nedbank group limited consolidated and separate … · consolidated and separate annual financial...
TRANSCRIPT
Consolidated and separate annual
finanCial statements
for the year ended 31 December 2014
NEDBANK GROUP LIMITED
Consolidated and separate annual
finanCial statements

Directors' responsibility 1Company secretary's certification 2Report from our audit committee 3Report from our directors 6Independent auditors' report to the shareholders of Nedbank Group Limited 9Consolidated financial statementsConsolidated statement of comprehensive income 10Consolidated statement of financial position 11Consolidated statement of changes in equity 12Consolidated statement of cashflows 14Segmental reporting 15Notes to the consolidated financial statements 18separate financial statementsSeparate statement of comprehensive income 138Separate statement of financial position 138Separate statement of changes in equity 139Separate statement of cashflows 139Notes to the separate annual financial statements 140additional information not covered by the auditors' reportCompliance with IFRS – financial statement notes 147Average banking statement of financial position and related interest 148
Statement of financial position – banking/trading categorisation 149
Contents

NedbaNk Group
1
Consolidated and separate annual
finanCial statements
direCtors’ responsibility
The directors are responsible for the preparation and fair presentation of the consolidated and separate financial statements of Nedbank Group Limited (comprising the statements of financial position at 31 December 2014, the statements of comprehensive income, the statements of changes in equity and statements of cashflows for the year then ended), the segmental reporting and the notes to the financial statements (including a summary of significant accounting policies and other explanatory notes) in accordance with International Financial Reporting Standards as issued by the International Accounting Standards Board, the SAICA Financial Reporting Guides as issued by the Accounting Practices Committee, the requirements of the Companies Act, 71 of 2008 (as amended) and the JSE Listings Requirements. In addition, the directors are responsible for the preparation of the directors' report.
The directors are also responsible for such internal control as the directors determine is necessary to enable the preparation of financial statements that are free from material misstatement, whether due to fraud or error and for maintaining adequate accounting records and an effective system of risk management as well as the preparation of the supplementary schedules included in these financial statements.
The directors have made an assessment of the ability of the company and its subsidiaries to continue as going concerns and there is no reason to believe that the businesses will not be going concerns in the year ahead.
The auditors are responsible for reporting on whether the consolidated and separate financial statements are fairly presented in accordance with the applicable financial reporting framework.
Approval of consolidated and separate annual financial statementsThe consolidated and separate annual financial statements of Nedbank Group Limited, as identified in the first paragraph, were approved by the Nedbank Group board of directors on 20 February 2015 and are signed on its behalf by:
dr rJ Khoza mWt brownChairman Chief Executive
Sandown
20 February 2015

2
Company seCretary’s CertifiCation
In terms of Section 88(2)(e) of the Companies Act, 71 of 2008 (as amended), I certify that, to the best of my knowledge and belief, Nedbank Group Limited has filed with the Commissioner all such returns and notices as are required by the Companies Act, 71 of 2008 (as amended), and that all such returns and notices are true, correct and up to date.
tsb JaliCompany Secretary
Sandown
20 February 2015

NedbaNk Group
3
Consolidated and separate annual
finanCial statements
report from our Group audit Committee
OverviewThe Nedbank Group Audit Committee (GAC) assists the board in fulfilling its oversight responsibilities, in particular with regard to evaluation of the adequacy and efficiency of accounting policies, internal controls and financial reporting processes. In addition the GAC assesses the effectiveness of the internal auditors and the independence and effectiveness of the external auditors.
CompositionThe GAC consists of four members, all of whom are independent non-executive directors, and is chaired by Malcolm Wyman. The GAC met five times during the year at times which were aligned with the group's financial reporting cycle. The Chief Executive (CE), the Chief Financial Officer (CFO), the Chief Operating Officer (COO), the Chief Risk Officer (CRO), the Chief Internal Auditor (CIA), the Chief Governance and Compliance Officer and representatives of the external auditors are invited to attend all GAC meetings.
GAC members
Scheduled meeting
attendance
Malcolm Wyman(Chairman) 5/5Nomavuso Mnxasana 5/5Paul Makwana 5/5
Tom Boardman (appointed 12 May 2014) 2/2
Committee governance and effectivenessThe legal responsibilities of the GAC are governed by the Companies Act, 71 of 2008 ('Companies Act'), and the Banks Act, 94 of 1990 (as amended) ('Banks Act'). These responsibilities, and compliance with appropriate governance and international best practice, are dealt with in the committee's charter, which is reviewed annually and was approved by the board.
The chairman of the committee reports to the board on the matters discussed at each committee meeting and the minutes of each meeting are circulated to all boardmembers.
The GAC Chairman has regular contact with the management team, including the CEO, the COO, the CRO, the CIA and the CFO, to address relevant matters directly. The CIA and the external auditors have direct access to the committee, including closed sessions without management, on any matter that they regard as relevant to the fulfilment of the committee's responsibilities.
New members of the GAC undergo an induction programme, which includes briefings on matters relevant to the responsibilities of the committee, and meet with the finance executive. Ongoing training is provided to committee members on a range of financial, regulatory and other compliance matters. During 2014 training was conducted on the investor relations function and Johannesburg Stock Exchange (JSE) reporting requirements; non-interest income key drivers and areas of judgement; integrated reporting framework and developments; and global mega trends within the taxation environment.
The performance of the committee is reviewed annually through a self-assessment questionnaire. The 2014 review concluded that the committee continued to operate effectively and meet its objectives.
Internal controlThe GAC monitored the effectiveness of the group's internal controls and compliance with the Enterprisewide Risk Management Framework (ERMF). The emphasis on risk governance is based on three lines of defence and the GAC uses the regular reports received from the three lines of defence to evaluate the effectiveness of the internal controls. The ERMF places weight on accountability, responsibility, independence, reporting, communication and transparency, both internally and with all Nedbank's key external stakeholders.
The functions of the three lines of defence, as well as the principal responsibilities that extend across the group, are set out in the Risk and Balance Sheet Management Review available at nedbankgroup.co.za. For the period under review the GAC monitored management's effectiveness at:
■ creating and maintaining an effective internal control environment throughout the group;
■ demonstrating the necessary respect for the control environment; and
■ identifying and correcting weaknesses in systems and internal controls.
The GAC received regular reports from the Group Information Technology Committee regarding the monitoring of the adequacy and efficiency of the group's information systems and from the Group Credit Committee regarding its oversight of the adequacy and efficiency of the credit monitoring processes and systems.
The GAC received regular reports on issues in the group's key issues control log from the CRO and regular reports regarding governance and compliance matters (including the Companies Act and Banks Act) from the Chief Governance and Compliance Officer.
As required by King III the GAC received confirmation from the CIA regarding the effectiveness of internal financial controls, internal controls and risk management.
Having considered, analysed, reviewed and debated information provided by management as well as Internal Audit and the external auditors, the GAC considered that the internal controls of the group had been effective in all material aspects throughout the year under review.
Financial reporting processThe GAC received regular reports from the CFO regarding the financial performance of the group, the tracking and monitoring of key performance indicators, details of budgets, forecasts, long-term plans and capital expenditures, financial reporting controls and processes, and the adequacy and reliability of management information used during the financial reporting process.
The GAC reviewed and approved the accounting policies of the group as reported in the annual financial statements, monitoring the consistency of application and compliance with accounting standards. The GAC also reviewed and approved the related group policies (Finance and Accounting Risk Policy, Taxation Policy and Regulatory Reporting Policy). The GAC further assessed and confirmed the appropriateness of the going-concern assumption used in the annual financial statements, taking into account management budgets and the capital and the liquidity profiles.

4
REPORT FROM OuR AuDIT COMMITTEE (continued)
The GAC also:
■ received a summary of the key technical accounting matters from the CFO for consideration as well as a summary of critical accounting judgements and estimates made during the financial reporting process;
■ received input where there have been substantive discussions between management and the external auditors; and
■ discussed all key areas of judgement with management and the external auditors.
The GAC satisfied itself as to the expertise, resources and experience of the finance function, as well as the appropriateness of the expertise and experience of the CFO in terms of the JSE Listings Requirements.
Over the past year and a half, there have been significant changes in reporting by audit committees in the united Kingdom, driven by regulatory and stakeholder requirements for greater transparency from audit committees in reporting the matters that the audit committee considered to be significant to the financial statements and how they addressed these matters. The GAC considered the uK audit committee reporting developments to be best practice and have chosen to adopt them in the current year. Key areas of management judgement applied in the preparation of the financial statements and assessed by the GAC in the current year are:
■ fair value of financial instruments – The GAC reviewed reports from the CFO regarding the Investment Committee review of investment valuations and details of critical valuation judgements applied to the valuation of group treasury and trading instruments. Financial instruments and investments are disclosed in notes 37 and 38 to the financial statements and in the accounting policy discussed in note 1.5.
■ taxation-related matters – The GAC reviewed reports from the CFO regarding the tax computation and, where applicable, levels of judgement in determining tax accrual and the deferred tax balance. The taxation expense and related balances are disclosed in note 11 to the financial statements.
■ Credit risk provisions – The GAC reviewed reports from the Group Credit Committee regarding the level and appropriateness of impairments, provisioning methodologies, and related key judgements in determining the impairment balances.
■ impairment considerations for goodwill, intangible assets and associate investments – The GAC reviewed reports from the CFO regarding the annual goodwill impairment assessment, the consideration of impairment applied to certain intangible assets, and related assumptions and judgements and the consideration of the indicators of impairment for associate investments. The methodology used by the group for goodwill impairment testing is set out in note 1.7 to the financial statements.
■ employee benefits – The GAC reviewed reports from the CFO regarding the valuation of postretirement medical aid and pension fund obligations by independent actuaries and the level of judgement applied in those actuarial valuations. Details of the key assumptions used are set out in note 27 to the financial statements.
In future, our external auditors will be required to report key audit matters in their report, those matters that in the auditors’ judgement were of most significance in their audit. Those key audit matters may include the key areas of management judgement described above or may extend to other matters. The GAC will continue to provide information in their report to allow users of the financial statements to understand how the GAC considered and evaluated the significant matters described by the external auditors.
Regulatory reporting processThe GAC reviewed the adequacy of the regulatory reporting processes as required by the Banks Act, which includes evaluation of the quality of reporting and the adequacy of systems and processes, and consideration of any findings regarding the regulatory reports by the external auditors. The GAC also hosts an annual trilateral meeting with representatives of the Bank Supervision Department of the South African Reserve Bank (SARB) where, among other things, key external audit findings, internal
audit matters and reporting responsibilities in terms of the regulations are discussed and the SARB provides feedback on industry-related issues.
Internal AuditInternal Audit performs an independent assurance function and forms part of the third line of defence as set out in the ERMF in the integrated report. The CIA has a functional reporting line to the committee chairman and an operational reporting line to the CEO.
The GAC, with respect to its evaluation of the adequacy and effectiveness of internal controls, receives reports from the CIA, assesses the effectiveness of the group internal audit function and reviews and approves the Group Internal Audit plan. In particular the GAC:
■ ensured that the CIA had a direct reporting line to the Chairman of the GAC;
■ reviewed and recommended the Internal Audit Charter for approval by the board of directors;
■ monitored the effectiveness of the internal-audit function in terms of its scope, execution of its plan, coverage, independence, skills, staffing, overall performance and position within the organisation; and
■ monitored and challenged, where appropriate, action taken by management with regard to adverse internal-audit findings.
External auditorsThe group's external auditors are Deloitte & Touche and KPMG. The GAC has a well-established policy on auditor independence and audit effectiveness. During the period the GAC:
■ recommended to the board the selection of the external auditors and the approval of their audit fees for the year under review;
■ approved the external auditors' annual plan and related scope of work, confirming suitable reliance on Group Internal Audit and the appropriateness of key audit risks identified and related audit effort; and
■ monitored the effectiveness of the external auditors in terms of their skills, independence, execution of the audit plan, reporting and overall performance.
A further annual review of the quality of the audit and the performance of the joint external auditors was performed by Internal Audit by analysing critical competencies expected of the external auditors through interviews with and the responses to questionnaires by key finance staff, Group Internal Audit members central to the assessment process and members of the GAC.
The GAC also approved the Non-audit Services Policy that specifies that the external auditors are precluded from engaging in non-audit services that would compromise their independence or violate any professional requirements or regulations affecting their appointment as auditors. However, the external auditors may provide non-audit services that do not interfere with their independence and where their skills and experience make them a logical supplier, subject to preapproval by the committee. The GAC received regular reports as to the scope and quantum of non-audit services proposed and delivered and confirmation from the external auditors that their independence (in respect of audit services and non-audit services) has not been impaired. Fees paid to the auditors are disclosed in note 8 to the annual financial statements.
During the period under review Nedbank Group's ultimate holding company, Old Mutual plc, invited tenders for its external audit. Although the Nedbank Group audit was not itself required to be the subject of a tender, the GAC did support the Old Mutual plc process by evaluating, in respect of Nedbank Group, the tender participants determined by Old Mutual plc and reporting observations for consideration to Old Mutual plc. Old Mutual plc subsequently confirmed that KPMG had been retained as their external auditors and therefore, since KPMG is one of our joint external auditors, there were no implications for Nedbank Group.
The GAC considered the independence of the joint external auditors on an ongoing basis during the year. The GAC also examined the auditors' proposed audit plan in July and assessed their skills, reporting and overall

NedbaNk Group
5
Consolidated and separate annual
finanCial statements
performance based on a formal review following the year end audit. It was confirmed that the joint external auditors were effective, and they were recommended to the board for reappointment in 2015.
Key focus areas for 2015 ■ Review and consideration of management plans in respect of future
changes to the International Financial Reporting Standards (IFRS), most notably:
� IFRS 9: Financial Instruments, which comprises three main sections, namely classification and measurement of financial assets and financial liabilities, impairment methodology and hedge accounting. This standard will be effective from 1 January 2018 and is expected to have a significant impact on impairment methodologies in banking across the globe.
� IFRS 15: This standard relates to revenue from contracts with clients and although significant and very relevant to the group, it is not expected to bring material changes when it becomes effective on 1 January 2017.
■ Monitoring of major technology implementations, the largest of which was the SAP enterprise resource planning (ERP) programme undertaken in 2014 and implemented early in 2015, impacting the entire financial accounting control environment.
■ Continued focus on ensuring that the group's financial systems, processes and controls are operating effectively, are consistent with the group's complexity and are responsive to changes in the environment and industry.
Annual financial statements and integrated reporting processThe GAC reviewed and discussed the audited annual financial statements with the CFO, the CE, the CRO, Internal Audit and the external auditors. The GAC assessed, and found to be effective and appropriate, the financial reporting process and controls that led to the compilation of the annual financial statements as well as the presentation and disclosure in the annual financial statements with regard to the approved accounting policies, IFRS and the requirements for fair presentation of the Companies Act.
The GAC reviewed and discussed the integrated report reporting process, governance and financial information included in the integrated report after considering recommendations received from the Group Transformation, Social and Ethics Committee, the Group Remuneration Committee, the Group Risk and Capital Management Committee and the Group Directors' Affairs Committee.
The GAC recommended to the board that the annual financial statements and the financial information included in the integrated report be approved. The board subsequently approved the annual financial statements and the integrated report, which will be open for discussion at the forthcoming annual general meeting.
malcolm Wyman
Group Audit Committee Chairman
20 February 2015

6
The board of directors have pleasure in presenting the annual financial statements of Nedbank Group for the year ended 31 December 2014.
Nature of businessNedbank Group Limited ('Nedbank Group' or 'the company') is a registered bank controlling company that, through its subsidiaries, provides a wide range of banking and financial services. Nedbank Group maintains a primary listing under 'Banks' on the JSE Ltd (the JSE), with a secondary listing on the Namibian Stock Exchange.
Annual financial statementsDetails of the financial results are set out on pages 10 to 146 of the annual financial statements, which have been prepared under the supervision of the Nedbank Group Chief Financial Officer, Mrs RK Morathi, and audited in compliance with the South African Institute of Chartered Accountants (SAICA) Financial Reporting Guides as issued by the Accounting Practices Committee, and the requirements of the Companies Act, 71 of 2008 (as amended) and the JSE Listings Requirements.
Integrated reportThe board of directors acknowledges its responsibility to ensure the integrity of this integrated report. The board has accordingly applied its mind to this integrated report and in the opinion of the board the integrated report addresses all material issues, and presents fairly the integrated performance of the organisation and its impacts. The integrated report has been prepared in line with best practice pursuant to the recommendations of the King III Code (principle 9.1).
Year under reviewThe year under review is fully covered in the Chairman's Review, Chief Executive's Review and the Chief Financial Officer’s Review in the Nedbank Group Limited Integrated Report.
Share capitalDetails of the authorised and issued share capital, together with details of shares issued during the year, appear in note 29 to the annual financial statements available at nedbankgroup.co.za.
American depositary sharesAt 31 December 2014, Nedbank Group had 2 710 700 (31 December 2013: 3 159 022) American Depositary Shares in issue, through The Bank of New York Mellon as depositary, and trading on the OTC markets in the uS. Each American depositary share is equal to one ordinary share.
OwnershipThe holding company of Nedbank Group is Old Mutual Life Assurance Company (SA) Limited and associates, which holds 54,04% of the issued ordinary shares of the company. The ultimate holding company is Old Mutual plc, incorporated in England and Wales. Further details of shareholders appear in note 15 to the separate annual financial statements.
DividendsThe following dividends were declared in respect of the year ended 31 December 2014:
■ Interim ordinary dividend of 460 cents per share (2013: 390 cents per share)
■ Final ordinary dividend of 568 cents per share (2013: 505 cents per share)
BorrowingsNedbank Group’s borrowing powers are unlimited pursuant to the company’s memorandum of incorporation. The details of borrowings appear in note 34 to the annual financial statements available at nedbankgroup.co.za.
DirectorsBiographical details of the current directors and details of directors' and prescribed officers’ remuneration and Nedbank Group shares issued to directors and prescribed officers appear in the Nedbank Group Limited Integrated Report.
During the period under review, and also subsequent to year-end, the following changes occurred to the Nedbank Group Limited Board:
■ David Adomakoh was appointed as an independent non-executive director on 21 February 2014;
■ Mantsika Matooane was appointed as an independent non-executive director on 15 May 2014;
■ Brian Dames was appointed as an independent non-executive director on 30 June 2014;
■ Paul Hanratty was appointed as a non-executive director on 8 August 2014;
■ Mfundo Nkuhlu was appointed as an executive director and Chief Operating Officer on 1 January 2015;
■ Graham Dempster stood down as Chief Operating Officer on 1 January 2015, but remained on the board as an executive director.
In terms of Nedbank Group’s memorandum of incorporation, one-third of the directors are required to retire at each Nedbank Group annual general meeting (AGM) and may offer themselves for election or reelection. The rotating directors are firstly those directors appointed since the last shareholders’ meeting, and thereafter those longest in office since their last election.
Paul Hanratty, Vassi Naidoo and Mfundo Nkuhlu were appointed by the board of directors subsequent to the shareholders meeting held on 7 August 2014 and, in terms of the memorandum of incorporation, their appointments terminate at the close of the AGM. They are available for election.
Mpho Makwana, Nomavuso Mnxasana, Raisibe Morathi and Julian Roberts are also required to seek reelection at the AGM. The aforementioned directors make themselves available for reelection and separate resolutions will be submitted for approval at the annual general meeting to be held on 11 May 2015.
In terms of Nedbank Group policy, non-executive directors and independent non-executive directors of Nedbank Group who have served on the board for a period longer than nine years are required to retire. Reuel Khoza, Mustaq Enus-Brey and Gloria Serobe were appointed to the Nedbank Group board on 16 August 2005 and they will retire at the close of the AGM. The board has resolved to elect Vassi Naidoo as Chairman of Nedbank Group immediately after the close of the Nedbank Group AGM, subject to shareholders having elected him as a non-executive director.
Graham Dempster has reached the retirement age for executive directors and he also retires from the board at the close of this AGM.
report from our direCtors
NedbaNk Group
7
Consolidated and separate annual
finanCial statements
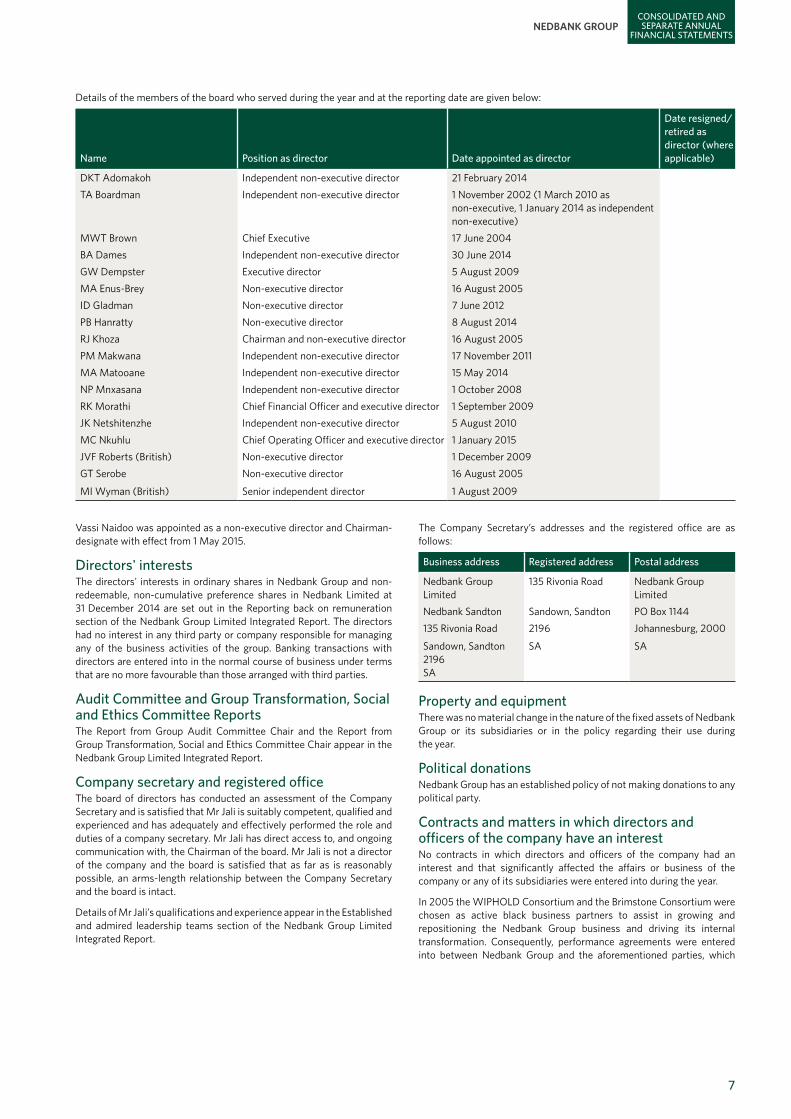
Details of the members of the board who served during the year and at the reporting date are given below:
Name Position as director Date appointed as director
Date resigned/retired as director (where applicable)
DKT Adomakoh Independent non-executive director 21 February 2014TA Boardman Independent non-executive director 1 November 2002 (1 March 2010 as
non-executive, 1 January 2014 as independent non-executive)
MWT Brown Chief Executive 17 June 2004BA Dames Independent non-executive director 30 June 2014GW Dempster Executive director 5 August 2009MA Enus-Brey Non-executive director 16 August 2005ID Gladman Non-executive director 7 June 2012PB Hanratty Non-executive director 8 August 2014RJ Khoza Chairman and non-executive director 16 August 2005PM Makwana Independent non-executive director 17 November 2011MA Matooane Independent non-executive director 15 May 2014NP Mnxasana Independent non-executive director 1 October 2008RK Morathi Chief Financial Officer and executive director 1 September 2009JK Netshitenzhe Independent non-executive director 5 August 2010MC Nkuhlu Chief Operating Officer and executive director 1 January 2015JVF Roberts (British) Non-executive director 1 December 2009GT Serobe Non-executive director 16 August 2005
MI Wyman (British) Senior independent director 1 August 2009
Vassi Naidoo was appointed as a non-executive director and Chairman-designate with effect from 1 May 2015.
Directors' interestsThe directors' interests in ordinary shares in Nedbank Group and non-redeemable, non-cumulative preference shares in Nedbank Limited at 31 December 2014 are set out in the Reporting back on remuneration section of the Nedbank Group Limited Integrated Report. The directors had no interest in any third party or company responsible for managing any of the business activities of the group. Banking transactions with directors are entered into in the normal course of business under terms that are no more favourable than those arranged with third parties.
Audit Committee and Group Transformation, Social and Ethics Committee ReportsThe Report from Group Audit Committee Chair and the Report from Group Transformation, Social and Ethics Committee Chair appear in the Nedbank Group Limited Integrated Report.
Company secretary and registered officeThe board of directors has conducted an assessment of the Company Secretary and is satisfied that Mr Jali is suitably competent, qualified and experienced and has adequately and effectively performed the role and duties of a company secretary. Mr Jali has direct access to, and ongoing communication with, the Chairman of the board. Mr Jali is not a director of the company and the board is satisfied that as far as is reasonably possible, an arms-length relationship between the Company Secretary and the board is intact.
Details of Mr Jali’s qualifications and experience appear in the Established and admired leadership teams section of the Nedbank Group Limited Integrated Report.
The Company Secretary’s addresses and the registered office are as follows:
Business address Registered address Postal address
Nedbank Group Limited
135 Rivonia Road Nedbank Group Limited
Nedbank Sandton Sandown, Sandton PO Box 1144135 Rivonia Road 2196 Johannesburg, 2000
Sandown, Sandton 2196SA
SA SA
Property and equipmentThere was no material change in the nature of the fixed assets of Nedbank Group or its subsidiaries or in the policy regarding their use during the year.
Political donationsNedbank Group has an established policy of not making donations to any political party.
Contracts and matters in which directors and officers of the company have an interestNo contracts in which directors and officers of the company had an interest and that significantly affected the affairs or business of the company or any of its subsidiaries were entered into during the year.
In 2005 the WIPHOLD Consortium and the Brimstone Consortium were chosen as active black business partners to assist in growing and repositioning the Nedbank Group business and driving its internal transformation. Consequently, performance agreements were entered into between Nedbank Group and the aforementioned parties, which

8
REPORT FROM OuR DIRECTORS (continued)
govern, inter alia, the setting of the performance criteria, their evaluation and the resultant performance fees in respect of the black business partners. Mrs GT Serobe is founder, executive director and 9% shareholder of Women Investment Portfolio Holdings Limited (WIPHOLD) and Chief Executive of Wipcapital (Pty) Limited, a wholly owned subsidiary of WIPHOLD. Mr MA Enus-Brey is Chief Executive Officer and 8,83% shareholder of Brimstone Investment Corporation Limited and a director of various Brimstone subsidiary companies. The WIPHOLD Financial Services Number Two Trust and the Brimstone-Mtha Financial Services Trust matured on 1 January 2015.
Also in 2005, Aka Capital (Pty) Limited ('Aka Capital'), in which Dr RJ Khoza is a director and 27% shareholder, was appointed as business development partner of Nedbank Group and a performance agreement was similarly entered into between Nedbank Group and Aka Capital. The AKA-Nedbank Eyethu Trust subsequently matured on 1 January 2011.
Mr JK Netshitenzhe is an executive director of the Mapungubwe Institute for Strategic Reflection (MISTRA). In 2014, Mistra received a grant of R1m (2013: R2m) from the Nedbank Eyethu Community Trust (formed in 2005 as part of Nedbank Group’s BEE transaction). The Nedbank Eyethu Community Trust provides funding to charitable or non–profit organisations that qualify. The grant to MISTRA was evaluated against the normal criteria for funding by the trust.
Directors' and prescribed officers’ service contractsThere are no service contracts with the directors of the company, other than for the chairman and executive directors as set out below. The directors who entered into these service contracts remain subject to retirement by rotation in terms of Nedbank Group's memorandum of incorporation.
The key responsibilities relating to Reuel Khoza's position as Chairman of Nedbank Group, and similarly for Vassi Naidoo who is the Chairman-designate, are encapsulated in contracts .
Service contracts have been entered into for Mike Brown, Graham Dempster, Mfundo Nkuhlu and Raisibe Morathi. These service contracts are effective until the executive directors reach the normal retirement age and stipulate a maximum notice period of six months (12 months for Mr Brown) under most circumstances.
Details relating to the service contracts of prescribed officers are incorporated in the Reporting back on remuneration section of the Nedbank Group Limited Integrated Report.
InsuranceThe group has placed cover in the London insurance market for up to R2,55bn for losses in excess of R50m. Group captive insurers provide cover for total losses below the R50m level engagement point, retaining R100m, in any one year. Selected insurance covers are placed with the Old Mutual Group.
Subsidiary companiesDetails of principal subsidiary companies are reflected in note 54 to the annual financial statements at nedbankgroup.co.za.
Acquisition of shares14 715 049 ordinary shares in Nedbank Group were acquired from NBG Capital Management Limited (a wholly-owned subsidiary of Nedbank Group) at R229.65 per share under a specific authority granted by shareholders on 7 August 2014. These shares were delisted and reverted to authorised but unissued shares on 22 August 2014.
No shares in Nedbank Group were acquired by Nedbank Group or by a Nedbank Group subsidiary during the financial year under review in terms of the general authority previously granted by shareholders. Members will be requested to renew the general authority enabling the company or a subsidiary of the company to repurchase shares.
Events after the reporting periodThe various BBBEE schemes that reached their maturity dates on 1 January 2015 were rationalised through a specific repurchase of Nedbank Group shares. Full details were announced on SENS on 23 February 2015. The repurchased shares did not have a significant impact on the consolidated financial position of the group and were delisted, cancelled and reinstated as authorised but unissued shares. Following this, the Community Trust, which matures only in 2030, subscribed for Nedbank Group shares to maintain its shareholding in the group.
On 15 January 2015 Nedbank Limited's unsecured subordinated NEDH1A and NEDH1B notes were redeemed and R225m of new-style tier 2 debt instruments issued. A further R5,4bn of senior unsecured debt was issued on 12 February 2015.
At 31 December the carrying value of our long-term strategic investment in ETI was R6,2bn. Based on the ETI share price at year-end the market value was R5,5bn. We assessed the indicators of impairment as at 31 December 2014 in terms of International accounting Standard (IAS) 39 and, inter alia, took into consideration ETI shares trade in low volume, the price is therefore subject to volatility and does not reflect the underlying financial and strategic value of the investment to the Nedbank Group. Therefore we did not impair the carrying value of our investment at 31 December 2014. Subsequent to the year-end on 19 February 2015 the market value of ETI based on the share price, was R4,4bn. We will continue to assess the indicators of impairment in future reporting periods.

NedbaNk Group
9
Consolidated and separate annual
finanCial statements
independent auditors' report to tHe sHareHolders of nedbanK Group limited
We have audited the consolidated and separate financial statements of Nedbank Group Limited set out on pages 10 to 146, which comprise the statements of financial position as at 31 December 2014, and the statements of comprehensive income, statements of changes in equity and statements of cash flows for the year then ended, and the notes, comprising a summary of significant accounting policies and other explanatory information, and specified sections of the remuneration report.
Directors’ responsibility for the consolidated financial statementsThe company’s directors are responsible for the preparation and fair presentation of these consolidated and separate financial statements in accordance with International Financial Reporting Standards and the requirements of the Companies Act of South Africa, and for such internal control as the directors determine is necessary to enable the preparation of consolidated and separate financial statements that are free from material misstatement, whether due to fraud or error.
Auditors' responsibilityOur responsibility is to express an opinion on these financial statements based on our audit. We conducted our audit in accordance with International Standards on Auditing. Those standards require that we comply with ethical requirements and plan and perform the audit to obtain reasonable assurance about whether the financial statements are free from material misstatement.
An audit involves performing procedures to obtain audit evidence about the amounts and disclosures in the financial statements. The procedures selected depend on the auditors' judgement, including the assessment of the risks of material misstatement of the financial statements, whether due to fraud or error. In making those risk assessments, the auditors consider internal control relevant to the entity’s preparation and fair presentation of the financial statements in order to design audit procedures that are appropriate in the circumstances, but not for the purpose of expressing an opinion on the effectiveness of the entity’s internal control. An audit also includes evaluating the appropriateness of accounting policies used and the reasonableness of accounting estimates made by management, as well as evaluating the overall presentation of the financial statements.
We believe that the audit evidence we have obtained is sufficient and appropriate to provide a basis for our audit opinion.
OpinionIn our opinion, these financial statements present fairly, in all material respects, the consolidated and separate financial position of Nedbank Group Limted at 31 December 2014, and its consolidated and separate financial performance and consolidated and separate cash flows for the year then ended in accordance with International Financial Reporting Standards and the requirements of the Companies Act of South Africa.
Other reports required by the Companies ActAs part of our audit of the consolidated and separate financial statements for the year ended 31 December 2014, we have read the Directors’ Report, the Audit Committee’s Report and the Company Secretary’s Certificate for the purpose of identifying whether there are material inconsistencies between these reports and the audited consolidated and separate financial statements. These reports are the responsibility of the respective preparers. Based on reading these reports we have not identified material inconsistencies between these reports and the audited consolidated and separate financial statements. However, we have not audited these reports and accordingly do not express an opinion on these reports.
KpmG inc. deloitte & toucheRegistered Auditor Registered AuditorPer Heather Berrange Per Mgcinisihlalo JordanChartered Accountant (SA) Chartered Accountant (SA)Director Partner
KPMG Crescent Building 8, Deloitte Place85 Empire Road The Woodlands,Woodlands DriveParktown, Johannesburg Woodmead, Sandton2193 2128The company’s principal place of business is at KPMG Crescent, 85 Empire Road, Parktown, where a list of the directors’ names is available for inspection.
A full list of partners and directors is available on request.
Sandown 20 February 2015

10
CONSOLIDATED STATEMENT OF COMPREHENSIVE INCOMEfor the year ended 31 December
Accounting policy Notes
2014rm
2013Rm
Interest and similar income 1.23 5 52 619 46 087
Interest expense and similar charges 1.23 6 29 658 24 867
net interest income 22 961 21 220
Impairments charge on loans and advances 1.5 19.1 4 506 5 565
income from lending activities 18 455 15 655
Non-interest revenue 1.18, 1.21, 1.23 7 20 312 19 361
operating income 38 767 35 016 Total operating expenses 1.23 8 24 534 22 419
Indirect taxation 9 635 601
profit from operations before non-trading and capital items 13 598 11 996 Non-trading and capital items 10 (109) (56)
Fair-value adjustments of investment properties 1.10 25.1 6 6
profit from operations 13 495 11 946
Share of profits of associate companies and joint arrangements 1.3 22.1 161 27
profit before direct taxation 13 656 11 973
Direct taxation 1.6 11.1 3 468 3 016
profit for the year 10 188 8 957 other comprehensive income net of taxation 647 1 675
items that may be reclassified subsequently to profit or lossExchange differences on translating foreign operations 1.4 390 690 Fair-value adjustments on available-for-sale assets 1.5 21 32
items that may not be reclassified subsequently to profit or lossGains on property revaluations 1.9 202 222 Remeasurements on long-term employee benefit assets 1.8 34 731
total comprehensive income for the year 10 835 10 632
profit attributable to: – equity holders of the parent 1.3 9 796 8 637 – non-controlling interest – ordinary shareholders 1.3 69 28
– non-controlling interest – preference shareholders 1.3 323 292
10 188 8 957
total comprehensive income attributable to: – equity holders of the parent 1.3 10 431 10 295 – non-controlling interest – ordinary shareholders 1.3 81 45
– non-controlling interest – preference shareholders 1.3 323 292
total comprehensive income for the year 10 835 10 632
Basic earnings per share (cents) 12.1 2 109 1 877
Diluted earnings per share (cents) 12.1 2 049 1 822

NedbaNk Group
11
Consolidated and separate annual
finanCial statements
CONSOLIDATED STATEMENT OF FINANCIAL POSITIONat 31 December 2014
Accounting
policy Notes2014
rm2013
Rm
assetsCash and cash equivalents 1.5, 1.25 14 13 339 20 842 Other short-term securities 1.5 15 67 234 42 451 Derivative financial instruments 1.5 16 15 573 13 390 Government and other securities 1.5 17 27 177 32 091 Loans and advances 1.5 18 613 021 579 372 Other assets 1.5 20 8 715 8 673 Current taxation assets 1.6 291 565 Investment securities 1.5 21 20 029 19 348 Non-current assets held for sale 1.11 23 16 12 Investments in private-equity associates, associate companies and joint arrangements 1.3, 1.5 22 7 670 1 101 Deferred taxation assets 1.6 24 309 216 Investment property 1.10 25 130 214 Property and equipment 1.9, 1.19 26 7 773 6 818 Long-term employee benefit assets 1.8 27 4 546 2 980 Mandatory reserve deposits with central banks 1.5, 1.25 14 14 911 13 231
Intangible assets 1.3, 1.7, 1.12 28 8 579 8 290
total assets 809 313 749 594
equity and liabilitiesOrdinary share capital 1.15, 1.16 29.1 466 461 Ordinary share premium 1.15 16 781 16 343
Reserves 1.4, 1.14 49 777 43 813
total equity attributable to equity holders of the parent 67 024 60 617 Non-controlling interest attributable to:– ordinary shareholders 1.3 326 246
– preference shareholders 1.3 29.2 3 561 3 473
total equity 70 911 64 336 Derivative financial instruments 1.5 16 15 472 16 580 Amounts owed to depositors 1.5 30 653 450 602 952 Provisions and other liabilities 1.5. 1.13 31 13 788 14 682 Current taxation liabilities 1.6 134 301 Deferred taxation liabilities 1.6 24 931 789 Long-term employee benefit liabilities 1.8 27 3 071 1 842 Investment contract liabilities 1.5. 1.17 32 11 747 11 523 Insurance contract liabilities 1.5. 1.18 33 4 171 3 321
Long-term debt instruments 1.5 34 35 638 33 268
total liabilities 738 402 685 258
total equity and liabilities 809 313 749 594

12
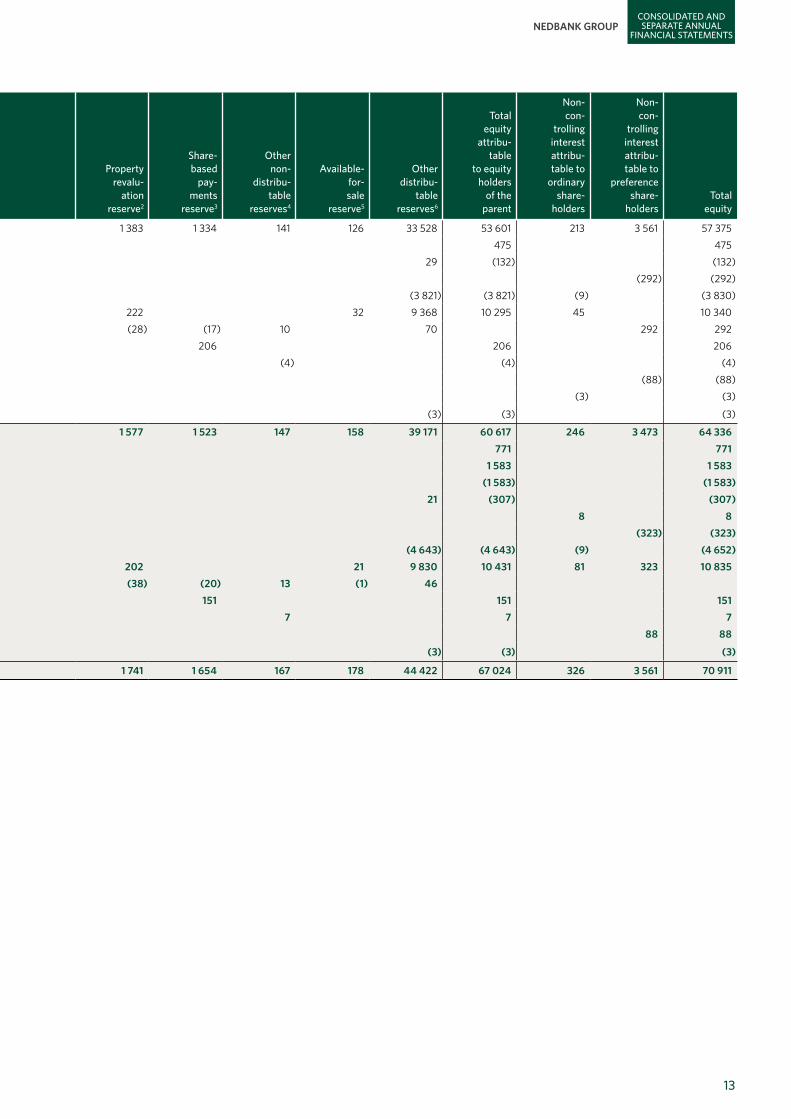
CONSOLIDATED STATEMENT OF CHANGES IN EquITYfor the year ended 31 December
rm
Number of
ordinary shares
Ordinary share
capital
Ordinary share
premium
Foreigncurrency
trans-lation
reserve1
Property revalu-
ation reserve2
Share-based
pay-ments
reserve3
Other non-
distribu-table
reserves4
Available-for-sale
reserve5
Other distribu-
table reserves6
Total equity
attribu-table
to equity holders
of the parent
Non-con-
trolling interest attribu-table to
ordinary share-
holders
Non-con-
trolling interest attribu-table to
preference share-
holders Total
equity
Balance at 31 December 2012 457 303 304 457 16 033 599 1 383 1 334 141 126 33 528 53 601 213 3 561 57 375 Shares issued in terms of employee incentive schemes 2 792 902 3 472 475 475 Shares (acquired)/no longer held by group entities and BEE trusts 1 097 253 1 (162) 29 (132) (132)Preference share dividends paid (292) (292)Dividends to shareholders (3 821) (3 821) (9) (3 830)Total comprehensive income for the year 673 222 32 9 368 10 295 45 10 340 Transfer (from)/to reserves (35) (28) (17) 10 70 292 292 Share-based payments reserve movement 206 206 206 Regulatory risk reserve provision (4) (4) (4)Preference shares held by group entities (88) (88)Disposal of subsidiary (3) (3)
Other movements (3) (3) (3)
balance at 31 december 2013 461 193 459 461 16 343 1 237 1 577 1 523 147 158 39 171 60 617 246 3 473 64 336 Shares issued in terms of employee incentive schemes 3 670 463 4 767 771 771 Shares delisted (14 715 049) (15) 1 598 1 583 1 583 Treasury shares no longer held by group entities 14 715 049 15 (1 598) (1 583) (1 583)Shares (acquired)/no longer held by group entities and BEE trusts 778 996 1 (329) 21 (307) (307)Acquisition of additional shareholding in subsidiary 8 8 Preference share dividends paid (323) (323)Dividends to shareholders (4 643) (4 643) (9) (4 652)Total comprehensive income for the year 378 202 21 9 830 10 431 81 323 10 835 Transfer (from)/to reserves (38) (20) 13 (1) 46 Share-based payments reserve movement 151 151 151 Regulatory risk reserve provision 7 7 7 Preference shares no longer held by group entities 88 88
Other movements (3) (3) (3)
balance at 31 december 2014 465 642 918 466 16 781 1 615 1 741 1 654 167 178 44 422 67 024 326 3 561 70 911 1 This represents the cumulative foreign exchange differences that arise on the translation of an entity with a different functional currency compared with the presentation currency of the parent company. The cumulative reserve relating
to a subsidiary that is disposed of is included in the determination of profit/loss on disposal of the subsidiary.² This represents the cumulative amounts that have been recognised on the revaluation of group properties net of deferred taxation. When the property is disposed of, the cumulative revaluation surplus is transferred directly to retained
income.³ All share-based payment expenses are recognised in the statement of comprehensive income, with the corresponding amount recognised in share-based payment reserves. Any excess tax benefit over the relative tax on the share-based
payments expense is recognised directly in this reserve. On the expiry or exercise of a share-based instrument the cumulative amount recognised in this respect is transferred directly to other distributable reserves.⁴ Represents other non-distributable revaluation surplus on capital items and non-distributable reserves transferred from other distributable reserves in order to comply with various banking regulations.⁵ This comprises of all fair-value adjustments, net of the related tax on all financial assets that have been classified as available for sale. On the disposal or impairment of available-for-sale financial assets the cumulative gains and the
associated tax recognised on these instruments are recognised in profit and loss for the period and are not included in the determination of headline earnings per share.⁶ Represents the accumulated profits after distributions to shareholders and appropriation of retained earnings to other non-distributable earnings.
All movements are reflected net of taxation.
NedbaNk Group
13
Consolidated and separate annual
finanCial statements
rm
Number of
ordinary shares
Ordinary share
capital
Ordinary share
premium
Foreigncurrency
trans-lation
reserve1
Property revalu-
ation reserve2
Share-based
pay-ments
reserve3
Other non-
distribu-table
reserves4
Available-for-sale
reserve5
Other distribu-
table reserves6
Total equity
attribu-table
to equity holders
of the parent
Non-con-
trolling interest attribu-table to
ordinary share-
holders
Non-con-
trolling interest attribu-table to
preference share-
holders Total
equity
Balance at 31 December 2012 457 303 304 457 16 033 599 1 383 1 334 141 126 33 528 53 601 213 3 561 57 375 Shares issued in terms of employee incentive schemes 2 792 902 3 472 475 475 Shares (acquired)/no longer held by group entities and BEE trusts 1 097 253 1 (162) 29 (132) (132)Preference share dividends paid (292) (292)Dividends to shareholders (3 821) (3 821) (9) (3 830)Total comprehensive income for the year 673 222 32 9 368 10 295 45 10 340 Transfer (from)/to reserves (35) (28) (17) 10 70 292 292 Share-based payments reserve movement 206 206 206 Regulatory risk reserve provision (4) (4) (4)Preference shares held by group entities (88) (88)Disposal of subsidiary (3) (3)
Other movements (3) (3) (3)
balance at 31 december 2013 461 193 459 461 16 343 1 237 1 577 1 523 147 158 39 171 60 617 246 3 473 64 336 Shares issued in terms of employee incentive schemes 3 670 463 4 767 771 771 Shares delisted (14 715 049) (15) 1 598 1 583 1 583 Treasury shares no longer held by group entities 14 715 049 15 (1 598) (1 583) (1 583)Shares (acquired)/no longer held by group entities and BEE trusts 778 996 1 (329) 21 (307) (307)Acquisition of additional shareholding in subsidiary 8 8 Preference share dividends paid (323) (323)Dividends to shareholders (4 643) (4 643) (9) (4 652)Total comprehensive income for the year 378 202 21 9 830 10 431 81 323 10 835 Transfer (from)/to reserves (38) (20) 13 (1) 46 Share-based payments reserve movement 151 151 151 Regulatory risk reserve provision 7 7 7 Preference shares no longer held by group entities 88 88
Other movements (3) (3) (3)
balance at 31 december 2014 465 642 918 466 16 781 1 615 1 741 1 654 167 178 44 422 67 024 326 3 561 70 911 1 This represents the cumulative foreign exchange differences that arise on the translation of an entity with a different functional currency compared with the presentation currency of the parent company. The cumulative reserve relating
to a subsidiary that is disposed of is included in the determination of profit/loss on disposal of the subsidiary.² This represents the cumulative amounts that have been recognised on the revaluation of group properties net of deferred taxation. When the property is disposed of, the cumulative revaluation surplus is transferred directly to retained
income.³ All share-based payment expenses are recognised in the statement of comprehensive income, with the corresponding amount recognised in share-based payment reserves. Any excess tax benefit over the relative tax on the share-based
payments expense is recognised directly in this reserve. On the expiry or exercise of a share-based instrument the cumulative amount recognised in this respect is transferred directly to other distributable reserves.⁴ Represents other non-distributable revaluation surplus on capital items and non-distributable reserves transferred from other distributable reserves in order to comply with various banking regulations.⁵ This comprises of all fair-value adjustments, net of the related tax on all financial assets that have been classified as available for sale. On the disposal or impairment of available-for-sale financial assets the cumulative gains and the
associated tax recognised on these instruments are recognised in profit and loss for the period and are not included in the determination of headline earnings per share.⁶ Represents the accumulated profits after distributions to shareholders and appropriation of retained earnings to other non-distributable earnings.
All movements are reflected net of taxation.

14
CONSOLIDATED STATEMENT OF CASHFLOWSfor the year ended 31 December
Notes2014
rm2013
Rm
Cash generated by operations 35.1 21 332 20 553 Cash received from clients 35.2 72 826 65 392 Cash paid to clients, employees and suppliers 35.3 (52 527) (45 768)Dividends received on investments 92 41 Recoveries on loans previously written off 941 888
Change in funds for operating activities (11 231) (4 507)Increase in operating assets 35.4 (62 820) (61 874)Increase in operating liabilities 35.5 51 589 57 367
net cash from operating activities before taxation 10 101 16 046
Taxation paid 35.6 (4 283) (3 890)
Cashflows from operating activities 5 818 12 156 Cashflows utilised by investing activities (9 455) (4 341)Acquisition of property and equipment, computer software and development costs and investment property (2 483) (1 737)Disposal of property and equipment, computer software and development costs and investment property 61 6 Net movement on non-current assets held for sale (4) 496 Disposal of investment banking assets 13 15 Acquisition of private-equity associates, associate companies and joint arrangements (6 541) (122)Disposal of private-equity associates, associate companies and joint arrangements 133 80 Acquisition of other investments (5 587) (4 113)Disposal of other investments 4 953 1 034
Cashflows utilised by financing activities (2 132) (800)Net proceeds from issue of ordinary shares 464 343 Issue of long-term debt instruments 7 005 8 785 Redemption of long-term debt instruments (4 635) (5 815)Dividends paid to ordinary shareholders 35.7 (4 643) (3 821)Preference share dividends paid (323) (292)
effects of exchange rate changes on opening cash and cash equivalents (excluding foreign borrowings) (54) (64)
net (decrease)/increase in cash and cash equivalents (5 823) 6 951
Cash and cash equivalents at the beginning of year1 34 073 27 122
Cash and cash equivalents at the end of the year1 14 28 250 34 073 1 Including mandatory reserve deposits with central banks.

NedbaNk Group
15
Consolidated and separate annual
finanCial statements
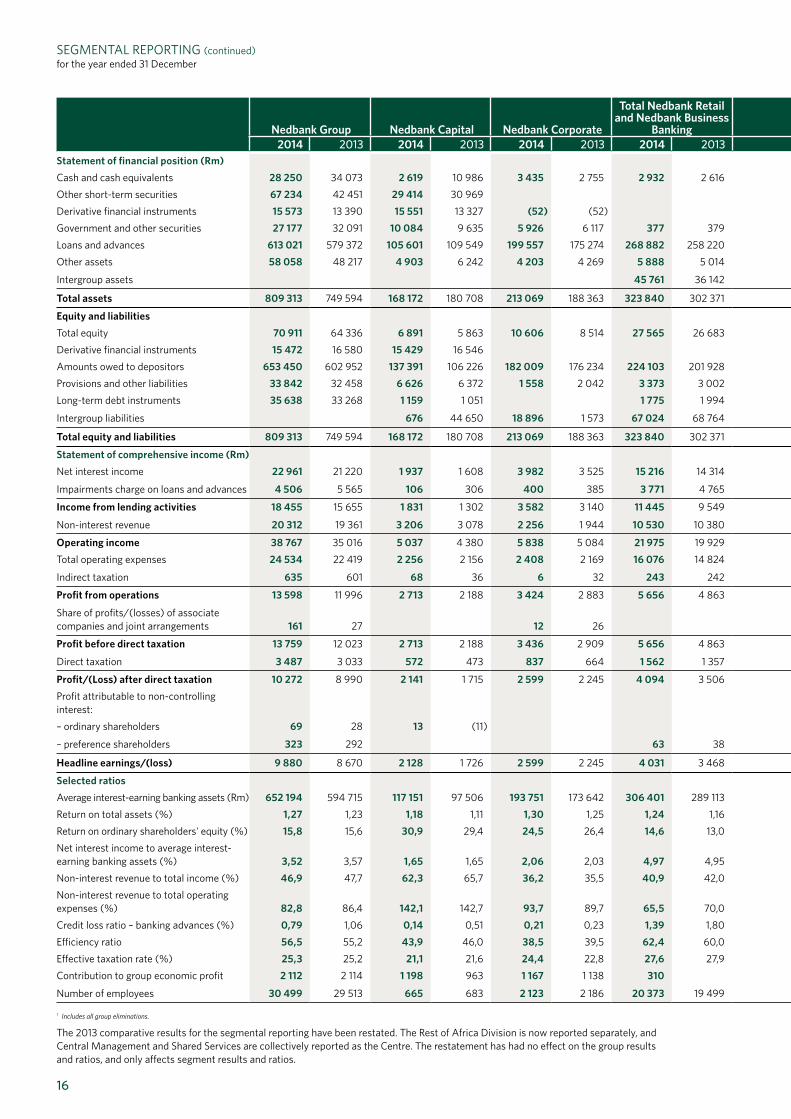
seGmental reportinG
The group’s identification of its segments and the measurement of segment results are based on the group’s internal management reporting as used for day-to-day decisionmaking and as reviewed by the chief operating decisionmaker, which in Nedbank Group Limited's case is the Group Executive Committee. The segments have been identified according to the nature of their respective products and services and their related target markets.
Nedbank CapitalNedbank Capital comprises the group’s investment banking businesses that together manage the structuring, lending, underwriting and trading businesses. Nedbank Capital seeks to provide seamless specialist advice, debt and equity raising and execution and trading capabilities in all the major SA business sectors.
Nedbank CorporateNedbank Corporate comprises the client-focused businesses of Corporate Banking, Property Finance as well as the specialist support areas of Transactional Banking and Corporate Shared Services. These businesses focus mainly on providing lending, deposit-taking, commercial property finance and transactional banking to large corporates, financial institutions, the public sector and government clients. Corporate Banking engages with companies that have annual turnovers exceeding R700m (with strategic exceptions) and lending requirements greater than R50m. This target market also includes the public sector and strategic BEE partnerships. Property Finance specialises in providing specifically structured property finance solutions to commercial, industrial, retail, residential and affordable housing developments as well as partnerships through joint ventures or minority equity investments. Transactional Banking supports the wholesale clusters and segments of retail with business solutions, transactional product solutions and innovation, and is also responsible for managing our correspondent banking relationships. Corporate Shared Services is the delivery and service centre for transactional processing. It also houses Nedbank Investor Services (NIS) through which it provides custodial services and secured lending to the collective investments industry.
Nedbank RetailNedbank Retail serves the financial needs of all individuals (excluding high-net-worth individuals) and small businesses with a turnover of up to R10m to whom it offers a full spectrum of banking and assurance products and services. The Nedbank Retail product portfolio includes transactional accounts, home loans, vehicle and asset finance [including Motor Finance Corporation (MFC)], card (both card-issuing and merchant-acquiring services), personal loans and investments.
Nedbank Business BankingNedbank Business Banking offers the full spectrum of commercial banking products and related services to companies with an annual turnover of up to R700m.
Nedbank WealthNedbank Wealth provides a range of financial services through three divisions of Wealth Management, Asset Management and Insurance. The cluster has operations in SA, London, on the Isle of Man, Jersey, Guernsey and the uAE. Nedbank Wealth creates, manages and protects the wealth of a wide spectrum of clients ranging from high-net-worth individuals all the way through to the entry-level market.
Rest of Africa DivisionThe Rest of Africa Division is responsible for the group’s banking operations and expansion activities in the rest of Africa. The Rest of Africa Division has client-facing subsidiaries (retail and wholesale banking) in Lesotho, Malawi, Namibia, Swaziland and Zimbabwe and an investment, with management control, in a bank in Mozambique. The division also holds the 20,7% investment in Ecobank Transnational Incorporated, manages the Ecobank-Nedbank alliance and facilitates investments in other countries in Africa.
CentreThe Centre is an aggregation of business operations that provide various support services to Nedbank Group Limited, which includes the following clusters: Group Finance, Group Technology, Group Strategic Planning and Economics, Group Human Resources, Enterprise Governance and Compliance, Group Risk and Group Marketing, Communications and Corporate Affairs. The Centre also includes Group Balance Sheet Management which is responsible for capital management, liquidity and funding management, the management of banking-book interest rate risk, margin management and strategic portfolio management.
16
SEGMENTAL REPORTING (continued)for the year ended 31 December
nedbank Group nedbank Capital nedbank Corporate
total nedbank retail and nedbank business
banking nedbank retail nedbank business
banking nedbank Wealth rest of africa division Centre2014 2013 2014 2013 2014 2013 2014 2013 2014 2013 2014 2013 2014 2013 2014 2013 2014 2013
statement of financial position (rm)Cash and cash equivalents 28 250 34 073 2 619 10 986 3 435 2 755 2 932 2 616 2 932 2 616 934 1 706 3 328 2 779 15 002 13 231 Other short-term securities 67 234 42 451 29 414 30 969 9 943 6 847 1 849 958 26 028 3 677 Derivative financial instruments 15 573 13 390 15 551 13 327 (52) (52) 1 2 24 20 49 93 Government and other securities 27 177 32 091 10 084 9 635 5 926 6 117 377 379 377 379 336 709 10 454 15 251 Loans and advances 613 021 579 372 105 601 109 549 199 557 175 274 268 882 258 220 203 063 195 435 65 819 62 785 24 819 22 082 14 073 14 700 89 (453)Other assets 58 058 48 217 4 903 6 242 4 203 4 269 5 888 5 014 5 532 4 725 356 289 21 912 20 274 7 818 951 13 334 11 467
Intergroup assets 45 761 36 142 45 761 36 142 (45 761) (36 142)
total assets 809 313 749 594 168 172 180 708 213 069 188 363 323 840 302 371 211 904 203 155 111 936 99 216 57 609 50 911 27 428 20 117 19 195 7 124
equity and liabilitiesTotal equity 70 911 64 336 6 891 5 863 10 606 8 514 27 565 26 683 22 109 21 903 5 456 4 780 2 830 2 487 3 549 1 998 19 470 18 791 Derivative financial instruments 15 472 16 580 15 429 16 546 4 1 47 27 (8) 6 Amounts owed to depositors 653 450 602 952 137 391 106 226 182 009 176 234 224 103 201 928 118 134 107 931 105 969 93 997 26 122 21 704 17 058 14 406 66 767 82 454 Provisions and other liabilities 33 842 32 458 6 626 6 372 1 558 2 042 3 373 3 002 2 862 2 563 511 439 17 626 16 560 876 566 3 783 3 916 Long-term debt instruments 35 638 33 268 1 159 1 051 1 775 1 994 1 775 1 994 4 4 32 700 30 219
Intergroup liabilities 676 44 650 18 896 1 573 67 024 68 764 67 024 68 764 11 027 10 159 5 894 3 116 (103 517) (128 262)
total equity and liabilities 809 313 749 594 168 172 180 708 213 069 188 363 323 840 302 371 211 904 203 155 111 936 99 216 57 609 50 911 27 428 20 117 19 195 7 124
statement of comprehensive income (rm)Net interest income 22 961 21 220 1 937 1 608 3 982 3 525 15 216 14 314 11 720 11 206 3 496 3 108 628 531 898 801 300 441
Impairments charge on loans and advances 4 506 5 565 106 306 400 385 3 771 4 765 3 500 4 355 271 410 41 59 35 50 153
income from lending activities 18 455 15 655 1 831 1 302 3 582 3 140 11 445 9 549 8 220 6 851 3 225 2 698 587 472 863 751 147 441
Non-interest revenue 20 312 19 361 3 206 3 078 2 256 1 944 10 530 10 380 8 820 8 651 1 710 1 729 3 399 3 081 768 675 153 203
operating income 38 767 35 016 5 037 4 380 5 838 5 084 21 975 19 929 17 040 15 502 4 935 4 427 3 986 3 553 1 631 1 426 300 644 Total operating expenses 24 534 22 419 2 256 2 156 2 408 2 169 16 076 14 824 12 689 11 705 3 387 3 119 2 484 2 218 1 256 1 126 54 (74)
Indirect taxation 635 601 68 36 6 32 243 242 215 217 28 25 102 108 30 23 186 160
profit from operations 13 598 11 996 2 713 2 188 3 424 2 883 5 656 4 863 4 136 3 580 1 520 1 283 1 400 1 227 345 277 60 558
Share of profits/(losses) of associate companies and joint arrangements 161 27 12 26 (1) 149 2
profit before direct taxation 13 759 12 023 2 713 2 188 3 436 2 909 5 656 4 863 4 136 3 580 1 520 1 283 1 400 1 226 494 277 60 560
Direct taxation 3 487 3 033 572 473 837 664 1 562 1 357 1 136 1 003 426 354 358 326 85 64 73 149
profit/(loss) after direct taxation 10 272 8 990 2 141 1 715 2 599 2 245 4 094 3 506 3 000 2 577 1 094 929 1 042 900 409 213 (13) 411 Profit attributable to non-controlling interest:– ordinary shareholders 69 28 13 (11) 52 40 4 (1)
– preference shareholders 323 292 63 38 63 38 260 254
Headline earnings/(loss) 9 880 8 670 2 128 1 726 2 599 2 245 4 031 3 468 2 937 2 539 1 094 929 1 042 900 357 173 (277) 158
selected ratiosAverage interest-earning banking assets (Rm) 652 194 594 715 117 151 97 506 193 751 173 642 306 401 289 113 198 343 193 027 108 058 96 086 32 351 27 455 18 920 17 207 (16 380) (10 208)Return on total assets (%) 1,27 1,23 1,18 1,11 1,30 1,25 1,24 1,16 1,42 1,27 1,01 0,96 1,91 1,95 1,58 0,90 Return on ordinary shareholders' equity (%) 15,8 15,6 30,9 29,4 24,5 26,4 14,6 13,0 13,3 11,6 20,1 19,4 36,8 36,2 10,1 8,7 Net interest income to average interest-earning banking assets (%) 3,52 3,57 1,65 1,65 2,06 2,03 4,97 4,95 5,91 5,81 3,24 3,24 1,94 1,93 4,75 4,66 Non-interest revenue to total income (%) 46,9 47,7 62,3 65,7 36,2 35,5 40,9 42,0 42,9 43,6 32,9 35,7 84,4 85,3 46,1 45,7 Non-interest revenue to total operating expenses (%) 82,8 86,4 142,1 142,7 93,7 89,7 65,5 70,0 69,5 73,9 50,5 55,4 136,9 138,9 61,2 59,9 Credit loss ratio – banking advances (%) 0,79 1,06 0,14 0,51 0,21 0,23 1,39 1,80 1,70 2,16 0,42 0,65 0,17 0,28 0,23 0,37 Efficiency ratio 56,5 55,2 43,9 46,0 38,5 39,5 62,4 60,0 61,8 58,9 65,1 64,5 61,7 61,4 69,2 76,3 Effective taxation rate (%) 25,3 25,2 21,1 21,6 24,4 22,8 27,6 27,9 27,5 28,0 28,0 27,6 25,6 26,6 17,2 23,1 Contribution to group economic profit 2 112 2 114 1 198 963 1 167 1 138 310 (48) (308) 358 308 660 577 (122) (87) (1 101) (477)
Number of employees 30 499 29 513 665 683 2 123 2 186 20 373 19 499 18 026 17 153 2 347 2 346 2 119 2 056 1 605 1 501 3 614 3 588
1 Includes all group eliminations.
The 2013 comparative results for the segmental reporting have been restated. The Rest of Africa Division is now reported separately, and Central Management and Shared Services are collectively reported as the Centre. The restatement has had no effect on the group results and ratios, and only affects segment results and ratios.
Depreciation costs of R946m (2013: R870m) and amortisation costs of R719m (2013: R648m) for property, equipment, computer software, capitalised development and other intangible assets are charged on an activity-justified transfer pricing methodology by the segment owning the assets to the segment utilising the benefits thereof.

NedbaNk Group
17
Consolidated and separate annual
finanCial statements
nedbank Group nedbank Capital nedbank Corporate
total nedbank retail and nedbank business
banking nedbank retail nedbank business
banking nedbank Wealth rest of africa division Centre2014 2013 2014 2013 2014 2013 2014 2013 2014 2013 2014 2013 2014 2013 2014 2013 2014 2013
statement of financial position (rm)Cash and cash equivalents 28 250 34 073 2 619 10 986 3 435 2 755 2 932 2 616 2 932 2 616 934 1 706 3 328 2 779 15 002 13 231 Other short-term securities 67 234 42 451 29 414 30 969 9 943 6 847 1 849 958 26 028 3 677 Derivative financial instruments 15 573 13 390 15 551 13 327 (52) (52) 1 2 24 20 49 93 Government and other securities 27 177 32 091 10 084 9 635 5 926 6 117 377 379 377 379 336 709 10 454 15 251 Loans and advances 613 021 579 372 105 601 109 549 199 557 175 274 268 882 258 220 203 063 195 435 65 819 62 785 24 819 22 082 14 073 14 700 89 (453)Other assets 58 058 48 217 4 903 6 242 4 203 4 269 5 888 5 014 5 532 4 725 356 289 21 912 20 274 7 818 951 13 334 11 467
Intergroup assets 45 761 36 142 45 761 36 142 (45 761) (36 142)
total assets 809 313 749 594 168 172 180 708 213 069 188 363 323 840 302 371 211 904 203 155 111 936 99 216 57 609 50 911 27 428 20 117 19 195 7 124
equity and liabilitiesTotal equity 70 911 64 336 6 891 5 863 10 606 8 514 27 565 26 683 22 109 21 903 5 456 4 780 2 830 2 487 3 549 1 998 19 470 18 791 Derivative financial instruments 15 472 16 580 15 429 16 546 4 1 47 27 (8) 6 Amounts owed to depositors 653 450 602 952 137 391 106 226 182 009 176 234 224 103 201 928 118 134 107 931 105 969 93 997 26 122 21 704 17 058 14 406 66 767 82 454 Provisions and other liabilities 33 842 32 458 6 626 6 372 1 558 2 042 3 373 3 002 2 862 2 563 511 439 17 626 16 560 876 566 3 783 3 916 Long-term debt instruments 35 638 33 268 1 159 1 051 1 775 1 994 1 775 1 994 4 4 32 700 30 219
Intergroup liabilities 676 44 650 18 896 1 573 67 024 68 764 67 024 68 764 11 027 10 159 5 894 3 116 (103 517) (128 262)
total equity and liabilities 809 313 749 594 168 172 180 708 213 069 188 363 323 840 302 371 211 904 203 155 111 936 99 216 57 609 50 911 27 428 20 117 19 195 7 124
statement of comprehensive income (rm)Net interest income 22 961 21 220 1 937 1 608 3 982 3 525 15 216 14 314 11 720 11 206 3 496 3 108 628 531 898 801 300 441
Impairments charge on loans and advances 4 506 5 565 106 306 400 385 3 771 4 765 3 500 4 355 271 410 41 59 35 50 153
income from lending activities 18 455 15 655 1 831 1 302 3 582 3 140 11 445 9 549 8 220 6 851 3 225 2 698 587 472 863 751 147 441
Non-interest revenue 20 312 19 361 3 206 3 078 2 256 1 944 10 530 10 380 8 820 8 651 1 710 1 729 3 399 3 081 768 675 153 203
operating income 38 767 35 016 5 037 4 380 5 838 5 084 21 975 19 929 17 040 15 502 4 935 4 427 3 986 3 553 1 631 1 426 300 644 Total operating expenses 24 534 22 419 2 256 2 156 2 408 2 169 16 076 14 824 12 689 11 705 3 387 3 119 2 484 2 218 1 256 1 126 54 (74)
Indirect taxation 635 601 68 36 6 32 243 242 215 217 28 25 102 108 30 23 186 160
profit from operations 13 598 11 996 2 713 2 188 3 424 2 883 5 656 4 863 4 136 3 580 1 520 1 283 1 400 1 227 345 277 60 558
Share of profits/(losses) of associate companies and joint arrangements 161 27 12 26 (1) 149 2
profit before direct taxation 13 759 12 023 2 713 2 188 3 436 2 909 5 656 4 863 4 136 3 580 1 520 1 283 1 400 1 226 494 277 60 560
Direct taxation 3 487 3 033 572 473 837 664 1 562 1 357 1 136 1 003 426 354 358 326 85 64 73 149
profit/(loss) after direct taxation 10 272 8 990 2 141 1 715 2 599 2 245 4 094 3 506 3 000 2 577 1 094 929 1 042 900 409 213 (13) 411 Profit attributable to non-controlling interest:– ordinary shareholders 69 28 13 (11) 52 40 4 (1)
– preference shareholders 323 292 63 38 63 38 260 254
Headline earnings/(loss) 9 880 8 670 2 128 1 726 2 599 2 245 4 031 3 468 2 937 2 539 1 094 929 1 042 900 357 173 (277) 158
selected ratiosAverage interest-earning banking assets (Rm) 652 194 594 715 117 151 97 506 193 751 173 642 306 401 289 113 198 343 193 027 108 058 96 086 32 351 27 455 18 920 17 207 (16 380) (10 208)Return on total assets (%) 1,27 1,23 1,18 1,11 1,30 1,25 1,24 1,16 1,42 1,27 1,01 0,96 1,91 1,95 1,58 0,90 Return on ordinary shareholders' equity (%) 15,8 15,6 30,9 29,4 24,5 26,4 14,6 13,0 13,3 11,6 20,1 19,4 36,8 36,2 10,1 8,7 Net interest income to average interest-earning banking assets (%) 3,52 3,57 1,65 1,65 2,06 2,03 4,97 4,95 5,91 5,81 3,24 3,24 1,94 1,93 4,75 4,66 Non-interest revenue to total income (%) 46,9 47,7 62,3 65,7 36,2 35,5 40,9 42,0 42,9 43,6 32,9 35,7 84,4 85,3 46,1 45,7 Non-interest revenue to total operating expenses (%) 82,8 86,4 142,1 142,7 93,7 89,7 65,5 70,0 69,5 73,9 50,5 55,4 136,9 138,9 61,2 59,9 Credit loss ratio – banking advances (%) 0,79 1,06 0,14 0,51 0,21 0,23 1,39 1,80 1,70 2,16 0,42 0,65 0,17 0,28 0,23 0,37 Efficiency ratio 56,5 55,2 43,9 46,0 38,5 39,5 62,4 60,0 61,8 58,9 65,1 64,5 61,7 61,4 69,2 76,3 Effective taxation rate (%) 25,3 25,2 21,1 21,6 24,4 22,8 27,6 27,9 27,5 28,0 28,0 27,6 25,6 26,6 17,2 23,1 Contribution to group economic profit 2 112 2 114 1 198 963 1 167 1 138 310 (48) (308) 358 308 660 577 (122) (87) (1 101) (477)
Number of employees 30 499 29 513 665 683 2 123 2 186 20 373 19 499 18 026 17 153 2 347 2 346 2 119 2 056 1 605 1 501 3 614 3 588
1 Includes all group eliminations.
The 2013 comparative results for the segmental reporting have been restated. The Rest of Africa Division is now reported separately, and Central Management and Shared Services are collectively reported as the Centre. The restatement has had no effect on the group results and ratios, and only affects segment results and ratios.
Depreciation costs of R946m (2013: R870m) and amortisation costs of R719m (2013: R648m) for property, equipment, computer software, capitalised development and other intangible assets are charged on an activity-justified transfer pricing methodology by the segment owning the assets to the segment utilising the benefits thereof.

18
NOTES TO THE CONSOLIDATED FINANCIAL STATEMENTSfor the year ended 31 December
1 PRINCIPAL ACCOuNTING POLICIESThe group applies the following accounting policies in preparing the consolidated and separate financial statements of Nedbank Group Limited.
1.1 Basis of preparationThe financial statements have been prepared on a going-concern basis and have been prepared on a consistent basis with the prior year, except as detailed in note 2.2.
The consolidated and separate financial statements have been prepared in accordance with International Financial Reporting Standards (IFRS) as issued by the International Accounting Standards Board, the SAICA Financial Reporting Guides as issued by the Accounting Practices Committee, Financial Pronouncements as issued by the Financial Reporting Standards Council, the requirements of the Companies Act, 71 of 2008 (as amended) and the JSE Listings Requirements.
The financial information presented in the consolidated financial statements comprises that of the parent company, Nedbank Group Limited, together with its subsidiaries, including consolidated structured entities, joint arrangements and associates, presented as a single entity (‘the group’). The financial information presented in the separate financial statements comprises that of the parent company, Nedbank Group Limited (‘the company‘).
The financial statements are presented in SA rand, the functional currency of Nedbank Group Limited, and are rounded to the nearest million rands. The statements are prepared on the accrual and historical cost basis of accounting, except for:
■ non-current assets and disposal groups held for sale, which are all stated at the lower of the carrying amount and the fair value less costs to sell;
■ employee benefit liabilities, valued using the projected-unit credit method, less the net total fair value of the plan assets; and ■ the following assets and liabilities, which are stated at their fair value:
� financial assets and financial liabilities classified as at fair value through profit or loss; � financial assets classified as available for sale; and � investment properties and owner-occupied properties.
1.2 Accounting policy electionsThe following accounting policy elections have been made by the group:
property and equipment ■ Land and buildings are stated at revalued amounts.
■ Revaluation surpluses are recognised directly in equity, through other comprehensive income.
investment in venture capital divisions ■ In venture capital divisions the group has elected to carry associate and joint-venture entities at fair value through profit and loss.
financial instruments ■ The group has elected to designate certain fixed-rate financial assets and liabilities at fair value through profit and loss to reduce the accounting mismatch.
■ ‘Regular way’ purchases or sales of financial assets are recognised and derecognised using trade date accounting.
investment properties ■ The group has elected to recognise all investment properties at fair value, with changes in fair value being recognised in profit and loss for the period.
investments in subsidiaries, associate companies and joint arrangements
■ The group has elected to recognise these investments at cost in the company financial statements.

NedbaNk Group
19
Consolidated and separate annual
finanCial statements
1.3 Group accountingThe group has adopted IFRS 10 Consolidated Financial Statements, IFRS 11 Joint Arrangements and IFRS 12 Disclosure of Interests in Other Entities, as well as the consequential amendments to International Accounting Standards (IAS) 28 Investments in Associates and Joint Ventures (2011), with effect from 1 January 2013.
subsidiary undertakings and consolidated structured entitiesSubsidiary undertakings are those entities, including unincorporated entities such as trusts and partnerships that are controlled by the group. The group controls an entity when it is exposed to, or has rights to, variable returns from its involvement with the entity and has the ability to affect those returns through its power over the entity. The group is considered to have power over an entity when it has existing rights that give it the current ability to direct the relevant activities of the entity. The group is exposed, or has rights, to variable returns from its involvement with the entity when the investor’s returns from its involvement have the potential to vary as a result of the entity’s performance. The group considers all facts and circumstances relevant to its involvement with an entity to evaluate whether control exists. The group assesses any changes to the facts and circumstances relevant to the entity and reassesses the consolidation requirements on a continuous basis.
The group financial statements include the assets, liabilities and results of the company plus subsidiaries, including consolidated structured entities from the date control is established until the date that control ceases.
Where a subsidiary has a reporting period that is different from that of the group, the results of the subsidiary are adjusted to reflect a reporting period consistent with the group’s reporting period. Where necessary, adjustments are made to the financial statements of subsidiaries to align any difference in accounting policies with those of the group.
Subsidiaries include structured entities that are designed so that its activities are not governed by way of voting rights. In assessing whether the group has power over such investees in which it has an interest, the group considers factors such as the purpose and design of the investee; its practical ability to direct the relevant activities of the investee; the nature of its relationship with the investee; and the size of its exposure to the variability of returns of the investee.
Intragroup balances, transactions, income and expenses, and profits and losses are eliminated in preparation of the group financial statements. unrealised losses are not eliminated to the extent that they provide objective evidence of impairment.
associatesAn associate is an entity, including an unincorporated entity, over which the group has the ability to exercise significant influence, but not control or joint control, through participation in the financial and operating policy decisions of the investment (that is neither a subsidiary nor an investment in a joint arrangement). This is generally demonstrated by the group holding in excess of 20%, but no more than 50%, of the voting rights.
The profit or loss of the associate and assets and liabilities, including goodwill identified on acquisition, net of any accumulated impairment losses, are included in the group financial statements using the equity method of accounting from the date significant influence commences until the date significant influence ceases. Where an associate has a reporting period that is different from that of the group, the results of the associate are adjusted to reflect a reporting period consistent with the group’s reporting period. The carrying amount of such investments is reduced to recognise any impairment in the value of individual investments. When the group’s share of losses exceeds the carrying amount of the associate, the carrying amount is reduced to nil, inclusive of any long-term debt outstanding. The recognition of further losses is discontinued, except to the extent that the group has incurred or guaranteed obligations in respect of the associate.
Where an entity within the group transacts with an associate of the group, unrealised profits and losses are eliminated to the extent of the group’s interest in the associate, but only to the extent that there is no evidence of impairment.
At each reporting date the group determines whether there is objective evidence that the investments in associates are impaired. Objective evidence of impairment for an associate investment includes information about significant changes with an adverse effect that have taken place in the technological, market, economic or legal environment in which the issuer operates, and indicates that the cost of the associate investment may not be recovered. A significant or prolonged decline in the fair value of an associate investment below its cost is also objective evidence of impairment. The carrying amounts of such investments are then reduced to recognise any impairment by applying the impairment methodology described in 1.12.
Investments in associates that are held with the intention of disposing thereof within 12 months are accounted for and classified as noncurrent assets held for sale in accordance with the methodology described in 1.11.
Joint arrangementsJoint arrangements are those entities over which the group has joint control, established by contractual agreements requiring unanimous consent for decisions about activities that significantly affect the arrangements’ returns. They are classified and accounted as follows:
■ Joint operation – when the group has rights to the assets, and obligations for the liabilities, relating to an arrangement, it accounts for its assets, liabilities and transactions, including its share of those held or incurred jointly, in relation to the joint operation.
■ Joint venture – when the group has rights only to the net assets of the arrangement, it accounts for its interest using the equity method. The carrying amount of such investments is reduced to recognise any impairment in the value of individual investments, by applying the impairment methodology described in 1.12.
Where an entity within the group transacts with a joint arrangement of the group, unrealised profits and losses are eliminated to the extent of the group’s interest in the joint arrangement. When the group’s share of losses exceeds the carrying amount of the joint arrangement, the carrying amount is reduced to nil. The recognition of further losses is discontinued, except to the extent that the group has incurred or guaranteed obligations in respect of the joint arrangement.
Investments in joint arrangements that are held with the intention of disposing thereof within 12 months are accounted for and classified as non-current assets held for sale in accordance with the methodology described in 1.11.
CompanyInvestments in group companies are accounted for at cost less impairment losses in the company financial statements. The carrying amounts of these investments are reviewed annually and impaired when necessary by applying the impairment methodology described in 1.12.
Common control transactionsFor transactions in which combining entities are controlled by the same party or parties before and after the transaction and where that control is not transitory are referred to as common control transactions. The group’s accounting policy for the acquiring entity would be to account for the transaction at book values as reflected in the consolidated financial statements of the selling entity.
The excess of the cost of the transaction over the acquirer’s proportionate share of the net assets value acquired in common control transactions, will be allocated to the common control reserve in equity.
Investments held by venture capital divisionsWhere the group has an investment in an associate or joint-venture company held by a venture capital division, whose primary business is to purchase and dispose of minority stakes in entities, the investment is classified as designated at fair value through profit or loss, as the divisions are managed on a fair-value basis. Changes in the fair value of these investments are recognised in non-interest revenue in profit or loss in the period in which they occur.

20
NOTES TO THE CONSOLIDATED FINANCIAL STATEMENTS (continued)for the year ended 31 December
Acquisitions and disposals of stakes in group companiesAcquisitions of subsidiaries (entities acquired) and businesses (assets and liabilities acquired) are accounted for using the acquisition method. The cost of a business combination is measured as the aggregate of the fair values (at the acquisition date) of assets given, liabilities incurred or assumed, and equity instruments issued by the group in exchange for control of the acquiree. For all transactions subsequent to 31 December 2008 acquisition-related costs are recognised in profit or loss as incurred. Prior to this date all acquisition-related costs were capitalised to the cost of the acquisition.
Where the cost of acquisition includes any asset or liability resulting from a contingent consideration arrangement, that asset or liability is measured at the acquisition date fair value. Subsequent changes in such fair values are adjusted against the cost of acquisition where they qualify as measurement period adjustments (see below). All other subsequent changes in the fair value of a contingent consideration classified as an asset or liability are accounted for in accordance with the relevant IFRS. Changes in the fair value of a contingent consideration that has been classified as equity are not recognised.
The acquiree’s identifiable assets, liabilities and contingent liabilities that meet the conditions for recognition under IFRS 3 Business Combinations are recognised at their fair value at the date of acquisition, except:
■ deferred taxation assets or liabilities, which are recognised and measured in accordance with IAS 12 Income Taxes, and liabilities or assets related to employee benefit arrangements, which are recognised and measured in accordance with IAS 19 Employee Benefits;
■ liabilities or equity instruments that relate to the replacement, by the group, of an acquiree’s share-based payment awards, which are measured in accordance with IFRS 2 Share-based Payments; and
■ assets (or disposal groups) that are classified as held for sale in accordance with IFRS 5 Non-current Assets Held for Sale and discontinued operations, which are measured in accordance with that standard.
If the initial accounting for a business combination is incomplete by the end of the reporting period in which the combination occurs, the group reports provisional amounts for the items for which the accounting is incomplete. Where provisional amounts were reported, these are adjusted during the measurement period (see below). Additional assets or liabilities are recognised to reflect any new information obtained about the facts and circumstances that existed at the date of acquisition, which, if known, would have affected the amounts recognised on that date.
The measurement period is the period from the date of acquisition to the date the group receives complete information about the facts and circumstances that existed at the acquisition date. This measurement period is subject to a maximum of one year after the acquisition date.
Where a business combination is achieved in stages, the group’s previously held interests in the acquired entity are remeasured to fair value at the acquisition date on the date the group attains control, and the resulting gain or loss, if any, is recognised in profit or loss. Amounts arising from interests in the acquiree prior to the acquisition date that have previously been recognised in other comprehensive income (OCI) are reclassified to profit or loss, where such treatment would be appropriate if that interest were disposed of.
Non-controlling interests in the net assets of consolidated subsidiaries are identified separately from the group’s equity therein. The interest of non-controlling shareholders is initially measured either at fair value or at the non-controlling interest’s proportionate share of the acquiree’s identifiable net assets. The choice of measurement basis is made on an acquisition-by-acquisition basis. Subsequent to the acquisition, non-controlling interests consist of the amount attributed to such interests at initial recognition and the non-controlling interest’s share of changes in equity since the date of the combination.
The difference between the proceeds from the disposal of a subsidiary, the fair value of any retained investment and its carrying amount at the date of disposal, including the cumulative amount of any exchange differences recognised in the statement of changes in equity that relate
to the subsidiary, is recognised as a gain or loss on the disposal of the subsidiary in the group profit or loss for the period.
All changes in the group’s interest in a subsidiary that do not result in a loss of control are accounted for as equity transactions (transactions with owners). Any difference between the amount by which the non-controlling interests are increased or decreased and the fair value of the consideration paid or received, is recognised directly in equity and attributed to the group.
GoodwillGoodwill arising on the acquisition of a subsidiary is recognised as an asset on the date that control is acquired, being the acquisition date. Goodwill is measured as the excess of the sum of the consideration transferred, the amount of any non-controlling interest in the acquiree and the fair value of the acquirer’s previously held equity interest (if any) in the entity over the net fair value of the identifiable net assets recognised. If, after reassessment, the group’s interest in the net fair value of the acquiree’s identifiable net assets exceeds the sum of the consideration transferred plus the amount of any non-controlling interest in the acquiree and the fair value of the acquirer’s previously held equity interest (if any), this excess is recognised immediately in profit or loss as a bargain purchase gain.
Goodwill is not amortised, but is tested for impairment at least once a year. Any impairment loss is recognised immediately in profit or loss and is not subsequently reversed.
On disposal of a subsidiary the goodwill attributable to the subsidiary is included in the determination of the profit or loss on disposal.
1.4 Foreign currency translationForeign currency transactionsIndividual entities within the group may use a different functional currency than that of the group, being the currency of the primary economic environment in which the respective entities operate. Transactions in foreign currencies are translated into the functional currency of the individual entities in the group at the date of the transaction by applying the spot exchange rate ruling at the transaction date to the foreign currency amounts.
Monetary assets and liabilities in foreign currencies are translated into the functional currency of the respective entities of the group at the spot exchange rate ruling at the reporting date.
Exchange differences that arise on the settlement or translation of monetary items at rates that are different from those at which they were translated on initial recognition during the period or in previous financial statements are recognised in profit or loss in the period that they arise.
Non-monetary assets and liabilities denominated in foreign currencies that are measured at fair value are translated into the respective functional currencies of the group entities using the foreign exchange rates ruling at the dates when the fair values were determined.
Non-monetary assets and liabilities denominated in foreign currencies that are measured in terms of historical cost are converted into the functional currency of the respective group entities at the rate of exchange ruling at the date of the transaction and are not subsequently retranslated.
Exchange differences on non-monetary items are recognised consistently with the gains and losses that arise on such items. For example, exchange differences relating to an item for which gains and losses are recognised directly in equity are generally recognised in equity. Conversely, exchange differences for non-monetary items for which gains and losses are recognised in profit or loss are recognised in profit or loss in the period in which they arise.
Investments in foreign operationsNedbank Group Limited’s presentation currency is SA rand.
The assets and liabilities, including goodwill, of those entities that have functional currencies other than that of the group (SA rand) are translated at the closing exchange rate. Income and expenses are translated using the average exchange rate for the period. The differences
NedbaNk Group
21
Consolidated and separate annual
finanCial statements
that arise on translation of these entities are recognised in OCI in the statement of comprehensive income. The cumulative exchange differences are recognised as a separate component of equity and are represented by the balance in the foreign currency translation reserve.
On disposal of a foreign operation the cumulative amount in the foreign currency translation reserve related to that operation is transferred to profit or loss for the period when the gain or loss on the disposal of the foreign operation is recognised.
The primary and major determinants for non-rand functional currencies are the economic factors that determine the sales price for goods and services as well as costs. Additional supplementary factors to be considered are funding, autonomy and cashflows.
1.5 Financial instrumentsFinancial instruments, as recognised in the statement of financial position, include all financial assets and financial liabilities, including derivative instruments, but exclude investments in subsidiaries, associate companies and joint arrangements (other than investments held by venture capital divisions) and employee benefit plans. Financial instruments are accounted for under IAS 32 Financial Instruments: Presentation, IAS 39 Financial Instruments: Recognition and Measurement, IFRS 7 Financial Instruments: Disclosures and IFRS 13 Fair Value Measurement.
The group commenced hedge accounting during the 2014 financial period. This is neither a change in accounting policy nor as a result of the adoption of a new or amended standard, but merely the first time application of an accounting treatment currently permitted under existing and currently effective IFRS.
This accounting policy should be read in conjunction with the group’s categorised statement of financial position, the group’s risk management policies and note 37.1.
Initial recognitionFinancial instruments are recognised in the statement of financial position when the group becomes a party to the contractual provisions of a financial instrument. All purchases of financial assets that require delivery within the timeframe established by regulation or market convention (‘regular way’ purchases) are recognised at the trade date, which is the date on which the group commits to purchase the financial asset. The liability to pay for ‘regular way’ purchases of financial assets is recognised on the trade date, which is when the group becomes a party to the contractual provisions of the financial instrument.
Contracts that require or permit net settlement of the change in the value of the contract are not considered ‘regular way’ contracts and are treated as derivatives between the trade and settlement dates of the contract.
Initial measurementFinancial instruments that are categorised and designated at initial recognition as being at fair value through profit or loss are recognised at fair value. Transaction costs, which are directly attributable to the acquisition or on issue of these financial instruments, are recognised immediately in profit and loss.
Financial instruments that are not carried at fair value through profit or loss are initially measured at fair value plus transaction costs that are directly attributable to the acquisition or issue of the financial instruments.
Where the transaction price in a non-active market is different to the fair value from other observable current market transactions in the same instrument or based on a valuation technique, the variables of which include only data from observable markets, the group defers such differences (day-one gains or losses). Day-one gains or losses are amortised on a straight-line basis over the life of the financial instrument. To the extent that the inputs determining the fair value of the instrument become observable, or on derecognition of the instrument, day-one gains or losses are recognised immediately in profit or loss.
Categories of financial instrumentsSubsequent to initial recognition, financial instruments are measured at fair value or amortised cost, depending on their classification and whether fair value can be measured reliably:
■ Financial instruments at fair value through profit or lossFinancial instruments at fair value through profit or loss consist of instruments that are held for trading and instruments that the group has designated, at the initial recognition date, as at fair value through profit or loss.
The group classifies instruments as held for trading if they have been acquired or incurred principally for the purpose of sale or repurchase in the near term, they are part of a portfolio of identified financial instruments for which there is evidence of a recent actual pattern of short-term profittaking or they are derivatives. The group’s derivative transactions include foreign exchange contracts, interest rate futures, forward rate agreements, currency and interest rate swaps, and currency and interest rate options (both written and purchased).
Financial instruments that the group has elected, at the initial recognition date, to designate as at fair value through profit or loss are those that meet any one of the following conditions:
� the fair value through profit or loss designation eliminates or significantly reduces a measurement or recognition inconsistency that would otherwise arise from measuring assets or liabilities or recognising the gains and losses on assets and liabilities on different bases;
� the instrument forms part of a group of financial instruments that is managed and its performance is evaluated on a fair value basis, in accordance with a documented risk management or investment strategy, and information about the group is provided internally on that basis to key management personnel, using a fair-value basis; or
� a contract contains one or more embedded derivatives that require separation from the host contract or a derivative that significantly modifies the cashflows of the host contract.
Gains or losses on financial instruments at fair value through profit or loss (excluding interest income and interest expense calculated on the amortised-cost basis relating to interest-bearing instruments that have been designated as at fair value through profit or loss) are reported in non-interest revenue in the period in which they arise. Interest income and interest expense calculated in accordance with the effective-interest method are reported in interest income and expense, except for interest income and interest expense on instruments held for trading, which are recognised in non-interest revenue.
■ Non-trading financial liabilitiesAll financial liabilities, other than those at fair value through profit or loss, are classified as non-trading financial liabilities and are measured at amortised cost. The interest expense is recorded in interest expense and similar charges.
■ Held-to-maturity financial assetsHeld-to-maturity financial assets are non-derivative financial assets with fixed or determinable payments and a fixed maturity that the group has the positive intention and ability to hold to maturity, other than those that meet the definition of loans and receivables or those that were designated as at fair value through profit or loss or available for sale. Held-to-maturity financial assets are measured at amortised cost, with interest income recognised in interest and similar income. Gains or losses arising on disposal of held-to-maturity financial assets are recognised in non-interest revenue.
■ Loans and receivablesLoans and receivables are non-derivative financial assets with fixed or determinable payments that are not quoted in an active market, other than those financial assets classified by the group on initial recognition as at fair value through profit or loss, available for sale or loans and receivables that are held for trading.

22
NOTES TO THE CONSOLIDATED FINANCIAL STATEMENTS (continued)for the year ended 31 December
Financial assets that are classified as loans and receivables are carried at amortised cost, with interest income recognised in interest and similar income. Gains or losses arising on disposal are recognised in non-interest revenue. The majority of the group’s advances are included in the loans and receivables category.
■ Available-for-sale financial assetsAvailable-for-sale financial assets are non-derivative financial assets that the group has designated as available for sale or are not classified as (a) loans and receivables, (b) held-to-maturity investments or (c) financial assets as at fair value through profit or loss.
Available-for-sale financial assets are measured at fair value, with fair-value gains or losses recognised in other comprehensive income, unless the asset has been designated as a hedged item in a fair-value hedging relationship subject to hedge accounting. In a fair-value hedging relationship, the portion of the fair value gain or loss of the asset attributable to the hedged risk is recorded in profit and loss to offset changes in the fair value of the hedging instrument. Any other changes in the fair value of the asset attributable to aspects other than the hedged risk, is recognised in other comprehensive income.
Foreign currency translation gains or losses on monetary items, impairment losses and interest income calculated using the effective-interest-rate method, is reported in profit or loss.
Derivative financial instruments and hedge accountingDerivatives are classified as assets when their fair value is positive or as liabilities when their fair value is negative, subject to the offsetting principles as described under ‘Offsetting financial instruments and related income’.
The method of recognising fair value gains and losses depends on whether derivatives are held for trading or are designated as hedging instruments, and if the latter, the nature of the risks being hedged.
■ Derivatives that qualify for hedge accountingThe group applies hedge accounting when transactions meet the criteria set out in IAS 39. When derivatives are designated as hedging instruments, the group classifies them as either:
■ hedges of the change in fair value of recognised assets or liabilities or firm commitments (‘fair value hedges’);
■ hedges of the variability in highly probable future cash flows attributable to a recognised asset or liability, or a forecast transaction (‘cash flow hedges’); or
■ a hedge of a net investment in a foreign operation (‘net investment hedges’).
Cashflow hedges and hedges of net investments in foreign entities do not currently form part of the group’s hedging strategy.
At the inception of a hedging relationship, the group designates and documents the relationship between the hedging instrument and the hedge item as well as its risk management objective and strategy for undertaking the hedging transactions, and the nature of the risk being hedged. The group also documents its assessment of whether the hedging instrument is effective in offsetting changes in fair value or cashflow of the hedged item attributable to the hedged risk.
Hedge effectiveness is assessed at inception and throughout the term of each hedging relationship. Each hedge must be expected to be highly effective (prospective effectiveness), and demonstrate actual effectiveness (retrospective effectiveness) on an ongoing basis.
For prospective effectiveness, the hedging instrument must be expected to be highly effective in offsetting changes in fair value or cash flows attributable to the hedges risk during the period for which the hedge is designated. For actual effectiveness to be achieved, the changes in fair value or cash flows must offset each other in the range of 80% to 125%.
Interest on designated qualifying hedges is included in net interest income.
■ Fair value hedgesWhere a hedging relationship is designated as a fair value hedge, the hedged item is adjusted for the change in fair value in respect of the risk
being hedged. Fair value gains and losses arising on the remeasurement of both the hedging instrument and the hedged item are recognised in ‘net interest income’, for so long as the hedging relationship is effective. Any hedge ineffectiveness is recognised in profit and loss in non-interest revenue.
If the derivative expires, is sold, terminated, exercised, no longer meets the criteria for fair-value hedge accounting, or the designation is revoked, then hedge accounting is discontinued.
■ Derivatives that do not qualify for hedge accountingAll gains and losses from changes in the fair value of derivatives that do not qualify for hedge accounting are recognised immediately in non-interest revenue.
Embedded derivativesDerivatives in a host contract that is a financial or non-financial instrument, such as an equity conversion option in a convertible bond, are separated from the host contract when all of the following conditions are met:
■ the economic characteristics and risks of the embedded derivative are not closely related to those of the host contract; and
■ a separate instrument with the same terms as the embedded derivative would meet the definition of a derivative; and
■ the combined contract is not measured at fair value, with changes in fair value recognised in profit or loss.
The host contract is accounted for:
■ under IAS 39 if it is a financial instrument; and ■ in accordance with other appropriate accounting standards if it is
not a financial instrument.
If an embedded derivative is required to be separated from its host contract, but it is not possible separately to measure the fair value of the embedded derivative, either at acquisition or at a subsequent financial reporting date, the entire hybrid instrument is categorised as at fair value through profit or loss and measured at fair value.
Measurement basis of financial instrumentsThere are two bases of measurement, namely amortised cost and fair value:
■ Amortised costThe amortised cost of a financial instrument is the amount at which the financial instrument is measured on initial recognition minus principal repayments, plus or minus the cumulative amortisation using the effective-interest method of any difference between the initial contractual amount and the maturity amount, less any cumulative impairment losses.
The effective-interest method is a method of calculating the amortised cost of a financial instrument and of allocating the interest income and expense over the relevant period. The effective interest rate is the rate that exactly discounts estimated future cash payments or receipts through the expected life of the financial instrument or, when appropriate, a shorter period, to the net carrying amount of the financial instrument. When calculating the effective interest rate, cashflows are estimated considering all contractual terms of the financial instrument, but future credit losses are not considered. The calculation includes all fees and points paid or received between parties to the contract that are an integral part of the effective interest rate, transaction costs, and all other premiums or discounts.
■ Fair valueThe fair value of a financial instrument is the amount that would be received to sell the asset or paid to transfer a liability in an orderly transaction between market participants at the measurement date.
The fair value of instruments that are quoted in an active market is determined using quoted prices where they represent those at which regularly and recently occurring transactions take place.
The group uses valuation techniques to establish the fair value of instruments where quoted prices in active markets are not available.
NedbaNk Group
23
Consolidated and separate annual
finanCial statements
For a detailed discussion of the fair value of financial instruments refer to note 37.1.
Impairment of financial assetsThe group assesses at each reporting date whether there is objective evidence that a financial asset or group of financial assets is impaired. A financial asset or a group of financial assets is impaired and impairment losses are incurred if, and only if, there is objective evidence of impairment as a result of one or more events that occurred after the initial recognition of the asset (a loss event) and that loss event has (or events have) an impact on the estimated future cashflows of the financial asset or group of financial assets that can be reliably estimated. Objective evidence that a financial asset or group of assets is impaired includes observable data that comes to the attention of the group about the following loss events:
■ significant financial difficulty of the issuer or obligor; ■ a breach of contract, such as a default or delinquency in respect of
interest or principal payments; ■ the group granting to the borrower, for economic or legal reasons
relating to the borrower’s financial difficulty, a concession that the group would not otherwise consider;
■ it becoming probable that the borrower will enter bankruptcy or other financial reorganisation;
■ the disappearance of an active market for that financial asset because of financial difficulties; or
■ observable data indicating that there is a measurable decrease in the estimated future cashflows from a group of financial assets since the initial recognition of those assets, although the decrease cannot yet be identified with the individual financial assets in the group, including:
� adverse changes in the payment status of borrowers in the group; or
� national or local economic conditions that correlate with defaults on the assets in the group.
Loans that would otherwise be past due or impaired and whose terms have been renegotiated and display the characteristics of a performing loan are reset to performing status. Loans whose terms have been renegotiated continue to be monitored to determine whether they are considered to be impaired or past due.
■ Assets carried at amortised costIf there is objective evidence that an impairment loss on loans and receivables or held-to-maturity financial assets carried at amortised cost has been incurred, the amount of the impairment loss is measured as the difference between the asset’s carrying amount and the present value of estimated future cashflows (excluding future credit losses that have not been incurred) discounted at the financial asset’s original effective interest rate. The carrying amount of the asset is reduced through the use of an allowance account and the amount of the loss is recognised in profit or loss.
The group first assesses whether there is objective evidence of impairment individually for financial assets that are individually significant, and individually or collectively for financial assets that are not individually significant. If the group determines that there is no objective evidence of impairment for an individually assessed financial asset, whether significant or not, it includes the asset in a group of financial assets with similar credit risk characteristics and collectively assesses them for impairment.
If, in a subsequent period, the amount of the impairment loss decreases and the decrease can be related objectively to an event occurring after the impairment was recognised (such as an improvement in the debtor’s credit rating), the previously recognised impairment loss is reversed by adjusting the allowance account. The reversal may not result in a carrying amount of the financial asset that exceeds what the amortised cost would have been had the impairment not been recognised at the date on which the impairment is reversed. The amount of the reversal is recognised in profit or loss for the period.
■ Available-for-sale financial assetsWhen a decline in the fair value of an available-for-sale financial asset has been recognised directly in equity, in the statement of comprehensive
income, and there is objective evidence that the asset is impaired, the cumulative loss that has been recognised directly in equity, in the statement of comprehensive income, is removed from equity and recognised in profit or loss. The amount of the cumulative loss that is removed from equity and recognised in profit or loss is the difference between the acquisition cost (net of any principal repayment and amortisation) and current fair value, less any impairment loss on that financial asset previously recognised in profit or loss. Impairment losses recognised in profit or loss for an investment in an equity instrument classified as available for sale are not reversed through profit or loss.
If, in a subsequent period, the fair value of a debt instrument classified as available for sale increases and the increase can be objectively related to an event occurring after the impairment loss was recognised in profit or loss, the impairment loss is reversed, with the amount of the reversal recognised in profit or loss for the period.
■ Maximum credit riskCredit risk arises principally from loans and advances to clients, investment securities, derivatives and irrevocable commitments to provide facilities. The maximum credit risk is typically the gross carrying amount, net of any amounts offset and impairment losses. The maximum credit exposure for loan commitments is the full amount of the commitment if the loan cannot be settled net in cash or using another financial asset.
DerecognitionThe group derecognises a financial asset (or group of financial assets) or a part of a financial asset (or part of a group of financial assets) when, and only when:
■ the contractual rights to the cashflows arising from the financial asset have expired; or
■ it transfers the financial asset, including substantially all the risks and rewards of ownership of the asset; or
■ it transfers the financial asset, neither retaining nor transferring substantially all the risks and rewards of ownership of the asset, but no longer retaining control of the asset.
A financial liability (or part of a financial liability) is derecognised when, and only when, the liability is extinguished, ie when the obligation specified in the contract is discharged, cancelled or has expired.
The difference between the carrying amount of a financial asset or financial liability (or part thereof) that is derecognised and the consideration paid or received, including any non-cash assets transferred or liabilities assumed, is recognised in non-interest revenue for the period.
SecuritisationsThe group securitises various consumer and commercial financial assets, generally resulting in the sale of these assets to structured entities, which in turn issue securities to investors. Interests in the securitised financial assets may be retained in the form of senior or subordinated tranches, interest-only strips or other residual interests (retained interests). Retained interests are primarily recorded in available-for-sale investment securities and carried at fair value.
Gains or losses on securitisation, if the financial assets or liabilities are derecognised, depend in part on the carrying amount of the transferred financial assets, allocated between the financial assets derecognised and the retained interests based on their relative fair values at the date of transfer. Gains or losses on securitisation are recorded in non-interest revenue for the period.
Offsetting financial instruments and related incomeFinancial assets and liabilities are offset and the net amount reported in the statement of financial position only when the group has a legally enforceable right to set off the financial asset and financial liability and the group has an intention of settling the asset and liability on a net basis or realising the asset and settling the liability simultaneously. Income and expense items are offset only to the extent that their related instruments have been offset in the statement of financial position.

24
CollateralFinancial and non-financial assets are held as collateral in respect of recognised financial assets. Such collateral, except cash collateral, is not recognised by the group, as the group does not retain the risks and rewards of ownership, and is obliged to return such collateral to counterparties on settlement of the related obligations. Should a counterparty be unable to settle its obligations, the group takes possession of collateral or calls on other credit enhancements as full or part settlement of such amounts. These assets are recognised when the applicable recognition criteria under IFRS are met, and the group’s accounting policies are applied from the date of recognition.
Cash collateral is recognised when the group receives the cash and is reported as amounts received from depositors. Collateral is also given to counterparties under certain financial arrangements, but such assets are not derecognised where the group retains the risks and rewards of ownership. Such assets are at risk to the extent that the group is unable to fulfil its obligations to counterparties. For a detailed discussion on collateral see note 49.
Sale and repurchase agreements and lending of securitiesSecurities sold subject to linked repurchase agreements are retained in the financial statements, as the group retains all risks and rewards of ownership of the securities. The securities are recorded as trading or investment securities and the counterparty liability is included in amounts owed to other depositors, deposits from other banks, or other money market deposits, as appropriate. Securities purchased under agreements to resell are recorded as loans and advances to other banks or clients, as appropriate. The difference between the sale and repurchase price is treated as interest and recognised over the duration of the agreements using the effective-interest method.
Securities lent to counterparties are also retained in the financial statements and any interest earned is recognised in profit or loss using the effective interest-rate method. Securities borrowed are not recognised in the financial statements, unless these are sold to third parties, in which case the purchase and sale are recorded with the gain or loss included in non-interest revenue. The obligation to return them is recorded at fair value as a trading liability.
Acceptances
Acceptances comprise undertakings by the group to pay bills of exchange drawn on clients. The group expects most acceptances to be settled simultaneously with the reimbursement from clients. Acceptances are recorded as liabilities within amounts owed to depositors, with the corresponding asset recorded in the statement of financial position within loans and advances.
Financial guarantee contractsFinancial guarantee contracts are contracts that require the issuer to make specified payments to reimburse the holder for a loss it incurs because a specified debtor fails to make payments when due in accordance with the terms of a debt instrument.
Issued financial guarantee contracts are recognised as insurance contracts and are measured at the best estimate of the expenditure required to settle any financial obligation as of the reporting date. Liability adequacy testing is performed to ensure that the carrying amount of the liability for issued financial guarantee contracts is sufficient. Any increase in the liability relating to guarantees is recognised in profit or loss.
1.6 TaxationTaxation expense, recognised in the statement of comprehensive income, comprises current and deferred taxation. Current or deferred taxation is recognised in profit or loss, except to the extent that it relates to items recognised directly in equity, in which case it too is recognised in equity and to the extent that it relates to items recognised in OCI, in which case it too is recognised in OCI.
Current taxationCurrent taxation is the expected tax payable on the taxable income for the year, using taxation rates enacted or substantively enacted at the reporting date, and any adjustment to taxation payable in respect of previous years (prior-period tax paid).
Deferred taxationDeferred taxation is recognised in respect of temporary differences between the carrying amounts of assets and liabilities for financial reporting purposes and the amounts used for taxation purposes. Temporary differences are differences between the carrying amounts of assets and liabilities for financial reporting purposes and their respective taxation bases. The amount of deferred taxation provided is based on the expected manner of realisation or settlement of the carrying amount of assets and liabilities, and is measured at the taxation rates (enacted or substantively enacted at the reporting date) that are expected to be applied to the temporary differences when they reverse.
Deferred taxation is recognised in profit or loss for the period, except to the extent that it relates to a transaction that is recognised directly in equity or in OCI, or a business combination that is accounted for as an acquisition. The effect on deferred taxation of any changes in taxation rates is recognised in profit or loss for the period, except to the extent that it relates to items previously charged or credited directly to equity.
Deferred taxation liabilities are generally recognised for all taxable temporary differences, and deferred taxation assets are generally recognised for all deductible temporary differences to the extent that it is probable that taxable profits will be available against which those deductible temporary differences can be utilised.
Deferred taxation is not recognised for the following temporary differences:
■ the initial recognition of goodwill; ■ the initial recognition of assets or liabilities in a transaction that is
not a business combination and that affects neither accounting nor taxable profit; and
■ differences relating to investments in subsidiaries and jointly controlled entities to the extent that they will not reverse in the foreseeable future.
Deferred taxation assets are recognised to the extent that it is probable that future taxable income will be available against which the unutilised taxation losses and deductible temporary differences can be used. Deferred taxation assets are reviewed at each reporting date and are reduced to the extent that it is no longer probable that the related taxation benefits will be realised.
Deferred taxation assets and liabilities are offset if there is a legally enforceable right to offset current taxation liabilities against current taxation assets, and they relate to income taxes levied by the same taxation authority on the same taxable entity, or on different taxation entities, but they intend to settle current tax liabilities and assets on a net basis or their taxation assets and liabilities will be realised simultaneously.
Deferred taxation assets and liabilities are not discounted.
1.7 Goodwill and intangible assetsGoodwill and goodwill impairmentGoodwill arises on the acquisition of subsidiaries, associates and joint arrangements. Goodwill is measured at cost less accumulated impairment losses. In respect of equity-accounted investments the carrying amount of goodwill is included in the carrying amount of the investment.
Goodwill is allocated to one or more cash-generating units (CGus), being the smallest identifiable group of assets that generates cash inflows that are largely independent of the cash inflows from other assets or groups of assets. Goodwill is allocated to the CGus in which the synergies from the business combinations are expected. Each CGu containing goodwill is annually tested for impairment. An impairment loss is recognised whenever the carrying amount of an asset or its CGu exceeds its recoverable amount. Impairment losses that are recognised in respect of CGus are allocated first to reduce the carrying amount of any goodwill allocated to a CGu and then to reduce the carrying amount of the other assets in the CGu on a pro rata basis. However, the carrying amount of these other assets may not be reduced below the highest of its fair value less costs to sell, its value in use and zero.
NOTES TO THE CONSOLIDATED FINANCIAL STATEMENTS (continued)for the year ended 31 December

NedbaNk Group
25
Consolidated and separate annual
finanCial statements
Impairment testing proceduresThe recoverable amount of a CGu is the higher of its fair value less cost to sell and its value in use. The fair value less cost to sell is determined by ascertaining the current market value of an asset (or the CGu) and deducting any costs related to the realisation of the asset.
In assessing value in use the expected future cashflows from the CGu are discounted to their present value using a discount rate that reflects current market assessments of the time value of money and the risks specific to the particular CGu.
Impairment losses relating to goodwill are not reversed and all impairment losses are recognised in capital and non-trading items for the period.
Computer software and capitalised development costsExpenditure on research activities, undertaken with the prospect of gaining new scientific or technical knowledge and understanding, and expenditure on internally generated goodwill and brands are recognised as an expense in profit or loss for the period.
If costs can be reliably measured and future economic benefits are available, expenditure on computer software and other development activities, whereby set procedures and processes are applied to a project for the production of new or substantially improved products and processes, is capitalised if the computer software and other developed products or processes are technically and commercially feasible and the group has intention and sufficient resources to complete development. The expenditure capitalised includes the cost of materials and directly attributable employee and other direct costs. Computer development expenditure is amortised only once the relevant software is available for use in the manner intended by management. Capitalised software is stated at cost less accumulated amortisation and impairment losses. Expenditure for the development of computers that are not yet available for use is not amortised and is stated at cost less impairment losses.
Amortisation of computer software and development costs is charged to profit or loss on a straight-line basis over the estimated useful lives of these assets, which do not exceed five years and are reviewed annually. Subsequent expenditure relating to computer software is capitalised only when it increases the future economic benefits embodied in the specific asset, in its current condition, to which it relates. All other subsequent expenditure is recognised as an expense in the period in which it is incurred. The profit or loss on the disposal of computer software is recognised in non-trading and capital items (in profit or loss). The profit or loss on disposal is the difference between the net proceeds received and the carrying amount of the asset.
The amortisation methods and residual values of these intangible assets are reviewed on an annual basis.
Contractual client relationshipsContractual client relationships, including the present value of in-force business in insurance businesses, acquired in a business combination are recognised at fair value at the date of acquisition. The contractual client relationships have a finite useful life and are carried at cost less accumulated amortisation. The useful lives of these client relationships are reviewed on an annual basis. Amortisation is calculated using the straight-line method over the expected life of the client relationship.
1.8 Employee benefitsThe group operates a number of defined-benefit and defined-contribution plans for eligible employees. The assets of these plans are generally held in separate trustee–administered funds. These benefits are accounted for in accordance with IAS 19.
Defined-benefit plansThe liability recognised in the statement of financial position in respect of defined-benefit pension plans is the present value of the defined-benefit obligation at the reporting date less the fair value of plan assets.
The defined-benefit obligation is calculated annually by independent actuaries using the projected unit credit method. The present value of the defined benefit obligation is determined by discounting the estimated
future cash outflows using yields for government bonds that have maturity dates approximating the terms of the group’s obligations.
Gains or losses resulting from remeasurements are recognised immediately in other comprehensive income. Remeasurements include actuarial gains and losses, return on plan assets and the asset ceiling.
Current service costs and net interest on the defined-benefit liability are recognised immediately as an expense in profit or loss. Past service costs are recognised in profit or loss on the earlier of the date of the plan amendment or curtailment, and the date the group recognises related restructuring costs.
Plan assets are only offset against plan liabilities where they are assets held by long-term employee benefit funds or qualifying insurance policies. qualifying insurance policies exclude any policies held by the group’s holding or subsidiary companies.
Defined-contribution plansContributions to defined-contribution plans are recognised as an expense in profit or loss in the periods during which services are rendered by employees.
Postemployment benefit plansThe group provides postretirement medical benefits and disability cover for eligible employees. The non-pension postemployment benefits are accounted for, in accordance with their nature, as either a defined-contribution plan or a defined-benefit plan. Similarly, the expected costs associated with such benefits are accounted for in a manner consistent with their classification.
Short-term employee benefitsShort-term employee benefits include salaries, accumulated leave payments, bonuses and non-monetary benefits such as medical aid contributions.
Short-term employee benefit obligations are measured on an undiscounted basis and are expensed as the related service is provided.
A liability is recognised for the amount to be paid under short-term cash bonus plans or accumulated leave if the group has a present, legal or constructive obligation to pay this amount as a result of past services provided by the employee and the obligation can be estimated reliably.
1.9 Property and equipmentItems of property and equipment are initially recognised at cost if it is probable that any future economic benefits associated with the items will flow to the group and they have a cost that can be measured reliably. Certain items of property and equipment that had been revalued to fair value on 1 January 2004, the date of transition to IFRS, are measured on the basis of deemed cost, being the revalued amount at the date of that revaluation.
Subsequent expenditure is capitalised to the carrying amount of items of property and equipment if it is measurable and it is probable that it increases the future economic benefits associated with the asset. All other expenses are recognised in profit or loss as an expense when incurred.
Subsequent to initial recognition, computer equipment, vehicles and furniture and other equipment are measured at cost less accumulated depreciation and accumulated impairment losses.
Land and buildings, the fair values of which can be reliably measured, are carried at revalued amounts, being the fair value at the date of revaluation less any subsequent accumulated depreciation and impairment losses. Revaluation increases are credited directly to equity in Other comprehensive income under the heading Revaluation reserve. However, revaluation increases are recognised in profit or loss to the extent that they reverse a revaluation decrease of the same asset previously recognised in profit or loss. Revaluation decreases are recognised in profit or loss. However, decreases are debited directly to equity to the extent of any credit balance existing in the revaluation surplus in respect of the same asset. Land and buildings are revalued on the same basis as investment properties.
This accounting policy should be read in conjunction with note 26.

26
DepreciationEach part of an item of property and equipment with a cost that is significant in relation to the total cost of the item is depreciated separately. Items of property and equipment that are classified as held for sale in terms of IFRS 5 Non-current Assets Held for Sale and Discontinued Operations are not depreciated. The depreciable amounts of property and equipment are recognised in profit or loss on a straight-line basis over the estimated useful lives of the items of property and equipment, unless they are included in the carrying amount of another asset. The useful lives, residual values and depreciation methods for property and equipment are assessed and adjusted (where required) on an annual basis.
On revaluation any accumulated depreciation at the date of the revaluation is eliminated against the gross carrying amount of the item concerned and the net amount restated to the revalued amount. Subsequent depreciation charges are adjusted based on the revalued amount and residual values.
Any difference between the depreciation charge on the revalued amount and that which would have been charged under historic cost is transferred net of any related deferred taxation between the revaluation reserve and retained earnings as the property is utilised. Land is not depreciated.
The maximum initial estimated useful lives are as follows:
Computer equipment 5 yearsMotor vehicles 6 yearsFixtures and furniture 10 yearsLeasehold property 20 yearsSignificant leasehold property components 10 yearsFreehold property 50 yearsSignificant freehold property components 5 years
DerecognitionItems of property and equipment are derecognised on disposal or when no future economic benefits are expected from their use or disposal. The gain or loss on derecognition is recognised in profit or loss and is determined as the difference between the net disposal proceeds, if any, and the carrying amount of the item. On derecognition any surplus in the revaluation reserve in respect of an individual item of property and equipment is transferred directly to retained earnings in the statement of changes in equity.
Compensation from third parties for items of property and equipment that were impaired, lost or given up is included in profit or loss when the compensation becomes receivable.
1.10 Investment propertiesInvestment properties comprise real estate held for earning rentals and/or for capital appreciation. This does not include real estate held for use in the supply of services or for administrative purposes. Investment properties are initially measured at cost plus any directly attributable expenses.
Investment properties are stated at fair value. Internal professional valuers perform valuations annually. For practical reasons valuations are carried out over a cyclical basis over a 12-month period due to the large number of investment properties involved. External valuations are obtained once every three years on a rotational basis. In the event of a material change in market conditions between the valuation date and reporting date an internal valuation is performed and adjustments made to reflect any material changes in value.
The valuation methodology applied is dependent on the nature of the property. Income-generating assets are valued using discounted cashflows. Vacant land, land holdings and residential flats are valued according to sales of comparable properties. Near-vacant properties are valued at land value less the estimated cost of demolition.
Surpluses and deficits arising from changes in fair value are recognised in profit or loss for the period in the statement of comprehensive income.
For properties reclassified during the year from property and equipment to investment properties any revaluation gain arising is initially recognised in profit or loss to the extent of previously charged impairment
losses. Any residual excess is taken to the revaluation reserve. Revaluation deficits are recognised in the revaluation reserve to the extent of previously recognised gains and any residual deficit is accounted for in profit or loss for the period.
Investment properties that are reclassified to owner-occupied property are revalued at the date of transfer, with any difference being taken to profit or loss.
This accounting policy should be read in conjunction with note 25.
1.11 Non-current assets held for sale and discontinued operations
Non-current assets (or disposal groups) are classified as held for sale when their carrying amount will be recovered principally through sale rather than use.
The asset or disposal group must be available for immediate sale in its present condition and the sale should be highly probable, with an active programme to find a buyer and the appropriate level of management approving the sale.
Immediately before classification as held for sale, all assets and liabilities are remeasured in accordance with the group’s accounting policies. Non-current assets (or disposal groups) held for sale are measured at the lower of the carrying amount and fair value less incremental directly attributable cost to sell (excluding taxation and finance charges) and are not depreciated.
Gains or losses recognised on initial classification as held for sale and subsequent remeasurement are recognised in profit or loss, regardless of whether the assets were previously measured at revalued amounts. The maximum gains that can be recognised are the cumulative impairment losses previously recognised in profit or loss. A disposal group continues to be consolidated while classified as held for sale. Income and expenses continue to be recognised in profit or loss.
Non-current assets (or disposal groups) are reclassified from held for sale to held for use if they no longer meet the held-for-sale criteria. On reclassification the non-current asset (or disposal group) is remeasured at the lower of its recoverable amount and the carrying amount that would have been recognised had the asset (or disposal group) never been classified as held for sale. Any gains or losses are recognised in profit or loss, unless the asset was carried at a revalued amount prior to classification as held for sale.
A discontinued operation is a clearly distinguishable component of the group’s business that has been disposed of or is held for sale, which:
■ represents a separate major line of business or geographical area of operations;
■ is part of a single coordinated plan to dispose of a major line of business or geographical area of operations; or
■ is a subsidiary acquired exclusively with a view to resale.
This accounting policy should be read in conjunction with note 23.
1.12 Impairment (all assets other than financial assets, deferred taxation assets and investment property)
The group assesses all assets (other than financial assets, deferred-taxation assets and investment property) for indications of impairment or the reversal of a previously recognised impairment at each reporting date. These impairments (where the carrying amount of an asset exceeds its recoverable amount) or the reversal of a previously recognised impairment is recognised in profit or loss for the period. Intangible assets not yet available for use are tested, at least of an annual basis, for impairment.
An impairment loss is recognised in profit or loss whenever the carrying amount of an asset exceeds its recoverable amount.
The recoverable amount of an asset is the higher of its fair value less cost to sell and its value in use. The fair value less cost to sell is determined by ascertaining the current market value of an asset and deducting any costs related to the realisation of the asset.
NOTES TO THE CONSOLIDATED FINANCIAL STATEMENTS (continued)for the year ended 31 December
NedbaNk Group
27
Consolidated and separate annual
finanCial statements
In assessing value in use the expected future pretax cashflows from the asset are discounted to their present value using a pretax discount rate that reflects current market assessments of the time value of money and the risks specific to the asset. For an asset the cashflows of which are largely dependent on those of other assets the recoverable amount is determined for the CGu to which the asset belongs.
A previously recognised impairment loss will be reversed if the recoverable amount increases as a result of a change in the estimates used previously to determine the recoverable amount, but not to an amount higher than the carrying amount that would have been determined, net of depreciation or amortisation, had no impairment loss been recognised in prior periods.
1.13 Other provisionsProvisions are recognised when the group has a present legal or constructive obligation as a result of a past event, in respect of which it is probable that an outflow of economic benefits will occur and a reliable estimate can be made of the amount of the obligation. The amount recognised as a provision is the reasonable estimate of the expenditure required to settle the obligation at the reporting date. Where the effect of discounting is material, the provision is discounted. The discount rate reflects current market assessments of the time value of money and, where appropriate, the risks specific to the liability. Gains from the expected disposal of assets are not taken into account in measuring provisions. Provisions are reviewed at each reporting date and adjusted to reflect the current reasonable estimate. If it is no longer probable that an outflow of resources will be required to settle the obligation, the provision is reversed.
ReimbursementsWhere some or all of the expenditure required to settle a provision is expected to be reimbursed by a party outside the group, the reimbursement is recognised when it is virtually certain that it will be received if the group settles the obligation. The reimbursement is recorded as a separate asset at an amount not exceeding the related provision. The expense for the provision is presented net of the reimbursement in profit or loss. Specific policies include:
■ Onerous contractsA provision for onerous contracts is recognised when the expected benefits to be derived by the group from a contract are lower than the unavoidable cost of meeting the obligations under the contract.
■ RestructuringA provision for restructuring is recognised when the group has a detailed formal plan for restructuring and has raised a valid expectation, among those parties directly affected, that the plan will be carried out, either by having begun implementation or by publicly announcing the plan’s main features. Restructuring provisions include only those costs that arise directly from restructuring that is not associated with the ongoing activities of the group.
Future operating costs or losses are not provided for.
1.14 Share-based paymentsEquity-settled share-based payment transactions with employeesThe services received in an equity-settled share-based payment transaction with employees are measured at the fair value of the equity instruments granted. The fair value of the equity instruments is measured at the grant date and is not subsequently remeasured.
If the equity instruments granted vest immediately and an employee is not required to complete a specified period of service before becoming unconditionally entitled to the instruments, the services received are recognised in profit or loss for the period in full on the grant date with a corresponding increase in equity.
Where the equity instruments do not vest until the employee has completed a specified period of service, it is assumed that the services rendered by the employee, as consideration for the equity instruments, will be received in the future during the vesting period. The services are accounted for in profit or loss in the statement of comprehensive income as they are rendered during the vesting period, with a corresponding
increase in equity. The amount recognised as an expense is adjusted to reflect the number of share awards for which the related service and non-market performance vesting conditions are expected to be met such that the amount ultimately recognised as an expense is based on the number of share awards that do meet the related service and non-market performance conditions at the vesting date. Where the equity instruments are no longer outstanding, the accumulated share-based payment reserve in respect of those equity instruments is transferred to retained earnings.
Cash-settled share-based payment transactions with employeesThe cost of cash-settled transactions is measured initially at fair value at the grant date. The fair value is expensed over the period until the vesting date with recognition of a corresponding liability. The liability is remeasured to fair value at each reporting date up to and including the settlement date with changes in fair value recognised in the statements of comprehensive income as staff costs.
Measurement of fair value of equity instruments grantedThe equity instruments granted by the group are measured at fair value at the measurement date using standard option pricing valuation models. The valuation technique is consistent with generally acceptable valuation methodologies for pricing financial instruments and incorporates all factors and assumptions that knowledgeable, willing market participants would consider in setting the price of the equity instruments. Vesting conditions, other than market conditions, are not taken into account in determining fair value. Vesting conditions are taken into account by adjusting the number of equity instruments included in the measurement of the transaction amount.
Share-based payment transactions with persons or entities other than employeesTransactions in which equity instruments are issued to historically disadvantaged individuals and organisations in SA for less than fair value are accounted for as share-based payments. Where the group has issued such instruments and expects to receive services in return for equity instruments, the share-based payments charge is spread over the related vesting (ie service) period. In instances where such services could not be identified the cost has been expensed with immediate effect. The valuation techniques are consistent with those mentioned above.
1.15 Share capitalOrdinary share capital, preference share capital or any financial instrument issued by the group is classified as equity when:
■ payment of cash, in the form of a dividend or redemption, is at the discretion of the group;
■ the instrument does not provide for the exchange of financial instruments under conditions that are potentially unfavourable to the group;
■ settlement in the group’s own equity instruments is for a fixed number of equity instruments at a fixed price; and
■ the instrument represents a residual interest in the assets of the group after deducting all its liabilities.
Consideration paid or received for equity instruments is recognised directly in equity. Equity instruments are initially measured at the proceeds received, less incremental directly attributable issue costs, net of any related income tax benefits. No gain or loss is recognised in profit or loss on the purchase, sale, issue or cancellation of the group’s equity instruments.
When the group issues a compound instrument, ie an instrument that contains a liability and an equity component, the fair value of the liability component is calculated first and the equity component is treated as a residual. Transaction costs that relate to the issue of a compound financial instrument are allocated to the liability and equity components of the instrument in proportion to the allocation of proceeds.
Distributions to holders of equity instruments are recognised as distributions in the statement of changes in equity in the period in which they are payable. Dividends for the year that are declared after the reporting date are disclosed in the notes to the financial statements.

28
1.16 Treasury sharesWhen the group acquires its own share capital, the amount of the consideration paid, including directly attributable costs, net of any related tax benefit, is recognised as a change in equity. Shares repurchased by the issuing entity are cancelled. Shares repurchased by group entities are classified as treasury shares and are held at cost. These shares are treated as a deduction from the issued and weighted average number of shares and the cost price of the shares is presented as a deduction from total equity. The par value of the shares is presented as a deduction from ordinary share capital and the remainder of the cost is presented as a deduction from ordinary share premium. Dividends received on treasury shares are eliminated on consolidation.
1.17 Investment contractsInvestment contract liabilitiesLiabilities for unit-linked and market-linked contracts are reported at fair value. For unit-linked contracts the fair value is calculated as the account value of the units, ie the number of units held multiplied by the bid-price value of the assets in the underlying fund (adjusted for taxation). For market-linked contracts the fair value of the liability is determined with reference to the fair value of the underlying assets. This fair value is calculated in accordance with the financial soundness valuation basis, except that negative rand reserves arising from the capitalisation of future margins are not permitted. The fair value of the liability, at a minimum, reflects the initial deposit of the client, which is repayable on demand.
Investment contract liabilities (other than unit-linked and market-linked contracts) are measured at amortised cost.
Embedded derivatives included in investment contracts are separated out and measured at fair value. The host contract liability is measured on an amortised-cost basis.
Revenue on investment management contractsFees charged for investment management services in conjunction with investment management contracts are recognised as revenue as the services are provided. Initial fees that exceed the level of recurring fees and relate to the future provision of services are deferred and amortised over the projected period over which services will be provided.
Contribution income relating to investment contractsContribution income includes lump sums received in respect of linked businesses with retirement funds and are accounted for when due. The contribution income is set off directly against the liability under investment contracts.
Benefits relating to investment contractsPolicyholder benefits are accounted for when claims are intimated directly against the liability under investment contracts.
1.18 Insurance contractsContracts under which the scheme accepts insurance risk from another party by agreeing to compensate such party or other beneficiaries if a specified uncertain future event adversely affects the party or other beneficiaries are classified as insurance contracts.
Policy liabilitiesThe policy liabilities under unmatured policies, including unintimated claims, are computed at the reporting date by PC Falconer, the statutory actuary, according to the financial soundness valuation method as set out in the guidelines issued by the Actuarial Society of SA in Professional Guidance Note (PGN) 104. Claims intimated but not paid are provided for. The actuarial statement of financial position is included as a separate item in the group’s annual financial statements. The group performs a liability adequacy test on its liabilities in line with IFRS 4 Insurance Contracts.
Linked productsLinked products are investment-related products where the risk and reward of the underlying investment portfolio accrues to the policyholder. Linked products, which provide for returns based on the change in the value of the underlying instruments and market indicators, are initially
recorded at cost. These products are revalued at year-end using discounted-cashflow analysis, closing market values and index values based on the observation dates stated in the underlying investment agreements. Valuations are adjusted for the effects of changes in foreign exchange rates. Actuarial liabilities of these linked products are stated at the same value as the underlying investments.
1.19 LeasesThe group as lesseeLeases in respect of which the group bears substantially all risks and rewards incidental to ownership are classified as finance leases. Finance leases are capitalised at the inception of the lease at the lower of the fair value of the lease property and the present value of the minimum lease payments. Directly attributable costs, such as commission paid, incurred by the group are added to the carrying amount of the asset. Each lease payment is allocated between the liability and finance charges to achieve a constant periodic rate of interest on the balance outstanding. Contingent rentals are expensed in the period they are incurred. The depreciation policy for leased assets is consistent with that of depreciable assets owned. If the group does not have reasonable certainty that it will obtain ownership of the leased asset by the end of the lease term, the asset is depreciated over the shorter of the lease term and its useful life.
Leases that are not classified as finance leases are classified as operating leases. Payments made under operating leases, net of any incentives received from the lessor, are recognised in profit or loss on a straight line basis over the term of the lease. When another systematic basis is more representative of the time pattern of the user’s benefit, then that method is used.
The group as lessorWhere assets are leased out under a finance lease arrangement, the present value of the lease payments is recognised as a receivable and included under loans and advances in the statement of financial position. Initial direct costs are included in the initial measurement of the receivable. The difference between the gross receivable and unearned finance income is recognised under loans and advances in the statement of financial position. Finance lease income is allocated to accounting periods to reflect a constant periodic rate of return on the group’s net investment outstanding in respect of the leases.
Assets leased out under operating leases are included under property and equipment in the statement of financial position. Initial direct costs incurred in negotiating and arranging the lease are added to the carrying amount of the leased asset and recognised as an expense over the lease term on the same basis as the rental income. Leased assets are depreciated over their expected useful lives on a basis consistent with similar assets. Rental income, net of any incentives given to lessees, is recognised on a straight-line basis over the term of the lease. When another systematic basis is more representative of the time pattern of the user’s benefit, then that method is used.
Recognition of lease of landLeases of land and buildings are classified as operating or finance leases in the same way as leases of other assets.
However, when a single lease covers both land and a building, the minimum lease payments at the inception of the lease (including any upfront payments) are allocated between the land and the building in proportion to the relative fair values of the respective leasehold interests. Any upfront premium allocated to the land element that is normally classified as an operating lease represents prepaid lease payments. These payments are amortised over the lease term in accordance with the time pattern of benefits provided. If the lease payments cannot be allocated reliably between these two elements, the entire lease is classified as a finance lease, unless it is clear that both elements are operating leases.
1.20 Borrowing costsBorrowing costs directly attributable to the acquisition, construction and production of qualifying assets are capitalised as part of the costs of these assets. qualifying assets are assets that necessarily take a substantial period of time to prepare for their intended use or sale.
NOTES TO THE CONSOLIDATED FINANCIAL STATEMENTS (continued)for the year ended 31 December

NedbaNk Group
29
Consolidated and separate annual
finanCial statements
Capitalisation of borrowing costs continues up to the date when the assets are substantially ready for their use or sale.
All other borrowing costs are expensed in the period in which they are incurred.
Borrowing costs capitalised are disclosed in the notes by asset category and are calculated at the group’s average funding cost, except to the extent that funds are borrowed specifically for the purpose of obtaining a qualifying asset. Where this occurs, actual borrowing costs incurred, less any investment income on the temporary investment of those borrowings, are capitalised.
1.21 Government grantsGovernment grants are recognised when there is reasonable assurance that they will be received and that the group will comply with the conditions attached to them. Grants that compensate the group for expenses or losses already incurred or for purposes of giving immediate financial support to the entity with no future-related costs are recognised as income in the period it becomes receivable. Grants that compensate the group for expenses to be incurred are recognised as revenue in profit or loss on a systematic basis in the same periods in which the expenses will be incurred. Grants that compensate the group for the cost of an asset are recognised in profit or loss as revenue on a systematic basis over the useful life of the asset.
1.22 Client loyaltyWhen a cardholder makes a purchase that is regarded as eligible spend, the person/company will be granted points that can be redeemed at a later date for goods or services. Points do not expire, unless a client is delinquent or dormant, in which case the points accrued are forfeited as stated in the terms and conditions.
The fair value of the consideration received or receivable in respect of the initial sale is allocated between the award credits and the other components of the sale. The award credits are recognised as deferred revenue until the entity fulfils its obligations to deliver awards to customers.
The consideration allocated to the award credits will be measured by reference to the fair value thereof, ie the amount for which the award credits could be sold separately and the expected manner by which the points will be utilised. Adjustments are made for the expected utilisation and non-utilisation of the points awarded.
1.23 Revenue and expenditureInterest income and expenseInterest income and expense are recognised in profit or loss using the effective-interest method taking into account the expected timing and amount of cashflows. The effective-interest method is a method of calculating the amortised cost of a financial asset or financial liability (or group of financial assets or financial liabilities) and of allocating the interest income or interest expense over the relevant period. Interest income and expense include the amortisation of any discount or premium or other differences between the initial carrying amount of an interest-bearing financial instrument and its amount at maturity calculated on an effective-interest-rate basis.
Non-interest revenue ■ Fees and commissions
The group earns fees and commissions from a range of services it provides to clients and these are accounted for as follows:
� Income earned on the execution of a significant act is recognised when the significant act has been performed.
� Income earned from the provision of services is recognised as the service is rendered by reference to the stage of completion of the service.
� Income that forms an integral part of the effective interest rate of a financial instrument is recognised as an adjustment to the effective interest rate and recorded in interest income.
■ Dividend incomeDividend income is recognised when the right to receive payment is established on the ex dividend date for equity instruments and is included in dividend income under non-interest revenue.
■ Net trading incomeNet trading income comprises all gains and losses from changes in the fair value of financial assets and financial liabilities held for trading, together with the related interest, expense, costs and dividends. Interest earned while holding trading securities and interest incurred on trading liabilities are reported within non-interest revenue.
■ Income from investment contractsRefer to 1.17 for non-interest revenue arising on investment management contracts.
■ OtherExchange and securities trading income, from investments and net gains on the sale of investment banking assets, is recognised in profit or loss when the amount of revenue from the transaction or service can be measured reliably, it is probable that the economic benefits of the transaction or service will flow to the group and the costs associated with the transaction or service can be measured reliably.
Fair-value gains or losses on financial instruments at fair value through profit or loss, including derivatives, are included in non-interest revenue. These fair-value gains or losses are determined after deducting the interest component, which is recognised separately in interest income and expense.
Gains or losses on derecognition of any financial assets or financial liabilities are included in non-interest revenue.
1.24 Segmental reportingAn operating segment is a component of an entity that engages in business activities from which it may earn revenues, the operating results of which components are regularly reviewed by the group's chief operating decisionmakers to make decisions about resources to be allocated and to assess its performance, and for which financial information is available.
The group’s identification of its segments and the measurement of segment results are based on the group’s internal reporting to management. The segments have been identified according to the nature of their respective products and services and their related target markets, the detail of which can be found in the segmental reporting section.
The segments identified are complemented by the Centre, which provides support in the areas of finance, human resources, governance and compliance, risk management and information technology. Additional information relating to major clients and other performance measures is provided.
The group accounts for intersegment revenues and transfers as if the transactions were with third parties at current market prices.
1.25 Cash and cash equivalentsCash and cash equivalents comprise balances with a maturity of less than 90 days from the date of acquisition, including cash and balances with central banks that are not mandatory, other eligible bills and amounts due from other banks.

30
2 STANDARDS AND INTERPRETATIONS
2.1 Standards and interpretations issued and not yet effective
IFRS 9 Financial InstrumentsIFRS 9 Financial Instruments was issued in its entirety in July 2014. The final version of this standard incorporates amendments to the classification and measurement guidance as well as the accounting requirements for the impairment of financial assets measured at amortised cost. These elements of the final standard are discussed in detail below:
■ Financial assets are to be classified and measured based on the business model for managing the financial asset and the cashflow characteristics of the financial asset. There are two measurement approaches, namely fair value and amortised cost. The financial asset is carried at amortised cost if it is the business model of the entity to hold that asset for the purpose of collecting contractual cashflows and if those cashflows comprise principal repayments and interest.
■ For financial liabilities designated as at fair value through profit or loss, a further requirement is that all changes in the fair value of financial liabilities attributable to credit risk be transferred to other comprehensive income with no recycling through profit or loss on disposal.
■ Impairments in terms of IFRS 9 will be determined based on an expected-loss model that considers the significant changes to the asset's credit risk and the expected loss that will arise in the event of default.
■ IFRS 9 allows financial liabilities not held for trading to be measured at either amortised cost or fair value. If fair value is elected, then changes in the fair value as a result of changes in own credit risk should be recognised in other comprehensive income.
■ The hedge accounting requirements under IFRS 9 are closely aligned with how entities undertake risk management activities when hedging financial and non-financial risk exposures. Hedge effectiveness will now be proved based on management's risk management objectives rather than the 80% to 125% band that was previously stipulated. IFRS 9 also allows for rebalancing of the hedge and the deferral of hedging costs.
The group has initiated a process to determine the impact of the standard on the group's statement of financial position and performance. until the process has been completed the group is unable to quantify the expected impact.
The standard is effective for financial years commencing on or after 1 January 2018.
IFRS 15 Revenue from Contracts with CustomersIFRS 15 establishes a five-step model that will apply to revenue earned from a contract with a client (with limited exceptions), regardless of the type of revenue transaction or the industry.
The standard's requirements will also apply to the recognition and measurement of gains and losses on the sale of some non-financial assets that are not outputs of the entity's ordinary activities (eg the sale of property, plant and equipment or intangibles).
Extensive disclosures will be required, including disaggregation of total revenue, information about performance obligations, changes in contract asset and liability account balances between periods, and key judgements and estimates.
The standard is effective for financial years commencing on or after 1 January 2017.
The group has initiated a process to determine the impact of the standard on the group's statement of financial position and performance. until the process has been completed the group is unable to quantify the expected impact.
Amendment to IAS 19 Employee Benefits: Defined Benefit Plans – Employee ContributionsThe amendment applies to contributions from employees or third parties and simplifies the accounting for contributions that are independent of the number of years of employee service, for example, employee contributions that are calculated according to a fixed percentage of salary.
The amendment is effective for the group for the financial year commencing 1 January 2015. The group is evaluating the impact of this standard on the group financial statements.
Amendments to IAS 16 Property, Plant and Equipment and IAS 38 Intangible AssetsThe amendments to IAS 16 and IAS 38 are to clarify the basis for the calculation of depreciation and amortisation as being the expected pattern of consumption of the future economic benefits of an asset.
The amendments prohibit the use of revenue-based depreciation for property, plant and equipment and significantly limit the use of revenue-based amortisation for intangible assets. As a result the ratio of revenue generated to total revenue expected to be generated cannot be used to depreciate property, plant and equipment and may only be used in very limited circumstances to amortise intangible assets.
The amendments are effective for the group for the financial year commencing 1 January 2016 and are not expected to have an effect on the group's financial statements.
Amendment to IFRS 11 Joint Arrangements on Acquisition of an Interest in a Joint OperationThis amendment adds new guidance on how to account for the acquisition of an interest in a joint operation that constitutes a business. The amendment specifies the appropriate accounting treatment for such acquisitions.
The amendment is effective for the group for the financial year commencing 1 January 2016 and is not expected to have an effect on the group's financial statements.
Amendments to IAS 16 Property, Plant and Equipment and IAS 41 Agriculture – Regarding Bearer PlantsThese amendments change the financial reporting for bearer plants, such as grape vines, rubber trees and oil palms. The International Accounting Standards Board (IASB) decided that bearer plants should be accounted for in the same way as property, plant and equipment because their operation is similar to that of manufacturing. Consequently, the amendments include bearer plants in the scope of IAS 16, instead of IAS 41. The produce growing on bearer plants will remain within the scope of IAS 41.
The amendments are effective for the group for the financial year commencing 1 January 2016 and are not expected to have an effect on the group's financial statements.
IFRS 14 Regulatory Deferral AccountsThe standard IFRS 14 Regulatory Deferral Accounts permits first-time adopters to continue to recognise amounts related to rate regulation in accordance with their previous Generally Accepted Accounting Practices (GAAP) requirements when they adopt IFRS. However, to enhance comparability with entities that already apply IFRS and do not recognise such amounts, the standard requires that the effect of rate regulation must be presented separately from other items.
The standard is effective for the group for the financial year commencing 1 January 2016 and is not expected to have an effect on the group's financial statements.
Amendments to IAS 27 Separate Financial Statements on the equity methodThese amendments allow entities to use the equity method to account for investments in subsidiaries, joint ventures and associates in their separate financial statements.
NOTES TO THE CONSOLIDATED FINANCIAL STATEMENTS (continued)for the year ended 31 December

NedbaNk Group
31
Consolidated and separate annual
finanCial statements
The amendments are effective for the group for the financial year commencing 1 January 2016 and are not expected to have a significant effect on the group's financial statements.
Amendments to IFRS 10 Consolidated Financial Statements and IAS 28 Investments in Associates and Joint VenturesThese amendments address an inconsistency between the requirements in IFRS 10 and those in IAS 28 for dealing with the sale or contribution of assets between an investor and its associate or joint venture. The main consequence of the amendments is that a full gain or loss is recognised when a transaction involves a business (whether it is housed in a subsidiary or not). A partial gain or loss is recognised when a transaction involves assets that do not constitute a business, even if these assets are housed in a subsidiary.
The amendments are effective for the group for the financial year commencing 1 January 2016 and are not expected to have an effect on the group's financial statements.
IASB Annual Improvement ProjectThe IASB issued annual improvements to IFRS cycles 2010 to 2012 and 2011 to 2013, and for 2014.
The improvements focus on areas of inconsistency in IFRS or where clarification of wording is required. As a consequence, the improvements are either clarifying or correcting in nature, and do not propose new principles or changes to existing ones.
The amendments are effective for the group for the financial year commencing 1 January 2015 and are not expected to have a material impact on the group's financial statements.
2.2 Standards and interpretations adopted in the current year
The following standards and interpretations, or amendments thereto, effective for the financial year-end commencing 1 January 2014, have been adopted by the group:
IFRIC 21 LeviesInternational Financial Reporting Interpreting Committee (IFRIC) 21 is an interpretation of IAS 37 Provisions, Contingent Liabilities and Contingent Assets and considers how an entity should account for liabilities to pay levies imposed by governments, other than income taxes, in its financial statements.IFRIC 21 clarifies that the obligating event that gives rise to a liability to pay a levy is the activity described in the relevant legislation that triggers the payment of the levy.
The amendment did not have a material effect on the group's financial statements.
Revised standardsAmendments to IFRS 10, IFRS 12 and IAS 27 – Investment EntitiesThe amendments define an investment entity and introduce an exception to consolidating particular subsidiaries for that investment entity. These amendments require an investment entity to measure those subsidiaries at fair value through profit or loss in accordance with IFRS 9 Financial Instruments or IAS 39 Financial Instruments: Recognition and Measurement in its consolidated and separate financial statements.
The amendments also introduce new disclosure requirements for investment entities in IFRS 12 Disclosure of Interests in Other Entities and IAS 27 Separate Financial Statements.
The amendments did not have an effect on the group's financial statements.
Amendment to IAS 32 Financial Instruments: Presentation – Offsetting Financial Assets and Financial LiabilitiesThe amendment to IAS 32 clarifies offsetting by explaining:
■ when an entity currently has a legally enforceable right of setoff; and ■ when gross settlement is equivalent to net settlement.
The adoption of the amendment did not have an impact on the group's financial statements.
Amendment to IAS 36 Impairment of Assets Recoverable Amounts Disclosures for Non-financial AssetsThe amendment removes certain disclosures required in respect of the recoverable amount of declined-value cash-generating units, which had previously been included in IAS 36 by the issue of IFRS 13 Fair Value Measurement.
The amendment did not have a material effect on the group's financial statements.
Amendment to IAS 39 Financial Instruments: Recognition and MeasurementThe IASB made a narrow-scope amendment to IAS 39 to permit the continuation of hedge accounting in certain circumstances in which the counterparty to a hedging instrument changes in order to achieve clearing for that instrument. The amendment covers novations in the following circumstances:
■ As a consequence of laws or regulations, or the introduction of laws or regulations.
■ Where the parties to the hedging instrument agree that one or more clearing counterparties replace their original counterparty to become the new counterparty to each of the parties.
■ Where it did not result in changes to the terms of the original derivative other than changes directly attributable to the change in counterparty to achieve clearing.
All of the above criteria must be met to continue hedge accounting under this exception.
The amendment did not have an effect on the group's financial statements.
3 KEY ASSuMPTIONS CONCERNING THE FuTuRE AND KEY SOuRCES OF ESTIMATION
The group’s accounting policies are set out in note 1 of the annual financial statements. Certain of these policies, as well as estimates made by management, are considered to be important to an understanding of the group’s financial condition since they require management to make difficult, complex or subjective judgements and estimates, some of which may relate to matters that are inherently uncertain. The following accounting policies include estimates that are particularly sensitive in terms of judgements and the extent to which estimates are used. Other accounting policies involve significant amounts of judgements and estimates, but the total amounts involved are not significant to the financial statements. Management has agreed the accounting policies and critical accounting estimates with the board and Nedbank Group Audit Committee.
3.1 Allowances for loan impairment and other credit risk provisions
Allowances for loan impairment represent management’s estimate of the losses incurred in the loan portfolios at the reporting date.
The group assesses its loan portfolios for impairment at each reporting date. In determining whether an impairment loss should be recorded in the statement of comprehensive income, the group makes judgements as to whether there is observable data indicating a measurable decrease in the estimated future cashflows from a portfolio of loans before the decrease can be allocated to an individual loan in that portfolio. Estimates are made of the duration between the occurrence of a loss event and the identification of a loss on an individual basis. The impairment for performing loans is calculated on a portfolio basis, based on historical loss ratios, adjusted for national and industry-specific economic conditions and other indicators present at the reporting date that correlate with defaults on the portfolio. These include early arrears and other indicators of potential default, such as changes in macroeconomic conditions and legislation affecting credit recovery. These annual loss ratios are applied to loan balances in the portfolio and scaled to the estimated loss emergence period.
32
Within the Nedbank Retail, Nedbank Wealth and Nedbank Business Banking portfolios, which comprise large numbers of small homogeneous assets with similar risk characteristics where credit-scoring techniques are generally used, statistical techniques are used to calculate impairment allowances on the portfolio, based on historical recovery rates and assumed emergence periods. These statistical analyses use as primary inputs the extent to which accounts in the portfolio are in arrears and historical information on the eventual losses encountered from such delinquent portfolios. There are many such models in use, each tailored to a product, line of business or client category.
Judgement and knowledge are needed in selecting the statistical methods to be used when the models are developed or revised. The impairment allowance reflected in the financial statements for these portfolios is therefore considered to be reasonable and supportable.
For larger exposures impairment allowances are calculated on an individual basis and all relevant considerations that have a bearing on the expected future cashflows are taken into account, for example the business prospects for the client, the realisable value of collateral, the group’s position relative to other claimants, the reliability of client information and the likely cost and duration of the workout process. The level of the impairment allowance is the difference between the value of the discounted expected future cashflows (discounted at the loan’s original effective interest rate) and its carrying amount. Subjective judgements are made in the calculation of future cashflows. Furthermore, judgements change with time as new information becomes available or as workout strategies evolve, resulting in frequent revisions to the impairment allowance as individual decisions are taken. Changes in these estimates would result in a change in the allowances and have a direct impact on the impairments charge.
3.2 Fair value of financial instrumentsCertain of the group’s financial instruments are carried at fair value through profit or loss, such as those held for trading, designated by management under the fair-value option and non-cashflow hedging derivatives.
Other non-derivative financial assets may be designated as available for sale. Available-for-sale financial investments are initially recognised at fair value and are subsequently held at fair value. Gains and losses arising from changes in fair value of such assets are included as a separate component of other comprehensive income and presented in equity.
The fair value of a financial instrument is the amount that would be received to sell the asset or paid to transfer the liability in an orderly transaction at the measurement date between knowledgeable, willing parties, other than in a forced or liquidation sale. Financial instruments entered into as trading transactions, together with any associated hedging, are measured at fair value and the resultant profits and losses are included in net trading income, along with interest and dividends arising from long and short positions and funding costs relating to trading activities. Assets and liabilities resulting from gains and losses on financial instruments held for trading are reported gross in trading portfolio assets and liabilities or derivative financial instruments, reduced by the effects of netting agreements where there is an intention to settle net with counterparties.
Details of the processes, procedures and assumptions used in the determination of fair value are discussed in note 37.1 to the financial statements. In particular, the areas that involve the greatest amount of judgement and complexity include the following:
■ assessing whether instruments are trading with sufficient frequency and volume, that they can be considered liquid;
■ the inclusion of a measure of the counterparties, non-performance risk in the fair-value measurement of loans and advances, which involves the modelling of dynamic credit spreads;
■ the inclusion of credit valuation adjustment (CVA) and debit valuation adjustment (DVA) in the fair-value measurement of derivative instruments, with particular emphasis on DVA; and
■ the inclusion of own credit risk in the calculation of the fair value of financial liabilities.
These concepts are continuously developing and evolving within the context of the SA market and therefore changes in these assumptions will arise as the market develops.
3.3 Derecognition, securitisations and structured entities
The group enters into transactions that may result in the derecognition of certain financial instruments. Judgement is applied as to whether these financial instruments are derecognised from the group’s statement of financial position.
The group sponsors the formation of structured entities primarily for the purpose of allowing clients to hold investments, for asset securitisation transactions, for asset financing and for buying or selling credit protection. The group consolidates structured entities it controls in terms of IFRS guidance. Where it is difficult to determine whether the group controls a structured entity, the group makes judgements, in terms of IFRS guidance, about its exposure to the risks and rewards, as well as about its ability to make operational decisions for the structured entity in question. In arriving at judgements, these factors are considered both jointly and separately. Further information in respect of those securitisations, consolidated into the group financial statements, can be found in note 45 to the financial statements.
3.4 GoodwillManagement considers at least annually whether the current carrying value of goodwill is to be impaired. The first step of the impairment- review process requires the identification of independent CGus by segmenting the group business into as many largely independent income streams as is reasonably practicable. The goodwill is then allocated to these independent units. The first element of this allocation is based on the areas of the business expected to benefit from the synergies derived from the acquisition. The second element reflects the allocation of the net assets acquired and the difference between the consideration paid for those net assets and their fair value. This allocation is reviewed following business reorganisation. The carrying value of the unit, including the allocated goodwill, is compared with its fair value or value in use to determine whether any impairment exists. If the recoverable amount of a unit is less than its carrying value, goodwill will be impaired.
Detailed calculations may need to be carried out, taking into consideration changes in the market in which a business operates (eg competitive activity and regulatory change). In the absence of readily available market-price data this calculation is based on discounting expected pretax cashflows at a risk-adjusted interest rate appropriate to the operating unit, the determination of both of which requires the exercise of judgement. The estimation of pretax cashflows is sensitive to the periods for which detailed forecasts are available and to assumptions regarding the long-term sustainable cashflows. While forecasts are compared with actual performance and external economic data, expected cashflows naturally reflect management’s view of future performance.
The most significant amount of goodwill relates to Nedbank Limited. The goodwill impairment testing performed in 2014 indicated that none of the goodwill was impaired in the year under review. Management believes that reasonable changes in key assumptions used to determine the recoverable amount of Nedbank Limited’s goodwill would not result in impairment.
Further information in respect of goodwill recognised in the statement of financial position can be found in note 28 to the financial statements.
3.5 Intangible assetsAn internally generated intangible asset, specifically internally developed software generated during the development phase, is recognised as an asset if certain conditions are met. These conditions include technical feasibility, intention to complete the development, ability to use the asset under development and demonstration of how the asset will generate probable future economic benefits.
The cost of a recognised internally generated intangible asset comprises all costs directly attributable to making the asset capable of being used
NOTES TO THE CONSOLIDATED FINANCIAL STATEMENTS (continued)for the year ended 31 December

NedbaNk Group
33
Consolidated and separate annual
finanCial statements
as intended by management. Conversely, all expenditures arising during the research phase are expensed as incurred.
The decision to recognise internally generated intangible assets requires significant judgement, particularly in the following areas:
■ evaluation of whether or not activities should be considered research activities or development activities;
■ assumptions about future market conditions, client demand and other developments;
■ assessment of whether completing an asset is technically feasible. The term ‘technical feasibility’ is not defined in the accounting standards, and therefore requires a group-specific and necessarily judgemental approach;
■ evaluation of the future ability to use or sell the intangible asset arising from the development and the assessment of probability of future benefits from sale or use; and
■ evaluation of whether or not a cost is directly or indirectly attributable to an intangible asset and whether or not a cost is necessary for completing a development.
All intangible assets of the group have finite useful lives. Consequently, the depreciable amount of the intangible assets is allocated on a systematic basis over their useful lives. Judgement is applied to the following:
■ Determining the useful life of an intangible asset, based on estimates regarding the period over which the intangible asset is expected to produce economic benefits to the group.
■ Determining the appropriate amortisation method. Accounting standards require that the straight-line method be used, unless management can reliably determine the pattern in which the future economic benefits of the asset are expected to be consumed by the group.
Both the amortisation period and the amortisation method have an impact on the amortisation expenses recorded in each period.
In making impairment assessments for the group’s intangible assets, management uses certain complex assumptions and estimates about future cashflows, which require significant judgement and assumptions about future developments. These assumptions are affected by various factors, including changes in the group’s business strategy, internal forecasts and estimation of the group’s weighted-average cost of capital. Due to these factors, actual cashflows and values could vary significantly from the forecast future cashflows and related values derived using the discounted-cashflow method.
Further information in respect of intangible assets recognised in the statement of financial position can be found in note 28.
3.6 Employee benefitsThe group provides pension plans for employees in most parts of the world. Arrangements for staff retirement benefits vary from country to country and are made in accordance with local regulations and custom.
For defined-benefit schemes, including postretirement medical aid schemes, actuarial valuation of each of the scheme’s obligations using the projected-unit credit method and the fair valuation of each of the scheme’s assets are performed annually in accordance with the requirements of IAS 19.
The actuarial valuation is dependent on a series of assumptions, the key ones being interest rates, mortality, investment returns and inflation. Mortality estimates are based on standard industry and national mortality tables, adjusted where appropriate to reflect the group’s own experience. The returns on fixed-interest investments are set to market yields at the valuation date (less an allowance for risk) to ensure consistency with the asset valuation. The returns on equities are based on the long-term outlook for global equities at the calculation date, having regard to current market yields and dividend growth expectations.
The inflation assumption reflects long-term expectations of both earnings and retail price inflation. Further information on employee benefit obligations, including assumptions, is set out in note 27 to the annual financial statements.
3.7 Income taxesThe group is subject to direct taxation in a number of jurisdictions in which it operates. There may be transactions and calculations for which the ultimate tax determination has an element of uncertainty during the ordinary course of business. The group recognises liabilities based on objective estimates of the quantum of taxes that may be due. Where the final tax determination is different from the amounts that were initially recorded, such differences will impact the income tax and deferred taxation provisions in the period in which such determination is made through profit and loss for that period.
3.8 Financial risk managementThe group’s risk management policies and procedures are disclosed in the Worldclass at Managing Risk section of the group's integrated report, available at nedbankgroup.co.za. These risk management procedures include, but are not limited to, credit risk, securitisation risk, liquidity risk, interest rate risk in the banking book and market risk.
4 CAPITAL MANAGEMENTNedbank Group’s Capital Management Framework reflects the integration of risk, capital, strategy and performance measurement across the group and contributes significantly to the Enterprisewide Risk Management Framework (ERMF).
A board-approved Solvency and Capital Management policy requires Nedbank Group to be capitalised at the greater of Basel III regulatory capital and economic capital.
The Group Capital Management division is housed within the Balance Sheet Management cluster that reports to the chief operating officer and is mandated with the implementation of the Capital Management Framework and the Internal Capital Adequacy Assessment Process (ICAAP) across the group. The capital management (incorporating ICAAP) responsibilities of the board and management are incorporated in their respective terms of reference as contained in the ERMF and are assisted by the board’s Group Risk and Capital Management Committee, and Group Asset and Liability Committee (ALCO) and Executive Risk Committee (Group ALCO), respectively.
Capital, reserves and long-term debt instrumentsThe group's Capital Management Framework, policies and processes cover the group's capital and reserves as per the consolidated statement of changes in equity, as well as the long-term debt instruments per note 34.
Further details on the ERMF, capital management and regulatory requirements are disclosed in the Worldclass at Managing Risk section of the group's integrated report, available at nedbankgroup.co.za, which is unaudited, unless stated otherwise.
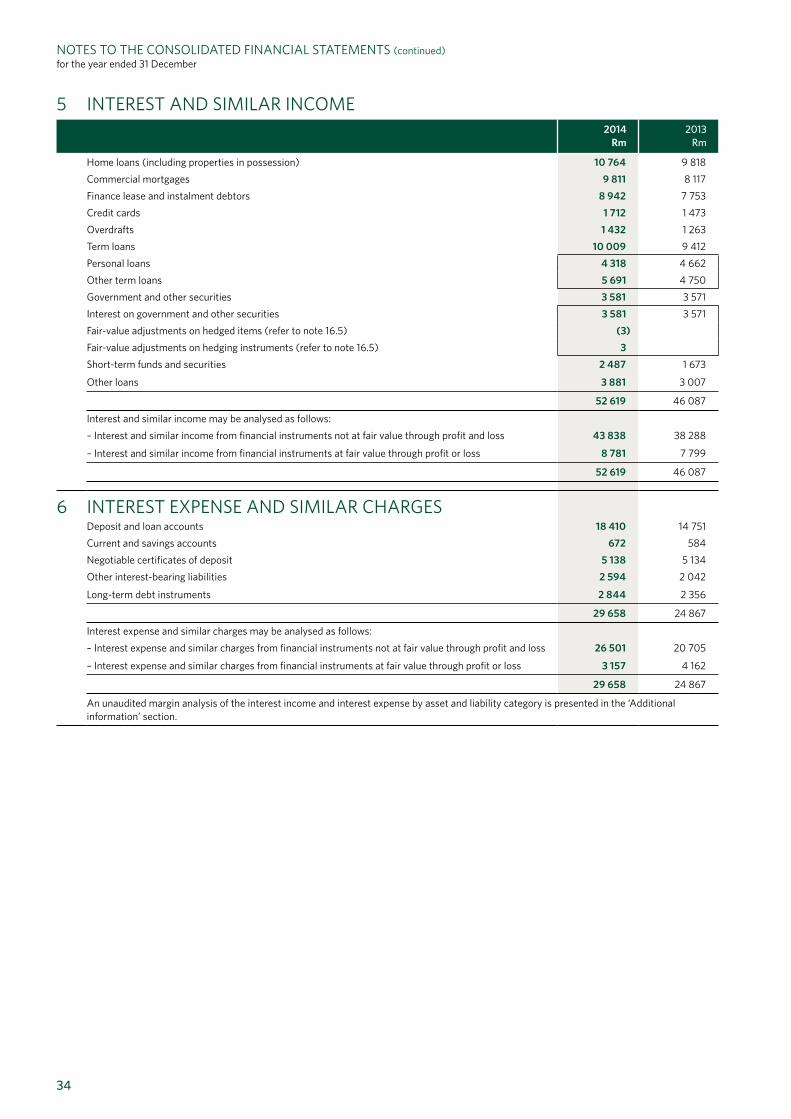
34
5 INTEREST AND SIMILAR INCOME2014
rm2013
Rm
Home loans (including properties in possession) 10 764 9 818Commercial mortgages 9 811 8 117Finance lease and instalment debtors 8 942 7 753Credit cards 1 712 1 473Overdrafts 1 432 1 263Term loans 10 009 9 412Personal loans 4 318 4 662Other term loans 5 691 4 750Government and other securities 3 581 3 571Interest on government and other securities 3 581 3 571Fair-value adjustments on hedged items (refer to note 16.5) (3)Fair-value adjustments on hedging instruments (refer to note 16.5) 3Short-term funds and securities 2 487 1 673
Other loans 3 881 3 007
52 619 46 087
Interest and similar income may be analysed as follows:– Interest and similar income from financial instruments not at fair value through profit and loss 43 838 38 288
– Interest and similar income from financial instruments at fair value through profit or loss 8 781 7 799
52 619 46 087
6 INTEREST ExPENSE AND SIMILAR CHARGESDeposit and loan accounts 18 410 14 751Current and savings accounts 672 584Negotiable certificates of deposit 5 138 5 134Other interest-bearing liabilities 2 594 2 042
Long-term debt instruments 2 844 2 356
29 658 24 867
Interest expense and similar charges may be analysed as follows:– Interest expense and similar charges from financial instruments not at fair value through profit and loss 26 501 20 705
– Interest expense and similar charges from financial instruments at fair value through profit or loss 3 157 4 162
29 658 24 867
An unaudited margin analysis of the interest income and interest expense by asset and liability category is presented in the ‘Additional information’ section.
NOTES TO THE CONSOLIDATED FINANCIAL STATEMENTS (continued)for the year ended 31 December

NedbaNk Group
35
Consolidated and separate annual
finanCial statements
7 NON-INTEREST REVENuE2014
rm2013
Rm
Commission and fee income1 14 570 14 023Administration fees 733 472Cash-handling fees 882 844Insurance commission 624 613Exchange commission 456 400Other fees 2 342 2 212Guarantee income 174 169Card income 2 996 2 759Service charges 3 497 3 605Other commission2 2 866 2 949
Insurance income (note 7.2) 1 986 1 927Fair-value adjustments (note 7.1) 35 40Fair-value adjustments 73 46Fair-value adjustments – own debt (38) (6)
Net trading income 2 648 2 564Foreign exchange 1 202 1 187Debt securities 1 194 1 146Equities 227 208Commodities 25 23
Private-equity income 423 225Securities dealing – realised 350 34Securities dealing – unrealised (11) 33Dividends received 84 158
Investment income 105 56Dividends received from unlisted investments 92 41Long-term-asset sales 13 15
Net sundry income 545 526Rents received 103 80Rental income from properties in possession 4 3Other sundry income 438 443
20 312 19 361See note 7.4 for a breakdown of non-interest revenue by operating segment.1 Commission and fee income includes R2 196m (2013: R1 947m) related to trust and fiduciary fees.2 2013 includes administration-related fee of R156m, currently in administration fees.
7.1 Analysis of fair-value adjustmentsFair-value adjustments can be analysed as follows:– Held for trading 142 2 183– Designated as at fair value through profit or loss (107) (2 143)
35 40
7.2 Insurance incomeInsurance contract income 1 889 1 923 Net insurance premium income 3 900 3 498 Gross premiums received 4 229 3 784 Reinsurance premiums (329) (286)
Net insurance claims and benefits (1 280) (1 153)Gross claims and benefits paid (1 582) (1 358)Reinsurance recoveries 302 205
Net commission and administration fees paid (258) (300)Investment income 377 220 Changes in insurance contracts (850) (342)
Investment contract expense 97 4 Premium income 247 178 Claims and benefits paid (127) (104)Investment income 40 39 Changes in investment contracts (63) (109)
1 986 1 927
7.3 Government grantsThe group receives various government grants, from SA and foreign governments. The government grants take a variety of forms, including interest rate subsidies on loans advanced to clients and payment in respect of previously writtenoff advances in respect of qualifying deceased estates. The government grants that are received by the group are recognised when the conditions of the government grant have been fulfilled and the grant is due to the group.Certain government assistance is directed towards the group's clients, including grants made to clients as first-time homeowners. Although the group may assist the client in obtaining the grant, these grants do not qualify as government grants as envisaged by the accounting standard.The group receives certain SA government grants in the form of refunds for Skills Development Levies and they pertain to prior training that has been facilitated by the group on behalf of its employees.No assistance has been received by the group from any government or government organisation in respect of any troubled asset or financial-crisis-related programme.
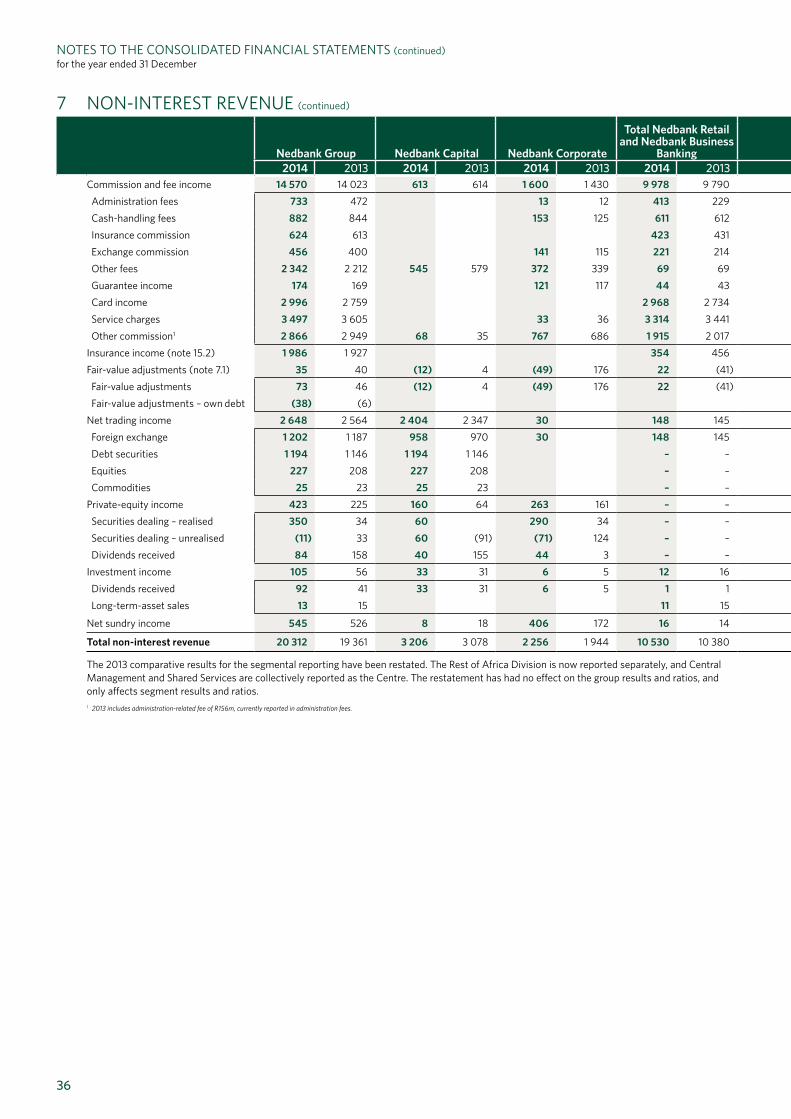
36
7 NON-INTEREST REVENuE (continued)
nedbank Group nedbank Capital nedbank Corporate
total nedbank retail and nedbank business
banking nedbank retail nedbank business
banking nedbank Wealth rest of africa division Centre2014 2013 2014 2013 2014 2013 2014 2013 2014 2013 2014 2013 2014 2013 2014 2013 2014 2013
Commission and fee income 14 570 14 023 613 614 1 600 1 430 9 978 9 790 8 422 8 196 1 556 1 594 1 783 1 650 609 542 (13) (3)Administration fees 733 472 13 12 413 229 409 224 4 5 268 200 33 24 6 7Cash-handling fees 882 844 153 125 611 612 256 253 355 359 2 1 116 106Insurance commission 624 613 423 431 419 427 4 4 189 171 12 11Exchange commission 456 400 141 115 221 214 87 86 134 128 63 47 26 19 5 5Other fees 2 342 2 212 545 579 372 339 69 69 69 69 1 240 1 120 157 134 (41) (29)Guarantee income 174 169 121 117 44 43 4 3 40 40 1 9 8Card income 2 996 2 759 2 968 2 734 2 891 2 658 77 76 28 25Service charges 3 497 3 605 33 36 3 314 3 441 2 829 2 907 485 534 17 13 133 116 (1)Other commission1 2 866 2 949 68 35 767 686 1 915 2 017 1 527 1 638 388 379 4 97 95 99 17 15
Insurance income (note 15.2) 1 986 1 927 354 456 354 456 1 630 1 470 1 1 1Fair-value adjustments (note 7.1) 35 40 (12) 4 (49) 176 22 (41) 14 (44) 8 3 – – – – 74 (99)Fair-value adjustments 73 46 (12) 4 (49) 176 22 (41) 14 (44) 8 3 112 (93)Fair-value adjustments – own debt (38) (6) (38) (6)
Net trading income 2 648 2 564 2 404 2 347 30 148 145 46 50 102 95 – – 66 72 – –Foreign exchange 1 202 1 187 958 970 30 148 145 46 50 102 95 66 72Debt securities 1 194 1 146 1 194 1 146 – –Equities 227 208 227 208 – –Commodities 25 23 25 23 – –
Private-equity income 423 225 160 64 263 161 – – – – – – – – – – – –Securities dealing – realised 350 34 60 290 34 – –Securities dealing – unrealised (11) 33 60 (91) (71) 124 – –Dividends received 84 158 40 155 44 3 – –
Investment income 105 56 33 31 6 5 12 16 1 1 11 15 3 – 12 – 39 4Dividends received 92 41 33 31 6 5 1 1 1 1 1 12 39 4Long-term-asset sales 13 15 11 15 11 15 2
Net sundry income 545 526 8 18 406 172 16 14 (17) (8) 33 22 (17) (39) 80 61 52 300
total non-interest revenue 20 312 19 361 3 206 3 078 2 256 1 944 10 530 10 380 8 820 8 651 1 710 1 729 3 399 3 081 768 675 153 203
The 2013 comparative results for the segmental reporting have been restated. The Rest of Africa Division is now reported separately, and Central Management and Shared Services are collectively reported as the Centre. The restatement has had no effect on the group results and ratios, and only affects segment results and ratios.1 2013 includes administration-related fee of R156m, currently reported in administration fees.
NOTES TO THE CONSOLIDATED FINANCIAL STATEMENTS (continued)for the year ended 31 December
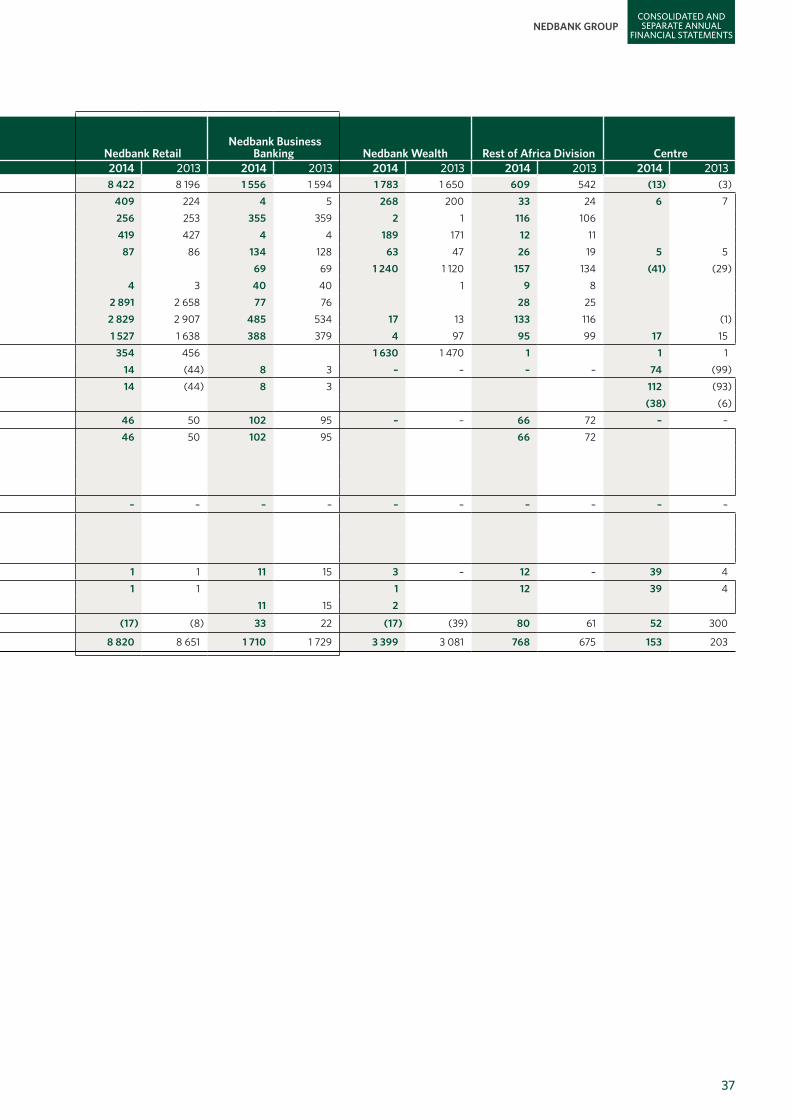
NedbaNk Group
37
Consolidated and separate annual
finanCial statements
7 NON-INTEREST REVENuE (continued)
nedbank Group nedbank Capital nedbank Corporate
total nedbank retail and nedbank business
banking nedbank retail nedbank business
banking nedbank Wealth rest of africa division Centre2014 2013 2014 2013 2014 2013 2014 2013 2014 2013 2014 2013 2014 2013 2014 2013 2014 2013
Commission and fee income 14 570 14 023 613 614 1 600 1 430 9 978 9 790 8 422 8 196 1 556 1 594 1 783 1 650 609 542 (13) (3)Administration fees 733 472 13 12 413 229 409 224 4 5 268 200 33 24 6 7Cash-handling fees 882 844 153 125 611 612 256 253 355 359 2 1 116 106Insurance commission 624 613 423 431 419 427 4 4 189 171 12 11Exchange commission 456 400 141 115 221 214 87 86 134 128 63 47 26 19 5 5Other fees 2 342 2 212 545 579 372 339 69 69 69 69 1 240 1 120 157 134 (41) (29)Guarantee income 174 169 121 117 44 43 4 3 40 40 1 9 8Card income 2 996 2 759 2 968 2 734 2 891 2 658 77 76 28 25Service charges 3 497 3 605 33 36 3 314 3 441 2 829 2 907 485 534 17 13 133 116 (1)Other commission1 2 866 2 949 68 35 767 686 1 915 2 017 1 527 1 638 388 379 4 97 95 99 17 15
Insurance income (note 15.2) 1 986 1 927 354 456 354 456 1 630 1 470 1 1 1Fair-value adjustments (note 7.1) 35 40 (12) 4 (49) 176 22 (41) 14 (44) 8 3 – – – – 74 (99)Fair-value adjustments 73 46 (12) 4 (49) 176 22 (41) 14 (44) 8 3 112 (93)Fair-value adjustments – own debt (38) (6) (38) (6)
Net trading income 2 648 2 564 2 404 2 347 30 148 145 46 50 102 95 – – 66 72 – –Foreign exchange 1 202 1 187 958 970 30 148 145 46 50 102 95 66 72Debt securities 1 194 1 146 1 194 1 146 – –Equities 227 208 227 208 – –Commodities 25 23 25 23 – –
Private-equity income 423 225 160 64 263 161 – – – – – – – – – – – –Securities dealing – realised 350 34 60 290 34 – –Securities dealing – unrealised (11) 33 60 (91) (71) 124 – –Dividends received 84 158 40 155 44 3 – –
Investment income 105 56 33 31 6 5 12 16 1 1 11 15 3 – 12 – 39 4Dividends received 92 41 33 31 6 5 1 1 1 1 1 12 39 4Long-term-asset sales 13 15 11 15 11 15 2
Net sundry income 545 526 8 18 406 172 16 14 (17) (8) 33 22 (17) (39) 80 61 52 300
total non-interest revenue 20 312 19 361 3 206 3 078 2 256 1 944 10 530 10 380 8 820 8 651 1 710 1 729 3 399 3 081 768 675 153 203
The 2013 comparative results for the segmental reporting have been restated. The Rest of Africa Division is now reported separately, and Central Management and Shared Services are collectively reported as the Centre. The restatement has had no effect on the group results and ratios, and only affects segment results and ratios.1 2013 includes administration-related fee of R156m, currently reported in administration fees.

38
8 OPERATING ExPENSES2014
rm2013
Rm
Staff costs 13 838 12 629 Remuneration and other staff costs 11 097 10 126 Short-term incentives 2 100 1 833 Long-term employee benefits (note 27.2)1 29 116 Share-based payments expense – employees 612 554
BEE transaction expenses2 47 57 BEE share-based payments expenses 21 32 Fees 26 25
Computer processing 3 097 2 720 Depreciation for computer equipment 412 356 Amortisation of computer software 655 584 Operating lease charges for computer equipment 281 238 Development costs 181 192 Other computer processing expenses 1 568 1 350
Communication and travel 835 820 Depreciation for vehicles 5 5 Other communication and travel 830 815
Occupation and accommodation 1 987 1 838 Depreciation for owner-occupied land and buildings 136 129 Operating lease charges for land and buildings 769 703 Other occupation and accommodation expenses 1 082 1 006
Marketing and public relations 1 517 1 451 Fees and assurances 2 260 2 042 Auditors’ remuneration 132 129 Statutory audit – current year 96 92
– prior year 2 Non-audit services – interim reviews 8 7
– other services 28 28 Other fees and assurance costs 2 128 1 913
Furniture, office equipment and consumables 493 454 Depreciation for furniture and other equipment 393 380 Operating lease charge for furniture and other equipment 8 7 Other office equipment and consumables 92 67
Other operating expenses 460 408 Amortisation of intangible assets 64 64 Other sundries 396 344
24 534 22 419
NOTES TO THE CONSOLIDATED FINANCIAL STATEMENTS (continued)for the year ended 31 December

NedbaNk Group
39
Consolidated and separate annual
finanCial statements
Certain expenses incurred by the company on behalf of subsidiary companies are recovered from subsidiary companies.Refer to note 8.1 for a breakdown of total expenses by operating segment and the Remuneration Report for a detailed breakdown of directors’ and prescribed officers’ remuneration.1 Includes contributions to defined-benefit and pension funds and postretirement medical aid funding and any adjustments for defined-benefit obligations together with any fair-value adjustments of plan assets held.
See note 27.2 See note 51 for a description of the BEE schemes.
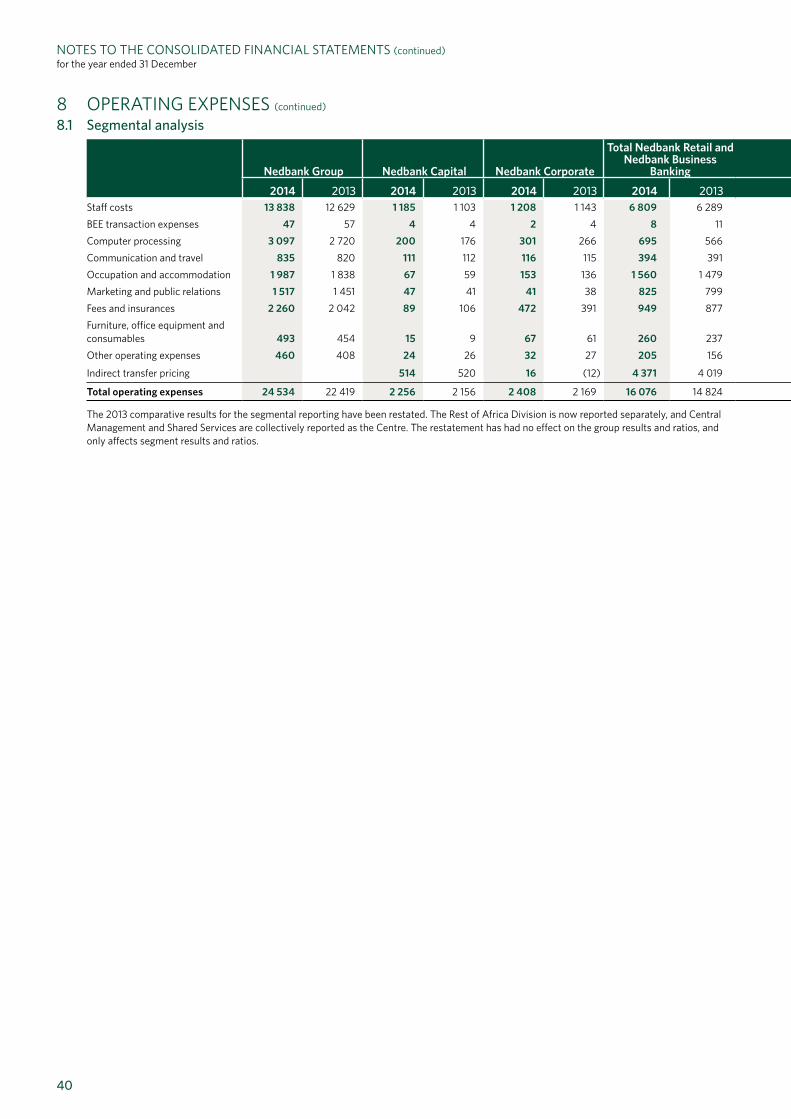
40
8 OPERATING ExPENSES (continued)
8.1 Segmental analysis
nedbank Group nedbank Capital nedbank Corporate
total nedbank retail and nedbank business
banking nedbank retail nedbank business
banking nedbank Wealth rest of africa division Centre
2014 2013 2014 2013 2014 2013 2014 2013 2014 2013 2014 2013 2014 2013 2014 2013 2014 2013Staff costs 13 838 12 629 1 185 1 103 1 208 1 143 6 809 6 289 5 416 5 019 1 393 1 270 1 261 1 144 632 520 2 743 2 430 BEE transaction expenses 47 57 4 4 2 4 8 11 5 8 3 3 3 2 1 1 29 35 Computer processing 3 097 2 720 200 176 301 266 695 566 621 519 74 47 109 90 69 60 1 723 1 562 Communication and travel 835 820 111 112 116 115 394 391 351 349 43 42 64 61 43 38 107 103 Occupation and accommodation 1 987 1 838 67 59 153 136 1 560 1 479 1 424 1 352 136 127 122 107 112 94 (27) (37)Marketing and public relations 1 517 1 451 47 41 41 38 825 799 746 725 79 74 104 114 37 31 463 428 Fees and insurances 2 260 2 042 89 106 472 391 949 877 874 799 75 78 254 181 116 120 380 367 Furniture, office equipment and consumables 493 454 15 9 67 61 260 237 249 227 11 10 16 17 36 37 99 93 Other operating expenses 460 408 24 26 32 27 205 156 194 145 11 11 107 93 31 48 61 58
Indirect transfer pricing 514 520 16 (12) 4 371 4 019 2 809 2 562 1 562 1 457 444 409 179 177 (5 524) (5 113)
total operating expenses 24 534 22 419 2 256 2 156 2 408 2 169 16 076 14 824 12 689 11 705 3 387 3 119 2 484 2 218 1 256 1 126 54 (74)
The 2013 comparative results for the segmental reporting have been restated. The Rest of Africa Division is now reported separately, and Central Management and Shared Services are collectively reported as the Centre. The restatement has had no effect on the group results and ratios, and only affects segment results and ratios.
NOTES TO THE CONSOLIDATED FINANCIAL STATEMENTS (continued)for the year ended 31 December

NedbaNk Group
41
Consolidated and separate annual
finanCial statements
8 OPERATING ExPENSES (continued)
8.1 Segmental analysis
nedbank Group nedbank Capital nedbank Corporate
total nedbank retail and nedbank business
banking nedbank retail nedbank business
banking nedbank Wealth rest of africa division Centre
2014 2013 2014 2013 2014 2013 2014 2013 2014 2013 2014 2013 2014 2013 2014 2013 2014 2013Staff costs 13 838 12 629 1 185 1 103 1 208 1 143 6 809 6 289 5 416 5 019 1 393 1 270 1 261 1 144 632 520 2 743 2 430 BEE transaction expenses 47 57 4 4 2 4 8 11 5 8 3 3 3 2 1 1 29 35 Computer processing 3 097 2 720 200 176 301 266 695 566 621 519 74 47 109 90 69 60 1 723 1 562 Communication and travel 835 820 111 112 116 115 394 391 351 349 43 42 64 61 43 38 107 103 Occupation and accommodation 1 987 1 838 67 59 153 136 1 560 1 479 1 424 1 352 136 127 122 107 112 94 (27) (37)Marketing and public relations 1 517 1 451 47 41 41 38 825 799 746 725 79 74 104 114 37 31 463 428 Fees and insurances 2 260 2 042 89 106 472 391 949 877 874 799 75 78 254 181 116 120 380 367 Furniture, office equipment and consumables 493 454 15 9 67 61 260 237 249 227 11 10 16 17 36 37 99 93 Other operating expenses 460 408 24 26 32 27 205 156 194 145 11 11 107 93 31 48 61 58
Indirect transfer pricing 514 520 16 (12) 4 371 4 019 2 809 2 562 1 562 1 457 444 409 179 177 (5 524) (5 113)
total operating expenses 24 534 22 419 2 256 2 156 2 408 2 169 16 076 14 824 12 689 11 705 3 387 3 119 2 484 2 218 1 256 1 126 54 (74)
The 2013 comparative results for the segmental reporting have been restated. The Rest of Africa Division is now reported separately, and Central Management and Shared Services are collectively reported as the Centre. The restatement has had no effect on the group results and ratios, and only affects segment results and ratios.

42
9 INDIRECT TAxATION2014
rm2013
Rm
Value-added taxation 499 493
Other transaction taxes 136 108
635 601
Value-added taxation comprises the VAT incurred that is irrecoverable in respect of the making of exempt supplies as defined in the Value-Added Tax Act, 1991.
10 NON-TRADING AND CAPITAL ITEMS(Loss)/Profit on sale of subsidiaries and investments (12) 11
Impairment of property and equipment, and capitalised development costs (97) (67)
(109) (56)
11 DIRECT TAxATION11.1 Charge for the year
SA normal taxation:– Current charge 3 380 3 074– Capital gains taxation – deferred (28) (25)– Deferred taxation (5) (139)
Foreign taxation 180 134
Current and deferred taxation on income 3 527 3 044Prior-year overprovision/(underprovision) – current taxation 221 (131)
Prior-year (underprovision)/overprovision – deferred taxation (261) 120
Total taxation on income 3 487 3 033
Taxation on non-headline earnings items (19) (17)
3 468 3 016
11.2 Taxation rate reconciliation2014
%2013
%
Standard rate of SA normal taxation 28,0 28,0Non-taxable dividend income (2,4) (2,8)Capital items 0,1 (0,2)Foreign income and section 9D attribution (0,5) (0,4)
Other 0,1 0,6
Effective taxation rate 25,3 25,2
11.3 Income tax recognised in other comprehensive income2014rm Gross taxation net of taxation
Exchange differences on translating foreign operations 390 390Fair-value adjustments on available-for-sale assets 21 21Remeasurements on long-term employee benefit assets 56 (22) 34Gains on property revaluations 234 (32) 2022013Exchange differences on translating foreign operations 690 690Fair-value adjustments on available-for-sale assets 49 (17) 32Remeasurements on long-term employee benefit assets 1 016 (285) 731
Gains on property revaluations 333 (111) 222
11.4 Future taxation reliefThe group has estimated taxation losses of R1 015m (2013: R1 124m) that can be set off against future taxable income, of which R581,0m (2013: R465,9m) has been applied to the deferred taxation balance.
NOTES TO THE CONSOLIDATED FINANCIAL STATEMENTS (continued)for the year ended 31 December

NedbaNk Group
43
Consolidated and separate annual
finanCial statements
12 EARNINGS12.1 Earnings per share
Basic earnings and headline earnings per share are calculated by dividing the relevant earnings amount by the weighted-average number of shares in issue. Diluted earnings and diluted headline earnings per share are calculated by dividing the relevant earnings by the weighted-average number of shares in issue after taking the dilutive impact of potential ordinary shares to be issued into account.
basic Headline
basic diluted basic diluted
2014profit attributable to equity holders of the parent (rm) 9 796 9 796 9 796 9 796Adjusted for:– Non-trading and capital items (note 10) 109 109– Fair-value adjustments of investment properties (6) (6)
– Taxation on non-trading and capital items (note 11) (19) (19)
adjusted profit attributable to equity holders of the parent (rm) 9 796 9 796 9 880 9 880
Weighted-average number of ordinary shares 464 442 212 464 442 212 464 442 212 464 442 212Adjusted for:
– Share schemes that have a dilutive effect 13 792 790 13 792 790
adjusted weighted average number of ordinary shares 464 442 212 478 235 002 464 442 212 478 235 002
earnings per share (cents) 2 109 2 049 2 127 2 066
2013profit attributable to equity holders of the parent (rm) 8 637 8 637 8 637 8 637Adjusted for:– Non-trading and capital items (note 10) 56 56– Fair-value adjustments of investment properties (6) (6)
– Taxation on non-trading and capital items (note 11) (17) (17)
adjusted profit attributable to equity holders of the parent (rm) 8 637 8 637 8 670 8 670
Weighted-average number of ordinary shares 460 167 246 460 167 246 460 167 246 460 167 246Adjusted for:
– Share schemes that have a dilutive effect 13 954 845 13 954 845
adjusted weighted average number of ordinary shares 460 167 246 474 122 091 460 167 246 474 122 091
earnings per share (cents) 1 877 1 822 1 884 1 829
The diluted-earnings-per-share calculations are based on the group's daily average share price of 22 458 cents (2013: 19 205 cents) and exclude the effect of certain share options granted under certain share option schemes as they would be anti-dilutive. The number of share options not included in the weighted-average number of shares (as they would have been anti-dilutive) is nil (2013: 226 061).
12.2 Headline earnings reconciliation
rm
2014 2013
Gross net of taxation Gross Net of taxation
Profit attributable to equity holders of the parent 9 796 8 637Less: Non-headline earnings items (103) (84) (50) (33)Profit on sale of subsidiaries, investments and property and equipment (12) 7 11 11Net impairment of investments, property and equipment and capitalised development costs (97) (97) (67) (49)Fair-value adjustments of investment properties 6 6 6 5
Headline earnings 9 880 8 670

44
13 DIVIDENDS13.1 Ordinary shares
last day to trade (cum
dividend) Cents per
share rm
2014Final declared for 2013 – paid 2014 28 march 2014 505 2 433
Interim declared for 2014 5 september 2014 4601 2 210
Ordinary dividends paid 2014 965 4 643
Final ordinary dividend declared for 2014 5681
1 Total dividend declared for 2014 was 1 028 cents per share and the dividend cover ratio equalled 2,07 times.
2013Final declared for 2012 – paid 2013 27 March 2013 412 1 967Interim declared for 2013 6 September 2013 3902 1 854
Ordinary dividends paid 2013 802 3 821
Final ordinary dividend declared for 2013 28 March 2014 5052
2 Total dividend declared for 2013 was 895 cents per share and the dividend cover ratio equalled 2,11 times.
Dividend distributions include payments to participants in employee and BEE share schemes.
13.2 Non-controlling interest – preference shareholdersnumber
of sharesCents per
shareamount
(rm)
2014Nedbank Limited – Final declared for 2013 – paid March 2014 358 277 491 35,70775 128
Nedbank Limited – Interim declared for 2014 – paid September 2014 358 277 491 36,86072 132
260
Nedbank Limited – Final declared for 2014 – payable March 2015 358 277 491 38,76140 139
dividends declared calculations days rateamount
(rm)
2014Nedbank Limited1 July 2014 – 31 December 2014 184 138,91 July 2014 – 17 July 2014 17 7,500% 12,518 July 2014 – 31 December 2014 167 7,708% 126,4
Total declared 138,9
number of shares
Cents per share
amount (rm)
2013Nedbank Limited – Final declared for 2012 – paid March 2013 358 277 491 35,82649 128
Nedbank Limited – Interim declared for 2013 – paid August 2013 358 277 491 35,12556 126
254
Nedbank Limited – Final declared for 2013 – paid March 2014 358 277 491 35,70775 128
dividends declared calculations days rateamount
(rm)
2013Nedbank Limited
1 July 2013 – 31 December 2013 184 7,083% 127,9
Total declared 127,9
NOTES TO THE CONSOLIDATED FINANCIAL STATEMENTS (continued)for the year ended 31 December

NedbaNk Group
45
Consolidated and separate annual
finanCial statements
13.2 Non-controlling interest – preference shareholders (continued)
dividends paid calculations Days RateAmount
(Rm)
2013 (Paid March 2014)
Nedbank – 1 July 2013 – 31 December 2013 184 127,91 July 2013 – 31 December 2013 184 7,083% 127,9
2014 (Paid Sept 2014)Nedbank – 1 January 2014 – 30 June 2014 181 132,11 January 2014 – 29 January 2014 29 7,083% 20,230 January 2014 – 30 June 2014 152 7,500% 111,9
Nedbank (MFC) – Participating preference shares 63,2
profit attributable to preference shareholders 323,2
2012 (Paid March 2013)Nedbank – 1 July 2012 – 31 December 2012 184 128,41 July 2012 – 19 July 2012 19 7,500% 14,020 July 2012 – 31 December 2012 165 7,083% 114,4
2013 (Paid September 2013)Nedbank – 1 January 2013 – 30 June 2013 181 7,083% 125,8
Nedbank (MFC) – Participating preference shares 37,7
profit attributable to preference shareholders 291,9
14 CASH AND CASH EquIVALENTS2014
rm2013
Rm
Coins and bank notes 6 943 5 841Money at call and short notice 5 865 14 697
Balances with central banks – other than mandatory reserve deposits 531 304
Cash and cash equivalents excluding mandatory reserve deposits with central banks 13 339 20 842
Mandatory reserve deposits with central banks 14 911 13 231
28 250 34 073
Money at call and short notice constitutes amounts withdrawable in 32 days or less. Mandatory reserve deposits are not available for use in the group's day-to-day operations. Cash on hand and mandatory reserve deposits are non-interest bearing.
15 OTHER SHORT-TERM SECuRITIES15.1 Analysis
Negotiable certificates of deposit 16 795 16 095
Treasury bills and other bonds 50 439 26 356
67 234 42 451
15.2 Sectoral analysisBanks 18 002 17 170Government and public sector 48 805 24 956
Other services 427 325
67 234 42 451

46
16 DERIVATIVE FINANCIAL INSTRuMENTSThese transactions have been entered into in the normal course of business and are carried at fair value. The principal types of derivative contracts into which the group enters are described below.SwapsThese are over the counter (OTC) agreements between two parties to exchange periodic payments of interest, or payments for the change in value of a commodity, or related index, over a set period based on notional principal amounts. The group enters into swap transactions in several markets. Interest rate swaps exchange fixed rates for floating rates of interest based on notional amounts. Basis swaps exchange floating or fixed interest calculated using different bases. Cross-currency swaps are the exchange of interest based on notional values of different currencies.OptionsOptions confer the right, but not the obligation, on the buyer to receive or pay a specific quantity of an asset or financial instrument for a specific price on or before a specified date. Options may be exchange-traded on OTC agreements. The group principally buys and sells currency, interest-rate and equity options.Futures and forwardsShort-term interest rate futures, bond futures, financial futures, equity and commodity futures and forward foreign exchange contracts are all agreements to deliver, or take delivery of, a specified amount of an asset or financial instrument based on a specified rate, price or index applied against the underlying asset or financial instrument, at a specified date. Futures are exchange-traded at standardised amounts of the underlying asset or financial instrument. Forward contracts are OTC agreements and are principally dealt in by the group, in interest rates as forward-rate agreements and in currency as forward foreign exchange contracts.Collateral
The group may require collateral in respect of the credit risk present in derivative transactions. The amount of credit risk is principally the positive fair value of the contract. Collateral may be in the form of cash or in the form of a lien over a client's assets, entitling the group to make a claim for current and future liabilities.
16.1 Total carrying amount of derivative financial instruments2014
rm2013
Rm
Gross carrying amount of assets 15 573 13 390
Gross carrying amount of liabilities (15 472) (16 580)
Net carrying amount 101 (3 190)
A detailed breakdown of the carrying amount (fair value) and notional principal of the various types of derivative financial instruments held by the group is presented in the following tables in notes 16.2 – 16.5.
NOTES TO THE CONSOLIDATED FINANCIAL STATEMENTS (continued)for the year ended 31 December

NedbaNk Group
47
Consolidated and separate annual
finanCial statements
16.2 Notional principal of derivative financial instrumentsThis represents the gross notional amounts of all outstanding contracts at year-end. This gross notional amount is the sum of the absolute amount of all purchases and sales of derivative instruments. The notional amounts do not represent amounts exchanged by the parties and therefore represent only the measure of involvement by the group in derivative contracts and not its exposure to market or credit risks arising from such contracts. The amounts actually exchanged are calculated on the basis of the notional amounts and other terms of the derivative, which relate to interest rates, exchange rates, securities or commodity prices or financial and other indices.
2014 2013
rmnotional principal
positivevalue
negative value
Notional principal
Positivevalue
Negative value
Hedging derivativesInterest rate derivativesInterest rate swaps 275 275
other derivativesEquity derivatives 6 863 2 433 4 430 12 518 6 015 6 503Options written 2 170 2 170 3 087 3 087Options purchased 2 158 2 158 2 978 2 978Futures1 2 535 275 2 260 6 453 3 037 3 416
Commodity derivatives 1 957 1 173 784 1 285 1 285Futures 1 957 1 173 784 1 285 1 285
exchange rate derivatives 305 088 143 381 161 707 182 775 93 580 89 195Forwards 243 353 115 986 127 367 156 812 82 279 74 533Futures 1 214 108 1 106 379 336 43Currency swaps 49 331 22 043 27 288 21 075 8 593 12 482Options purchased 5 244 5 244 2 329 2 329Options written 5 946 5 946 2 180 43 2 137
interest rate derivatives 682 182 344 037 338 145 757 066 378 581 378 485Interest rate swaps 515 128 256 336 258 792 469 028 237 677 231 351Forward rate agreements 121 403 65 299 56 104 242 826 120 099 122 727Options purchased 723 723Futures 6 160 1 696 4 464 7 705 1 884 5 821Caps 2 169 900 1 269 307 307Floors 650 650 150 150
Credit default swaps 36 672 19 156 17 516 36 327 18 198 18 129
total notional principal 996 365 491 299 505 066 953 644 478 176 475 4681 Includes contracts for difference with positive notionals of R45m (2013: R342m) and negative notionals of R1 677m (2013: R2 014m).
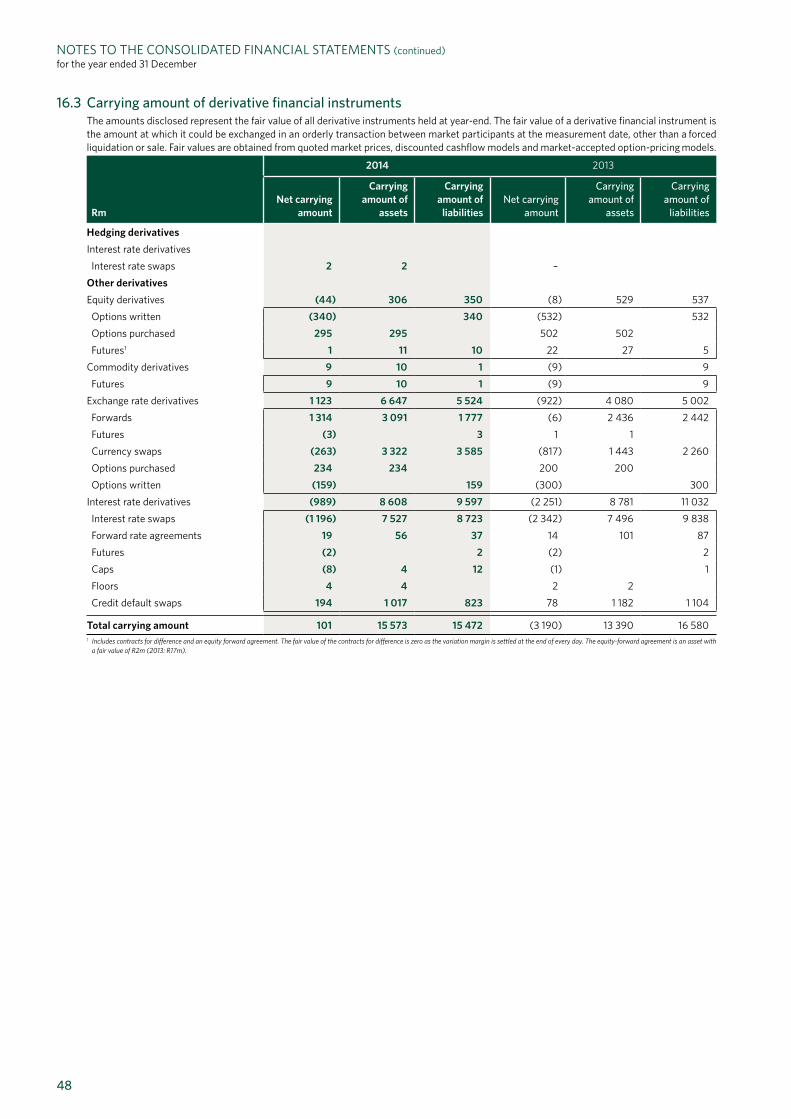
48
16.3 Carrying amount of derivative financial instrumentsThe amounts disclosed represent the fair value of all derivative instruments held at year-end. The fair value of a derivative financial instrument is the amount at which it could be exchanged in an orderly transaction between market participants at the measurement date, other than a forced liquidation or sale. Fair values are obtained from quoted market prices, discounted cashflow models and market-accepted option-pricing models.
rm
2014 2013
net carrying amount
Carrying amount of
assets
Carrying amount of
liabilities Net carrying
amount
Carrying amount of
assets
Carrying amount of
liabilities
Hedging derivativesInterest rate derivativesInterest rate swaps 2 2 –
other derivativesEquity derivatives (44) 306 350 (8) 529 537Options written (340) 340 (532) 532Options purchased 295 295 502 502Futures1 1 11 10 22 27 5
Commodity derivatives 9 10 1 (9) 9Futures 9 10 1 (9) 9
Exchange rate derivatives 1 123 6 647 5 524 (922) 4 080 5 002Forwards 1 314 3 091 1 777 (6) 2 436 2 442Futures (3) 3 1 1Currency swaps (263) 3 322 3 585 (817) 1 443 2 260Options purchased 234 234 200 200Options written (159) 159 (300) 300
Interest rate derivatives (989) 8 608 9 597 (2 251) 8 781 11 032Interest rate swaps (1 196) 7 527 8 723 (2 342) 7 496 9 838Forward rate agreements 19 56 37 14 101 87Futures (2) 2 (2) 2Caps (8) 4 12 (1) 1Floors 4 4 2 2Credit default swaps 194 1 017 823 78 1 182 1 104
total carrying amount 101 15 573 15 472 (3 190) 13 390 16 5801 Includes contracts for difference and an equity forward agreement. The fair value of the contracts for difference is zero as the variation margin is settled at the end of every day. The equity-forward agreement is an asset with
a fair value of R2m (2013: R17m).
NOTES TO THE CONSOLIDATED FINANCIAL STATEMENTS (continued)for the year ended 31 December

NedbaNk Group
49
Consolidated and separate annual
finanCial statements
16.4 Analysis of derivative financial instruments Hedging
derivatives other derivatives
rm interest rate
derivatives equity
derivatives Commodity
derivatives exchange rate
derivatives interest rate
derivatives total
derivative assets2014Maturity analysis:under one year 271 10 3 427 784 4 492One to five years 1 35 1 932 3 151 5 119Over five years 1 1 288 4 673 5 962
2 306 10 6 647 8 608 15 573
2013Maturity analysis:under one year 353 2 332 416 3 101
One to five years 176 1 173 4 018 5 367Over five years 575 4 347 4 922
– 529 – 4 080 8 781 13 390
derivative liabilities2014Maturity analysis:under one year 268 1 2 393 632 3 294One to five years 82 1 653 3 096 4 831Over five years 1 478 5 869 7 347
– 350 1 5 524 9 597 15 472
2013Maturity analysis:under one year 335 9 2 772 531 3 647One to five years 202 1 013 4 329 5 544Over five years 1 217 6 172 7 389
– 537 9 5 002 11 032 16 580
notional principal of derivatives2014Maturity analysis:under one year 5 805 1 957 258 393 224 699 490 854One to five years 75 1 058 28 404 255 294 284 831Over five years 200 18 291 202 189 220 680
275 6 863 1 957 305 088 682 182 996 365
2013Maturity analysis:under one year 8 305 1 285 154 652 289 840 454 082One to five years 1 857 19 069 304 035 324 961Over five years 2 356 9 054 163 191 174 601
– 12 518 1 285 182 775 757 066 953 644
16.5 Derivatives designated as fair value hedgesAs part of the group’s hedging activities, it enters into transactions which are designated as fair-value hedge transactions. Cashflow hedges and hedges of net investments in foreign entities do not currently form part of the group’s hedging strategy.Fair-value hedges are used by the group to mitigate the risk of changes in fair-value of financial instruments due to movements in market interest rates. Derivatives that are designated by the group to form part of these fair-value hedge transactions, principally consist of interest rate swaps. The corresponding hedged items forming part of these fair-value hedge transactions primarily consist of fixed rate government bonds (refer to note 17).For qualifying fair-value hedges, all changes in the fair-value of the derivative and in the fair value of the hedged item in relation to the risk being hedged are recognised in profit and loss. If the hedge relationship is terminated, the fair-value adjustment to be hedged item continues to be reported as part to the basis of the item and is amortised to profit and loss as a yield adjustment over the remainder of the hedging period.The group recognised the following gains and losses on hedging instruments and hedged items:
rm 2014 2013
Losses on hedged items (assets) (note 5) (3)
Gains on hedging instruments (assets) (note 5) 3

50
17 GOVERNMENT AND OTHER SECuRITIES17.1 Analysis
2014rm
2013Rm
Government and government-guaranteed securities 14 176 17 884
Other dated securities1 13 001 14 207
27 177 32 091
17.2 Sectoral analysisFinancial services, insurance and real estate 2 516 2 628Banks 2 910 3 278Manufacturing 1 882 2 171Transport, storage and communication 694 1 082Government and public sector 17 907 21 046
Other sectors 1 268 1 886
27 177 32 0911 Includes securitised assets. See note 45.
18 LOANS AND ADVANCESThe group extends advances to individuals and to the corporate, commercial and public sectors. Advances made to individuals are mostly in the form of mortgages, instalment credit, overdrafts, personal loans and credit card borrowings. The group’s main activity is in the corporate and commercial sector, where advances are made to a large cross-section of businesses, predominantly in the finance and service area, manufacturing and building and property finance sectors.This note should be read in conjunction with note 19 'Impairment of loans and advances', as this represents the gross exposure before any impairment provision. Specific impairments have been raised against those loans identified as impaired, and the analysis per product type can be found in note 19.2. Portfolio impairments are recognised against loans and advances classified as 'neither past due nor impaired' or 'past due but not impaired'.
18.1 Categories of loans and advances2014
rm2013
Rm
Mortgage loans 261 101 242 481Home loans 137 449 136 156Commercial mortgages 123 652 106 325
Net finance lease and instalment debtors (note 18.4) 94 237 85 038Gross investment 117 907 106 234unearned finance charges (23 670) (21 196)
Credit cards 13 404 11 441Other loans and advances 255 374 251 868Properties in possession 596 772Overdrafts 16 141 15 048Term loans 106 175 97 528Personal loans 18 346 21 145Other term loans 87 829 76 383
Overnight loans 21 638 17 927Other loans to clients 69 161 70 976Foreign client lending 12 512 12 658Remittances in transit 195 237Other loans1 56 454 58 081
Preference shares and debentures 18 098 18 984Factoring accounts 4 986 4 796Deposits placed under reverse repurchase agreements 18 291 25 796Trade, other bills and bankers' acceptances 288 41
624 116 590 828
Impairment of loans and advances (note 19) (11 095) (11 456)
613 021 579 372
Comprises:Loans and advances to customers 602 175 557 956
Loans and advances to banks 21 941 32 872
624 116 590 828
See note 18.8 for a breakdown of loans and advances by operating segment.1 Represents clients' indebtedness for acceptances and other loans.
NOTES TO THE CONSOLIDATED FINANCIAL STATEMENTS (continued)for the year ended 31 December
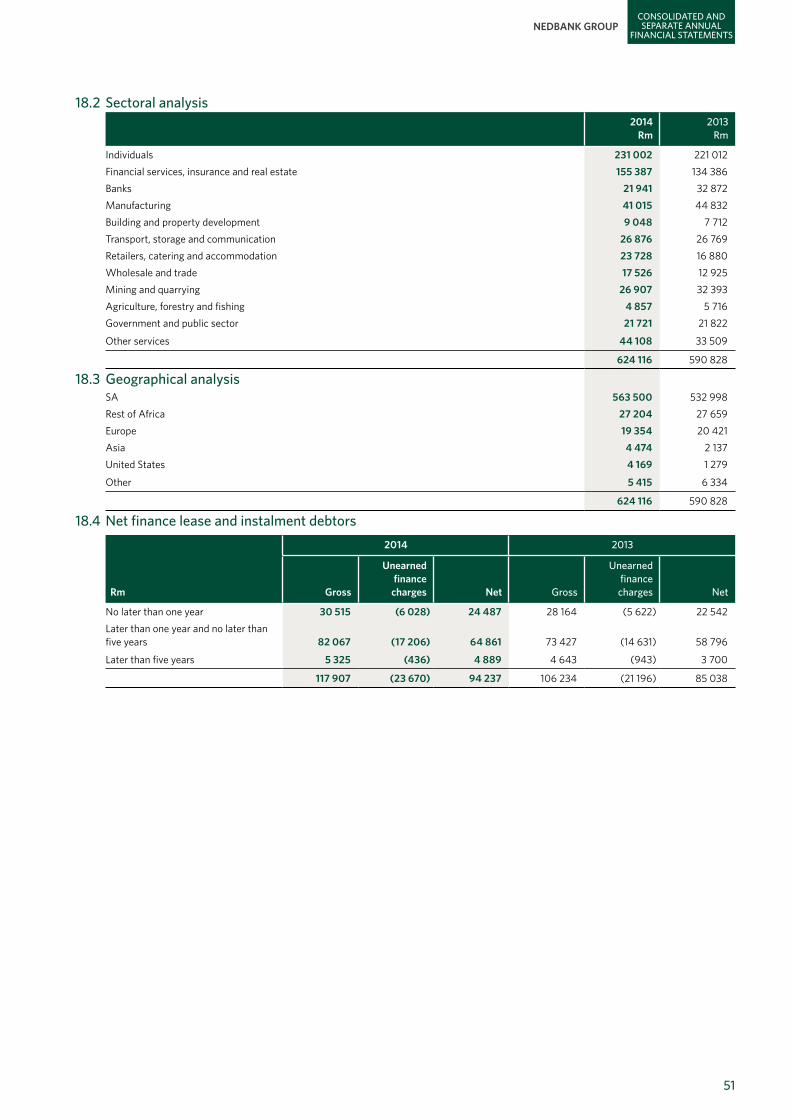
NedbaNk Group
51
Consolidated and separate annual
finanCial statements
18.2 Sectoral analysis2014
rm2013
Rm
Individuals 231 002 221 012Financial services, insurance and real estate 155 387 134 386Banks 21 941 32 872Manufacturing 41 015 44 832Building and property development 9 048 7 712Transport, storage and communication 26 876 26 769Retailers, catering and accommodation 23 728 16 880Wholesale and trade 17 526 12 925Mining and quarrying 26 907 32 393Agriculture, forestry and fishing 4 857 5 716Government and public sector 21 721 21 822
Other services 44 108 33 509
624 116 590 828
18.3 Geographical analysisSA 563 500 532 998Rest of Africa 27 204 27 659Europe 19 354 20 421Asia 4 474 2 137united States 4 169 1 279
Other 5 415 6 334
624 116 590 828
18.4 Net finance lease and instalment debtors
rm
2014 2013
Gross
unearned finance
charges net Gross
Unearned finance
charges Net
No later than one year 30 515 (6 028) 24 487 28 164 (5 622) 22 542 Later than one year and no later than five years 82 067 (17 206) 64 861 73 427 (14 631) 58 796
Later than five years 5 325 (436) 4 889 4 643 (943) 3 700
117 907 (23 670) 94 237 106 234 (21 196) 85 038
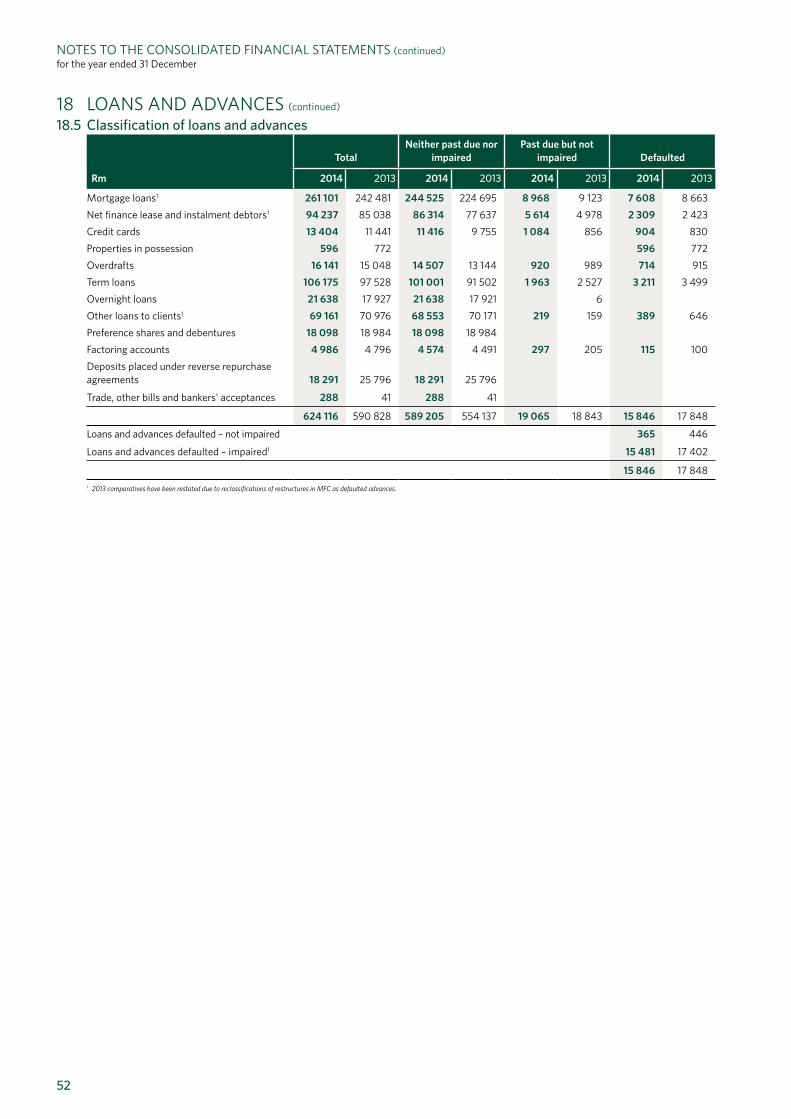
52
18 LOANS AND ADVANCES (continued)
18.5 Classification of loans and advances
rm
totalneither past due nor
impairedpast due but not
impaired defaulted
2014 2013 2014 2013 2014 2013 2014 2013
Mortgage loans1 261 101 242 481 244 525 224 695 8 968 9 123 7 608 8 663 Net finance lease and instalment debtors1 94 237 85 038 86 314 77 637 5 614 4 978 2 309 2 423 Credit cards 13 404 11 441 11 416 9 755 1 084 856 904 830 Properties in possession 596 772 596 772 Overdrafts 16 141 15 048 14 507 13 144 920 989 714 915 Term loans 106 175 97 528 101 001 91 502 1 963 2 527 3 211 3 499 Overnight loans 21 638 17 927 21 638 17 921 6 Other loans to clients1 69 161 70 976 68 553 70 171 219 159 389 646 Preference shares and debentures 18 098 18 984 18 098 18 984 Factoring accounts 4 986 4 796 4 574 4 491 297 205 115 100 Deposits placed under reverse repurchase agreements 18 291 25 796 18 291 25 796
Trade, other bills and bankers' acceptances 288 41 288 41
624 116 590 828 589 205 554 137 19 065 18 843 15 846 17 848
Loans and advances defaulted – not impaired 365 446
Loans and advances defaulted – impaired1 15 481 17 402
15 846 17 8481 2013 comparatives have been restated due to reclassifications of restructures in MFC as defaulted advances.
NOTES TO THE CONSOLIDATED FINANCIAL STATEMENTS (continued)for the year ended 31 December

NedbaNk Group
53
Consolidated and separate annual
finanCial statements
18.6 Age analysis of loans and advances
rm
total <1 month>1 month
<3 months>3 months<6 months
2014 2013 2014 2013 2014 2013 2014 2013
Neither past due nor impaired 589 205 554 137 589 205 554 137 Mortgage loans 244 525 224 695 244 525 224 695 Net finance lease and instalment debtors 86 314 77 637 86 314 77 637 Credit cards 11 416 9 755 11 416 9 755 Overdrafts 14 507 13 144 14 507 13 144 Term loans 101 001 91 502 101 001 91 502 Overnight loans 21 638 17 921 21 638 17 921 Other loans to clients 68 553 70 171 68 553 70 171 Preference shares and debentures 18 098 18 984 18 098 18 984 Factoring accounts 4 574 4 491 4 574 4 491 Deposits placed under reverse repurchase agreements 18 291 25 796 18 291 25 796 Trade, other bills and bankers' acceptances 288 41 288 41
Past due but not impaired 19 065 18 843 11 086 10 370 7 938 8 358 41 115 Mortgage loans1 8 968 9 123 5 747 5 740 3 198 3 372 23 11 Net finance lease and instalment debtors1 5 614 4 978 2 341 2 533 3 268 2 439 5 6 Credit cards 1 084 856 741 81 343 679 96 Overdrafts 920 989 843 633 64 354 13 2 Term loans 1 963 2 527 901 1 039 1 062 1 488 Overnight loans – 6 6 Other loans to clients1 219 159 216 133 3 26 Factoring accounts 297 205 297 205
subtotal 608 270 572 980 600 291 564 507 7 938 8 358 41 115
Defaulted 15 846 17 848 Mortgage loans1 7 608 8 663 Net finance lease and instalment debtors1 2 309 2 423 Credit cards 904 830
Properties in possession 596 772 Overdrafts 714 915 Term loans 3 211 3 499 Other loans to clients¹ 389 646 Factoring accounts 115 100
total loans and advances 624 116 590 828 1 2013 comparatives have been restated due to reclassifications of restructures in MFC as defaulted advances.

54
18 LOANS AND ADVANCES (continued)
18.7 Credit quality of loans and advances
rm
total nGr 1-12 nGr 13-20 nGr 21-25 np 1-3 unrated
2014 2013 2014 2013 2014 2013 2014 2013 2014 2013 2014 2013
Neither past due nor impaired 589 205 554 137 235 110 220 044 314 177 296 868 22 792 19 727 – – 17 126 17 498Mortgage loans 244 525 224 695 62 567 54 541 165 950 153 044 8 976 6 943 7 032 10 167Net finance lease and instalment debtors 86 314 77 637 4 391 4 958 72 841 66 036 6 929 4 902 2 153 1 741Credit cards 11 416 9 755 1 099 1 328 8 714 6 823 1 581 1 592 22 12Overdrafts 14 507 13 144 3 619 3 812 9 093 8 018 253 252 1 542 1 062Term loans 101 001 91 502 74 740 60 138 20 489 24 936 4 822 5 680 950 748Overnight loans 21 638 17 921 16 834 13 815 4 800 3 918 4 187 1Other loans to clients 68 553 70 171 42 962 43 853 22 676 22 594 227 171 2 688 3 553Preference shares and debentures 18 098 18 984 11 401 15 830 3 958 2 940 2 739 214Factoring accounts 4 574 4 491 143 280 4 431 4 211Deposits placed under reverse repurchase agreements 18 291 25 796 17 354 21 451 937 4 345Trade, other bills and bankers' acceptances 288 41 38 288 3
Past due but not impaired 19 065 18 843 11 1 3 064 3 252 15 649 14 637 26 471 315 482Mortgage loans¹ 8 968 9 123 2 1 1 471 1 245 7 363 7 530 2 195 130 152Net finance lease and instalment debtors¹ 5 614 4 978 731 1 114 4 760 3 679 9 139 114 46Credit cards 1 084 856 230 168 835 676 15 12 4Overdrafts 920 989 7 407 249 482 471 58 24 211Term loans 1 963 2 527 2 224 475 1 720 1 945 67 17 40Overnight loans – 6 6Other loans to clients¹ 219 159 1 1 192 125 26 33Factoring accounts 297 205 297 205
Defaulted 15 846 17 848 – – – – – 87 13 973 16 368 1 873 1 393Mortgage loans¹ 7 608 8 663 35 7 103 8 089 505 539Net finance lease and instalment debtors¹ 2 309 2 423 8 2 295 2 354 14 61Credit cards 904 830 1 902 829 2Properties in possession 596 772 596 772Overdrafts 714 915 33 679 875 35 7Term loans 3 211 3 499 10 2 546 3 484 665 5Other loans to clients1 389 646 333 637 56 9Factoring accounts 115 100 115 100
total loans and advances 624 116 590 828 235 121 220 045 317 241 300 120 38 441 34 451 13 999 16 839 19 314 19 3731 2013 comparatives have been restated due to reclassifications of restructures in MFC as defaulted advances.
The group uses a master rating scale for measuring credit risk, which measures borrower risk excluding the effect of collateral and any credit mitigation (ie probability of default only). The comprehensive probability of default rating scale, which is mapped to default probabilities and external rating agency scales, enables the group to measure credit risk consistently and accurately across its entire portfolio. A brief explanation of the scale follows:
NGR 21-25: Represents borrowers who are of higher risk. This category comprises higher-risk individuals or small businesses, as well as borrowers that were rated higher on inception, but have since migrated down the rating scale as a result of poor financial performance. However, the borrower has not defaulted and is continuing to make repayments.
NGR 1-12: Represents borrowers who demonstrate a strong capacity to meet financial obligations, and who have a negligible or low probability of default. This category comprises, but is not limited to, the group's large corporate clients, including financial institutions, parastatals and other government-related institutions.
NP 1-3: Represents clients who have defaulted. Where this rating appears in the 'past due but not impaired' category, the borrowers are continuing to make repayments against their obligation and are being closely monitored.
NGR 13-20: Represents borrowers who demonstrate a satisfactory ability to make payments and who have a low or moderate probability of default. This category comprises, but is not limited to, small and medium businesses, medium-sized corporate clients and individuals.
NOTES TO THE CONSOLIDATED FINANCIAL STATEMENTS (continued)for the year ended 31 December

NedbaNk Group
55
Consolidated and separate annual
finanCial statements
18 LOANS AND ADVANCES (continued)
18.7 Credit quality of loans and advances
rm
total nGr 1-12 nGr 13-20 nGr 21-25 np 1-3 unrated
2014 2013 2014 2013 2014 2013 2014 2013 2014 2013 2014 2013
Neither past due nor impaired 589 205 554 137 235 110 220 044 314 177 296 868 22 792 19 727 – – 17 126 17 498Mortgage loans 244 525 224 695 62 567 54 541 165 950 153 044 8 976 6 943 7 032 10 167Net finance lease and instalment debtors 86 314 77 637 4 391 4 958 72 841 66 036 6 929 4 902 2 153 1 741Credit cards 11 416 9 755 1 099 1 328 8 714 6 823 1 581 1 592 22 12Overdrafts 14 507 13 144 3 619 3 812 9 093 8 018 253 252 1 542 1 062Term loans 101 001 91 502 74 740 60 138 20 489 24 936 4 822 5 680 950 748Overnight loans 21 638 17 921 16 834 13 815 4 800 3 918 4 187 1Other loans to clients 68 553 70 171 42 962 43 853 22 676 22 594 227 171 2 688 3 553Preference shares and debentures 18 098 18 984 11 401 15 830 3 958 2 940 2 739 214Factoring accounts 4 574 4 491 143 280 4 431 4 211Deposits placed under reverse repurchase agreements 18 291 25 796 17 354 21 451 937 4 345Trade, other bills and bankers' acceptances 288 41 38 288 3
Past due but not impaired 19 065 18 843 11 1 3 064 3 252 15 649 14 637 26 471 315 482Mortgage loans¹ 8 968 9 123 2 1 1 471 1 245 7 363 7 530 2 195 130 152Net finance lease and instalment debtors¹ 5 614 4 978 731 1 114 4 760 3 679 9 139 114 46Credit cards 1 084 856 230 168 835 676 15 12 4Overdrafts 920 989 7 407 249 482 471 58 24 211Term loans 1 963 2 527 2 224 475 1 720 1 945 67 17 40Overnight loans – 6 6Other loans to clients¹ 219 159 1 1 192 125 26 33Factoring accounts 297 205 297 205
Defaulted 15 846 17 848 – – – – – 87 13 973 16 368 1 873 1 393Mortgage loans¹ 7 608 8 663 35 7 103 8 089 505 539Net finance lease and instalment debtors¹ 2 309 2 423 8 2 295 2 354 14 61Credit cards 904 830 1 902 829 2Properties in possession 596 772 596 772Overdrafts 714 915 33 679 875 35 7Term loans 3 211 3 499 10 2 546 3 484 665 5Other loans to clients1 389 646 333 637 56 9Factoring accounts 115 100 115 100
total loans and advances 624 116 590 828 235 121 220 045 317 241 300 120 38 441 34 451 13 999 16 839 19 314 19 3731 2013 comparatives have been restated due to reclassifications of restructures in MFC as defaulted advances.
The group uses a master rating scale for measuring credit risk, which measures borrower risk excluding the effect of collateral and any credit mitigation (ie probability of default only). The comprehensive probability of default rating scale, which is mapped to default probabilities and external rating agency scales, enables the group to measure credit risk consistently and accurately across its entire portfolio. A brief explanation of the scale follows:
NGR 21-25: Represents borrowers who are of higher risk. This category comprises higher-risk individuals or small businesses, as well as borrowers that were rated higher on inception, but have since migrated down the rating scale as a result of poor financial performance. However, the borrower has not defaulted and is continuing to make repayments.
NGR 1-12: Represents borrowers who demonstrate a strong capacity to meet financial obligations, and who have a negligible or low probability of default. This category comprises, but is not limited to, the group's large corporate clients, including financial institutions, parastatals and other government-related institutions.
NP 1-3: Represents clients who have defaulted. Where this rating appears in the 'past due but not impaired' category, the borrowers are continuing to make repayments against their obligation and are being closely monitored.
NGR 13-20: Represents borrowers who demonstrate a satisfactory ability to make payments and who have a low or moderate probability of default. This category comprises, but is not limited to, small and medium businesses, medium-sized corporate clients and individuals.

56
18 LOANS AND ADVANCES (continued)
18.8 Segmental analysis
Nedbank
Group Nedbank
Capital Nedbank Corporate
Total Nedbank Retail and Nedbank Business
Banking Nedbank
Retail Nedbank
Business Banking Nedbank
Wealth Rest of Africa
Division Centre
Rm 2014 2013 2014 2013 2014 2013 2014 2013 2014 2013 2014 2013 2014 2013 2014 2013 2014 2013
Mortgage loans 261 101 242 481 – – 101 805 86 603 135 345 134 315 102 873 102 629 32 472 31 686 20 038 18 210 4 364 3 804 (451) (451)Home loans 137 449 136 156 10 621 119 561 119 113 102 239 101 977 17 322 17 136 14 430 13 448 3 651 3 213 (203) (239)Commercial mortgages 123 652 106 325 101 795 85 982 15 784 15 202 634 652 15 150 14 550 5 608 4 762 713 591 (248) (212)
Net finance lease and instalment debtors 94 237 85 038 3 436 3 400 88 220 79 680 75 509 67 599 12 711 12 081 284 273 2 330 1 708 (33) (23)Credit cards 13 404 11 441 13 376 11 428 13 215 11 281 161 147 28 13Other loans and advances 255 374 251 868 105 942 110 046 95 456 86 182 40 874 42 333 19 066 22 181 21 808 20 152 4 665 3 767 7 531 9 362 906 178Properties in possession 596 772 388 498 176 258 167 242 9 16 32 16
Overdrafts 16 141 15 048 7 2 2 137 2 635 10 607 9 588 1 498 1 599 9 109 7 989 119 111 3 271 2 712Term loans 106 175 97 528 20 293 14 992 64 108 58 388 19 009 21 893 17 086 20 129 1 923 1 764 989 781 1 779 1 478 (3) (4)Personal loans 18 346 21 145 17 088 20 131 17 086 20 129 2 2 7 1 1 251 1 013Other term loans 87 829 76 383 20 293 14 992 64 108 58 388 1 921 1 762 1 921 1 762 982 780 528 465 (3) (4)
Overnight loans 21 638 17 927 20 513 17 265 607 695 1 607 694 518 469 (502) Other loans to clients 69 161 70 976 55 545 56 408 2 068 1 600 5 215 4 811 315 210 4 900 4 601 3 524 2 858 1 940 4 680 869 619
Foreign client lending 12 512 12 658 10 173 7 532 1 357 874 435 636 1 1 434 635 547 3 616Remittances in transit 195 237 (25) 5 15 2 158 63 151 70 7 (7) 3 47 164Other loans 56 454 58 081 45 397 48 871 696 724 4 622 4 112 163 139 4 459 3 973 3 524 2 855 1 346 900 869 619
Preference shares and debentures 18 098 18 984 11 523 12 845 6 242 5 758 269 292 269 292 1 1 23 23 40 65Factoring accounts 4 986 4 796 (5) 4 991 4 796 4 991 4 796Deposits placed under reverse repurchase agreements 18 291 25 796 18 291 25 796 – –Trade, other bills and bankers' acceptances 288 41 288 3 38 – –
Loans and advances before impairments 624 116 590 828 105 942 110 046 200 697 176 185 277 815 267 756 210 663 203 690 67 152 64 066 24 987 22 250 14 253 14 887 422 (296)
Impairment of advances (11 095) (11 456) (341) (497) (1 140) (911) (8 933) (9 536) (7 600) (8 255) (1 333) (1 281) (168) (168) (180) (187) (333) (157)
total loans and advances 613 021 579 372 105 601 109 549 199 557 175 274 268 882 258 220 203 063 195 435 65 819 62 785 24 819 22 082 14 073 14 700 89 (453)
Comprises: Loans and advances to clients 602 175 557 956 91 905 83 827 194 831 174 033 277 657 267 693 210 512 203 620 67 145 64 073 23 421 20 814 13 939 14 271 422 (2 682)
Loans and advances to banks 21 941 32 872 14 037 26 219 5 866 2 152 158 63 151 70 7 (7) 1 566 1 436 314 616 2 386
loans and advances before impairments 624 116 590 828 105 942 110 046 200 697 176 185 277 815 267 756 210 663 203 690 67 152 64 066 24 987 22 250 14 253 14 887 422 (296)
The 2013 comparative results for the segmental reporting have been restated. The Rest of Africa Division is now reported separately, and Central Management and Shared Services are collectively reported as the Centre. The restatement has had no effect on the group results and ratios, and only affects segment results and ratios.
NOTES TO THE CONSOLIDATED FINANCIAL STATEMENTS (continued)for the year ended 31 December

NedbaNk Group
57
Consolidated and separate annual
finanCial statements
18 LOANS AND ADVANCES (continued)
18.8 Segmental analysis
Nedbank
Group Nedbank
Capital Nedbank Corporate
Total Nedbank Retail and Nedbank Business
Banking Nedbank
Retail Nedbank
Business Banking Nedbank
Wealth Rest of Africa
Division Centre
Rm 2014 2013 2014 2013 2014 2013 2014 2013 2014 2013 2014 2013 2014 2013 2014 2013 2014 2013
Mortgage loans 261 101 242 481 – – 101 805 86 603 135 345 134 315 102 873 102 629 32 472 31 686 20 038 18 210 4 364 3 804 (451) (451)Home loans 137 449 136 156 10 621 119 561 119 113 102 239 101 977 17 322 17 136 14 430 13 448 3 651 3 213 (203) (239)Commercial mortgages 123 652 106 325 101 795 85 982 15 784 15 202 634 652 15 150 14 550 5 608 4 762 713 591 (248) (212)
Net finance lease and instalment debtors 94 237 85 038 3 436 3 400 88 220 79 680 75 509 67 599 12 711 12 081 284 273 2 330 1 708 (33) (23)Credit cards 13 404 11 441 13 376 11 428 13 215 11 281 161 147 28 13Other loans and advances 255 374 251 868 105 942 110 046 95 456 86 182 40 874 42 333 19 066 22 181 21 808 20 152 4 665 3 767 7 531 9 362 906 178Properties in possession 596 772 388 498 176 258 167 242 9 16 32 16
Overdrafts 16 141 15 048 7 2 2 137 2 635 10 607 9 588 1 498 1 599 9 109 7 989 119 111 3 271 2 712Term loans 106 175 97 528 20 293 14 992 64 108 58 388 19 009 21 893 17 086 20 129 1 923 1 764 989 781 1 779 1 478 (3) (4)Personal loans 18 346 21 145 17 088 20 131 17 086 20 129 2 2 7 1 1 251 1 013Other term loans 87 829 76 383 20 293 14 992 64 108 58 388 1 921 1 762 1 921 1 762 982 780 528 465 (3) (4)
Overnight loans 21 638 17 927 20 513 17 265 607 695 1 607 694 518 469 (502) Other loans to clients 69 161 70 976 55 545 56 408 2 068 1 600 5 215 4 811 315 210 4 900 4 601 3 524 2 858 1 940 4 680 869 619
Foreign client lending 12 512 12 658 10 173 7 532 1 357 874 435 636 1 1 434 635 547 3 616Remittances in transit 195 237 (25) 5 15 2 158 63 151 70 7 (7) 3 47 164Other loans 56 454 58 081 45 397 48 871 696 724 4 622 4 112 163 139 4 459 3 973 3 524 2 855 1 346 900 869 619
Preference shares and debentures 18 098 18 984 11 523 12 845 6 242 5 758 269 292 269 292 1 1 23 23 40 65Factoring accounts 4 986 4 796 (5) 4 991 4 796 4 991 4 796Deposits placed under reverse repurchase agreements 18 291 25 796 18 291 25 796 – –Trade, other bills and bankers' acceptances 288 41 288 3 38 – –
Loans and advances before impairments 624 116 590 828 105 942 110 046 200 697 176 185 277 815 267 756 210 663 203 690 67 152 64 066 24 987 22 250 14 253 14 887 422 (296)
Impairment of advances (11 095) (11 456) (341) (497) (1 140) (911) (8 933) (9 536) (7 600) (8 255) (1 333) (1 281) (168) (168) (180) (187) (333) (157)
total loans and advances 613 021 579 372 105 601 109 549 199 557 175 274 268 882 258 220 203 063 195 435 65 819 62 785 24 819 22 082 14 073 14 700 89 (453)
Comprises: Loans and advances to clients 602 175 557 956 91 905 83 827 194 831 174 033 277 657 267 693 210 512 203 620 67 145 64 073 23 421 20 814 13 939 14 271 422 (2 682)
Loans and advances to banks 21 941 32 872 14 037 26 219 5 866 2 152 158 63 151 70 7 (7) 1 566 1 436 314 616 2 386
loans and advances before impairments 624 116 590 828 105 942 110 046 200 697 176 185 277 815 267 756 210 663 203 690 67 152 64 066 24 987 22 250 14 253 14 887 422 (296)
The 2013 comparative results for the segmental reporting have been restated. The Rest of Africa Division is now reported separately, and Central Management and Shared Services are collectively reported as the Centre. The restatement has had no effect on the group results and ratios, and only affects segment results and ratios.
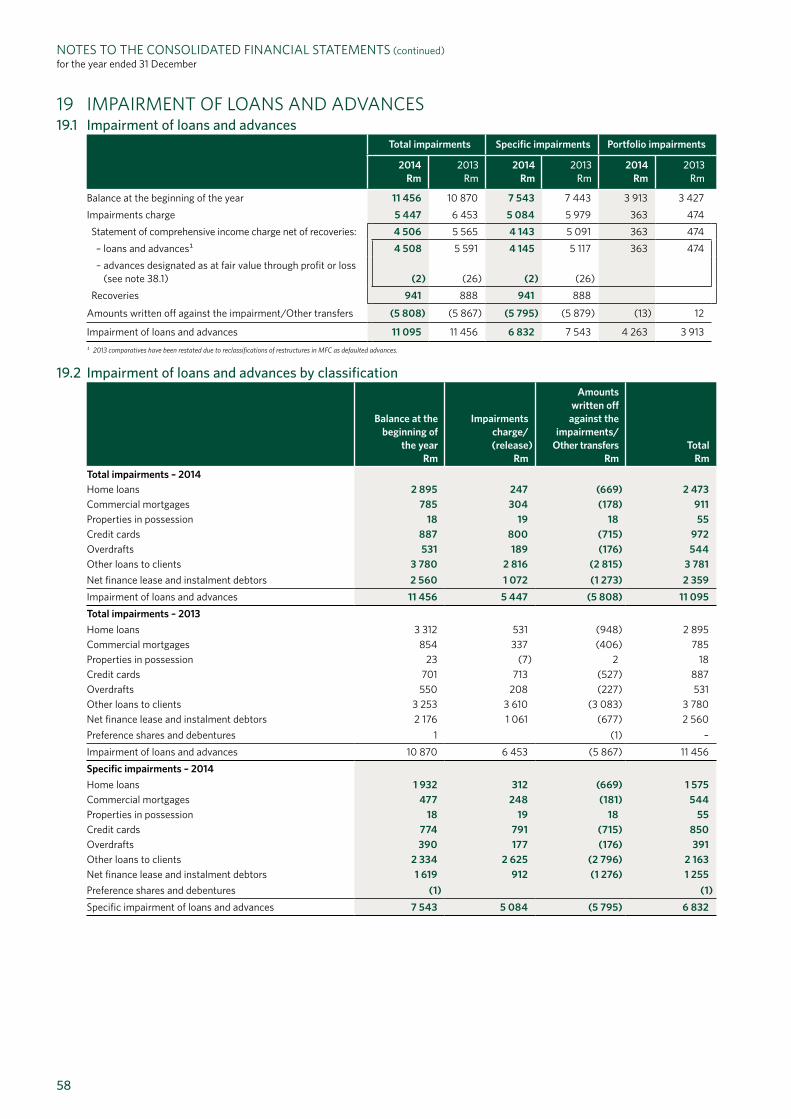
58
NOTES TO THE CONSOLIDATED FINANCIAL STATEMENTS (continued)for the year ended 31 December
19 IMPAIRMENT OF LOANS AND ADVANCES19.1 Impairment of loans and advances
total impairments specific impairments portfolio impairments
2014rm
2013Rm
2014rm
2013Rm
2014rm
2013Rm
Balance at the beginning of the year 11 456 10 870 7 543 7 443 3 913 3 427 Impairments charge 5 447 6 453 5 084 5 979 363 474 Statement of comprehensive income charge net of recoveries: 4 506 5 565 4 143 5 091 363 474 – loans and advances¹ 4 508 5 591 4 145 5 117 363 474 – advances designated as at fair value through profit or loss
(see note 38.1) (2) (26) (2) (26)Recoveries 941 888 941 888
Amounts written off against the impairment/Other transfers (5 808) (5 867) (5 795) (5 879) (13) 12
Impairment of loans and advances 11 095 11 456 6 832 7 543 4 263 3 913
¹ 2013 comparatives have been restated due to reclassifications of restructures in MFC as defaulted advances.
19.2 Impairment of loans and advances by classification
balance at thebeginning of
the yearrm
impairmentscharge/(release)
rm
amounts written off
against theimpairments/
other transfersrm
totalrm
total impairments – 2014Home loans 2 895 247 (669) 2 473Commercial mortgages 785 304 (178) 911Properties in possession 18 19 18 55Credit cards 887 800 (715) 972Overdrafts 531 189 (176) 544Other loans to clients 3 780 2 816 (2 815) 3 781Net finance lease and instalment debtors 2 560 1 072 (1 273) 2 359Impairment of loans and advances 11 456 5 447 (5 808) 11 095total impairments – 2013Home loans 3 312 531 (948) 2 895Commercial mortgages 854 337 (406) 785Properties in possession 23 (7) 2 18Credit cards 701 713 (527) 887Overdrafts 550 208 (227) 531Other loans to clients 3 253 3 610 (3 083) 3 780Net finance lease and instalment debtors 2 176 1 061 (677) 2 560Preference shares and debentures 1 (1) –Impairment of loans and advances 10 870 6 453 (5 867) 11 456specific impairments – 2014Home loans 1 932 312 (669) 1 575Commercial mortgages 477 248 (181) 544Properties in possession 18 19 18 55Credit cards 774 791 (715) 850Overdrafts 390 177 (176) 391Other loans to clients 2 334 2 625 (2 796) 2 163Net finance lease and instalment debtors 1 619 912 (1 276) 1 255Preference shares and debentures (1) (1)Specific impairment of loans and advances 7 543 5 084 (5 795) 6 832

NedbaNk Group
59
Consolidated and separate annual
finanCial statements
19.2 Impairment of loans and advances by classification (continued)
balance at thebeginning of
the yearrm
impairmentscharge/(release)
rm
amountswritten off
againstimpairments/
other transfersrm
totalrm
specific impairments – 2013Home loans 2 508 359 (935) 1 932Commercial mortgages 569 281 (373) 477Properties in possession 23 (7) 2 18Credit cards 604 697 (527) 774Overdrafts 414 203 (227) 390Other loans to clients 2 035 3 393 (3 094) 2 334Net finance lease and instalment debtors¹ 1 290 1 053 (724) 1 619Preference shares and debentures (1) (1)Specific impairment of loans and advances 7 443 5 979 (5 879) 7 543portfolio impairments – 2014Home loans 963 (65) 898Commercial mortgages 308 56 3 367Credit cards 113 9 122Overdrafts 141 12 153Other loans to clients 1 446 191 (19) 1 618Net finance lease and instalment debtors 941 160 3 1 104
Preference shares and debentures 1 1
Portfolio impairment of loans and advances 3 913 363 (13) 4 263
portfolio impairments – 2013Home loans 804 172 (13) 963Commercial mortgages 285 56 (33) 308Credit cards 97 16 113Overdrafts 136 5 141Other loans to clients 1 218 217 11 1 446Net finance lease and instalment debtors¹ 886 8 47 941
Preference shares and debentures 1 1
Portfolio impairment of loans and advances 3 427 474 12 3 913
¹ 2013 comparatives have been restated due to reclassifications of restructures in MFC as defaulted advances.

notes to the consolidated financial statements (continued)for the year ended 31 december
60
19 IMPAIRMENT OF LOANS AND ADVANCES (continued)
19.3 Sectoral analysistotal impairments specific impairments portfolio impairments
2014rm
2013 Rm
2014rm
2013 Rm
2014rm
2013 Rm
Individuals¹ 7 771 8 260 5 131 5 646 2 640 2 614 Financial services, insurance and real estate 1 326 978 498 428 828 550 Manufacturing 521 285 354 95 167 190 Building and property development 103 113 42 63 61 50 Transport, storage and communication 188 191 73 96 115 95 Retailers, catering and accommodation 34 51 7 6 27 45 Wholesale and trade 133 244 79 213 54 31 Mining and quarrying 160 195 47 132 113 63 Agriculture, forestry and fishing 47 165 19 142 28 23 Government and public sector 58 60 47 47 11 13
Other services 754 914 535 675 219 239
11 095 11 456 6 832 7 543 4 263 3 913
¹ 2013 comparatives have been restated due to reclassifications of restructures in MFC as defaulted advances.
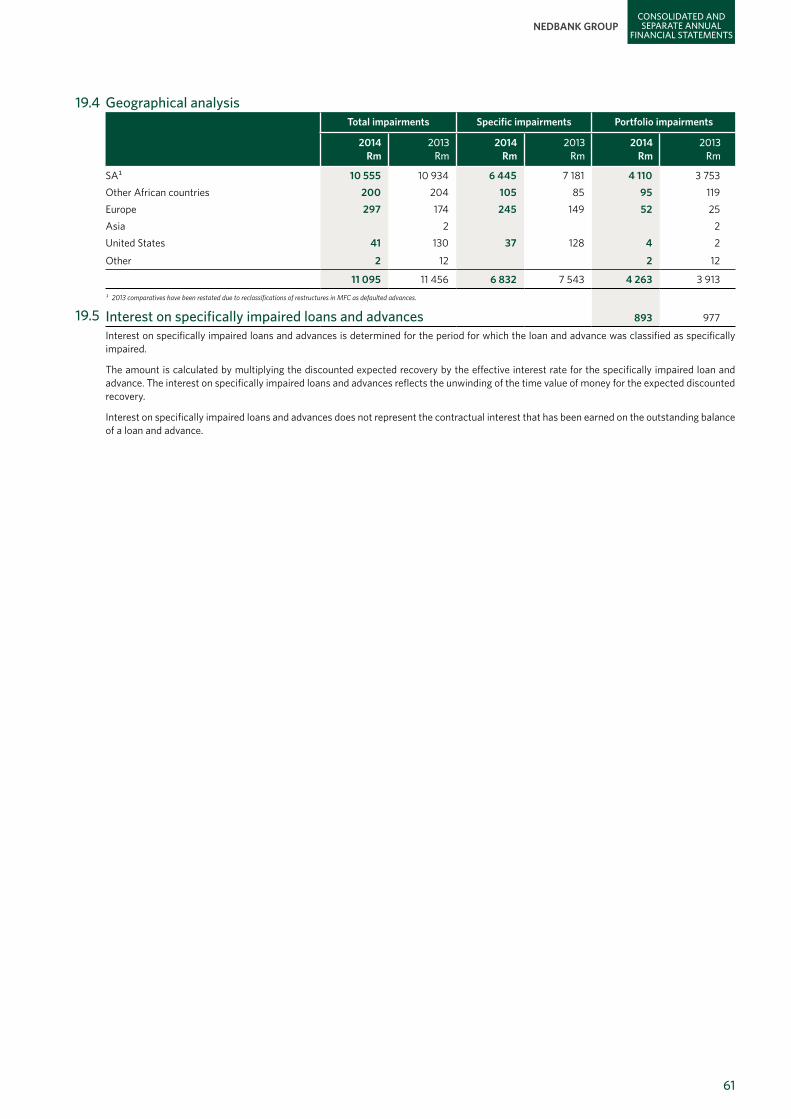
NedbaNk Group
61
Consolidated and separate annual
finanCial statements
19.4 Geographical analysistotal impairments specific impairments portfolio impairments
2014rm
2013 Rm
2014rm
2013 Rm
2014rm
2013 Rm
SA¹ 10 555 10 934 6 445 7 181 4 110 3 753 Other African countries 200 204 105 85 95 119 Europe 297 174 245 149 52 25 Asia 2 2 united States 41 130 37 128 4 2
Other 2 12 2 12
11 095 11 456 6 832 7 543 4 263 3 913
¹ 2013 comparatives have been restated due to reclassifications of restructures in MFC as defaulted advances.
19.5 Interest on specifically impaired loans and advances 893 977
Interest on specifically impaired loans and advances is determined for the period for which the loan and advance was classified as specifically impaired.
The amount is calculated by multiplying the discounted expected recovery by the effective interest rate for the specifically impaired loan and advance. The interest on specifically impaired loans and advances reflects the unwinding of the time value of money for the expected discounted recovery.
Interest on specifically impaired loans and advances does not represent the contractual interest that has been earned on the outstanding balance of a loan and advance.
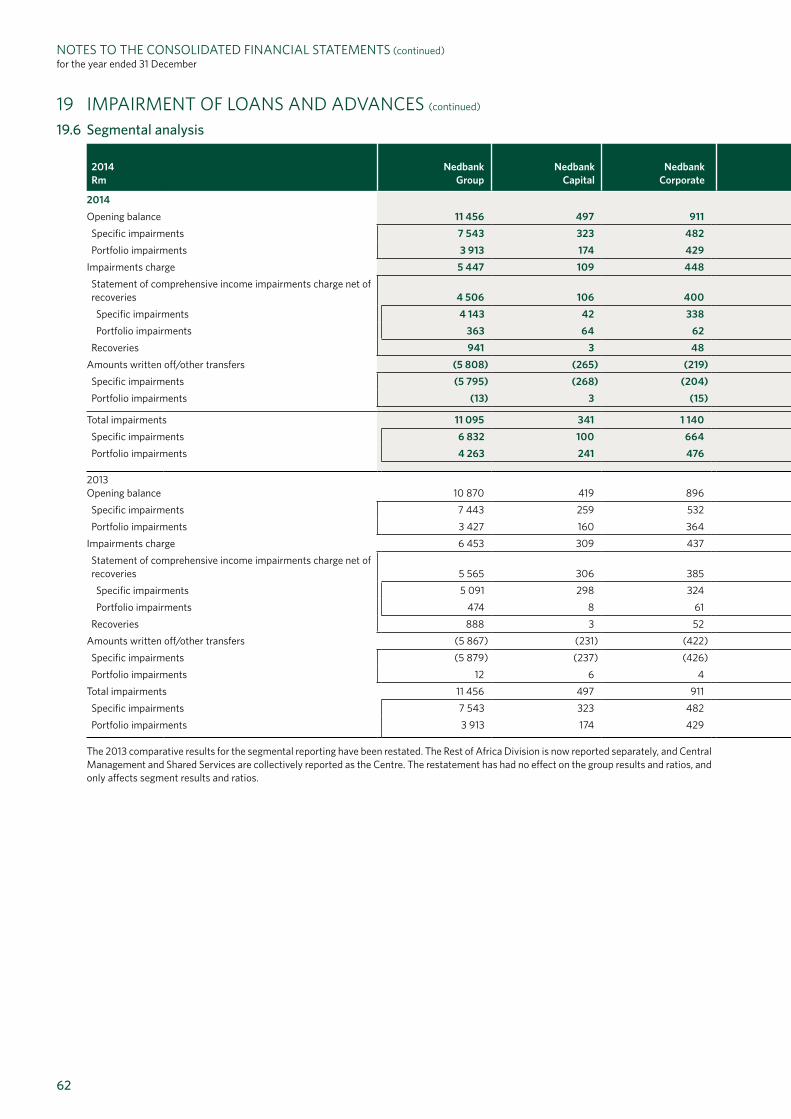
notes to the consolidated financial statements (continued)for the year ended 31 december
62
19 IMPAIRMENT OF LOANS AND ADVANCES (continued)
19.6 Segmental analysis
2014 rm
nedbank Group
nedbank Capital
nedbank Corporate
total nedbank retail and nedbank business
banking nedbank retailnedbank
business bankingnedbank
Wealthrest of africa
division Centre
2014Opening balance 11 456 497 911 9 536 8 255 1 281 168 187 157Specific impairments 7 543 323 482 6 528 5 693 835 141 85 (16)Portfolio impairments 3 913 174 429 3 008 2 562 446 27 102 173
Impairments charge 5 447 109 448 4 644 4 354 290 46 48 152Statement of comprehensive income impairments charge net of recoveries 4 506 106 400 3 771 3 500 271 41 35 153Specific impairments 4 143 42 338 3 681 3 494 187 43 36 3Portfolio impairments 363 64 62 90 6 84 (2) (1) 150
Recoveries 941 3 48 873 854 19 5 13 (1)Amounts written off/other transfers (5 808) (265) (219) (5 247) (5 009) (238) (46) (55) 24Specific impairments (5 795) (268) (204) (5 247) (5 009) (238) (46) (29) (1)Portfolio impairments (13) 3 (15) (26) 25
Total impairments 11 095 341 1 140 8 933 7 600 1 333 168 180 333Specific impairments 6 832 100 664 5 835 5 032 803 143 105 (15)Portfolio impairments 4 263 241 476 3 098 2 568 530 25 75 348
2013Opening balance 10 870 419 896 9 141 7 881 1 260 112 147 155Specific impairments 7 443 259 532 6 525 5 631 894 88 57 (18)Portfolio impairments 3 427 160 364 2 616 2 250 366 24 90 173
Impairments charge 6 453 309 437 5 582 5 134 448 63 60 2Statement of comprehensive income impairments charge net of recoveries 5 565 306 385 4 765 4 355 410 59 50Specific impairments 5 091 298 324 4 373 4 043 330 56 40Portfolio impairments 474 8 61 392 312 80 3 10
Recoveries 888 3 52 817 779 38 4 10 2Amounts written off/other transfers (5 867) (231) (422) (5 187) (4 760) (427) (7) (20)Specific impairments (5 879) (237) (426) (5 187) (4 760) (427) (7) (22)Portfolio impairments 12 6 4 – 2
Total impairments 11 456 497 911 9 536 8 255 1 281 168 187 157Specific impairments 7 543 323 482 6 528 5 693 835 141 85 (16)Portfolio impairments 3 913 174 429 3 008 2 562 446 27 102 173
The 2013 comparative results for the segmental reporting have been restated. The Rest of Africa Division is now reported separately, and Central Management and Shared Services are collectively reported as the Centre. The restatement has had no effect on the group results and ratios, and only affects segment results and ratios.
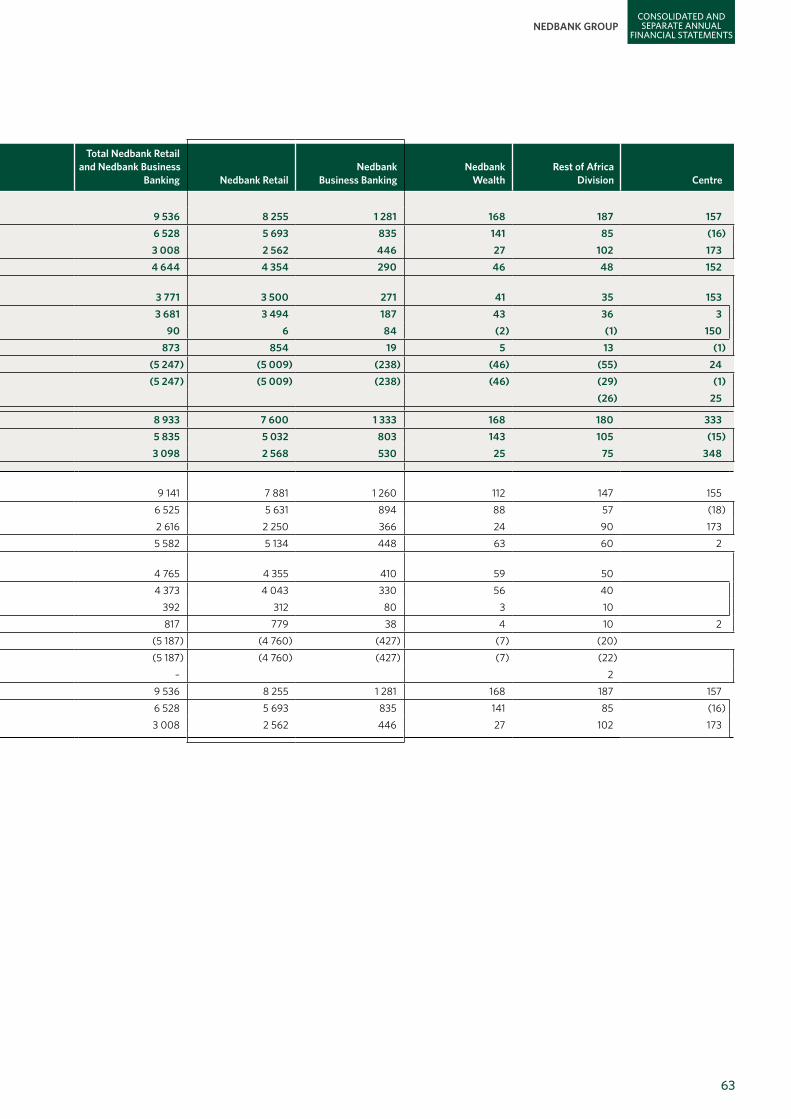
NedbaNk Group
63
Consolidated and separate annual
finanCial statements
19 IMPAIRMENT OF LOANS AND ADVANCES (continued)
19.6 Segmental analysis
2014 rm
nedbank Group
nedbank Capital
nedbank Corporate
total nedbank retail and nedbank business
banking nedbank retailnedbank
business bankingnedbank
Wealthrest of africa
division Centre
2014Opening balance 11 456 497 911 9 536 8 255 1 281 168 187 157Specific impairments 7 543 323 482 6 528 5 693 835 141 85 (16)Portfolio impairments 3 913 174 429 3 008 2 562 446 27 102 173
Impairments charge 5 447 109 448 4 644 4 354 290 46 48 152Statement of comprehensive income impairments charge net of recoveries 4 506 106 400 3 771 3 500 271 41 35 153Specific impairments 4 143 42 338 3 681 3 494 187 43 36 3Portfolio impairments 363 64 62 90 6 84 (2) (1) 150
Recoveries 941 3 48 873 854 19 5 13 (1)Amounts written off/other transfers (5 808) (265) (219) (5 247) (5 009) (238) (46) (55) 24Specific impairments (5 795) (268) (204) (5 247) (5 009) (238) (46) (29) (1)Portfolio impairments (13) 3 (15) (26) 25
Total impairments 11 095 341 1 140 8 933 7 600 1 333 168 180 333Specific impairments 6 832 100 664 5 835 5 032 803 143 105 (15)Portfolio impairments 4 263 241 476 3 098 2 568 530 25 75 348
2013Opening balance 10 870 419 896 9 141 7 881 1 260 112 147 155Specific impairments 7 443 259 532 6 525 5 631 894 88 57 (18)Portfolio impairments 3 427 160 364 2 616 2 250 366 24 90 173
Impairments charge 6 453 309 437 5 582 5 134 448 63 60 2Statement of comprehensive income impairments charge net of recoveries 5 565 306 385 4 765 4 355 410 59 50Specific impairments 5 091 298 324 4 373 4 043 330 56 40Portfolio impairments 474 8 61 392 312 80 3 10
Recoveries 888 3 52 817 779 38 4 10 2Amounts written off/other transfers (5 867) (231) (422) (5 187) (4 760) (427) (7) (20)Specific impairments (5 879) (237) (426) (5 187) (4 760) (427) (7) (22)Portfolio impairments 12 6 4 – 2
Total impairments 11 456 497 911 9 536 8 255 1 281 168 187 157Specific impairments 7 543 323 482 6 528 5 693 835 141 85 (16)Portfolio impairments 3 913 174 429 3 008 2 562 446 27 102 173
The 2013 comparative results for the segmental reporting have been restated. The Rest of Africa Division is now reported separately, and Central Management and Shared Services are collectively reported as the Centre. The restatement has had no effect on the group results and ratios, and only affects segment results and ratios.

notes to the consolidated financial statements (continued)for the year ended 31 december
64
20 OTHER ASSETS2014
rm2013
Rm
Sundry debtors and other accounts 6 620 5 412
Trading securities and spot positions 2 095 3 261
8 715 8 673
21 INVESTMENT SECuRITIESListed investments at market value 635 826 Private-equity portfolio 624 819 Other 11 7
unlisted investments at directors' valuation 3 228 3 390 Taquanta Asset Managers portfolio 424 421 Strate Ltd 51 43 Private-equity portfolio 1 194 1 506 Other 1 559 1 420
Total listed and unlisted investments 3 863 4 216
Listed policyholder investments at market value 11 576 11 088 Equities 193 219 Government, public and private sector stock 979 808 unit trusts 10 404 10 061
unlisted policyholder investments at directors’ valuation 4 658 4 133 Negotiable certificates of deposit, money market and other short-term funds 4 658 4 133
Net policyholder liabilities (68) (89)
Total policyholder investments 16 166 15 132
Total investment securities 20 029 19 348
22 SuMMARISED FINANCIAL INFORMATION OF INVESTMENTS IN PRIVATE EquITY ASSOCIATES, ASSOCIATE COMPANIES AND JOINT ARRANGEMENTS
profit/(loss) from continuing operations
posttax profit/(loss) from discontinued
operations other comprehensive
income/(loss) total comprehensive
income
2014rm
2013Rm
2014rm
2013Rm
2014rm
2013Rm
2014rm
2013Rm
Comprehensive income AssociatesBanking associates 3 489 (25) (1 048) 2 416 Private-equity associates (Manufacturing, industrial, leisure and other) 248 130 5 1 162 6 176 104 Private-equity associates (Property investment associates) 141 116 (4) 135 116 Other 77 117 (8) 70 136
Joint arrangements (4) (16)
3 951 347 (24) 1 (894) 6 2 797 356
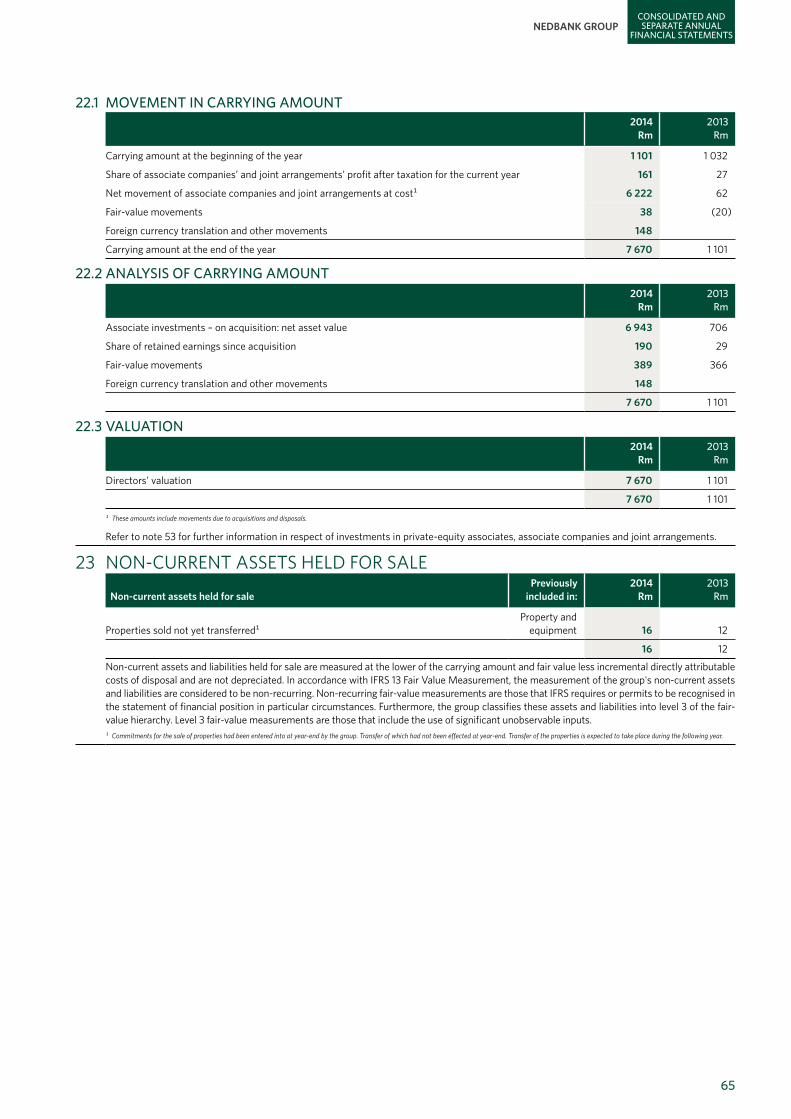
NedbaNk Group
65
Consolidated and separate annual
finanCial statements
22.1 MOVEMENT IN CARRYING AMOUNT2014
rm2013
Rm
Carrying amount at the beginning of the year 1 101 1 032
Share of associate companies’ and joint arrangements’ profit after taxation for the current year 161 27
Net movement of associate companies and joint arrangements at cost¹ 6 222 62
Fair-value movements 38 (20)
Foreign currency translation and other movements 148
Carrying amount at the end of the year 7 670 1 101
22.2 ANALYSIS OF CARRYING AMOUNT2014
rm2013
Rm
Associate investments – on acquisition: net asset value 6 943 706
Share of retained earnings since acquisition 190 29
Fair-value movements 389 366
Foreign currency translation and other movements 148
7 670 1 101
22.3 VALUATION2014
rm2013
Rm
Directors’ valuation 7 670 1 101
7 670 1 101
¹ These amounts include movements due to acquisitions and disposals.
Refer to note 53 for further information in respect of investments in private-equity associates, associate companies and joint arrangements.
23 NON-CuRRENT ASSETS HELD FOR SALE
non-current assets held for sale previously
included in: 2014
rm2013
Rm
Properties sold not yet transferred¹ Property and
equipment 16 12
16 12
Non-current assets and liabilities held for sale are measured at the lower of the carrying amount and fair value less incremental directly attributable costs of disposal and are not depreciated. In accordance with IFRS 13 Fair Value Measurement, the measurement of the group's non-current assets and liabilities are considered to be non-recurring. Non-recurring fair-value measurements are those that IFRS requires or permits to be recognised in the statement of financial position in particular circumstances. Furthermore, the group classifies these assets and liabilities into level 3 of the fair-value hierarchy. Level 3 fair-value measurements are those that include the use of significant unobservable inputs.¹ Commitments for the sale of properties had been entered into at year-end by the group. Transfer of which had not been effected at year-end. Transfer of the properties is expected to take place during the following year.
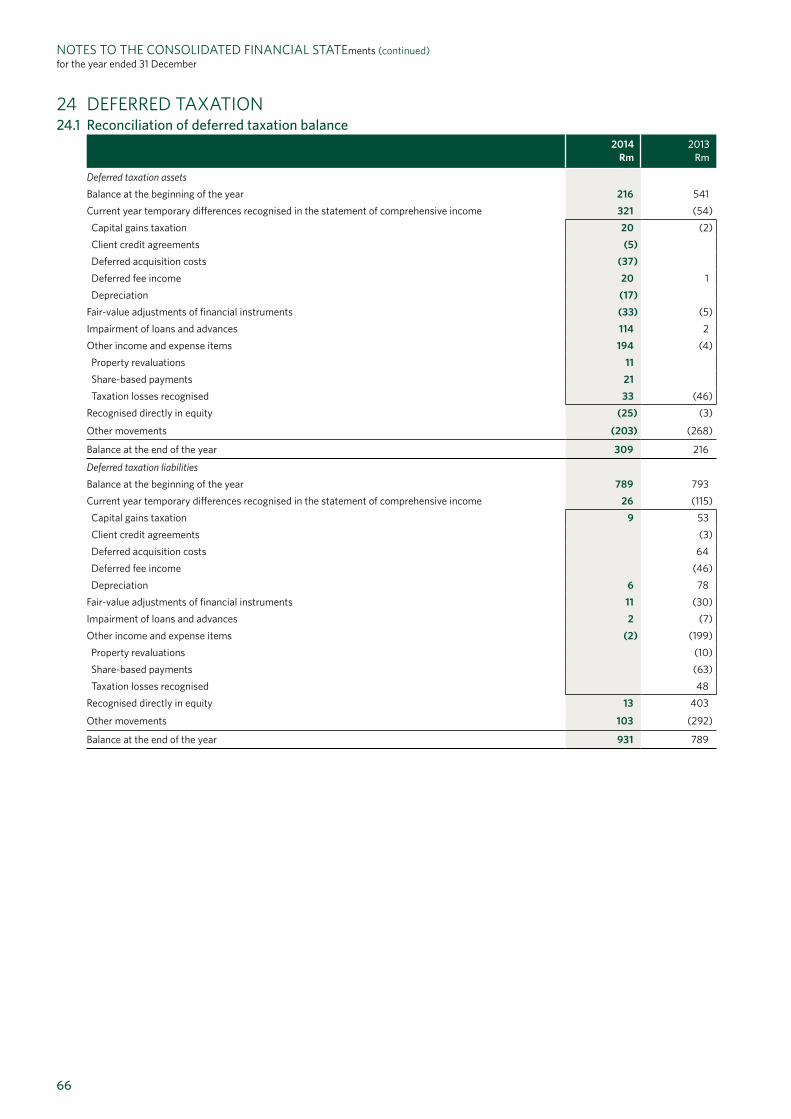
66
NOTES TO THE CONSOLIDATED FINANCIAL STATEments (continued)for the year ended 31 December
24 DEFERRED TAxATION24.1 Reconciliation of deferred taxation balance
2014rm
2013Rm
Deferred taxation assetsBalance at the beginning of the year 216 541 Current year temporary differences recognised in the statement of comprehensive income 321 (54)Capital gains taxation 20 (2)Client credit agreements (5)Deferred acquisition costs (37)Deferred fee income 20 1 Depreciation (17)
Fair-value adjustments of financial instruments (33) (5)Impairment of loans and advances 114 2 Other income and expense items 194 (4)Property revaluations 11 Share-based payments 21 Taxation losses recognised 33 (46)
Recognised directly in equity (25) (3)
Other movements (203) (268)
Balance at the end of the year 309 216
Deferred taxation liabilitiesBalance at the beginning of the year 789 793 Current year temporary differences recognised in the statement of comprehensive income 26 (115)Capital gains taxation 9 53 Client credit agreements (3)Deferred acquisition costs 64 Deferred fee income (46)Depreciation 6 78
Fair-value adjustments of financial instruments 11 (30)Impairment of loans and advances 2 (7)Other income and expense items (2) (199)Property revaluations (10)Share-based payments (63)Taxation losses recognised 48
Recognised directly in equity 13 403
Other movements 103 (292)
Balance at the end of the year 931 789

NedbaNk Group
67
Consolidated and separate annual
finanCial statements
24.2 Analysis of deferred taxation2014
rm2013
Rm
Deferred taxation assetsCapital gains taxation (184)Client credit agreements (16)Deferred acquisition costs (396)Deferred fee income 281 4 Depreciation (408)Fair-value adjustments of financial instruments 86 8 Impairment of loans and advances 1 253 15 Other income and expense items (9) 59 Property revaluations (434)Share-based payments (27)
Taxation losses 163 130
309 216
Deferred taxation liabilitiesCapital gains taxation 75 323 Client credit agreements 11 Deferred acquisition costs 358 Deferred fee income (257)Depreciation 28 419 Fair-value adjustments of financial instruments 64 (60)Impairment of loans and advances (6) (1 124)Other income and expense items 636 533 Property revaluations 134 532
Share-based payments 54
931 789
25 INVESTMENT PROPERTY25.1 Fair value
2014rm
2013Rm
Fair value at the beginning of the year 214 205 Acquisitions 4 Disposals (8)Effect of movements in foreign exchange rates 1 3 Transferred to non-current assets held for sale (note 23) (87)
Net profit from fair-value adjustments 6 6
Fair value at the end of the year 130 214

notes to the consolidated financial statements (continued)for the year ended 31 december
68
25 INVESTMENT PROPERTY (continued)
25.2 Fair value of investment propertyInvestment properties are freehold and are either held to earn rentals or for capital appreciation. Internal professional valuers perform valuations on an annual basis. External valuations are obtained once every three years on a rotational basis in accordance with the group's policies for the valuation of properties. The internal and external valuers are members or associates of the Institute of Valuers (SA) or a local equivalent in the case of foreign subsidiaries. The carrying amount of these properties is the fair value of property as determined by registered independent valuers who have recent experience in the location and category of the property being valued. In determining the fair value of these investment properties, the following factors were considered:
Type of property Valuation method Significant inputs Parameters2014
rm2013
Rm
Commercial property Discounted cashflow Income capitalisation rates 10,0% 8 98
Residential property
Average of market comparable sales, replacement cost and investment values Rate per square metre 122 116
Total investment properties measured at fair value 130 214
In accordance with IFRS 13 Fair Value Measurement, the measurement of the group's investment properties are considered to be recurring. Recurring fair-value measurements are those that IFRS requires or permits to be recognised in the statement of financial position at the end of each reporting period. Furthermore, the group classifies its investment properties into level 3 of the fair-value hierarchy. Level 3 fair-value measurements are those that include the use of significant unobservable inputs.
25.3 Rental income and operating expenses from investment property2014
rm2013
Rm
Rental income from investment property 15 23 Direct operating expense arising from investment property that generated rental income 23 36
25.4 Minimum contractual lease rental income from investment property2014 12
– 12
26 PROPERTY AND EquIPMENT
land buildings Computer equipment
furniture and other
equipment Vehicles total
2014rm
2013Rm
2014rm
2013Rm
2014rm
2013Rm
2014rm
2013Rm
2014rm
2013Rm
2014rm
2013Rm
Gross carrying amountBalance at 1 January 813 808 4 135 3 846 3 040 2 711 3 484 3 224 34 34 11 506 10 623 Acquisitions 3 3 188 94 746 451 772 466 5 7 1 714 1 021 Increases arising from revaluations¹ 104 7 176 345 280 352 Transfers to non-current assets held for sale (1) (3) (3) (5) (4) (8)Disposals (3) (15) (1) (552) (129) (202) (164) (5) (7) (774) (304)Writeoff of accumulated depreciation on revaluations (85) (132) (85) (132)Transfers to software (note 28) (13) (47) – (60)
Effect of movements in foreign exchange rates and other movements 1 1 1 1 3 7 2 5 1 8 14
Balance at 31 December 920 813 4 397 4 135 3 237 3 040 4 056 3 484 35 34 12 645 11 506
¹ Gains on property revaluations are recognised in profit or loss to the extent that they reverse a revaluation decrease of the same asset previously recognised in profit or loss.

NedbaNk Group
69
Consolidated and separate annual
finanCial statements
land buildings Computer equipment
furniture and other
equipment Vehicles total
2014rm
2013Rm
2014rm
2013Rm
2014rm
2013Rm
2014rm
2013Rm
2014rm
2013Rm
2014rm
2013Rm
accumulated depreciation and impairment lossesBalance at 1 January 392 406 2 257 2 015 2 017 1 783 22 21 4 688 4 225 Depreciation charge for the year 136 129 412 356 393 380 5 5 946 870 Writeoff of accumulated depreciation on revaluations (85) (132) (85) (132)Disposals (15) (1) (517) (118) (144) (144) (4) (5) (680) (268)Transfers to software (note 28) (10) (6) – (16)
Effect of movements in foreign exchange rates and other movements 3 4 1 4 (1) 1 3 9
Balance at 31 December – – 428 392 2 155 2 257 2 267 2 017 22 22 4 872 4 688
Carrying amount
At 1 January 813 808 3 743 3 440 783 696 1 467 1 441 12 13 6 818 6 398
At 31 December 920 813 3 969 3 743 1 082 783 1 789 1 467 13 12 7 773 6 818
Equipment (principally computer equipment, motor vehicles, fixtures and furniture) is stated at cost less accumulated depreciation and impairment losses. Land is recognised at the revalued amount, which is based on external valuations obtained every three years on a rotation basis for all properties in accordance with the group's accounting policy. The valuers are members or associates of the Institute of Valuers (SA) or a local equivalent in the case of foreign subsidiaries. An annual internal review is also done on those properties not subject to external valuation. The carrying amount of properties is the fair value as determined by the valuers less subsequent accumulated depreciation and impairment losses. Adjustments in the valuation of the properties are recorded in the revaluation reserve, which is amortised over the remaining useful life of the property. In determining the fair value of properties, the following factors are considered:
land buildings
type of property Valuation method significant inputs parameters2014
rm2013
Rm2014
rm2013
Rm
Commercial property Market comparable approach and discounted cashflow
Income capitalisation rates
11,5% – 13,5% (2013: 11,0% – 13,5%) 915 808 3 959 3 733
Residential property Market comparable Price per square metre 5 5 10 8
total land and buildings 920 813 3 969 3 741
In accordance with IFRS 13 Fair Value Measurement,the measurement of the group's properties are considered to be recurring. Recurring fair-value measurements are those that IFRS requires or permits to be recognised in the statement of financial position at the end of each reporting period. Furthermore, the group classifies its properties measured at fair value into level 3 of the fair-value hierarchy. Level 3 fair-value measurements are those that include the use of significant unobservable inputs.
In respect of certain properties there are restrictions of title in terms of regulatory restrictions such as servitudes. This does not have a material effect on the ability of the group to transfer these properties. No material plant and equipment have been pledged as security for liabilities.
If land and buildings were carried under the cost and not the revaluation model, the carrying amount would have been R2 477m (2013: R2 434m).
27 LONG-TERM EMPLOYEE BENEFITSThe group has a number of defined-benefit and defined-contribution plans in terms of which it provides pension, postretirement medical aid and long-term disability benefits to employees and their dependants on retirement, death or disability. All eligible employees and former employees are members of trustee-administered or underwritten schemes within the group, financed by company and employee contributions. All SA retirement plans are governed by the Pension Funds Act of 1956. The defined-benefit funds are actuarially valued using the projected-unit credit method. Any deficits are funded to ensure the ongoing financial soundness of the funds.
The benefits provided by the defined-benefit schemes are based on years of membership and/or salary levels. These benefits are provided from contributions by employees, the group, and income from the assets of these schemes. The benefits provided by the defined-contribution schemes are determined by the accumulated contributions and investment earnings.
At the dates of the latest valuations the defined-benefit plans were in a sound financial position in terms of section 16 of the Pensions Funds Act. During 1998 active members in the Nedgroup Pension Fund (defined-benefit) were granted a further option to transfer to one of the defined-contribution funds and approximately three-quarters of the then valuation surplus was allocated to members and pensioners.
The funds that constitute the assets and liabilities that the group has recognised in the statement of financial position in respect of its defined-benefit plans are listed below. The latest actuarial valuations were performed at 31 December 2014.
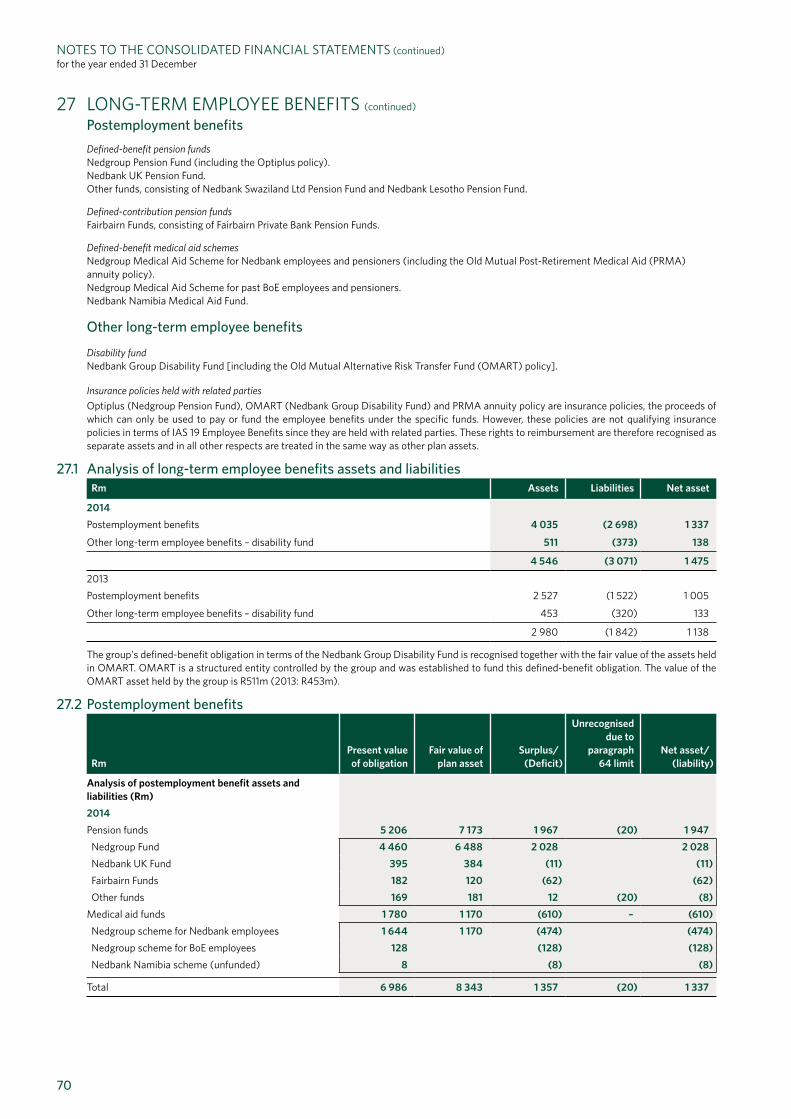
notes to the consolidated financial statements (continued)for the year ended 31 december
70
27 LONG-TERM EMPLOYEE BENEFITS (continued)
Postemployment benefitsDefined-benefit pension funds Nedgroup Pension Fund (including the Optiplus policy). Nedbank uK Pension Fund. Other funds, consisting of Nedbank Swaziland Ltd Pension Fund and Nedbank Lesotho Pension Fund.
Defined-contribution pension funds Fairbairn Funds, consisting of Fairbairn Private Bank Pension Funds.
Defined-benefit medical aid schemes Nedgroup Medical Aid Scheme for Nedbank employees and pensioners (including the Old Mutual Post-Retirement Medical Aid (PRMA) annuity policy). Nedgroup Medical Aid Scheme for past BoE employees and pensioners. Nedbank Namibia Medical Aid Fund.
Other long-term employee benefits
Disability fund Nedbank Group Disability Fund [including the Old Mutual Alternative Risk Transfer Fund (OMART) policy].
Insurance policies held with related partiesOptiplus (Nedgroup Pension Fund), OMART (Nedbank Group Disability Fund) and PRMA annuity policy are insurance policies, the proceeds of which can only be used to pay or fund the employee benefits under the specific funds. However, these policies are not qualifying insurance policies in terms of IAS 19 Employee Benefits since they are held with related parties. These rights to reimbursement are therefore recognised as separate assets and in all other respects are treated in the same way as other plan assets.
27.1 Analysis of long-term employee benefits assets and liabilitiesrm assets liabilities net asset
2014Postemployment benefits 4 035 (2 698) 1 337
Other long-term employee benefits – disability fund 511 (373) 138
4 546 (3 071) 1 475
2013Postemployment benefits 2 527 (1 522) 1 005
Other long-term employee benefits – disability fund 453 (320) 133
2 980 (1 842) 1 138
The group's defined-benefit obligation in terms of the Nedbank Group Disability Fund is recognised together with the fair value of the assets held in OMART. OMART is a structured entity controlled by the group and was established to fund this defined-benefit obligation. The value of the OMART asset held by the group is R511m (2013: R453m).
27.2 Postemployment benefits
rm present value
of obligation fair value of
plan asset surplus/
(deficit)
unrecognised due to
paragraph 64 limit
net asset/ (liability)
analysis of postemployment benefit assets and liabilities (rm)2014Pension funds 5 206 7 173 1 967 (20) 1 947 Nedgroup Fund 4 460 6 488 2 028 2 028 Nedbank uK Fund 395 384 (11) (11)Fairbairn Funds 182 120 (62) (62)Other funds 169 181 12 (20) (8)
Medical aid funds 1 780 1 170 (610) – (610)Nedgroup scheme for Nedbank employees 1 644 1 170 (474) (474)Nedgroup scheme for BoE employees 128 (128) (128)Nedbank Namibia scheme (unfunded) 8 (8) (8)
Total 6 986 8 343 1 357 (20) 1 337

NedbaNk Group
71
Consolidated and separate annual
finanCial statements
27.2 Postemployment benefits (continued)
rm present value
of obligation fair value of
plan asset surplus/
(deficit)
unrecognised due to
paragraph 64 limit
net asset/(liability)
2013Pension funds 4 917 6 625 1 708 (18) 1 690 Nedgroup Fund 4 267 6 017 1 750 1 750 Nedbank uK Fund 352 332 (20) (20)Fairbairn Funds 136 105 (31) (31)Other funds 162 171 9 (18) (9)
Medical aid funds 1 578 893 (685) – (685)Nedgroup scheme for Nedbank employees 1 481 893 (588) (588)Nedgroup scheme for BoE employees 90 (90) (90)Nedbank Namibia scheme (unfunded) 7 (7) (7)
Total 6 495 7 518 1 023 (18) 1 005
rm
pension andprovident
fundsmedical aid
funds total
present value of defined benefit obligation (rm)2014Balance at the beginning of the year 4 917 1 578 6 495 Current service cost 34 68 102 Interest cost 389 151 540 Contributions by plan participants 10 10 Actuarial losses 172 42 214 Benefits paid (336) (59) (395)
Impact of foreign currency exchange rate changes 20 20
Balance at the end of the year 5 206 1 780 6 986 2013Balance at the beginning of the year 4 890 1 591 6 481 Current service cost 32 65 97 Interest cost 317 133 450 Contributions by plan participants 10 10 Actuarial gains (158) (148) (306)Benefits paid (277) (63) (340)
Impact of foreign currency exchange rate changes 103 103
Balance at the end of the year 4 917 1 578 6 495 fair value of plan assets (rm)2014Balance at the beginning of the year 6 625 893 7 518 Expected return on plan assets 533 92 625 Actuarial gains/(losses) 294 (24) 270 Contributions by the employer 40 40 Contributions by plan participants 10 266 276 Benefits paid (335) (57) (392)Scheme-settled administration costs (11) (11)
Impact of foreign currency exchange rate changes 17 17
Balance at the end of the year 7 173 1 170 8 343 2013Balance at the beginning of the year 5 713 854 6 567 Expected return on plan assets 372 68 440 Actuarial gains 692 28 720 Contributions by the employer 32 32 Contributions by plan participants 10 10 Benefits paid (275) (57) (332)Scheme-settled administration costs (8) (8)
Impact of foreign currency exchange rate changes 89 89
Balance at the end of the year 6 625 893 7 518

notes to the consolidated financial statements (continued)for the year ended 31 december
72
27 LONG-TERM EMPLOYEE BENEFITS (continued)
27.2 Postemployment benefits
rm
pension andprovident
fundsmedical aid
funds total
net asset/(liability) recognised (rm)2014Present value of defined-benefit obligation (5 206) (1 780) (6 986)
Fair value of plan assets 7 173 1 170 8 343
Funded status 1 967 (610) 1 357
unrecognised due to paragraph 64 limit (20) (20)
1 947 (610) 1 337 Asset 4 035 4 035 Liability (2 088) (610) (2 698)
2013Present value of defined-benefit obligation (4 917) (1 578) (6 495)
Fair value of plan assets 6 625 893 7 518
Funded status 1 708 (685) 1 023
unrecognised due to paragraph 64 limit (18) (18)
1 690 (685) 1 005 Asset 2 527 2 527 Liability (837) (685) (1 522)
net (income)/expense recognised (rm)2014Current service cost 34 68 102 Interest cost (143) 59 (84)
Scheme-settled plan administration costs 11 11
(98) 127 29
2013Current service cost 32 65 97 Interest cost (54) 65 11
Scheme-settled plan administration costs 8 8
(14) 130 116
movements in net asset/(liability) recognised (rm)2014Balance at the beginning of the year 1 690 (685) 1 005 Net income/(expense) recognised in the statement of comprehensive income 98 (127) (29)Net remeasurements – credit/(debit) for the year 122 (67) 55 Contributions paid by the employer 40 269 309
Impact of foreign currency exchange rate changes (3) (3)
Balance at the end of the year 1 947 (610) 1 337
2013Balance at the beginning of the year 814 (737) 77 Net income/(expense) recognised in the statement of comprehensive income 14 (130) (116)Net remeasurements – credit/(debit) for the year 842 175 1 017 Contributions paid by the employer 32 7 39
Impact of foreign currency exchange rate changes (12) (12)
Balance at the end of the year 1 690 (685) 1 005
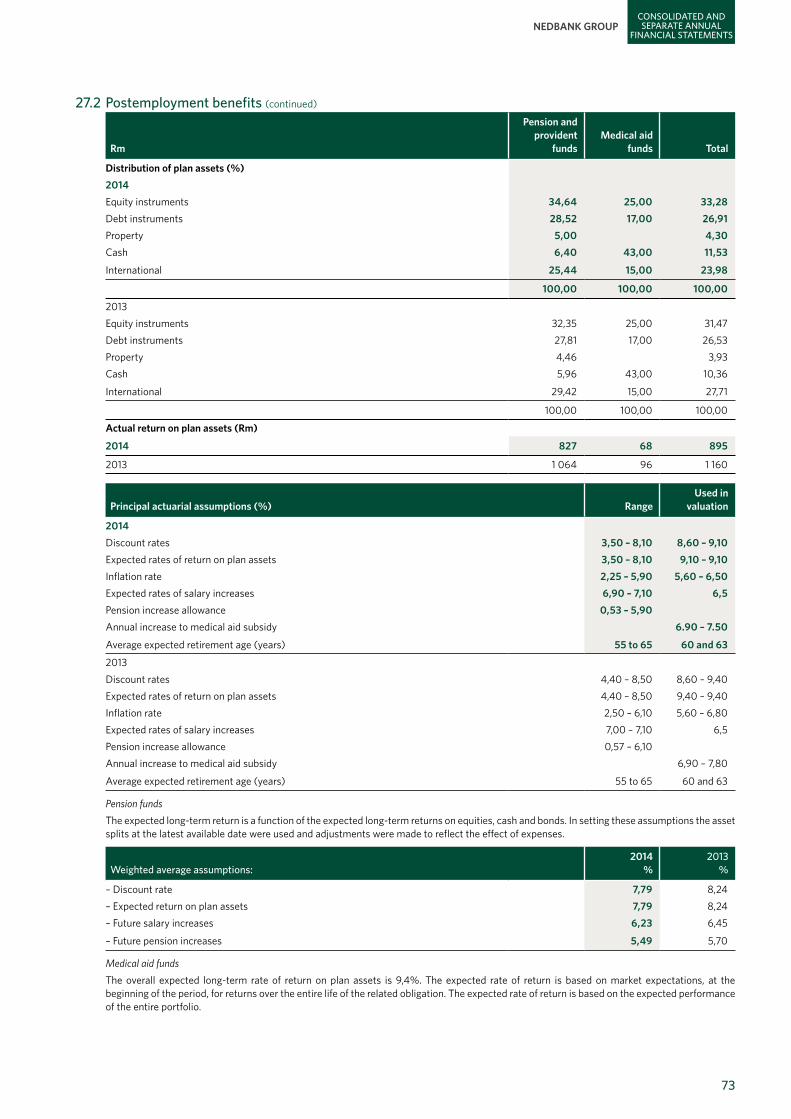
NedbaNk Group
73
Consolidated and separate annual
finanCial statements
27.2 Postemployment benefits (continued)
rm
pension andprovident
fundsmedical aid
funds total
distribution of plan assets (%)2014Equity instruments 34,64 25,00 33,28 Debt instruments 28,52 17,00 26,91 Property 5,00 4,30 Cash 6,40 43,00 11,53
International 25,44 15,00 23,98
100,00 100,00 100,00
2013Equity instruments 32,35 25,00 31,47 Debt instruments 27,81 17,00 26,53 Property 4,46 3,93 Cash 5,96 43,00 10,36
International 29,42 15,00 27,71
100,00 100,00 100,00
actual return on plan assets (rm)
2014 827 68 895
2013 1 064 96 1 160
principal actuarial assumptions (%) range used in
valuation
2014Discount rates 3,50 – 8,10 8,60 – 9,10 Expected rates of return on plan assets 3,50 – 8,10 9,10 – 9,10 Inflation rate 2,25 – 5,90 5,60 – 6,50 Expected rates of salary increases 6,90 – 7,10 6,5 Pension increase allowance 0,53 – 5,90 Annual increase to medical aid subsidy 6.90 – 7.50
Average expected retirement age (years) 55 to 65 60 and 63
2013Discount rates 4,40 – 8,50 8,60 – 9,40 Expected rates of return on plan assets 4,40 – 8,50 9,40 – 9,40 Inflation rate 2,50 – 6,10 5,60 – 6,80 Expected rates of salary increases 7,00 – 7,10 6,5 Pension increase allowance 0,57 – 6,10 Annual increase to medical aid subsidy 6,90 – 7,80
Average expected retirement age (years) 55 to 65 60 and 63
Pension fundsThe expected long-term return is a function of the expected long-term returns on equities, cash and bonds. In setting these assumptions the asset splits at the latest available date were used and adjustments were made to reflect the effect of expenses.
Weighted average assumptions:2014
%2013
%
– Discount rate 7,79 8,24– Expected return on plan assets 7,79 8,24– Future salary increases 6,23 6,45
– Future pension increases 5,49 5,70
Medical aid fundsThe overall expected long-term rate of return on plan assets is 9,4%. The expected rate of return is based on market expectations, at the beginning of the period, for returns over the entire life of the related obligation. The expected rate of return is based on the expected performance of the entire portfolio.

notes to the consolidated financial statements (continued)for the year ended 31 december
74
27 LONG-TERM EMPLOYEE BENEFITS (continued)
27.2 Postemployment benefitsexperience adjustments on present value of defined-benefit obligation for past five years
principal actuarial assumptions (%) range used in
valuation
2014 (42) (42)
2013 148 148 2012 23 18 41 2011 (104) (153) (257)2010 14 (48) (34)
2009 190 (98) 92
experience adjustments on fair value of plan assets for past five years
2014 (24) (24)
2013 28 28 2012 18 18 2011 (34) (2) (36)2010 95 (10) 85
2009 188 27 215
estimate of future contributions
Contributions expected for ensuing year 36 36
fund surplus/(deficit) for past five years
present value of obligation
fair value of plan asset
surplus/(deficit)
pension funds
2014 5 206 7 173 1 967
2013 4 917 6 625 1 708 2012 4 890 5 713 823 2011 4 281 5 183 902 2010 3 985 4 965 980
2009 3 510 4 694 1 184
medical aid funds
2014 1 780 1 170 (610)
2013 1 578 893 (685)2012 1 591 854 (737)2011 1 489 830 (659)2010 1 229 810 (419)
2009 1 092 790 (302)
effect of 1% change in assumed medical cost trend rates (rm)
2014 2013
1% increase – effect on current service cost and interest cost 50 37 1% increase – effect on accumulated benefit obligation 275 229 1% decrease – effect on current service cost and interest cost (20) (29)
1% decrease – effect on accumulated benefit obligation (223) (186)

NedbaNk Group
75
Consolidated and separate annual
finanCial statements
28 INTANGIBLE ASSETS
rm Goodwill software
software development
costs
Client relationships,
contractual rights and
other total
2014CostBalance at the beginning of the year 6 603 6 996 958 641 15 198 Acquisitions 257 809 1 066 Development costs commissioned to software 766 (766) –Impairment losses (33) (38) (71)Disposals and retirements (213) (213)
Foreign currency translation and other movements 15 2 17
Balance at the end of the year 6 618 7 775 963 641 15 997
accumulated amortisationBalance at the beginning of the year 1 477 5 012 136 283 6 908 Amortisation charge 655 64 719 Disposals and retirements (211) (211)
Foreign currency translation and other movements 2 2
Balance at the end of the year 1 477 5 458 136 347 7 418
Carrying amount
At the beginning of the year 5 126 1 984 822 358 8 290
At the end of the year 5 141 2 317 827 294 8 579
2013CostBalance at the beginning of the year 6 518 6 010 1 006 641 14 175 Acquisitions 2 273 683 958 Development costs commissioned to software 669 (669) –Impairment losses (5) (62) (67)Transfers to non-current assets held for sale (note 32) –Disposals and retirements (18) (18)Transfers from property and equipment (note 35) 60 60
Foreign currency translation and other movements 83 7 90
Balance at the end of the year 6 603 6 996 958 641 15 198
accumulated amortisation Balance at the beginning of the year 1 477 4 424 134 218 6 253 Amortisation charge 584 64 648 Transfers to non-current assets held for sale –Disposals and retirements (17) (17)Transfers from property and equipment (note 35) 16 16
Foreign currency translation and other movements 5 2 1 8
Balance at the end of the year 1 477 5 012 136 283 6 908
Carrying amount
At the beginning of the year 5 041 1 586 872 423 7 922
At the end of the year 5 126 1 984 822 358 8 290

notes to the consolidated financial statements (continued)for the year ended 31 december
76
28 INTANGIBLE ASSETS28.1 Analysis of goodwill
2014 2013
rm Cost
accumulated impairment
losses Carrying amount Cost
Accumulated impairment
losses Carrying
amount
Original subsidiary companiesNedbank Private Wealth Ltd (Isle of Man)/Nedgroup Trust Ltd (Guernsey) 547 (138) 409 532 (138) 394 Peoples Mortgage Ltd 198 (198) – 198 (198) –IBL Asset Finance and Services Ltd 285 (25) 260 285 (25) 260 Nedbank Limited 3 938 (1 114) 2 824 3 938 (1 114) 2 824 Old Mutual Bank 206 206 206 206 Nedgroup Private Wealth (Pty) Ltd 725 725 725 725 Nedgroup Life Assurance Company Ltd 401 401 401 401 Nedbank Namibia Ltd 136 (2) 134 136 (2) 134 Capital One 82 82 82 82 American Express 81 81 81 81
Visigro Investments (Pty) Ltd 19 19 19 19
6 618 (1 477) 5 141 6 603 (1 477) 5 126
Goodwill is allocated to individual CGus based on business activity. Impairment testing is done on a regular basis by comparing the net carrying value of the CGus to the estimated value in use. The value in use is determined by discounting estimated future cashflows of each CGu. The discounted cashflow calculations have been performed using Nedbank’s cost of equity, which is calculated using the Capital Asset Pricing Model. No impairments resulting from impairment testing have been effected for the reporting periods presented. Management regards the useful lives of all CGus to be indefinite. See note 3 for key assumptions used when assessing goodwill impairment.
The value in use of the various CGus were based on the following assumptions:
2014 2013
Risk-free rate range (%) 1,72 – 7,98 2,94 – 8,23Beta range 0,21 – 1,53 0,15 – 2,00Equity Risk Premium (%) 6,00 6,00Terminal growth rate range (%) 0,00 – 5,80 0,00 – 5,00Cashflow projection (years) 3 3
Discount rate range (%) 9,08 – 13,29 9,06 – 14,94
2014rm
2013Rm
Geographical split is based on the area in which the CGu operates:SA 4 598 4 598 Rest of Africa 134 134
Rest of world 409 394
5 141 5 126
The value in use is estimated as follows:SA 192 898 189 598 Rest of Africa 6 108 3 523
Rest of world 1 306 768
200 312 193 889
Net estimated recoverable amounts:SA 188 300 184 999 Rest of Africa 5 974 3 390
Rest of world 897 374
195 171 188 763

NedbaNk Group
77
Consolidated and separate annual
finanCial statements
29 SHARE CAPITAL29.1 Ordinary share capital
2014rm
2013Rm
Authorised
600 000 000 (2013: 600 000 000) ordinary shares of R1 each 600 600
Issued499 257 807 (2013: 510 302 393) fully paid ordinary shares of R1 each 499 510
Treasury shares arising from share repurchases by subsidiaries of 33 614 889 (2013: 49 108 934) fully paid ordinary shares of R1 each (33) (49)
466 461
Subject to the restrictions imposed by the Companies Act, 71 of 2008 (as amended), the unissued shares are under the control of the directors until the forthcoming annual general meeting.
The treasury shares held are used mainly for the purpose of fulfilling the options and share awards outstanding in terms of the share schemes (for both employees and third parties).
29.2 Preference share capital and premiumNedbank Limited preference share capital and premium
Authorised1 000 000 000 (2013: 1 000 000 000) non-redeemable non-cumulative preference shares of R0,001 each 1 15 000 Class A redeemable cumulative preference shares of R0,0001 each ¹ ¹
5 000 Class B redeemable cumulative preference shares of R0,0001 each ¹ ¹
Issued358 277 491 (2013: 358 277 491) non-redeemable non-cumulative preference shares of R0,001 each ¹ ¹100 Class “A” redeemable cumulative preference shares of R0,0001 each ¹ ¹100 Class “B” redeemable cumulative preference shares of R0,0001 each ¹ ¹Preference share premium 3 561 3 561
Treasury shares arising from share repurchases by subsidiaries of Rnil (2013: 8 797 290) preference shares, including the share premium. (88)
3 561 3 473¹ Represents amounts less than R1m.
The preference shares are classified as equity instruments by Nedbank Limited (the company) and have therefore been classified as non-controlling interest in the consolidated financial statements.
Each preference share confers on the holder the right to capital of the company in the form of a cash dividend prior to payment of dividends to any other class of shareholder. The rate is limited to 83,33% of the prevailing prime rate on a deemed value of R10 and is never compounded. The dividends, if declared, accrue half-yearly on 30 June and 31 December and are payable within 120 days of these dates respectively.
If a preference dividend is not declared, the dividend will not accumulate and will never become payable by the company, whether in preference to payments to any other class of share or otherwise.
Each preference share confers on the holder the right to a return of capital on the winding up of the company prior to any payment to any other class of share, but holders are not entitled to any further participation in the profits, assets or any surplus assets of the company in such circumstances.
The holders of this class of share are not entitled to be present or vote (even by proxy) at any meeting of the company, except when a declared dividend or part thereof remains in arrears and unpaid after six months from the due date or a resolution is proposed that directly affects the rights attached to the preference share or the interests of the holder, including resolutions to wind up the company or in the reduction of its share capital.
At every general meeting where the preference shareholder is entitled to vote, the voting rights are restricted to the holder's nominal value in proportion to the total nominal value of all shares issued by the company.
No shares in the capital of the company, in priority to the preference shares, can be created or issued without prior sanction of the holders of preference shares by way of a resolution passed at a separate class meeting properly constituted in terms of the provisions set out in the articles of association.

notes to the consolidated financial statements (continued)for the year ended 31 december
78
30 AMOuNTS OWED TO DEPOSITORS30.1 Classifications
2014rm
2013Rm
Current accounts 65 170 58 704Savings deposits 25 386 22 631Other deposits and loan accounts 449 705 407 593Call and term deposits 257 634 237 393Fixed deposits 42 800 38 289Cash management deposits 60 820 56 571Other deposits and loan accounts 88 451 75 340
Foreign currency liabilities 30 153 14 309Negotiable certificates of deposit 70 377 87 457
Deposits received under repurchase agreements¹ 12 659 12 258
653 450 602 952
Comprises:– Amounts owed to depositors 604 294 557 645
– Amounts owed to banks 49 156 45 307
653 450 602 952
Deposit products include current accounts, savings accounts, call and notice deposits, fixed deposits and negotiable certificates of deposit. Term deposits vary from six months to five years in both the wholesale and retail markets.
Foreign currency liabilities are either matched by advances to clients or hedged against exchange rate fluctuations.
See note 30.4 for a breakdown of amounts owed to depositors by operating segment.
¹ Government and other securities (note 17) and negotiable certificates of deposit (note 15) amounting to R11 827m (2013: R12 258m) have been pledged as collateral for deposits received under repurchase agreements. These amounts represent assets that have been transferred but that do not qualify for derecognition under IAS 39.

NedbaNk Group
79
Consolidated and separate annual
finanCial statements
30.2 Sectoral analysis2014
rm2013
Rm
Banks 49 156 45 307Government and public sector 47 057 47 359Individuals 163 056 148 580
Business sector 394 181 361 706
653 450 602 952
30.3 Geographical analysisSA 604 784 563 050Rest of Africa 18 858 15 710Europe 28 098 21 017Asia 1 315 803
united States 395 2 372
653 450 602 952

notes to the consolidated financial statements (continued)for the year ended 31 december
80
30.4 Segmental analysis
nedbank Group nedbank Capital nedbank Corporatetotal nedbank retail and
nedbank business banking nedbank retailnedbank business
banking nedbank Wealthrest of africa
division Centre
rm 2014 2013 2014 2013 2014 2013 2014 2013 2014 2013 2014 2013 2014 2013 2014 2013 2014 2013
Current accounts 65 170 58 704 665 602 4 728 3 278 54 321 49 854 32 111 29 622 22 210 20 232 1 375 1 195 3 999 3 695 82 80Savings deposits 25 386 22 631 3 3 9 244 9 019 8 992 8 778 252 241 15 309 12 867 830 734 8Other deposits and loan accounts 449 705 407 593 102 075 86 278 172 633 167 172 157 289 140 242 76 514 69 043 80 775 71 199 9 438 7 642 8 274 6 578 (4) (319)Call and term deposits 257 634 237 393 9 200 7 511 115 426 113 394 120 818 106 807 47 613 41 776 73 205 65 031 8 658 7 270 3 816 2 870 (284) (459)Fixed deposits 42 800 38 289 8 914 6 215 3 235 2 869 28 538 27 216 27 397 26 091 1 141 1 125 180 149 1 933 1 840Cash management deposits 60 820 56 571 110 261 53 639 50 635 5 666 4 610 12 18 5 654 4 592 598 219 798 629 9 217Other deposits and loan accounts 88 451 75 340 83 851 72 291 333 274 2 267 1 609 1 492 1 158 775 451 2 4 1 727 1 239 271 (77)
Foreign currency liabilities 30 153 14 309 21 908 5 199 4 645 5 781 3 249 2 813 517 488 2 732 2 325 351 516Negotiable certificates of deposit 70 377 87 457 160 2 398 – – 3 528 2 883 66 689 82 176
Deposits received under repurchase agreements 12 659 12 258 12 583 11 749 – – 76 509
Amounts owed to depositors 653 450 602 952 137 391 106 226 182 009 176 234 224 103 201 928 118 134 107 931 105 969 93 997 26 122 21 704 17 058 14 406 66 767 82 454
Comprises:– Amounts owed to clients 604 294 557 645 96 588 66 298 179 161 172 125 223 543 201 560 117 583 107 569 105 960 93 991 26 122 21 704 15 363 13 513 63 517 82 445
– Amounts owed to banks 49 156 45 307 40 803 39 928 2 848 4 109 560 368 551 362 9 6 1 695 893 3 250 9
Total amounts owed to depositors 653 450 602 952 137 391 106 226 182 009 176 234 224 103 201 928 118 134 107 931 105 969 93 997 26 122 21 704 17 058 14 406 66 767 82 454
The 2013 comparative results for the segmental reporting have been restated. The Rest of Africa Division is now reported separately, and Central Management and Shared Services are collectively reported as the Centre. The restatement has had no effect on the group results and ratios, and only affects segment results and ratios.
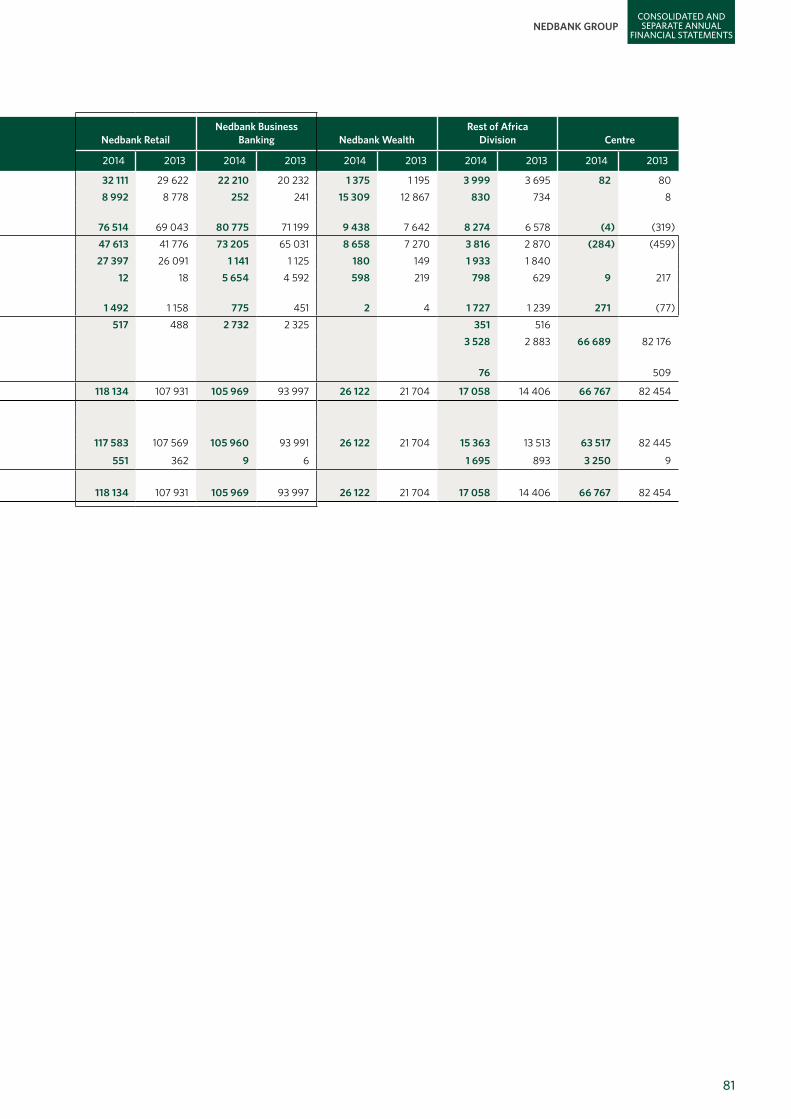
NedbaNk Group
81
Consolidated and separate annual
finanCial statements
30.4 Segmental analysis
nedbank Group nedbank Capital nedbank Corporatetotal nedbank retail and
nedbank business banking nedbank retailnedbank business
banking nedbank Wealthrest of africa
division Centre
rm 2014 2013 2014 2013 2014 2013 2014 2013 2014 2013 2014 2013 2014 2013 2014 2013 2014 2013
Current accounts 65 170 58 704 665 602 4 728 3 278 54 321 49 854 32 111 29 622 22 210 20 232 1 375 1 195 3 999 3 695 82 80Savings deposits 25 386 22 631 3 3 9 244 9 019 8 992 8 778 252 241 15 309 12 867 830 734 8Other deposits and loan accounts 449 705 407 593 102 075 86 278 172 633 167 172 157 289 140 242 76 514 69 043 80 775 71 199 9 438 7 642 8 274 6 578 (4) (319)Call and term deposits 257 634 237 393 9 200 7 511 115 426 113 394 120 818 106 807 47 613 41 776 73 205 65 031 8 658 7 270 3 816 2 870 (284) (459)Fixed deposits 42 800 38 289 8 914 6 215 3 235 2 869 28 538 27 216 27 397 26 091 1 141 1 125 180 149 1 933 1 840Cash management deposits 60 820 56 571 110 261 53 639 50 635 5 666 4 610 12 18 5 654 4 592 598 219 798 629 9 217Other deposits and loan accounts 88 451 75 340 83 851 72 291 333 274 2 267 1 609 1 492 1 158 775 451 2 4 1 727 1 239 271 (77)
Foreign currency liabilities 30 153 14 309 21 908 5 199 4 645 5 781 3 249 2 813 517 488 2 732 2 325 351 516Negotiable certificates of deposit 70 377 87 457 160 2 398 – – 3 528 2 883 66 689 82 176
Deposits received under repurchase agreements 12 659 12 258 12 583 11 749 – – 76 509
Amounts owed to depositors 653 450 602 952 137 391 106 226 182 009 176 234 224 103 201 928 118 134 107 931 105 969 93 997 26 122 21 704 17 058 14 406 66 767 82 454
Comprises:– Amounts owed to clients 604 294 557 645 96 588 66 298 179 161 172 125 223 543 201 560 117 583 107 569 105 960 93 991 26 122 21 704 15 363 13 513 63 517 82 445
– Amounts owed to banks 49 156 45 307 40 803 39 928 2 848 4 109 560 368 551 362 9 6 1 695 893 3 250 9
Total amounts owed to depositors 653 450 602 952 137 391 106 226 182 009 176 234 224 103 201 928 118 134 107 931 105 969 93 997 26 122 21 704 17 058 14 406 66 767 82 454
The 2013 comparative results for the segmental reporting have been restated. The Rest of Africa Division is now reported separately, and Central Management and Shared Services are collectively reported as the Centre. The restatement has had no effect on the group results and ratios, and only affects segment results and ratios.

notes to the consolidated financial statements (continued)for the year ended 31 december
82
31 PROVISIONS AND OTHER LIABILITIES2014
rm2013
Rm
Creditors and other accounts 7 982 8 767Deferred revenue: customer loyalty programmes 258 277Insurance contracts provision 328 442Short-trading securities and spot positions 4 451 4 467Provision for onerous contracts (note 31.1) 12 14
Leave pay accrual (note 31.2) 757 715
13 788 14 682
31.1 Provision for onerous contractsBalance at the beginning of the year 14 12
Recognised in profit or loss (2) 2
Balance at the end of the year 12 14
31.2 Leave pay accrualBalance at the beginning of the year 715 675Recognised in profit or loss 404 376
utilised during the year (362) (336)
Balance at the end of the year 757 715
31.3 Day-one gains and lossesThe group enters into transactions where the fair value of the financial instruments is determined using valuation models for which certain inputs are not based on market-observable prices or rates. Such financial instruments are initially recognised at the transaction price, which is the best indicator of fair value. The transaction price may differ from the valuation amount obtained, giving rise to a day-one profit or loss.
The difference between the transaction price and the valuation amount, commonly referred to as ‘day-one profit or loss’, is deferred and either amortised over the life of the transaction, deferred until the instrument’s fair value can be determined using market-observable inputs, or realised when the financial instrument is derecognised.
The group's day-one profits are attributable to commodity financial instruments.
Balance at the beginning of the year 33
Loss recognised in the statement of comprehensive income (33)
Balance at the end of the year – –
32 INVESTMENT CONTRACT LIABILITIES20 14
rm2013
Rm
Balance at the beginning of the year 11 523 9 513Premium income 3 638 4 663Investment income 983 1 396Annuities (390) (373)Death and disability benefits (331) (178)Withdrawals/Surrenders (3 498) (3 415)
Other movements (178) (83)
Balance at the end of the year 11 747 11 523
Policies held within investment contracts are recorded at market-related values.

NedbaNk Group
83
Consolidated and separate annual
finanCial statements
33 INSuRANCE CONTRACT LIABILITIES2014
rm2013
Rm
Balance at the beginning of the year 3 321 2 979Net premiums 3 049 2 624Individual – single premiums 1 334 569Individual – recurring premiums 1 926 2 259Group – recurring premiums 2Net reinsurance premiums (211) (206)
Investment income 322 220Dividends 3 4Interest 266 229Realised and unrealised gains/(losses) on investments 53 (13)
Policyholders' benefits paid (883) (689)Annuities (141) (118)Death and disability benefits (445) (332)Maturities (181) (130)Gross surrenders and withdrawals (116) (109)
Total expenses (659) (691)Administration expenses (149) (133)Commission (437) (479)Indirect taxation (73) (79)
Other income 3 4
Transfer to operating profit (982) (1 126)
Balance at the end of the year 4 171 3 321
34 LONG-TERM DEBT INSTRuMENTSnominal
value instrument terms2014
rm2013
Rm
Subordinated debt 9 817 8 949rand-denominated rm 8 654 7 895Callable notes repayable on 8 February 2019 (NED8) (a) 1 700 8,90% per annum¹ 1 765Callable notes repayable on 6 July 2022 (NED9) (c) 2 000 JIBAR + 0,47% per annum² 2 031 2 026Callable notes repayable on 17 September 2020 (NED11) (b) 1 000 10,54% per annum¹ 1 048 1 070Callable notes repayable on 25 July 2023 (NED13) (g) 1 800 JIBAR + 2,75 per annum² 1 828 1 826Callable notes repayable on 29 November 2023 (NED14) (g) 1 200 JIBAR + 2,55% per annum² 1 209 1 208Callable notes repayable on 8 April 2024 (NED15) (h) 450 10.49% per annum¹ 461Callable notes repayable on 8 April 2024 (NED16) (g) 1 737 JIBAR + 2,55% per annum² 1 771Callable notes repayable on 14 October 2024 (NED17) (g) 300 JIBAR + 2,75% per annum² 306
namibian dollar-denominated nam$m 4 3Long-term debenture repayable on 15 September 2030
40
17% per annum until 15 September 2000 – thereafter zero coupon 4 3
us dollar-denominated us$m 1 159 1 051Callable notes repayable on 3 March 2022 (EMTN01) (e) 100 Three-month uSD LIBOR² 1 159 1 051
Hybrid subordinated debt – rand-denominated rm 1 900 1 831Callable notes repayable on 20 November 2018 (NEDH1A) (d) 487 15,05% per annum¹ 575 552Callable notes repayable on 20 November 2018 (NEDH1B) (d) 1 265 JIBAR + 4,75% per annum² 1 325 1 279
securitised liabilities – rand-denominated rm 1 395 1 593Callable notes repayable on 25 October 2039 (GRH1A1) (f) 480 JIBAR + 1,1% per annum² 32 232Callable notes repayable on 25 October 2039 (GRH1A2) (f) 336 JIBAR + 1,25% per annum² 340 340Callable notes repayable on 25 October 2039 (GRH1A3) (f) 900 JIBAR + 1,54% per annum² 912 910Callable notes repayable on 25 October 2039 (GRH1B) (f) 110 JIBAR + 1,90% per annum² 111 111¹ Interest on these notes is payable biannually.² Interest on these notes is payable quarterly.

notes to the consolidated financial statements (continued)for the year ended 31 december
84
34 LONG-TERM DEBT INSTRuMENTS (continued)
Nominal value Instrument terms
2014rm
2013Rm
senior unsecured debt – rand-denominated rm 22 511 20 882Senior unsecured notes repayable on 15 September 2015 (NBK2A) 3 244 10,55% per annum¹ 3 347 3 347Senior unsecured notes repayable on 15 September 2015 (NBK2B) 1 044 JIBAR + 2,20% per annum² 1 054 1 053Senior unsecured notes repayable on 9 September 2019 (NBK3A) 1 273 11,39% per annum¹ 1 385 1 397Senior unsecured notes repayable on 28 October 2024 (NBK4) 660 Zero coupon 263 236Senior unsecured notes repayable on 19 April 2015 (NBK6A) 478 9,68% per annum¹ 487 487Senior unsecured notes repayable on 19 April 2015 (NBK6B) 1 027 JIBAR + 1,75% per annum² 1 043 1 041Senior unsecured notes repayable on 19 April 2020 (NBK7B) 80 JIBAR + 2,15% per annum² 81 81Senior unsecured notes repayable on 24 March 2014 (NBK8A) 450 8,39% per annum¹ 460Senior unsecured notes repayable on 24 March 2014 (NBK8B) 988 JIBAR + 1,05% per annum² 869Senior unsecured notes repayable on 23 March 2016 (NBK9A) 1 137 9,36% per annum¹ 1 166 1 166Senior unsecured notes repayable on 23 March 2016 (NBK9B) 677 JIBAR + 1,25% per annum² 678 678Senior unsecured notes repayable on 25 July 2016 (NBK10A) 151 6,91% per annum¹ 154 155Senior unsecured notes repayable on 21 April 2014 (NBK10B) 500 JIBAR + 1,00% per annum² 455Senior unsecured notes repayable on 28 November 2020 (NBK11A) 1 888 8,92% per annum¹ 1 903 1 903Senior unsecured notes repayable on 27 October 2014 (NBK11B) 1 075 JIBAR + 0,94% per annum² 1 086Senior unsecured notes repayable on 19 March 2021 (NBK12A) 855 9,38% per annum¹ 878Senior unsecured notes repayable on 20 February 2015 (NBK12B) 1 297 JIBAR + 1,00% per annum² 1 307 1 306Senior unsecured notes repayable on 19 March 2024 (NBK13A) 391 9,73% per annum¹ 402Senior unsecured notes repayable on 21 February 2017 (NBK13B) 405 JIBAR + 1,30% per annum² 408 408Senior unsecured notes repayable on 28 November 2016 (NBK14A) 500 9,29% per annum¹ 501Senior unsecured notes repayable on 27 August 2015 (NBK14B) 250 JIBAR + 1,00% per annum² 252 251Senior unsecured notes repayable on 27 August 2017 (NBK15B) 786 JIBAR + 1,31% per annum² 700 730Senior unsecured notes repayable on 25 July 2016 (NBK16B) 3 056 JIBAR + 0,8% per annum² 3 068 3 074Senior unsecured notes repayable on 28 November 2016 (NBK17B) 694 JIBAR + 0,75% per annum² 698 699Senior unsecured notes repayable on 20 March 2017 (NBK18B) 1 035 JIBAR + 0,85% per annum² 1 037Senior unsecured notes repayable on 26 June 2017 (NBK19B) 806 JIBAR + 0,9% per annum² 806Senior unsecured notes repayable on 25 June 2021 (NBK20B) 650 JIBAR + 1,3% per annum² 650Senior unsecured notes repayable on 10 November 2017 (NBK21B) 241 JIBAR + 1,12% per annum² 243Other – Rand-denominated Rm 15 13unsecured debentures repayable on 30 November 2029 200 Zero coupon 15 13
Total long-term debt instruments in issue 35 638 33 268¹ Interest on these notes is payable biannually.² Interest on these notes is payable quarterly.
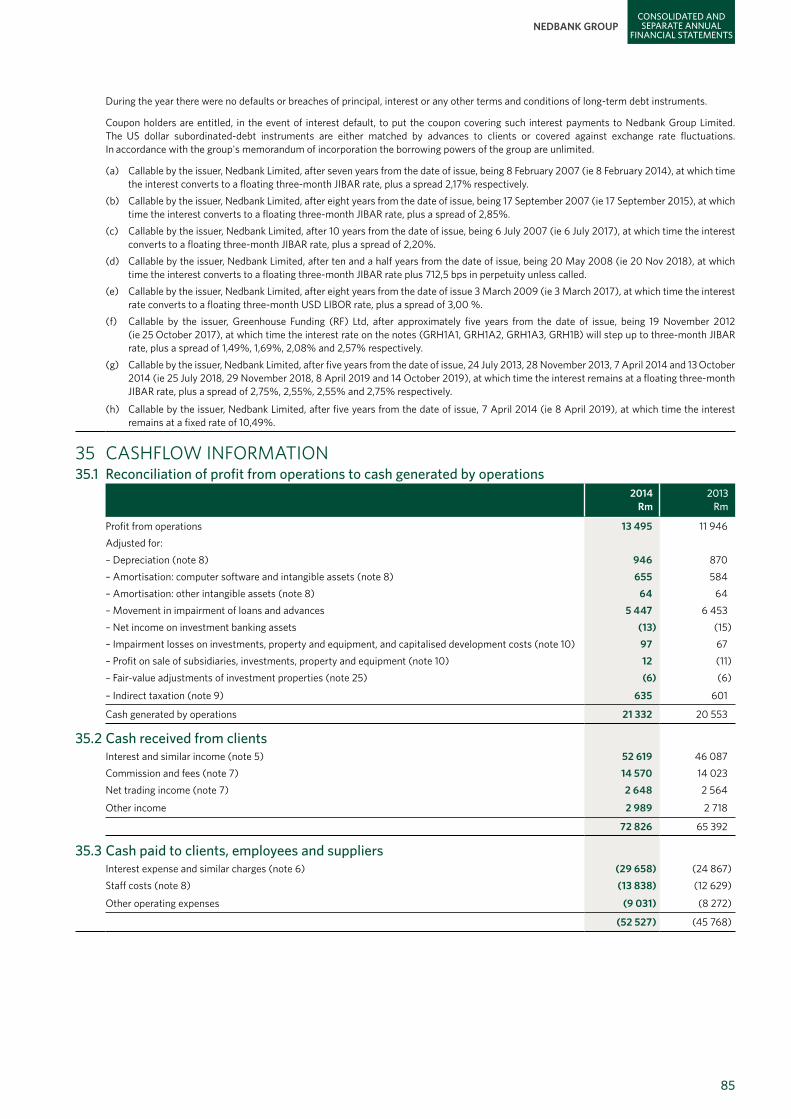
NedbaNk Group
85
Consolidated and separate annual
finanCial statements
During the year there were no defaults or breaches of principal, interest or any other terms and conditions of long-term debt instruments.
Coupon holders are entitled, in the event of interest default, to put the coupon covering such interest payments to Nedbank Group Limited. The uS dollar subordinated-debt instruments are either matched by advances to clients or covered against exchange rate fluctuations. In accordance with the group's memorandum of incorporation the borrowing powers of the group are unlimited.
(a) Callable by the issuer, Nedbank Limited, after seven years from the date of issue, being 8 February 2007 (ie 8 February 2014), at which time the interest converts to a floating three-month JIBAR rate, plus a spread 2,17% respectively.
(b) Callable by the issuer, Nedbank Limited, after eight years from the date of issue, being 17 September 2007 (ie 17 September 2015), at which time the interest converts to a floating three-month JIBAR rate, plus a spread of 2,85%.
(c) Callable by the issuer, Nedbank Limited, after 10 years from the date of issue, being 6 July 2007 (ie 6 July 2017), at which time the interest converts to a floating three-month JIBAR rate, plus a spread of 2,20%.
(d) Callable by the issuer, Nedbank Limited, after ten and a half years from the date of issue, being 20 May 2008 (ie 20 Nov 2018), at which time the interest converts to a floating three-month JIBAR rate plus 712,5 bps in perpetuity unless called.
(e) Callable by the issuer, Nedbank Limited, after eight years from the date of issue 3 March 2009 (ie 3 March 2017), at which time the interest rate converts to a floating three-month uSD LIBOR rate, plus a spread of 3,00 %.
(f) Callable by the issuer, Greenhouse Funding (RF) Ltd, after approximately five years from the date of issue, being 19 November 2012 (ie 25 October 2017), at which time the interest rate on the notes (GRH1A1, GRH1A2, GRH1A3, GRH1B) will step up to three-month JIBAR rate, plus a spread of 1,49%, 1,69%, 2,08% and 2,57% respectively.
(g) Callable by the issuer, Nedbank Limited, after five years from the date of issue, 24 July 2013, 28 November 2013, 7 April 2014 and 13 October 2014 (ie 25 July 2018, 29 November 2018, 8 April 2019 and 14 October 2019), at which time the interest remains at a floating three-month JIBAR rate, plus a spread of 2,75%, 2,55%, 2,55% and 2,75% respectively.
(h) Callable by the issuer, Nedbank Limited, after five years from the date of issue, 7 April 2014 (ie 8 April 2019), at which time the interest remains at a fixed rate of 10,49%.
35 CASHFLOW INFORMATION35.1 Reconciliation of profit from operations to cash generated by operations
2014rm
2013Rm
Profit from operations 13 495 11 946Adjusted for:– Depreciation (note 8) 946 870– Amortisation: computer software and intangible assets (note 8) 655 584– Amortisation: other intangible assets (note 8) 64 64– Movement in impairment of loans and advances 5 447 6 453– Net income on investment banking assets (13) (15)– Impairment losses on investments, property and equipment, and capitalised development costs (note 10) 97 67– Profit on sale of subsidiaries, investments, property and equipment (note 10) 12 (11)– Fair-value adjustments of investment properties (note 25) (6) (6)
– Indirect taxation (note 9) 635 601
Cash generated by operations 21 332 20 553
35.2 Cash received from clientsInterest and similar income (note 5) 52 619 46 087Commission and fees (note 7) 14 570 14 023Net trading income (note 7) 2 648 2 564
Other income 2 989 2 718
72 826 65 392
35.3 Cash paid to clients, employees and suppliersInterest expense and similar charges (note 6) (29 658) (24 867)Staff costs (note 8) (13 838) (12 629)
Other operating expenses (9 031) (8 272)
(52 527) (45 768)

notes to the consolidated financial statements (continued)for the year ended 31 december
86
35 CASHFLOW INFORMATION35.4 Increase in operating assets
2014rm
2013Rm
Other short-term securities (24 783) 1 006Government and other securities 4 914 (5 338)
Loans and advances and other operating assets (42 951) (57 542)
(62 820) (61 874)
35.5 Increase in operating liabilitiesCurrent and savings accounts 9 221 8 119Other deposits, loan accounts and foreign currency liabilities 57 956 37 689Negotiable certificates of deposit (17 080) 10 569Deposits received under repurchase agreements 401 (4 303)
Creditors and other liabilities 1 091 5 293
51 589 57 367
35.6 Taxation paidAmounts receivable at the beginning of the year 264 53Statement of comprehensive income charge (excluding deferred taxation) (3 762) (3 076)Other taxation received/(paid) 7 (2)
Amounts receivable at the end of the year (157) (264)
(3 648) (3 289)
Total indirect taxation (note 9) (635) (601)
Taxation paid (4 283) (3 890)
35.7 Dividends paidRecognised in the consolidated statement of changes in shareholders' equity (4 643) (3 821)

NedbaNk Group
87
Consolidated and separate annual
finanCial statements
36 CONSOLIDATED STATEMENT OF FINANCIAL POSITION – CATEGORIES OF FINANCIAL INSTRuMENTS
notes
at fair value through profit or loss
Held-to-maturity
invest-ments
rm
loans and
receiv-ables
rm
financial liabilities
at amortised
costrm
non-financial
assets, liabilities
and equity
rmtotal
rm
Held for trading
rm
desig-nated¹
rm
available-for-sale
financial assets
rm
2014assetsCash and cash equivalents 14 13 339 13 339Other short-term securities 15 67 234 9 629 15 689 9 323 32 593Derivative financial instruments 16 15 573 15 573Government and other securities 17 27 177 5 491 8 691 2 653 9 245 1 097Loans and advances 18 613 021 26 947 60 241 40 525 793Other assets 20 8 715 2 113 383 6 219Current taxation assets 291 291Investment securities 21 20 029 19 541 488Non-current assets held for sale 23 16 16Investments in private-equity associates, associate companies and joint arrangements 22 7 670 898 6 772Deferred taxation assets 24 309 309Investment property 25 130 130Property and equipment 26 7 773 7 773Long-term employee benefit assets 27 4 546 4 546Mandatory reserve deposits with central banks 14 14 911 14 911
Intangible assets 28 8 579 8 579
total assets 809 313 59 753 105 443 12 504 41 838 561 359 – 28 416
equity and liabilitiesOrdinary share capital 29.1 466 466Ordinary share premium 16 781 16 781
Reserves 49 777 49 777
total equity attributable to equity holders of the parent 67 024 – – – – – – 67 024Non-controlling interest attributable to: – ordinary shareholders 326 326
– preference shareholders 29.2 3 561 3 561
total equity 70 911 – – – – – – 70 911Derivative financial instruments¹ 16 15 472 15 472Amounts owed to depositors 30 653 450 77 201 39 576 536 673Provisions and other liabilities 31 13 788 4 509 9 279Current taxation liabilities 134 134Deferred taxation liabilities 24 931 931Long-term employee benefit liabilities 27 3 071 3 071Investment contract liabilities 32 11 747 11 747Insurance contract liabilities 33 4 171 4 171
Long-term debt instruments 34 35 638 2 040 33 598
total liabilities 738 402 97 182 57 534 – – – 579 550 4 136
total equity and liabilities 809 313 97 182 57 534 – – – 579 550 75 047
36 CONSOLIDATED STATEMENT OF FINANCIAL POSITION – CATEGORIES OF FINANCIAL INSTRuMENTS (continued)
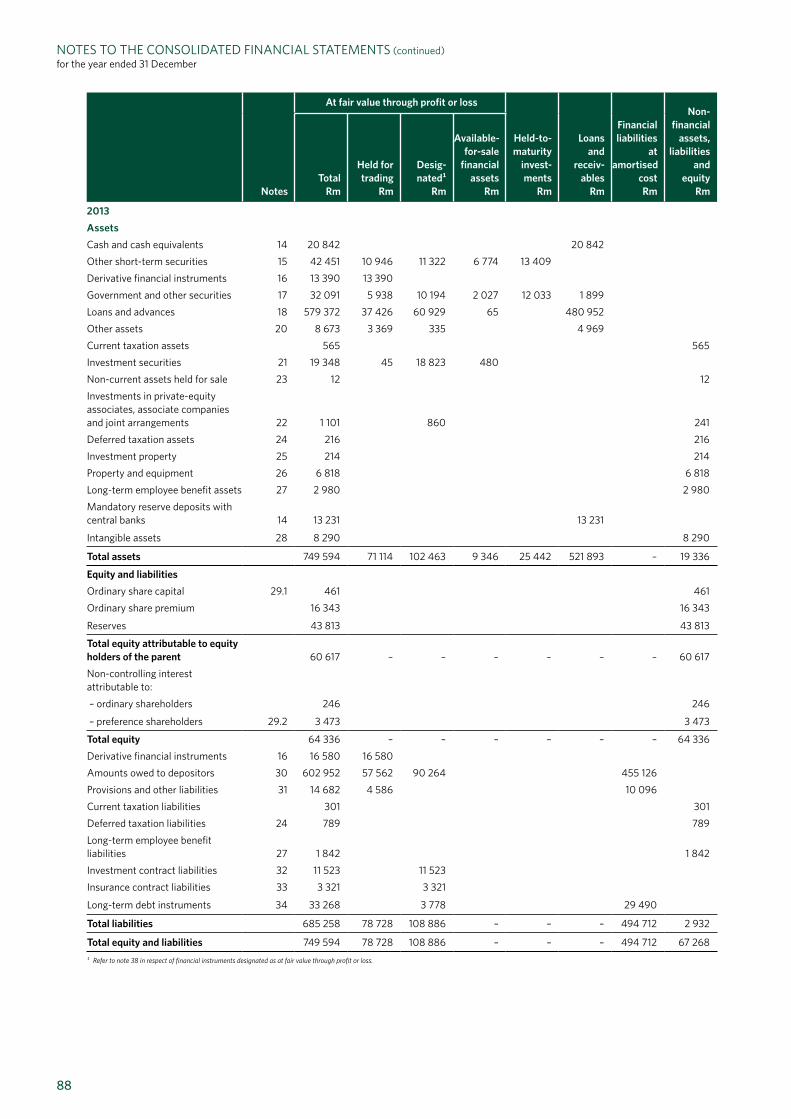
notes to the consolidated financial statements (continued)for the year ended 31 december
88
notes
at fair value through profit or loss
Held-to-maturity
invest-ments
rm
loans and
receiv-ables
rm
financial liabilities
at amortised
costrm
non-financial
assets, liabilities
and equity
rmtotal
rm
Held for trading
rm
desig-nated¹
rm
available-for-sale
financial assets
rm
2013assetsCash and cash equivalents 14 20 842 20 842Other short-term securities 15 42 451 10 946 11 322 6 774 13 409Derivative financial instruments 16 13 390 13 390Government and other securities 17 32 091 5 938 10 194 2 027 12 033 1 899Loans and advances 18 579 372 37 426 60 929 65 480 952Other assets 20 8 673 3 369 335 4 969Current taxation assets 565 565Investment securities 21 19 348 45 18 823 480Non-current assets held for sale 23 12 12Investments in private-equity associates, associate companies and joint arrangements 22 1 101 860 241Deferred taxation assets 24 216 216Investment property 25 214 214Property and equipment 26 6 818 6 818Long-term employee benefit assets 27 2 980 2 980Mandatory reserve deposits with central banks 14 13 231 13 231
Intangible assets 28 8 290 8 290
total assets 749 594 71 114 102 463 9 346 25 442 521 893 – 19 336
equity and liabilitiesOrdinary share capital 29.1 461 461Ordinary share premium 16 343 16 343
Reserves 43 813 43 813
total equity attributable to equity holders of the parent 60 617 – – – – – – 60 617Non-controlling interest attributable to: – ordinary shareholders 246 246
– preference shareholders 29.2 3 473 3 473
total equity 64 336 – – – – – – 64 336Derivative financial instruments 16 16 580 16 580Amounts owed to depositors 30 602 952 57 562 90 264 455 126Provisions and other liabilities 31 14 682 4 586 10 096Current taxation liabilities 301 301Deferred taxation liabilities 24 789 789Long-term employee benefit liabilities 27 1 842 1 842Investment contract liabilities 32 11 523 11 523Insurance contract liabilities 33 3 321 3 321
Long-term debt instruments 34 33 268 3 778 29 490
total liabilities 685 258 78 728 108 886 – – – 494 712 2 932
total equity and liabilities 749 594 78 728 108 886 – – – 494 712 67 268
¹ Refer to note 38 in respect of financial instruments designated as at fair value through profit or loss.

NedbaNk Group
89
Consolidated and separate annual
finanCial statements
37 FAIR-VALuE MEASuREMENT – FINANCIAL INSTRuMENTS37.1 Valuation of financial instruments
BackgroundInformation obtained from the valuation of financial instruments is used by the group to assess the performance of the business and, in particular, provide assurance that the risk and return measures that the business has taken are accurate and complete. It is important that the valuation of financial instruments accurately represents the financial position of the group while complying with the requirements of the applicable accounting standards.
The fair value of a financial instrument is the amount that would be received to sell the asset or paid to transfer a liability in an orderly transaction between market participants at the measurement date. underlying the definition of fair value is a presumption that an entity is a going concern without any intention or need to liquidate, to curtail materially the scale of its operations or to undertake a transaction on adverse terms. Fair value is not, therefore, the amount that an entity would receive or pay in a forced transaction, involuntary liquidation or distressed sale.
Control environmentValidation and approvalThe business unit entering into the transaction is responsible for the initial determination and recording of the fair value of the transaction. There are normalised review protocols for the independent review and validation of fair values separate from the business unit entering into the transaction. These include, but are not limited to:
■ daily controls over the profit or loss recorded by trading and treasury frontoffice traders; ■ specific controls to ensure consistent pricing policies and procedures are adhered to; ■ independent valuation of structures, products and trades; and ■ periodic review of all elements of the modelling process.
The validation of pricing and valuation methodologies is verified by a specialist team that is part of the group’s risk management function and that is independent of all the business units. A specific area of focus is the marking-to-model of illiquid and/or complex financial instruments.
The review of the modelling process includes approval of model revisions, vetting of model inputs, review of model results and more specifically the verification of risk calculations. All valuation techniques are validated and reviewed by qualified senior staff and are calibrated and back-tested for validity by using prices from any observable current market transaction in the same instrument (ie without modification or repackaging) or based on any observable market data. The group obtains market data consistently in the same market where the instrument was originated or purchased.
If the fair-value calculation deviates from the quoted market value due to inaccurate observed market data, these deviations in the valuation are documented and presented at a review committee, which is independent of both the business unit and the specialist team, for approval. The committee will need to consider both the regulatory and accounting requirements in arriving at an opinion on whether the deviation is acceptable.
The group refines and modifies its valuation techniques as markets and products develop and as the pricing for individual products becomes more or less readily available. While the group believes its valuation techniques are appropriate and consistent with those of other market participants, the use of different methodologies or assumptions may result in different estimates of fair value at the different reporting dates.
Stress testing and sensitivity measuresComprehensive stress testing is conducted by the group, in which the following, at a minimum, are considered:
■ anticipated future projected trading positions; ■ historical events; ■ scenario testing to evaluate plausible future events; and ■ specific testing to supplement the value at risk (VaR) methodology (ie one-day holding period and 99% confidence interval).
For further discussion in respect of stress testing and sensitivity measures refer to note 37.7.
Valuation methodologiesThe objective of a fair-value measurement is to estimate the price at which an orderly transaction to sell the asset or to transfer the liability would take place between market participants at the measurement date under current market conditions. A fair-value measurement includes, but is not limited to, consideration of the following:
■ The particular asset or liability that is being measured (consistently with its unit of account); ■ The principal (or most advantageous) market for the asset or liability; and ■ The valuation technique(s) appropriate for the measurement, considering the availability of data with which to develop inputs that
represent the assumptions that market participants would use when pricing the asset or liability and the level of the fair-value hierarchy within which the inputs are categorised.
Quoted priceA financial instrument is regarded as quoted in an active market if quoted prices are readily available from an exchange, industry group, pricing service or regulatory agency, and those prices represent actual and regularly occurring market transactions on an arm’s length basis. The appropriate quoted market price for an asset held or a liability to be issued is usually the current bid price and, for an asset to be acquired or a liability held, the asking price.
The objective of determining fair value is to arrive at the transaction price of an instrument on the measurement date (ie without modifying or repackaging the instrument) in the principal (or most advantageous) active market to which the business has immediate access.
The existence of published price quotations in an active market is the most reliable evidence of fair value and, when they exist, they are used without adjustment to measure the financial asset or financial liability. A market is considered to be active if transactions occur with sufficient volume and frequency to provide pricing information on an ongoing basis.
These quoted prices would generally be classified as level 1 in terms of the fair-value hierarchy prescribed by IFRS 13 Fair Value Measurement.

notes to the consolidated financial statements (continued)for the year ended 31 december
90
37 FAIR-VALuE MEASuREMENT – FINANCIAL INSTRuMENTS (continued)
37.1 Valuation of financial instruments (continued)Valuation techniquesIf the market for a financial instrument is not active, the group establishes fair value by using various valuation techniques. These valuation techniques may include:
■ using recent arm’s length market transactions between knowledgeable, willing parties; ■ reference to the current fair value of another instrument that is substantially of the same in nature; ■ reference to the value of the net asset of the underlying business; ■ earnings multiples; ■ discounted cashflow analysis; and ■ various option pricing models.
If there is a valuation technique that is commonly used by market participants to price the financial instrument and that technique has been demonstrated to provide reasonable estimates of prices obtained in actual market transactions, the group will use that technique. In applying valuation techniques, and to the extent possible, the group maximises the use of relevant observable inputs and minimises the use of unobservable inputs.
The objective of using a valuation technique is to establish what the transaction price would have been on the measurement date in an arm’s length exchange and motivated by normal business considerations. In applying valuation techniques, the group uses estimates and assumptions that are consistent with available information about the estimates and assumptions that market participants would use in setting a price for the financial instrument.
Fair value is therefore estimated on the basis of the results of a valuation technique that makes maximum use of market inputs and relies as little as possible on entity-specific inputs. A valuation technique would be expected to arrive at a realistic estimate of the fair value if:
■ it reasonably reflects how the market could be expected to price the instrument; and ■ the inputs to the valuation technique reasonably represent market expectations and measures of the risk-return factors inherent in the
financial instrument.
Therefore, a valuation technique: ■ will incorporate all relevant factors that market participants would consider in determining a price; and ■ is consistent with accepted economic methodologies for pricing financial instruments.
If a published price quotation in an active market does not exist for a financial instrument in its entirety, but active markets exist for its component parts, fair value is determined on the basis of the relevant market prices for the various component parts.
If a rate (rather than a price) is quoted in an active market, the group uses that market-quoted rate as an input into a valuation technique to determine fair value. If the market-quoted rate does not include credit risk or other factors that market participants would include in valuing the instrument, the group adjusts for these factors.
Valuation techniques applied by the group would generally be classified as level 2 or level 3 in terms of the fair-value hierarchy prescribed by IFRS 13 Fair Value Measurement. The determination of whether an instrument is classified as level 2 or level 3 is dependent on the significance of observable inputs versus unobservable inputs in relation to the fair value of the instrument.
Observable marketsquoted market prices in active markets are the best evidence of fair value and are used as the basis of measurement, if available. A determination of what constitutes observable market data will necessitate significant judgement. It is the group’s belief that observable market data comprises, in the following hierarchical order:
■ prices or quotes from an exchange or listed markets in which there are sufficient liquidity and activity; ■ proxy observable market data that is proven to be highly correlated and has a logical, economic relationship with the instrument that is
being valued; and ■ other direct and indirect market inputs that are observable in the marketplace.
Data is considered by the group to be ‘observable’ if the data is: ■ verifiable; ■ readily available; ■ regularly distributed; ■ from multiple independent sources; ■ transparent; and ■ not proprietary.
Data is considered by the group to be ‘market-based’ if the data is: ■ reliable; ■ based on consensus within reasonable narrow, observable ranges; ■ provided by sources that are actively involved in the relevant market; and ■ supported by actual market transactions.
It is not intended to imply that all of the above characteristics must be present to conclude that the evidence qualifies as observable market data. Judgement is applied based on the strength and quality of the available evidence.

NedbaNk Group
91
Consolidated and separate annual
finanCial statements
Inputs to valuation techniquesAn appropriate valuation technique for estimating the fair value of a particular financial instrument would incorporate observable market data about the market conditions and other factors that are likely to affect the instrument’s fair value. Inputs are selected on a basis that is consistent with the characteristics of the instrument that market participants would take into account in a transaction for that instrument. Principal inputs to valuation techniques applied by the group include, but are not limited to, the following:
■ Discount rate: Where discounted cashflow techniques are used, estimated future cashflows are based on management’s best estimates and the discount rate used is a market rate at the reporting date for an instrument with similar terms and conditions.
■ The time value of money: The business may use well-accepted and readily observable general interest rates, such as the Johannesburg Interbank Agreed Rate (SA), London Interbank Offered Rate (uK) or an appropriate swap rate, as the benchmark rate to derive the present value of a future cashflow.
■ Credit risk: Credit risk is the risk of loss associated with a counterparty’s failure or inability to fulfil its contractual obligations. The valuation of the relevant financial instrument takes into account the effect of credit risk on fair value by including an appropriate adjustment for the risk taken.
■ Foreign currency exchange prices: Active currency exchange markets exist for most major currencies, and prices are quoted daily on various trading platforms and in financial publications.
■ Commodity prices: Observable market prices are available for those commodities that are actively traded on exchanges in SA, London, New York, Chicago and other commercial exchanges.
■ Equity prices: Prices (and indices of prices) of traded equity instruments are readily observable on JSE Ltd or any other recognised international exchange. Present value techniques may be used to estimate the current market price of equity instruments for which there are no observable prices.
■ Volatility: Measures of the volatility of actively traded items can be reasonably estimated by the implied volatility in current market prices. The shape and skew of the volatility curve is derived from a combination of observed trades and doubles in the market. In the absence of an active market, a methodology to derive these volatilities from observable market data will be developed and utilised.
■ Recovery rates/Loss given default: These are used as an input to valuation models as an indicator of the severity of losses on default. Recovery rates are primarily sourced from market data providers or inferred from observable credit spreads.
■ Prepayment risk and surrender risk: Expected repayment patterns for financial assets and expected surrender patterns for financial liabilities can be estimated on the basis of historical data.
■ Servicing costs: If the cost of servicing a financial asset or financial liability is significant and other market participants would face comparable costs, the issuer would consider them in determining the fair value of that financial asset or financial liability.
■ Dividends: Consistent consensus dividend forecasts adjusted for internal investment analysts’ projections can be applied to each share. Forecasts are usually available for the current year plus one additional year. Thereafter, a constant growth rate would be applied to the specific dates into the future for each individual share.
■ Inception profit (day-one gain or loss): The best evidence of the fair value of a financial instrument at initial recognition is the transaction price (ie the fair value of the consideration given or received), unless the fair value of that instrument is evidenced by comparison with other observable current market transactions in the same instrument (ie without modification or repackaging) or based on a valuation technique, the variables of which include data from observable markets only.
Valuation adjustmentsTo estimate a reliable fair value, where appropriate, the group applies certain valuation adjustments to the pricing information derived from the above sources. In making appropriate adjustments, the group considers certain adjustments to the modelled price that market participants would make when pricing that instrument. Factors that would be considered include, but are not limited to, the following:
■ Own credit on financial liabilities: The carrying amount of financial liabilities held at fair value is adjusted to reflect the effect of changes in the group’s own credit spreads. As a result, the carrying value of issued bonds and subordinated-debt instruments that have been designated at fair value through profit or loss is adjusted by reference to the movement in the appropriate spreads. The resulting gain or loss is recognised in profit and loss in the statement of other comprehensive income.
■ Counterparty credit spreads: Adjustments are made to market prices when the creditworthiness of the counterparty differs from that of the assumed counterparty in the market price (or parameter).
Valuation techniques by instrumentOther short-term securities and government and other securities
The fair value of these instruments is based on quoted market prices from an exchange dealer, broker, industry group or pricing service, when available. When they are unavailable, the fair value is determined by reference to quoted market prices for similar instruments, adjusted as appropriate for the specific circumstances of the instruments.
Where these instruments include corporate bonds, the bonds are valued using observable active quoted prices or recently executed transactions, except where observable price quotations are not available. Where price quotations are not available, the fair value is determined based on cashflow models, where significant inputs may include yield curves and bond or single name credit default swap spreads.
Derivative financial instrumentsDerivative contracts can either be traded via an exchange or over the counter (OTC) and are valued using market standard models and quoted parameter inputs. Parameter inputs are obtained from pricing services, consensus pricing services and recently occurring transactions in active markets, whenever possible. Certain inputs may not be observable in the market directly, but can be determined from observable prices via model calibration procedures. Other inputs are not observable, but can generally be estimated from historical data or other sources.

notes to the consolidated financial statements (continued)for the year ended 31 december
92
37 FAIR-VALuE MEASuREMENT – FINANCIAL INSTRuMENTS (continued)
37.1 Valuation of financial instruments (continued)Loans and advancesLoans and advances include mortgage loans (home loans and commercial mortgages), other asset-based loans, including collaterised debt obligations, and other secured and unsecured loans.
In the absence of an observable market for these instruments, the fair value is determined by using internally developed models that are specific to the instrument and that incorporate all available observable inputs. These models involve discounting the contractual cashflows by using an at-inception credit-adjusted zero coupon curve. Loans and advances are reviewed for observed and verified changes in credit risk and the credit spread is adjusted at subsequent dates if there has been an observable change in credit risk relating to a particular loan or advance.
Investment securitiesInvestment securities include private-equity investments, listed investments and unlisted investments.
The fair value of listed investments is determined with reference to quoted bid prices at the close of business on the relevant securities exchange.
Where private-equity investments are involved, the exercise of judgement is required due to uncertainties inherent in estimating the fair value. The fair value of private-equity is determined using appropriate valuation methodologies that, dependent on the nature of the investment, may include an analysis of the investee’s financial position and results, risk profiles and prospects, discounted cashflow analysis, enterprise value comparisons with similar companies, price/earnings comparisons and earnings multiples. For each investment the relevant methodology is applied consistently over time and may be adjusted for changes in market conditions relative to that instrument.
The fair value of unlisted investments is determined using appropriate valuation techniques that may include, but are not limited to, discounted cashflow analysis, net asset value calculations and directors’ valuations.
Other assetsShort positions or long positions in equities arise in trading activities where equity shares, not owned by the group, are sold in the market to third parties. The fair value of these instruments is determined by reference to the gross short/long position valued at the offer rate.
Investments in instruments that do not have a quoted market price in an active market and the fair value of which cannot be reliably measured, as well as derivatives that are linked to and have to be settled by delivery of such unquoted equity instruments, are measured at fair value, using models considered to be appropriate by management.
Amounts owed to depositorsAmounts owed to depositors include deposits under repurchase agreements, negotiable certificates of deposit and other deposits. These instruments incorporate all market risk factors, including a measure of the group’s credit risk relevant for that financial liability when designated at fair value through profit or loss.
The fair value of these financial liabilities is determined by discounting the contractual cashflows using a Nedbank Group Limited specific credit-adjusted yield curve that reflects the level at which the group would issue similar instruments at the reporting date. The market risk parameters are valued consistently to similar instruments held as assets.
The fair value of a financial liability with a demand feature is not less than the amount payable on demand, discounted from the first date on which the amount could be required to be paid. When the fair value of a financial liability cannot be reliably determined, the liability is recorded at the amount due. Fair value is considered reliably measurable if:
■ the variability in the range of reasonable fair-value estimates is not significant for that instrument; or ■ the probabilities of the various estimates within the range can be reasonably assessed and used in estimating fair value.
Investment contract liabilitiesThe fair value of investment contract liabilities is determined by reference to the fair value of the underlying assets.
Long-term debt instrumentsThe fair value of long-term debt instruments is determined by reference to published market values on the relevant exchange, when they are.
■ available; and ■ considered to be trading with sufficient volume and frequency.
When the above conditions are not met, the fair value is determined using models considered to be appropriate by management. As far as possible, inputs to these models will leverage observable inputs for similar instruments with similar coupons and maturities.
Complex instrumentsThese instruments are valued by using internally developed models that are specific to the instrument and that have been calibrated to market prices. In less active markets data is obtained from less frequent market transactions, broker quotes and through extrapolation and interpolation techniques. Where observable prices or inputs are not available, other relevant sources of information such as historical data, fundamental analysis of the economics of the transaction and proxy information from similar transactions are used. These models are continually reviewed and assessed to ensure that the best available data is being utilised in the determination of fair value.
Other liabilitiesShort positions or long positions in equities arise in trading activities where equity shares, not owned by the group, are sold in the market to third parties. The fair value of these instruments is determined by reference to the gross short/long position valued at the offer rate.
Where the group has assets and liabilities with offsetting market risks, it may use mid-market prices as a basis for establishing fair values for the offsetting risk positions and apply the bid or asking price to the net open position, as appropriate.

NedbaNk Group
93
Consolidated and separate annual
finanCial statements
Summary of principal valuation techniques – level 2 instrumentsThe following table sets out the group's principal valuation techniques used in determining the fair value of financial assets and financial liabilities classified as level 2 in the fair value hierarchy:
Valuation technique Key inputs
assetsOther short-term securities Discounted cashflow model Discount ratesDerivative financial instruments Discounted cashflow model Discount rates
Black-Scholes model Risk-free rate and volatilitiesMultiple valuation techniques Valuation multiples
Government and other securities Discounted cashflow model Discount ratesLoans and advances Discounted cashflow model Interest rate curvesInvestment securities Discounted cashflow models Money market rates and interest rates
Adjusted net asset value underlying price of market traded instruments
Dividend yield method Dividend growth rates
liabilitiesDerivative financial instruments Discounted cashflow model Discount rates
Black-Scholes model Risk-free rate and volatilitiesMultiple valuation techniques Valuation multiples
Amounts owed to depositors Discounted cashflow model Discount ratesProvisions and liabilities Discounted cashflow model Discount ratesInvestment and insurance contract liabilities Adjusted net asset value underlying price of market traded instruments
Long-term debt instruments Discounted cashflow model Discount rates
Summary of principal valuation techniques – level 3 instruments
The summary of the valuation techniques applicable to those financial assets and financial liabilities classified as level 3 in the fair value hierarchy is set out in note 37.7.
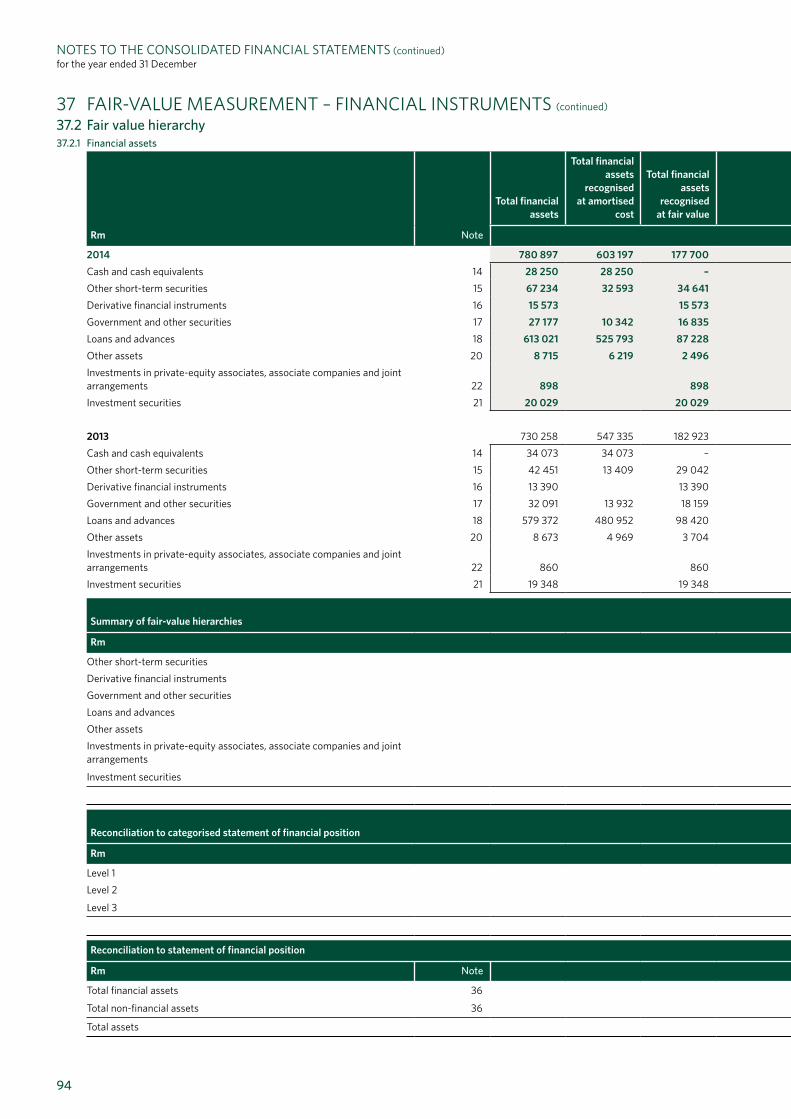
notes to the consolidated financial statements (continued)for the year ended 31 december
94
37 FAIR-VALuE MEASuREMENT – FINANCIAL INSTRuMENTS (continued)
37.2 Fair value hierarchy37.2.1 Financial assets
Note
total financialassets
total financialassets
recognised at amortised
cost
total financial assets
recognised at fair value Held for trading
designated at fair value through profit or loss available-for-sale
rm Level 1 Level 2 Level 3 Level 1 Level 2 Level 3 Level 1 Level 2 Level 3
2014 780 897 603 197 177 700 6 743 53 010 – 4 794 98 918 1 731 2 432 10 072 –Cash and cash equivalents 14 28 250 28 250 –Other short-term securities 15 67 234 32 593 34 641 9 629 668 15 021 9 323Derivative financial instruments 16 15 573 15 573 27 15 546Government and other securities 17 27 177 10 342 16 835 4 603 888 3 096 5 595 2 381 272Loans and advances 18 613 021 525 793 87 228 26 947 23 60 185 33 40Other assets 20 8 715 6 219 2 496 2 113 383Investments in private-equity associates, associate companies and joint arrangements 22 898 898 898Investment securities 21 20 029 20 029 624 18 117 800 11 477
2013 730 258 547 335 182 923 8 598 62 471 45 5 447 95 213 1 803 1 970 7 376 –Cash and cash equivalents 14 34 073 34 073 –Other short-term securities 15 42 451 13 409 29 042 266 10 680 377 10 945 6 774Derivative financial instruments 16 13 390 13 390 67 13 323Government and other securities 17 32 091 13 932 18 159 4 896 1 042 3 891 6 303 1 898 129Loans and advances 18 579 372 480 952 98 420 37 426 25 60 871 33 65Other assets 20 8 673 4 969 3 704 3 369 335Investments in private-equity associates, associate companies and joint arrangements 22 860 860 860Investment securities 21 19 348 19 348 45 819 17 094 910 7 473
summary of fair-value hierarchiestotal financial assets
recognised at fair valuetotal financial assets
classified as level 1total financial assets classified as level 2
total financial assets classified as level 3
rm 2014 2013 2014 2013 2014 2013 2014 2013
Other short-term securities 34 641 29 042 668 643 33 973 28 399Derivative financial instruments 15 573 13 390 27 67 15 546 13 323Government and other securities 16 835 18 159 10 080 10 685 6 755 7 474Loans and advances 87 228 98 420 63 90 87 132 98 297 33 33Other assets 2 496 3 704 2 496 3 704Investments in private-equity associates, associate companies and joint arrangements 898 860 898 860
Investment securities 20 029 19 348 635 826 18 594 17 567 800 955
177 700 182 923 13 969 16 015 162 000 165 060 1 731 1 848
reconciliation to categorised statement of financial position Held for trading designated at fair value
through profit or loss available-for-sale
rm 2014 2013 2014 2013 2014 2013
Level 1 6 743 8 598 4 794 5 447 2 432 1 970Level 2 53 010 62 471 98 918 95 213 10 072 7 376
Level 3 45 1 731 1 803
59 753 71 114 105 443 102 463 12 504 9 346
reconciliation to statement of financial position
rm Note 2014 2013
Total financial assets 36 780 897 730 258
Total non-financial assets 36 28 416 19 336
Total assets 809 313 749 594

NedbaNk Group
95
Consolidated and separate annual
finanCial statements
37 FAIR-VALuE MEASuREMENT – FINANCIAL INSTRuMENTS (continued)
37.2 Fair value hierarchy37.2.1 Financial assets
Note
total financialassets
total financialassets
recognised at amortised
cost
total financial assets
recognised at fair value Held for trading
designated at fair value through profit or loss available-for-sale
rm Level 1 Level 2 Level 3 Level 1 Level 2 Level 3 Level 1 Level 2 Level 3
2014 780 897 603 197 177 700 6 743 53 010 – 4 794 98 918 1 731 2 432 10 072 –Cash and cash equivalents 14 28 250 28 250 –Other short-term securities 15 67 234 32 593 34 641 9 629 668 15 021 9 323Derivative financial instruments 16 15 573 15 573 27 15 546Government and other securities 17 27 177 10 342 16 835 4 603 888 3 096 5 595 2 381 272Loans and advances 18 613 021 525 793 87 228 26 947 23 60 185 33 40Other assets 20 8 715 6 219 2 496 2 113 383Investments in private-equity associates, associate companies and joint arrangements 22 898 898 898Investment securities 21 20 029 20 029 624 18 117 800 11 477
2013 730 258 547 335 182 923 8 598 62 471 45 5 447 95 213 1 803 1 970 7 376 –Cash and cash equivalents 14 34 073 34 073 –Other short-term securities 15 42 451 13 409 29 042 266 10 680 377 10 945 6 774Derivative financial instruments 16 13 390 13 390 67 13 323Government and other securities 17 32 091 13 932 18 159 4 896 1 042 3 891 6 303 1 898 129Loans and advances 18 579 372 480 952 98 420 37 426 25 60 871 33 65Other assets 20 8 673 4 969 3 704 3 369 335Investments in private-equity associates, associate companies and joint arrangements 22 860 860 860Investment securities 21 19 348 19 348 45 819 17 094 910 7 473
summary of fair-value hierarchiestotal financial assets
recognised at fair valuetotal financial assets
classified as level 1total financial assets classified as level 2
total financial assets classified as level 3
rm 2014 2013 2014 2013 2014 2013 2014 2013
Other short-term securities 34 641 29 042 668 643 33 973 28 399Derivative financial instruments 15 573 13 390 27 67 15 546 13 323Government and other securities 16 835 18 159 10 080 10 685 6 755 7 474Loans and advances 87 228 98 420 63 90 87 132 98 297 33 33Other assets 2 496 3 704 2 496 3 704Investments in private-equity associates, associate companies and joint arrangements 898 860 898 860
Investment securities 20 029 19 348 635 826 18 594 17 567 800 955
177 700 182 923 13 969 16 015 162 000 165 060 1 731 1 848
reconciliation to categorised statement of financial position Held for trading designated at fair value
through profit or loss available-for-sale
rm 2014 2013 2014 2013 2014 2013
Level 1 6 743 8 598 4 794 5 447 2 432 1 970Level 2 53 010 62 471 98 918 95 213 10 072 7 376
Level 3 45 1 731 1 803
59 753 71 114 105 443 102 463 12 504 9 346
reconciliation to statement of financial position
rm Note 2014 2013
Total financial assets 36 780 897 730 258
Total non-financial assets 36 28 416 19 336
Total assets 809 313 749 594
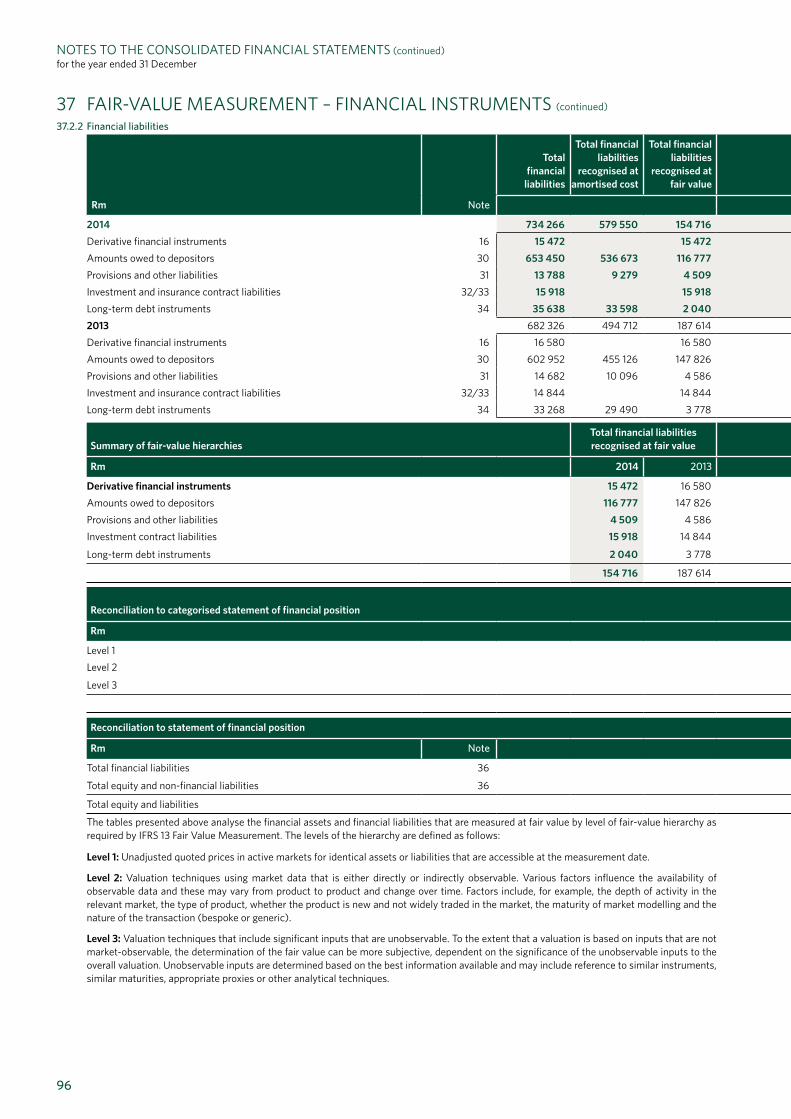
notes to the consolidated financial statements (continued)for the year ended 31 december
96
37 FAIR-VALuE MEASuREMENT – FINANCIAL INSTRuMENTS (continued)
37.2.2 Financial liabilities
rm Note
total financial
liabilities
total financial liabilities
recognised at amortised cost
total financial liabilities
recognised at fair value Held for trading
designated at fair value through profit or loss
Level 1 Level 2 Level 3 Level 1 Level 2 Level 3
2014 734 266 579 550 154 716 4 376 92 786 20 575 56 959 –Derivative financial instruments 16 15 472 15 472 7 15 445 20Amounts owed to depositors 30 653 450 536 673 116 777 77 201 39 576Provisions and other liabilities 31 13 788 9 279 4 509 4 369 140Investment and insurance contract liabilities 32/33 15 918 15 918 15 918Long-term debt instruments 34 35 638 33 598 2 040 575 1 4652013 682 326 494 712 187 614 4 500 74 228 – 2 317 106 569 –Derivative financial instruments 16 16 580 16 580 31 16 549Amounts owed to depositors 30 602 952 455 126 147 826 57 562 90 264Provisions and other liabilities 31 14 682 10 096 4 586 4 469 117Investment and insurance contract liabilities 32/33 14 844 14 844 14 844Long-term debt instruments 34 33 268 29 490 3 778 2 317 1 461
summary of fair-value hierarchiestotal financial liabilities recognised at fair value
total financial liabilities classified as level 1
total financial liabilities classified as level 2
total financial liabilities classified as level 3
rm 2014 2013 2014 2013 2014 2013 2014 2013
derivative financial instruments 15 472 16 580 7 31 15 445 16 549 20Amounts owed to depositors 116 777 147 826 116 777 147 826Provisions and other liabilities 4 509 4 586 4 369 4 469 140 117Investment contract liabilities 15 918 14 844 15 918 14 844
Long-term debt instruments 2 040 3 778 575 2 317 1 465 1 461
154 716 187 614 4 951 6 817 149 745 180 797 20 –
reconciliation to categorised statement of financial position Held for trading designated at fair value
through profit or loss
rm 2014 2013 2014 2013
Level 1 4 376 4 500 575 2 317Level 2 92 786 74 228 56 959 106 569
Level 3 20
97 182 78 728 57 534 108 886
reconciliation to statement of financial position
rm Note 2014 2013
Total financial liabilities 36 734 266 682 326
Total equity and non-financial liabilities 36 75 047 67 268
Total equity and liabilities 809 313 749 594
The tables presented above analyse the financial assets and financial liabilities that are measured at fair value by level of fair-value hierarchy as required by IFRS 13 Fair Value Measurement. The levels of the hierarchy are defined as follows:
level 1: unadjusted quoted prices in active markets for identical assets or liabilities that are accessible at the measurement date.
level 2: Valuation techniques using market data that is either directly or indirectly observable. Various factors influence the availability of observable data and these may vary from product to product and change over time. Factors include, for example, the depth of activity in the relevant market, the type of product, whether the product is new and not widely traded in the market, the maturity of market modelling and the nature of the transaction (bespoke or generic).
level 3: Valuation techniques that include significant inputs that are unobservable. To the extent that a valuation is based on inputs that are not market-observable, the determination of the fair value can be more subjective, dependent on the significance of the unobservable inputs to the overall valuation. unobservable inputs are determined based on the best information available and may include reference to similar instruments, similar maturities, appropriate proxies or other analytical techniques.

NedbaNk Group
97
Consolidated and separate annual
finanCial statements
37 FAIR-VALuE MEASuREMENT – FINANCIAL INSTRuMENTS (continued)
37.2.2 Financial liabilities
rm Note
total financial
liabilities
total financial liabilities
recognised at amortised cost
total financial liabilities
recognised at fair value Held for trading
designated at fair value through profit or loss
Level 1 Level 2 Level 3 Level 1 Level 2 Level 3
2014 734 266 579 550 154 716 4 376 92 786 20 575 56 959 –Derivative financial instruments 16 15 472 15 472 7 15 445 20Amounts owed to depositors 30 653 450 536 673 116 777 77 201 39 576Provisions and other liabilities 31 13 788 9 279 4 509 4 369 140Investment and insurance contract liabilities 32/33 15 918 15 918 15 918Long-term debt instruments 34 35 638 33 598 2 040 575 1 4652013 682 326 494 712 187 614 4 500 74 228 – 2 317 106 569 –Derivative financial instruments 16 16 580 16 580 31 16 549Amounts owed to depositors 30 602 952 455 126 147 826 57 562 90 264Provisions and other liabilities 31 14 682 10 096 4 586 4 469 117Investment and insurance contract liabilities 32/33 14 844 14 844 14 844Long-term debt instruments 34 33 268 29 490 3 778 2 317 1 461
summary of fair-value hierarchiestotal financial liabilities recognised at fair value
total financial liabilities classified as level 1
total financial liabilities classified as level 2
total financial liabilities classified as level 3
rm 2014 2013 2014 2013 2014 2013 2014 2013
derivative financial instruments 15 472 16 580 7 31 15 445 16 549 20Amounts owed to depositors 116 777 147 826 116 777 147 826Provisions and other liabilities 4 509 4 586 4 369 4 469 140 117Investment contract liabilities 15 918 14 844 15 918 14 844
Long-term debt instruments 2 040 3 778 575 2 317 1 465 1 461
154 716 187 614 4 951 6 817 149 745 180 797 20 –
reconciliation to categorised statement of financial position Held for trading designated at fair value
through profit or loss
rm 2014 2013 2014 2013
Level 1 4 376 4 500 575 2 317Level 2 92 786 74 228 56 959 106 569
Level 3 20
97 182 78 728 57 534 108 886
reconciliation to statement of financial position
rm Note 2014 2013
Total financial liabilities 36 734 266 682 326
Total equity and non-financial liabilities 36 75 047 67 268
Total equity and liabilities 809 313 749 594
The tables presented above analyse the financial assets and financial liabilities that are measured at fair value by level of fair-value hierarchy as required by IFRS 13 Fair Value Measurement. The levels of the hierarchy are defined as follows:
level 1: unadjusted quoted prices in active markets for identical assets or liabilities that are accessible at the measurement date.
level 2: Valuation techniques using market data that is either directly or indirectly observable. Various factors influence the availability of observable data and these may vary from product to product and change over time. Factors include, for example, the depth of activity in the relevant market, the type of product, whether the product is new and not widely traded in the market, the maturity of market modelling and the nature of the transaction (bespoke or generic).
level 3: Valuation techniques that include significant inputs that are unobservable. To the extent that a valuation is based on inputs that are not market-observable, the determination of the fair value can be more subjective, dependent on the significance of the unobservable inputs to the overall valuation. unobservable inputs are determined based on the best information available and may include reference to similar instruments, similar maturities, appropriate proxies or other analytical techniques.

notes to the consolidated financial statements (continued)for the year ended 31 december
98
37 FAIR-VALuE MEASuREMENT – FINANCIAL INSTRuMENTS (continued)
37.3 Details of changes in valuation techniquesThere have been no changes to valuation techniques during the current year.
37.4 Significant transfers between level 1 and level 2There was a transfer of other short-term securities held for trading between level 1 and level 2 as the market in which the prices are quoted is no longer considered to be active.
37.5 Level 3 reconciliationAssets
rm
opening balance
at 1 January
Gains in profit
for the year
Gains in other
compre-hensive income
for the yearpurchases and issues
sales and settlements
transfers from level 2
transfers to level 2
Closing balance at
31 december
2014Held for trading 45 – – – (45) – – –Investment securities 45 (45)
Designated as at fair value 1 803 250 – 169 (491) – – 1 731Investments in private-equity associates, associate companies and joint arrangements 860 42 142 (146) 898Loans and advances 33 33Investment securities 910 208 27 (345) 800
total financial assets classified as level 3 1 848 250 – 169 (536) – – 1 731
rm
opening balance
at 1 January
Gains in profit /(losses)
for the year
Gains in other
compre-hensive income
for the yearpurchases and issues
sales and settlements
transfers from level 2
transfers to level 2
Closing balance at
31 december
2013Held for trading 54 11 – – (20) – – 45Derivative financial instruments 2 (2) –Investment securities 52 11 (18) 45
Designated as at fair value 2 138 (12) – 259 (582) – – 1 803Investments in private-equity associates, associate companies and joint arrangements 1 000 (22) 59 (177) 860Loans and advances 117 (84) 33Investment securities 1 021 10 200 (321) 910
total financial assets classified as level 3 2 192 (1) – 259 (602) – – 1 848
Liabilities
rm
opening balance
at 1 January
Gains in profit
for the year
Gains in other
compre-hensive income
for the yearpurchases and issues
sales and settlements
transfers from level 2
transfers to level 2
Closing balance at
31 december
2014Held for trading – – – 20 – – – 20Derivative financial instruments 20 20
Total financial liabilities classified as level 3 – – – 20 – – – 20
Gains and losses include, but are not limited to, fair-value gains or losses, translation gains or losses and trading gains or losses.2013Held for trading 1 – – – (1) – – –Derivative financial instruments 1 (1)
total financial liabilities classified as level 3 1 – – – (1) – – –
Gains and losses include, but are not limited to, fair-value gains or losses, translation gains or losses and trading gains or losses.

NedbaNk Group
99
Consolidated and separate annual
finanCial statements
37 FAIR-VALuE MEASuREMENT – FINANCIAL INSTRuMENTS (continued)
37.3 Details of changes in valuation techniquesThere have been no changes to valuation techniques during the current year.
37.4 Significant transfers between level 1 and level 2There was a transfer of other short-term securities held for trading between level 1 and level 2 as the market in which the prices are quoted is no longer considered to be active.
37.5 Level 3 reconciliationAssets
rm
opening balance
at 1 January
Gains in profit
for the year
Gains in other
compre-hensive income
for the yearpurchases and issues
sales and settlements
transfers from level 2
transfers to level 2
Closing balance at
31 december
2014Held for trading 45 – – – (45) – – –Investment securities 45 (45)
Designated as at fair value 1 803 250 – 169 (491) – – 1 731Investments in private-equity associates, associate companies and joint arrangements 860 42 142 (146) 898Loans and advances 33 33Investment securities 910 208 27 (345) 800
total financial assets classified as level 3 1 848 250 – 169 (536) – – 1 731
rm
opening balance
at 1 January
Gains in profit /(losses)
for the year
Gains in other
compre-hensive income
for the yearpurchases and issues
sales and settlements
transfers from level 2
transfers to level 2
Closing balance at
31 december
2013Held for trading 54 11 – – (20) – – 45Derivative financial instruments 2 (2) –Investment securities 52 11 (18) 45
Designated as at fair value 2 138 (12) – 259 (582) – – 1 803Investments in private-equity associates, associate companies and joint arrangements 1 000 (22) 59 (177) 860Loans and advances 117 (84) 33Investment securities 1 021 10 200 (321) 910
total financial assets classified as level 3 2 192 (1) – 259 (602) – – 1 848
Liabilities
rm
opening balance
at 1 January
Gains in profit
for the year
Gains in other
compre-hensive income
for the yearpurchases and issues
sales and settlements
transfers from level 2
transfers to level 2
Closing balance at
31 december
2014Held for trading – – – 20 – – – 20Derivative financial instruments 20 20
Total financial liabilities classified as level 3 – – – 20 – – – 20
Gains and losses include, but are not limited to, fair-value gains or losses, translation gains or losses and trading gains or losses.2013Held for trading 1 – – – (1) – – –Derivative financial instruments 1 (1)
total financial liabilities classified as level 3 1 – – – (1) – – –
Gains and losses include, but are not limited to, fair-value gains or losses, translation gains or losses and trading gains or losses.

notes to the consolidated financial statements (continued)for the year ended 31 december
100
37 FAIR-VALuE MEASuREMENT – FINANCIAL INSTRuMENTS (continued)
37.6 Unrealised gains and lossesThe unrealised gains or losses arising on instruments classified as level 3 include the following:
2014Rm
2013Rm
Trading income 11
Private-equity gains/(losses) 193 (12)
193 (1)
37.7 Effect of changes in significant unobservable assumptions to reasonable possible alternativesThe fair-value measurement of financial instruments are, in certain circumstances, measured using valuation techniques that include assumptions that are not market observable. Where these scenarios apply, the group performs stress testing on the fair value of the relevant instruments. In performing the stress testing, appropriate levels for the unobservable input parameters are chosen so that they are consistent with prevailing market evidence and in line with the group’s approach to valuation control.
The sensitivity of the fair-value measurement is determined on the unobservable market inputs. Significant changes to the unobservable inputs in isolation will have either a positive or negative impact on the fair value. The following information is intended to illustrate the potential impact of the relative uncertainty in the fair value of financial instruments for which valuation is dependent on unobservable input parameters and which are classified as level 3 in the fair value hierarchy. However, it is unlikely in practice that all unobservable parameters would simultaneously be at the extremes of their ranges of reasonably possible alternatives. Furthermore, the disclosure is neither predictive nor indicative of future movements in fair value.
The following table shows the effect on fair value of changes in unobservable input parameters to reasonable possible alternative assumptions:
Valuation technique
principle assumption stressed
stress parameters%
amounts recognised in the statement of financial position
rm
favourable change in fair value due to stress test
rm
unfavourable change in fair value due to stress test
rm
2014assetsLoans and advances discounted cashflows Credit spreads and discount
rates between (13) and 13 33 3 (4)Investment securities discounted cashflows,
adjusted net asset value, earnings multiples, third-party valuations, dividend yields
Valuation multiples, correlations, volatilities and credit spreads
between (13) and 13 800 76 (95)
Investments in private-equity associates, associate companies and joint arrangements
discounted cashflows, earnings multiples
Valuation multiples between (16) and 16 898 124 (134)
total financial assets classified as level 3 1 731 203 (233)
liabilities
Derivative financial instruments discounted cashflows, earnings multiples
Growth rates, cost of equity and price-to-book between (13) and 13 (20) 15 (21)
Valuation technique
principle assumption stressed
stress parameters%
amounts recognised in the statement of financial position
rm
favourable change in fair value due to stress test
rm
unfavourable change in fair value due to stress test
rm
2013assetsLoans and advances Discounted cashflows Credit spreads and discount rates between (14) and 14 33 3 (4)Investment securities Discounted cashflows, adjusted
net asset value, earnings multiples, third-party valuations, dividend yields
Valuation multiples, correlations, volatilities and credit spreads
between (25) and 25 955 104 (119)
Investments in private-equity associates, associate companies and joint arrangements
Discounted cashflows, earnings multiples
Valuation multiplesbetween (11) and 11 860 83 (93)
total financial assets classified as level 3 1 848 190 (216)

NedbaNk Group
101
Consolidated and separate annual
finanCial statements
37 FAIR-VALuE MEASuREMENT – FINANCIAL INSTRuMENTS (continued)
37.6 Unrealised gains and lossesThe unrealised gains or losses arising on instruments classified as level 3 include the following:
2014Rm
2013Rm
Trading income 11
Private-equity gains/(losses) 193 (12)
193 (1)
37.7 Effect of changes in significant unobservable assumptions to reasonable possible alternativesThe fair-value measurement of financial instruments are, in certain circumstances, measured using valuation techniques that include assumptions that are not market observable. Where these scenarios apply, the group performs stress testing on the fair value of the relevant instruments. In performing the stress testing, appropriate levels for the unobservable input parameters are chosen so that they are consistent with prevailing market evidence and in line with the group’s approach to valuation control.
The sensitivity of the fair-value measurement is determined on the unobservable market inputs. Significant changes to the unobservable inputs in isolation will have either a positive or negative impact on the fair value. The following information is intended to illustrate the potential impact of the relative uncertainty in the fair value of financial instruments for which valuation is dependent on unobservable input parameters and which are classified as level 3 in the fair value hierarchy. However, it is unlikely in practice that all unobservable parameters would simultaneously be at the extremes of their ranges of reasonably possible alternatives. Furthermore, the disclosure is neither predictive nor indicative of future movements in fair value.
The following table shows the effect on fair value of changes in unobservable input parameters to reasonable possible alternative assumptions:
Valuation technique
principle assumption stressed
stress parameters%
amounts recognised in the statement of financial position
rm
favourable change in fair value due to stress test
rm
unfavourable change in fair value due to stress test
rm
2014assetsLoans and advances discounted cashflows Credit spreads and discount
rates between (13) and 13 33 3 (4)Investment securities discounted cashflows,
adjusted net asset value, earnings multiples, third-party valuations, dividend yields
Valuation multiples, correlations, volatilities and credit spreads
between (13) and 13 800 76 (95)
Investments in private-equity associates, associate companies and joint arrangements
discounted cashflows, earnings multiples
Valuation multiples between (16) and 16 898 124 (134)
total financial assets classified as level 3 1 731 203 (233)
liabilities
Derivative financial instruments discounted cashflows, earnings multiples
Growth rates, cost of equity and price-to-book between (13) and 13 (20) 15 (21)
Valuation technique
principle assumption stressed
stress parameters%
amounts recognised in the statement of financial position
rm
favourable change in fair value due to stress test
rm
unfavourable change in fair value due to stress test
rm
2013assetsLoans and advances Discounted cashflows Credit spreads and discount rates between (14) and 14 33 3 (4)Investment securities Discounted cashflows, adjusted
net asset value, earnings multiples, third-party valuations, dividend yields
Valuation multiples, correlations, volatilities and credit spreads
between (25) and 25 955 104 (119)
Investments in private-equity associates, associate companies and joint arrangements
Discounted cashflows, earnings multiples
Valuation multiplesbetween (11) and 11 860 83 (93)
total financial assets classified as level 3 1 848 190 (216)

notes to the consolidated financial statements (continued)for the year ended 31 december
102
37 FAIR-VALuE MEASuREMENT – FINANCIAL INSTRuMENTS (continued)
37.8 Fair-value approximates carrying valueCertain financial instruments of the group are not carried at fair value, including those categorised as held to maturity, loans and receivables, and other financial assets and financial liabilities at amortised cost. The calculation of the fair value of these financial instruments incorporates the group’s best estimate of the value at which these financial assets could be exchanged, or financial liabilities transferred, between market participants at the measurement date. The group’s estimate of what fair value is does not necessarily represent what it would be able to sell the asset for or transfer the respective financial liability for in an involuntary liquidation or distressed sale.
The fair values of these respective financial instruments at the reporting date detailed below are estimated only for the purpose of IFRS disclosure, as follows:Loans and advancesLoans and advances, recognised in note 18, that are not recognised at fair value, principally comprise variable-rate financial assets. The interest rates on these variable rate-financial assets are adjusted when the applicable benchmark interest rate changes.
Loans and advances are not actively traded in most markets and it is therefore not possible to determine the fair value of these loans and advances using observable market prices and market inputs. Due to the unique characteristics of the loans and advances portfolio and the fact that there have been no recent transactions involving the disposals of such loans and advances, there is no basis to determine a price that could be negotiated between market participants in an orderly transaction. The group is not currently in the position of a forced sale of such underlying loans and advances and it would therefore be inappropriate to value the loans and advances on a forced-sale basis.
For specifically impaired loans and advances, the carrying value as determined after consideration of the group’s IAS 39 credit impairments, is considered the best estimate of fair value.
The group has developed a methodology and model to determine the fair value of the gross exposures for the performing loans and advances measured at amortised cost. This model incorporates the use of average interest rates and projected monthly cashflows per product type. Future cashflows are discounted using interest rates at which similar loans would be granted to borrowers with similar credit ratings and maturities. Methodologies and models are updated on a continuous basis for changes in assumptions, forecasts and modelling techniques. Future forecasts of the group’s probability of default (PDs) and loss given defaults (LGDs) for periods 2015 to 2017 (2013: for periods 2014 to 2017) are based on the latest available internal data and applied to the first three years’ projected cashflows. Thereafter, PDs and LGDs are gradually reverted to their long-run averages and are applied to the remaining projected cashflows. Inputs into the model include various assumptions utilised in the pricing of loans and advances. The determination of such inputs is highly subjective and therefore any change to one or more of the assumptions may result in a significant change in the determination of the fair value of loans and advances.
The results of these fair-value calculations are summarised below:
2014 2013
Positive scenario (%) 0,28 (0,88)Base scenario (%) (0,09) (1,27)
Mild-risk scenario (%) (0,62) (1,83)
The table above indicates the differential between the fair value of performing loans and advances and the carrying value thereof. The scenarios are based on the group’s assessment of future economic developments. Positive percentages (without brackets) indicate that the fair value of the performing loans and advances is greater than the carrying value. Similarly, negative percentages (included in brackets) indicate that the fair value of the performing loans and advances is less than its carrying value.
In the current year under review, the current carrying value of the loans and advances is greater than the calculated fair value. Loans and advances granted in prior periods, which are still performing, were priced at lower contractual interest rates compared to the higher pricing that loans and advances are currently contracted at within current circumstances. The estimated cashflows on the prior period underlying loans and advances are thus discounted at a higher rate to determine the fair value, compared to the lower contractual rate at inception date, resulting in a lower fair-value than the current carrying value.
The group is of the opinion that the carrying value of loans and advances approximates fair value. Loans and advances would be classified into level 3 of the fair-value hierarchy.
Government and other securitiesThe fair value of government and other securities are determined based on available market prices and directors' valuations where appropriate. See note 17 for further detail. Government and other securities would be classified into level 1 (available market prices) and level 2 (directors' valuations) of the fair-value hierarchy.
Other financial assets (excluding government and other securities and loans and advances) and financial liabilities (excluding amounts owed to depositors and long-term debt instruments)The carrying values of cash and cash equivalents, other assets, mandatory deposits with central banks and provisions and other liabilities are considered a reasonable approximation of their respective fair values, as they are either short term in nature or are repriced to current market rates at frequent intervals. Other financial assets and other financial liabilities would be classified into level 1 of the fair value hierarchy.
Amounts owed to depositorsThe group is of the opinion that the carrying value of variable-rate amounts owed to depositors approximates fair value. Amounts owed to depositors would be classified into level 2 of the fair-value hierarchy.
Long-term debt instrumentsThe group is of the opinion that the carrying value of variable-rate long-term debt instruments approximates fair value. Long-term debt instruments would generally be classified into level 1 or level 2 of the fair-value hierarchy.

NedbaNk Group
103
Consolidated and separate annual
finanCial statements
38 FINANCIAL INSTRuMENTS DESIGNATED AS AT FAIR VALuE THROuGH PROFIT OR LOSSThe group has satisfied the criteria for designation of financial instruments as at fair value through profit or loss in terms of the accounting policies.
Various fixed-rate advances and liabilities are entered into by the group. The overall interest-rate risk of the group is economically hedged by way of interest rate swaps and managed by the Group ALCO. The interest rate risk is then traded to the market through the central trading desk.
The swaps and frontdesk trading instruments meet the definition of 'derivatives', and are measured at fair value in terms of IAS 39. Fixed-rate advances and liabilities, however, do not meet this definition. Therefore, to avoid any accounting mismatch of holding the advances at amortised cost and the hedging instruments at fair value, the advances and liabilities are designated as at fair value through profit or loss and are held at fair value.
Various instruments are designated as at fair value through profit or loss, which is consistent with the group's documented risk management or investment strategy. The fair value of the instruments is managed and reviewed on a regular basis by the risk/investment functions of the group. The risk of the portfolio is measured and monitored on a fair-value basis.
38.1 Financial assets designated as at fair value through profit or loss
rm
Change in fair value due to change in credit risk¹
maximum exposure to credit risk Current period Cumulative
2014 2013 2014 2013 2014 2013
Negotiable certificates of deposit purchased 620 Treasury bills 15 069 11 322 Government guaranteed 2 880 3 657 Other dated securities 5 810 6 537 Mortgage loans 20 785 19 698 2 26 (2) (4)Installment credit 19 030 17 169 Leases and debentures 44 26 Other lending-related investments 23 23 Preference shares 2 012 2 522 Loans and advances (secured and unsecured) 5 588 7 400 Foreign correspondents 4 188 6 229 Other loans 8 331 7 596 Loans to other banks 240 266 Debtors and accruals 383 335 Private-equity associates, associate companies and joint arrangements 898 860 Listed investments 624 818 unlisted investments 2 752 2 872 Policyholder assets (68) (88)
Policyholder investments 16 234 15 221
105 443 102 463 2 26 (2) (4)1 Positive amounts represent gains while negative amounts represent losses. See note 18.1.
Nedbank Group has estimated the change in credit risk as being the amount arising from the change in fair value of the financial instrument that is not attributable to changes in market conditions that give rise to market risk. Individual credit spreads for loans or receivables that have been designated as at fair value through profit or loss are determined at inception of the deal. The credit spread is calculated as the difference between the benchmark interest rate and the interest rate charged to the client. Subsequent changes in the benchmark interest rate and the credit spread give rise to changes in fair value in the financial instrument. Loans and advances are reviewed for observable changes in credit risk and the credit spread is adjusted at subsequent dates if there has been an observable change in credit risk relating to a particular loan or advance. No credit derivatives are used to hedge the credit risk on any of the financial assets designated as at fair value through profit or loss.
A breakdown of the financial assets which are designated as at fair value through profit or loss can be found in note 36. A detailed explanation of how each financial asset is valued can be found in note 37.1.
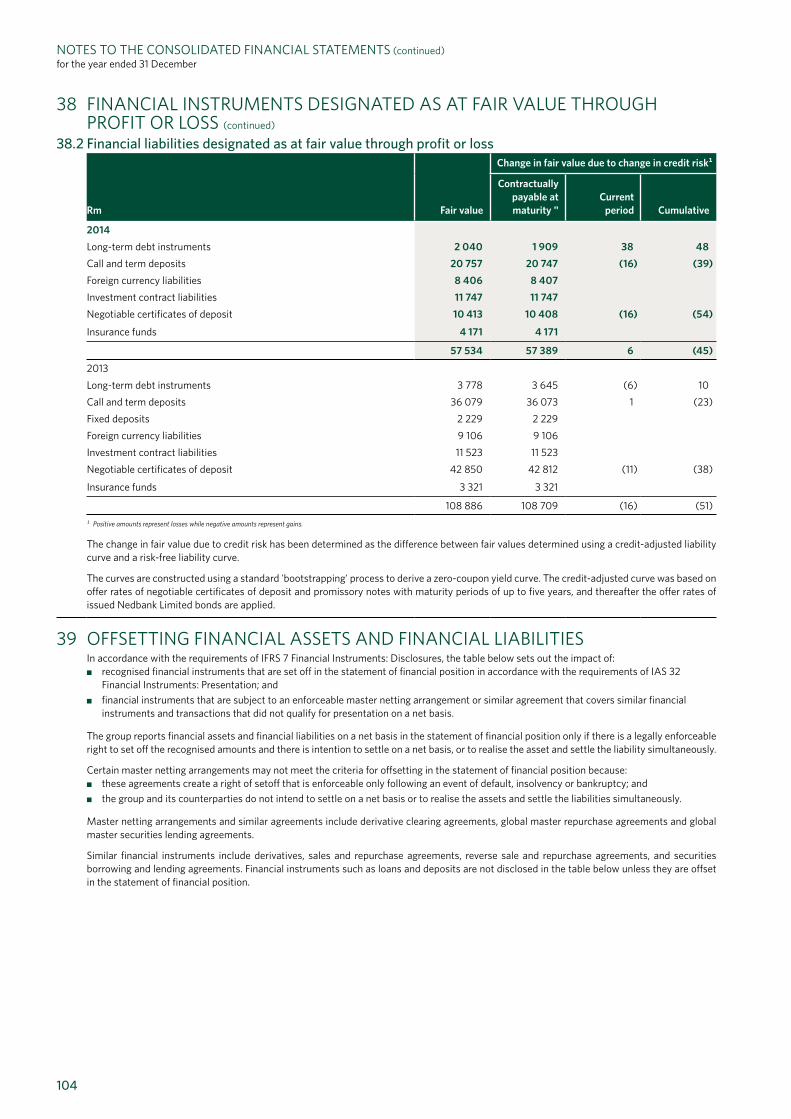
notes to the consolidated financial statements (continued)for the year ended 31 december
104
38 FINANCIAL INSTRuMENTS DESIGNATED AS AT FAIR VALuE THROuGH PROFIT OR LOSS (continued)
38.2 Financial liabilities designated as at fair value through profit or loss
rm fair value
Change in fair value due to change in credit risk¹
Contractuallypayable at maturity "
Current period Cumulative
2014Long-term debt instruments 2 040 1 909 38 48 Call and term deposits 20 757 20 747 (16) (39)Foreign currency liabilities 8 406 8 407 Investment contract liabilities 11 747 11 747 Negotiable certificates of deposit 10 413 10 408 (16) (54)
Insurance funds 4 171 4 171
57 534 57 389 6 (45)
2013Long-term debt instruments 3 778 3 645 (6) 10 Call and term deposits 36 079 36 073 1 (23)Fixed deposits 2 229 2 229 Foreign currency liabilities 9 106 9 106 Investment contract liabilities 11 523 11 523 Negotiable certificates of deposit 42 850 42 812 (11) (38)
Insurance funds 3 321 3 321
108 886 108 709 (16) (51)
¹ Positive amounts represent losses while negative amounts represent gains.
The change in fair value due to credit risk has been determined as the difference between fair values determined using a credit-adjusted liability curve and a risk-free liability curve.
The curves are constructed using a standard 'bootstrapping' process to derive a zero-coupon yield curve. The credit-adjusted curve was based on offer rates of negotiable certificates of deposit and promissory notes with maturity periods of up to five years, and thereafter the offer rates of issued Nedbank Limited bonds are applied.
39 OFFSETTING FINANCIAL ASSETS AND FINANCIAL LIABILITIESIn accordance with the requirements of IFRS 7 Financial Instruments: Disclosures, the table below sets out the impact of:
■ recognised financial instruments that are set off in the statement of financial position in accordance with the requirements of IAS 32 Financial Instruments: Presentation; and
■ financial instruments that are subject to an enforceable master netting arrangement or similar agreement that covers similar financial instruments and transactions that did not qualify for presentation on a net basis.
The group reports financial assets and financial liabilities on a net basis in the statement of financial position only if there is a legally enforceable right to set off the recognised amounts and there is intention to settle on a net basis, or to realise the asset and settle the liability simultaneously.
Certain master netting arrangements may not meet the criteria for offsetting in the statement of financial position because: ■ these agreements create a right of setoff that is enforceable only following an event of default, insolvency or bankruptcy; and ■ the group and its counterparties do not intend to settle on a net basis or to realise the assets and settle the liabilities simultaneously.
Master netting arrangements and similar agreements include derivative clearing agreements, global master repurchase agreements and global master securities lending agreements.
Similar financial instruments include derivatives, sales and repurchase agreements, reverse sale and repurchase agreements, and securities borrowing and lending agreements. Financial instruments such as loans and deposits are not disclosed in the table below unless they are offset in the statement of financial position.

NedbaNk Group
105
Consolidated and separate annual
finanCial statements
39 OFFSETTING FINANCIAL ASSETS AND FINANCIAL LIABILITIES (continued)
rm
effects of netting on the statementof financial position
related amounts not set off in the statement of financial position
Grossamounts
amounts set off in the
statementof financial position in
accordance with ias 32
net amountsincluded
in the statement of financial
position¹
amounts that may
be netted off on the
occurrence of a future
eventfinancial collateral
net amounts
reflecting the effect of master
netting arrangements
amounts not subject
to ifrs 7 offsetting
disclosure²
total amounts
recognised in the
statement of financial
position
2014Derivative financial instruments (2 677) 2 788 111 (111) (10) 101– Assets 15 540 33 15 573– Liabilities (15 429) (43) (15 472)Assets excluding derivative financial instruments 5 387 (2 874) 2 513 – – 2 513 610 508 613 021– Loans and advances 5 387 (2 874) 2 513 2 513 610 508 613 021Liabilities excluding derivative financial instruments (88 695) 29 516 (59 179) – – (59 179) (594 271) (653 450)– Amounts owed to depositors (88 695) 29 516 (59 179) (59 179) (594 271) (653 450)2013Derivative financial instruments³ (2 956) (2 956) 506 (2 450) (234) (3 190)– Assets 13 004 386 13 390– Liabilities (15 960) (620) (16 580)Assets excluding derivative financial instruments³ 2 885 (831) 2 054 – – 2 054 577 318 579 372– Loans and advances 2 885 (831) 2 054 2 054 577 318 579 372Liabilities excluding derivative financial instruments³ (71 322) 16 187 (55 135) – – (55 135) (547 817) (602 952)– Amounts owed to depositors (71 322) 16 187 (55 135) (55 135) (547 817) (602 952)
¹ Includes the net amount of financial assets and financial liabilities where offsetting has been applied in terms of IAS 32 and financial instruments that are subject to master netting agreements but where no offsetting has been applied. Excludes financial instruments that are neither subject to setoff nor master netting agreements.
² Includes financial instruments that are neither subject to setoff nor master netting agreements.³ During 2014 the group enhanced its accounting processes and management information and expanded the disclosure relating to the offsetting of financial assets and liabilities in its consolidated financial statements.
This expanded disclosure resulted in a restatement to 2013 comparative information.

106
NOTES TO THE CONSOLIDATED FINANCIAL STATEMENTS (continued)for the year ended 31 December
40 CREDIT ANALYSIS OF OTHER SHORT-TERM SECuRITIES, AND GOVERNMENT AND OTHER SECuRITIES
investment grade subinvestment grade not rated total
2014rm
2013Rm
2014rm
2013Rm
2014rm
2013Rm
2014rm
2013Rm
Credit ratingsOther short-term securities 65 148 41 568 1 877 796 209 87 67 234 42 451Negotiable certificates of deposit 16 193 16 095 602 16 795 16 095Treasury bills and other 48 955 25 473 1 275 796 209 87 50 439 26 356
Government and other securities 25 413 30 481 1 294 1 610 470 – 27 177 32 091Government and government-guaranteed securities 13 483 17 447 600 437 93 14 176 17 884Other dated securities 11 930 13 034 694 1 173 377 13 001 14 207
90 561 72 049 3 171 2 406 679 87 94 411 74 542
All debt securities that are purchased by the group are rated using an internal rating system, being the Nedbank Group Rating (NGR) scale. The group requires that all investments be rated using the NGR scale to ensure that credit risk is measured consistently and accurately across the group. This ensures compliance with the group's policy surrounding the rating of investments. The NGR scale has been mapped to the Standard & Poor's credit rating system. According to the NGR scale investment grade can be equated to a Standard & Poor's rating of above BBB-. All government and other short-term securities are current and not impaired. Investment grade includes credit ratings from NGR01 to NGR11 and subinvestment grade includes credit ratings from NGR12 to NGR25.
41 LIquIDITY GAP
rm <3 months >3 months <6 months
>6 months <1 year
>1 year <5 years >5 years
non-deter– mined total
2014Cash and cash equivalents (including mandatory reserve deposits with central banks) 27 930 220 100 28 250Other short-term securities 30 050 14 821 16 743 5 620 67 234Derivative financial instruments 2 750 555 1 187 5 119 5 962 15 573Government and other securities 550 290 3 888 16 713 5 736 27 177Loans and advances 128 855 21 935 40 827 262 405 158 999 613 021
Other assets 58 058 58 058
190 135 37 821 62 745 289 857 170 697 58 058 809 313
Total equity 70 911 70 911Derivative financial instruments 1 973 407 914 4 831 7 347 15 472Amounts owed to depositors 477 516 46 970 48 900 69 513 10 551 653 450Provisions and other liabilities 11 747 22 095 33 842
Long-term debt instruments 1 354 1 576 5 706 22 328 4 674 35 638
492 590 48 953 55 520 96 672 22 572 93 006 809 313
Net liquidity gap (302 455) (11 132) 7 225 193 185 148 125 (34 948) –
2013Cash and cash equivalents (including mandatory reserve deposits with central banks) 34 073 34 073Other short-term securities 16 308 11 715 10 803 3 625 42 451Derivative financial instruments 1 261 852 989 5 368 4 920 13 390Government and other securities 4 455 797 3 122 18 666 5 051 32 091Loans and advances 123 578 22 318 39 657 240 069 153 750 579 372
Other assets 48 217 48 217
179 675 35 682 54 571 267 728 163 721 48 217 749 594
Total equity 64 336 64 336Derivative financial instruments 1 600 940 1 107 5 544 7 389 16 580Amounts owed to depositors 424 869 47 914 54 881 69 907 5 381 602 952Provisions and other liabilities 11 523 20 935 32 458
Long-term debt instruments 3 106 494 1 162 24 882 3 624 33 268
441 098 49 348 57 150 100 333 16 394 85 271 749 594
Net liquidity gap (261 423) (13 666) (2 579) 167 395 147 327 (37 054) –
This note has been prepared on a contractual maturity basis.

NedbaNk Group
107
Consolidated and separate annual
finanCial statements
42 CONTRACTuAL MATuRITY ANALYSIS FOR FINANCIAL LIABILITIES
rm
statement of financial
position amount <3 months
>3 months<6 months
>6 months<1 year
>1 year< 5 years >5 years
non-determinable
maturity total
2014Long-term debt instruments 35 638 1 891 2 026 6 934 27 312 5 302 43 465Investment contract liabilities 11 747 11 747 11 747Insurance contract liabilities 4 171 4 171 4 171Amounts owed to depositors 653 450 480 872 49 208 51 926 75 700 10 758 – 668 464Current accounts 65 170 65 171 65 171Savings deposits 25 386 25 387 25 387Other deposits and loan accounts 449 705 334 678 31 032 31 191 50 249 10 671 457 821Foreign currency liabilities 30 153 25 659 2 315 1 160 1 020 30 154Negotiable certificates of deposit 70 377 17 305 15 861 19 575 24 431 87 77 259Deposits received under repurchase agreements 12 659 12 672 12 672
Derivative financial instruments – liabilities 15 472 1 973 407 914 4 831 7 347 15 472
Provisions and other liabilities 17 924 17 924 17 924
738 402 496 483 51 641 59 774 107 843 23 407 22 095 761 243
Guarantees on behalf of clients 23 778 23 778 23 778Confirmed letters of credit and discounting transactions 3 262 3 262 3 262
unutilised facilities and other 104 429 104 429 104 429
131 469 131 469 – – – – – 131 469
2013Long-term debt instruments 33 268 3 641 810 2 145 30 215 4 120 40 931Investment contract liabilities 11 523 11 523 11 523Insurance contract liabilities 3 321 3 321 3 321Amounts owed to depositors 602 952 428 353 50 542 58 093 75 169 5 513 – 617 670Current accounts 58 704 58 671 5 30 58 706Savings deposits 22 631 22 615 3 14 22 632Other deposits and loan accounts 407 593 299 872 22 439 35 259 52 831 5 422 415 823Foreign currency liabilities 14 309 12 687 1 622 14 309Negotiable certificates of deposit 87 457 22 243 28 095 21 212 22 294 91 93 935Deposits received under repurchase agreements 12 258 12 265 12 265
Derivative financial instruments – liabilities 16 580 1 600 940 1 107 5 544 7 389 16 580
Provisions and other liabilities 17 614 17 614 17 614
685 258 445 117 52 292 61 345 110 928 17 022 20 935 707 639
Guarantees on behalf of clients 35 806 35 806 35 806Confirmed letters of credit and discounting transactions 3 205 3 205 3 205
unutilised facilities and other 95 255 95 255 95 255
134 266 134 266 – – – – – 134 266
Provisions and other liabilities are included in this table in order to provide a reconciliation with the statement of financial position.

108
NOTES TO THE CONSOLIDATED FINANCIAL STATEMENTS (continued)for the year ended 31 December
43 HISTORICAL VALuE AT RISK (99%, ONE-DAY) BY RISK TYPE
rm
2014 2013
average minimum maximum year-end Average Minimum Maximum Year-end
Foreign exchange 3,7 0,6 10,7 0,9 2,2 0,6 9,4 1,4Interest rate 7,8 5,2 12,1 5,8 4,5 2,6 11,1 11,1Equity products 2,0 0,6 5,7 1,1 1,6 0,6 5,4 1,1Credit 3,8 2,7 5,3 5,3 3,2 2,4 4,7 2,8Commodity 0,3 0,9 0,9 0,4 3,0 0,1
Diversification (6,9) (4,8) (5,3) (5,7)
Total VaR exposure 10,7 6,9 16,5 9,2 6,6 4,1 11,4 10,8
The Worldclass at Managing Risk section of the group's integrated report, available at nedbankgroup.co.za, contains information on the group trading book VaR and the comparison of trading VaR.
44 INTEREST RATE REPRICING GAP
rm <3 months >3 months <6 months
>6 months <1 year
>1 year <5 years >5 years
trading and non-rate total
2014Total assets 531 243 26 852 23 301 46 047 16 226 165 644 809 313Total equity and liabilities 487 151 26 259 27 245 16 518 4 768 247 372 809 313Interest rate hedging activities 24 380 7 528 1 270 (25 085) (8 093)Repricing profile 68 472 8 121 (2 674) 4 444 3 365 (81 728)Cumulative repricing profile 68 472 76 593 73 919 78 364 81 729
Expressed as a percentage of total assets 8,5 9,5 9,1 9,7 10,1
2013Total assets 521 808 19 146 7 844 45 867 18 564 136 365 749 594Total equity and liabilities 461 483 35 284 27 927 17 230 3 900 203 770 749 594Interest rate hedging activities (8 666) 27 391 18 045 (24 708) (12 062)Repricing profile 51 659 11 253 (2 038) 3 929 2 602 (67 405)Cumulative repricing profile 51 659 62 912 60 874 64 803 67 405
Expressed as a percentage of total assets 6,9 8,4 8,1 8,6 9,0
The Worldclass at Managing Risk section of the group's integrated report, available at nedbankgroup.co.za, contains information on interest rate risk in the banking book.
45 SECuRITISATIONSNedbank Group Limited uses securitisation primarily as a funding diversification tool and to add flexibility in mitigating structural liquidity risk. The group currently has three active traditional securitisation transactions:
■ Synthesis Funding Ltd (Synthesis), an asset-backed commercial paper (ABCP) programme launched in 2004; ■ GreenHouse Funding (RF) Ltd, Series 2 (GreenHouse), a residential mortgage-backed securitisation programme; ■ GreenHouse Funding III (RF) Ltd, Series 3 (GreenHouse 3), a residential mortgage-backed securitisation programme; and ■ Precinct Funding 1 (RF) Ltd (Precinct), a commercial mortgage-backed securitisation programme.
Synthesis primarily invests in long-term rated bonds and offers capital market funding to SA corporates. These assets are funded through the issuance of short-dated investment-grade commercial paper to institutional investors. All the commercial paper issued by Synthesis is assigned the highest short-term RSA local-currency credit rating by Fitch, and is listed on the JSE Limited.
Greenhouse 1 securitised R2bn of home loans originated by Nedbank Retail in 2007. The notes issued to finance the purchase of the home loan portfolio were assigned credit ratings by both Fitch and Moody's and listed on the JSE Limited.
Greenhouse 1 was restructured and refinanced on 19 November 2012 as a static amortising structure. The proceeds from the refinance of this transaction, through the issuance of new notes and subordinated loans, was utilised to repay the R1,3bn existing notes and subordinated loans upon their scheduled maturity, and to acquire additional home loans. The senior notes, which are rated by Fitch and listed on the JSE Limited, were placed with third-party investors and the junior notes and subordinated loans retained by the group. The home loans transferred to Greenhouse have continued to be recognised as financial assets.
Greenhouse III, a second standalone RMBS programme was implemented during 2014. In anticipation of issuance of notes to the capital markets, a portfolio of R962m eligible residential mortgages originated by Nedbank Retail were sold to the vehicle and funded by way of a warehousing facility from Nedbank. It is anticipated that the notes will be issued in 2015.

NedbaNk Group
109
Consolidated and separate annual
finanCial statements
45 SECuRITISATIONS (continued)Precinct is a commercial mortgage-backed securitisation programme. The originator, seller and servicer of the commercial property loan portfolio is Nedbank Corporate Property Finance, the market leader in commercial property finance in South Africa, with a portfolio of R109,1bn.
The Precinct structure takes the form of a static pool of small commercial property loans with limited substitution and redraws/further advance capabilities. The pool of assets at 31 December 2012 (provisional pool of assets prior to inception) had an outstanding balance of R2,5bn with an open market value of the associated properties of R5,3bn.
Precinct has issued notes rated by Moody’s Investors Service and listed on the JSE Ltd. The A and B notes were placed to third party investors and the junior notes and subordinated loan retained by the group.
The following table shows the carrying amount of securitised assets, stated at the amount of the group’s continuing involvement where appropriate, together with the associated liabilities, for each category of asset in the statement of financial position:¹
rm
2014 2013
Carrying amount of
assetsassociated
liabilities
Carrying amount of
assetsAssociated
liabilities
loans and advances to customers:– Residential mortgage loans 2 520 2 743 1 762 1 994Less: Impairments (24) (26)
– Commercial mortgage loans 1 586 2 309 1 959 2 551Less: Impairments (4) (6)
other financial assets:– Corporate and bank paper 1 989 2 809– Other securities 1 295 2 286
– Commercial paper 3 285 5 096
Total 7 362 8 337 8 784 9 641
This table presents the gross balances within the securitisation schemes and does not reflect any eliminations of intercompany and cash balances held by the various securitisation vehicles.
¹ The value of any derivative instruments taken out to hedge any financial asset or liability, is adjusted against such instrument in this disclosure.
46 FOREIGN CuRRENCY CONVERSION GuIDEMonetary figures in these financial statements are expressed in SA rand to the nearest million. The approximate value of the SA rand at 31 December against the following currencies was:
2014actual
2013Actual
2014average
2013Average
united States dollar 0,08638 0,09524 0,09202 0,10289Pound sterling 0,05544 0,05759 0,05593 0,06590
Euro 0,07108 0,06915 0,06973 0,07752
47 CONTINGENT LIABILITIES AND uNDRAWN FACILITIES2014
rm2013
Rm
Guarantees on behalf of clients 23 778 35 806Letters of credit and discounting transactions 3 262 3 205
Irrevocable unutilised facilities and other 104 429 95 255
131 469 134 266
The group, in the ordinary course of business, enters into transactions that expose the group to tax, legal and business risks. Provisions are made for known liabilities that are expected to materialise (refer to note 40). Possible obligations and known liabilities where no reliable estimate can be made or it is considered improbable that an outflow would result are reported as contingent liabilities. This is in accordance with IAS 37: Provisions, Contingent Liabilities and Contingent Assets.

110
NOTES TO THE CONSOLIDATED FINANCIAL STATEMENTS (continued)for the year ended 31 December
47 CONTINGENT LIABILITIES AND uNDRAWN FACILITIES (continued)
There are a number of legal or potential claims against Nedbank Group Limited and its subsidiary companies, the outcome of which cannot at present be foreseen.
As disclosed in the group’s 2009 annual financial statements, the largest of these potential actions are claims in the High Court against Nedbank Limited by certain shareholders in Pinnacle Point Group Limited, alleging that Nedbank Limited had a legal duty of care to them arising from a share swap transaction. In 2013 two of these claims of R147m and of R802m were dismissed by the North Gauteng High Court. The only claim remaining is for R355m.
Originally these shareholders and others lodged proceedings with the Securities Regulation Panel (SRP) for an order declaring that an affected transaction took place. The SRP ruled that no affected transaction took place. The last remaining claimant brought an application to the South Gauteng High Court for the review of the SRP ruling. This application was dismissed with costs on 15 November 2013. The applicant filed a notice to apply for leave to appeal this judgment, and on 16 July 2014 the Supreme Court of Appeal ruled in Nedbank's favour by refusing the application.
During 2011 further actions were instituted against Nedbank Limited by other stakeholders for R210m, and by Absa Bank Limited for R773m. In both these actions Nedbank filed exceptions against the claims. On 25 August 2014, the R210m claim was withdrawn.
Nedbank Limited and its legal advisers remain of the opinion that the remaining claims are ambitious, and that the remaining claimants will have great difficulty succeeding.
48 COMMITMENTS48.1 Capital expenditure approved by directors
2014rm
2013Rm
Contracted 1 294 247
Not yet contracted 1 286 889
2 580 1 136
Funds to meet capital expenditure commitments will be provided from group resources. In addition, capital expenditure is incurred in the normal course of business throughout the year.
48.2 Operating lease commitmentsCompanies in the group have entered into leases over fixed property, furniture and other equipment for varying periods. The group is a major lessor of properties, which are subject to individual contracts that specify the group's option to renew leases, escalation clauses and purchase options, if applicable. Due to the large number of lease agreements entered into by the group, this information has not been provided in the annual financial statements, but is available from the group on request. The following are the minimum lease payments under non-cancellable leases:
20142015
rm 2016 – 2019
rm beyond 2019
rm
Land and buildings¹ 726 2 033 2 598
Furniture and equipment 286 173
1 012 2 206 2 598
20132014
Rm 2015 – 2018
Rm Beyond 2018
Rm
Land and buildings¹ 756 2 002 2 682
Furniture and equipment 246 410 2
1 002 2 412 2 6841 The group may from time to time enter into subleases of properties where it is the lessee. These subleases are considered to be immaterial in the context of the group's overall leasing arrangements.
The terms of renewal and escalation clauses are as follows:
The majority of material leases entered into by the group include an option to renew the lease. If the rental for the renewal period has not been agreed on or determined by the commencement date of the renewal period, the tenant must continue to pay the existing monthly rental. Once the rental is determined, cumulative adjustments will be made to the amount payable for the following month. Escalation clauses for major leases entered into by the group range between 6% and 10% per annum. For all major lease agreements entered into, there is no requirement to pay contingent rent or purchase options.
48.3 Commitments under derivative instrumentsThe group enters into option contracts, financial futures contracts, forward rate and interest rate swap agreements and other financial agreements in the normal course of business (note 16).
49 COLLATERAL49.1 COLLATERAL PLEDGED
The group has pledged government and other securities (note 17) and negotiable certificates of deposit (note 15) amounting to R13 818m (2013: R12 258m) as collateral for deposits received under repurchase agreements. These amounts represent assets that have been transferred, but that do not qualify for derecognition under IAS 39.
These transactions are entered into under terms and conditions that are standard industry practice to securities borrowing and lending activities.

NedbaNk Group
111
Consolidated and separate annual
finanCial statements
49.2 COLLATERAL HELD TO MITIGATE CREDIT RISKCredit risk mitigation refers to the actions that can be taken by the group to manage its exposure to credit risk so as to align such exposure to its risk appetite. This action can be proactive or reactive and the level of mitigation that a bank desires may be influenced by external factors such as the economic cycle or internal factors such as a change in risk appetite.
References to credit risk mitigation normally focus on the taking of collateral as well as the management of such collateral. While collateral is an essential component of credit risk mitigation there are a number of other methods used for mitigating credit risk. The group's credit risk policy acknowledges the role to be played by credit risk mitigation in the management of credit risk but emphasises that collateral on its own is not necessarily a justification for lending. The primary consideration for any lending opportunity should rather be the borrower's financial position and ability to repay the facility from its own resources and cashflow.
The group generally segregates collateral received into the following two classes:
(i) Financial collateral:The group takes financial collateral to support credit exposures in the trading book. This includes cash and debt securities in respect of derivative transactions.
These transactions are entered into under terms and conditions that are standard industry practice to securities borrowing and lending activities.
(ii) Non-financial collateral:
In secured financial transactions, the group takes other physical collateral to recover outstanding exposure in the event of the borrower being unable or unwilling to fulfil its obligations. This includes mortgages over property (both residential and commercial), liens over business assets (including, but not limited to, plant, vehicles, aircraft, inventories and trade debtors) and guarantees from parties other than the borrower.
Should a counterparty be unable to settle its obligations, the group takes possession of collateral as full or part settlement of such amounts. In general, the group seeks to dispose of such property and other assets that are not readily convertible into cash as soon as the market for the relevant asset permits.
The group monitors the concentration levels of collateral to ensure that it is adequately diversified. In particular, the following collateral types are common in the marketplace:
(i) Retail portfolio:
■ Mortgage lending secured by mortgage bonds over residential property; ■ Instalment credit transactions secured by the assets financed; and ■ Overdrafts that are either unsecured or secured by guarantees, suretyships or pledged securities.
(ii) Wholesale portfolio:
■ Commercial properties are supported by the property financed and a cession of the leases; ■ Instalment credit type of transactions that are secured by the assets financed; ■ Working capital facilities when secured usually by either a claim on specific assets (fixed assets, inventories or trade debtors) or other
collateral such as guarantees; ■ Term and structured lending which usually relies on guarantees or credit derivatives (where only internationally recognised and
enforceable agreements are used); and ■ Credit exposure to other banks where the risk is commonly mitigated through the use of financial control and netting agreements.
The valuation and management of collateral across all business units of the group are governed by the Group Credit Policy.
Management considers collateral held in the retail portfolio to be homogenous by nature and therefore more reliably identifiable. Generally, valuations in respect of mortgage portfolios are updated using statistical index models, published data by service providers are used for motor vehicles and physical inspection is performed for other types of collateral. Furthermore, physical valuations are performed six monthly on the defaulted book. At 31 December 2014 management considered R137 042m (2013: R132 268m) to be a reasonable estimate of the collateral held in the retail portfolio.
Management considers collateral held in the wholesale portfolio to be non-homogenous and often exhibiting illiquid characteristics and therefore valuing collateral of this nature requires a significant level of judgement. Collateral of this nature is valued at the inception of a transaction and at least annually during the life of the transaction usually as part of the facility review, which includes a review of the security structure and covenants to ensure that proper title is retained over the relevant collateral. At 31 December 2014 management considered R173 823m to be a reasonable estimate of the collateral held in the wholesale portfolio.
A further consideration with regard to the valuation and management of collateral is that when credit intervention is required, or in the case of default, all items of collateral relating to that particular client portfolio are immediately revalued. In such instances physical inspection by an expert valuer is required. This process also ensures that an appropriate impairment is evaluated timeously.
The group does not hold any collateral (financial or non-financial) that it is permitted to sell or repledge in the absence of default by its owner.
49.3 COLLATERAL TAKEN POSSESSION OF AND RECOGNISED IN THE STATEMENT OF FINANCIAL POSITIONIncluded in properties in possession (note 18.1) is an amount of R241m (2013: R555m), which represents assets the group has acquired during the year by taking possession of collateral held as security.

112
NOTES TO THE CONSOLIDATED FINANCIAL STATEMENTS (continued)for the year ended 31 December
50 MANAGED FuNDS2014
rm2013
Rm
50.1 Fair value of funds under management – by type unit trusts 154 869 135 327 Third party 1 846 1 760
Private clients 55 298 53 254
212 013 190 341
50.2 Fair value of funds under management – by geography SA 180 884 166 279
Rest of World 31 129 24 062
212 013 190 341
50.3 Reconciliation of movement in funds under management – by typeunit trusts
rmthird party
rmprivate clients
rmtotal
rm
Balance at 31 December 2012 101 036 1 060 48 399 150 495 Inflows 166 898 297 10 893 178 088 Outflows (150 153) (7) (12 396) (162 556)Mark-to-market value adjustment 14 027 79 5 902 20 008
Foreign currency translation differences 3 519 331 456 4 306
Balance at 31 December 2013 135 327 1 760 53 254 190 341 Inflows 209 746 16 10 054 219 816 Outflows (200 072) (153) (11 106) (211 331)Mark-to-market value adjustment 7 631 155 2 953 10 739
Foreign currency translation differences 2 237 68 143 2 448
Balance at 31 December 2014 154 869 1 846 55 298 212 013
50.4 Reconciliation of movement in funds under management – by geography
sarm
restof world
rmtotal
rm
Balance at 31 December 2012 133 991 16 504 150 495 Inflows 172 859 5 229 178 088 Outflows (157 786) (4 770) (162 556)Mark-to-market value adjustment 17 215 2 793 20 008
Foreign currency translation differences 4 306 4 306
Balance at 31 December 2013 166 279 24 062 190 341 Inflows 213 948 5 868 219 816 Outflows (208 727) (2 604) (211 331)Mark-to-market value adjustment 9 384 1 355 10 739
Foreign currency translation differences 2 448 2 448
Balance at 31 December 2014 180 884 31 129 212 013
The group, through a number of subsidiaries, operates unit trusts, holds and invests funds on behalf of clients and acts as a trustee in a number of fiduciary capacities. In addition, companies in the group operate securities and custodial services on behalf of clients. Commissions and fees earned in respect of trust and management activities performed are included in the consolidated statement of comprehensive income as non-interest revenue.

NedbaNk Group
113
Consolidated and separate annual
finanCial statements
51 SHARE-BASED PAYMENTSNedbank Group Limited shares, share options over Nedbank Group Limited shares and equity instruments in respect of Nedbank Group Limited shares are granted to employees as part of their remuneration package as services are rendered, as well as to clients, business partners and affinity groups as an incentive to retain business and develop growth within the group. The following are the share and share option schemes that have been in place during the year. All schemes are equity-settled at group level, except the Nedbank uK schemes and the Nedbank Wealth Management International schemes, both of which are cash-settled.
As the group cannot estimate reliably the fair value of services received nor the value of additional business received, the group rebuts the presumption that such services and business can be measured reliably. The group therefore measures their fair value by reference to the fair value of the shares, share options or equity instruments granted, in line with the group's accounting policy. The fair value of such shares, share options and equity instruments is measured at the grant date utilising the Black-Scholes valuation model.
51.1 Description of arrangements
scheme
trust/special-purpose vehicle (spV) description
Vesting requirements
maximum term
traditional employee schemes
Nedbank Group (2005) Share Option and Restricted Share Scheme
Nedbank Group (2005) Share Scheme Trust
Restricted shares are granted to key personnel to motivate senior employees to remain with the group. The granting of Restricted shares is based on job level, merit and performance, and is entirely at the discretion of the trustees acting on recommendations of executive management. Grants are made twice a year for new appointments and annually for existing staff on a date determined by the trustees.
2012, 2013 and 2014 grants: Three years' service and achievement of performance targets based on average return on equity and Nedbank Group Limited share price performance against the financial index. Where the performance target is not met, 50% will vest, provided that the three years' service has been achieved.
3 years
Nedbank Group (2005) Matched Share Scheme
Nedbank Group (2005) Share Scheme Trust
All employees of the group are eligible to participate in the scheme. An amount of not more than 50% of their after-tax bonus can be invested, which will be matched by the group with shares.
Three years' service and achievement of Nedbank Group Limited performance target. Where this performance targets is not met, 50% will vest provided that the three years' service has been achieved.
3 years
Old Mutual uK Sharesave Scheme
n/a All eligible employees of Nedbank Private Wealth Limited (Isle of Man) and Nedgroup Trust Limited (Guernsey) are entitled to participate in the Old Mutual uK Sharesave Plan, which allows them to elect to save between £5 and £250 per month over a three- or five-year period, and receive an option to purchase Old Mutual plc shares in the future at an exercise price that is set at the start of the plan. Invitations to participate in the plan are issued annually.
Completion of three or five years' service.
5,5 years
Nedbank uK Long term incentive Plan (LTIP)
n/a Employees who perform services in the united Kingdom on behalf of the group will be considered for participation in the uK LTIP. Selected employees will be granted share appreciation rights (SARs). SARs are similar to options in that SARs are granted at a predetermined exercised price vesting and expiry date. When the participant elects to exercise SARs, the employer settles the difference between the current market price and the exercise price in cash.
Completion of three years' service, from grant date subject to corporate performance targets being met.
3 years
Nedbank uK Matched Scheme
n/a All uK employees of the group are eligible to participate in the scheme. An amount of not more than 50% of their after-tax bonus can be invested, which will be matched by the group with shares.
Completion of three years' service, from grant date subject to corporate performance targets being met.
3 years

114
NOTES TO THE CONSOLIDATED FINANCIAL STATEMENTS (continued)for the year ended 31 December
51 SHARE-BASED PAYMENTS (continued)
51.1 Description of arrangements (continued)
Scheme
Trust/Special-purpose vehicle (SPV) Description
Vesting requirements
Maximum term
Nedbank Wealth Management International Long-term incentive Plan (LTIP)
n/a Restricted shares are granted to key Nedbank Wealth Management International personnel to motivate senior employees to remain with the group. The granting of restricted shares is based on job level, merit and performance, and is entirely at the discretion of the trustees acting on recommendations of executive management. Grants are made twice a year for new appointments and annually for existing staff on a date determined by the trustees.
Completion of three years' service, from grant date subject to corporate performance targets being met.
3 years
Nedbank Wealth Management International Matched Scheme
n/a All Nedbank Wealth Management International employees of the group are eligible to participate in the scheme. An amount of not more than 50% of their after-tax bonus can be invested, which will be matched by the group with shares.
Completion of three years' service, from grant date subject to corporate performance targets being met.
3 years
nedbank eyethu bee schemes - employees
Black Executive Scheme
Nedbank Eyethu Black Executive Trust
Restricted shares and share options were granted to certain black employees at a senior management level. The beneficial ownership of the shares resides with the participants, including the voting and dividend rights.
Participants must remain in service for four, five and six years, after each of which 1/3 of the shares become unrestricted and 1/3 of the options vest.
7 years
Black Management Scheme
Nedbank Eyethu Black Management Trust
Restricted shares and share options were granted to certain black employees at a middle- and senior-management level. The beneficial ownership of the shares resides with the participants, including the voting and dividend rights.
Participants must remain in service for four, five and six years, after each of which 1/3 of the shares become unrestricted and 1/3 of the options vest.
7 years
nedbank eyethu bee schemes – Clients and business partners
Black Business Partner Scheme
WIPHOLD Financial Services Number Two Trust and Brimstone-Mtha Financial Services Trust
Each trust was issued an equal number of restricted shares at R1,87 per share, with notional funding over a period of 10 years. The beneficial ownership of the shares resides with the participants, including the voting and dividend rights.
No dealing in the shares during the 10-year notional funding period.
10 years
Community Trust
Nedbank Eyethu Community Trust
The trust has been formed with the specific purpose of providing previously disadvantaged communities and charitable organisations with the opportunity to receive dividends in respect of the scheme shares and thereby contributing to Nedbank Group Limited’s BEE compliance.
Shares are not allocated to specific beneficiaries. At the end of the 10 years, the net assets of the trust will be allocated to participants as determined by the trustees.
10 yearsSubsequent to December 2013 the termination date of the trust was extended from 2015 to 2030 so as to provide an ongoing flexible vehicle for deploying the residual assets of the trust and continued support of community affairs in line with the group's BEE and Fair Share 2030 initiatives.
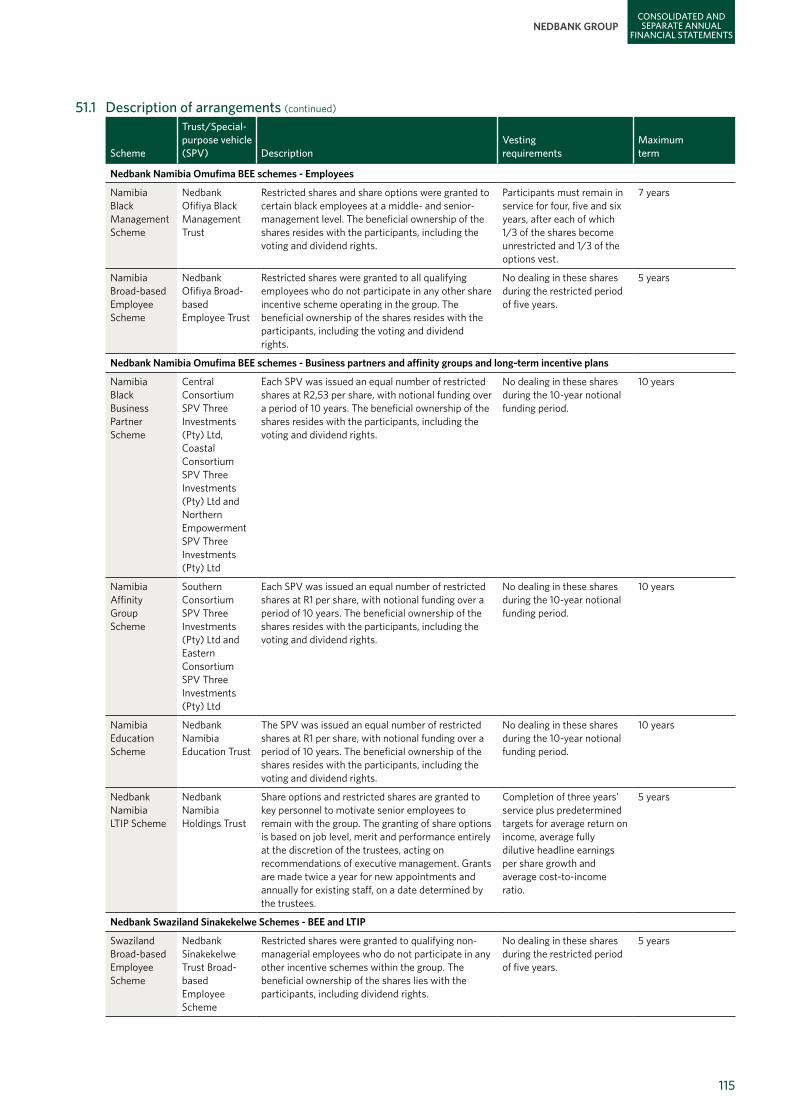
NedbaNk Group
115
Consolidated and separate annual
finanCial statements
51.1 Description of arrangements (continued)
Scheme
Trust/Special-purpose vehicle (SPV) Description
Vesting requirements
Maximum term
nedbank namibia omufima bee schemes - employees
Namibia Black Management Scheme
Nedbank Ofifiya Black Management Trust
Restricted shares and share options were granted to certain black employees at a middle- and senior-management level. The beneficial ownership of the shares resides with the participants, including the voting and dividend rights.
Participants must remain in service for four, five and six years, after each of which 1/3 of the shares become unrestricted and 1/3 of the options vest.
7 years
Namibia Broad-based Employee Scheme
Nedbank Ofifiya Broad-based Employee Trust
Restricted shares were granted to all qualifying employees who do not participate in any other share incentive scheme operating in the group. The beneficial ownership of the shares resides with the participants, including the voting and dividend rights.
No dealing in these shares during the restricted period of five years.
5 years
nedbank namibia omufima bee schemes - business partners and affinity groups and long-term incentive plans
Namibia Black Business Partner Scheme
Central Consortium SPV Three Investments (Pty) Ltd, Coastal Consortium SPV Three Investments (Pty) Ltd and Northern Empowerment SPV Three Investments (Pty) Ltd
Each SPV was issued an equal number of restricted shares at R2,53 per share, with notional funding over a period of 10 years. The beneficial ownership of the shares resides with the participants, including the voting and dividend rights.
No dealing in these shares during the 10-year notional funding period.
10 years
Namibia Affinity Group Scheme
Southern Consortium SPV Three Investments (Pty) Ltd and Eastern Consortium SPV Three Investments (Pty) Ltd
Each SPV was issued an equal number of restricted shares at R1 per share, with notional funding over a period of 10 years. The beneficial ownership of the shares resides with the participants, including the voting and dividend rights.
No dealing in these shares during the 10-year notional funding period.
10 years
Namibia Education Scheme
Nedbank Namibia Education Trust
The SPV was issued an equal number of restricted shares at R1 per share, with notional funding over a period of 10 years. The beneficial ownership of the shares resides with the participants, including the voting and dividend rights.
No dealing in these shares during the 10-year notional funding period.
10 years
Nedbank Namibia LTIP Scheme
Nedbank Namibia Holdings Trust
Share options and restricted shares are granted to key personnel to motivate senior employees to remain with the group. The granting of share options is based on job level, merit and performance entirely at the discretion of the trustees, acting on recommendations of executive management. Grants are made twice a year for new appointments and annually for existing staff, on a date determined by the trustees.
Completion of three years' service plus predetermined targets for average return on income, average fully dilutive headline earnings per share growth and average cost-to-income ratio.
5 years
nedbank swaziland sinakekelwe schemes - bee and ltip
Swaziland Broad-based Employee Scheme
Nedbank Sinakekelwe Trust Broad-based Employee Scheme
Restricted shares were granted to qualifying non-managerial employees who do not participate in any other incentive schemes within the group. The beneficial ownership of the shares lies with the participants, including dividend rights.
No dealing in these shares during the restricted period of five years.
5 years

116
NOTES TO THE CONSOLIDATED FINANCIAL STATEMENTS (continued)for the year ended 31 December
51 SHARE-BASED PAYMENTS (continued)
51.1 Description of arrangements (continued)
Scheme
Trust/Special-purpose vehicle (SPV) Description
Vesting requirements
Maximum term
Swaziland Management Scheme
Nedbank Sinakekelwe Trust Management Scheme
Restricted shares and share options were granted to key management personnel as an incentive to remain within the group. Grants are allocated on the basis of job level, performance, potential and skills and competencies portrayed by the employee, entirely at the discretion of the trustees, and are allocated under recommendation of the group's executive management team. The beneficial ownership of the shares lie with the participants, including dividend rights.
Participants must remain in service for three, four and five years, after each of which 1/3 of the shares become unrestricted and 1/3 of the options vest.
5 years
Swaziland Trust Long-term Incentive Scheme
Nedbank Sinakekelwe Trust Long-term Incentive Scheme
Restricted shares and share options are granted to key management personnel as an incentive to remain within the group. Grants will be allocated on the basis of job level, performance, potential and skills and competencies portrayed by the employee, entirely at the discretion of the group's executive management team. The beneficial ownership of the shares will lie with the participants, including dividend rights. Grants to staff have yet to be made.
Participants must remain in service for three, four and five years, after each of which 1/3 of the shares become unrestricted and 1/3 of the options vest.
5 years
No numerical information has been included in either the share-based payment expense or reserve in respect of these schemes, as the cumulative amount is less than R1m.
51.2 Effect on profit and financial positionshare-based
payments expenseshare-based
payments reserve/liability
2014rm
2013Rm
2014rm
2013Rm
traditional employee schemes 612 554 1 177 1 011 Nedbank Group (2005) Share Option and Restricted Share Scheme 517 493 939 850 Nedbank Group (2005) Matched Share Scheme 79 51 148 93 Old Mutual uK Sharesave Scheme 5 4 39 23 Nedbank uK Long-term Incentive Plan¹ 7 16 33 Nedbank uK Matched Share Scheme¹ 1 19 2 Nedbank Wealth Management International Long-term Incentive Plan¹ 9 (3) 13 9 Nedbank Wealth Management International Matched Share Scheme¹ 2 1 3 1
nedbank eyethu bee schemes 21 33 507 496 Black Business Partner Scheme 301 274 Community Scheme 124 124 Black Executive Scheme 14 17 42 38 Black Management Scheme 7 16 40 60
nedbank namibia omufima bee and other schemes (1) 21 16 Namibia Black Business Partner Scheme 13 9 Namibia Affinity Group Scheme 4 3 Namibia Education Scheme 4 4 Namibia Black Management Scheme (1)
633 586 1 705 1 523
¹ This scheme is cash settled and therefore creates a liability.

NedbaNk Group
117
Consolidated and separate annual
finanCial statements
51.3 Movements in number of instruments2014 2013
number of instruments
Weighted average
exercise pricer
Number of instruments
Weighted average
exercise priceR
nedbank Group (2005) share option and restricted share schemeOutstanding at the beginning of the year 10 710 356 11 321 761 Granted 3 444 280 3 500 768 Forfeited (719 950) (411 640)
Exercised (3 566 309) (3 700 533)
Outstanding at the end of the year 9 868 377 10 710 356
Exercisable at the end of the year – – – –
Weighted average share price for options exercised (R) 196,76 192,45
nedbank Group (2005) matched share schemeOutstanding at the beginning of the year 1 274 585 917 581 Granted 732 501 626 785 Forfeited (104 291) (168 694)
Exercised (252 822) (101 087)
Outstanding at the end of the year 1 649 973 1 274 585
Exercisable at the end of the year – – – –
Weighted average share price for options exercised (R) 222,54 189,01
old mutual uK sharesave scheme Outstanding at the beginning of the year 2 637 872 0,75 2 672 000 0,70 Granted 947 451 232 225 1,63 Forfeited (132 844) (100 298) 1,28 Exercised (1 747 781) (161 496) 0,85
Expired (4 559) 0,94
Outstanding at the end of the year 1 704 698 2 637 872 0,75
Exercisable at the end of the year – 88 030 0,35
Weighted average share price for options exercised (GBP) 2,00 1,97
nedbank uK long-term incentive planOutstanding at the beginning of the year 198 960 263 972 17,84 Granted 52 336 38 084 Forfeited (9 414) (58 708) 51,47
Exercised (44 594) (44 388)
Outstanding at the end of the year 197 288 – 198 960
Exercisable at the end of the year – – 66 196 –
Weighted average share price for options exercised (GBP) – –
nedbank uK matched share schemeOutstanding at the beginning of the year 16 099 7 856 Granted 2 811 7 584
Other (1 483) 659
Outstanding at the end of the year 17 427 16 099
Exercisable at the end of the year – – – –
Weighted average share price for options exercised (GBP) – –
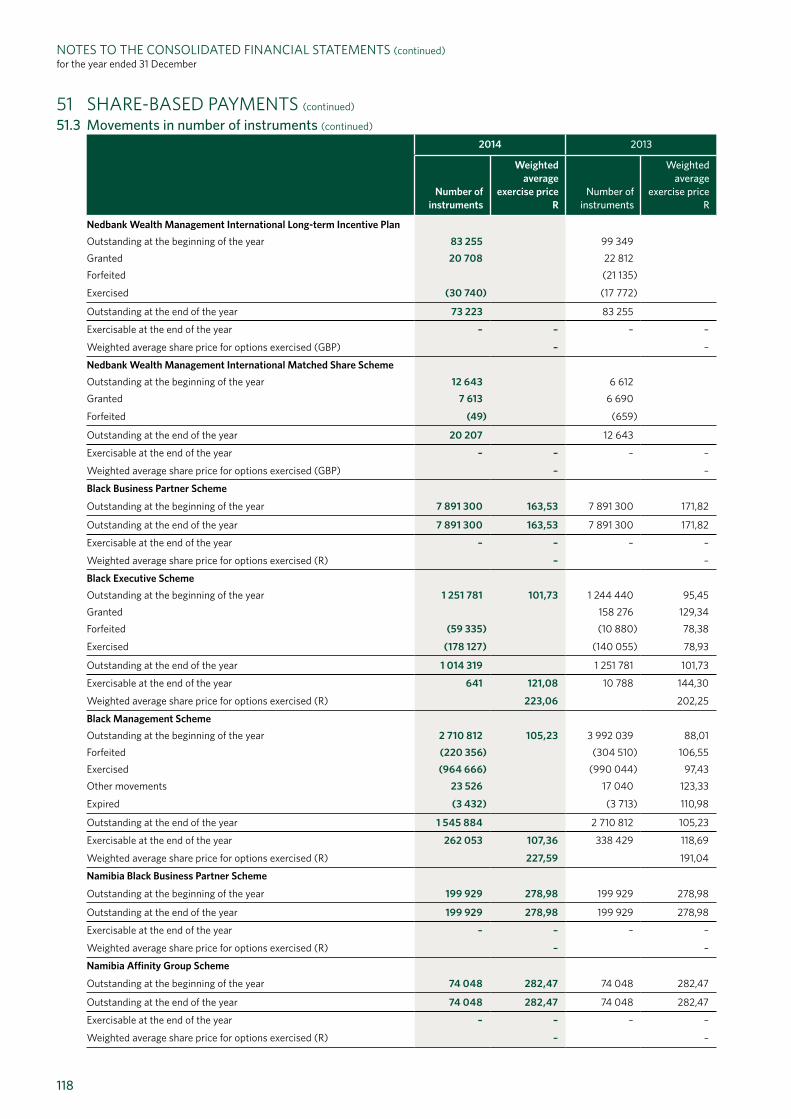
118
NOTES TO THE CONSOLIDATED FINANCIAL STATEMENTS (continued)for the year ended 31 December
51 SHARE-BASED PAYMENTS (continued)
51.3 Movements in number of instruments (continued)
2014 2013
number of instruments
Weighted average
exercise pricer
Number of instruments
Weighted average
exercise priceR
nedbank Wealth management international long-term incentive planOutstanding at the beginning of the year 83 255 99 349 Granted 20 708 22 812 Forfeited (21 135)
Exercised (30 740) (17 772)
Outstanding at the end of the year 73 223 83 255
Exercisable at the end of the year – – – –
Weighted average share price for options exercised (GBP) – –
nedbank Wealth management international matched share schemeOutstanding at the beginning of the year 12 643 6 612 Granted 7 613 6 690
Forfeited (49) (659)
Outstanding at the end of the year 20 207 12 643
Exercisable at the end of the year – – – –
Weighted average share price for options exercised (GBP) – –
black business partner scheme
Outstanding at the beginning of the year 7 891 300 163,53 7 891 300 171,82
Outstanding at the end of the year 7 891 300 163,53 7 891 300 171,82
Exercisable at the end of the year – – – –
Weighted average share price for options exercised (R) – –
black executive schemeOutstanding at the beginning of the year 1 251 781 101,73 1 244 440 95,45 Granted 158 276 129,34 Forfeited (59 335) (10 880) 78,38
Exercised (178 127) (140 055) 78,93
Outstanding at the end of the year 1 014 319 1 251 781 101,73
Exercisable at the end of the year 641 121,08 10 788 144,30
Weighted average share price for options exercised (R) 223,06 202,25
black management schemeOutstanding at the beginning of the year 2 710 812 105,23 3 992 039 88,01 Forfeited (220 356) (304 510) 106,55 Exercised (964 666) (990 044) 97,43 Other movements 23 526 17 040 123,33
Expired (3 432) (3 713) 110,98
Outstanding at the end of the year 1 545 884 2 710 812 105,23
Exercisable at the end of the year 262 053 107,36 338 429 118,69
Weighted average share price for options exercised (R) 227,59 191,04
namibia black business partner scheme
Outstanding at the beginning of the year 199 929 278,98 199 929 278,98
Outstanding at the end of the year 199 929 278,98 199 929 278,98
Exercisable at the end of the year – – – –
Weighted average share price for options exercised (R) – –
namibia affinity Group scheme
Outstanding at the beginning of the year 74 048 282,47 74 048 282,47
Outstanding at the end of the year 74 048 282,47 74 048 282,47
Exercisable at the end of the year – – – –
Weighted average share price for options exercised (R) – –

NedbaNk Group
119
Consolidated and separate annual
finanCial statements
51.3 Movements in number of instruments (continued)
2014 2013
number of instruments
Weighted average
exercise pricer
Number of instruments
Weighted average
exercise priceR
namibia education scheme
Outstanding at the beginning of the year 98 730 282,47 98 730 282,47
Outstanding at the end of the year 98 730 282,47 98 730 282,47
Exercisable at the end of the year – – – –
Weighted average share price for options exercised (R) – –
namibia black management schemeOutstanding at the beginning of the year 5 166 102,55 20 651 95,19 Forfeited (2 244)Exercised (5 166) (14 740) 95,57
Other 1 499 120,62
Outstanding at the end of the year – 5 166 102,55
Exercisable at the end of the year – – 1 071 120,62
Weighted average share price for options exercised (R) 224,04 186,77
Community scheme
Outstanding at the beginning of the year 851 111 851 111
Outstanding at the end of the year 851 111 851 111
Exercisable at the end of the year – – – –
Weighted average share price for options exercised (R) – –
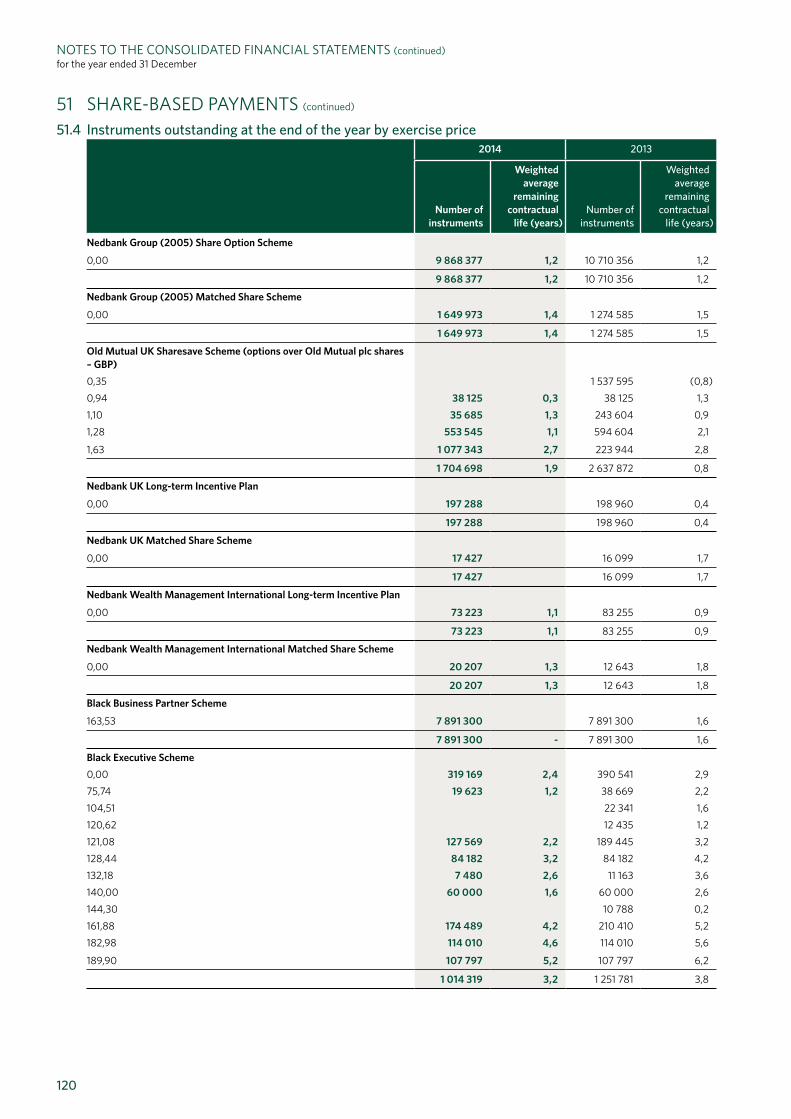
120
NOTES TO THE CONSOLIDATED FINANCIAL STATEMENTS (continued)for the year ended 31 December
51 SHARE-BASED PAYMENTS (continued)
51.4 Instruments outstanding at the end of the year by exercise price2014 2013
number of instruments
Weighted average
remaining contractual
life (years) Number of
instruments
Weightedaverage
remaining contractual
life (years)
nedbank Group (2005) share option scheme
0,00 9 868 377 1,2 10 710 356 1,2
9 868 377 1,2 10 710 356 1,2
nedbank Group (2005) matched share scheme
0,00 1 649 973 1,4 1 274 585 1,5
1 649 973 1,4 1 274 585 1,5
old mutual uK sharesave scheme (options over old mutual plc shares – Gbp)0,35 1 537 595 (0,8)0,94 38 125 0,3 38 125 1,3 1,10 35 685 1,3 243 604 0,9 1,28 553 545 1,1 594 604 2,1
1,63 1 077 343 2,7 223 944 2,8
1 704 698 1,9 2 637 872 0,8
nedbank uK long-term incentive plan
0,00 197 288 198 960 0,4
197 288 198 960 0,4
nedbank uK matched share scheme
0,00 17 427 16 099 1,7
17 427 16 099 1,7
nedbank Wealth management international long-term incentive plan
0,00 73 223 1,1 83 255 0,9
73 223 1,1 83 255 0,9
nedbank Wealth management international matched share scheme
0,00 20 207 1,3 12 643 1,8
20 207 1,3 12 643 1,8
black business partner scheme
163,53 7 891 300 7 891 300 1,6
7 891 300 - 7 891 300 1,6
black executive scheme0,00 319 169 2,4 390 541 2,9 75,74 19 623 1,2 38 669 2,2 104,51 22 341 1,6 120,62 12 435 1,2 121,08 127 569 2,2 189 445 3,2 128,44 84 182 3,2 84 182 4,2 132,18 7 480 2,6 11 163 3,6 140,00 60 000 1,6 60 000 2,6 144,30 10 788 0,2 161,88 174 489 4,2 210 410 5,2 182,98 114 010 4,6 114 010 5,6
189,90 107 797 5,2 107 797 6,2
1 014 319 3,2 1 251 781 3,8
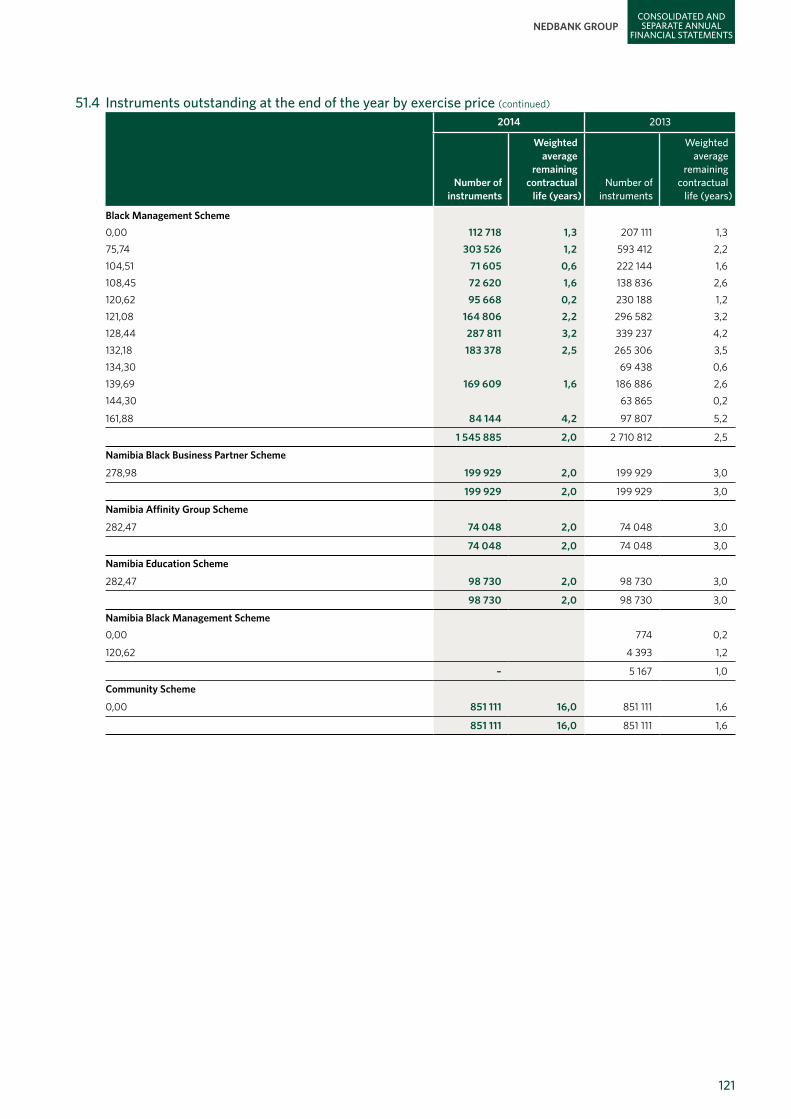
NedbaNk Group
121
Consolidated and separate annual
finanCial statements
51.4 Instruments outstanding at the end of the year by exercise price (continued)
2014 2013
number of instruments
Weighted average
remaining contractual
life (years) Number of
instruments
Weightedaverage
remaining contractual
life (years)
black management scheme0,00 112 718 1,3 207 111 1,3 75,74 303 526 1,2 593 412 2,2 104,51 71 605 0,6 222 144 1,6 108,45 72 620 1,6 138 836 2,6 120,62 95 668 0,2 230 188 1,2 121,08 164 806 2,2 296 582 3,2 128,44 287 811 3,2 339 237 4,2 132,18 183 378 2,5 265 306 3,5 134,30 69 438 0,6 139,69 169 609 1,6 186 886 2,6 144,30 63 865 0,2
161,88 84 144 4,2 97 807 5,2
1 545 885 2,0 2 710 812 2,5
namibia black business partner scheme
278,98 199 929 2,0 199 929 3,0
199 929 2,0 199 929 3,0
namibia affinity Group scheme
282,47 74 048 2,0 74 048 3,0
74 048 2,0 74 048 3,0
namibia education scheme
282,47 98 730 2,0 98 730 3,0
98 730 2,0 98 730 3,0
namibia black management scheme0,00 774 0,2
120,62 4 393 1,2
– 5 167 1,0
Community scheme
0,00 851 111 16,0 851 111 1,6
851 111 16,0 851 111 1,6

122
NOTES TO THE CONSOLIDATED FINANCIAL STATEMENTS (continued)for the year ended 31 December
51 SHARE-BASED PAYMENTS (continued)
51.5 Instruments granted during the yearThe weighted average fair value of instruments granted during the year has been calculated using the Black-Scholes option pricing model, using the following inputs and assumptions.
nedbank Group (2005) share
option andrestricted
share scheme
nedbank Group(2005)
matchedshare scheme
old mutual uK sharesave
scheme(Gbp)
nedbank uK long-term
incentive plan
nedbank uK matched
scheme
nedbank Wealth
management international
long-term incentive plan
nedbank Wealth
management international
matched scheme
black executive
scheme
2014Number of instruments granted 3 440 886 731 882 947 451 52 336 2 811 20 708 7 613 Weighted average fair value per instrument granted (R)³ 203,61 188,72 1,63 181,75 188,72 Weighted average share price (R) 215,58 224,01 2,00 210,25 223,03 215,77 224,04 Weighted average expected volatility (%)¹ 23,0 22,0 31,4 22,00 22,00 Weighted average life (years) 3,0 3,0 3,5 3,00 3,00 Weighted average risk-free interest rate (%) 7,2 6,8 1,4 6,8 6,8 Number of participants 1 615 668 13 11 11 24 Weighted average vesting period (years) 3,0 3,0 3,5 3,0 3,0 3,0 3,0 Possibility of not vesting (%) 10,0 7,0 10,0 10,0 10,0 10,0 5,0
Expectation of meeting performance criteria (%) 90,0 93,0 90,0 90,0 90,0 90,0 95,0
2013Number of instruments granted 3 491 184 626 280 232 225 38 084 7 584 22 812 6 690 158 276 Weighted average fair value per instrument granted (R)³ 187,76 169,98 0,47 171,36 173,25 171,58 169,98 92,40 Weighted average share price (R) 197,02 190,53 1,99 197,21 190,53 197,21 190,53 198,50 Weighted average expected volatility (%)¹ 20,0 20,0 33,1 20,0 20,0 22,0 22,0 20,0 Weighted average life (years) 3,0 3,0 3,3 3,0 2,5 3,0 3,0 5,7 Weighted average expected dividends (%)² 4,0 2,6 Weighted average risk-free interest rate (%) 5,3 5,3 0,4 5,3 5,3 5,3 5,3 6,1 Number of participants 1 792 559 13 11 12 15 7 Weighted average vesting period (years) 3,0 3,0 3,3 3,0 3,0 3,0 3,0 Possibility of not vesting (%) 10,0 7,0 10,0 10,0 10,0 10,0 5,0
Expectation of meeting performance criteria (%) 90,0 93,0 90,0 90,0 90,0 90,0 95,0 ¹ Expected volatility is determined based on the historical average volatility for shares over their vesting periods. Volatility is determined using expected volatility for all shares listed on the JSE.² The dividend yield used for grants made has been based on forecast dividends.³ Fair value per instrument has been recalculated in line with a change in the valuation methodology for shares linked to the Financial Index

NedbaNk Group
123
Consolidated and separate annual
finanCial statements
51 SHARE-BASED PAYMENTS (continued)
51.5 Instruments granted during the yearThe weighted average fair value of instruments granted during the year has been calculated using the Black-Scholes option pricing model, using the following inputs and assumptions.
nedbank Group (2005) share
option andrestricted
share scheme
nedbank Group(2005)
matchedshare scheme
old mutual uK sharesave
scheme(Gbp)
nedbank uK long-term
incentive plan
nedbank uK matched
scheme
nedbank Wealth
management international
long-term incentive plan
nedbank Wealth
management international
matched scheme
black executive
scheme
2014Number of instruments granted 3 440 886 731 882 947 451 52 336 2 811 20 708 7 613 Weighted average fair value per instrument granted (R)³ 203,61 188,72 1,63 181,75 188,72 Weighted average share price (R) 215,58 224,01 2,00 210,25 223,03 215,77 224,04 Weighted average expected volatility (%)¹ 23,0 22,0 31,4 22,00 22,00 Weighted average life (years) 3,0 3,0 3,5 3,00 3,00 Weighted average risk-free interest rate (%) 7,2 6,8 1,4 6,8 6,8 Number of participants 1 615 668 13 11 11 24 Weighted average vesting period (years) 3,0 3,0 3,5 3,0 3,0 3,0 3,0 Possibility of not vesting (%) 10,0 7,0 10,0 10,0 10,0 10,0 5,0
Expectation of meeting performance criteria (%) 90,0 93,0 90,0 90,0 90,0 90,0 95,0
2013Number of instruments granted 3 491 184 626 280 232 225 38 084 7 584 22 812 6 690 158 276 Weighted average fair value per instrument granted (R)³ 187,76 169,98 0,47 171,36 173,25 171,58 169,98 92,40 Weighted average share price (R) 197,02 190,53 1,99 197,21 190,53 197,21 190,53 198,50 Weighted average expected volatility (%)¹ 20,0 20,0 33,1 20,0 20,0 22,0 22,0 20,0 Weighted average life (years) 3,0 3,0 3,3 3,0 2,5 3,0 3,0 5,7 Weighted average expected dividends (%)² 4,0 2,6 Weighted average risk-free interest rate (%) 5,3 5,3 0,4 5,3 5,3 5,3 5,3 6,1 Number of participants 1 792 559 13 11 12 15 7 Weighted average vesting period (years) 3,0 3,0 3,3 3,0 3,0 3,0 3,0 Possibility of not vesting (%) 10,0 7,0 10,0 10,0 10,0 10,0 5,0
Expectation of meeting performance criteria (%) 90,0 93,0 90,0 90,0 90,0 90,0 95,0 ¹ Expected volatility is determined based on the historical average volatility for shares over their vesting periods. Volatility is determined using expected volatility for all shares listed on the JSE.² The dividend yield used for grants made has been based on forecast dividends.³ Fair value per instrument has been recalculated in line with a change in the valuation methodology for shares linked to the Financial Index

124
NOTES TO THE CONSOLIDATED FINANCIAL STATEMENTS (continued)for the year ended 31 December
52 RELATED PARTIES52.1 Relationship with parent, ultimate controlling party and investees
The group's parent company is Old Mutual (South Africa) Ltd (OMSA) which, through its subsidiaries, holds 54,04% (2013: 52,03%) of Nedbank Group Limited’s ordinary shares. The ultimate controlling party is Old Mutual plc, incorporated in the united Kingdom.
Material subsidiaries of the group are identified in note 54 and associate companies and joint arrangements of the group are identified in note 53.
52.2 Key management personnel compensation Key management personnel are those persons who have authority and responsibility for planning, directing and controlling the activities of the group, directly or indirectly, including all directors of the company and its parent, as well as members of the Executive Committee who are not directors, as well as close members of the family of any of these individuals.
Details of the compensation paid to the board of directors and prescribed officers and details of their shareholdings in the company are disclosed in the Remuneration Report. Compensation paid to the board of directors and compensation paid to other key management personnel, as well as the number of share instruments held, are shown below:
directors
Key management
personnel total
Compensation (rm)2014Directors' fees 14 14 Remuneration - paid by subsidiaries 84 202 286 Short-term employee benefits 47 120 167 Gain on exercise of share instruments 37 82 119
98 202 300
2013Directors' fees 11 11 Remuneration - paid by subsidiaries 78 151 229 Short-term employee benefits 43 118 161 Gain on exercise of share instruments 35 33 68
89 151 240
number of share instruments2014Outstanding at the beginning of the year 571 714 1 666 293 2 238 007 Granted 173 902 456 115 630 017 Forfeited (7 965) (91 879) (99 844)
Exercised (159 183) (455 540) (614 723)
Outstanding at the end of the year 578 468 1 574 989 2 153 457
2013Outstanding at the beginning of the year 645 194 1 686 127 2 331 321 Granted 165 168 441 334 606 502 Forfeited (11 541) (11 541)
Exercised (238 648) (449 627) (688 275)
Outstanding at the end of the year 571 714 1 666 293 2 238 007

NedbaNk Group
125
Consolidated and separate annual
finanCial statements
52.3 Related-party transactionsTransactions between Nedbank Group Ltd and its subsidiaries, which are related parties, have been eliminated on consolidation and are not disclosed in this note. Transactions between Nedbank Group Ltd and its other related parties are disclosed below. All of these transactions were entered into in the normal course of business.
Outstanding balances (Rm)
Due from/(owing to)
2014 2013
parent/ultimate controlling partyDeposits owing to Old Mutual Life Assurance Company (SA) Ltd (14) (749)Bank balances owing to Old Mutual Life Assurance Company (SA) Ltd (237) (5 970)Forward exchange rate contracts with Old Mutual plc (4)Account payable owing to Old Mutual plc (1) (1)fellow subsidiariesDeposits owing to Old Mutual Asset Managers (SA) (Pty) Ltd (24) (60)Deposits owing to other fellow subsidiaries (9 076) (10 637)Bank balances owing to Old Mutual Asset Managers (SA) (Pty) Ltd (15) (5)Bank balances owing to other fellow subsidiaries (873) (1 163)associate companiesLoans due from associate companies 2 157 1 489 Deposits owing to associate companies (47) (12)Bank balances owing to associate companies (5) (9)Key management personnelMortgage bonds due from key management personnel 27 32 Deposits owing to key management personnel (33) (33)Deposits owing to entities under the influence of key management personnel (1 099) (1 398)Bank balances due from key management personnel 4 4 Bank balances owing to key management personnel (43) (40)Bank balances due from entities under the influence of key management personnel 1 35 Bank balances owing to entities under the influence of key management personnel (179) (362)
The WIPHOLD and Brimstone consortia and Aka Capital (Pty) Ltd are related parties since certain key management personnel of the company have significant influence over these entities. These entities are participants in the Nedbank Eyethu BEE schemes and the share-based payments reserve recognised in respect of these entities and key management personnel is detailed below:
WIPHOLD consortium (154) (108)Brimstone consortium (147) (107)Key management personnel - directors (52) (48)
Key management personnel - other (129) (113)
Share-based payments reserve (482) (376)
Performance fees are paid to the WIPHOLD and Brimstone consortia in terms of the Nedbank Eyethu BEE schemes.WIPHOLD consortium (12)
Brimstone consortium (12)
Performance fee liability at the end of the year (24) –
long-term employee benefit plansBank balances owing to Nedgroup Medical Aid Fund (1)Bank balances owing to Nedgroup Pension Fund (100) (64)
Bank balances and deposits owing to other funds (73) (275)

126
NOTES TO THE CONSOLIDATED FINANCIAL STATEMENTS (continued)for the year ended 31 December
52 RELATED PARTIES (continued)
52.3 Related-party transactions (continued)
transactions (rm)
income/(expense)
2014 2013
parent/ultimate controlling partyInterest expense to Old Mutual Life Assurance Company (SA) (Pty) Ltd (342) (344)Dividend declared to OMSA via its subsidiaries (2 525) (2 103)fellow subsidiariesInterest income from Old Mutual Asset Managers (SA) (Pty) Ltd 27 30 Interest income from other fellow subsidiaries 5 3 Interest expense to other fellow subsidiaries (2 815) (1 526)Interest expense to Old Mutual Asset Managers (SA) (Pty) Ltd (41) (25)Insurance premiums to Mutual & Federal Insurance Company Ltd (148) (163)Claims recovered from Mutual & Federal Insurance Company Ltd 99 94 Commission income from Mutual & Federal Insurance Company Ltd 27 29 Asset management fee to Old Mutual Asset Managers (SA) (Pty) Ltd (4)associate companiesInterest expense to associate companies (22) (11)Key management personnelInterest income from key management personnel 4 1 Interest income from entities under the influence of key management personnel 348 316 Interest expense to key management personnel (31) (17)Interest expense to entities under the influence of key management personnel (227) (227)
The share-based payments charge in respect of the entities that are participants in the Nedbank Eyethu BEE schemes and key management personnel is detailed below:
– Key management personnel - other (5) (5)
Share-based payments expense (included in BEE transaction expenses) (5) (5)
Key management personnel - directors (17) (7)
Key management personnel - other (60) (24)
Share-based payments expense (included in staff costs) (77) (31)
Performance fees are paid to the Wiphold and Brimstone consortia in terms of the Nedbank Eyethu BEE scheme:– Wiphold consortium (14)
– Brimstone consortium (13)
Performance fee expense – (27)

NedbaNk Group
127
Consolidated and separate annual
finanCial statements
52.3 Related-party transactions (continued)
income/(expense)
2014 2013
long-term employee benefit plansInterest expense to Nedgroup Pension Fund (4) (4)Interest expense to other funds (25) (12)
The Nedbank Group Pension Fund has an insurance policy (Optiplus policy) with a fellow subsidiary, Old Mutual Life Assurance Company (SA) Ltd, in respect of its pension plan obligations. Nedbank Limited has an insurance policy (Symmetry policy) with a fellow subsidiary, Old Mutual Life Assurance Company (SA) (Pty) Ltd, in respect of its postretirement medical aid obligations. The group has an interest in the OMART cell captive within a fellow subsidiary in respect of its disability plan obligations. The value of this policy and this interest are shown as reimbursement rights, with a corresponding liability. In the case of the interest in the cell captive, the group recognises the surplus in the cell captive. The amounts included in the financial statements in respect of this policy and this interest are as follows:
– Optiplus policy reimbursement right 827 777 – Symmetry policy reimbursement right 1 179
– OMART policy reimbursement right (note 27.1) 511 453
Included in long-term employee benefit assets 2 517 1 230
Optiplus policy obligation (827) (777)Postretirement medical aid obligation (1 179)
Disability obligation (374) (320)
Included in long-term employee benefit liabilities (2 380) (1 097)

128
53 ANALYSIS OF INVESTMENTS IN PRIVATE EquITY ASSOCIATES, ASSOCIATE COMPANIES AND JOINT ARRANGEMENTS
Group
Carrying amount net indebtedness of loans to/
(from) associates dividends received
Nature of activities
percentageholding
2014%
percentageholding
2013%
Measurement method
Acquisitiondate Year-end
2014rm
2013Rm
2014rm
2013Rm
2014rm
2013Rm
private equity associates and associate companiesListed
Ecobank Transnational Incorporated (Togo)¹ Banking 20,7Equity-
accounted Oct 14 Dec 6 223 466 individually immaterial associatesunlistedCentury City JV Property development 50 50 Fair value Dec 10 Dec 55 55 Erf 7 Sandown (Pty) Ltd Property development 35 35 Fair value Jul 07 Feb 63 57 5 5 Falcon Forest Trading 85 (Pty) Ltd Property development 30 Fair value Mar 05 Feb 40 2 39 Friedshelf 113 (Pty) Ltd Property development 20 20 Fair value Aug 02 Feb 85 83 43 43 Masingita Property Investment Holdings (Pty) Ltd Property development 35 35 Fair value Aug 05 Feb 125 83 38 14 Odyssey Developments (Pty) Ltd² Property development 49 49 Fair value Aug 07 Feb 57 79 49 43 Other individually immaterial associates³Private-equity associates (Manufacturing, industrial, leisure and other)⁴ 373 342 235 242 26 17 Private-equity associates (Property investment associates)⁴ 123 125 1 270 1 103 1 3 Other Various 238 230 (4) 2
Joint arrangementsunlisted
Banco Único, S.A. (Mozambique) Banking 36,6Equity-
accounted Jun 14 Dec 286
Individually immaterial joint arrangements³ Various 42 7 55 35
7 670 1 101 2 157 1 489 66 20
unless otherwise stated above, all entities are domiciled and incorporated in SA. The group has the same proportion of voting rights as its proportion of ownership interest, unless stated otherwise and has not incurred any contingent liabilities with regard to the associates or joint arrangements listed above.
¹ Ecobank Transnational Incorporated, which is a Pan-African bank and its shares are listed on the stock exchanges of Nigeria, Ghana and Ivory Coast. ² The group's proportion of ownership in the entity is 49% while its voting right equates to 35%. ³ Represents various investments that are not individually material. ⁴ Includes entities that have been reclassified from investment securities to investments in private-equity associates, associate companies and joint arrangements to align better with industry practice. Refer to note 56.
NOTES TO THE CONSOLIDATED FINANCIAL STATEMENTS (continued)for the year ended 31 December

NedbaNk Group
129
Consolidated and separate annual
finanCial statements
53 ANALYSIS OF INVESTMENTS IN PRIVATE EquITY ASSOCIATES, ASSOCIATE COMPANIES AND JOINT ARRANGEMENTS
Group
Carrying amount net indebtedness of loans to/
(from) associates dividends received
Nature of activities
percentageholding
2014%
percentageholding
2013%
Measurement method
Acquisitiondate Year-end
2014rm
2013Rm
2014rm
2013Rm
2014rm
2013Rm
private equity associates and associate companiesListed
Ecobank Transnational Incorporated (Togo)¹ Banking 20,7Equity-
accounted Oct 14 Dec 6 223 466 individually immaterial associatesunlistedCentury City JV Property development 50 50 Fair value Dec 10 Dec 55 55 Erf 7 Sandown (Pty) Ltd Property development 35 35 Fair value Jul 07 Feb 63 57 5 5 Falcon Forest Trading 85 (Pty) Ltd Property development 30 Fair value Mar 05 Feb 40 2 39 Friedshelf 113 (Pty) Ltd Property development 20 20 Fair value Aug 02 Feb 85 83 43 43 Masingita Property Investment Holdings (Pty) Ltd Property development 35 35 Fair value Aug 05 Feb 125 83 38 14 Odyssey Developments (Pty) Ltd² Property development 49 49 Fair value Aug 07 Feb 57 79 49 43 Other individually immaterial associates³Private-equity associates (Manufacturing, industrial, leisure and other)⁴ 373 342 235 242 26 17 Private-equity associates (Property investment associates)⁴ 123 125 1 270 1 103 1 3 Other Various 238 230 (4) 2
Joint arrangementsunlisted
Banco Único, S.A. (Mozambique) Banking 36,6Equity-
accounted Jun 14 Dec 286
Individually immaterial joint arrangements³ Various 42 7 55 35
7 670 1 101 2 157 1 489 66 20
unless otherwise stated above, all entities are domiciled and incorporated in SA. The group has the same proportion of voting rights as its proportion of ownership interest, unless stated otherwise and has not incurred any contingent liabilities with regard to the associates or joint arrangements listed above.
¹ Ecobank Transnational Incorporated, which is a Pan-African bank and its shares are listed on the stock exchanges of Nigeria, Ghana and Ivory Coast. ² The group's proportion of ownership in the entity is 49% while its voting right equates to 35%. ³ Represents various investments that are not individually material. ⁴ Includes entities that have been reclassified from investment securities to investments in private-equity associates, associate companies and joint arrangements to align better with industry practice. Refer to note 56.

130
NOTES TO THE CONSOLIDATED FINANCIAL STATEMENTS (continued)for the year ended 31 December
53 ANALYSIS OF INVESTMENTS IN PRIVATE EquITY ASSOCIATES, ASSOCIATE COMPANIES AND JOINT ARRANGEMENTS (continued)
53.1 ADDITIONAL DISCLOSURE RELATING TO MATERIAL ASSOCIATE COMPANIES AND JOINT ARRANGEMENTS
ecobank transnational incorporated¹ banco Único, sa
2014rm
2013Rm
2014rm
2013Rm
Fair-value of investment in Ecobank Transnational Incorporated based on the closing quoted price on the Nigerian Stock Exchange 5 483 statement of comprehensive incomeRevenue 17 745 345 Profit/(loss) from continuing operations 3 489 7 Posttax profit/(loss) from discontinued operations (25)Other comprehensive income/(loss) (1 048)Total comprehensive income 2 416 7 statement of financial positionCurrent assets 149 278 2 496 Non-current assets 115 204 1 820 Current liabilities 122 754 2 095 Non-current liabilities 114 555 1 807 additional disClosures relatinG to Joint Venturesbanco Único, sastatemement of comprehensive incomeInterest and similar income 374 Interest and similar charges 162 Depreciation and amortisation 44 Income tax income/(expense) (5)statement of financial positionCash and cash equivalents included in current assets 175 Current financial liabilities (excluding trade and other payables and provisions) included in current liabilities 2 018
Non-current financial liabilities (excluding trade and other payables and provisions) included in non-current liabilities 1 795 ¹ The information provided for Ecobank Transnational Incorporated has been based on the latest available financial information, being the financial results for the nine months ended 30 September 2014 .

NedbaNk Group
131
Consolidated and separate annual
finanCial statements
54 ANALYSIS OF INVESTMENTS IN SuBSIDIARY COMPANIES Group Company
issued capital effective holding book value of investments net indebtedness
2014rm
2013Rm
2014rm
2013Rm
2014rm
2013Rm
2014rm
2013Rm
banking²Nedbank Limited 27 27 100 100 20 949 20 949 (5 733) 482 Nedbank Namibia Ltd 17 17 100 100 Nedbank (Malawi) Ltd 7 5 100 97,1 Nedbank (Lesotho) Ltd 20 20 100 100 Nedbank (Swaziland) Ltd 12 12 65,0 65,0 Nedbank Private Wealth Ltd (Isle of Man) 198 191 100 100 MBCA Bank Ltd (Zimbabwe) 1 1 71,4 71,4 trust and securities entities³Nedgroup Private Wealth Stockbrokers (Pty) Ltd ¹ ¹ 100 100 Nedgroup Trust Ltd (Guernsey) 2 2 100 100 Nedgroup Collective Investments Ltd⁵ 6 6 100 100 Syfrets Securities Ltd 1 1 100 100 353 353 200 200 other companies³Nedgroup Private Wealth (Pty) Ltd ¹ ¹ 100 100 566 456 BoE Holdings (Pty) Ltd, formerly BoE Holdings Ltd 2 2 100 100 BoE Investment Holdings Ltd 11 11 100 100 937 937 (869) (869)Depfin Investments (Pty) Ltd⁴ ¹ ¹ 100 100 Dr Holsboer Benefit Fund⁶ ¹ ¹ 100 100 Nedgroup Investments Africa (Mauritius) ¹ ¹ 100 100 98 78 NBG Capital Management (Pty) Ltd, formerly NBG Capital Management Ltd ¹ ¹ 100 100 1 1 612 Nedbank Group Insurance Company Ltd ¹ ¹ 100 100 10 10 Nedcapital Investment Holdings (Pty) Ltd (Namibia) ¹ ¹ 100 100 25 Ned Settle Services (Pty) Ltd ¹ ¹ 100 100 6 Nedcor Investments Ltd 28 28 100 100 Nedcor Trade Services Ltd (Mauritius) 3 100 100 NedEurope Ltd (Isle of Man) 5 186 4 704 100 100 1 612 1 612 Nedgroup Insurance Company Ltd⁵ 5 5 100 100 49 Nedgroup International Holdings Ltd (Isle of Man) ¹ ¹ 100 100 Nedgroup Investment 102 Ltd 6 6 100 100 Nedbank Group Insurance Holdings Ltd, formerly Nedgroup Investment Holdings 101 Ltd 17 17 100 100 196 196 260 Nedgroup Life Assurance Company Ltd 15 15 100 100 310 Nedgroup Securities (Pty) Ltd 10 10 100 100 34 500 500 Nedgroup Structured Life Ltd 1 1 100 100 NedInvest (Pty) Ltd 5 5 100 100 5 5 NedNamibia Holdings Ltd (Namibia) 18 18 100 100 429 429 NIB Blue Capital Investments (Pty) Ltd ¹ ¹ 100 100 Peoples Mortgage Ltd 45 45 100 100 The Board of Executors ¹ ¹ 100 100 (45) (45)
Other companies (5) (5)
25 221 25 384 (5 692) 1 875 ¹ Represents amounts less than R1m.² The banking subsidiary companies are restricted in terms of Basel regulations and prudential requirements with regard to the distributions of funds to their holding company. ³ These entities are free of any restrictions imposed on the distribution of funds, save for compliance with any local regulations.⁴ The entity is considered to be consolidated structured entity. Put options exist between the group and subscribers of issued preference shares of the entity. These options can be excercised if the entity breaches the terms of
the preference share subscription agreement. The group has not provided financial or any other support to the entity without the contractual obligation to do so. The group has no current intention to provide financial or other support to the entity without the contractual obligation to do so.
⁵ In terms of a dispensation received from the Financial Services Board these companies are not allowed to declare any distributions to its holding company.⁶ The entity is governed by the terms of a trust deed. Restrictions are in place with regard to access or the use of the entity's assets.The composition of the group is illustrated in note 54.3. Unless otherwise stated, all entities are domiciled in SA. Unless otherwise stated, the financial statements of the subsidiaries used in the preparation of consolidated financial statements are as of the same date or same period than that of the consolidated financial statements. Unless otherwise stated, there are no significant restrictions (eg statutory, contractual and regulatory restrictions) on the group's ability to access or use the assets and settle the liabilities of the group.

132
NOTES TO THE CONSOLIDATED FINANCIAL STATEMENTS (continued)for the year ended 31 December
54 ANALYSIS OF INVESTMENTS IN SuBSIDIARY COMPANIES (continued)Headline earnings from subsidiaries (after eliminating intercompany transactions):
2014rm
2013Rm
Aggregate headline earnings attributable to equity holders 9 900 8 719
Aggregate headline losses attributable to equity holders (20) (49)
General information required in terms of the Companies Act, 71 of 2008 (as amended), is detailed in respect of only those subsidiaries where the financial position or results are material to the group. It is considered that the disclosure in these statements of such information in respect of the remaining subsidiaries would entail expenses out of proportion to the value to members. Other subsidiaries consist of nominees, property-owning and financial holding companies acquired in the course of lending activities.
Nedbank Group Ltd will ensure that, except in the case of political risk, and unless specifically excluded by public notice in a country where a subsidiary is domiciled, its banking subsidiaries, and its principal non-banking subsidiaries, are able to meet their contractual liabilities.
54.1 Material non-controlling interestsThe table below provides detail of non-wholly owned subsidiaries of the group that have material non-controlling interests:
nedbank (malawi) ltd² nedbank (swaziland) ltd mbCa bank ltd (Zimbabwe)
2014rm
2013Rm
2014rm
2013Rm
2014rm
2013Rm
financial positionTotal assets 272 3 596 2 845 2 219 1 887 Total liabilities 231 3 122 2 444 1 790 1 554 Accumulated non-controlling interests at the end of the year 3 165 136 126 98 Comprehensive incomeIncome from lending activities 24 149 119 148 103 Non-interest revenue 30 139 131 129 118 Profit/(loss) from continuing operations (4) 97 112 58 55 Total comprehensive income/(loss) (3) 98 78 58 40 Profit allocated to non-controlling interests during the reporting period ¹ 38 27 17 11 CashflowsCashflow (utilsed by)/from operating activities (71) 62 (493) (34) 100 Cashflow (utilsed by)/from investing activities 8 (8) (13) (10) (11)Cashflow utilsed by financing activities (25) (23)
Net increase/(decrease) in cash and cash equivalents (63) 29 (529) (44) 89 ¹ Represents amounts less than R1m.² Nedbank (Malawi) Ltd became a wholly owned subsidiary on 30 December 2014.
54.2 SIGNIFICANT JUDGEMENT AND ASSUMPTIONS IN THE ASSESSMENT OF CONTROLNo significant judgements and assumptions were used in determining whether the group has control over another entity except for the following:Judgements and assumptions applied in concluding that the group has control over another entity:
securitisationThe group orginated and sponsors certain securitisation vehicles and acts in various capacities with regard to these structures. The group controls these entities and have been consolidating these structures since its inception. These securitisation structures include the following:
Synthesis Funding Ltd (Synthesis), an asset-backed commercial paper (ABCP) programme; invests in long-term rated bonds and offers capital market funding to SA corporates which is funded through the issuance of short-dated investment-grade commercial paper. The group acts in various capacities with regard to this vehicle which includes the role of master liquidity facility provider, programme-wide credit enhancement provider, administrator, dealer, paying and settlement agent, custodian and hedge counterparty. The group is involved in the day-to-day activities of the vehicle. Although the activities and decisionmaking rights are predetermined and restricted; the group exercises a significant degree of discretion in its decisionmaking regarding investments, funding and risk management. Industry knowledge and experience of the group are crucial to successful operation of Synthesis. The group is exposed to variable returns from the entity in the form of fees and interest income as well as residual income subsequent to certain distributions through the provisioning of credit enhancement. As a result, the group has concluded that it controls the entity.

NedbaNk Group
133
Consolidated and separate annual
finanCial statements
Other securitisation vehicles consist of GreenHouse Funding (RF) Ltd, Series 1 (GreenHouse), a residential mortgage-backed securitisation programme, and Precinct Funding 1 (RF) Ltd, a commercial mortgage-backed securitisation programme. The activities of these vehicles are predetermined and restricted in terms of the programme documentation established at its inception. The group does however exercise some discretion in its decisionmaking which includes the selection and transfer of assets and the management of defaulted assets. Through the provision of administration services, the interest-rate hedge, and credit enhancement; Nedbank Limited has rights to the residual return of the vehicle. The group has concluded that it controls these entities.
Refer to note 45 for further information on the securitisation activities of the group.
employee share schemesEmployee share schemes were established by the group (or any of its subsidiaries) in terms of a trust deed for the benefit of its employees in return for their employment services rendered. Funding is provided by the group or its subsidiaries to acquire shares that are beneficially held on behalf of the beneficiaries of the trust. The beneficiaries of the trust are specified by group or its subsidiaries. The trustees have limited rights and act within narrowly defined parameters in terms of the trust deed. The trustees receive limited remuneration (if any) for their services rendered in terms of the trust. The group has concluded that the trustees merely act in an agent capacity and that the group has control over the trust.
dr Holsboer benefit fundNedbank Limited is the founder of the trust. The fund was established in terms of a trust deed for the benefit of employees of Nedbank Limited. The beneficiaries of the trust include employees, contractors and pensioners as nominated by the trustees in their sole discretion. The trustees have the right to vest or distribute net income of the trust in their discretion. All trustees are required to act in accordance with trust deed. The founder, Nedbank Limited, reserves the right to terminate the appointment of any of the trustees. In terms of the trust deed, the trustees are not entitled to remuneration for their services unless the founder and all the trustees unanimously agree. The group has concluded that the trustees merely act in an agent capacity and that the group has control over the trust.
Judgements and assumptions applied in concluding that the group does not have control over another entity:
investment fundsThe group acts as fund manager to a number of investment funds. Determining whether the group controls such an investment fund usually focuses on the assessment of decisionmaking rights as fund manager, the investor's rights to remove the fund manager and the aggregate economic interests of the group in the fund in the form of interest held and management fees.
In most instances the group's decisionmaking authority, in capacity as fund manager, with regard to these funds is regarded to be well defined. Discretion is however exercised when decisions regarding the relevant activities of these funds are being made. For all funds managed by the group, the investors have the right to remove the group as fund manager without cause.
Fees earned by the group, in its capacity as fund manager, are considered to be market related, commensurate with the services provided and includes only terms, conditions or amounts that are customarily present in arrangements for similar services and level of skills negotiated on an arm’s length basis.
As a result, the group has concluded that it acts as agent on behalf of the investors in all instances. The group does therefore not control these funds and has not consolidated these funds.
investment-holding entitiesThe group provides funding to various investment-holding entities in the form of preference shares. The group's rights relating to these investment-holding entities, through the subscription of preference shares, are considered to be protective rather than substantive. As a result, the group has concluded that it does not have power nor control over these entities.

134
Notes to the coNsolidated fiNaNcial statemeNts (continued)for the year ended 31 december
54.3 Major subsidiary companies
NedBaNK GRoUP iNsURaNce holdiNGs limited 100%
Local subsidiaries
■ Boe holdings (Pty) ltd
■ Peoples mortgage ltd
■ Nedcor investments ltd
■ Nedgroup investment 102 ltd
■ depfin investments (Pty) ltd
■ Boe investment holdings ltd
Foreign Nedbank subsidiaries
■ Nedbank (lesotho) ltd
■ Nedbank (swaziland) ltd 65,0%
■ Nedcor trade services ltd (mauritius)
■ syfrets securities ltd
■ Nedgroup Private Wealth stockbrokers (Pty) ltd
■ Nedgroup collective investments ltd
■ Nedinvest (Pty) ltd
■ dr holsboer Benefit fund
■ Nedgroup securities (Pty) ltd
■ NBG capital management (Pty) ltd
■ NiB Blue capital investments (Pty) ltd
■ Nedgroup Private Wealth (Pty) ltd
Other insurance ■ Nedbank Group
insurance company ltd
■ Nedgroup insurance company ltd
■ Nedgroup structured life ltd
■ Nedgroup life assurance company ltd
Local subsidiaries ■ Nedeurope ltd
(isle of man)
■ Nedgroup investments africa (mauritius)
■ Nedbank (malawi) ltd
■ mBca Bank ltd (Zimbabwe) 71,4%
■ Nedbank Namibia ltd
■ Nedgroup international holdings ltd (isle of man)
■ Nedgroup trust ltd (Guernsey)
all subsidiaries are wholly-owned, unless stated otherwise.
tRUsts, secURities aNd otheR eNtities
NedBaNK limited 100%
foReiGN NedBaNK GRoUP sUBsidiaRies
NedBaNK GRoUP iNsURaNce holdiNGs limited 100%
Local subsidiaries
■ Boe holdings (Pty) ltd
■ Peoples mortgage ltd
■ Nedcor investments ltd
■ Nedgroup investment 102 ltd
■ depfin investments (Pty) ltd
■ Boe investment holdings ltd
Foreign Nedbank subsidiaries
■ Nedbank (lesotho) ltd
■ Nedbank (swaziland) ltd 65,0%
■ Nedcor trade services ltd (mauritius)
■ syfrets securities ltd
■ Nedgroup Private Wealth stockbro-kers (Pty) ltd
■ Nedgroup collec-tive investments ltd
■ Nedinvest (Pty) ltd
■ dr holsboer Benefit fund
■ Nedgroup securi-ties (Pty) ltd
■ NBG capital management (Pty) ltd
■ NiB Blue capital investments (Pty) ltd
■ Nedgroup Private Wealth (Pty) ltd
■ Nedbank Group insurance company ltd
■ Nedgroup insurance company ltd
■ Nedgroup structured life ltd
■ Nedgroup life assurance company ltd
■ Nedeurope ltd (isle of man)
■ Nedgroup investments africa (mauritius)
■ Nedbank (malawi) ltd
■ mBca Bank ltd (Zimbabwe) 71,4%
■ Nedbank Namibia ltd
■ Nedgroup international holdings ltd (isle of man)
■ Nedgroup trust ltd (Guernsey)
all subsidiaries are wholly-owned, unless stated otherwise.
tRUsts, secURities aNd otheR eNtities
NedBaNK limited 100%
foReiGN NedBaNK GRoUP sUBsidiaRies
otheR iNsURaNce
NEDBANK GROUP LTD

NedbaNk Group
135
Consolidated and separate annual
finanCial statements
55 uNCONSOLIDATED STRuCTuRED ENTITIESThe group considers an entity that has been designed so that voting or similar rights are not the dominant factor in deciding who controls the entity, to be a structured entity. The relevant activities of structured entities are normally directed by means of contractual arrangements and often have some or all of the following features or attributes:
■ restricted activities; ■ a narrow and well-defined objective; ■ insufficient equity to permit the structured entity to finance its activities without subordinated financial support; and ■ financing in the form of multiple contractually linked instruments to investors that create concentrations of credit or other risks (tranches).
However, interests in unconsolidated structured entities that result from typical customer supplier relationships are not regarded as exposures that are required to be disclosed in terms of IFRS 12 with specific reference to unconsolidated structured entities.
The group evaluates the nature of its involvement with all unconsolidated structured entities to determine whether it is based on a typical customer-supplier relationship. This assessment includes consideration of the following:
■ the typical operations and business model of the business unit involved; ■ the risk and variability of return the group is exposed to; ■ the purpose and design of the structured entity and/or the instrument the group is exposed to; and ■ the level of subordination of rights and concentration of risk relating to the exposure.
The group has various involvements in and exposures towards unconsolidated structured entities which includes: ■ certain investments in exchange-traded funds and securitisation structures; ■ certain funding structures; ■ certain management and fiduciary functions performed in terms of trusts and partnerships; and ■ security special-purpose vehicles (SPVs).
Through careful assessment, these involvements and exposure are regarded to be typical customer supplier relationships and are therefore not required to be disclosed in terms of IFRS 12.
56 EMBEDDED-VALuE REPORT OF NEDGROuP LIFE ASSuRANCE COMPANY LIMITED (NEDGROuP LIFE)sCope of tHe embedded-Value reportThis report deals with the embedded value of Nedgroup Life and the value of new business written during the financial year.
embedded-ValueThe embedded-value (EV) and value of new business of the covered business at 31 December are:
% change2014
rm2013
Rm
Adjusted net worth 1 053 697Required capital 208 454Free surplus 845 243
Value of in-force business 1 340 1 440Present value of future profits 1 445 1 554Frictional costs (28) (59)Cost of non-hedgeable risk (77) (55)
Total EV 12,0 2 393 2 137Value of new business -27,0 257 352New business sales (APE¹) -22,6 668 863APE¹ margin (%) 38,5 40,8PVNBP² -27,9 1 698 2 354PVNBP² margin (%) 15,1 15,0Analysis of EV earnings:EV at the beginning of the year 2 137 2 030Total EV earnings 676 683Operating EV earnings 595 714Value of new business 257 352Expected return 155 114Experience variances 250 299Non-economic assumption changes (67) (51)
Economic variances 38 (59)Return on adjusted net worth 43 28
Adjustment: dividends paid (420) (576)EV at the end of the year 12,0 2 393 2 137Return on EV (%) 27,8 35,2¹ Annualised premium equivalent.² Present value of new-business premiums.

136
NOTES TO THE CONSOLIDATED FINANCIAL STATEMENTS (continued)for the year ended 31 December
56 EMBEDDED-VALuE REPORT OF NEDGROuP LIFE ASSuRANCE COMPANY LTD (NEDGROuP LIFE) (continued)The return on EV of 27,8% (2013: 35,2%) is driven by strong 2014 sales. Nedgroup Life paid dividends totalling R420m (2013: R576m).
metHodoloGyCovered business refers to all long-term life insurance business underwritten by the company.
embedded valueThe EV of the covered business is the discounted value of the projected future after-tax shareholder earnings arising from covered business in force at the valuation date, plus the adjusted net worth.
Adjusted net worth represents the excess of the market value of assets over the statutory financial soundness valuation of liabilities.
required capital
Required capital is the market value of assets that is required to support the covered business over and above that required to back the statutory liabilities, whose distribution to shareholders is restricted. The following capital measures are considered acceptable when determining the required capital:
■ economic capital and ■ regulatory capital
Economical capital for the covered business is based on the company's own internal assessment of risk inherent in the business, consistent with a 99,93% confidence interval over a one-year time horizon.
free surplusFree surplus is the excess of market value of assets over the statutory liabilities and the required capital. It is the assets that are available for distribution to shareholders.
Value of in-force (Vif) businessVIF business consists of the following components:
■ present value of future profits; less ■ frictional costs of required capital; less ■ cost of non-hedgeable risks.
Projected liabilities and cashflows are calculated net of outward reinsurance.present value of future profits (pVfp)PVFP is calculated as the discounted value of future distributable earnings (taking account of local statutory reserving requirements) that are expected to emerge from the in-force covered business, including the value of contractual renewal of in-force business, on a best-estimate basis where assumed earned rates of return and discount rates are equal to risk-free rates.
frictional costsDue to the requirement to hold capital in addition to statutory liabilities (ie required capital), there is a cost to shareholders since this capital is locked in the company. Frictional cost is the cost in respect of the taxation on the investment return and investment costs on the assets backing the required capital.
Cost of non-hedgeable risk (CnHr)Non-hedgeable risks are those risks which cannot be hedged in deep and liquid markets (eg mortality, morbidity, persistency, expense, reinsurance and operational risk). These risks are managed by holding risk capital. CNHR is calculated using a capital approach, ie it is determined as the present value of capital charges for all future non-hedgeable risk capital requirements until the liabilities have run off. A weighted-average cost of capital rate of 2,0% has been applied to residual symmetric and asymmetric non-hedgeable capital.
Value of new business (Vnb)This is a measure of the value added to a company as a result of writing new business. This is calculated as the discounted value, at the date of sale, of projected after-tax shareholder profit from covered new business written during the reporting period net of frictional costs and the CNHR associated with writing new business, using economic assumptions at the start of the reporting period.
ape and pVnbp marginsAPE is the annual premium for regular premium sales plus 10% of single-premium sales sold during the reporting period. The APE margin is defined as the ratio of VNB to APE.
PVNBP is the present value of future premium and is calculated using a calculation approach that is consistent with calculation of VNB. The PVNBP margin is defined as the ratio of VNB to PVNBP.
assumptionsnon-economic assumptionsThe EV and VNB were determined using best-estimate assumptions regarding future mortality, persistency rates and expenses. These best estimate assumptions are determined using past, current and expected future experience.
economic assumptionsEconomic assumptions are determined such that projected cashflows are valued in line with the prices of similar cashflows that are traded in the capital markets. Investment return and discounting assumptions are based on the SA swap yield curve. The swap curve is sourced from a third-party market-consistent asset model. Expense inflation assumptions are determined considering a spread to the swap yield curve.

NedbaNk Group
137
Consolidated and separate annual
finanCial statements
The risk-free spot yields and expense inflation at various terms are provided in the tables below:
Risk-free yields2014
%2013
%
Term (years)1 6,6 5,75 7,6 7,7
10 8,3 8,8
Expense inflation2014
%2013
%
Term (years)1 5,8 6,35 6,4 7,1
10 7,0 7,8
sensitiVitiesThe table below shows the sensitivities of VNB, VIF and EV at 31 December to changes in key assumptions.2014
Rm VIF EV VNB
Central assumptions 1 339 2 393 257Economic assumptions increase by 1% 1 289 2 343 246Economic assumptions decrease by 1% 1 371 2 424 268Equity and property market value decreasing by 10% 1 321 2 418 257Voluntary discontinuance rates decreasing by 10% 1 401 2 437 270Mortality and morbidity rates decrease by 5% 1 409 2 481 270Maintenance expenses decrease by 10%, with no corresponding change in expense charges 1 348 2 424 271
Acquisition expenses increase by 10% 1 339 2 393 253
2013Central assumptions 1440 2 137 352Economic assumptions increase by 1% 1395 2 098 339Economic assumptions decrease by 1% 1488 2 178 367Equity and property market value decreasing by 10% 1434 2 171 352Voluntary discontinuance rates decreasing by 10% 1521 2 199 373Mortality and morbidity rates decrease by 5% 1516 2 235 367Maintenance expenses decrease by 10%, with no corresponding change in expense charges 1462 2 174 366
Acquisition expenses increase by 10% 1440 2 137 350
reVieW by independent aCtuaries
Independent consulting actuaries have reviewed the results, methodology and assumptions underlying the calculation of the EV and the VNB. Based on the information supplied to them by Nedgroup Life, they are satisfied that the methodology and assumptions have been determined in accordance with generally accepted actuarial principles and in accordance with guidance note APN107 – Embedded Value Reporting.
57 EVENTS AFTER THE REPORTING PERIODRefer to the directors' report for information on these events.

138
SEPARATE STATEMENT OF COMPREHENSIVE INCOMEfor the year ended 31 December
SEPARATE STATEMENT OF FINANCIAL POSITIONat 31 December
Note2014
rm2013
Rm
Interest and similar income (26)
Interest expense and similar charges 1
net interest expense (25)
Impairment of intergroup loans and advances release 7 166 12
income from lending activities 141 12Dividends from subsidiaries 6 254 4 462Reversal of impairment on investment in subsidiary 6Fair-value adjustments 46 9Loss on cancellation of treasury shares (1 767)
Foreign exchange (loss)/gain on capital redemption (12) 46
operating income 4 662 4 535
Operating expenses 1 (33) (24)
profit before taxation 4 629 4 511
Direct taxation 2 15 53
total comprehensive income for the year 4 614 4 458
Note2014
rm2013
Rm
assetsCash and cash equivalents 1Loans and advances 288Other assets 1Investment securities 3 40Investments in associate companies and joint arrangements 4 6 223Investment in subsidiary companies 26 327 28 179Shares at cost – unlisted 25 221 25 384Owing by subsidiaries 1 106 2 795
total assets 32 840 28 219
Shareholders' equity and liabilitiesOrdinary share capital 5 499 510Ordinary share premium 20 644 21 474Share-based payments reserve 340 340Other non-distributable reserves 41 41
Distributable reserves 4 458 4 736
equity attributable to equity holders of the parent 25 982 27 101Other liabilities 6 57 13Current taxation liabilities 3 19Impairment of intergroup loans and advances 7 166
Amounts owing to subsidiaries 6 798 920
total liabilities 6 858 1 118
total shareholders' equity and liabilities 32 840 28 219

NedbaNk Group
139
Consolidated and separate annual
finanCial statements
SEPARATE STATEMENT OF CHANGES IN EquITYfor the year ended 31 December
SEPARATE STATEMENT OF CASHFLOWSfor the year ended 31 December
Number of ordinary
sharesRm
Ordinary share
capitalRm
Ordinary share
premiumRm
Share-based payments
reserve¹Rm
Other non-distributable
reserves²Rm
Distributable reserves³
Rm
Total ordinary shareholders’
equityRm
Balance at 31 December 2012 507 509 491 507 21 002 340 41 4 370 26 260Shares issued in terms of employee incentive schemes 2 792 902 3 527 530Capital contribution (55) (55)Total comprehensive income for the year 4 458 4 458
Dividends to shareholders (4 092) (4 092)
balance at 31 december 2013 510 302 393 510 21 474 340 41 4 736 27 101Shares issued in terms of employee incentive schemes 3 670 463 4 767 771Shares delisted (14 715 049) (15) (1 597) (1 612)Total comprehensive income for the year 4 614 4 614
Dividends to shareholders (4 892) (4 892)
balance at 31 december 2014 499 257 807 499 20 644 340 41 4 458 25 982¹ All share-based payment expenses are recognised in the statement of comprehensive income, with the corresponding amount recognised in share-based payment reserves. Any excess tax benefit over the relative tax on the share-based
payments expense is recognised directly in this reserve. On the expiry or exercise of a share-based instrument the cumulative amount recognised in this respect is transferred directly to other distributable reserves.² Represents other non-distributable revaluation surplus on capital items and non-distributable reserves transferred from other distributable reserves in order to comply with various banking regulations.³ Represents the accumulated profits after distributions to shareholders and appropriation of retained earnings to other non-distributable earnings.
Note2014
rm2013
Rm
Cash generated by operations 8 6 196 4 438Cash paid to clients, employees and suppliers (58) (24)Dividends received on investments 6 254 4 462
Change in funds for operating activities 7 322 (835)Decrease/(increase) in operating assets 1 400 (617)Increase/(decrease) in operating liabilities 5 922 (218)
net cash from operating activities before taxation 13 518 3 603
Taxation paid 9 31 38
Cashflows from operating activities 13 487 3 565Cashflows (utilised by)/from investing activities (7 752) 52(Acquisition)/disposal of investments in subsidiaries, associate companies and joint arrangements (7 752) 52
Cashflows utilised by financing activities (5 734) (3 617)Proceeds from issue of ordinary shares 771 530Capital contribution (1 613) (55)Dividends paid to ordinary shareholders (4 892) (4 092)
net increase in cash and cash equivalents for the year 1 –

140
NOTES TO THE SEPARATE ANNuAL FINANCIAL STATEMENTSfor the year ended 31 December
The separate annual financial statements have been prepared in accordance with accounting policies consistent with those applied in the preparation of the consolidated annual financial statements, except where stated otherwise.
1 OPERATING ExPENSES2014
rm2013
Rm
Audit fees 19 13Directors' fees 9 8
Other 5 3
33 24
2 DIRECT TAxATION2.1 Charge for the year
Statement of comprehensive income charge – SA normal taxation 9Statement of comprehensive income charge – section 9D attribution 6 51
Deferred CGT on impairment of option 2
15 53
2.2 Taxation rate reconciliation % %Standard rate of SA normal taxation 28 28Non-taxable income (39) (28)
Other taxation 11 1
Effective taxation rate 1
3 INVESTMENT SECuRITIESBalance at the beginning of year 40 31Fair-value gain 73 9
Capitalised to investments in associate companies and joint arrangements (113)
Balance at end of the year 40
4 INVESTMENTS IN ASSOCIATE COMPANIES AND JOINT ARRANGEMENTSThe investments in ETI and Banco Único are held at costInvestments in associate companies and joint arrangements 6 213
Loans to associate companies and joint arrangements 10
Balance at the end of the year 6 223
5 SHARE CAPITALOrdinary share capitalAuthorised
600 000 000 (2013: 600 000 000) ordinary shares of R1 each 600 600
Issued ordinary share capital
499 257 807 (2013 : 510 302 393) fully paid ordinary shares of R1 each 499 510
Subject to the restrictions imposed by the Companies Act, 71 of 2008 (as amended), the unissued shares are under the control of the directors until the forthcoming annual general meeting.
6 OTHER LIABILITIESCreditors and other accounts 57 13
7 IMPAIRMENT OF INTERGROuP LOANS AND ADVANCESA specific impairment was raised on intergroup loans and advances made by Nedbank Limited to fellow subsidiary companies in prior years. This impairment provision is no longer required as these intergroup loans are being monitored through Nedbank Ltd's credit monitoring process.Balance at the beginning of the year 166 178
Statement of comprehensive income release (166) (12)
Balance at the end of the year 166

NedbaNk Group
141
Consolidated and separate annual
finanCial statements
8 CASH GENERATED BY OPERATIONS2014
rm2013
Rm
Reconciliation of profit before taxation to cash generated by operationsProfit before taxation 4 629 4 511Adjusted for:– Movement in impairment of loans and advances (166) (12)– Fair-value option (46) (9)– Foreign exchange gain on capital redemption (46)– Reversal of impairment on investment in subsidiary (6)– Loss on cancellation of treasury shares 1 767
– Foreign exchange loss 12
Cash generated by operations 6 196 4 438
9 TAxATION PAID
Amounts payable at the beginning of the year 19 6Statement of comprehensive income charge – SA normal taxation 9Statement of comprehensive income charge – section 9D attribution 6 51
Amounts payable at the end of the year (3) (19)
31 38
10 SHARE-BASED PAYMENTSEquity instruments are granted to business partners and non-executive directors as an incentive to retain business and develop growth within the group. The share-based payments expenses and reserve balances in respect of the Black Business Partner Scheme and the Non-executive Directors' Scheme, implemented in 2005, were accounted for in the Nedbank Group Limited consolidated financial statements and in the Nedbank Group Limited standalone financial statements. Both of these schemes will be equity-settled.As the company cannot estimate reliably the fair value of services received nor the value of additional business received, the company rebuts the presumption that such services and business can be measured reliably. The company therefore measures their fair value by reference to the fair value of the equity instruments granted, in line with the group's accounting policy. The fair value of such equity instruments is measured at the grant date utilising the Black-Scholes valuation model.
10.1 Description of arrangementsScheme Trust/SPV Description Vesting requirements Maximum term
Nedbank Eyethu BEE schemes
Black Business Partner Scheme
WIPHOLD Financial Services Number Two Trust and Brimstone-Mtha Financial Services Trust
Each trust was issued an equal number of restricted shares at R1,87 per share, with notional funding over a period of 10 years. The beneficial ownership of the shares resides with the participants, including the voting and dividend rights.
No dealing in the shares during the 10-year notional funding period.
10 years
Community Trust Nedbank Eyethu Community Trust
The trust has been formed with the specific purpose of providing previously dissadvantaged communities and charitable organisations with the opportunity to receive dividends in respect of the scheme shares and thereby contributing to Nedbank Group's Limited BEE compliance.
Shares are not allocated to specific beneficiaries. At the end of the 10 years the net assets of the trust will be allocated to participants as determined by the trustees.
10 yearsSubsequent to December 2013 the termination date of the trust was extended from 2015 to 2030 so as to provide an ongoing flexible vehicle for deploying the residual assets of the trust and continued support of community affairs in line with the group's BEE and Fair Share 2030 initiatives.

142
10.2 Effect on profit and financial positionshare-based payments expense share-based payments reserve
2014rm
2013Rm
2014rm
2013Rm
Community Scheme 124 124
124 124
10.3 Movements in number of instruments2014 2013
number of instruments
Weighted average
exercise pricer
number of instruments
Weighted average
exercise pricer
black business partner scheme
Outstanding at the beginning of the year 7 891 300 163,53 7 891 300 171,82
Outstanding at the end of the year 7 891 300 163,53 7 891 300 171,82
Exercisable at the end of the year
Weighted average share price for options exercised (R)
Community scheme
Outstanding at the beginning of the year 851 111 851 111
Outstanding at the end of the year 851 111 851 111
Exercisable at the end of the year
Weighted average share price for options exercised (R)
10.4 Instruments outstanding at the end of the year by exercise priceBlack Business Partner Scheme
163,53 7 891 300 7 891 300 1,6
7 891 300 7 891 300 1,6
11 RELATED PARTIES11.1 Relationship with parent, ultimate controlling party and investees
The company's parent company is Old Mutual (South Africa) Ltd (OMSA), which, through its subsidiaries, holds 54,04% (2013: 52,03%) of Nedbank Group Limited's ordinary shares. The ultimate controlling party is Old Mutual plc, incorporated in the united Kingdom.
Material subsidiaries of the company are identified in note 54 and associate companies and joint arrangements of the company are identified in note 53.
11.2 Key management personnel compensationKey management personnel are those persons who have authority and responsibility for planning, directing and controlling the activities of the company, directly or indirectly, including all directors of the company and its parent, as well as members of the executive committee who are not directors, as well as close members of the family of any of these individuals.
Details of the compensation paid to the board of directors and prescribed officers and details of their shareholdings in the company are disclosed in the Remuneration Report. Compensation paid to the board of directors and compensation paid to other key management personnel, as well as the number of share instruments held, are shown below:
NOTES TO THE SEPARATE ANNuAL FINANCIAL STATEMENTS (continued)for the year ended 31 December

NedbaNk Group
143
Consolidated and separate annual
finanCial statements
11.2 Key management personnel compensation (continued)
Directors
Key management
personnel Total
Compensation (rm)2014Directors' fees 14 14Remuneration – Paid by subsidiaries 84 202 286Short-term employee benefits 47 120 167Gain on exercise of share instruments 37 82 119
98 202 300
2013Directors' fees 11 11Remuneration – Paid by subsidiaries 78 151 229Short-term employee benefits 43 118 161Gain on exercise of share instruments 35 33 68
89 151 240
number of share instruments2014Outstanding at the beginning of the year 571 714 1 666 293 2 238 007Granted 173 902 456 115 630 017Forfeited (7 965) (91 879) (99 844)
Exercised (159 183) (455 540) (614 723)
Outstanding at the end of the year 578 468 1 574 989 2 153 457
2013Outstanding at the beginning of the year 645 194 1 686 127 2 331 321Granted 165 168 441 334 606 502Forfeited (11 541) (11 541)
Exercised (238 648) (449 627) (688 275)
Outstanding at the end of the year 571 714 1 666 293 2 238 007
11.3 Related-party transactionsThe following significant transactions were entered into between Nedbank Group Limited and the following related parties. All of these transactions were entered into in the normal course of business.
outstanding balances (rm)
due from/(owing to)
2014 2013
subsidiariesLoan from BoE Investment Holdings Ltd – Interest free (869) (869)Loan from Nedbank Nominees (Pty) Ltd – Interest free (4) (4)Advance to Nedbank Group Insurance Holdings Ltd 260Advance to NBG Capital Management Ltd 1 612Advance to Syfrets Securities Ltd 200 200Advance to Nedgroup Securities Ltd 500 500Loan from The Board of Executors 1838 (45) (45)Bank accounts with Nedbank Ltd – Interest free 144 482Loan from Nedbank Ltd – interest bearing (878)Loan from Nedbank Ltd – interest free (5 000)Impairment provision in respect of amounts due to Nedbank Ltd by its subsidiaries (166)Key management personnelThe WIPHOLD and Brimstone consortiums are related parties since certain key- management personnel of the group have significant influence over these entities. These consortia are participants in the Nedbank Eyethu BEE schemes and the share-based payments reserve recognised in respect of these consortiums and key management personnel is detailed below:– WIPHOLD consortium (154) (108)– Brimstone consortium (147) (107)– Community trust (125) (125)Share-based payments reserve (426) (340)

144
11 RELATED PARTIES (continued)
11.3 Related-party transactions (continued)
transactions (rm)
income/(expense)
2014 2013
interest expense to subsidiariesNedbank Ltd (26)dividends from subsidiariesAlliance Investments Ltd 5BoE Investment Holdings Ltd 309NBG Capital Management (Pty) Ltd 1 842Nedbank Group Insurance Company Ltd 75Nedbank Ltd 3 400 3 450Nedeurope Ltd 138 50Nedcor (SA) Insurance Company Ltd 34Nedgroup Insurance Company Ltd 50 50Nedgroup Investment Holdings 101 Ltd 480 118Nedgroup Investments (Pty) Ltd 160 105Nedgroup Life Assurance Company Ltd 288Nedgroup Private Wealth (Pty) Ltd 150Nedinvest Ltd 1
Tando AG 11
Dividends declared by subsidiaries 6 254 4 462
12 LIquIDITY, CREDIT RISK AND MARKET RISK INFORMATIONAssets and liabilities consist of primarily non-financial assets and liabilities. These are not subject to liquidity, credit risk and market risk for disclosure purposes, except as disclosed in note 5.
13 OFFSETTING FINANCIAL ASSETS AND FINANCIAL LIABILITIESAssets and liabilities consist of primarily non-financial assets and liabilities. These are not subject to offsetting disclosures as envisaged in IFRS 7.
14 EVENTS AFTER THE REPORTING PERIODRefer to the directors' report for information on these events.
NOTES TO THE SEPARATE ANNuAL FINANCIAL STATEMENTS (continued)for the year ended 31 December

NedbaNk Group
145
Consolidated and separate annual
finanCial statements
15 SHAREHOLDERS' ANALYSISRegister date: 2 January 2015Authorised share capital: 600 000 000 sharesIssued share capital: 499 257 807 shares
shareholder spread number of
shareholdings % number of
shares %
1 – 1 000 shares 17 190 80,47 4 189 529 0,841 001 – 10 000 shares 3 241 15,17 8 917 668 1,7910 001 – 100 000 shares 704 3,30 23 175 378 4,64100 001 – 1 000 000 shares 187 0,88 53 527 054 10,72
1 000 001 shares and over 40 0,18 409 448 178 82,01
total 21 362 100,00 499 257 807 100,00
Distribution of shareholders
Banks 200 0,94 65 431 449 13,11Close corporations 119 0,56 121 492 0,02Empowerment 21 0,10 23 132 880 4,63Endowment funds 171 0,80 965 785 0,19Government 3 0,01 85 573 0,02Individuals 16 455 77,03 9 805 439 1,97Insurance companies 149 0,70 3 116 313 0,62Investment companies 63 0,29 3 140 861 0,63Medical aid schemes 37 0,17 369 418 0,07Mutual funds 405 1,90 40 036 708 8,02Old Mutual Life Assurance Company (South Africa) Ltd and associates 36 0,17 269 776 225 54,04Other corporations 68 0,32 106 802 0,02Private companies 366 1,71 1 896 551 0,38Public companies 22 0,10 140 067 0,03Retirement funds 481 2,25 64 264 490 12,87Share trusts¹ 10 0,05 12 536 625 2,51
Nominees and trusts 2 756 12,90 4 331 129 0,87
total 21 362 100,00 499 257 807 100,00
Public/non-public shareholders
Non-public shareholders 88 0,41 307 252 640 61,54Directors and associates of the company² 9 0,04 796 059 0,16Old Mutual Life Assurance Company (South Africa) Ltd and associates 36 0,17 269 776 225 54,04Nedbank/Nedbank Group pension funds 6 0,03 265 981 0,05Nedbank Group Ltd and associates (share trusts)¹ 10 0,05 12 037 266 2,41Nedbank Group Ltd and associates (mutual funds) 7 0,03 1 332 143 0,27Nedbank Group BEE trusts – SA¹ 9 0,04 22 226 463 4,45Nedbank Group BEE trusts – Namibia 11 0,05 818 503 0,16
Public shareholders 21 274 99,59 192 005 167 38,46
total 21 362 100,00 499 257 807 100,00¹ Excludes shares held by directors in share trusts (executive directors only) and Eyethu schemes.² Includes shares held by directors in share trusts (executive directors only) and Eyethu schemes.

146
NOTES TO THE SEPARATE ANNuAL FINANCIAL STATEMENTS (continued)for the year ended 31 December
15 SHAREHOLDERS' ANALYSIS (continued)
major shareholders/managers Number of
shares 2014
% holding2013
% holding
Old Mutual Life Assurance Company (South Africa) Ltd and associates 269 776 225 54,04 52,03Nedbank Group treasury shares 33 614 889 6,74 9,63BEE trusts:– Eyethu scheme – Nedbank South Africa 21 876 437 4,38 4,42– Omufima scheme – Nedbank Namibia 827 607 0,17 0,15Nedbank Group (2005) Share Option, Matched Share and Restricted Share Scheme 10 863 333 2,18 2,17Nedbank Group Ltd and associates (Capital Management) 2,88Nedbank Namibia Ltd 47 512 0,01 0,01
Coronation Fund Managers (SA) 33 029 067 6,62 5,99Public Investment Corporation (SA) 32 746 778 6,56 6,37Lazard Asset Management (uS and uK) 13 498 914 2,70 3,15Dimensional Fund Advisors (uS, uK and Au) 7 905 186 1,58 1,46BlackRock Inc (uS and uK) 7 893 372 1,58 1,66
Sanlam Investment Management (SA) 7 657 157 1,53 1,95
beneficial shareholders holding of 5% or more Number of
shares 2014
% holding2013
% holding
Old Mutual Life Assurance Company (South Africa) Ltd and associates (SA) 269 776 225 54,04 52,03
Government Employees Pension Fund (SA) 36 859 230 7,38 7,51
Geographical distribution of shareholders Number of
shares 2014
% holding2013
% holding
domestic 429 687 651 86,07 86,85South Africa 416 008 435 83,33 85,36Namibia 9 736 799 1,95 1,00Swaziland 48 500 0,01 0,01unclassified 3 893 917 0,78 0,48
foreign 69 570 156 13,93 13,15united States of America 37 305 236 7,47 7,95united Kingdom and Ireland 6 537 519 1,31 1,28Europe 10 220 780 2,05 1,48Other countries 15 506 621 3,10 2,44
499 257 807 100,00 100,00

NedbaNk Group
147
Consolidated and separate annual
finanCial statements
Note number Note description IFRS required
1 PRINCIPAL ACCOuNTING POLICIES IAS² 12 STANDARDS AND INTERPRETATIONS IAS 1 and IAS 83 KEY ASSuMPTIONS CONCERNING THE FuTuRE AND KEY SOuRCES OF ESTIMATION IAS 14 CAPITAL MANAGEMENT IAS 15 INTEREST AND SIMILAR INCOME IAS 18, IAS 32, IAS 39, IFRS 7 and IFRS 136 INTEREST ExPENSE AND SIMILAR CHARGES IAS 18, IAS 32, IAS 39, IFRS 7 and IFRS 137 NON-INTEREST REVENuE IAS 18, IAS 20, IAS 32, IAS 39, IFRS 4, IFRS
7, IFRS 8 and IFRS 138 OPERATING ExPENSES IAS 1, IAS19, IFRS 2 and IFRS 89 INDIRECT TAxATION IAS 110 NON-TRADING AND CAPITAL ITEMS IAS 1, IAS 16, IAS 36 and IFRS 1011 DIRECT TAxATION IAS 1212 EARNINGS IAS 3313 DIVIDENDS IAS 1 and IAS 1014 CASH AND CASH EquIVALENTS IAS 1, IAS 7 and IFRS 715 OTHER SHORT-TERM SECuRITIES IAS 1, IAS 39, IFRS 7, IFRS 8 and IFRS 1316 DERIVATIVE FINANCIAL INSTRuMENTS IAS 32, IAS 39, IFRS 7 and IFRS 1317 GOVERNMENT AND OTHER SECuRITIES IAS 1,IAS 32, IAS 39, IFRS 7; IFRS 8 and IFRS 1318 LOANS AND ADVANCES IAS 17, IAS 39, IFRS 7, IFRS 8 and IFRS 1319 IMPAIRMENT OF LOANS AND ADVANCES IAS 39, IFRS 7 and IFRS 820 OTHER ASSETS IAS 1, IAS 39, IFRS 7 and IFRS 1321 INVESTMENT SECuRITIES IAS 32, IAS 39, IFRS 7 and IFRS 1322 INVESTMENTS IN PRIVATE ASSOCIATES, ASSOCIATE COMPANIES AND JOINT
ARRANGEMENTSIAS 28, IFRS 11, IFRS 12 and IFRS 13
23 NON-CuRRENT ASSETS AND LIABILITIES HELD FOR SALE IFRS 5 and IFRS 1324 DEFERRED TAxATION IAS 1225 INVESTMENT PROPERTY IAS 40 and IFRS 1326 PROPERTY AND EquIPMENT IAS 16, IAS 36 and IFRS 1327 LONG-TERM EMPLOYEE BENEFITS IAS 19, IAS 26 and IFRIC³ 1428 INTANGIBLE ASSETS IAS 38 and IAS 3629 SHARE CAPITAL IAS 130 AMOuNTS OWED TO DEPOSITORS IAS 1, IAS 39, IFRS 7, IFRS 8 and IFRS 1331 PROVISIONS AND OTHER LIABILITIES IAS 37, IAS 32, IAS 39, IFRS 7 and IFRS 1332 INVESTMENT CONTRACT LIABILITIES IAS 1, IAS 39, IFRS 4, IFRS 7 and IFRS 1333 INSuRANCE CONTRACT LIABILITIES IAS 1 and IFRS 434 LONG-TERM DEBT INSTRuMENTS IAS 32, IAS 39, IFRS 7 and IFRS 1335 CASHFLOW INFORMATION IAS 736 CONSOLIDATED STATEMENT OF FINANCIAL POSITION – CATEGORIES OF FINANCIAL
INSTRuMENTSIAS 39 and IFRS 7
37 FAIR-VALuE MEASuREMENT – FINANCIAL INSTRuMENTS IAS 39, IFRS 7 and IFRS 1338 FINANCIAL INSTRuMENTS DESIGNATED AS AT FAIR VALuE THROuGH PROFIT OR LOSS IAS 32, IAS 39, IFRS 7 and IFRS 1339 OFFSETTING FINANCIAL ASSETS AND FINANCIAL LIABILITIES IFRS 7, IFRS 13 and IAS 3240 CREDIT ANALYSIS OF OTHER SHORT-TERM SECuRITIES, AND GOVERNMENT AND
OTHER SECuRITIESIFRS 7
41 LIquIDITY GAP IFRS 742 CONTRACTuAL MATuRITY ANALYSIS FOR FINANCIAL LIABILITIES IFRS 743 HISTORICAL VALuE AT RISK (99%, ONE-DAY ) BY RISK TYPE IFRS 744 INTEREST RATE REPRICING GAP IFRS 745 SECuRITISATIONS IAS 39, IFRS 7 and IFRS 1346 FOREIGN CuRRENCY CONVERSION GuIDE IAS 2147 CONTINGENT LIABILITIES AND uNDRAWN FACILITIES IAS 37 and IAS 1048 COMMITMENTS IAS 37, IAS 10, IAS 17 and IFRS 749 COLLATERAL IFRS 750 MANAGED FuNDS IFRS 7 and IFRS 1351 SHARE-BASED PAYMENTS IFRS 252 RELATED PARTIES IAS 2453 ANALYSIS OF INVESTMENTS IN PRIVATE-EquITY ASSOCIATES, ASSOCIATE
COMPANIES AND JOINT ARRANGEMENTSIAS 28, IFRS 11, IFRS 12 and IFRS 13
54 ANALYSIS OF INVESTMENTS IN SuBSIDIARY COMPANIES IAS 27, IFRS 10 and IFRS 1255 uNCONSOLIDATED STRuCTuRED ENTITIES IFRS 12Page 135 EMBEDDED-VALuE REPORT OF NEDGROuP LIFE ASSuRANCE COMPANY LTD IFRS 4Integrated Report WORLDCLASS AT MANAGING RISK IFRS 7 and IFRS 13¹ International Financial Reporting Standards (IFRS).² International Accounting Standards (IAS).³ International Financial Reporting Interpretations Committee (IFRIC).
COMPLIANCE WITH IFRS1 – ANNuAL FINANCIAL STATEMENT NOTES

148
rm
2014 2013
averagebalance margin statement interest
Averagebalance Margin statement interest
assets received % Assets Received %
Average prime rate 9,07 8,50Loans and advancesHome loans (including properties in possession) 136 669 10 764 7,88 136 603 9 818 7,19Commercial mortgages 113 525 9 811 8,64 98 223 8 117 8,26Finance lease and instalment debtors 88 119 8 942 10,15 79 266 7 753 9,78Credit cards 12 715 1 712 13,46 11 102 1 473 13,27Overdrafts 15 541 1 432 9,21 14 439 1 263 8,75Term loans and other¹ 185 310 9 572 5,17 163 494 7 757 4,74Personal loans 19 838 4 318 21,77 22 660 4 662 20,57Impairment of loans and advances (11 536) (11 635)
Government and other securities 41 692 3 581 8,59 41 229 3 571 8,66
Short-term funds and trading securities 50 321 2 487 4,94 39 334 1 673 4,25
interest-earning banking assets 652 194 52 619 8,07 594 715 46 087 7,75Net interdivisional assets-trading book (34 551) (21 356)Revaluation of FVTPL designated assets 761 1 454Derivative financial instruments 129 185Insurance assets 15 968 13 835Cash and bank notes 4 095 3 552Other assets 10 739 7 552Associate companies and investments 7 117 4 126Property and equipment 7 143 6 615Intangible assets 8 301 7 993
Mandatory reserve deposits with central bank 13 555 13 124
Total assets 685 451 52 619 7,68 631 795 46 087 7,29
liabilities paid % Liabilities Paid %
Deposit and loan accounts 354 275 18 410 5,20 320 237 14 751 4,61Current and savings accounts 79 876 672 0,84 72 043 584 0,81Negotiable certificates of deposit 82 210 5 138 6,25 89 319 5 134 5,75Other interest-bearing liabilities² 37 796 2 594 6,86 34 194 2 042 5,97
Long-term debt instruments 34 516 2 844 8,24 29 275 2 356 8,05
interest-bearing banking liabilities 588 673 29 658 5,04 545 068 24 867 4,56Other liabilities 13 223 10 971Revaluation of FVTPL³ designated liabilities 761 1 454Derivative financial instruments 931 2 602Investment contract liabilities 15 765 13 581Ordinary shareholders' equity 62 274 54 395
Non-controlling interest 3 824 3 724
total equity and liabilities 685 451 29 658 4,33 631 795 24 867 3,94
interest margin on interest-earning banking assets 652 194 22 961 3,52 594 715 21 220 3,57
Where possible, averages are calculated on daily balances.
¹ Includes term loans, preference shares, factoring debtors, other lending-related instruments and interest on derivatives.² Includes foreign currency liabilities.³ Fair-value through profit or loss.
AVERAGE BANKING STATEMENT OF FINANCIAL POSITION AND RELATED INTEREST

NedbaNk Group
149
Consolidated and separate annual
finanCial statements
Rm
2014 2013
banking trading eliminations total Banking Trading Eliminations Total
assetsCash and cash equivalents 13 335 4 13 339 20 837 5 20 842Other short-term securities 58 787 15 012 (6 565) 67 234 32 076 20 034 (9 659) 42 451Derivative financial instruments 116 16 873 (1 416) 15 573 105 14 782 (1 497) 13 390Government and other securities 36 486 6 880 (16 189) 27 177 46 081 5 490 (19 480) 32 091Loans and advances 586 016 27 005 613 021 541 889 37 483 579 372Other assets 6 159 2 556 8 715 4 871 3 802 8 673Current taxation assets 291 291 565 565Investment securities 20 029 20 029 19 343 5 19 348Non-current assets held for sale 16 16 12 12Investments in private-equity associates, associate companies and joint arrangements 7 670 7 670 1 101 1 101Deferred taxation assets 165 144 309 70 146 216Property and equipment 7 900 3 7 903 7 027 5 7 032Long-term employee benefit assets 4 546 4 546 2 980 2 980Mandatory reserve deposits with central banks 14 911 14 911 13 231 13 231Intangible assets 8 568 11 8 579 8 270 20 8 290
Inter-divisional assets 56 793 (56 793) – 29 579 (29 579) –
total assets 764 995 125 281 (80 963) 809 313 698 458 111 351 (60 215) 749 594
Equity and liabilitiesTotal equity attributable to equity holders of the parent 64 007 3 017 67 024 57 948 2 669 60 617Non-controlling interest attributable to:– ordinary shareholders 326 326 246 246
– preference shareholders 3 561 3 561 3 473 3 473
total equity 67 894 3 017 – 70 911 61 667 2 669 – 64 336Derivative financial instruments 1 498 15 390 (1 416) 15 472 1 677 16 400 (1 497) 16 580Amounts owed to depositors 576 163 85 403 (8 116) 653 450 545 317 67 637 (10 002) 602 952Provisions and other liabilities 7 028 21 398 (14 638) 13 788 9 220 24 599 (19 137) 14 682Current taxation liabilities 128 6 134 303 (2) 301Deferred taxation liabilities 864 67 931 741 48 789Long-term employee benefit liabilities 3 071 3 071 1 842 1 842Investment contract liabilities 11 747 11 747 11 523 11 523Insurance contract liabilities 4 171 4 171 3 321 3 321Long-term debt instruments 35 638 35 638 33 268 33 268
Inter divisional liabilities 56 793 (56 793) – 29 579 (29 579) –
total liabilities 697 101 122 264 (80 963) 738 402 636 791 108 682 (60 215) 685 258
total equity and liabilities 764 995 125 281 (80 963) 809 313 698 458 111 351 (60 215) 749 594
STATEMENT OF FINANCIAL POSITION – BANKING/TRADING CATEGORISATION