polaris bank limited consolidated and separate financial
TRANSCRIPT

Consolidated and separate financial statements for the year ended
Polaris Bank Limited
31 December 2019
Polaris Bank Limited
Consolidated and separate financial statements
For the year ended 31 December 2019
Note Page
Note
Page
General information 1 7 Interest income 109
Report of the Directors 2 9 Interest expense 109
Statement of Directors' responsibilities 7 10 Fee and commission income 109
Sustainability Report 8 11 Fee and commission expense 110
Corporate governance report 18 12 Net trading and foreign exchange
income
110
Report of the Auditors 29 13 Other operating income 110
Statement of comprehensive income 34 14 Impairment loss on loans and other
financial assets
110
Statement of financial position 35 15 Employee benefit costs 111
Statement of changes in equity 36 16 Administration and general expenses 112
Statement of cashflows 38 17 Depreciation and amortisation 112
2 Summary of significant accounting policies 41 18 Cash and balances with central banks 113
2.1 Statement of compliance 41 19 Due from banks and other financial
institutions
113
2.2 Basis of preparation 41 20 Financial assets held at fair value
through profit or loss
113
2.2.2 Accounting policies 43 21 Loans and advances to customers 114
2.3 Foreign currency translation 43 22 Investments held at Amortised Cost 115
2.4 Basis of consolidation 44 23 Investments held at FVTOCI 115
2.5 Current and deferred income tax 45 24 Assets pledged as collateral 115
2.6 Financial assets and liabilities 46 25 Prepayment and other assets 116
2.7 Offsetting financial instruments 52 26 Right of use Asset 117
2.8 Assets pledged as collateral 52 27 Lease liability 117
2.90 Interest income and expense 53 28 Property, plant and equipment 118
2.10 Fees and commission income 53 29 Intangible assets 119
2.11 Net trading and foreign exchange income 53 30 Assets classified as held for sale and
discontinued operations
120
2.12 Dividend income 53 31 Due to other financial institutions 123
2.13 Impairment of non-financial assets 53 32 Deposits from customers 123
2.14 Non-current assets (or disposal groups) held
for sale
54 33 Borrowings from local and foreign
institutions
123
2.15 Leases 54 34 Current tax liability 124
2.16 Property, plant and equipment 54 35 Accruals and other liabilities 125
2.17 Intangible assets 55 36 Retirement benefit obligation 125
2.18 Employee benefits 55 37 Share capital and reserves 125
2.19 Provisions 56 38 Cash generated from operations 126
2.20 Financial guarantees 56 39 Related parties 127
2.21 Share capital 56 40 Related party transactions 127
2.22 Borrowings 57 41 Contingent liabilities and commitments 131
2.23 Discontinued operations 57 42 Statement of prudential adjustment 132
2.24 Repossessed Collateral 57 43 Events after the reporting period 132
3 Financial risk management 72 44 Segment reporting 133
4.1 Operational Risk 100 Other National Disclosures: 135
4.2 Capital management 102 Value added statement 136
5 Fair values of financial assets and liabilities 105
6 Significant accounting judgments, estimates
and assumptions
107

Polaris Bank Limited
Consolidated and separate financial statements
For the year ended 31 December 2019
GENERAL INFORMATION
DIRECTORS AND ADVISORS
DIRECTORS Capacity
Directors appointed by Central Bank of Nigeria
Mr Muhammad K. Ahmad, OON Non-Executive Director/Chairman
Mr Adetokunbo Abiru Managing Director/CEO
Mr. Innocent C. Ike Executive Director
Mr. Abdullahi S. Mohammed Executive Director
Mr. Abdullahi M. Umar Non-Executive Director
Mr. Austin Jo-Madugu Non-Executive Director
Mr. Olu Odugbemi Non-Executive Director
Mr. Bata Wakawa Non-Executive Director
COMPANY SECRETARY/LEGAL ADVISER: Babatunde Osibodu
REGISTERED OFFICE: 3 Akin Adesola Street
Victoria Island
Lagos
www.polarisbanklimited.com
AUDITORS: PricewaterhouseCoopers
(Chartered Accountants)
Landmark Towers
5B Water Corporation Road
Victoria Island
Lagos
www.pwc.com/ng

Polaris Bank Limited
Consolidated and separate financial statements
For the year ended 31 December 2019
(All amounts in millions of Naira unless otherwise stated)
Auditors' report
4

Polaris Bank Limited
Consolidated and separate financial statements
Statement of comprehensive income
For the year ended 31 December 2019
(All amounts in millions of Naira unless otherwise stated)
Group Group Bank 21 September - 21 September -
31 December 31 December 31 December 31 December
2019 2018 2019 2018
Notes
Interest income on amortized cost financial assets 7 131,650 24,374 131,650 24,374
Interest income on fair value through profit/loss 8 1,961 215 1,961 215
Interest expense 9 (45,814) (15,212) (45,814) (15,212)
Net interest income 87,797 9,377 87,797 9,377
Impairment loss on loans and other financial assets 14 (14,126) (2,796) (14,126) (2,796)
73,671 6,581 73,671 6,581
Net fee and commission income 10 & 11 8,536 2,159 8,536 2,159
Net trading and foreign exchange income 12 950 8,820 950 8,820
Other operating income 13 3,997 1,066 4,484 1,066
Net operating profit 87,154 18,626 87,641 18,626
Employee benefit costs 15 (26,428) (6,606) (26,428) (6,606)
Administration and general expenses 16 (28,863) (8,457) (28,863) (8,457)
Depreciation and amortisation 17 (4,521) (1,107) (4,521) (1,107)
Profit before tax 27,342 2,456 27,829 2,456
Taxation 34 (479) (25) (479) (25)
Profit for the period from continuing operations 26,863 2,431 27,350 2,431
Profit/ (loss) for the period from discontinued operations (573) 425 - -
Profit for the period 26,290 2,856 27,350 2,431
Profit attributable to:
Owners of the Bank 26,211 2,777 27,350 2,431
Continuing operations 26,863 2,431 27,350 2,431
Discontinued operations (652) 346 - -
Non-controlling interests 79 79 - -
Continuing operations - - - -
Discontinued operations 79 79 - -
26,290 2,856 27,350 2,431
Other comprehensive income:Items that may be subsequently reclassified to
profit or lossCurrency translation differences arising from foreign
operations (388) 1,880 - - Items that will not be reclassified to profit or
loss
Net gains on investments in equity instruments
designated at fair value through other
comprehensive income 2,677 98 2,677 98
Other comprehensive income for the period,
net of tax 2,289 1,978 2,677 98
Total comprehensive income for the period 28,579 4,834 30,027 2,529
Total comprehensive income attributable to:
Owners of the bank 28,500 4,755 30,027 2,529
Continuing operations 29,152 4,409 30,027 2,529
Discontinued operations (652) 346 - -
Non-controlling interests 79 79 - -
Continuing operations - - - -
Discontinued operations 79 79 - -
28,579 4,834 30,027 2,529
The accompanying notes form an integral part of these financial statements
Bank

Polaris Bank Limited
Consolidated and separate financial statements
Statement of financial position
As at 31 December 2019
(All amounts in millions of Naira unless otherwise stated)
Group Group Bank Bank
31 December 31 December 31 December 31 December
2019 2018 2019 2018
Assets Notes
Cash and balances with central banks 18 26,484 28,026 26,484 28,026
Due from banks and other financial institutions 19 62,076 68,966 62,076 68,966 Financial assets held at fair value through
profit or loss 20 1,264 57 1,264 57
Loans and advances to customers 21 188,738 340,050 188,738 340,050
Investment securities:
- Amortised cost 22 517,071 531,805 517,071 531,805 - Fair value through other comprehensive
Income (FVTOCI) 23 17,362 14,634 17,362 14,634
Assets pledged as collateral 24 42,084 58,262 42,084 58,262
Prepayment and other assets 25 48,046 54,795 48,046 55,580
Other loans and receivables 25b 182,594 - 182,594 -
Right of use assets 26 3,637 - 3,637 -
Property, plant and equipment 28 51,623 48,311 51,623 48,311
Intangible assets 29 180 284 180 284 1,141,159 1,145,190 1,141,159 1,145,975
Assets classified as held for sale 30 15,485 23,468 2,107 4,120
Total assets 1,156,644 1,168,658 1,143,266 1,150,095
Liabilities
Due to other financial institutions 31 - 25 - 25
Deposits from customers 32 857,885 861,044 857,885 861,044
Lease liabilities 27 2,645 - 2,645 - Borrowings from local and foreign
institutions 33 100,920 137,694 100,920 137,694
Current tax liability 34 819 365 819 365
Accruals and other liabilities 35 97,945 97,076 97,997 97,994
Retirement benefit obligation 36 11 11 11 11 1,060,225 1,096,215 1,060,277 1,097,133
Liabilities classified as held for sale 30 9,529 13,686 - -
Total liabilities 1,069,754 1,109,901 1,060,277 1,097,133
Equity
Share capital 37a 25,000 25,000 25,000 25,000
Share premium 37b 873,450 873,450 873,450 873,450
Retained earnings 3,467 (26,004) 4,395 (26,215)
Reorganisation reserve 37e (848,017) (848,017) (848,017) (848,017)
Other reserves 37c 31,796 32,767 28,161 28,744
85,696 57,196 82,989 52,962
Non-controlling interest 37d 1,194 1,561 - -
Total equity 86,890 58,757 82,989 52,962
Total equity and liabilities 1,156,644 1,168,658 1,143,266 1,150,095
Mr Muhammad K. Ahmad, OON Mr Adetokunbo. M. Abiru Mr Pius Olaoye
Chairman Managing Director / CEOFRC NO: 2017/IODN/0000002581
The accompanying notes form an integral part of these financial statements
Chief Financial Officer FRC No: 2016/ICAN/00000014239 FRC No: 2017/ICAN/00000016556
The financial statements were approved and authorised for issue by the Board of Directors on 13 February 2020 and
signed on its behalf by:

Polaris Bank Limited
Consolidated and separate financial statements
Statement of changes in equity
For the year ended 31 December 2019
(All amounts in millions of Naira unless otherwise stated)
Group
Share Share Statutory Regulatory Translation Fair Value Retained Reorganisation
Intervention
fundNon-
controlling Total
capital premium reserve reserve reserve Reserve Earnings reserve reserve Total interest Equity
At 01 January 2019 25,000 873,450 857 27,917 3,895 98 (26,004) (848,017) - 57,196 1,561 58,757
Profit for the period - - - - - - 26,211 26,211 79 26,290
Other comprehensive income,
net of tax
Translation reserve - - - - (388) - - - (388) - (388)
Net gains on investments in equity
instruments designated at FVTOCI - - - - - 2,677 - - - 2,677 - 2,677
Total other comprehensive
income - - - - (388) 2,677 - - - 2,289 - 2,289
Total comprehensive income - - - - (388) 2,677 26,211 - - 28,500 79 28,579
Transactions with owners
Elimination of non-controlling
interest at disposal of subsidiary - - - - - - - - - (446) (446)
Transfers for the period - - 9,573 (27,917) - 3,260 - 15,085 - - -
Total transactions with owners- - 9,573 (27,917) - - 3,260 - 15,085 - (446) (446)
Balance at 31 December 201925,000 873,450 10,430 - 3,507 2,775 3,467 (848,017) 15,085 85,697 1,194 86,890
Attributable to equity holders of the parent
36

Polaris Bank Limited
Consolidated and separate financial statements
Statement of changes in equity
For the year ended 31 December 2019
(All amounts in millions of Naira unless otherwise stated)
Group
Share Share Statutory Regulatory Translation Fair Value
Accumulate
d ReorganisationNon-
controlling Total
capital premium reserve reserve reserve Reserve loss reserve Total interest Equity
At 21 September 2018 - - - - 1,952 - (86) (848,017) (846,151) 1,538 (844,613)
Profit for the period - - - - - - 2,856 2,856 (79) 2,777
Other comprehensive income,
net of tax
Translation reserve - - - - 1,943 - - 1,943 102 2,045
Net gains on investments in equity
instruments designated at FVTOCI - - - - - 98 - - 98 - 98
Total other comprehensive
income - - - - 1,943 98 - - 2,041 102 2,143
Total comprehensive income - - - - 1,943 98 2,856 - 4,897 23 4,920
Transactions with owners
Issue of shares to AMCON 25,000 873,450 - - - - 898,450 898,450
Transfers for the period - - 857 27,917 - (28,774) - - - -
Total transactions with owners25,000 873,450 857 27,917 - - (28,774) - 898,450 - 898,450
Balance at 31 December 201825,000 873,450 857 27,917 3,895 98 (26,004) (848,017) 57,196 1,561 58,757
Attributable to equity holders of the parent
37

Polaris Bank Limited
Consolidated and separate financial statements
Statement of changes in equity
For the year ended 31 December 2019
(All amounts in millions of Naira unless otherwise stated)
Bank
Share Share Statutory Regulatory Fair value Retained Reorganisation
Intervention
fund
capital premium reserve reserve reserve earnings reserve reserve Total
At 01 January 2019 25,000 873,450 729 27,917 98 (26,215) (848,017) - 52,962
Profit for the period - - - - - 27,350 - - 27,350
Other comprehensive income/(loss), net of tax:
Net gains on investments in equity instruments
designated at FVTOCI - - - - 2,677 - - - 2,677
Total other comprehensive income/(loss) - - - - 2,677 - - - 2,677
Total comprehensive income - - - - 2,677 27,350 - - 30,027
Transactions with owners
Transfers for the period - - 9,573 (27,917) - 3,260 - 15,085 -
Total transactions with Owners - - 9,573 (27,917) - 3,260 15,085 -
Balance at 31 December 2019 25,000 873,450 10,302 - 2,775 4,395 (848,017) 15,085 82,989
Attributable to equity holders
38

Polaris Bank Limited
Consolidated and separate financial statements
Statement of changes in equity
For the year ended 31 December 2019
(All amounts in millions of Naira unless otherwise stated)
Bank
Share Share Statutory Regulatory Fair value Accumulated Reorganisation
capital premium reserve reserve reserve loss reserve Total
At 21 September 2018 - - - - - (848,017) (848,017)
Profit for the period - - - - - 2,431 2,431
Other comprehensive income/(loss), net of tax:
Net gains on investments in equity instruments
designated at FVTOCI - - - - 98 - 98
Total other comprehensive income/(loss) - - - - 98 - 98
Total comprehensive income - - - - 98 2,431 2,529
Transactions with owners
Issue of shares to AMCON 25,000 873,450 - - - 898,450
Transfers for the period 729 27,917 (28,646) -
Total transactions with Owners 25,000 873,450 729 27,917 - (28,646) 898,450
Balance at 31 December 2018 25,000 873,450 729 27,917 98 (26,215) (848,017) 52,962
Attributable to equity holders
39

Polaris Bank Limited
Consolidated and separate financial statements
Statement of Cash flows
For the year ended 31 December 2019
(All amounts in millions of Naira unless otherwise stated)
Group Group Bank Bank31 December 31 December 31 December 31 December
2019 2018 2019 2018
Operating activities Note
Net cash used in operating activities 38 (68,722) 19,899 (68,722) 19,899
Investing activities
Acquisition of investment securities (715,493) (487,816) (715,493) (487,816)
Interest received on investment securities 73,659 281 73,659 281
Dividend received 484 196 484 196
Acquisition of property and equipment (9,649) (503) (9,649) (503)
Proceeds from the sale of property and equipment 252 302 252 302
Acquisition of intangible assets (127) (9) (127) (9)
Net proceeds from disposal of subsidiaries 2,363 - 2,363
Payment for Right of Use asset (554) - (554) -
Proceeds from disposed and matured investment
securities
750,764 90,411 750,764 90,411
Net cash used in investing activities 101,699 (397,138) 101,699 (397,138)
Cash flows from financing activities
Interest paid on interest bearing borrowings (5,049) (3,418) (5,049) (3,418)
Proceeds from shares issued - 898,450 - 898,450
Repayment of interest bearing borrowings (37,598) (516,094) (37,598) (516,094)
Net cash provided by financing activities (42,647) 378,938 (42,647) 378,938
Net decrease in cash and cash equivalents (9,670) 1,700 (9,670) 1,700
Opening cash and cash equivalents 96,992 93,682 96,992 93,682
Effect of exchange rate fluctuations on cash held 1,238 1,610 1,238 1,610
Net decrease in cash and cash equivalents (9,670) 1,700 (9,670) 1,700
Cash and cash equivalents at
31 December
18.1 88,560 96,992 88,560 96,992
40

Polaris Bank Limited
Consolidated and separate financial statements
Notes to the financial statements
For the year ended 31 December 2019
(All amounts in millions of Naira unless otherwise stated)
1
2
2.1
2.2
2.2(a)
The following standards and interpretations apply for the first time to financial reporting periods
commencing on or after 1 January 2019:
New and amended standards and interpretations
IFRS 16 Leases
The Bank had to change its accounting policies as a result of adopting IFRS 16. The Bank elected to adopt the new rules retrospectively
but recognised the cumulative effect of initially applying the new standard on 1 January 2019. This note is disclosed in note 26.
Leases- Accounting policy from 1 January 2019:
The Bank leases several assets including buildings. Lease terms are negotiated on an individual basis and contain different terms and
conditions, including extension options. The lease period ranges from 1 year to 40 years. The lease agreements do not impose any
covenants, however, leased assets may not be used as security for borrowing purposes. Contracts may contain both lease and non-
lease components. The bank has elected not to separate lease and non lease components and instead accounts for these as a single
lease component. From 1 January 2019, leases are recognised as a right-of-use asset and a corresponding liability at the date at which
the leased asset is available for use by the Bank. Assets and liabilities arising from lease are initially measured on a present value basis.
Reporting entity
Summary of significant accounting policies
Statement of compliance
The consolidated and separate financial statements of the Bank and the Group for the year ended 31 December 2019 have been
prepared in accordance with International Financial Reporting Standards (IFRS) as issued by the International Accounting Standards
Board (IASB), and the interpretations of these standards, issued by the International Financial Reporting Interpretations Committee
(IFRIC).
Basis of preparation
Polaris Bank Limited commenced banking operations on September 21, 2018 after it took over and assumed ownership of assets and
liabilities of Skye Bank Plc. The Bank was issued operating license by the Central Bank of Nigeria (CBN) whilst the operating license of
Skye Bank was revoked by the Central Bank of Nigeria. The address of the Bank's registered office is 3 Akin Adesola Street, Victoria
Island, Lagos.
The accompanying financial statements comprise the financial statements of Polaris Bank Limited (referred to as the "Bank" or "the
Parent") and its subsidiaries (referred to together as "the Group"). The Bank is a company incorporated in Nigeria under the Companies
and Allied Matters Act.
These consolidated and separate financial statements for the year ended 31 December 2019, are prepared for the Bank and the Group
respectively. The Bank and the Group are primarily involved in wholesale, corporate and retail banking and mortgage financing.
These financial statements were authorised for issue by the Board of Directors on 13 February 2020.
The principal accounting policies adopted in the preparation of these consolidated and separate financial statements are set out below.
These policies are applicable to both the Bank and Group financial statements and have been consistently applied.
These financial statements comprise the statement of comprehensive income, the statement of financial position, the statement of
changes in equity, the statement of cash flow and the notes.
The preparation of financial statements in conformity with IFRS requires the use of certain critical accounting estimates. It also requires
management to exercise its judgment in the process of applying the Group’s accounting policies. Changes in assumptions may have a
significant impact on the financial statements in the period the assumptions changed. Management believes that the underlying
assumptions are appropriate and that the Group’s financial statements therefore present the financial position and results fairly. The
areas involving a higher degree of judgment or complexity, or areas where assumptions and estimates are significant to the
consolidated financial statements, are disclosed in Note 6.
Basis of measurement
These financial statements have been prepared in accordance with the going concern principle under the historical cost convention
except for the following:
-Derivative financial instruments which are measured at fair value.
-Non derivative financial instruments, carried at fair value through profit or loss, are measured at fair value.
-Fair value through other comprehensive income (FVOCI), financial assets are measured at fair value through equity.
-Assets and liabilities held for trading are measured at fair value.
-Assets and liabilities held for principal and interest payments are measured at amortised cost.
41

Polaris Bank Limited
Consolidated and separate financial statements
Notes to the financial statements
For the year ended 31 December 2019
(All amounts in millions of Naira unless otherwise stated)
Impact of adoption
As 31 December
2018
Reclassification Remeasurement As at 1 January
2019Right of Use Asset - 1,103 1,443 2,546 Prepaid Rent 1,103 (1,103) - -
Lease payments to be made under reasonably certain extension options are also included in the measurement of the liability. The
variable lease payments do not depend on an index or a rate are recognised as expense in the period in which the event or condition
that triggers the payment occurs.
The lease payments are discounted using the interest rate implicit in the lease. If that rate cannot be readily determined, the Bank's
incremental borrowing rate is used, being the rate that the Bank would have to pay to borrow the funds necessary to obtain an asset of
similar value to the right use asset in a similar economic environment with similar terms, security and conditions.
Lease payments are allocated between principal and finance cost. The finance cost is charged to profit or loss over the lease period so
as to produce a constant periodic rate of interest on the remaining balance of the liability for each period. After the commencement
date, the amount of lease liabilities is increased to reflct the accretion of interest and reduced for the lease payments made. In addition,
the carrying amount of lease liabilities is remeasured if there is a modification, a change in the lease term, a change in the in-substance
fixed lease payments or a change in the assessment to purchase the underlying asset. The lease term refers to the contractual period of
a lease.
Right of use assets
Right of use assets are measured at cost comprising the following:
- the amount of the initial measurement of lease liability
- any lease payments made at or before the commencement date less any lease incentives received
- any initial direct costs, and
- restoration costs.
Right of use assets are generally depreciated over the shorter of the asset's useful life and the lease term on a straight-line basis. If the
Bank is reasonably certain to exercise a purchase option, the right-of-use asset is depreciated over the underlying assets's useful life.
Short-term leases and leases of low value
The Bank did not apply the short-term lease recognition exemption to its short-term leases (i.e., those leases that have a lease term of
12 months or less from the commencement date and do not contain a purchase option). It also did not apply the lease of low-value
assets recognition exemption to leases that are considered of low value (i.e low value assets). Low-value assets are assets with lease
amount of less than $5,000 when new. Lease payments on short -term leases and leases of low-value assets are recognised as expense
in profit or loss on a straight-line basis over the lease term.
Interpretation 23 Uncertainty over Income Tax Treatments
The interpretation explains how to recognise and measure deferred and current income tax assets and liabilities where there is
uncertainty over a tax treatment.
In particular, it discusses:
a. how to determine the appropriate unit of account, and that each uncertain tax treatment should be considered separately or together
as a group, depending on which approach better predicts theresolution of the uncertainty
b. that the entity should assume a tax authority will examine the uncertain tax treatments and have full knowledge of all related
information, i. e that detection risk should be ignored
c.that the entity should reflect the effect of the uncertainty in its income tax accounting when it is not probable that the tax
authorities will accept the treatment
Lease Liabilities
At the commencement date of a lease, the Bank recognises lease liabilities measured at the present value of lease payments to be
made over the lease term. Lease liabilities include the net present value of the following lease payments:
- fixed payments (including in-substance fixed payments), less any lease incentives receivable
- variable lease payment that are based on an index or a rate
- amounts expected to be payable by the Bank under residual value guarantees
- the exercise price of a purchase option if the lessee is reasonably certain to exercise that option and
- payments of penalties for terminating the lease, if the lease term reflects the Bank exercising that option.
Amendments to IAS 19
This amendment was issued 7 february 2018 and became effective 1 January 2019. It prescribes the accounting for all types of
employee benefits except share based payment, to which IFRS 2 applies. Employee benefits are all forms of consideration given by an
entity in exchange for service rendered by employees or for the termination of employment. IAS 19 requires an entity to recognise:
> a liability when an employee has provided service in exchange for employee benefits to be paid in the future; and
> an expense when the entity consumes the economic benefit arising from the service provided by an employee in exchange for
employee benefits.
The amendments clarify that:
> On amendment, curtailment or settlement of a defined benefit plan, a company now uses updated actuarial assumptions to determine
its current service cost and net interest for the period; and the effect of the asset ceiling is disregarded when calculating the gain or loss
on any settlement of the plan and is dealt with separately in other comprehensive income (OCI).
42

Polaris Bank Limited
Consolidated and separate financial statements
Notes to the financial statements
For the year ended 31 December 2019
(All amounts in millions of Naira unless otherwise stated)
2.2.1
2.2.2
2.3
(a)
(b)
Translation differences on non-monetary assets and liabilities such as equities held at fair value through profit or loss are recognised in
profit or loss as part of the fair value gain or loss. Translation differences on non-monetary financial assets measured at fair value, such
as equities classified as fair value through OCI, are included in other comprehensive income.
Items included in the consolidated financial statements of each of the Group's entities are measured using the currency of the primary
economic environment in which the entity operates (the “functional currency”). The consolidated financial statements are presented in
Nigerian Naira (“N”), which is the Group’s presentation currency.
Transactions and balances
Accounting policies
The Group has adopted all the relevant standards applicable from the date of its incorporation.
Functional and presentation currency
New standards and interpretations not yet adopted
Certain new accounting standards and interpretation have been published that are not mandatory for 31 December 2019 and have not
been early adopted by the Group.
IFRS 17 – Insurance Contracts
IFRS 17 was issued in May 2017 and applies to annual reporting periods beginning on or after 1 January 2021. The new IFRS 17
standard establishes the principles for the recognition, measurement, presentation and disclosure of insurance contracts within the
scope of the Standard. The objective of IFRS 17 is to ensure an entity provides relevant information that faithfully represents those
contracts. This information gives a basis for users of financial statements to assess the effect that insurance contracts have on the
entity's financial position, financial performance and cashflows. This standard does not impact the Group in anyway as the Bank and its
subsidiary companies do not engage in insurance business.
Definition of Material –Amendments to IAS 1 and IAS 8
The IASB has made amendments to IAS 1 Presentation of Financial Statements and IAS 8 Accounting Policies, Changes in Accounting
Estimates and Errors which use a consistent definition of materiality throughout International Financial Reporting Standards and the
Conceptual Framework for Financial Reporting, clarify when information is material and incorporate some of the guidance in IAS 1 about
immaterial information
Definition of a Business – Amendments to IFRS 3
The amended definition of a business requires an acquisition to include an input and a substantive process that together significantly
contribute to the ability to create outputs. The definition of the term ‘outputs’ is amended to focus on goods and services provided to
customers, generating investment income and other income, and it excludes returns in the form of lower costs and other economic
Changes in the fair value of monetary securities denominated in foreign currency measured at fair value through OCI are analysed
between translation differences resulting from changes in the amortised cost of the security and other changes in the carrying amount
of the security. Translation differences related to changes in amortised cost are recognised in profit or loss, and other changes in
carrying amount are recognised in other comprehensive income.
Prepayment Features with Negative Compensation – Amendments to IFRS 9
The narrow-scope amendments made to IFRS 9 Financial Instruments in October 2017 enable entities to measure certain prepayable
financial assets with negative compensation at amortised cost. These assets, which include some loan and debt securities, would
otherwise have to be measured at fair value through profit or loss. To qualify for amortised cost measurement, the negative
compensation must be ‘reasonable compensation for early termination of the contract’
and the asset must be held within a ‘held to collect’ business model.
Foreign currency transactions, that is transactions denominated or that require settlement in a foreign currency, are translated into the
functional currency using the exchange rates prevailing at the dates of the transactions. Monetary items denominated in foreign
currency are translated using the closing rate as at the reporting date. Non-monetary items measured at historical cost denominated in
a foreign currency are translated with the exchange rate as at the date of initial recognition; non-monetary items in a foreign currency
that are measured at fair value are translated using the exchange rates at the date when the fair value was determined.
Foreign exchange gains and losses resulting from the settlement of foreign currency transactions and from the year end translation of
monetary assets and liabilities denominated in foreign currencies are recognised in the Statement of Comprehensive Income, except
when deferred in other comprehensive income as qualifying cash flow hedging instruments and qualifying net investment hedging
instruments.
All foreign exchange gains and losses recognised in the income statement are presented net in the Income Statement. Foreign
exchange gains and losses on other comprehensive income items are presented in other comprehensive income within the
Except where indicated, financial information presented in Naira has been rounded to the nearest million.
Foreign currency translation
43

Polaris Bank Limited
Consolidated and separate financial statements
Notes to the financial statements
For the year ended 31 December 2019
(All amounts in millions of Naira unless otherwise stated)
(c)
2.4
Subsidiaries
The Group applies the acquisition method to account for business combinations. The consideration transferred for the acquisition of a
subsidiary is the fair value of the assets transferred, the liabilities incurred to the former owners of the acquiree and the equity interests
issued by the Group. The consideration transferred includes the fair value of any asset or liability resulting from a contingent
consideration arrangement. Identifiable assets acquired and liabilities and contingent liabilities assumed in a business combination are
measured initially at their fair values at the acquisition date. The Group recognises any non-controlling interest in the acquiree on an
acquisition-by-acquisition basis, either at fair value or at the non-controlling interest’s proportionate share of the recognised amounts of
acquiree’s identifiable net assets. Investment in subsidiaries are reported at cost less impairment (if any) in the separate financial
statements of the Bank.
Changes in ownership interests in subsidiaries without change of control
The results and financial position of all the Group entities (none of which has the currency of a hyper-inflationary economy) that have a
functional currency different from the presentation currency are translated into the presentation currency as follows:
• assets and liabilities for each statement of financial position presented are translated at the closing rate at the date of that
statement of financial position;
• income and expenses for each income statement are translated at average exchange rates (unless this average is not a reasonable
approximation of the cumulative effect of the rates prevailing on the transaction dates, in which case income and expenses are
translated at the dates of the transactions); and
• all resulting exchange differences are recognised in other comprehensive income.
Exchange differences arising from the above process are reported in shareholders' equity as 'Foreign currency translation reserve'.
On consolidation, exchange differences arising from the translation of the net investment in foreign entities, and of borrowings and
other currency instruments designated as hedges of such investments, are taken to 'Other comprehensive income'. When a foreign
operation is disposed of, or partially disposed of, such exchange differences are recognised in the consolidated income statement as
part of the gain or loss on sale. Goodwill and fair value adjustments arising on the acquisition of a foreign entity are treated as assets
and liabilities of the foreign entity and translated at the closing rate.
Transactions with non-controlling interests that do not result in loss of control are accounted for as equity transactions – that is, as
transactions with the owners in their capacity as owners. The difference between fair value of any consideration paid and the relevant
share acquired of the carrying value of net assets of the subsidiary is recorded in equity. Gains or losses on disposals to non-controlling
interests are also recorded in equity.
Subsidiaries are all entities (including structured entities) over which the Group has control. The Group controls an entity when the
Group is exposed to, or has rights to, variable returns from its involvement with the entity and has the ability to affect those returns
through its power over the entity. Subsidiaries are fully consolidated from the date on which control is transferred to the group. They
are deconsolidated from the date that control ceases.
Acquisition-related costs are expensed as incurred. If the business combination is achieved in stages, the acquisition date carrying value
of the acquirer’s previously held equity interest in the acquiree is re-measured to fair value at the acquisition date; any gains or losses
arising from such re-measurement are recognised in profit or loss.
Inter-company transactions, balances and unrealised gains on transactions between Group companies are eliminated. Unrealised losses
are also eliminated. When necessary, amounts reported by subsidiaries have been adjusted to conform with the Group’s accounting
policies. Accounting policies of the subsidiaries have been changed where necessary to reflect the accounting policies of the group.
Basis of consolidation
The financial statements of the subsidiaries used to prepare the consolidated financial statements were prepared as of the parent
company’s reporting date.
Group companies (foreign operations)
Any contingent consideration to be transferred by the Group is recognised at fair value at the acquisition date. Subsequent changes to
the fair value of the contingent consideration that is deemed to be an asset or liability is recognised in accordance with IFRS 9 either in
profit or loss or as a change to other comprehensive income. Contingent consideration that is classified as equity is not re-measured,
and its subsequent settlement is accounted for within equity.
44

Polaris Bank Limited
Consolidated and separate financial statements
Notes to the financial statements
For the year ended 31 December 2019
(All amounts in millions of Naira unless otherwise stated)
Capital reorganisation
2.5 Current and deferred income tax
Current income tax
Deferred income tax
Deferred income tax is provided in full, using the liability method, on temporary differences arising between the tax bases of assets and
liabilities and their carrying amounts in the consolidated financial statements. However, deferred tax liabilities are not recognised if they
arise from the initial recognition of goodwill; deferred income tax is not accounted for if it arises from initial recognition of an asset or
liability in a transaction other than a business combination that at the time of the transaction affects neither accounting nor taxable
profit or loss. Deferred income tax is determined using tax rates (and laws) that have been enacted or substantially enacted by the end
of the reporting period and are expected to apply when the related deferred income tax asset is realized or the deferred income tax
liability is settled.
When there is Capital reorganisation, the Group recognizes the assets and liabilities of the defunct entity in its consolidated financial
statements at their pre-combination carrying amounts. The assets and liabilities are not remeasured to fair values but are recognised at
their book values on the date of the reorganisation.
Business combinations in which all of the combining entities or businesses are ultimately controlled by the same party or parties both
before and after the business combination (and where that control is not transitory) are referred to as common control transactions.
The Group accounts for the transaction at book values in its consolidated financial statements. The book values of the acquired entity
are the consolidated book values as reflected in the group annual financial statements. The excess of the cost of the transaction over
the Group’s proportionate share of the net asset value acquired in common control transactions, will be allocated to the existing
business combination reserve in equity. Where comparative periods are presented, the financial statements and financial information
are not restated.
Deferred income tax assets are recognised on deductible temporary differences arising from investments in subsidiaries, associates and
joint arrangements only to the extent that it is probable the temporary difference will reverse in the future and there is sufficient
taxable profit available against which the temporary difference can be utilised.
The current income tax charge is calculated on the basis of the applicable tax laws in the respective jurisdiction and it consists of
Company Income Tax, Education Tax and NITDEF Tax. Company Income Tax is assessed at 30% statutory rate of total profit,
Education Tax is computed as 2% of assessable profit while NITDEF tax is a 1% levy on Profit Before Tax of the Bank. The Group
periodically evaluates positions taken in tax returns; ensuring information disclosed are in agreement with the underlying tax liability
which has been adequately provided for in the financial statements.
Deferred income tax assets and liabilities are offset when there is a legally enforceable right to offset current tax assets against current
tax liabilities and when the deferred income taxes assets and liabilities relate to taxes levied by the same taxation authority on either
the same taxable entity or different taxable entities where there is an intention to settle the balances on a net basis.
The tax expense for the period comprises current and deferred tax. Tax is recognised in the income statement, except to the extent
that it relates to items recognised in other comprehensive income or directly in equity. In this case, the tax is also recognised in other
comprehensive income or directly in equity, respectively.
Deferred income tax assets are recognised only to the extent that it is probable that future taxable profit will be available against which
the temporary differences can be utilised. Deferred income tax liabilities are provided on taxable temporary differences arising from
investments in subsidiaries, associates and joint arrangements, except for deferred income tax liability where the timing of the reversal
of the temporary difference is controlled by the Group and it is probable that the temporary difference will not reverse in the
foreseeable future.
Disposal of subsidiaries
When the Group ceases to have control, any retained interest in the entity is remeasured to its fair value at the date when control is
lost, with the change in carrying amount recognised in profit or loss. The fair value is the initial carrying amount for the purposes of
subsequently accounting for the retained interest as an associate, joint venture or financial asset. In addition, any amounts previously
recognised in other comprehensive income in respect of that entity are accounted for as if the Group had directly disposed of the
related assets or liabilities. This may mean that amounts previously recognised in other comprehensive income are reclassified to profit
or loss.
Common control transactions
45

Polaris Bank Limited
Consolidated and separate financial statements
Notes to the financial statements
For the year ended 31 December 2019
(All amounts in millions of Naira unless otherwise stated)
2.6 Financial assets and liabilities
2.6.1 Financial assets
(a) Debt instruments
The Group classifies its financial instruments in the following categories: at fair value through profit or loss (FVTPL), amortised costs
and fair value through other comprehensive income (FVOCI). The Group's financial assets classified as amortised cost includes loans
and advances to customers; other loans and receivables; and investment securities. The classification depends on the purpose for which
the financial assets were acquired and their characteristics.
Initial recognition and measurement
Financial assets and financial liabilities are recognised when the entity becomes a party to the contractual provisions of the instrument.
Regular way purchases and sales of financial assets are recognised on settlement-date on which the Group commits to purchase or sell
the asset. At initial recognition, the group measures a financial asset at its fair value plus, in the case of a financial asset not at fair
value through profit or loss (FVPL), transaction costs that are directly attributable to the acquisition of the financial asset. Transaction
costs of financial assets carried at FVPL are expensed in profit or loss.
Business model: the business model reflects how the Group manages the assets in order to generate cash flows. That is, whether the
Group's objective is solely to collect the contractual cash flows from the assets or is to collect both the contractual cash flows and cash
flows arising from the sale of assets. If neither of these is applicable (e.g. financial assets are held for trading purposes), then the
financial assets are classified as part of 'other' business model and measured at FVTPL. Factors considered by the Group in determining
the business for a group of assets include past experience on how the cash flows for these assets were collected, how the assets
performance is evaluated and reported to key management personnel, how risks are assessed and managed and how managers are
compensated. For example, the Group's business model for the mortgage loan book is to hold to collect contractual cash flows.
Debt instruments are those instruments that meet the definition of a financial liability from the issuer's perspective, such as loans,
government and corporate bonds and trade receivables purchased from clients in factoring arrangements without recourse. Debt
investment securities
Classification and subsequent measurement of debt instruments depend on:
(i) the Group's business model for managing the asset; and
(ii) the Cash flow characteristics of the asset.
Based on these factors, the Group classifies its debt instruments into one of the following three measurement categories:
Amortised cost: Assets that are held for collection of contractual cash flows where those cash flows represent solely payments of
principal and interest (SPPI), and that are not designated at FVTPL, are measured at amortised cost. The carrying amount of these
assets is adjusted by any expected credit loss allowance recognised and measured as described in note 2.6.1 (f). Interest income from
these financial assets is included in 'interest income' using the effective interest rate method.
Fair value through other comprehensive income (FVOCI): Financial assets that are held for collection of contractual cash flows
and for selling the assets, where the assets' cash flows represent solely payments of principal and interest, and that are not designated
at FVTPL, are measured at fair value. Movements in the carrying amount are taken through OCI, except for the recognition of
impairment gains or losses, interest revenue and foreign exchange gains and losses on the instrument's amortised cost which are
recognised in profit or loss.
Fair value through profit or loss: Assets that do not meet the criteria for amortised cost or FVOCI are measured at fair value
through profit or loss. A gain or loss on a debt investment that is subsequently measured at fair value through profit or loss and is not
part of a hedging relationship is recognised in profit or loss and presented in the profit or loss statement within 'Net trading income and
foreign exchange income' in the period in which it arises.
SPPI: Where the business model is to hold assets to collect contractual cash flows or to collect contractual cash flows and sell, the
Group assesses whether the financial instruments' cash flows represent solely payments of principal and interest (the 'SPPI test'). In
making this assessment, the Group considers whether the contractual cash flows are consistent with a basic lending arrangement i.e.
interest includes only consideration for the time value of money, credit risk, other basic lending risks and a profit margin that is
consistent with a basic lending arrangement. Where the contractual terms introduce exposure to risk or volatility that are inconsistent
with a basic lending arrangement, the related financial asset is classified and measured at fair value through profit or loss.
The Group reclassifies debt investments when and only when its business model for managing those assets changes. The reclassification
takes place from the start of the first reporting period following the change. Such changes are expected to be very infrequent and none
occurred during the period.
46

Polaris Bank Limited
Consolidated and separate financial statements
Notes to the financial statements
For the year ended 31 December 2019
(All amounts in millions of Naira unless otherwise stated)
(b)
( c)
(d) Modification of loans
• Significant change in the interest rate.
• Change in the currency the loan is denominated in.
(e ) Derecognition other than on a modification
Impairment
The Group assesses on a forward - looking basis the expected credit losses ('ECL') associated with its debt instruments carried at
amortised cost and FVOCI and with the exposure arising from loan commitments and financial guarantee contracts. The Group
recognises a loss allowance for such losses at each reporting date. The measurement of ECL reflects:
• An unbiased and probability-weighted amount that is determined by evaluating a range of possible outcomes;
• The time value of money; and
• Reasonable and supportable information that is available without undue cost or effort at the reporting date about past events, current
conditions and forecasts of future economic conditions.
• If the borrower is in financial difficulty, whether the modification merely reduces the contractual cash flows to the amounts the
borrower is expected to be able to pay
Equity Instruments
Equity instruments are instruments that meet the definition of equity from the issuer's perspective; that is, instruments that do not
contain a contractual obligation to pay and that evidence a residual interest in the issuer's net assets. Examples of equity instruments
include basic ordinary shares.
The Group subsequently measures all equity investments at fair value through profit or loss, except where the Group's management
has elected, at initial recognition, to irrevocably designate an equity investment at fair value through other comprehensive income.
When this is election is used, fair value gains and losses are recognised in OCI and are not subsequently reclassified to profit or loss,
including on disposal. Impairment losses (and reversal of impairment losses) are not reported separately from other changes in fair
value. Dividends, when representing a return on such investments, continue to be recognised in profit or loss as other income when the
Group's right to receive payment is established.
Gains and losses on equity investments at FVTPL are included in the 'Net trading income' line in the statement of comprehensive
income.
• Whether any substantial new terms are introduced, such as a profit share/equity based return that substantially affects the risk profile
of the loan.
The Group sometimes renegotiates or otherwise modifies the contractual cash flows of loans to customers. When this happens, the
Group assesses whether or not the new terms are substantially different to the original terms. The Group does this by considering,
among others, the following factors:
• Significant extension of the loan term when the borrower is not in financial difficulty.
• Insertion of collateral, other security or credit enhancements that significantly affect the credit risk associated with the loan.
If the terms are substantially different, the Group derecognises the original financial asset and recognises a 'new' asset at fair value and
recalculates a new effective interest rate for the asset. The date of renegotiation is consequently considered to be the date of initial
recognition for impairment calculation purposes, including for the purpose of determining whether a significant increase in credit risk
has occurred. However, the Group also assesses whether the new financial asset recognised is deemed to be credit-impaired at initial
recognition, especially in circumstances where the renegotiation was driven by the debtor being unable to make the originally agreed
payments. Differences in the carrying amount are also recognised in profit or loss as a gain or loss on derecogntion.
If the terms are not substantially different, the renegotiation or modification does not result in derecognition, and the Group
recalculates the gross carrying amount based on the revised cash flows of the financial asset and recognises a modification gain or loss
in profit or loss. The new gross carrying amount is recalculated by discounting the modified cash flows at the original effective interest
rate (or credit-adjusted effective interest rate for purchased or originated credit-impaired financial assets).
Financial assets, or a portion thereof, are derecognised when the contractual rights to receive the cash flows from the assets have
expired, or when they have been transferred and either (i) the Group transfers substantially all the risks and rewards of ownership, or
(ii) the Group neither transfers nor retains substantially all the risks and rewards of ownership and the Group has not retained control.
The Group enters into transactions where it retains the contractual rights to receive cash flows from assets but assumes a contractual
obligation to pay those cash flows to other entities and transfers substantially all of the risks and rewards. These transactions are
accounted for as 'pass through' transfers that result in derecognition if the Group:
(i) Has no obligation to make payments unless it collects equivalent amounts from the assets;
(ii) Is prohibited from selling or pledging the assets; and
(iii) Has an obligation to remit any cash it collects from the assets without material delay.
47

Polaris Bank Limited
Consolidated and separate financial statements
Notes to the financial statements
For the year ended 31 December 2019
(All amounts in millions of Naira unless otherwise stated)
(f)
Stage 1
(Initial recognition)
12-Month expected credit losses
(g)
The key judgements and assumptions adopted by the Group in addressing the requirements of the standard are discussed below:
Expected credit loss (ECL) measurement
IFRS 9 outlines a 'three-stage' model for impairment based on changes in credit quality since initial recognition as summarised below:
• A financial instrument that is not credit-impaired on initial recognition is classified in 'Stage 1' and has its credit risk continuously
monitored by the Group.
• If a significant increase in credit risk ('SICR') since initial recognition is identified, the financial instruments is moved to 'Stage 2' but is
not yet deemed to be credit- impaired. Please refer to note 2.6.1 g for a description of how the Group determines when a significant
increase in credit risk has occurred.
• If the financial instrument is credit-impaired, the financial instrument is then moved to 'Stage 3'. Please refer to note 2.6.1 i for a
description of how the Group defines credit-impaired and default.
• Financial instruments in Stage 1 have their ECL measured at an amount equal to the portion of lifetime expected credit losses that
result from default events possible within the next 12 months. Instruments in stages 2 or 3 have their ECL measured based on
expected credit losses on a lifetime basis. Please refer to note 2.6.1 j for a description of inputs, assumptions and estimation techniques
used in measuring the ECL.
• A pervasive concept in measuring ECL in accordance with IFRS 9 is that it should consider forward-looking information. Note 2.6.1 j
includes an explanation of how the Group has incorporated this in its ECL models.
• Purchased or originated credit-impaired financial assets are those financial assets that are credit-impaired on initial recognition. Their
ECL is always measured on a lifetime basis (Stage 3).
Stage 2 Stage 3
Lifetime expected credit losses
(Credit-impaired assets)
Lifetime expected credit losses
Collateral (shares and bonds) furnished by the Group under standard repurchase agreements and securities lending and borrowing
transactions are not derecognised because the Group retains substantially all the risks and rewards on the basis of the predetermined
repurchase price, and the criteria for derecognition are therefore not met.
(Significant increase in credit risk since
initial recognition)
Change in credit quality since initial recognition
Significant increase in credit risk (SICR)
The Group considers a financial instrument to have experienced a significant increase in credit risk when one or more of the following
quantitative, qualitative or backstop criteria have been met. At each reporting period, the Bank assesses whether there has been a
significant increase in credit risk for exposures since initial recognition by comparing the risk of default occurring over the remaining
expected life from the reporting date and the date of origination. The assessment considers borrower-specific quantitative information
without consideration of collateral, and the impact of forward-looking macroeconomic factors.
Quantitative criteria:
The quantitative criteria considers deterioration in the credit rating of the obligor/counterparty based on facilities with days past due of
above 30 days, these facilities are considered to have significant increase in credit risk by the Group. The Bank has also adopted the
CBN Risk Management Guidelines in determining its significant increase in credit risk criteria.
Qualitative Criteria
The occurrence of any of the under listed indicators in the Bank's Portfolio shall be considered as a significant increase in credit risk:
• Actual or expected significant change in the financial instrument's external credit rating.
• Actual or expected or for retail portfolios, if the borrower meets one or more of the following criteria.
• Identification of the loan or customer on a 'watchlist' or other forbearance indicators.
• Significant financial difficulty of a borrower or issuer.
• Classification of an exposure by a licensed credit risk management, including credit bureaus.
• Deterioration of relevant credit risk drivers for an individual obligor or pool of obligors.
• Expectation of forbearance or restructuring due to financial difficulties.
• Significant increases in credit risk on other financial instruments of the same borrower.
Deterioration in credit worthiness due factors other than those listed above
48

Polaris Bank Limited
Consolidated and separate financial statements
Notes to the financial statements
For the year ended 31 December 2019
(All amounts in millions of Naira unless otherwise stated)
(h)
(i)
(j)
Low Credit risk exemption
The Group has not used the low credit risk exemption for any financial instruments apart from Debt investment securities (FGN treasury
bills and bonds) and balances due from other banks in the period ended 31 December 2019.
Definition of default and credit-impaired assets
The Group defines a financial instrument as in default, which is fully aligned with the definition of credit-impaired, when it meets one or
more of the following criteria:
Quantitative criteria
The borrower is more than 90 days past due on its contractual payments.
Qualitative criteria
The borrower meets unlikeliness to pay criteria, which indicates the borrower is in significant financial difficulty. These are instances
where:
• The borrower is in long-term forbearance
• The borrower is deceased
• The borrower is insolvent
• The borrower is in branch of financial covenant(s)
• An active market for that financial asset has disappeared because of financial difficulties
• Concessions have been made by the lender relating to the borrower's financial difficulty
• It is becoming probable that the borrower will enter bankruptcy
• Financial assets are purchased or originated at a deep discount that reflects the incurred credit losses.
Measuring ECL - Explanation of inputs, assumptions and estimation techniques
The Expected Credit Loss (ECL) is measured on either a 12-month (12M) or Lifetime basis depending on whether a significant increase
in credit risk has occurred since initial recognition or whether an asset is considered to be credit-impaired. Expected credit losses are
the discounted product of the Probability of Default (PD), Exposure at Default (EAD), and Loss Given Default (LGD), defined as follows:
• EAD is based on the amounts the Group expects to be owed at the time of default, over the next 12 months (12M EAD) or over the
remaining lifetime (Lifetime EAD). For example, for a revolving commitment, the Group includes the current drawn balance plus any
further amount that is expected to be drawn up to the current contractual limit by the time of default, should it occur.
• Loss Given Default (LGD) represents the Group's expectation of the extent of loss on a defaulted exposure. LGD varies by type of
counterparty, type and seniority of claim and availability of collateral or other credit support. LGD is expressed as a percentage loss per
unit of exposure at the time of default (EAD). LGD is calculated on a 12-month or lifetime basis, where 12-month LGD is the percentage
of loss expected to be made if the default occurs in the next 12 months and Lifetime LGD is the percentage of loss expected to be made
if the default occurs over the remaining expected lifetime of the loan.
• The PD represents the likelihood of a borrower defaulting on its financial obligation (based on the "Definition of default and credit-
impaired" above), either over the next 12 months (12M PD), or over the remaining lifetime (Lifetime PD) of the obligation.
The ECL is determined by projecting the PD, LGD and EAD for each future month and for each individual exposure or collective
segment. These three components are multiplied together and adjusted for the likelihood of survival (i.e. the exposure has not prepaid
or defaulted in an earlier month). This effectively calculates an ECL for each future month, which is then discounted back to the
reporting date and summed. The discount rate used in the ECL calculation is the original effective interest rate.
The Lifetime PD is developed by applying a maturity profile to the current 12M PD. The maturity profile looks at how defaults develop
on a portfolio from the point of initial recognition throughout the lifetime of the loans. The maturity profile is based on historical
observed data and is assumed to be the same across all assets within a portfolio and credit grade band. This is supported by historical
analysis.
The criteria above have been applied to all financial instruments held by the Group and are consistent with the definition of default used
for internal credit risk management purposes. The default definition has been applied consistently to model the Probability of Default
(PD), Exposure at Default (EAD) and Loss given Default (LGD) throughout the Group's expected loss calculations. An instrument is
considered to no longer be in default (i.e. to have cured) when it no longer meets any of the default criteria for a consecutive period of
six months. This period of six months has been determined based on an analysis which considers the likelihood of a financial instrument
returning to default status after cure using different possible cure definitions.
49

Polaris Bank Limited
Consolidated and separate financial statements
Notes to the financial statements
For the year ended 31 December 2019
(All amounts in millions of Naira unless otherwise stated)
(k)
(l)
The 12-month and lifetime EADs are determined based on the expected payment profile, which varies by product type.
• For amortising products and bullet repayment loans, this is based on the contractual repayments owed by the borrower over a 12
month or lifetime basis. This will also be adjusted for any expected prepayments made by a borrower. Early repayment/refinance
assumptions are also incorporated into the calculation.
• For revolving products, the exposure at default is predicted by taking current drawn balance and adding a "credit conversion factor"
which allows for the expected drawdown of the remaining limit by the time of default. These assumptions vary by product type and
current limit utilisation band, based on analysis of the Group's recent default data.
To estimate expected credit loss for off balance sheet exposures, credit conversion factor (CCF) is usually computed. CCF is a modelled
assumption which represents the proportion of any undrawn exposure that is expected to be drawn prior to a default event occuring. It
is a factor that coverts an off balance sheet exposure to its credit exposure equivalent.
The 12-month and lifetime LGDs are determined based on the factors which impact the recoveries made post default. These vary by
product type.
• For secured products, this is primarily based on collateral type and projected collateral values, historical discounts to market/book
values due to forced sales, time to repossession and recovery costs observed.
• For unsecured products, LGD's are typically set at product level due to the limited differentiation in recoveries achieved across
different borrowers. These LGD's are influenced by collection strategies, including contracted debt sales and price.
Macroeconomic variables incorporated in the ECL models
The Group relies on a broad range of forward looking information as economic inputs, such as: GDP growth. The inputs and models
used for calculating expected credit losses may not always capture all characteristics of the market at the date of the financial
statements. To reflect this, qualitative adjustments or overlays may be made as temporary adjustments using expert credit judgement.
The macro-economic parameters used are the same across risk management and capital planning process. See note 3.1.3iv for
additional details.
Forward-looking information incorporated in the ECL models
The assessment of SICR and the calculation of ECL both incorporate forward-looking information. The Group has performed historical
analysis and identified the key economic variables impacting credit risk and expected credit losses for each portfolio.
These economic variables and their associated impact on the PD, EAD and LGD vary by financial instrument. Expert judgement has also
been applied in this process. Forecasts of these economic variables (the "base economic scenario") are provided by the Predictive
Analytics' team on a quarterly basis and provide the best estimate view of the economy over the next four years. The impact of these
economic variables on the PD, EAD and LGD has been determined by performing statistical analysis to understand the impact that
changes in these variables have had historically on default rates and on the components of LGD and EAD.
In addition to the base economic scenario, the Predictive Analytics' team also provide other possible scenarios along with scenario
weightings. The number of other scenarios used is set based on the analysis of each major product type to ensure non-linearieties are
captured. The number of scenarios and their attributes are reassessed at each reporting date. At the reporting period, for all portfolios,
the Group concluded that three scenarios appropriately captured non-linearities.The scenario weightings are determined by a
combination of statistical analysis and expert credit judgement, taking account of the range of possible outcomes each chosen scenario
is representative of. The assessment of SICR is performed using the Lifetime PD under each of the base, and the other scenarios,
multiplied by the associated scenario weighting, along with qualitative and backstop indicators. This determines whether the whole
financial instrument is in Stage 1, Stage 2 or Stage 3 and hence whether 12-month or lifetime ECL should be recorded. Following this
assessment, the Group measures ECL as either a probability weighted 12 month ECL (Stage 1), or a probability weighted lifetime ECL
(Stages 2 and 3). These probability-weighted ECLs are determined by running each scenario through relevant ECL model and
50
Polaris Bank Limited
Consolidated and separate financial statements
Notes to the financial statements
For the year ended 31 December 2019
(All amounts in millions of Naira unless otherwise stated)
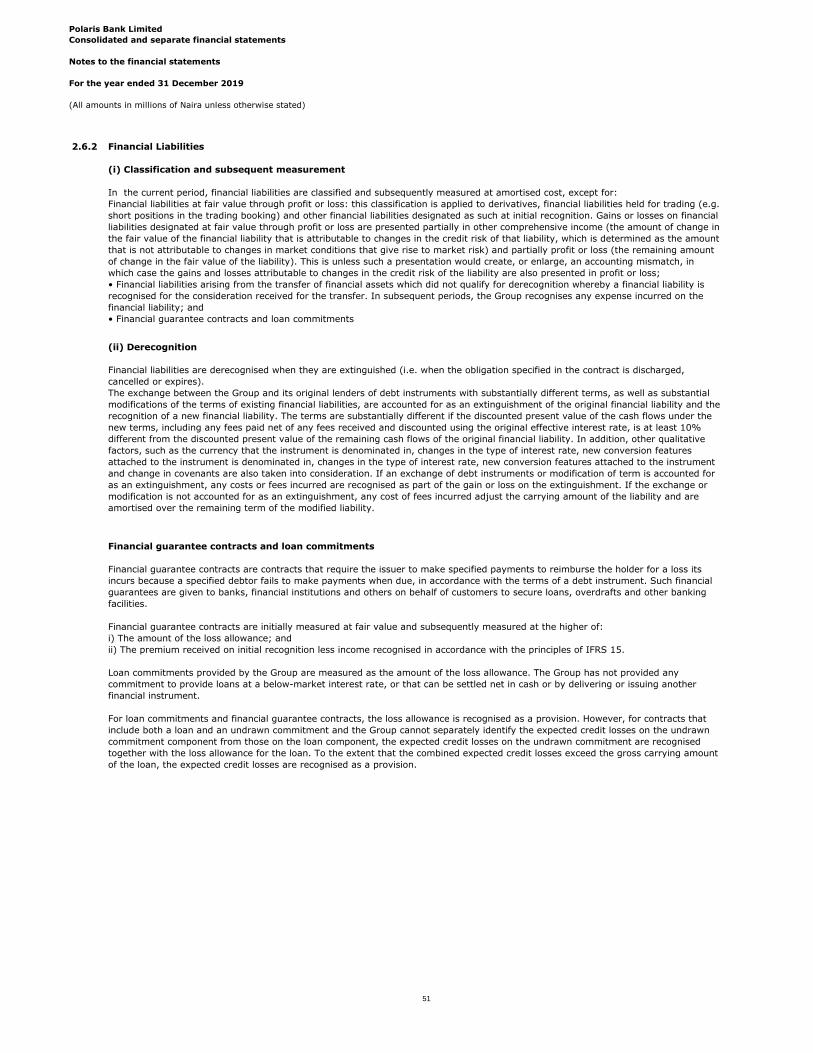
2.6.2 Financial Liabilities
(i) Classification and subsequent measurement
In the current period, financial liabilities are classified and subsequently measured at amortised cost, except for:
Financial liabilities at fair value through profit or loss: this classification is applied to derivatives, financial liabilities held for trading (e.g.
short positions in the trading booking) and other financial liabilities designated as such at initial recognition. Gains or losses on financial
liabilities designated at fair value through profit or loss are presented partially in other comprehensive income (the amount of change in
the fair value of the financial liability that is attributable to changes in the credit risk of that liability, which is determined as the amount
that is not attributable to changes in market conditions that give rise to market risk) and partially profit or loss (the remaining amount
of change in the fair value of the liability). This is unless such a presentation would create, or enlarge, an accounting mismatch, in
which case the gains and losses attributable to changes in the credit risk of the liability are also presented in profit or loss;
• Financial liabilities arising from the transfer of financial assets which did not qualify for derecognition whereby a financial liability is
recognised for the consideration received for the transfer. In subsequent periods, the Group recognises any expense incurred on the
financial liability; and
• Financial guarantee contracts and loan commitments
(ii) Derecognition
Financial liabilities are derecognised when they are extinguished (i.e. when the obligation specified in the contract is discharged,
cancelled or expires).
The exchange between the Group and its original lenders of debt instruments with substantially different terms, as well as substantial
modifications of the terms of existing financial liabilities, are accounted for as an extinguishment of the original financial liability and the
recognition of a new financial liability. The terms are substantially different if the discounted present value of the cash flows under the
new terms, including any fees paid net of any fees received and discounted using the original effective interest rate, is at least 10%
different from the discounted present value of the remaining cash flows of the original financial liability. In addition, other qualitative
factors, such as the currency that the instrument is denominated in, changes in the type of interest rate, new conversion features
attached to the instrument is denominated in, changes in the type of interest rate, new conversion features attached to the instrument
and change in covenants are also taken into consideration. If an exchange of debt instruments or modification of term is accounted for
as an extinguishment, any costs or fees incurred are recognised as part of the gain or loss on the extinguishment. If the exchange or
modification is not accounted for as an extinguishment, any cost of fees incurred adjust the carrying amount of the liability and are
amortised over the remaining term of the modified liability.
Financial guarantee contracts and loan commitments
Financial guarantee contracts are contracts that require the issuer to make specified payments to reimburse the holder for a loss its
incurs because a specified debtor fails to make payments when due, in accordance with the terms of a debt instrument. Such financial
guarantees are given to banks, financial institutions and others on behalf of customers to secure loans, overdrafts and other banking
facilities.
Financial guarantee contracts are initially measured at fair value and subsequently measured at the higher of:
i) The amount of the loss allowance; and
ii) The premium received on initial recognition less income recognised in accordance with the principles of IFRS 15.
Loan commitments provided by the Group are measured as the amount of the loss allowance. The Group has not provided any
commitment to provide loans at a below-market interest rate, or that can be settled net in cash or by delivering or issuing another
financial instrument.
For loan commitments and financial guarantee contracts, the loss allowance is recognised as a provision. However, for contracts that
include both a loan and an undrawn commitment and the Group cannot separately identify the expected credit losses on the undrawn
commitment component from those on the loan component, the expected credit losses on the undrawn commitment are recognised
together with the loss allowance for the loan. To the extent that the combined expected credit losses exceed the gross carrying amount
of the loan, the expected credit losses are recognised as a provision.
51

Polaris Bank Limited
Consolidated and separate financial statements
Notes to the financial statements
For the year ended 31 December 2019
(All amounts in millions of Naira unless otherwise stated)
2.7 Offsetting financial instruments
2.8 Assets pledged as collateral
2.9 Interest income and expense
a
2.10 Fees and commission income
2.11 Net trading and foreign exchange income
Financial assets transferred to external parties that do not qualify for de-recognition are reclassified in the statement of financial
position from investment securities to assets pledged as collateral, if the transferee has received the right to sell or re-pledge them in
the event of default from agreed terms.
Initial recognition of assets pledged as collateral is at fair value, whilst subsequent measurement is based on the classification of the
financial asset. Assets pledged as collateral are either designated as FVOCI or amortised cost. Where the assets pledged as collateral
are designated as FVOCI, subsequent measurement is at fair-value through OCI. Assets pledged as collateral are measured at
amortised cost.
a) POCI (Purchased or originated credit-impaired) financial assets, for which the original credit-adjusted effective interest rate is applied
to the amortised cost of the financial asset.
b) Financial assets that are not 'POCI' but have subsequently become credit-impaired (or stage 3), for which interest revenue is
calculated by applying the effective interest rate to their amortised cost (i.e. net of the expected credit loss provision)
The calculation of the effective interest rate includes contractual fees paid or received, transaction costs, and discounts or premiums
that re an integral part of the effective interest rate.
Transaction costs are incremental costs that are directly attributable to the acquisition, issue or disposal of a financial asset or liability.
Interest income and expense presented in the income statement include:
• Interest on financial assets and liabilities measured at amortised cost is calculated on an effective interest rate basis.
• Interest on financial assets and liabilities measured at FVTPL is calculated on an effective interest rate basis.
Net trading income and foreign exchange income comprises net fair value changes in held for trading securities, net fair value gain on
derivative instrument, and foreign exchange translation and trading gains/losses.
Fees and commission that are integral to the effective interest rate on a financial asset are included in the measurement of the effective
interest rate. Fees, such as processing and management fees charged for assessing the financial position of the borrower, evaluating
and reviewing guarantee, collateral and other security, negotiation of instruments’ terms, preparing and processing documentation and
finalising the transaction are an integral part of the effective interest rate on a financial asset or liability and are included in the
measurement of the effective interest rate of financial assets or liabilities.
Other fees and commissions which relates mainly to transaction and service fees, including loan account structuring and service fees,
investment management and other fiduciary activity fees, sales commission, placement line fees, syndication fees and guarantee
issuance fees are recognised as the related services are provided or performed.
Interest income is calculated by applying the effective interest rate to the gross carrying amount of financial assets, except for:
Interest income and expense for all interest-earning and interest bearing financial instruments are recognised in the income statement
within 'interest income' and 'interest expense' using the effective interest method. The effective interest rate is the rate that exactly
discounts the estimated future cash payments and receipts through the expected life of the financial asset or liability (or, where
appropriate, the next re-pricing date) to the carrying amount of the financial asset or liability. When calculating the effective interest
rate, the Group estimates future cash flows considering all contractual terms of the financial instruments but not future credit losses.
Financial assets and liabilities are offset and the net amount reported in the statement of financial position when the Group has a legally
enforceable right to set off the recognised amounts and there is an intention to settle on a net basis or realise the asset and settle the
liability simultaneously. The legally enforceable right must not be contingent on future events and must be enforceable in the normal
course of business and in the event of default, insolvency or bankruptcy of the counterparty.
Income and expenses are presented on a net basis only when permitted under IFRSs or for gains and losses arising from a group of
similar transactions such as in the Group's trading activity.
52

Polaris Bank Limited
Consolidated and separate financial statements
Notes to the financial statements
For the year ended 31 December 2019
(All amounts in millions of Naira unless otherwise stated)
2.12 Dividend income
2.13 Impairment of non-financial assets
2.14 Non-current assets (or disposal groups) held for sale
2.15 Leases
Any impairment loss in a disposal group is allocated first to goodwill and then to the remaining assets and liabilities on a prorata basis
except that loss is allocated to inventories, deferred tax assets, employee benefits and investment property which continue to be
measured in accordance with the group's accounting policies.
The recoverable amount of an asset or cash-generating unit is the greater of its value in use and its fair value less costs to sell. In
assessing value in use, the estimated future cash flows are discounted to their present value using a pre-tax discount rate that reflects
current market assessments of the time value of money and the risks specific to the asset.
An impairment loss is recognised in the income statement if the carrying amount of an asset or its cash generating unit exceeds its
recoverable amount. A cash generating unit is the smallest identifiable asset group that generates cash flows that largely are
independent from other assets and groups. Impairment losses recognised in respect of cash-generating units are allocated first to
reduce the carrying amount of any goodwill allocated to the units and then to reduce the carrying amount of the other assets in the unit
(group of units) on a pro rata basis.
The carrying amounts of the Group’s non-financial assets are reviewed at each reporting date to determine whether there is any
indication of impairment. If any such indication exists then the asset’s recoverable amount is estimated. For goodwill and intangible
assets that have indefinite useful lives or that are not available for use, the recoverable amount is estimated each year.
Dividend income is recognised when the right to receive income is established. Dividends are reflected as a component of other
operating income.
Non-current assets (or disposal groups) are classified as assets held for sale when their carrying amount is to be recovered principally
through a sale transaction and a sale is considered highly probable. They are stated at the lower of carrying amount and fair value less
costs to sell.
Leases of property, plant and equipment where the group, as lessee, has substantially all the risks and rewards of ownership are
classified as finance leases. Finance leases are capitalised at the lease's inception at the fair value of the leased property or, if lower,
the present value of the minimum lease payments. The corresponding rental obligations, net of finance charges, are included in other
short-term and long-term payables. Each lease payment is allocated between the liability and the finance cost. The finance cost is
charged to the profit or loss over the lease period so as to produce a constant periodic rate of interest on the remaining balance of the
liability for each period.
The property, plant and equipment acquired under finance leases is depreciated over the asset's useful life or over the shorter of the
asset's useful life and the lease term if there is no reasonable certainty that the group will obtain ownership at the end of the lease
term. Leases in which a significant portion of the risks and rewards of ownership are not transferred to the group as lessee are
classified as operating leases. Lease income from operating leases where the group is a lessor is recognised in income on a straight-line
basis over the lease term. The respective leased assets are included in the balance sheet based on their nature.
53

Polaris Bank Limited
Consolidated and separate financial statements
Notes to the financial statements
For the year ended 31 December 2019
(All amounts in millions of Naira unless otherwise stated)
2.16 Property, plant and equipment
i. Recognition and measurement
ii. Subsequent costs
iii. Depreciation
iv. Derecognition
The estimated useful lives for the current and comparative periods are as follows:
Leasehold land and buildings - Over the shorter of the useful life of 50 years or lease term
Leasehold improvements - Over the shorter of the useful life of 50 years or lease term
Motor vehicles - 4 years
Computer hardware - 3 years
Furniture and fittings - 5 years
Plant and machinery - 5 years
Depreciation begins when an asset is available for use and ceases at the earlier of the date that the asset is derecognised or classified
as held for sale in accordance with IFRS 5. A non-current asset or disposal group is not depreciated while it is classified as held for sale.
Depreciation is recognised in the income statement on a straight-line basis to write down the cost of each asset, to their residual values
over the estimated useful lives of each part of an item of property, plant and equipment. Leased assets under finance lease are
depreciated over the shorter of the lease term and their useful lives.
The cost of replacing part of an item of property, plant or equipment is recognised in the carrying amount of the item if it is probable
that the future economic benefits embodied within the part will flow to the Group and its cost can be measured reliably. The carrying
amount of the replaced part is derecognised. All other repairs and maintenance are charged to the income statement during the
financial period in which they are incurred.
The Group recognizes items of property, plant and equipment at the time the cost is incurred. These costs include costs incurred initially
to acquire or construct an item of property, plant and equipment as well as the costs of its dismantlement, removal or restoration, the
obligation for which an entity incurs as a consequence of using the item during a particular period.
The assets’ carrying values and useful lives are reviewed, and written down if appropriate, at each reporting date. Assets are impaired
whenever events or changes in circumstances indicate that the carrying amount is less than the recoverable amount.
Items of property and equipment are measured at cost less accumulated depreciation and impairment losses. Cost includes
expenditures that are directly attributable to the acquisition of the asset. When parts of an item of property or equipment have different
useful lives, they are accounted for as separate items (major components) of property and equipment.
Capital work in progress is not depreciated. Upon completion it is transferred to the relevant asset category. Depreciation methods,
useful lives and residual values are reassessed at each reporting date.
An item of property and equipment is derecognised on disposal or when no future economic benefits are expected from its use or
disposal. Any gain or loss arising on de-recognition of the asset (calculated as the difference between the net disposal proceeds and the
carrying amount of the asset) is included in the income statement in the year the asset is derecognised.
Depreciation rates, methods and the residual values underlying the calculation of depreciation of items of property, plant and equipment
are kept under review on an annual basis to take account of any change in circumstances.
54

Polaris Bank Limited
Consolidated and separate financial statements
Notes to the financial statements
For the year ended 31 December 2019
(All amounts in millions of Naira unless otherwise stated)
2.17 Intangible assets
Goodwill
Software
For the purpose of impairment testing, goodwill acquired in a business combination is allocated to each of the CGUs, or groups of CGUs,
that is expected to benefit from the synergies of the combination. Each unit or group of units to which the goodwill is allocated
represents the lowest level within the entity at which the goodwill is monitored for internal management purposes. Goodwill is
monitored at the operating segment level.
Software acquired by the Group is stated at cost less accumulated amortisation and accumulated impairment losses. Expenditure on
internally developed software is recognised as an asset when the Group is able to demonstrate its intention and ability to complete the
development and use the software in a manner that will generate future economic benefits, and can reliably measure the costs to
complete the development.
Development costs previously expensed cannot be capitalised. The capitalised costs of internally developed software include all costs
directly attributable to developing the software and capitalised borrowing costs, and are amortised over its useful life. Internally
developed software is stated at capitalised cost less accumulated amortisation and impairment.
Subsequent expenditure on software assets is capitalised only when it increases the future economic benefits embodied in the specific
asset to which it relates. All other expenditure is expensed as incurred.
Goodwill arises on the acquisition of subsidiaries and represents the excess of the cost of the acquisition over the Group's interest in the
net fair value of the identifiable assets, liabilities and contingent liabilities of the acquired subsidiaries at the date of acquisition. When
the excess is negative, it is recognised immediately in profit or loss. Goodwill on acquisition of subsidiaries is included in intangible
assets.
Goodwill impairment reviews are undertaken annually or more frequently if events or changes in circumstances indicate a potential
impairment. The carrying value of the CGU containing the goodwill is compared to the recoverable amount, which is the higher of value
in use and the fair value less costs of disposal. Any impairment is recognised immediately as an expense and is not subsequently
reversed. Gains and losses on the disposal of an entity include the carrying amount of goodwill relating to the entity sold.
Amortisation method, useful lives, and residual values are reviewed at each financial year-end and adjusted if appropriate.
Amortisation is recognised in profit or loss on a straight-line basis over the estimated useful life of the software, from the date that it is
available for use since this most closely reflects the expected pattern of consumption of the future economic benefits embodied in the
asset. The estimated useful life of software is 3 years.
55

Polaris Bank Limited
Consolidated and separate financial statements
Notes to the financial statements
For the year ended 31 December 2019
(All amounts in millions of Naira unless otherwise stated)
2.18 Employee benefits
Defined contribution plans
Defined benefit plans
Termination benefits
Short-term employee benefits
2.19 Provisions
2.20 Financial guarantees
A provision for onerous contracts is recognised when the expected benefits to be derived by the Group from a contract are lower than
the unavoidable cost of meeting its obligations under the contract. The provision is measured at the present value of the lower of the
expected cost of terminating the contract and the expected net cost of continuing with the contract. Before a provision is established,
the Group recognises any impairment loss on the assets associated with that contract.
Actuarial gains and losses arising from experience adjustments and changes in actuarial assumptions are charged or credited to equity
in other comprehensive income in the period in which they arise.
For defined contribution plans, the Group pays contributions to publicly or privately administered pension fund administrators (PFA) on
a mandatory, contractual or voluntary basis. The Group has no further payment obligations once the contributions have been paid. The
contributions are recognised as employee benefit expense in the income statement when they are due. Prepaid contributions are
recognised as an asset to the extent that a cash refund or a reduction in the future payments is available.
Financial guarantee contracts are contracts that require the issuer to make specified payments to reimburse the holder for a loss it
incurs because a specified debtor fails to make payments when due in accordance with the terms of a debt instrument.
Financial guarantees are initially recognised in the consolidated financial statements at their fair values on the date that the guarantee
was given; and the initial fair value amortised over the life of the financial guarantee. The guarantee liability is subsequently carried at
the higher of this amortised amount and the present value of any expected payment (when a payment under the guarantee has
become probable).
The current service cost of the defined benefit plan, recognised in the income statement in employee benefit expense, except where
included in the cost of an asset, reflects the increase in the defined benefit obligation resulting from employee service in the current
year, benefit changes curtailments and settlements.
Short-term employee benefit obligations are measured on an undiscounted basis and are expensed as the related service is provided. A
liability is recognised for the amount expected to be paid under short-term cash bonus or profit-sharing plans if the Group has a present
legal or constructive obligation to pay this amount as a result of past service provided by the employee and the obligation can be
estimated reliably.
A provision for restructuring is recognised when the Group has approved a detailed and formal restructuring plan, and the restructuring
either has commenced or has been announced publicly. The Group recognizes no provision for future operating losses.
Termination benefits are recognised as an expense when the Group is demonstrably committed, without realistic possibility of
withdrawal, to a formal detailed plan to terminate employment before the normal retirement date. Termination benefits for voluntary
redundancies are recognised if the Group has made an offer encouraging voluntary redundancy, it is probable that the offer will be
accepted, and the number of acceptances can be estimated reliably.
A provision is recognized if, as a result of a past event, the Group has a present legal or constructive obligation that can be estimated
reliably, and it is probable that an outflow of economic benefits will be required to settle the obligation. Provisions are determined by
discounting the expected future cash flows at a pre-tax rate that reflects current market assessments of the time value of money and,
where appropriate, the risks specific to the liability.
Past-service costs are recognised immediately in the income statement. The net interest cost is calculated by applying the discount rate
to the net balance of the defined benefit obligation. This cost is included in employee benefit expense in the income statement.
A defined contribution plan is a pension plan under which the Group pays fixed contributions to a separate entity. The Group has no
legal or constructive obligations to pay further contributions if the fund does not hold sufficient assets to pay all employees the benefits
relating to employee service in the current and prior periods.
A defined benefit plan is a pension plan that defines an amount of pension benefit that an employee will receive on retirement, usually
dependent on one or more factors, such as age, years of service and compensation. The liability recognised in the statement of financial
position in respect of defined benefit pension plans is the present value of the defined benefit obligation at the end of the reporting
period. The defined benefit obligation is calculated annually by independent actuaries using the projected unit credit method. The
present value of the defined benefit obligation is determined by discounting the estimated future cash outflows using interest rates of
high-quality corporate bonds that are denominated in the currency in which the benefits will be paid, and that have terms to maturity
approximating the terms of the related pension liability.
56

Polaris Bank Limited
Consolidated and separate financial statements
Notes to the financial statements
For the year ended 31 December 2019
(All amounts in millions of Naira unless otherwise stated)
2.21 Share capital
Ordinary shares are classified as equity.
Share issue costs
Dividends on the Bank's ordinary shares
2.22 Borrowings
2.23 Discontinued operations
2.24 Repossessed Collateral
Fees paid on the establishment of borrowings are recognised as transaction costs of the borrowing to the extent that it is probable that
some or all of the facility will be drawn down. In this case, the fee is deferred until the draw-down occurs. To the extent that there is no
evidence that it is probable that some or all of the facility will be drawn down, the fee is capitalised as a pre-payment for liquidity
services and amortised over the period of the facility to which it relates.
No dividends has been proposed by management for the current period.
Where the Bank or any member of the Group purchases the Bank’s equity share capital (treasury shares), the consideration paid,
including any directly attributable incremental costs (net of income taxes) is deducted from equity attributable to the Bank’s equity
holders until the shares are cancelled or reissued. Where such ordinary shares are subsequently reissued, any consideration received,
net of any directly attributable incremental transaction costs and the related income tax effects, is included in equity attributable to the
company’s equity holders.
In certain circumstances, property is repossesed following the foreclosure on loans that are in default. Repossessed properties are
measured at the lower of carrying amount and fair value less costs to sell and reported within 'Prepayments and other assets'.
The Group presents discontinued operations in a separate line in the consolidated income statement if an entity or a component of an
entity has been disposed of or is classified as held for sale and:
(a) Represents a separate major line of business or geographical area of operations;
(b) Is part of a single co-ordinated plan to dispose of a separate major line of business or geographical area of operations; or
(c) Is a subsidiary acquired exclusively with a view to resale (for example, certain private equity investments).
Net profit from discontinued operations includes the net total of operating profit and loss before tax from operations, including net gain
or loss on sale before tax or measurement to fair value less costs to sell and discontinued operations tax expense. A component of an
entity comprises operations and cash flows that can be clearly distinguished, operationally and for financial reporting purposes, from the
rest of the Group´s operations and cash flows. If an entity or a component of an entity is classified as a discontinued operation, the
Group restates prior periods in the consolidated income statement.
Incremental costs directly attributable to the issue of new shares or options or to the acquisition of a business are shown in equity as a
deduction, net of tax, from the proceeds.
Dividends on the Bank's ordinary shares are recognised in equity in the period in which they are approved by the Bank’s shareholders.
Dividends for the year that are declared after the date of the consolidated statement of financial position are dealt with in the
subsequent events note.
Once classified as held for sale or distribution, intangible assets and property, plant and equipment are no longer amortised or
depreciated, and any equity accounted investee is no longer equity accounted.
Impairment losses on initial classification as held for sale or distribution and subsequent gains and losses on re-measurement are
recognised in the income statement. Gains are not recognised in excess of any cumulative impairment loss.
Non-current assets, or disposal groups comprising assets and liabilities, that are expected to be recovered primarily through sale or
distribution rather than through continuing use, are classified as held for sale or distribution. Immediately before classification as held
for sale or distribution, the assets, or components of a disposal group, are re-measured in accordance with the Group’s accounting
policies. Thereafter generally the assets, or disposal group, are measured at the lower of their carrying amount and fair value less costs
to sell. Any impairment loss on a disposal group is allocated first to goodwill, and then to the remaining assets and liabilities on pro rata
basis, except that no loss is allocated to inventories, financial assets, deferred tax assets, employee benefit assets, investment property
or biological assets, which continue to be measured in accordance with the Group’s accounting policies.
Borrowings are recognised initially at fair value, net of transaction costs incurred. Borrowings are subsequently carried at amortised
cost; any difference between the proceeds (net of transaction costs) and the redemption value is recognised in the income statement
over the period of the borrowings using the effective interest method.
57

Polaris Bank Limited
Consolidated and separate financial statements
For the year ended 31 December 2019
Notes to the financials
(All amounts in millions of Naira unless otherwise stated)
3 Financial risk management
The following section discusses the Group's risk management policies. The measurement of ECL under IFRS 9 uses the
information and approaches that the Group uses to manage credit risk, though certain adjustments are made in order to
comply with the requirements of IFRS 9. The approach taken for IFRS 9 measurement purposes is discussed separately in
note 2.6.1.
The need for proper risk management cannot be over emphasized hence the Group recognises the need to invest in
establishing appropriate structures, develop its personnel and deploy the right technology to support its risk practices which
will further strengthen risk management values and beliefs across board. The Group's aim is to achieve an appropriate
balance between risk and return while minimising potential adverse effects on the Group's financial performance.
Risk management is at the center of the Group's operations. The Group practices a robust risk management system which
embodies proactive identification measurement, treatment, monitoring and reporting of all material risks to which it is
exposed. The Group is primarily exposed to credit, market and operational risks. Other risks faced by the group include but is
not limited to liquidity, settlement, reputational, legal, strategic and compliance risks. The management of these risks is in
unison with the Group’s capital management in general and the Group’s strategic objectives in particular.
The Enterprise Wide Risk Management Directorate is responsible for carrying out risk management in line with global best
practice and with the ultimate objective of delivering value to the Group’s shareholders. The risk management practice
adopted begins with establishing a general context from policy and guidance notes approved by the Board of Directors. The
practice further cascades into risk identification, risk analysis, evaluation, mitigation and communication.
The communication of risks helps to inculcate homogenous risk principles shared across the Group that eventually shapes in
general, risk awareness and response. A common risk management language improves the risk culture of the group hence
making everybody a stake holder in the risk process. The Group’s risk management is organised along the three line of
defense shown in the figure below:
These risk organisations are geared towards protection of the Group's Customer deposits, ensure optimum Capital
Management and boost risk adjusted profit margins for the enhancement of Shareholders value. The dynamic nature of risks
is a basis for the regular review of risk management policies and systems by the Group for effective and relevance. This
makes risk management in the Group, a veritable tool for decision making since is aligns with the prevailing market
conditions.
BUSINESS UNITS
- Interface with customers
- Risk origination
CONTROL GROUPS
- Provide risk oversight
- Provide controls
INTERNAL AUDIT
- Validation
-Assurance of risk management
processes
59

Polaris Bank Limited
Consolidated and separate financial statements
For the year ended 31 December 2019
Notes to the financials
(All amounts in millions of Naira unless otherwise stated)
Enterprise risk management framework
Polaris Bank has an enterprise risk management structure that aligns its practice within the strategy and regulatory standards
for capital management. It spells out the risk types, policies within which they are treated and the metrics for their
management and/or control. The Board has the overall responsibility for risk management within the Bank. The Board
enhances value for shareholders through various committees that includes but is not restricted to the committees shown in
the diagram below:
The committees at board and management levels are responsible for reviewing and recommending risk management policies,
procedures and profiles including risk philosophy, risk appetite and risk tolerance of the Group. The oversight functions cut
across all risk areas. The committees monitors the Group's plans and progress towards meeting regulatory Risk-Based
Supervision requirements and implementation of Basel precepts as well as the overall Regulatory and Economic Capital
Adequacy. Other function of these committees include:
Risk Management Philosophy
Group defines risk management philosophy as the set of values, attitudes and practices that shows how it would perceive and
or respond to any risk to which it is exposed. The principles that guide the management of risk across the Group are:
1. A general acceptance that enterprise risk-management is mandatory, and not optional.
2. Retention of ownership and accountability for risk and risk management right from the business unit or other unit where it
was first identified.
3. Striking a conservative balance between risk and reward. This is achieved by aligning risk appetite with business strategy,
diversifying risk, pricing risk appropriately, mitigating risk through preventive and detective controls and updating risk
registry.
4. Making risk management a shared responsibility .All business segments are responsible for active management of their
risks, with direction and oversight provided by the Risk Management Group, and other corporate support groups.
5. Risk knowledge and understanding as a basis for decision making. The enterprise performs a rigorous assessment of risks
in relationships, products, transactions and other business activities.
6. Avoidance of activities that are not consistent with our Values, Code of Conduct or Policies - This contributes to the
protection of our reputation and the uniformity of our principles.
7. Focus on clients as an act of good risk management. We know our clients, build a relationship with them and ensure that
the services we provide are suitable for and understood by them.
BOARD OF DIRECTORS
BOARD AUDIT COMMITTEE
INTERNAL AUDITORS EXTERNAL AUDITORS
BOARD RISK MANAGEMENT
COMMITTEE
MANAGEMENT RISK COMITTEE
MANAGEMENT CREDIT COMMITTEE
ASSETS AND LIABILITY COMMITTEE
BOARD CREDIT COMMITEE
60

Polaris Bank Limited
Consolidated and separate financial statements
For the year ended 31 December 2019
Notes to the financials
(All amounts in millions of Naira unless otherwise stated)
COMMITTEE
Board Audit
Board Risk
Management
Management Risk
Management
Credit
Assets and
Liability
Board Credit
Risk Organization and Governance
Diagram 1: Risk Organisation
RESPONSIBILITY
The Board at all times ensures that a systematic, documented assessment of the processes and outcomes surrounding key
risks is undertaken. It also ensures the regular review of risk management systems and policies to reflect prevailing realities.
Provision of validation, assurance, independence and objectivity of the
internal and external auditors.
Definition of the Bank’s risk appetite and the provision of appropriate
structure and resources for the identification, assessment, measurement,
monitoring and control of risks across the group.
Planning, management and control of the Bank`s overall risks.
Oversees credit approval that falls within the mandated approval limit.
Reviews and recommendation of credit policy direction to the BCC
Ensures adequate liquidity to meet the Bank’s funding need as well as
management of the interest rate and foreign exchange risk.
Provision of oversight for the Bank’s lending process, including its credit
policy, framework and strategy
The Enterprise Risk Management Group, headed by an Executive Director, who reports to the Board through the Group
Managing Director, has the primary responsibility of managing these risks on a day to day basis and maintains a consolidated
and holistic view of the different risk types.
The Group’s structure defines responsibility for risk management across all levels of authority. The Board of Directors, through
its various committees, articulates the vision, sets the tone and provides strategic direction for the management of risk across
the Group. Executive Management transforms the strategic direction and policies set by the Board into procedures and
processes, they institute an effective hierarchy to execute and implement the policies.
Board of Directors
Board Risk Management Committee
BUSINESS UNITS
Extern
al Au
dit
Inte
rnal A
ud
it
Management Committee
Board Credit Committee
Management Credit Committee
Asset and Liability Management
Committee
Risk Management Committee
Enterprise Risk Management
Credit Risk Management
Market Risk Management
Operational Risk Management
Co
mp
liance
Finan
ce
61

Polaris Bank Limited
Consolidated and separate financial statements
For the year ended 31 December 2019
Notes to the financial statements
(All amounts in millions of Naira unless otherwise stated)
Diagram 2: The Enterprise Risk Management Organogram
The Bank’s Enterprise risk management is made of credit, market and operational risks with the operational further encompassing
strategic and legal risks. MIS and Predictive analytics are operate independently of the three major risk classes. The credit analysis
team through the chief credit officer reports to the Directorate Head risk management.
MD/CEO
Directorate Head /Chief Risk Officer
ComplianceDepartment
Remedial Assets
Head, EnterpriseRisk Management
Head, Credit Risk
Portfolio Planning & MIS
Market Risk Operational Risk
Loan Review
Credit Admin & Compliance
Collateral Review
Retail Risk
Subsidiaries
Predictive Analytics
Strategic Risk
ALM
Trade &
Liquidity Risk
Subsidiaries
Chief Credit OfficerOperational Risk
Management
Compliance Risk
Legal Risk
BCP
Subsidiaries
CreditAnalysis
62

Polaris Bank Limited
Consolidated and separate financial statements
For the year ended 31 December 2019
Notes to the financial statements
(All amounts in millions of Naira unless otherwise stated)
Risk management strategies and objectives
Risk management objectives
• To optimise risk/return decisions, while establishing strong and independent review and challenge structures.• To ensure that business growth plans are properly supported by effective risk infrastructure.
• To improve the control and co-ordination of risk taking across the business.
The Group Enterprise-wide Risk Management Directorate manages all aspects of risk including threats and opportunities. The risk
management infrastructure therefore encompasses a comprehensive and integrated approach to identifying, managing, monitoring
and reporting. It also allows for effective risk communication that results in good awareness which makes collective risk
management a culture.
Diagram 3: The Risk Governance Pyramid
The overall business strategy of the bank revolves around present and future practices, policies and projections that would increase
earnings. The risk strategies however provide quantitative and qualitative guidance to maximize returns while minimising risks.
These strategies align well with the Bank’s risk appetite framework and measures. The strategic and principles used include:
• To manage the Group’s risk profile and ensure that its financial deliverables are met given a range of adverse business conditions.
• Placing emphasis on diversity, quality and stability of earning after thorough risk assessment• Leveraging on competitive advantages with a focus on core businesses• Ability to quantify to a very large extent all material risk faced.• Making disciplined and selective strategic investments
The Group’s risk management objectives are:
• To identify material risks to the Group and ensure that business activities and plans are consistent with its risk appetite.
Board
Board Risk Management
Risk Management Committee
Risk Management Units
Business Units
Internal Control
Oversight
Oversight
Escalation
Co-ordination
Ownership
Assurance/Validation
63

Polaris Bank Limited
Consolidated and separate financial statements
For the year ended 31 December 2019
Notes to the financial statements
(All amounts in millions of Naira unless otherwise stated)
Scope of Polaris Bank's Risk Management
Credit risk
Market risk
Liquidity risk
Compliance risk
Strategic risk
Risk Appetite
• Monthly Management Profitability Reports (MPR) for the marketing teams
• Monthly Operations Performance Reports (OPR) for the support teams
• Quarterly Business Profitability Review
• Annual Bank-wide performance appraisal systems
“In the Pursuit of the Group’s objectives of maximizing its earnings and shareholders value, the Group exhibits a “moderate”
appetite for risk. This measure is quantified by the various board approved risk limits/thresholds and reflected in the Group’s culture
as well as its approach to Business.”
Our Risk Appetite Statement defines the amount and type of risk the Group is willing to accept in the pursuit of its strategic
objectives, while recognising a range of possible outcomes as business plans are implemented. In arriving at the risk appetite, the
enterprise risk framework which is approved by the Board Risk Committee combines a top-down view of its capacity to take risk
with a bottom-up view of the business risk profile requested and recommended by each business area. The Group defines its risk
appetite at the enterprise level as well as across different risk areas using qualitative and quantitative measures.
Risk Management Methodology
The Group uses risk methodologies that cut across the 4T’s of response. The type of risk determines whether it would be
transferred, tolerated, treated or terminated. The major risks however fall under the treatment methodology. The Bank manages
risk to derive value for all stakeholders. Its sets about achieving this by formulating policies and procedures that guides actions and
reactions. Some of the policies and procedures are shown in the diagram below:
The policies sets the tone but to ensure adherence, several exception reports on customers and activities of the Group are
generated by the various audit control units for management’s decision making. These include:
Potential loss owing to obligor default
Risk that value of on and off-balance sheet positions of a financial institution will be adversely affected by
movements in market rates or prices.
Potential loss arising from inability to meet obligations, or fund increases in assets as they fall due without
incurring unacceptable cost or losses.
Potential loss arising from non-compliance with laws, regulations, standards or code of conducts of local
industry regulators.
Potential loss arising from current and prospective impact on earnings or capital due to:
i) Adverse business decisions
ii) Improper implementation of decisions
iii) Lack of responsiveness to industry changes
Po
lici
es a
nd
pro
ced
ure
s
ERM
Credit
Human Resources
Standard operations
IT
FX Exposure
64

Polaris Bank Limited
Consolidated and separate financial statements
For the year ended 31 December 2019
Notes to the financial statements
(All amounts in millions of Naira unless otherwise stated)
Table 1: Risk Appetite Definition Approach
Qualitative Quantitative –
Limits and
Thresholds
Quantitative –
Key Risk
Indicators
Risk Element Risk Appetite Definition Approach
Strategic Risk
Compliance Risk
The Group measures its performance against its Risk Appetite and reports this to the Executive Management and Board on a
quarterly basis; this may prompt a rebalancing of the business mix to achieve less risk on a diversified basis. The risk appetite
definition and monitoring enables the Group to:
• Identify unused risk capacity, and thus highlight profitable opportunities
• Improve risk and return characteristics across the business
• Meet growth targets within an overall risk appetite and protect the Group's performance
• Improve executive management control and co-ordination of risk-taking across businesses
The Risk Management Process
Enterprise Risk
Credit Risk
Market Risk
Liquidity Risk
Legal Risk
The risk management process begins with establishing a context followed by risk identification and definition. Risks identified must
be analysed and measured before effective monitoring and reporting can be executed.
Establishing a Context
This is achieved through policies and strategies adopted by the Bank to guide its business and operations. The Management
approves of these policies and have a role to play in their implementation. Lines of action and responses are detailed in the event of
crystallisation of risks.
Risk identification
The Group embarks on a thorough risk identification process on a cause, effect and impact basis. This helps to unearth risk in new
products, processes and activities. This risks discovered are added to risk register. These actions are carried out in addition to the
periodic review of the risk profile of existing products, processes and activities. The concept of risk identification at a fundamental
stage cuts across credit, operations, Market, Liquidity, Legal, Compliance and Strategic Risks. This is achieved through:
• Periodic review of existing products
• Defined Key Risk Indicators
• Regular update of the risk register
• Periodic risk and control self-assessment exercise
• A framework for the analysis and assessment of risks associated with new markets or products.
Risk Measurement
The risk management group is responsible for developing and sustaining an appropriate suite of risk management techniques to
support the operations of the various business lines. This function includes estimating the value of transactions, risk exposures,
credit risk rating and parameters regulatory and economic capital for the Bank. The techniques used are dependent of the risk
types. Some risk require quantitative modelling and stress testing while some are more subjectively or qualitatively measured. At
every point, the use of models is balanced with a good governance structure and application of sound and experienced judgment.
All methodologies used for risk measurement are subject to internal and external validation for relevance, accuracy and to
determine whether risk level are within the Bank’s appetite.
65

Polaris Bank Limited
Consolidated and separate financial statements
For the year ended 31 December 2019
Notes to the financial statements
(All amounts in millions of Naira unless otherwise stated)
Risk monitoring and Reporting
Monitoring is a very important part of the risk management process. It helps to ensure that business activities are within the
approved limits of guideline. It also aligns the transactions to the Bank’s strategies and risk appetite. Where there is a breach, such
is reported to senior management and/or the Board depending on the limit of guideline.
Reporting helps to capture the collective measures of risk across products and businesses in compliance or in breach of the policies,
limits and guidelines. They also provide a clear statement of the amounts, types, and sensitivities of the various risks in the Bank’s
portfolios. Senior management and the Board use this information to understand the Bank’s risk profile and the performance of the
portfolios. Reports and rendered daily, weekly, monthly, quarterly, semi -annually or annually depending on the risk and recipient.
The control functions also work independently to review risk practices in line with the framework. They also submit reports that are
used to check if the risk reports are reflective of the actual practices.
• Sensitivity Analysis and Stress Testing
The Group conducts sensitivity analysis and stress test to estimate the potential impact of risk levels on income and capital as a
result of fluctuations in market conditions, liquidity and other risk factors. This gives the bank an idea of its expected and
unexpected losses. The results from different areas (credit, market, operational liquidity etc.) are consolidated at an enterprise
level. Enterprise-wide stress testing is also integrated with both the strategic and financial planning processes. It is developed with
input from a broad base of stakeholders, and results are integrated into management decision-making processes for capital,
funding, market risk limits, and credit risk strategy. The development and review of this exercise is subject to formalized policies
and approval from senior management.
Models are veritable tools used for stress test and other quantitative risk measures. They help achieve outputs like Expected
Losses(EL), Unexpected Losses(UL), stressed non-performing loans, Exposure at Default(EAD), Probability of Default(PD), Loss
Given Default(LGD), Value at Risk (VaR), duration, maturity gap and rating grades. Since these models have become a vital part of
decision making, the Banks manages the risk inherent in their usage by validation, and revalidation internally and by reputable
External Consultants. In addition, staff are trained to use these models to achieve a high level of accuracy. The models are also
frequently used to reflect prevailing risk factors and best practice.
Basel and Capital Management
Polaris Bank is in the forefront of Basel implementation and it is constantly building resource capacity for the migration to the
internal rating based approach of capital management.
The Basel II regulatory capital framework governs minimum regulatory capital requirements .This framework is organised under
three pillars:
Pillar 1: The Bank uses Basel and CBN compliant methodologies and parameters to calculate its minimum capital requirements while
putting in place measures to achieve the regulatory capital figures stipulated by Basel and CBN
Pillar 2: This pillar contains the internal capital adequacy and assessment process (ICAAP). It is a formal internal assessment of
capital adequacy in relation to strategies, risk appetite, and actual risk profile. It is also a regulatory requirement. To this end, the
Bank has an ICAAP committee charged with producing the ICAAP report on an annual basis as required by the regulators. The Bank
also has a capital management committee that allocates capital after proper reviews of risk profile and concentration vis a vis
return.
Pillar 3: The Bank is transparent in all its process and reports its business operations in a precise manner. It enhances public
disclosure (both quantitative and qualitative) of specific details of risks being assumed, and how capital and risk are being managed
under the Basel framework.
The CBN specifies approaches for quantifying the risk weighted assets for credit, market and operational risk for the purpose of
determining regulatory capital. Although the computations are consistent with the requirements of Pillar 1 Basel II Accord, certain
sections have been adjusted to reflect the peculiarities of the Nigerian environment. In compliance with CBN, the Bank has adopted
the Standardized approach in determining capital charge for credit risk and market risk while capital charge for operational risk was
determined using Basic Indicator Approach (BIA).
66

Polaris Bank Limited
Consolidated and separate financial statements
For the year ended 31 December 2019
Notes to the financial statements
(All amounts in millions of Naira unless otherwise stated)
Management of Credit Risk
Credit risk is the risk of suffering financial loss, should any of the Group's customers, client or market counterparties fail to fulfil
their contractual obligations to the Group. Credit risk arises mainly from interbank, commercial and consumer loans and advances,
and loan commitments arising from such lending activities, but can also arise from credit enhancement provided, such as credit
derivatives (credit default swaps), financial guarantees, letters of credit, endorsements and acceptances.
Credit risk is the single largest risk within the Group, being an integral part of the Group’s business activities and is inherent in
traditional products – loans, commitments to lend and contingent liabilities, such as letters of credit – and in “traded products” such
as repurchase agreements (repos and reverse repos). The Group is also exposed to credit risks arising from investments in debt
securities and other exposures arising from its trading activities - trading exposures.
The Group defines credit risk as the risk that its customers will be unable or unwilling to pay interest, and/or principal or fail to
perform their obligations as specified in the loan contract engaged between the customer and the Group.
Credit Risk Management
Credit risk is the risk of an economic loss arising from the failure of a counterparties to fulfil its contractual obligations; its effect is
measured by the cost of replacing cash flows if the other party defaults.
Credit Risk Guiding Principles
Credit Risk Management in the Group is guided by the following principles:
a. A strategic rather than a purely opportunistic approach in the creation of its credit risk portfolio.
b. Clear articulation of policy guidelines on exposures, concentrations, pricing, collateral, customer-product matrices and portfolio
liquidity.
c. Maintenance of an integrated tracking system to measure actual against targeted risk asset composition and close monitoring of
risk, return and asset quality indicators.
d. The Group shall work to minimize the risk arising from a build-up of concentration in its Credit Risk Asset portfolio in any sector,
obligor or industry.
e. Portfolio liquidity and flexibility shall be important balancing elements in the creation of Credit Risk Assets by the Group.
f. Loan pricing for each exposure shall be determined by the obligor’s risk profile as represented by his risk rating.
g. Irrespective of the rewards, the Group will always put Credit Risk before pecuniary considerations.
h. The Group shall not engage in lending activities where though the returns look promising, the purpose of the loan and or its
source of repayment are unknown or at best speculative.
The Management of Credit Risk occurs broadly on 3 levels: the Board level, Management level and Risk Management Group level.
At the Board level, Credit Risk is managed by the Board Credit Committee and Board Risk Management Committee with the
following roles:
i. Regular and ad-hoc review and approval of Credit Risk Strategy
ii. Approval of the Group’s Credit Risk Appetite
iii. Monitoring the effectiveness of the Group’s Credit Risk Measurement and Control Systems
iv. Custody of the Group’s Credit Risk Framework
v. Approval of credit requests above Management Credit Committee limits
vi. Approval of the Group’s Credit Risk Rating Systems
vii. Monitoring compliance to portfolio concentration limits
At the Management level, Credit Risk is managed by the Management Risk Committee(MRC), Management Credit Committee
(MCC), the Portfolio Planning Committee (PPC) and the Rating Committee.
The role of the MCC includes among others:
a. Approval of credit facility requests within the limits of management but above the limits of various Business Unit Heads (including
the Managing Director).
b. Review and recommendation for approval to the Board Credit Committee on credit facilities above management limit.
c. Review and recommendation to the Board Credit Committee of Credit Policies and Standards.
67

Polaris Bank Limited
Consolidated and separate financial statements
For the year ended 31 December 2019
Notes to the financial statements
(All amounts in millions of Naira unless otherwise stated)
Credit Origination
The role of the Portfolio Planning Committee includes among others:
a. Review and recommendation for approval to the Board Risk Management Committee, the Group’s portfolio limit concentration
policy for sector, industry, region, product type, customer type and obligor rating.
b. Review and recommendation for approval to the Board Risk Management Committee, any changes in the Group’s portfolio limit
concentration policy.
c. Monitoring of the actual portfolio concentration limits against targeted performance.
d. Supervision of stress tests for the Group’s Credit Risk portfolio.
The credit risk assessment of loan exposures is centralized in a Credit Analysis team, headed by the Chief Credit Officer, who
reports to the CEO and Board of Directors through the Chief Risk Officer.
There are various levels of filtration in the process of creating credit risk asset in the Group including;
i. Clearly defined exposure concentration limits
ii. Originated transactions going through Centralized Sector Analysts for quality assurance
iii. The extensive use of the rating mechanism to objectively set Risk Acceptance Criteria
iv. Defined Target Markets indicating preferred sectors and obligors for whom credit assets can be created.
The credit approval process flow is depicted below:
The Centralized Specialist Analyst role is a risk management function, and all credits are reviewed for quality assurance, risk
acceptance criteria and conformity with portfolio strategy before being recommended for further processing and approvals along the
designated business line. Approval limits are delegated within the various underwriting levels based on loan value and collateral
arrangement. This assurance process is well institutionalized.
Credit Risk Monitoring
Credit risk monitoring is the responsibility of the Loan Review Department which also reports to the Managing Director (MD) and
Board through the Chief Risk Officer, the activity is carried out both at the individual obligor level (covering on and off balance sheet
exposures) and overall portfolio level.
The overriding objective of credit risk monitoring is to ensure that the quality of the Group's credit portfolio is tracked on a day to
day basis so as to take prompt and appropriate remedial measures as soon as any deterioration or potential deterioration is
identified.
Acct Officer Team Leader
BDM/
Business
Unit
Head
Centralised
Specialist Analyst Maker/
Checker
Under-writers
1-7
Legal Maker/
Checker
Credit Admin
Maker/
Checker
Draw-
down
Maker/
Checker
LOAN DISB’MENT
CREDITAPPROVAL
Activates:
• Credit Rating• Transaction Rating
• This is Limit Based
• Underwriting Levels 1-7;
Level 1- Area ManagerLevel 2- Regional ManagerLevel 3- Head of DirectorateLevel 4- GMDLevel 5- MCCLevel 6- BCCLevel 7- BOD
68

Polaris Bank Limited
Consolidated and separate financial statements
For the year ended 31 December 2019
Notes to the financial statements
(All amounts in millions of Naira unless otherwise stated)
Risk Group IFRS 9
Stage
1 Stage 11 Stage 22 Stage 3
Credit Risk Measurement
Number of days past
due
0-3031-90
Above 90 days
In determining the probability of default the bank has estimated the migration rates of loans from risk group 1 to risk group 2 and
quality of the performing book on a quarter by quarter basis. The movement between each risk group is based on the worse of the
credit quality and the days past due of the loan. Any facility with days past due above 90 days moves from risk group 1 to risk
group 2. Each loan facility are grouped based on its sector/industry and further sub-divided into 2 risk group. See below;
Furthermore, significant increase in credit risk is the main factor that determines movement of a financial asset from Stage 1 to
Stage 2, all obligors with days past due obligation or more than 30 days are migrated to stage 2. An obligor is moved into stage 3 if
past due obligation is over 90 days unless there is a rebuttable assumption used by Management.A facility in Stage 3 can
subsequently be deemed “cured”. A facility is deemed to be “cured” when there is a significant reduction in the credit risk of the
financial instrument. “Cured” facilities within Stage 2 are monitored for a probationary period of 90 days to confirm if the credit risk
has decreased sufficiently before they can be migrated from Stage 2 to Stage 1 while “Cured” facilities within Stage 3 are monitored
for a probationary period of 180 days before migration from Stage 3 to Stage 1.
The assessment of credit exposure is very critical. The Banks uses models due to variations in the associated risk factors in credit
risk.
In line with the Bank’s credit policy, the following facility types are accepted:
• Term Loans
• Revolving credits
• Project Finance
• Contingents
• Retail Lending
The estimation of credit exposure for risk management purposes is complex and requires the use of models, as the exposure varies
with changes in market conditions, expected cash flows and the passage of time. The assessment of credit risk of a portfolio of
assets entails further estimations as to the likelihood of defaults occurring, of the associated loss ratios and of defaults occurring, of
the associated loss ratios and of default correlations between counterparties. The Group measures credit risk using Probability of
Default (PD), Exposure of Default (EAD) and Loss Given Default (LGD). This is similar to the approach used for the purposes of
measuring Expected Credit Loss (ECL) under IFRS 9.
The Bank has several models for the quantification and measurement of credit risk but key to them all is credit risk rating system.
There are credit risk parameters engendered in the rating system for the estimation of entity and transactions risks. These
parameters include but is not restricted to probability of default, loss given default and exposure at default which are transparent
and may be replicated in order to provide consistency of credit adjudication, as well as minimum lending standards for each of the
risk rating categories.
• Probability of Default (PD)
The PD represents the likelihood of a borrower defaulting on its financial obligation either over the next 12 months (12 M PD), over
the remaining lifetime (Lifetime PD) of the obligation.
• Exposure at Default (EAD)
EAD is the amount the Group is owed at the time of default or at the reporting date. This basically the sum of the facilities principal
and interest outstanding at reporting date.
• Loss Given Default (LGD)
The Group's expectation of the extent of loss on a defaulted exposure. LGD varies by type of counterparties, type and seniority of
claim and availability of collateral or other credit support. LGD is expressed as a percentage loss per unit of exposure at the time of
default (EAD). LGD is calculated on a 12 month or lifetime basis, where 12-month LGD mirrors the probable loss the Group is likely
to incur on its outstanding facilities. This entails measuring the net realisable value of facility collaterals as well as the present value
of any future expected cash flow. The essence of this measure is to statistically measure the Group's historical loss experience.
69
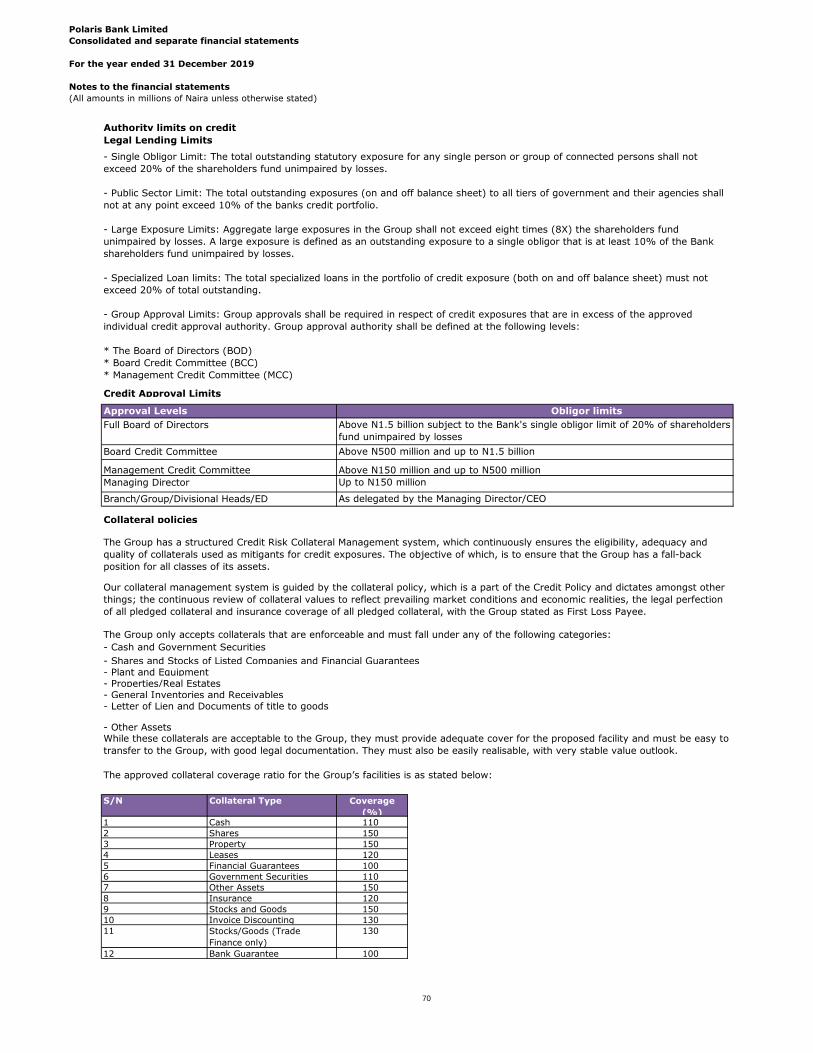
Polaris Bank Limited
Consolidated and separate financial statements
For the year ended 31 December 2019
Notes to the financial statements
(All amounts in millions of Naira unless otherwise stated)
Authority limits on credit
Legal Lending Limits
Credit Approval Limits
Collateral policies
- Cash and Government Securities
- Shares and Stocks of Listed Companies and Financial Guarantees- Plant and Equipment- Properties/Real Estates- General Inventories and Receivables- Letter of Lien and Documents of title to goods
- Other Assets
S/N Collateral Type Coverage
(%)1 Cash 110
2 Shares 150
3 Property 150
4 Leases 120
5 Financial Guarantees 100
6 Government Securities 110
7 Other Assets 150
8 Insurance 120
9 Stocks and Goods 150
10 Invoice Discounting 130
11 130
12 Bank Guarantee 100
Managing Director Up to N150 million
Branch/Group/Divisional Heads/ED As delegated by the Managing Director/CEO
Management Credit Committee Above N150 million and up to N500 million
- Single Obligor Limit: The total outstanding statutory exposure for any single person or group of connected persons shall not
exceed 20% of the shareholders fund unimpaired by losses.
- Public Sector Limit: The total outstanding exposures (on and off balance sheet) to all tiers of government and their agencies shall
not at any point exceed 10% of the banks credit portfolio.
- Large Exposure Limits: Aggregate large exposures in the Group shall not exceed eight times (8X) the shareholders fund
unimpaired by losses. A large exposure is defined as an outstanding exposure to a single obligor that is at least 10% of the Bank
shareholders fund unimpaired by losses.
- Specialized Loan limits: The total specialized loans in the portfolio of credit exposure (both on and off balance sheet) must not
exceed 20% of total outstanding.
- Group Approval Limits: Group approvals shall be required in respect of credit exposures that are in excess of the approved
individual credit approval authority. Group approval authority shall be defined at the following levels:
* The Board of Directors (BOD)
* Board Credit Committee (BCC)
* Management Credit Committee (MCC)
Approval Levels Obligor limits
The Group has a structured Credit Risk Collateral Management system, which continuously ensures the eligibility, adequacy and
quality of collaterals used as mitigants for credit exposures. The objective of which, is to ensure that the Group has a fall-back
position for all classes of its assets.
Our collateral management system is guided by the collateral policy, which is a part of the Credit Policy and dictates amongst other
things; the continuous review of collateral values to reflect prevailing market conditions and economic realities, the legal perfection
of all pledged collateral and insurance coverage of all pledged collateral, with the Group stated as First Loss Payee.
Full Board of Directors Above N1.5 billion subject to the Bank's single obligor limit of 20% of shareholders
fund unimpaired by losses
Board Credit Committee Above N500 million and up to N1.5 billion
The Group only accepts collaterals that are enforceable and must fall under any of the following categories:
While these collaterals are acceptable to the Group, they must provide adequate cover for the proposed facility and must be easy to
transfer to the Group, with good legal documentation. They must also be easily realisable, with very stable value outlook.
The approved collateral coverage ratio for the Group’s facilities is as stated below:
Stocks/Goods (Trade
Finance only)
70

Polaris Bank Limited
Consolidated and separate financial statements
For the year ended 31 December 2019
Notes to the financial statements
(All amounts in millions of Naira unless otherwise stated)
Credit collateral
Write-off policy
The main collateral types acceptable to the Bank for loans and advances include:
All collateral offered must have the following attributes:
• There must be good legal title
• The title must be easy to transfer
• It should be easy and relatively cheap to value
• The value should be appreciating or at least stable
• The security must be easy to sell.
The Group has not included collaterals not easily convertible into cash in calculation of its expected credit loss. All collateral must be
protected by insurance. Exceptions include cash collateral, securities in safe keeping, indemnity or guarantees, or where our interest
is general (for instance in a negative pledge). The insurance policy has to be issued by an insurer acceptable to the Bank. All cash
collateralized facilities shall have a 20% margin to provide cushion for interest and other charges i.e. only 80% of the deposit or
cash collateral may be availed to an obligor.
• Mortgages over residential properties
• Charges over business premises, fixed and floating assets as well as inventory.
• Charges over financial instruments such as equities, treasury bills etc.
The fair values of collaterals are based upon last annual valuation undertaken by independent valuers on behalf of the Bank. The
valuation techniques adopted for properties are based upon fair values of similar properties in the neighbourhood taking into
cognizance the advantages and disadvantages of the comparatives over the subject property and any other factor which can have
effect on the valuation e.g. subsequent movements in house prices, after making allowance for dilapidations. The fair values of
nonproperty collaterals (such as equities, bond, treasury bills, etc.) are determined with reference to market quoted prices or
market values of similar instrument. There were no repossessed collateral during the period.
The same fair value approach is used in determining the collaterals value in the course of sale or realisation.
The Group writes off financial assets, in whole or in part, when it has exhausted all practical recovery efforts and has concluded
there is no reasonable expectation of recovery. Loans (and the related impairment allowance accounts) are normally written off,
either partially or in full, when there is no realistic prospect of recovery. Where loans are secured, this is generally after receipt of
any proceeds from the realization of security. In circumstances where the net realizable value of any collateral has been determined
and there is no reasonable expectation of further recovery, write off may be earlier. Subsequent recoveries of amounts previously
written off are credited to the the statement of comprehensive income.
The Group may write-off financial assets that are still subject to enforcement activity. The outstanding contractual amounts of such
assets written off during the period ended 31 December 2019 was N726 million. The Group still seeks to recover amounts it is
legally owed in full, but which have been partially written off due to no reasonable expectation of recovery.
Loans to individuals or sole proprietors must be secured by tangible, marketable collateral that has a market value that is supported
by a valuation report from a registered estate valuer who is acceptable to the Group. The collateral must also be easy to check and
easy to dispose of. This collateral must be in the possession of, or pledged to, the Group. Client’s account balances must be within
the scope of cover provided by its collateral.
The Group ensures that each credit is reviewed and granted based on the strength of the borrowers’ cash flow. However, the Group
also ensures its credit facilities are well secured as a second way out. The policies that guide collateral for facilities are embedded
within the Group’s credit policy guide. These include the following policy statements amongst others:
71

Polaris Bank Limited
Consolidated and separate financial statements
For the year ended 31 December 2019
Notes to the financial statements
(All amounts in millions of Naira unless otherwise stated)
3. Financial risk management
3.1 Credit risk
3.1.1a Maximum exposure to credit risk for financial assets
Group and Bank
31 December 31 December
2019 2018
1,264 57
Other Assets (Cash reserve with CBN) 37,698 37,446
2019
Stage1
12-month ECL
Stage 2
Lifetime ECL
Stage 3
Lifetime ECL
Total
Term loans 127,571 241 83,823 211,635
Overdrafts 13,342 128 36,303 49,773
Gross Carrying amount 140,913 369 120,126 261,408
Loss Allowance (3,172) (41) (69,457) (72,670)
Carrying amount 137,741 328 50,669 188,739
Investment securities
561,145 - - 561,145
Loss allowance (1,990) - - (1,990)
Carrying amount 559,155 - - 559,155
Other assets (excluding restricted cash) - - 13,006 13,006
Other loans and receivables 182,594 - - 182,594
Loss allowance - - (4,191) (4,191)
Carrying amount 182,594 - 8,815 191,409
Balances with central banks 3,396 - - 3,396
Loss allowance - - - -
Carrying amount 3,396 - - 3,396
Due from banks and other financial institutions 62,076 - - 62,076
Loss allowance - - - -
Carrying amount 62,076 - - 62,076
2018
Stage1
12-month ECL
Stage 2
Lifetime ECL
Stage 3
Lifetime ECL
Total
Term loans 163,803 5,709 74,348 243,860
Overdrafts 11,424 399 278,880 290,703
Gross Carrying amount 175,227 6,108 353,228 534,563
Loss Allowance (15,822) (2,982) (175,708) (194,513)
Carrying amount 159,405 3,126 177,520 340,050
Investment securities
590,483 - - 590,483
Loss allowance (416) - - (416)
Carrying amount 590,067 - - 590,067
Other assets (excluding restricted cash) - - 18,471 18,471
Loss allowance - - (7,812) (7,812)
Carrying amount - - 10,659 10,659
Group and Bank
Investment securities: Amortised Costs and
Assets pledged as Collateral
Financial assets held at fair value through profit or loss
Maximum exposure to credit risk - Financial instruments subject to impairment
The following table contains an analysis of the credit risk exposure of financial instruments for which an ECL allowance is recognised.
The gross carrying amount of financial assets below also represents the Group's maximum exposure to credit risk on these assets.
The following table contains an analysis of the maximum credit risk exposure from financial assets not subject to impairment.
The Group's maximum exposure to credit risk for the period 1 January 2019 to 31 December 2019 is represented by the carrying
amounts of the financial assets in the statement of financial position.
Maximum exposure to credit risk - Financial instruments not subject to impairment
Group and Bank
Investment securities: Amortised Costs and
Assets pledged as Collateral
72

Polaris Bank Limited
Consolidated and separate financial statements
For the year ended 31 December 2019
Notes to the financial statements
(All amounts in millions of Naira unless otherwise stated)
31 December 31 December
2019 2018
Loans exposure to total credit risk exposure 44% 44%
49% 49%Other exposures to total credit risk exposure 7% 7%
Credit exposures relating to off-balance sheet items
Group and Bank Group and Bank
31 December 31 December
2019 2018
Bonds and guarantees 50,427 40,356
Letters of credit 4,418 2,187
54,845 42,543
Contingencies are disclosed on Note 41
3.1.1b Summary of collaterals held against loans and advances to customers
2019Gross exposure
Impairment
allowance Carrying amount
Fair value of
collateral held
Term loans 211,635 50,296 161,339 304,835
Overdrafts 49,773 22,374 27,399 154,075
261,408 72,670 188,738 458,910
Analysis by security Stage 1 Stage 2 Stage 3 Total
Secured against real estate 5,638 63 22,678 28,379
Secured by shares 53 - 7 60
Cash Collateral 8,467 0 89 8,556
Otherwise secured 102,768 310 98,172 201,250
Unsecured 22,964 0 199 23,163
Total Gross Loan 139,890 373 121,145 261,408
Fair Value of Collateral (164,892) (17,472) (276,548) (458,911)
(Over)/Under collaterization (25,002) (17,098) (155,403) (197,504)
Debt securities exposure to total credit risk exposure
The Group employs a range of policies and practices to mitigate credit risk. The most common of these is accepting collateral for funds
advanced. The Group has internal policies on the acceptability of specific classes of collateral or credit risk mitigation. Upon initial
recognition of loans and advances, the fair value of collateral is based on valuation techniques commonly used for the corresponding
assets. In subsequent periods, the fair value is assessed by reference to market price or indexes of similar assets.
The Group closely monitors collateral held for financial assets considered to be credit- impaired, as it becomes more likely that the
Group will take possession of collateral to mitigate potential credit losses. Financial assets that are credit-impaired and related
collateral held in order to mitigate potential losses are shown below:
The table above shows a worst-case scenario of credit risk exposure to the Group as at 31 December 2019 without taking account of
any collateral held or other credit enhancements attached. For on-balance-sheet assets, the exposures set out above are based on
amounts reported in the statement of financial position.
Although cash and cash equivalents are also subject to impairment requirements of IFRS 9, the identified impairment loss was
immaterial.
73

Polaris Bank Limited
Consolidated and separate financial statements
For the year ended 31 December 2019
Notes to the financial statements
(All amounts in millions of Naira unless otherwise stated)
2018 Gross exposure Impairment
allowance
Carrying amount Fair value of
collateral held
Term loans 243,860 69,599 174,261 345,607
Overdrafts 290,703 124,914 165,789 496,515
534,563 194,513 340,050 842,122
Analysis by security Stage 1 Stage 2 Stage 3 Total
Secured against real estate 3,078 121 27,634 30,833
Secured by shares 31 - 8 39
Cash Collateral 6,469 43 5 6,517
Otherwise secured 73,888 5,897 120,936 200,721
Unsecured 92,358 47 204,048 296,453
Total Gross Loan 175,824 6,108 352,631 534,563
Fair Value of Collateral (317,367) (58,739) (466,017) (842,123)
(Over)/Under collaterization (141,543) (52,631) (113,386) (307,560)
3.1.2 Credit quality of financial assets using external ratings
Group Bank
31 December 31 December
2019 2019
Sovereign ratings
- Nigeria (B+) S&P 3,396 3,396
3,396 3,396
Group Bank
31 December 31 December
2018 2018
Sovereign ratings
- Nigeria (B+) S&P 6,013 6,013
6,013 6,013
Group Bank
31 December 31 December
2019 2019
Counterparties with external credit rating (S&P)
- A+ 426 426
- A 14,790 14,790
- BBB+ 45,269 45,269
- BBB 1,085 1,085
- BB+ 5,009 5,009
- BB 68 68
- B 312 312
- Default 138 138
67,097 67,097
Due from other banks and other financial institutions
The credit quality of financial assets with reference to external ratings has been shown below. This information is provided for balances
due from banks and financial institutions and debt investment securities.
The credit quality of balances due from banks and other financial institutions are assessed by reference to external credit ratings
information about counterparty default rates.
Balances with central bank
The credit quality of balances with central bank are assessed by reference to external credit ratings information about counterparty
default rates.
74

Polaris Bank Limited
Consolidated and separate financial statements
For the year ended 31 December 2019
Notes to the financial statements
(All amounts in millions of Naira unless otherwise stated)
Group Bank
31 December 31 December
2018 2018
Counterparties with external credit rating (S&P)
- A+ 32,779 32,779
- A 39,404 39,404
- A- 3,285 3,285
- BBB+ 763 763
- B+ 518 518
- BB- 52 52
- B 368 368
77,169 77,169
Financial assets held at fair value through profit or loss
Group Bank
31 December 31 December
2019 2019
Sovereign ratings
- Nigeria (B+) S&P 1,264 1,264
1,264 1,264
Group Bank
31 December 31 December
2018 2018
Sovereign ratings
- Nigeria (B+) S&P 57 57
57 57
Investment securities - Debt
Group Bank
31 December 31 December
2019 2019
Sovereign ratings
- Nigeria (B+) S&P 517,071 517,071
517,071 517,071
Group Bank
31 December 31 December
2018 2018
Sovereign ratings
- Nigeria (B+) S&P 531,805 531,805
531,805 531,805
The credit quality of debt investment securities (amortized cost investments) are assessed by reference to external credit ratings
information about counterparty default rates.
75

Polaris Bank Limited
Consolidated and separate financial statements
For the year ended 31 December 2019
Notes to the financial statements
(All amounts in millions of Naira unless otherwise stated)
Assets pledged as collateral
Group Bank
31 December 31 December
2019 2019
Sovereign ratings
- Nigeria (B+) S&P 41,674 41,674
-Other Sovereign Ratings
AA 410 410
42,084 42,084
Group Bank
31 December 31 December
2018 2018
Sovereign ratings
- Nigeria (B+) S&P 50,449 50,449
-Other Sovereign Ratings
AA 323 323
BBB 7,531 7,531
58,303 58,303
Other Assets
Group Bank
31 December 31 December
2019 2019
- Unrated 50,704 50,704
50,704 50,704
Group Bank
31 December 31 December
2018 2018
- Unrated 60,676 60,676
60,676 60,676
Other loans and receivables
Group Bank
31 December 31 December
2019 2019
Sovereign ratings
- Nigeria (B+) S&P 182,594 182,594
182,594 182,594
3.1.3 Credit risk concentration
Concentration risk refers to the risk arising from an uneven distribution of counterparties within a credit portfolio or from concentration
in sectors, geographical locations etc. which poses a potential threat to the solvency of the counterparty.
The Group recognizes that concentration risk may exist among loans, which though may have been prudently underwritten, are
collectively sensitive to the same economic and financial or business development events, such that a negative development affecting
these factors may cause loans to perform as if it were a single, large exposure.
The Group complies fully with all regulatory portfolio concentration limits as determined by the CBN. The Group sets internal
thresholds, which are more conservative than the regulatory limits and this acts as a buffer to ensure compliance. In addition to
regulatory limits, the Group uses risk-based measurement systems to define a variety of concentration thresholds for its credit
portfolio. These include; sectors, geographical locations, strategic business units etc.
The Group employs its management information system in monitoring these limits and remedial actions are set in motion at
determined thresholds other tools employed in measuring risk concentrations include, HHI index and GINI coefficient.
Concentration of credit risk arise from financial instruments that have similar characteristics and are affected similarly by changes in
economic or other conditions. This information has been provided along geographical areas and economic sectors.
76

Polaris Bank Limited
Consolidated and separate financial statements
Notes to the financial statements
For the year ended 31 December 2019
(All amounts in millions of Naira unless otherwise stated)
3. Financial risk management continued
3.1.3i Concentration of risks of financial assets with credit risk exposure
31 December 2019
Credit risk concentration by geography relating to on-balance sheet
Cash and balances with central banks 3,396 - 3,396 3,396 - 3,396 Due from banks and other financial institutions 18,939 43,137 62,076 18,939 43,137 62,076 Financial assets held at fair value through profit or loss 68,966 - 68,966 1,264 - 1,264 Loans and advances to customers: - Term loans 211,635 - 211,635 211,635 - 211,635 - Overdraft 49,773 - 49,773 49,773 - 49,773 Investment securities
- Amortized Cost Investments 517,071 - 517,071 517,071 - 517,071 - Fair value through OCI Investments 17,362 - 17,362 17,362 - 17,362 Asset pledged as collateral - debt securities 42,084 - 42,084 42,084 - 42,084 Other loans and receivables 182,594 - 182,594 182,594 - 182,594 Other assets 46,513 - 46,513 45,956 557 46,513
1,158,333 43,137 1,201,470 1,090,074 43,694 1,133,768
Credit risk concentration by geography relating to off-balance sheet
Bonds and guarantees 50,427 - 50,427 50,427 - 50,427 Letters of credit 4,418 - 4,418 4,418 - 4,418
54,845 - 54,845 54,845 - 54,845
Group BankWithin Nigeria Outside
Nigeria Total
Within Nigeria Outside
Nigeria Total
The following table breaks down the Group’s credit exposure (without taking into account any collateral held or other credit support), as categorised by geographical region as at the reporting
date. For this table, the Group has allocated exposures to regions based on the country of domicile of its counterparties.
77

Polaris Bank Limited
Consolidated and separate financial statements
Notes to the financial statements
For the year ended 31 December 2019
(All amounts in millions of Naira unless otherwise stated)
31 December 2018
Credit risk concentration by geography relating to on-balance sheet
Cash and balances with central banks 6,013 - 6,013 6,013 - 6,013 Due from banks and other financial institutions 21,621 47,345 68,966 21,621 47,345 68,966 Financial assets held at fair value through profit or loss 57 - 57 57 - 57 Loans and advances to customers: - Term loans 243,860 - 243,860 243,860 - 243,860 - Overdraft 290,703 - 290,703 290,703 - 290,703 Investment securities - Amortized Cost Investments 531,805 - 531,805 531,805 - 531,805 - Fair value through OCI Investments 14,634 14,634 14,634 - 14,634 Asset pledged as collateral - debt securities 58,303 - 58,303 58,303 - 58,303 Other assets 52,079 52,079 52,864 - 52,864
1,219,075 47,345 1,266,420 1,219,860 47,345 1,267,205
Credit risk concentration by geography relating to off-balance sheet
Bonds and guarantees 40,356 10,071 50,427 40,356 - 40,356 Letters of credit 2,187 2,231 4,418 2,187 - 2,187
42,543 12,302 54,845 42,543 - 42,543
Group BankWithin Nigeria Outside
Nigeria Total
Within Nigeria Outside
Nigeria Total
78

Polaris Bank Limited
Consolidated and separate financial statements
Notes to the financial statements
For the year ended 31 December 2019
(All amounts in millions of Naira unless otherwise stated)
3.1.3ii. Industry sectors
Credit risk concentrations by industry relating to on-balance sheet items
Group and Bank
31 December 2019
SectorGeneral Commerce - - - 7,944 517,071 - - - 525,015 Manufacturing - - - 21,961 - - - - 21,961 Oil & Gas - - - 41,607 - - - - 41,607 Retail - - - 20,253 - - - - 20,253 Services - 62,076 - 96,973 - 14,474 - 8,815 182,338 Public Sector 3,396 - 68,966 - - 29,900 182,594 37,697 322,553
Total 3,396 62,076 68,966 188,738 517,071 44,374 182,594 46,512 1,113,727
Credit risk concentrations by industry relating to off-balance sheet items
Group and Bank
31 December 2019
General Commerce 13,707 76 13,783 13,707 - 13,707
Manufacturing 18,067 4,327 22,394 18,067 4,347 22,414
Oil & Gas 3,037 - 3,037 3,037 - 3,037
Retail - - - - - -
Services 15,615 15 15,630 15,615 72 15,687
Total 50,426 4,418 54,844 50,426 4,419 54,845
BankBonds and
guarantees
Letters of
creditTotal
Bonds and
guarantees
Letters of
creditTotal
Balances held
with Central
Bank
Due from banks
and other
financial
institutions
Financial assets
measured
through FVTPL
Loans and
advances to
customers
Financial assets
measured at
amortized cost
Asset pledged
as collateral -
debt securities
Other assets TotalOther loans and
receivables
The following table breaks down the Group’s credit exposure at gross amounts (without taking into account any collateral held or other credit support), as categorised by the Bank's defined industry sector.
Group
79

Polaris Bank Limited
Consolidated and separate financial statements
Notes to the financial statements
For the year ended 31 December 2019
(All amounts in millions of Naira unless otherwise stated)
Credit risk concentrations by industry relating to on-balance sheet items
Group and Bank
31 December 2018
SectorGeneral Commerce - - - 10,265 239 - - 10,504 Manufacturing - - - 31,507 - - - 31,507 Oil & Gas - - - 365,900 - - - 365,900 Retail - - - 6,478 - - - 6,478 Services - 68,966 - 120,082 - 7,531 52,079 248,658 Public Sector 6,013 - 57 - 531,566 50,772 - 588,408
- - - - - - - -
Total 6,013 68,966 57 534,232 531,805 58,303 52,079 1,251,455
Credit risk concentrations by industry relating to off-balance sheet items
Group and Bank
31 December 2018
General Commerce 2,727 1,857 4,584 2,727 1,857 4,584
Manufacturing 16,624 172 16,796 16,624 172 16,796
Oil & Gas 14,292 - 14,292 14,292 - 14,292
Retail - - - - - -
Services 6,713 159 6,872 6,713 159 6,872
Total 40,356 2,188 42,544 40,356 2,188 42,544
Group Bank
Financial assets
measured
through FVTPL
Bonds and
guarantees
Letters of
creditTotal
Bonds and
guarantees
Letters of
creditTotal
Balances held
with Central
Bank
Due from banks
and other
financial
institutions
Loans and
advances to
customers
Financial assets
measured at
amortized cost
Asset pledged
as collateral -
debt securities
Other assets Total
80

Polaris Bank Limited
Consolidated and separate financial statements
Notes to the financial statements
For the year ended 31 December 2019
(All amounts in millions of Naira unless otherwise stated)
3.1.3.iii Credit risk concentration by geography of loans and advances to customers by products
31 December 2019
Term loans 161,339 - 161,339 161,339 - 161,339 Overdrafts 27,399 - 27,399 27,399 - 27,399
188,738 - 188,738 188,738 - 188,738
Categorization of Loans and advancesThe table below analyses the Group's Loans and advances based on the categorization by Performance of the Loans and the allowances taken on them
31 December 2019
Term loanStage 1 127,571 2,731 127,571 2,731Stage 2 241 11 241 11Stage 3 83,823 47,554 83,823 47,554
211,635 50,296 211,635 50,296
OverdraftStage 1 13,342 442 13,342 442Stage 2 128 29 128 29Stage 3 36,303 21,903 36,303 21,903
49,773 22,374 49,773 22,374
261,408 72,670 261,408 72,670
EXPOSURE ECL EXPOSURE ECL
Group BankWithin Nigeria Outside
Nigeria TotalWithin Nigeria Outside
Nigeria Total
Group Bank
81

Polaris Bank Limited
Consolidated and separate financial statements
Notes to the financial statements
For the year ended 31 December 2019
(All amounts in millions of Naira unless otherwise stated)
31 December 2018
Term loans 243,860 - 243,860 243,860 - 243,860 Overdrafts 290,703 - 290,703 290,703 - 290,703
534,563 - 534,563 534,563 - 534,563
Categorization of Loans and advancesThe table below analyses the Group's Loans and advances based on the categorization by Performance of the Loans and the allowances taken on them
31 December 2018
Term loanStage 1 163,793 14,730 163,793 14,730Stage 2 5,709 2,817 5,709 2,817Stage 3 59,692 44,757 59,692 44,757
229,194 62,304 229,194 62,304Overdraft
Stage 1 12,139 790 12,139 790Stage 2 399 157 399 157
Stage 3 292,831 131,262 292,831 131,262305,369 132,209 305,369 132,209
534,563 194,513 534,563 194,513
3.1.3iv. Disclosures of various factors that impact the ECL as at 31 December 2019
These factors revolves around:
iii Application of varying haircut to underlying collateral and further discounting with their respective EIR
iii
The various assumptions under the different scenarios are as presented below
Scenario Period 1 Period 2 Period 3 Period 4GDP growth rate (%) Upturn 2.4% 3.02% 3.98% 4.05%
Base 2.3% 2.55% 3.30% 3.20%
Downturn 1.1% 2.10% 2.60% 2.35%
Base Upside Downside
50% 25% 25%
Application of varying forward looking information in relation to underlying macroeconomic assumptions and the degree of responsiveness of the Obligors to the assumptions at different degree of Normal,
Downturn and upturn scenarios.
The key drivers for credit risk for the bank is the GDP growth rate.
Predicted relationships between the key indicators and default and loss rates on various portfolios of financial assets have been developed based on analysing historical data over 4 years.
The weightings assigned to each economic scenario during the period were as follows;
Discounting of the expected future cashflows from individual Obligors with respective effective interest rate (EIR) on the set future dates to present value.
BankEXPOSURE ECL EXPOSURE ECL
Group
Group BankWithin Nigeria Outside
Nigeria TotalWithin Nigeria Outside
Nigeria Total
82

Polaris Bank Limited
Consolidated and separate financial statements
Notes to the financial statements
For the year ended 31 December 2019
(All amounts in millions of Naira unless otherwise stated)
3.1.4
Loans and advances to customers
a
Impairment
on stage 1-
12 months
ECL
Impairment
on stage 2-
Lifetime ECL
Not Credit
Impaired
Impairment
on stage 3 -
Lifetime ECL
Credit
Impaired
Total
Gross carrying amount as at 1 January 2019 175,825 6,107 352,631 534,563
Transfer from Stage 1 to Stage 2 (7,791) 7,791 - -
Transfer from Stage 1 to Stage 3 (3,654) - 3,654 -
Write-offs - - (252,168) (252,168)
FX and other movements (23,467) (13,529) 16,009 (20,987)
Total Gross 140,913 369 120,126 261,408
Loss Allowance as at 1 January 2019 15,519 2,975 176,019 194,513
Write-offs - - (726) (726)
Net movement (12,346) (2,934) (105,836) (121,116)
Total Allowance 3,172 41 69,457 72,670
Impairment
on stage 1-
12 months
ECL
Impairment
on stage 2-
Lifetime ECL
Not Credit
Impaired
Impairment
on stage 3 -
Lifetime ECL
Credit
Impaired
Total
Gross carrying amount as at 21 September 2018 205,063 3,914 733,605 942,582
Transfer from Stage 1 to Stage 2 (2,193) 2,193 - (0)
Transfer from Stage 1 to Stage 3 (27,045) - 27,045 0
Write-offs - - (435,155) (435,155)
FX and other movements - - 27,136 27,136
Total Gross 175,825 6,107 352,631 534,563
Loss Allowance as at 21 September 2018 8,015 238 594,593 602,846
Write-offs - - (435,155) (435,155)
Net movement 7,504 2,737 16,581 26,822
Total Allowance 15,519 2,975 176,019 194,513
Group & BankReconciliation of Gross loans and advances
83

Polaris Bank Limited
Consolidated and separate financial statements
Notes to the financial statements
For the year ended 31 December 2019
(All amounts in millions of Naira unless otherwise stated)
b Investment Securities
Impairment
on stage 1-
12 months
ECL
Impairment
on stage 2-
Lifetime ECL
Not Credit
Impaired
Impairment
on stage 3 -
Lifetime ECL
Credit
Impaired
Total
Gross carrying amount as at 1 January 2019 531,805 - 531,805
New financial assets originated or purchased (12,743) - (12,743)
Total Gross Amortised cost Investments 519,062 - - 519,062
Loss Allowance as at 1 January 2019 1,949 1,949
Charge for the year 41 41
1,990 - - 1,990
Assets pledged as collaterals
Gross carrying amount as at 1 January 2019 58,303 - 58,303
Financial assets that have been derecognised (16,219) (16,219)
Total Gross 42,084 - - 42,084
Loss Allowance as at 1 January 2019 41 - - 41
Impairment write-back (41) - - (41)
- - - -
Impairment
on stage 1-
12 months
ECL
Impairment
on stage 2-
Lifetime ECL
Not Credit
Impaired
Impairment
on stage 3 -
Lifetime ECL
Credit
Impaired
Total
Gross carrying amount as at 21 September 2018 925,572 - - 925,572
New financial assets originated or purchased (393,767) - - (393,767)
Total Gross Amortised cost Investments 531,805 - - 531,805
Loss Allowance as at 21 September 2018 1,575 - - 1,575
Financials assets that have been de-recognised during the period 374 - - 374
1,949 - - 1,949
Assets pledged as collaterals
Gross carrying amount as at 21 September 2018 58,544 - - 58,544
Financial assets that have been derecognised (241) (241)
Total Gross 58,303 - - 58,303
Loss Allowance as at 21 September 2018 24 - - 24
New financial assets originated or purchased 17 - - 17
41 - - 41
The loss allowance recognised in the period is impacted by a variety of factors, as described below:
• Transfers between Stage 1 and Stages 2 or 3 due to financial instruments experiencing significant increases (or decreases) of
credit risk or becoming credit-impaired in the period, and the consequent 'step up' between 12-month and Lifetime ECL;
• Impact on the measurement of ECL due to changes in PDs, EADs and LGDs in the period, arising from regular refreshing of inputs
to models;
• Financial assets derecognised during the period and write-offs of allowances related to assets that were written off during the
period.
Group & Bank
Reconciliation of Investment securities- Amortised Costs &
Assets pledged as collaterals
Reconciliation of Investment securities- Amortised Costs &
Assets pledged as collaterals
84

Polaris Bank Limited
Consolidated and separate financial statements
Notes to the financial statements
For the year ended 31 December 2019
(All amounts in millions of Naira unless otherwise stated)
3.1.5 Sensitivity analysis
a Sensitivity of expected credit loss - probability at default (PD)
31 December 31 December
2019 2018
Pre tax Pre tax
Increase 5,704 755
Decrease (6,149) (761)
(445) (6)
b Sensitivity of expected credit loss - loss given default (LGD)
31 December 31 December
2019 2018
Pre tax Pre tax
Increase 538 9,724
Decrease (538) (9,724)
- - c Sensitivity of expected credit loss- GDP Growth rate
31 December 31 December
2019 2018
Pre tax Pre tax
Increase (4) 82
Decrease 4 (82)
- -
Group & Bank
The Group carried out the following activities in assessing the sensitivity of the Group’s profit to fluctuations in the probability of
default.
The determination of the group's probability of default (PD) is explained in the financial risk management - credit risk measurement
section.
As at 31 December 2019, if the probability of default increased or decreased by 0.5%, with all other variables (exposure at default
and loss given default) held constant, the impact on impairment charge, which ultimately affects loss before tax and exposure at
default, would have been as set out in the tables below:
The Group in assessing the sensitivity of the Group’s profit to fluctuations in the loss given default, assumed a 0.5% change in the
loss given default. The chosen change in the loss given default was then applied to the bank's loan portfolio as at end of the year.
The determination of the group's loss given default (LGD) is explained in the financial risk management - credit risk measurement
section.
As at 31 December 2019, if the loss given default increased or decreased by five percept, with all other variables (exposure at
default, probability of default) held constant, the impact on impairment charge, which ultimately affects loss before tax and
exposure at default, would have been as set out in the tables below:
Group & Bank
Group & Bank
The most significant assumptions affecting the ECL allowance are the following; probability of default, loss given default and macro-
economic variables. Therefore changes to these key variables would directly impact the exposure at default as at reporting date.
The Group in assessing the sensitivity of the Group's profit to fluctuation in GDP growth rate, assumed a 0.5% change in the GDP
growth rate. The chosen change in this macro-economic variable was then applied to the bank's loan portfolio as at the end of year.
The determination of the group's macro-economic variable is explained in the financial risk management- credit risk measurement
section.
85

Polaris Bank Limited
Consolidated and separate financial statements
For the year ended 31 December 2019
Notes to the financial statements
(All amounts in millions of Naira unless otherwise stated)
3. Financial risk management continued
3.1.6 Debt securities
The table below shows analysis of the Gross debt securities into the different classifications:
31 December
2019
Financial assets
held at fair value
through profit or
loss
Financial
assets held at
Amortised cost
Assets pledged
as collateral
Total Financial
assets held at
fair value
through profit
or loss
Financial
assets held at
Amortised cost
Assets pledged
as collateral
Total
Federal government bonds - 56,984 14,064 71,048 - 56,984 14,064 71,048
State government bonds - 9,114 410 9,524 - 9,114 410 9,524
Corporate bonds - 1,674 - 1,674 - 1,674 - 1,674
Treasury bills 1,264 449,366 27,610 478,240 1,264 449,366 27,610 478,240
Eurobond - 1,923 - 1,923 - 1,923 - 1,923
1,264 519,061 42,084 562,409 1,264 519,061 42,084 562,409
31 December
2018
Financial assets
held at fair value
through profit or
loss
Financial
assets held at
Amortised cost
Assets pledged
as collateral
Total Financial
assets held at
fair value
through profit
or loss
Financial
assets held at
Amortised cost
Assets pledged
as collateral
Total
Federal government bonds - 34,762 25,992 60,754 - 34,762 25,992 60,754
State government bonds - 16,426 323 16,749 - 16,426 323.00 16,749
Corporate bonds - 1,814 - 1,814 - 1,814 - 1,814
Treasury bills 57 480,752 24,457 505,266 57 480,752 24,457 505,266
Eurobond - - 7,531 7,531 - - 7,531 7,531
57 533,754 58,303 592,114 57 533,754 58,303 592,114
Group Bank
Group Bank
The Group and Bank's investment in risk-free Government securities constitutes 99% of debt instruments portfolio. Investment in corporate and eurobonds accounts for the outstanding 1%.
86

Polaris Bank Limited
Consolidated and separate financial statements
For the year ended 31 December 2019
Notes to the financial statements
(All amounts in millions of Naira unless otherwise stated)
3.2 Liquidity risk
Liquidity risk management process
31 December 31 December
2019 2018
At 31 December % %
Average for the year 82 58
Maximum for the year 89 77
Minimum for the year 79 17
Polaris bank contingency funding plan
Liquidity risk is the risk that the Group does not have sufficient resources to meet its obligations when they fall due or will
have to meet such obligations at an excessive cost. This may be as a result of high cash outflows such as huge customer
withdrawals, cash requirements from contractual commitments, debt maturities that would deplete available cash
resources for client lending, trading activities and investments. Liquidity risks are categorized into funding liquidity risk –
inability to meet financial obligation as they fall due and market liquidity risk – inability to liquidate financial asset at a fair
market price.
The measure of the Group’s liquidity is the ratio of its liquid assets to total customer deposits. Liquidity management is
operated in a centralized governance control process that covers the entire Group’s liquidity risk management activities.
This is an oversight responsibility of the Asset and Liability Committee (ALCO), discharged through the Market and Liquidity
Risk management function. The Market and Liquidity Risk team monitors the inherent risk and threats to the bank's
immediate and future liquidity conditions, engaging stress testing under normal and severe market scenario as a tool. On
the other hand, Treasury Group ensure adequate funding over with sizeable buffer over regulatory minimum on a
continuous and sustainable basis. The market risk team, which ensures compliance to the board-approved liquidity
management policy, is independent of the funding function.
Details of the reported Bank ratio of net liquid assets to deposits from customers at the reporting date and during the year
were as follows:
Polaris Bank Contingency Funding Plan (CFP) serves as a way-out strategy under stress liquidity situations. The plan
consists of a set of policies and procedures that shall serve as blue print for the Bank to meet its funding needs in a timely
manner under adverse stress conditions. For effectiveness, this plan shall represent estimate of balance sheet changes that
may result from a liquidity, credit and/or market events.
The MD/CEO or the ALCO Chairman are the only persons authorized to activate the CFP. Execution of the Plan involves
funding and non-funding activities.
In the event of a liquidity squeeze, the Bank possesses a Crisis Management Committee that is comprised of heads of
departments of critical departments and is headed by the MD/CEO.
In ensuring adequate liquidity at all times, the Group maintains sizeable portfolio of highly marketable securities (mostly
government papers) that can be easily liquidated as protection against any unforeseen interruption to cash flow and
funding obligations. The liquid assets held for managing liquidity risk comprise of:
• Cash and balances with the Central Bank;
• Government Bonds and Treasury Bills
• Highly liquid instruments in the Group’s trading portfolio.
The Group’s liquidity related behaviour is strictly guided by the Board approved liquidity management policy. The policy
defines specific limit that will ensure adequate liquidity position at all times. Maturity re-pricing schedules, projected
liquidity position as well as stress tested liquidity outlook are generated weekly by the Liquidity Risk team for ALCO’s
decision making.
Funding sources are reviewed regularly by the Liquidity Risk Management team to ensure adequate funding diversification
by currency, geography, provider, product and term to maturity. Contingency funding arrangements are also in place as
way-out strategies in the unlikely condition of bank specific liquidity stress / local or global systemic liquidity shocks.
87

Polaris Bank Limited
Consolidated and separate financial statements
For the year ended 31 December 2019
Notes to the financial statements
(All amounts in millions of Naira unless otherwise stated)
3.2 Liquidity Risk
3.2.1 Liquidity Risk Measurement
• Cash and balances with the Central Bank;
• Government Bonds and Treasury Bills
• Highly liquid instruments in the Group’s trading portfolio
• Short term liabilities include local currency deposits from customers.
Assets & Liability Mix 31 December 31 December
2019 2018
Asset components % Proportion % Proportion % Proportion
Cash 4% 26,484 5% 28,026
Cash reserve 6% 37,698 6% 37,446
Treasury bills 77% 450,630 80% 480,809
FGN bonds & other certificates 10% 56,984 6% 34,762
Placements 3% 17,000 3% 19,700
Total 100 588,796 100 600,743
Liability components % Proportion % Proportion % Proportion
Current deposits 31% 265,045 32% 279,819
Savings deposits 20% 167,679 18% 154,536
Term deposits 34% 294,457 35% 303,913
Domiciliary deposits 15% 130,704 15% 122,776
Total 100 857,885 100 861,044
The measure of the Group’s liquidity is the ratio of its liquid assets to total customer deposits.
The liquid assets held for managing liquidity risk comprise:
88

Polaris Bank Limited
Consolidated and separate financial statements
For the year ended 31 December 2019
Notes to the financial statements
(All amounts in millions of Naira unless otherwise stated)
3. Liquidity Risk Measurement continued
3.2.2 Contractual maturity of financial assets and liabilities
Gross nominal (undiscounted) maturities of financial assets and liabilities
Group and Bank
31 December 2019
Carrying
amount
Gross nominal
inflow/(outflow)
Less than 90
days
91 - 180 days 181 - 365
days
Over 1 year
but less than
5 years
Over 5 years
Financial assets
Cash and balances with central banks 26,484 26,484 26,484 - - - -
Due from banks and other financial institutions 62,076 62,076 62,076 - - - -
Financial assets held at fair value through profit or loss 1,264 1,264 1,264 - - - -
Loans and advances to customers 188,738 261,408 66,669 2,768 3,662 52,338 135,971
Fair value through OCI 17,362 17,362 - - - - 17,362
Amortised Cost financial assets 517,071 840,497 74,105 60,497 581,847 23,280 100,768
Assets pledged as collateral 42,084 44,375 1,653 195 12,863 3,751 25,913
Other loans and receivables 182,594 210,676 - - 210,676 - -
Other assets 46,513 50,004 50,004 - - - -
1,084,186 1,514,146 282,255 63,460 809,048 79,369 280,014
Financial liabilities
Deposits from customers 857,885 857,885 563,428 294,457 - - -
Borrowings from local and foreign institutions 100,920 101,932 8,382 - 4,054 12,027 77,469
Lease liability 2,645 5,080 - - - 313 4,767
Other financial liabilities 76,837 76,837 76,837 - - - -
1,038,287 1,041,734 648,647 294,457 4,054 12,340 82,236
Gap (asset - liabilities) 45,899 472,412 (366,392) (230,997) 804,994 67,029 197,778
Cumulative liquidity gap - - (366,392) (597,388) 207,606 274,634 472,412
The following tables show the undiscounted cashflows on the Group's financial assets and liabilities and on the basis of their earliest possible contractual maturity. The gross nominal
inflow /(outflow) disclosed in the table is the contractual, undiscounted cash flow on the financial assets and liabilities:
89

Polaris Bank Limited
Consolidated and separate financial statements
For the year ended 31 December 2019
Notes to the financial statements
(All amounts in millions of Naira unless otherwise stated)
3.2.2 Contractual maturity of financial assets and liabilities (Continued)
Group and Bank
31 December 2018
Carrying
amount
Gross nominal
inflow/(outflow)
Less than 90
days
91 - 180 days 181 - 365
days
Over 1 year
but less than
5 years
Over 5 years
Financial assets
Cash and balances with central banks 28,026 28,026 28,026 - - - -
Due from banks and other financial institutions 68,966 68,966 68,966 - - - -
Financial assets held at fair value through profit or loss 57 57 57 - - - -
Loans and advances to customers 340,050 757,767 114,029 5,167 40,221 59,429 538,921
Fair value through OCI 14,634 14,634 - - - - 14,634
Amortised Cost financial assets 531,805 639,979 97,150 1,768 438,879 15,040 87,142
Assets pledged as collateral 58,303 98,024 3,651 430 28,415 8,286 57,242
Other assets 52,079 52,079 52,079
1,093,920 1,659,532 363,958 7,365 507,515 82,755 697,939
Financial liabilities
Due to other financial institutions 25 25 25 - - - -
Deposits from customers 861,044 861,194 845,161 7,019 9,014 - -
Borrowings from local and foreign institutions 137,694 135,726 200 3,643 39,394 11,695 80,794
Other financial liabilities 73,696 73,696 73,696
1,072,459 1,070,641 919,082 10,662 48,408 11,695 80,794
Gap (asset - liabilities) 21,461 588,891 (555,124) (3,297) 459,107 71,060 617,146
Cumulative liquidity gap - - (555,124) (558,421) (99,314) (28,254) 588,892
90
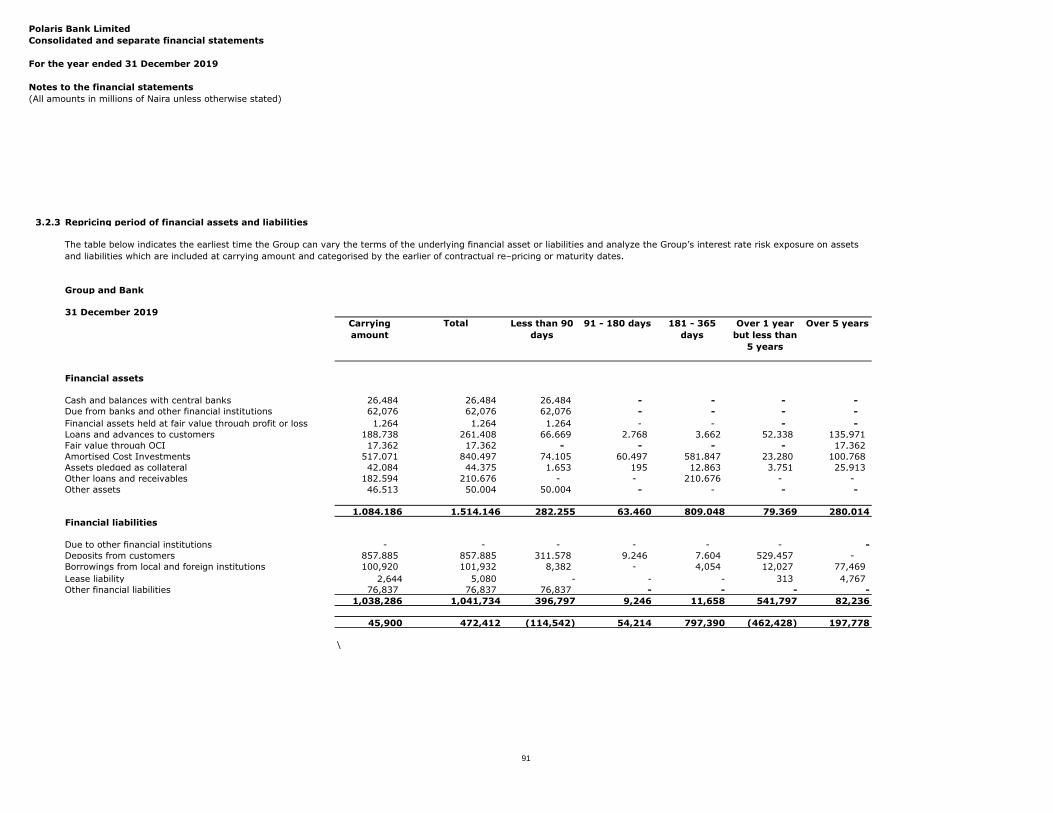
Polaris Bank Limited
Consolidated and separate financial statements
For the year ended 31 December 2019
Notes to the financial statements
(All amounts in millions of Naira unless otherwise stated)
3.2.3 Repricing period of financial assets and liabilities
Group and Bank
31 December 2019
Carrying
amount
Total Less than 90
days
91 - 180 days 181 - 365
days
Over 1 year
but less than
5 years
Over 5 years
Financial assets
Cash and balances with central banks 26,484 26,484 26,484 - - - -
Due from banks and other financial institutions 62,076 62,076 62,076 - - - -
Financial assets held at fair value through profit or loss 1,264 1,264 1,264 - - - -
Loans and advances to customers 188,738 261,408 66,669 2,768 3,662 52,338 135,971
Fair value through OCI 17,362 17,362 - - - - 17,362
Amortised Cost Investments 517,071 840,497 74,105 60,497 581,847 23,280 100,768
Assets pledged as collateral 42,084 44,375 1,653 195 12,863 3,751 25,913
Other loans and receivables 182,594 210,676 - - 210,676 - -
Other assets 46,513 50,004 50,004 - - - -
1,084,186 1,514,146 282,255 63,460 809,048 79,369 280,014
Financial liabilities
Due to other financial institutions - - - - - - -
Deposits from customers 857,885 857,885 311,578 9,246 7,604 529,457 -
Borrowings from local and foreign institutions 100,920 101,932 8,382 - 4,054 12,027 77,469
Lease liability 2,644 5,080 - - - 313 4,767
Other financial liabilities 76,837 76,837 76,837 - - - -
1,038,286 1,041,734 396,797 9,246 11,658 541,797 82,236
45,900 472,412 (114,542) 54,214 797,390 (462,428) 197,778
\
The table below indicates the earliest time the Group can vary the terms of the underlying financial asset or liabilities and analyze the Group’s interest rate risk exposure on assets
and liabilities which are included at carrying amount and categorised by the earlier of contractual re–pricing or maturity dates.
91

Polaris Bank Limited
Consolidated and separate financial statements
For the year ended 31 December 2019
Notes to the financial statements
(All amounts in millions of Naira unless otherwise stated)
3.2.3 Repricing period of financial assets and liabilities (Continued)
Group and Bank
31 December 2018
Carrying
amount
Total Less than 90
days
91 - 180 days 181 - 365
days
Over 1 year
but less than
5 years
Over 5 years
Financial assets
Cash and balances with central banks 28,026 28,026 28,026 - - - -
Due from banks and other financial institutions 68,966 68,966 68,966 - - - -
Financial assets held at fair value through profit or loss 57 57 57 - - - -
Loans and advances to customers 340,050 340,050 63,061 7,666 28,749 98,802 141,772
Fair value through OCI 14,634 14,634 - - - - 14,634
Amortised Cost Investments 531,805 531,805 94,368 100,095 296,297 5,613 35,431
Assets pledged as collateral 58,262 58,262 2,299 23,765 5,972 26,226
Other assets 52,079 52,079 52,079 - - - -
1,093,879 1,093,879 308,856 107,761 348,812 110,387 218,064
Financial liabilities
Due to other financial institutions 25 25 25 - - - -
Deposits from customers 861,044 861,044 845,161 7,019 8,864 0 0
Borrowings from local and foreign institutions 137,694 137,694 200 3,643 39,394 13,663.05 80,794
Other financial liabilities 97,076 66,751 66,751 - - - -
1,095,839 1,065,514 912,137 10,662 48,258 13,663 80,794
(1,960) 28,365 (603,281) 97,099 300,553 96,723 137,270
92

Polaris Bank Limited
Consolidated and separate financial statements
For the year ended 31 December 2019
Notes to the financial statements
(All amounts in millions of Naira unless otherwise stated)
3.3 Market risk
Market Risk Management Framework Overview
The Bank has developed encompassing processes for effective identification, assessment, monitoring and control of market risks
inherent in its business which is supported by enabling technology, policies/methodologies and tools. Market risk exposure
assessment is a periodic activity guided by Board approved policies and risk limits within which all exposures are contained. The
guiding policies and limits are reviewed periodically to ensure continuous relevance to the fast changing conditions of the
increasingly dynamic market place.
Market risk is the risk of loss in on or off balance sheet positions, as a result of adverse movement in foreign exchange rate,
interest rate, equity or commodity prices. Polaris Bank’s market risk exposures are largely interest and exchange rate induced,
while equity and commodity prices exposures are non-proprietary. Its Market Risk management is a centralized, independent
middle office function responsible for the day to day management which entails risk identification, measurement, monitoring
controlling and reporting.
The Bank has developed encompassing processes for effective identification, assessment, monitoring and control of market risks
inherent in the Bank’s business operations. Its risk management framework is supported by enabling policies/methodologies and
tools to facilitate linkages and to achieve its risk management objectives including market risk related ones.
The market risk management strategy clearly articulates underlining principles that drives the design and implementation of its
exposure management processes, which seek to contain such exposures within a set Board appetite, guided by operational policies.
The independent Market and Liquidity risk function reports daily to the Chief Risk Officer, weekly to Asset-Liability Committee and
quarterly to both the Management and the Board Risk Committees.
Market Risk Measurement:
Adequate risk assessment is critical for effective management. The Bank applies the Value at Risk (VaR) model to measure trading
market risk exposure of the entire trading portfolio. The VaR model runs largely on the variance co-variance method of
computation but is also complemented by historical simulation as well as Expected Shortfall methodologies where key assumption
of the former method prove unsatisfactory. The model (variance co-variance), stated at 99% confidence level over a day horizon,
applies the Exponential Weighted Moving Average (EWMA) model for volatility assessment thereby enhancing the speed of
response to changes in market factors.
Value at risk assessment is undertaken at the portfolio level, which takes cognizance of the risk-reduction benefit of asset returns
correlation. All the model outputs are back tested for accuracy, reliability and predictive power assessment. In addition, periodic
stress tests are also conducted to estimate potential losses in severe market conditions by stressing risk drivers within and
sometimes beyond historically observed levels.
The integrity of the VAR model is validated via back-testing model over a reasonable period (minimum of 250 days). Although a
valuable guide to risk, VAR is always viewed in the context of its limitations i.e.
• The use of historical data as a proxy for estimating future events may not be reflective of the growing complexities and changes
in the interactions of market drivers.
• The holding period assumption may also be flawed particularly in times of market illiquidity when it takes much longer to liquidate
positions
• The likely size of losses under the permissible 1% violation is not stated, which might exceed the Bank’s loss threshold
In adjusting for these limitations, the Bank has, in addition to stress testing, adopted the expected shortfall model, to gain a
statistical sense of the likely size of the extreme loss events. VaR is also assessed at 99% confidence interval and a 10-day holding
period as additional stress factor.
The Group’s market risk management framework clearly articulates underlining principles that drives the design and
implementation of its market risk exposure management process, which seeks to contain such exposures within its market risk
appetite.
93

Polaris Bank Limited
Consolidated and separate financial statements
For the year ended 31 December 2019
Notes to the financial statements
(All amounts in millions of Naira unless otherwise stated)
Market Risk Management Framework Overview
RISK
SOURCES
MR DATA
REPOSITORY
INTERNAL AND EXTERNAL
REPORTING
LIMIT MANAGEMENT
ECONOMIC CAPITAL CHARGE
REGULATORY CAPITAL CHARGE
MARKET RISK MANAGEMENT FRAMEWORK
PROCESSES STRUCTURE CULTURE STRATEGY
RISK
IDENTIFICATION
RISK
CONTROL
RISK
FINANCING
RIS
K A
PP
ET
ITE
INTERNAL DATA SOURCE
EXTERNAL DATASOURCE
COMPLIANCE
INTERNAL AUDIT
RISK
ASSESSMENTS
MARKET RISK DATA REFERENCE DATA
RISK
MEASUREMENTPORTFOLIO
VALUATION
PEOPLE PROCESSES SYSTEMS
TRADING MANDATE
STANDARDISED/
INTERNAL BASED
APPROACH
RIS
K A
PP
ET
ITE
94

Polaris Bank Limited
Consolidated and separate financial statements
For the year ended 31 December 2019
Notes to the financial statements
(All amounts in millions of Naira unless otherwise stated)
3. Financial risk management continued
3.3 Market risk
3.3.1 Market risk measurement techniques
Exposure to market risks - trading portfolios
a Exposure to Interest rate risk
FX Trading Activities: - The Bank currency trading activity is limited to trading Naira/USD currency pair throughout the financial year.
Volatility levels spiked in the year on the back of sustained pressure on the local currency, interventions and continuous changes in the
markets operational policies . Trading activities in USD/NGN currency pair recorded the highest VaR figure (99% confidence interval one
day horizon) of 0.85% of the position size, minimum of 0.16% and average of 0.46%.
The integrity of the VAR model is validated via back-testing model over a reasonable period. Although a valuable guide to risk, VAR is
always viewed in the context of its limitations i.e.
• The use of historical data as a proxy for estimating future events may not be reflective of the growing complexities and changes in the
interactions of market drivers.
• The holding period assumption may also be flawed particularly in times of market illiquidity when it takes much longer to liquidate
positions
• The likely size of losses under the permissible 1% violation is not stated, which might exceed the bank’s loss threshold
In adjusting for these limitations, the Group has, in addition to stress testing, adopted the expected shortfall model, to gain a statistical
sense of the likely size of the extreme loss events. VaR is also assessed at 99% confidence interval and a 10-day holding period as
additional stress factor.
Typically, the bank trades in the following financial instruments:
1. Treasury bills
2. Bonds
3. Foreign currencies
4. Money market products
The principal risk to which the bank's non trading portfolios are exposed to , is the risk of loss from fluctuations in the future cash flows
or fair values of financial instruments because of change in market interest rates. Interest rate risk is managed principally using interest
rate gaps. Below are some of the key variables used in quantifying, monitoring, controlling and reporting market risk exposure (traded
and non traded) across the group:
• Open position assessment: - for trading and currency risk exposures.
• Value at Risk model (VaR) - for trading and currency risk exposures
• Expected shortfall - for trading and currency risk exposures
• Interest and exchange rate sensitivity - For balance sheet level interest and exchange rate exposures assessment
• Stress testing - Both trading and non-trading exposures.
The Group applies a Value at Risk (VAR) methodology to its trading portfolios (including assets and liabilities that are designated at fair
value) to estimate the market risk exposures of open positions.
VAR is a statistically based estimate of the potential loss on the current portfolio from adverse market movements. It expresses the
‘maximum’ amount the Group might lose, at certain level of confidence (often 99%) given a time horizon (usually 1 day). There is
therefore a specified statistical probability (1%) that actual loss may be greater than the VAR estimate. The VAR model assumes a
certain ‘holding period’ until positions can be closed (1 day). The likely estimate of the size of 1% expected violation of the VaR number
is accessed via stress testing. VaR also assumes that market moves occurring over this holding period will follow a similar pattern to
those that have occurred in the past.
Traded Instruments: The instruments the bank's trade in are strictly provided for in the trading policy which include: Federal
Government securities and foreign currencies. The policy also clarifies requirements for trading in new products as well as position and
loss limits at dealers and product levels.
FGN BOND TRADING: The portfolio consists of eight(8) actively traded instruments with maturities ranging from 2 to 20years. Decline in
price volatile resulted in reduction in risk profile of the portfolio. The Value at risk (VaR), at 99% confidence interval and one day
horizon, as year-end was 1.08% compared that of the preceding year of 7.2%. The maximum VaR recorded was 3.66%, minimum was
0.38% and an average of 1.30%. Relative to other traded instruments, the bond portfolio recorded the lowest risk profile through the
year.
Treasury Bills Trading: Increased volatility at the shorter end of the curve (less than one year) increased the risk profile of the Treasury
Bills portfolio. The portfolio highest VaR (99% confidence interval, 1 day holding period) was 4.40%, lowest at 0.20% and average
1.23% of position size.
95

Polaris Bank Limited
Consolidated and separate financial statements
For the year ended 31 December 2019
Notes to the financial statements
(All amounts in millions of Naira unless otherwise stated)
Period ended 31 December 2019
Treasury bills FX
Maximum 8.15% 0.79%
Minimum 0.31% 0.13%
Average 1.36% 0.33%
Exposure to market risks - non-trading portfolios
Group Group Bank Bank
31 December 31
December
31 December 31 December
2019 2018 2019 2018
Pre tax Pre tax
Decrease
Assets (2,693) (2,210) (2,693) (2,210)
Liabilities 2,817 2,689 2,817 2,689
124 479 124 479
Increase
Assets 2,693 2,210 2,693 2,210
Liabilities (2,817) (2,689) (2,817) (2,689)
(124) (479) (124) (479)
Components of Balance Sheet Interest Rate sensitivity
Group Group Bank Bank
31 December 31
December
31 December 31 December
2019 2018 2019 2018
Pre tax Pre tax Pre tax Pre tax
Decrease
Financial assets
Due from banks and other financial institutions (168) (172) (168) (172)
Loans and advances to customers (435) (496) (435) (496)
Amortised cost financial assets (2,010) (1,485) (2,010) (1,485)
Assets pledged as collateral (80) (56) (80) (56)
(2,693) (2,209) (2,693) (2,209)
Financial liabilities
Deposits from customers 2,817 2,582 2,817 2,582
Borrowings from local and foreign institutions - 108 0 108
2,817 2,690 2,817 2,690
Total 124 481 124 481
The table below shows the result of interest rate sensitivity by applying a change of a 100 basis points. The impact on profit or loss is as
follows:
At 31 December 2019, if interest rates had been 100 basis points higher/lower with all other variables held constant, other components
of equity would have been N 124 million lower for the Bank. Foreign borrowing has been excluded from the analysis as they are not
considered sensitive to local rate changes.
The aggregated figures presented above are further analysed into their various components as shown in the following tables:
Decisions on interest rate direction is the responsibility of the ALCO, who works with the risk team in the day to day monitoring and
forecasting of market directions, based on macro-economic fundamentals, market dynamics and the monetary/fiscal policy objectives.
Interest rate risk exposure is occasioned by timing differences and optionalities in the maturities of assets and liabilities on the banking
book. Trading book exposures on the other hand is due to proprietary positions in rate and price sensitive financial assets in the
secondary market. These exposures are managed independently by the Market Risk Management function via appropriate policies,
procedures and models aided by technology.
Non trading interest rate risk exposures resides on the Group’s balance sheet, resulting from disproportionate impact of interest rate
changes on cash flows arising from asset and liability maturity mismatches leading to volatilities in net interest margin.
VaR ANALYSIS
96

Polaris Bank Limited
Consolidated and separate financial statements
For the year ended 31 December 2019
Notes to the financial statements
(All amounts in millions of Naira unless otherwise stated)
Group Group Bank Bank
31 December 31
December
31 December 31 December
2019 2018 2019 2018
Increase
Financial assets
Due from banks and other financial institutions 168 172 168 172
Loans and advances to customers 435 496 435 496
- Amortised cost financial assets 2,010 1,485 2,010 1,485
Assets pledged as collateral 80 56 80 56
2,693 2,209 2,693 2,209
Financial liabilities
Deposits from customers (2,817) (2,582) (2,817) (2,582)
Borrowings from local and foreign institutions (108) - (108)
Lease liability - - - -
(2,817) (2,690) (2,817) (2,690)
Total (124) (481) (124) (481)
Group Group Bank Bank
31
December
31
December
31
December
31
December
2019 2018 2019 2018
Pre tax Pre tax Pre tax Pre tax
Decrease 10.4 10.3 10.4 10.3
Increase (10.4) (10.3) (10.4) (10.3)
- - - -
b Foreign exchange risk
c Price risk
The group operates internationally and is exposed to foreign exchange risk arising from various currency exposures primarily with
respect to the US dollar, UK pound and Euro. Foreign exchange risk represents exposures to changes in the values of current holdings
and future cash flows denominated in other currencies. The types of instruments exposed to this risk include investments in foreign
subsidiaries, foreign currency-denominated loans and securities, future cash flows in foreign currencies arising from foreign exchange
transactions, foreign currency denominated debt.
In view of the current devaluation of naira, the bank also ensures that currency trading limits are in line with market realities, foreign
currency lending and funding is subject to approvals by top management. In this case the bank makes use of limits and management
action triggers for strict adherence to the Bank’s internal policies and risk appetite. Further, management ensures that repricing of the
assets is in line with market realities.
The Group maintains strict policy guidance for all its foreign currency related activities, and Board approval is required where business
exigencies necessitate currency exposure creation, which must still be contained within permissible threshold and adequately mitigated.
The Group ensures that foreign currencies denominated assets are matched with foreign currency denominated liabilities to reduce
currency risk exposure (exchange exposure gap). Periodic reports on the Group’s foreign currency exposure are rendered up to the
Board level. In line with the Basel II provision, both trading and non-trading currency exposures are treated as trading positions, and
are therefore subject to fair valuation relative to prevailing market exchange rate (mark-to-market).
Cash flow interest rate risk: This risk arises from the timing differences of exposure of interest rate sensitive assets and liabilities to
changes in market interest rates. The Group manages the cash flow interest rate risk by matching floating rate assets to floating rate
liabilities as much as feasible, while residual exposures are actively managed via different market instruments including interest rate
swaps where practicable.
At 31 December 2019, if interest rates on borrowed funds at amortised cost increased or reduced by 50 basis points with all other
variables held constant, the effect on profit or loss would have been as set out below:
To manage its price risk arising from investments in equity securities, the group diversifies its portfolio. Diversification of the portfolio is
done in accordance with the limits set by the group.
The group’s exposure to equity securities price risk arises from investments held by the group and classified in the balance sheet either
as at fair value through other comprehensive income (FVOCI)
97

Polaris Bank Limited
Consolidated and separate financial statements
For the year ended 31 December 2019
(All amounts in millions of Naira unless otherwise stated)
Price sensitivity analysis for financial instruments measured at FVOCI:
Group Group Bank Bank
31 December 31 December 31 December 31 December
2019 2018 2019 0
Unquoted Equity at FVOCI 17,352 14,634 17,352 14,634
17,352 14,634 17,352 14,634
Impact on Other
comprehensive
income:
Unfavourable change @ 2% decrease in unobservable inputs (120) (101) (120) (101)
Favourable change @ 2% increase in unobservable inputs 71 60 71 60
3. Financial risk management continued
3.3.2 Sensitivity of foreign exchange currencies and impact on profit and equity
Group Group Bank Bank
31 December 31 December 31 December 31 December
2019 2018 2019 2018
Pre tax Pre tax
Dollar
Naira strengthens 1,846 2,666 1,846 2,666
Naira weakens (1,846) (2,666) (1,846) (2,666)
Pounds
Naira strengthens (79) (80) (79) (5)
Naira weakens 79 80 79 5
Euro
Naira strengthens (89) (10) (89) (31)
Naira weakens 89 10 89 31
Equity price risk is the risk that the fair value of equities decreases as a result of changes in the level of equity indices and
individual stocks. The non-trading equity price risk exposure arises from equity securities classified as FVOCI. Sensitivity analysis for
the Group's equity securities is shown below.
The Group carried out the following in determining sensitivity of the Group's profit to fluctuations in exchange rate of foreign
currencies:
- Daily foreign exchange rates were obtained and trended
- A reasonably possible change of +/-N10 was determined based on the distribution of one year daily change in exchange rates.
- The chosen reasonable change in exchange rates was then applied to the bank's foreign currency position as at end of the
period.
At 31 December 2019, a change of +/-N10 against the foreign currency with all other variables held constant, the loss for the year
would have increased/(decreased) as set out in the table below mainly as a result of foreign exchange gains or losses on the
translation.
98

Polaris Bank Limited
Consolidated and separate financial statements
For the period 21 September to 31 December 2018
Notes to the financial statements
(All amounts in millions of Naira unless otherwise stated)
3. Financial risk management continued
The table below summarizes the Group's financial assets and financial liabilities at gross amount, categorised by currency:
Financial instruments by currencyGroup and Bank
31 December 2019Total Naira USD GBP Euro
Financial assets
Cash and balances with central banks 26,484 16,341 7,113 405 2,625 Due from banks and other financial institutions 62,076 18,938 40,588 845 1,705 Financial assets at fair value through profit or loss 1,264 1,264 - - - Loans and advances to customers 188,738 150,249 38,447 - 42 Fair value through OCI investments 29,460 29,460 - - - - Amortised cost investments 514,783 514,783 - - - Assets pledged as collateral 44,374 43,964 410 - - Other loans and receivables 182,594 182,594 - - - Other assets 46,513 46,513 - - -
1,096,286 1,004,106 86,558 1,250 4,372 Financial liabilities
Due to other financial institutions - - - - - Deposits from customers 857,885 800,044 55,209 1,968 664 Borrowings from local and foreign institutions 100,920 77,477 23,443 - - Lease liability 2,644 2,644 - - - Other liabilities 76,837 76,837 - - -
1,038,286 957,002 78,652 1,968 664 Group and Bank
31 December 2018Total Naira USD GBP Euro
Financial assets
Cash and balances with central banks 28,026 26,971 896 84 75Due from banks and other financial institutions 68,966 1,860 64,404 288 2,414Financial assets at fair value through profit or loss 57 57 - - - Loans and advances to customers 340,050 205,045 163,185 - 50 Fair value through OCI investments 17,361 17,361 - - - - Amortised cost investments 531,805 531,805 - - - Assets pledged as collateral 58,303 50,772 7,531 - - Other assets 52,079 52,079 - - -
1,096,647 885,950 236,016 372 2,539 Financial liabilities
Due to other financial institutions 25 25 - - - Deposits from customers 861,044 801,245 57,078 2,035 686 Borrowings from local and foreign institutions 137,694 86,645 51,049 Other liabilities 97,076 97,076 - - -
1,095,839 984,991 108,127 2,035 686
99

Polaris Bank Limited
Consolidated and separate financial statements
For the year ended 31 December 2019
Notes to the financial statements
(All amounts in millions of Naira unless otherwise stated)
4.1 Operational Risk
Insignificant Minor Moderate Major Significant
Certainly Medium Medium High High High
Highly Likely Medium Medium Medium High High
Likely Low Low Medium Medium High
Unlikely Low Low Medium Medium Medium
Highly Unlikely
Low Low Low Medium Medium
Polaris Bank defines Operational risk as the risk of loss resulting from inadequate or failed internal processes, people and systems
or from external events. Reputational risk and strategic risk are, in line with general market convention, excluded from the
definition of operational risk.
Operational risk exists in the natural course of the Bank’s business activity. It is not an objective to eliminate all exposure to
operational risk as this would be neither commercially viable nor indeed possible. The Bank's approach to managing operational risk
is to adopt fit-for-purpose operational risk practices that assist business line management in understanding their inherent risk and
reducing their risk profiles in line with the Bank's risk tolerance, while maximizing their operational performance and efficiency.
The Bank has set minimum requirements for managing operational risk through the Bank’s Risk Management and Governance
standards. These requirements have been fully implemented and embedded across the Bank's operations. In addition to meeting
the Bank minimum standards, the operational risk framework sets out a structured and consistent approach for managing
operational risk across the Bank. The risk management approach involves identifying, assessing, measuring, managing, mitigating,
and monitoring the risks associated with operations, enabling comprehensive analysis and reporting of the Bank's operational risk
profile.
The framework is based on the following core components:
1. Risk Identification and Control Methodology: This facilitates the identification of risks and the management thereof across each
business and operational function.
2. Risk and Control Self-Assessments: Each Strategic Business and Support Unit is required to analyse its business activities and
critical processes to identify the key operational risks to which it is exposed, and assess the adequacy and effectiveness of its
controls. For any area where management concludes that the level of residual risk is beyond an acceptable level, it is required to
define corrective action plans to reduce the level of risk. The assessments are facilitated, monitored and challenged by the
Operational Risk Management Department working hand in hand with Process or Business owners who also double as Risk
Champions to each business.
Risk evaluation involves measuring identified risks based on the probability of a loss event occurring (PE) (that is, likelihood) and
the loss given an event (LGE) (that is, impact) using a 5 X 5 Matrix as shown in the table below:
FrequencySeverity
3. Risk Register
Polaris Bank Ltd maintains a risk register that contains all the identified risks and controls for the different activities/ processes.
This register is populated with the risks identified from previous risk identification exercises (RCSA) and updated frequently as new
risks are identified. The Risk Register is however subject to regular reviews as indicated by the Operational Risk Management
Department.
4. Key Risk Indicators
Based on the key risks and controls identified above, relevant indicators are used to monitor key business environment and
internal control factors that may influence the Bank's operational risk profile. Each indicator has trigger thresholds to provide early-
warning signals of potential risk exposures and/or a potential breakdown of controls.
5. Operational Risk Incidents
Incident management involves the capturing, reporting and management of loss incidents across the Bank. The definition of
operational risk incidents includes not only events resulting in actual loss, but those resulting in non-financial impacts and near
misses. This process is intended to enable the root cause of individual incidents, or trends of incidents, to be analysed and actions
taken to reduce the exposure or to enhance controls. All Operational Risk incidents relating to the Bank's operations are
consolidated within a central database, which is also integrated with risk and control self-assessments and indicators.
The Management of Operational Risk Incidents also includes an Issues and Action Plan phase whereby Corrective Action Plans
(CAP) are developed based on results of root cause analyses of various incidents; responsibilities are assigned while timelines for
resolutions are also agreed.
100

Polaris Bank Limited
Consolidated and separate financial statements
For the year ended 31 December 2019
Notes to the financial statements
(All amounts in millions of Naira unless otherwise stated)
7. Polaris Bank Business Continuity Plan
The Polaris Bank Business Continuity Plan (BCP) contains actions developed to maintain or resume critical operations, including
services to customers, in the event of abnormal/unintended disruption to business. The BCP includes the step by step procedures
for handling major disasters as well as prolonged business interruptions spanning a specified period. This Business Continuity Plan
satisfies the Bank‘s commitment to a practical Enterprise Risk Management approach to support business objectives, and optimize
risk management capabilities by identifying potential threats and impacts and building resilience to ensure the Bank can respond
immediately and effectively to a major incident with minimal disruption to its normal business process.
It also satisfies regulatory requirements from the Central Bank of Nigeria (CBN) which stipulates that Commercial Financial
Institutions must put in place a Business Continuity Plan duly approved by the Management of the Bank within a fixed time frame.
This document is also in line with ISO22301, an international standard that emphasizes the need for a well-defined incident
response structure.
The Bank possesses a Disaster Recovery team headed by the MD/CEO.
Managing Operational Risk
The primary responsibility for managing operational risk forms part of the day-to-day responsibilities of management and
employees at all levels. Business line management is ultimately responsible for owning and managing risks resulting from their
activities. The risks are managed where they arise.
The operational risk management function is independent of business line management and is part of the second line of defense. It
is organized as follows:
• A central function that provides bank wide oversight and reporting. It is also responsible for developing and maintaining the
Operational Risk Management Framework.
• The primary oversight body for operational risk is the Risk Management Committee (RMC), which reports to the Board Risk
Management Committee (BRMC) and ultimately, the Board.
6. Reporting
Operational risk reports are produced on both a regular and on event-driven basis. The reports include a profile of the key risks to
business units' achievement of their business objectives, relevant control issues and operational risk incidents. Specific reports are
prepared on a regular basis for the relevant business unit committees and for the Bank Operational Risk Committee.
5. Operational Risk Incidents
Incident management involves the capturing, reporting and management of loss incidents across the Bank. The definition of
operational risk incidents includes not only events resulting in actual loss, but those resulting in non-financial impacts and near
misses. This process is intended to enable the root cause of individual incidents, or trends of incidents, to be analysed and actions
taken to reduce the exposure or to enhance controls. All Operational Risk incidents relating to the Bank's operations are
consolidated within a central database, which is also integrated with risk and control self-assessments and indicators.
The Management of Operational Risk Incidents also includes an Issues and Action Plan phase whereby Corrective Action Plans
(CAP) are developed based on results of root cause analyses of various incidents; responsibilities are assigned while timelines for
resolutions are also agreed.
101

Polaris Bank Limited
Consolidated and separate financial statements
For the year ended 31 December 2019
(All amounts in millions of Naira unless otherwise stated)
4.2 Capital Management
Capital Risk Management
Group Group Bank Bank
31 31
December
31
December
31
December
2019 2018 2019 2018
Tier 1 capital
Share capital 25,000 25,000 25,000 25,000
Share premium 873,450 873,450 873,450 873,450
Statutory reserves 10,430 857 10,302 729
Retained earnings 3,467 (26,004) 4,395 (26,215)
Reorganisation reserve (848,017) (848,017) (848,017) (848,017)
Non-Controlling Interest 1,194 1,561 - -
Total 65,524 26,847 65,130 24,947
Add/(less)
Intangible assets (179) (284) (179) (284)
Adjusted Total qualifying Tier 1 capital 65,344 26,563 64,950 24,663
Tier 2 capital
Other Qualifying Capital 3,507 3,895 - -
Fair value reserves 2,775 98 2,775 98 Adjusted Total qualifying Tier 2 capital 6,282 3,993 2,775 98
Total regulatory capital 71,626 30,556 67,726 24,762
Total risk-weighted assets 488,268 792,978 489,425 793,469
Capital Ratios
14.67% 3.85% 13.84% 3.12%
13.38% 3.35% 13.27% 3.11%
Capital management is central to the Group’s financial stability and sustainability. The Group endeavours to maintain the appropriate
level of capital that is adequate to support our risk profile, regulatory requirements and business needs.
The Group’s Capital Management philosophy is to optimize its capital structure given the peculiarities of its risk profile, by maintaining
adequate levels of capital to cater for all unexpected losses, beyond meeting regulatory requirements. This philosophy guides the Group's
Internal Capital Adequacy Assessment Process (ICAAP), which sets internal capital targets and defines strategies for achieving those
targets consistent with our risk appetite, business plans and operating environment. As part of this process, we have implemented a
program of enterprise-wide stress testing to evaluate the income and capital (economic and regulatory) impacts of several potential
stress events.
In the Group, capital allocations are approved at the Board level and are monitored daily by the Group’s management.
The Central Bank of Nigeria (CBN) has an oversight function and monitors all banks operating in Nigeria to ensure compliance with
capital adequacy requirements. At every point in time, the Group ensures that it has sufficient capital above the regulatory capital to
hedge against any unanticipated shocks.
The Group’s regulatory capital comprises of two tiers:
• Tier 1 capital: share capital (net of any book values of the treasury shares), statutory reserve, non-controlling interest, retained
earnings, reserves created by appropriations of retained earnings and other disclosed reserves. The book value of goodwill is deducted in
arriving at Tier 1 capital.
• Tier 2 capital: qualifying subordinated debt, unrealized gains arising on the fair valuation of equity instruments held as fair value
through OCI. Investments in capital of other banks and financial institutions are deducted from Tier 1 and Tier 2 capital to arrive at the
regulatory capital.
Capital adequacy ratio
The capital adequacy ratio is the quotient of the capital base of the Group and the Group's risk weighted asset base. The Central Bank of
Nigeria prescribed a minimum limit of 10% of total qualifying capital/total risk weighted capital/total risk weighted assets as a measure
of capital adequacy
Total regulatory capital expressed as a
percentage of total risk-weighted assets
The table below summarises the composition of regulatory capital and the ratios of the bank for the years presented below.
Total tier 1 capital expressed as a percentage
of risk-weighted assets
102

Polaris Bank Limited
Consolidated and separate financial statements
Notes to the financial statements
For the year ended 31 December 2019
(All amounts in millions of Naira unless otherwise stated)
5 Fair values of financial assets and liabilities
Accounting classification, measurement basis and fair values
The tables below sets out the Group's classification of each class of financial assets and liabilities and their fair values. All fair value measurements are recurring.
Group and Bank
31 December 2019
Fair
value
through
profit or
loss
Amortized
Costs
Fair value
through
OCI
Other
financial
liabilities at
amortised
cost
Total
carrying
amount
Level 1 Level 2 Level 3 Fair value
Financial assets
Cash and balances with central banks 26,484 - - 26,484 - 26,484 - 26,484 Due from banks and other financial institutions 62,076 - - 62,076 - 62,076 - 62,076
Financial assets at fair value through profit or loss 1,264 - - - 1,264 1,264 - - 1,264
Loans and advances to customers 188,738 - - 188,738 - 261,408 - 261,408
Fair Value through OCI - - Equity investment measured at fair value 17,362 - 17,362 - - 17,362 17,362
Amortised Cost Investments - - Treasury bills 447,078 - - 447,078 455,102 - - 455,102 - Corporate bonds 1,674 - - 1,674 - - 1,674 1,674 - State government bonds 9,114 - - 9,114 - 10,135 - 10,135 - Federal government bonds 56,984 - - 56,984 57,451 - - 57,451
Assets pledged as collateral -
- Treasury bills 29,900 - - 29,900 27,837 - - 27,837
- Federal government bonds 14,064 - - 14,064 13,642 - - 13,642
- State government bonds 410 - - 410 - 410 - 410 Other loans and receivables 182,594 - - 182,594 - 182,594 - -
Other assets 47,354 - 47,354 - 47,354 47,354 -
1,264 1,066,470 17,362 - 1,085,096 555,296 543,107 248,984 1,164,793
Financial liabilitiesDue to other financial institutions - - - - - - - - -
Deposits and other accounts - - - 857,885 857,885 - - 857,885 857,885
Borrowings from local and foreign banks/Institutions - - - 100,920 100,920 - - 100,920 100,920 Lease liability 2,644 - - 2,644 - - 2,644 2,644
Other liabilities - - - 97,256 97,256 - - 97,256 97,256 - 2,644 - 1,056,061 1,058,705 - - 1,058,705 1,058,705
Carrying amount Fair value
103

Polaris Bank Limited
Consolidated and separate financial statements
Notes to the financial statements
For the year ended 31 December 2019
(All amounts in millions of Naira unless otherwise stated)
Group and Bank
31 December 2018
Fair
value
through
profit or
loss
Amortized
Costs
Fair value
through
OCI
Other
financial
liabilities at
amortised
cost
Total
carrying
amount
Level 1 Level 2 Level 3 Fair value
Financial assets
Cash and balances with central banks - 28,026 - - 28,026 - 28,026 - 28,026 Due from banks and other financial institutions - 68,966 - - 68,966 - 68,966 - 68,966
Financial assets at fair value through profit or loss 57 - - - 57 57 - - 57
Loans and advances to customers 340,050 - - 340,050 - - 340,200 340,200
Fair Value through OCI - - - Equity investment measured at fair value - - 14,634 - 14,634 - - 14,634 14,634
Amortised Cost Investments - - - Treasury bills - 480,752 - - 480,752 474,393 - - 474,393 - Corporate bonds - 1,814 - - 1,814 - 1,824 1,824 - State government bonds - 16,426 - - 16,426 - 28,262 - 28,262 - Federal government bonds - 34,762 - - 34,762 29,132 - - 29,132
Assets pledged as collateral -
- Treasury bills - 24,457 - - 24,457 23,998 - - 23,998
- Federal government bonds - 25,992 - - 25,992 29,691 - - 29,691
- State government bonds - 323 - - 323 - 451 - 451 - Euro bonds - 7,531 - - 7,531 - 7,077 - 7,077
Other assets - 52,079 - - 52,079 - 52,079 52,079 -
57 1,081,178 14,634 - 1,095,869 557,271 134,607 406,913 1,098,791
Financial liabilitiesDue to other financial institutions - - - 25 25 - 25 - 25
Deposits and other accounts - - - 861,044 861,044 - 861,044 861,044
Borrowings from local and foreign banks/Institutions - - - 137,694 137,694 137,694 137,694
Lease liabilityOther liabilities - - - 76,837 76,837 - 76,837 76,837
- - - 1,075,600 1,075,600 - 25 1,075,575 1,075,600
Carrying amount Fair value
104

Polaris Bank Limited
Consolidated and separate financial statements
Notes to the financial statements
For the year ended 31 December 2019
(All amounts in millions of Naira unless otherwise stated)
5 Fair values of financial assets and liabilities continued
Fair value of financial assets and liabilities carried at fair value
Recognised fair value measurements
There were no transfers between
Fair value of financial assets and liabilities not carried at fair value
i Cash and balances with central banks and due from banks and other financial institutions
ii Investment securities and assets pledged as collateral
iii Loans and advances to customers
Financial instruments at fair value (including those held at fair value through profit or loss and fair value through OCI)
are either priced with reference to a quoted market price for that instrument or by using a valuation model. Where the
fair value is calculated using a valuation model, the methodology is to calculate the expected cash flows under the terms
of each specific contract and then discount these values back to a present value. The expected cash flows for each
contract are determined either directly by reference to actual cash flows implicit in observable market prices or through
modelling cash flows using appropriate financial markets pricing models. Wherever possible these models use as their
basis observable market prices and rates including, for example, interest rate yield curves, equities and prices.
The carrying amount of cash and balances with central banks and due from banks and other financial institutions are
reasonable approximation of their fair value.
The fair value for investment securities is based on market prices from financial market dealer price quotations. Where
this information is not available, fair value is estimated using quoted market prices for securities with similar credit,
maturity and yield characteristics.
The group's policy is to recognise transfers into and transfers out of fair value hierachy levels as at the end of the
reporting period.
Level 1: The fair value of financial instruments traded in active markets (such as publicly traded equity securities) is based on
quoted market prices at the end of the reporting period. The quoted market price used for financial assets held by the group is the
current market price. These instruments are included in level 1.
Level 2: The fair value of financial instruments that are not traded in an active market is determined using valuation
techniques which maximise the use of observable market data and rely as little as possible on entity-specific estimates.
If all significant inputs required to fair value an instrument are observable, the instrument is included in level 2. In
valuing the bonds classified as level 2, the price of the assets obtained from an over the counter sercurities exchange
was adopted in arriving at the fair value. It was categorised under level 2 of the fair value hierachy because the price
obtained was an indicative price due to the fact that the market for the instrument is not very active. No adjustment was
made to the input price.
Level 3: If one or more of the significant inputs is not based on observable market data, the instrument is included in
level 3.
The fair value for financial assets and liabilities that are not carried at fair value were determined respectively as follows:
The Group adopts a single approach in fair valuing its risk assets. This entails valuing all facilities with variable and fixed
interest rates using the discounted cash flow approach (Level 3). The Group’s variable rate facilities are indexed to the
Central Bank of Nigeria Monetary Policy Rate or Nigeria Interbank Offering Rate, with a spread to cover for the inherent
risk of individual facilities.
105

Polaris Bank Limited
Consolidated and separate financial statements
Notes to the financial statements
For the year ended 31 December 2019
(All amounts in millions of Naira unless otherwise stated)
iv Other assets
v Deposit from customers
vi Borrowings from local and foreign banks/institutions
vii Other liabilities
The estimated fair value of fixed interest-bearing borrowings not quoted in an active market is based on discounted cash
flows using the contractual interest rates for these debts over their remaining maturity.
The carrying amount of financial assets in other liabilities is a reasonable approximation of fair value.
The bulk of these financial assets have short (less than 3 months) maturities with the carrying amounts of the financial
assets being a reasonable approximation of fair value.
Fair values of customers’ deposits have been determined using discounted cash flow techniques applying the rates on
deposits of similar maturities and terms to discount the contractual cash flows.
106
Polaris Bank Limited
Consolidated and separate financial statements
For the year ended 31 December 2019
Notes to the financial statements
(All amounts in millions of Naira unless otherwise stated)
6
a
b
c
d
Significant accounting judgments, estimates and assumptions
Allowances for credit losses
The measurement of the expected credit loss allowance for Debt financial assets measured at amortised cost is an area that requires the use of
complex models and significant assumptions about future economic conditions and credit behaviour (e.g. the likelihood of customers defaulting
and the resulting losses). Explanation of the inputs, assumptions and techniques used in measuring ECL is further detailed in note 2.6.1j.
A number of significant judgements are also required in applying the accounting requirements for measuring ECL, such as:
• Determining criteria for significant increase in credit risk;
• Choosing appropriate models and assumptions for the measurement of ECL;
• Establishing the number and relative weightings of forward-looking scenarios for each type of product/market and the associated ECL; and
• Establishing groups of similar financial assets for the purposes of measuring ECL.
In assessing the need for collective loan loss allowances, management considers factors such as credit quality, portfolio size, concentrations, and
economic factors. In order to estimate the required allowance, assumptions are made to define the way expected credit losses are modelled and
to determine the required input parameters, based on historical experience and current economic conditions. The accuracy of the allowances
depends on how well future cash flows and model assumptions are determined. Please refer to note 3 for sensitivity analysis of the expected
credit loss to changes to the loss given default (LGD) and probability of default (PD).
Deferred tax assets and unrecognised tax losses
The Group’s financial statements and its financial results are influenced by accounting policies, assumptions, estimates and management
judgement, which necessarily have to be made in the course of preparation of the consolidated financial statements. The Group makes estimates
and assumptions that affect the reported amounts of assets and liabilities within the next financial year. All estimates and assumptions required in
conformity with IFRS are best estimates undertaken in accordance with the applicable standard. Estimates and judgements are evaluated on a
continuous basis, and are based on past experience and other factors, including expectations with regard to future events. Accounting policies
and management’s judgements for certain items are especially critical for the Group’s results and financial situation due to their materiality.
The significant judgements made by management in applying the Group's accounting policies and the key sources of estimation uncertainty in
these financial statements, which together are deemed critical to the Group's results and financial position, are as follows:
Deferred tax assets are recognised for deductible temporary differences, unused tax losses and unused tax credits to the extent that it is probable
that taxable profit will be available against which losses can be utilised. Management judgement is required to determine the amount of deferred
tax assets that can be recognised, based on the likely timing and level of future taxable profits together with future tax planning strategies, the
group assessed the probability of expected future taxable profits based on the expected profit for the next five years. Details of the Group's
recognised and unrecognised deferred tax assets and liabilities are as disclosed in note 33.
Determination of impairment of property, plant and equipment and intangible assets
Depreciation and carrying value of property, plant and equipment
The estimation of the useful lives of assets is based on management’s judgement. Any material adjustment to the estimated useful lives of items
of property and equipment will have an impact on the carrying value of these items.
Management is required to make judgements concerning the cause, timing and amount of impairment. In the identification of impairment
indicators, management considers the impact of changes in current competitive conditions, cost of capital, availability of funding, technological
obsolescence, discontinuance of services and other circumstances that could indicate that impairment exists. The Group applies the impairment
assessment to its separate cash generating units. This requires management to make significant judgements and estimates concerning the
existence of impairment indicators, separate cash generating units, remaining useful lives of assets, projected cash flows and net realisable
values. Management’s judgement is also required when assessing whether a previously recognised impairment loss should be reversed.
107

Polaris Bank Limited
Consolidated and separate financial statements
For the year ended 31 December 2019
Notes to the financial statements
(All amounts in millions of Naira unless otherwise stated)
e
i
Description
2019 2018Valuation
technique
Unobservable
inputs
Range of
unobservable
inputs
Relationship of
unobservable
inputs to fair
value
Nigeria Interbank
Settlement Systems5,973 5,628
Adjusted fair
value
comparison
approach
Median Price to
earnings (P/E)
ratio of similar
comparable
companies
P/E ratio 25.25x
Illiquidity ratio
19.2%
The higher the
P/E ratio of
similar trading
companies, the
higher the fair
value
Unified Payment
Services Limited7,547 6,912
Adjusted fair
value
comparison
approach
Median Price to
earnings (P/E)
ratio of similar
comparable
companies
P/E ratio 17.06x
Illiquidity ratio
19.2%
The higher the
EV/EBITDA ratio
of similar trading
companies, the
higher the fair
value
AFREXIM Bank 3,431 1,885
Adjusted fair
value
comparison
approach
Median Price to
Net book value
(P/BV) ratio of
similar
comparable
companies
P/BV 1.12X
Illiquidity ratio
19.2%
The higher the
P/E ratio of
similar trading
companies, the
higher the fair
value
FMDQ OTC
Securities Exchange350 199
Adjusted fair
value
comparison
approach
Median Price to
earnings (P/E)
ratio of similar
comparable
companies
P/E ratio 9.43x
Illiquidity ratio
19.2%
The higher the
P/E ratio of
similar trading
companies, the
higher the fair
valueSANEF (Shared
Agent Network
Expansion Facility
50 -
17,351 14,624
Information about fair value measurements using significant unobservable inputs (Level 2)
Adjusting factors used are the Illiquidity Discount which assumes a reduced earning on a private entity in comparison to a publicly quoted entity
and the Haircut adjustment which assumes a reduced earning for an entity located in Nigeria contributed by lower transaction levels in
comparison to an entity in a developed or emerging market. The unobservable inputs used entails Average P/B multiples of comparable
companies and Median of Enterprise value to EBITDA ratio (EV/EBITDA) of similar comparable companies.
The Group’s accounting policy on fair value measurements is discussed under note 2.6. The Group measures fair values using the following
hierarchy of methods.
Valuation of financial instruments
The fair value of financial instruments that are not traded in an active market is determined by using valuation techniques. These valuation
techniques maximise the use of observable market data where it is available and rely as little as possible on entity specific estimates. If all
significant inputs required to fair value an instrument are observable, the instrument is included in level 2.
The Group uses widely recognised valuation models for determining the fair value of its financial assets. The fair values of unquoted equity
investments have been generally derived using the adjusted fair value comparison approach. Quoted price per earning or price per book value,
enterprise value to EBITDA ratios of comparable entities in a similar industry were obtained and adjusted for key factors to reflect estimated
ratios of the investment being valued.
Financial instruments in Level 2
Bank
108

Polaris Bank Limited
Consolidated and separate financial statements
For the year ended 31 December 2019
Notes to the financial statements
(All amounts in millions of Naira unless otherwise stated)
Interest income
Group Group Bank Bank
21 September - 21 September -
31 December 31 December 31 December 31 December
2019 2018 2019 20187 Interest income on amortized cost instruments
Loans and advances to customers:
- Term loans 48,125 7,151 48,125 7,151
- Overdraft 3,943 1,929 3,943 1,929
Cash and short term funds 1,513 131 1,513 131
Investment securities 78,069 15,163 78,069 15,163
131,650 24,374 131,650 24,374
8 Interest income on FVTPL instruments
Investment securities 1,961 215 1,961 215
Total 133,611 24,589 133,611 24,589
9 Interest expense
Group Group Bank Bank
21 September - 21 September -
31 December 31 December 31 December 31 December
2019 2018 2019 2018
Savings deposits 4,540 1,077 4,540 1,077
Time deposits 31,654 10,100 31,654 10,100
Interbank takings 230 49 230 49
Borrowed funds 5,085 2,958 5,085 2,958
Current deposits 4,054 1,028 4,054 1,028Leases 251 - 251 -
45,814 15,212 45,814 15,212
10 Fee and commission income
Group Group Bank Bank
21 September - 21 September -
31 December 31 December 31 December 31 December
2019 2018 2019 2018
Current account maintenance charges 1,728 498 1,728 498
Commission on telex transfer 2,061 481 2,061 481
Commission on off-balance sheet transactions 216 41 216 41
Remittances fees 2,795 621 2,795 621
Letters of credit commission and fees 242 138 242 138
Commission on cheque book issued 375 122 375 122
Card related commission 3,521 758 3,521 758
Collection revenue 527 184 527 184
Other fee and commission income 338 74 338 74
11,803 2,917 11,803 2,917
Timing of revenue recognition
At a point in time 9,284 2,257 9,284 2,257
Over the life 2,519 660 2,519 660
109

Polaris Bank Limited
Consolidated and separate financial statements
For the year ended 31 December 2019
Notes to the financial statements
(All amounts in millions of Naira unless otherwise stated)
11 Fee and commission expense
Group Group Bank Bank
21 September - 21 September -
31 December 31 December 31 December 31 December
2019 2018 2019 2018
NEFT/NIBSS transfer charges 164 48 164 48
E banking expense 3,003 680 3,003 680
Other fee and commission expense 100 30 100 30
3,267 758 3,267 758
11.1 Net fee and commission income 8,536 2,159 8,536 2,159
12 Net trading and foreign exchange
incomeGroup Group Bank Bank
21 September - 21 September -
31 December 31 December 31 December 31 December
2019 2018 2019 2018
Foreign exchange translation gains (unrealised) 450 8,788 450 8,788
Net fair value changes in FVTPL securities
(Treasury bills)
500 32 500 32
950 8,820 950 8,820
13 Other operating income
Group Group Bank Bank
21 September - 21 September -
31 December 31 December 31 December 31 December
2019 2018 2019 2018
484 196 484 196
Rental income 180 40 180 40
Recoveries on loans previously written off 3,155 425 3,155 425
Gain on disposal of subsidiary - - 487 -
Gain on disposal of property and equipment 65 191 65 191
Sundry income 113 214 113 214
3,997 1,066 4,484 1,066
14 Impairment loss on loans and other financial assets
Group Group Bank Bank
21 September - 21 September -
31 December 31 December 31 December 31 December
2019 2018 2019 2018
Impairment charge on other assets (Note 25) 1,166 1,387 1,166 1,387
Impairment charge on loans and advances (Note 21) 14,276 4 14,276 4
Impairment charge on Investment securities - 416 - 416
Impairment reversal on contingents (1,316) - (1,316) -
Loss on disposal of equity instruments - 989 - 989
14,126 2,796 14,126 2,796
15 Employee benefit costs
Group Group Bank Bank
21 September - 21 September -
31 December 31 December 31 December 31 December
2019 2018 2019 2018
Wages and salaries 25,223 6,377 25,223 6,377
Defined contribution 452 120 452 120
Other staff cost (note 15.1) 125 66 125 66
Termination expenses 628 43 628 43
26,428 6,606 26,428 6,606
Dividend income on fair value through OCI investments
110

Polaris Bank Limited
Consolidated and separate financial statements
For the year ended 31 December 2019
Notes to the financial statements
(All amounts in millions of Naira unless otherwise stated)
15.1 Other staff cost
15.2 Employees and directors
a Employees
The average number of persons employed by the Group during the period was as follows:
Group Group Bank Bank
21 September - 21 September -
31 December 31 December 31 December 31 December
2019 2018 2019 2018Executive directors 3 3 3 3Management 119 126 119 126Non-management 2,390 2,552 2,390 2,552
2,512 2,681 2,512 2,681
Group Group Bank Bank
21 September - 21 September -
31 December 31 December 31 December 31 December
2019 2018 2019 2018
N300,001 - N2,000,000 - - - - N2,000,001 - N2,800,000 216 217 216 217N2,800,001 - N3,500,000 - 0 - 0N3,500,001 - N4,000,000 345 247 345 247N4,000,001 - N5,500,000 787 884 787 884N5,500,001 - N6,500,000 0 0N6,500,000 - N7,800,000 444 515 444 515N7,800,001 - N9,000,000 256 471 256 471N9,000,001 and above 461 344 461 344
2,509 2,678 2,509 2,678
b Directors' emoluments
Group Group Bank Bank
21 September - 21 September -
31 December 31 December 31 December 31 December
2019 2018 2019 2018
Fees and sitting allowances 33 2 33 2
Other director expenses and benefits 19 38 19 38
Total directors' related expenses (note 16) 52 40 52 40
Executive compensation 198 50 198 50
250 90 250 90
Chairman 9 1 9 1
Highest paid director 84 21 84 21
Other staff cost represent benefits accruing to employees with respect to loans granted at below market interest rate
The number of employees of the Group, other than directors, who received emoluments in the following ranges (excluding pension
contributions and certain benefits) were:
Remuneration paid to the Directors was:
Fees and other emoluments disclosed above include amounts paid to:
111

Polaris Bank Limited
Consolidated and separate financial statements
For the year ended 31 December 2019
Notes to the financial statements
(All amounts in millions of Naira unless otherwise stated)
Group Group Bank Bank
21 September - 21 September -
31 December 31 December 31 December 31 December
2019 2018 2019 2018
N5,000,001 and N10,000,000 1 6 1 6 N10,000,001 and N20,000,000 4 1 4 1 N20,000,001 and above 3 1 3 1
8 8 8 8
16 Administration and general expenses
Group Group Bank Bank
21 September - 21 September -
31 December 31 December 31 December 31 December
2019 2018 2019 2018
Advertising and business promotion 441 306 441 306
Communication and operational cost 180 47 180 47
Insurance costs 499 121 499 121
Legal and professional fees 1,978 174 1,978 174
NDIC insurance premium 5,034 1,512 5,034 1,512
Repairs and maintenance 3,868 1,047 3,868 1,047
Transport, travel, accommodation 545 91 545 91
Stationery and printing 536 137 536 137
Security expenses 1,320 341 1,320 341
Training expenses 819 43 819 43
Contract services 4,586 1,396 4,586 1,396
Charities and donations 119 8 119 8
Directors' related expenses 188 40 188 40
AMCON sinking fund expenses 3,960 1,080 3,960 1,080
Utilities 837 197 837 197
Office expenses 755 210 755 210
Newspapers and periodicals 11 3 11 3
Operational and other losses 488 761 488 761
Rents and rates 293 306 293 306
Auditors remuneration 210 90 210 90
Cash shipment services 1,048 265 1,048 265
Subscriptions 233 45 233 45
Other administrative expenses 915 237 915 237
28,863 8,457 28,863 8,457
17 Depreciation and amortisation
Group Group Bank Bank
21 September - 21 September -
31 December 31 December 31 December 31 December
2019 2018 2019 2018
Depreciation of property, plant and
equipment (note 28)
3,877 1,012 3,877 1,012
Depreciation of right of use ssset (note 27) 413 - 413 -
Amortisation of intangible assets (note 29) 231 95 231 95
4,521 1,107 4,521 1,107
The number of directors who received fees and other emoluments (excluding pension contributions and certain benefit) in the following
ranges was:
112

Polaris Bank Limited
Consolidated and separate financial statements
For the year ended 31 December 2019
Notes to the financial statements
(All amounts in millions of Naira unless otherwise stated)
18 Cash and balances with central banks
Group Group Bank Bank
31 December 31 December 31 December 31 December
2019 2018 2019 2018
Cash in vault 23,088 22,013 23,088 22,013
Operating account with the central banks 3,396 6,013 3,396 6,013
Included in cash and cash equivalents 26,484 28,026 26,484 28,026
18.1 Cash and cash equivalents
Group Group Bank Bank
31 December 31 December 31 December 31 December
2019 2018 2019 2018
Cash in vault (note 18) 23,088 22,013 23,088 22,013
Operating account with the central banks
(note 18)
3,396 6,013 3,396 6,013
Due from banks and other financial
institutions excluding long term placements
and cash collateral (Note 19)
62,076 68,966 62,076 68,966
88,560 96,992 88,560 96,992
19 Due from banks and other financial institutions
Group Group Bank Bank
31 December 31 December 31 December 31 December
2019 2018 2019 2018
Current account balances within Nigeria 1,939 1,921 1,939 1,921
Current account balances and placements outside of Nigeria 43,137 47,345 43,137 47,345
Placements with other banks 17,000 19,700 17,000 19,700
62,076 68,966 62,076 68,966
Current 62,076 68,966 62,076 68,966
62,076 68,966 20 Financial assets held at fair value through profit or loss
Group Group Bank Bank
31 December 31 December 31 December 31 December
2019 2018 2019 2018
Treasury Bills 1,264 57 1,264 57
1,264 57 1,264 57
Current 1,264 57 1,264 57
1,264 57 1,264 57
Cash and cash equivalents does not include restricted cash with the Central Bank of Nigeria (CBN) which is not available for use by the
group for normal day to day cash operations.
Trading securities are fair valued through profit or loss. They were acquired principally for the purpose of trade in the near term and to
take advantages of favourable fluctuations in the market price of the asset. Gains or losses relating to trading securities that are
measured at fair value are included in note 12.
113

Polaris Bank Limited
Consolidated and separate financial statements
For the year ended 31 December 2019
Notes to the financial statements
(All amounts in millions of Naira unless otherwise stated)
21 Loans and advances to customers
Group Group Bank Bank
31 December 31 December 31 December 31 December
2019 2018 2019 2018
Loans and advances to customers
Term loans 211,635 244,295 211,635 244,295
Overdrafts 49,773 290,268 49,773 290,268
261,408 534,563 261,408 534,563
Impairment allowance (note 21.1) (72,670) (194,513) (72,670) (194,513)
188,738 340,050 188,738 340,050
Current 37,731 117,582 37,731 117,582
Non-current 151,007 250,698 151,007 250,698
188,738 340,050 188,738 340,050
21.1 Movement in impairment allowance Group Group Bank Bank
31 December 31 December 31 December 31 December
2019 2018 2019 2018
Opening 194,513 602,846 194,513 602,846
Write-offs for the year (726) (408,337) (726) (408,337)
Loans sold to Amcon (135,393) - (135,393) -
Charge for the year 14,276 4 14,276 4
Balance at 31 December 72,670 194,513 72,670 194,513
114
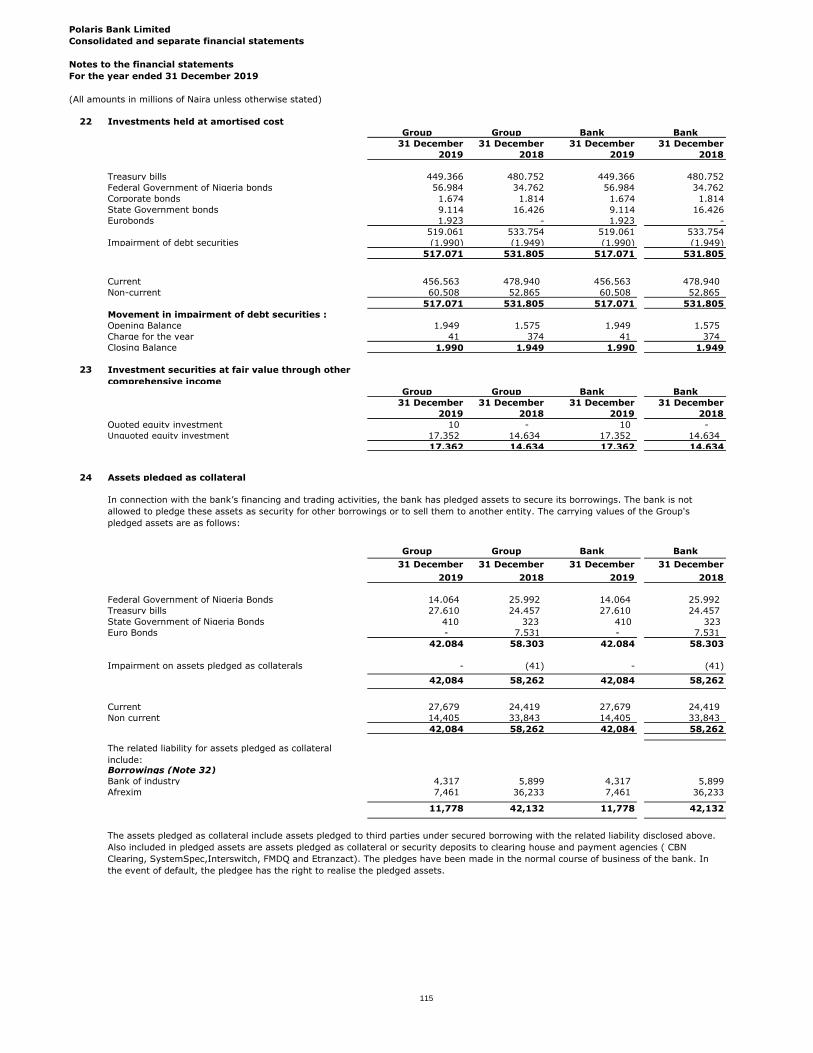
Polaris Bank Limited
Consolidated and separate financial statements
Notes to the financial statements
For the year ended 31 December 2019
(All amounts in millions of Naira unless otherwise stated)
22 Investments held at amortised cost
Group Group Bank Bank
31 December 31 December 31 December 31 December
2019 2018 2019 2018
Treasury bills 449,366 480,752 449,366 480,752
Federal Government of Nigeria bonds 56,984 34,762 56,984 34,762
Corporate bonds 1,674 1,814 1,674 1,814
State Government bonds 9,114 16,426 9,114 16,426
Eurobonds 1,923 - 1,923 -
519,061 533,754 519,061 533,754
Impairment of debt securities (1,990) (1,949) (1,990) (1,949)
517,071 531,805 517,071 531,805
Current 456,563 478,940 456,563 478,940
Non-current 60,508 52,865 60,508 52,865
517,071 531,805 517,071 531,805
Movement in impairment of debt securities :
Opening Balance 1,949 1,575 1,949 1,575
Charge for the year 41 374 41 374
Closing Balance 1,990 1,949 1,990 1,949
23 Investment securities at fair value through other
comprehensive incomeGroup Group Bank Bank
31 December 31 December 31 December 31 December
2019 2018 2019 2018
Quoted equity investment 10 - 10 -
Unquoted equity investment 17,352 14,634 17,352 14,634
17,362 14,634 17,362 14,634
24 Assets pledged as collateral
Group Group Bank Bank
31 December 31 December 31 December 31 December
2019 2018 2019 2018
Federal Government of Nigeria Bonds 14,064 25,992 14,064 25,992
Treasury bills 27,610 24,457 27,610 24,457
State Government of Nigeria Bonds 410 323 410 323
Euro Bonds - 7,531 - 7,531
42,084 58,303 42,084 58,303
Impairment on assets pledged as collaterals - (41) - (41)
42,084 58,262 42,084 58,262
Current 27,679 24,419 27,679 24,419
Non current 14,405 33,843 14,405 33,843
42,084 58,262 42,084 58,262
The related liability for assets pledged as collateral
include:Borrowings (Note 32)
Bank of industry 4,317 5,899 4,317 5,899
Afrexim 7,461 36,233 7,461 36,233
11,778 42,132 11,778 42,132
The assets pledged as collateral include assets pledged to third parties under secured borrowing with the related liability disclosed above.
Also included in pledged assets are assets pledged as collateral or security deposits to clearing house and payment agencies ( CBN
Clearing, SystemSpec,Interswitch, FMDQ and Etranzact). The pledges have been made in the normal course of business of the bank. In
the event of default, the pledgee has the right to realise the pledged assets.
In connection with the bank’s financing and trading activities, the bank has pledged assets to secure its borrowings. The bank is not
allowed to pledge these assets as security for other borrowings or to sell them to another entity. The carrying values of the Group's
pledged assets are as follows:
115

Polaris Bank Limited
Consolidated and separate financial statements
Notes to the financial statements
For the year ended 31 December 2019
(All amounts in millions of Naira unless otherwise stated)
25 Prepayment and other assets
Group Group Bank Bank
31 December 31 December 31 December 31 December
2019 2018 2019 2018
Financial assets
Accounts receivable 3,509 1,242 3,509 1,242
Sundry receivables 8,797 19,338 8,797 19,338
Cash Reserve with CBN 37,698 37,446 37,698 37,446
Intercompany receivables - - 700 2,650
50,004 58,026 50,704 60,676
Impairment allowance (see note 25.1) (3,491) (5,947) (4,191) (7,812)
46,513 52,079 46,513 52,864
Non-financial assets
Prepayments 884 2,177 884 2,177
Inventories 649 539 649 539
1,533 2,716 1,533 2,716
Prepayment and other assets 48,046 54,795 48,046 55,580
Current 46,513 52,079 45,813 50,214
Non-current 1,533 2,716 2,233 5,366
48,046 54,795 48,046 55,580
25.1 Movement in impairment allowance
Group Group Bank Bank
31 December 31 December 31 December 31 December
2019 2018 2019 2018
At Opening 5,947 4,560 7,812 6,425 Transfer to property under construction (2,412) - (2,412) - (Reversal)/Charge to profit or loss 1,166 1,387 1,166 1,387
Write offs during the year (1,210) (2,375)
Total 3,491 5,947 4,191 7,812
25b Other loans and receivables
Group Group Bank Bank
31 December 31 December 31 December 31 December
2019 2018 2019 2018
AMCON receivables 182,594 - 182,594 -
Impairment of loans and other receivables - - - -
182,594 - 182,594 -
116

26 Right of Use Assets
Building Total
N'm N'm
Opening balance as at 1 January 2019 2,546 2,546
Additions during the year 1,504 1,504
Closing balance as at 31 December 2019 4,050 4,050
Depreciation - -
Opening balance as at 1 January 2019 413 413
Charge for the year 413 413
Closing balance as at 31 December 2019
Net book value as at 31 December 2019 3,637 3,637
27 Lease liabilities
i Lease liabilities
N'm
Opening balance as at 1 January 2019 1,443
Additions 951
Interest expense 251
Closing balance as at 31 December 2019 2,645
Current lease liabilities 5
Non-current lease liabilities 2,640
2,645
ii Amounts recognised in the statement of profit or loss
N'm
Depreciation charge of right-of-use assets 413
Interest expense 251
664
The total cash outflow for leases as at December 2019 was N553 million.
iii)
Less than
6 months
6-12
months
Between
1 and 2
years
Between
2 and 5
years Above 5 years
Total contractual
cashflows Carrying amount
Lease liability - - - 313 4,767 5,080 2,645
This note provides information for leases where the Bank is a lessee.
Liquidity risk (maturity analysis of lease liabilities)
117

Polaris Bank Limited
Consolidated and separate financial statements
For the period year ended 31 December 2019
Notes to the financial statements
(All amounts in millions of Naira unless otherwise stated)
28 Property, plant and equipment
Group and Bank
Leasehold
land &
buildings
Leasehold
improvements
Plant &
machinery
Furniture &
fittings
Motor
vehicles
Computer
hardware
Property under
construction Total
Cost
As at 01 January 2019 35,916 18,622 16,047 2,989 3,579 15,994 4,661 97,808
Additions 100 32 1,186 42 660 659 6,970 9,649
Disposals/Write-offs - (15) (295) (17) (380) (230) (181) (1,118)
Reclassification from asset held for sale 137 - - - - - - 137
Reclassification (8) - (13) - - 21 - -
At 31 December 2019 36,145 18,639 16,925 3,014 3,859 16,444 11,450 106,476
Accumulated depreciation
As at 01 January 2019 3,677 10,746 13,900 2,852 3,421 14,902 - 49,498
Charge for the year 607 1,242 986 77 233 732 - 3,877
Disposals - (15) (292) (18) (380) (229) - (934)
Impairment - - - - - - 2,412 2,412
At 31 December 2019 4,284 11,973 14,594 2,911 3,274 15,405 2,412 54,853
Net book amount at 31 December 2019 31,861 6,666 2,331 103 585 1,039 9,038 51,623
Leasehold
land &
buildings
Leasehold
improvements
Plant &
machinery
Furniture &
fittings
Motor
vehicles
Computer
hardware
Property under
construction Total
Cost
As at 21 September 2018 35,892 18,615 15,993 2,991 3,619 15,919 4,388 97,417
Additions 24 7 70 2 - 126 273 502
Disposals/Write-offs - - (16) (4) (40) (51) - (111)
At 31 December 2018 35,916 18,622 16,047 2,989 3,579 15,994 4,661 97,808
Accumulated depreciation
As at 21 September 2018 3,526 10,392 13,658 2,832 3,393 14,768 - 48,569
Charge for the year 151 354 253 23 68 164 - 1,012
Disposals - - (10) (4) (40) (30) - (84)
At 31 December 2018
3,677 10,746 13,901 2,851 3,421 14,902 - 49,497
Net book amount at 31 December 2018 32,239 7,876 2,146 138 158 1,092 4,661 48,311
N2.412 bn relates to impairment of properties under construction that have become obsolete
118

Polaris Bank Limited
Consolidated and separate financial statements
Notes to the financial statements
For the year ended 31 December 2019
(All amounts in millions of Naira unless otherwise stated)
29 Intangible assets Bank
Computer Computer
software software
Cost
At 1 January 2019 9,653 9,653
Additions 127 127
At 31 December 2019 9,780 9,780
Amortisation
At 1 January 2019 (9,369) (9,369)
Amortisation charge (231) (231)
At 31 December 2019 (9,600) (9,600)
Net book value
At 31 December 2019 180 180
Cost
At 21 September 2018 9,644 9,644
Additions 9 9
At 31 December 2018 9,653 9,653
Amortisation
At 21 September 2018 (9,274) (9,274)
Amortisation charge (95) (95)
At 31 December 2018 (9,369) -9,369
Net book value
At 31 December 2018 284 284
*Intangible assets are all externally generated
Group
119

Polaris Bank Limited
Consolidated and separate financial statements
For the year ended 31 December 2019
Notes to the financial statements
(All amounts in millions of Naira unless otherwise stated)
30 Assets classified as held for sale and discontinued operations
Group Group Bank Bank
31 December 31 December 31 December 31 December
2019 2018 2019 2018
Non-current assets held for sale (note 30a) - 137 - 137
Discontinued operations (note 30b) - - 2,107 3,983
Assets of disposal group held for sale 15,485 23,331 - -
Total assets classified as held for sale 15,485 23,468 2,107 4,120
Liabilities of disposal group held for sale 9,529 13,686 - -
a
b Discontinued operations
Name Country of
incorporation
and place of
business
Nature of
business
Proportion of
ordinary shares
directly held by
parent (%)
Proportion of
ordinary
shares held
by non-
controlling
interests (%)
Carrying
amount
• Skye Bank Guinea Guinea Banking 73 27 1,156
• Skye Finance and Investment Ltd Dublin Financial
services
100 - 9
• Mainstreet Bank Estate Company Ltd Nigeria Property
development
100 - 500
• Mainstreet Securities Ltd Nigeria Financial
services
94 6 442
2,107
The table below shows the total non-controlling interest for the period:
Skye Bank
Guinea
Mainstreet
Securities Ltd
Total
1,124 70 1,194
Assets classified as held for sale as at 31 December 2018 were transferred to Property plant and equipment (See note 28) in 2019.
On 19 February 2016, the board of the defunct Skye Bank approved the disposal of the group's entire interest in all of its subsidiaries. As
at 31 December 2019, the sale of Four(4) subsidiaries have been completed.
In September 2018, the directors of Skye Finance and Investments Limited (SFIL), the Irish entity, resolved to place the company into
voluntary members liquidation at a board meeting. The affairs of the company was thus handed over to the liquidator.
Consequently, the associated assets and the liabilities of the unsold subsidiaries and SFIL have been presented as held for sale having met
all the conditions to be classified as such in accordance with IFRS 5 as the carrying amount is expected to be recovered principally by a sale
rather than through continuing use. These subsidiaries include:
120

Polaris Bank Limited
Consolidated and separate financial statements
For the year ended 31 December 2019
Notes to the financial statements
(All amounts in millions of Naira unless otherwise stated)
31 December 31 December
2019 2018
Net interest income 711 1,238
Net fee and commission income 338 458
Other operating income 278 188
- 856
Operating expenses (1,142) (2,315)
Profit before tax of discontinued operations 185 425
Loss on sale of subsidiaries (see note 30c below) (757) -
Taxation - -
Profit after tax of discontinued operations (572) 425
Exchange differences on translation of discontinued operations - 1,880
Other comprehensive income from discontinued operations - 1,880
Net cash inflow/(outflow) from operating activities 78 492
Net cash inflow/(outflow) from investing activities (560) (418)
Net cash inflow/(outflow) from financing activities (1,367) 79
The assets and liabilities of the subsidiaries held for sale are as follows;
Skye Bank
Guinea
Mainstreet
Securities
Limited
MBL Estate Total
Cash and Cash
Equivalent
2,469 675 17 3,161
Investment Securities 6,714 2,271 - 8,985
Loans and advances 1,837 - - 1,837
Other Assets and
receivables
224 (69) 1,265 1,420
Investment
Properties
- - - -
Property, Plant &
Equipment
81 - - 81
Intangible Assets - 1 - 1
Total Assets 11,325 2,878 1,282 15,485
Deposits 6,196 3 6,199
Due to other banks - - -
Current tax liabilities 39 416 455
Deferred Taxation 0 - -
Other Liabilities 926 1,231 652 2,809
Retirement Benefit
Obligation
- - 65 - 65
Total Liabilities 7,161 1,715 652 9,528
Financial risk management disclosures for non-current assets and non-current liabilities held for sale
In accordance with IFRS 5, the assets and liabilities held for sale were carried at the lower of their fair value less costs to sell and carrying
amount. The financial assets are cash and balance balances, Loans and advances to customers, investment securities and other assets.
The loan facilities of the discontinued operations are spread across sectors in the following percentages of: 63% in the corporate sector,
27% in the retail sector and 10% in the commercial sector. Collateral held against this exposure includes: properties, cash and other
enhancements. Most of the assets and liabilities mature within six months and as such fair value approximated carrying amount.
Investment in securities are trading instruments which are highly liquid and actively traded with maturity of 1 year. Cash and balances with
banks consist of balances held with foreign banks and unrestricted balances with central bank.
The summarised results from discontinued operations which have been included in the consolidated income statement are as follows:
121

Polaris Bank Limited
Consolidated and separate financial statements
For the year ended 31 December 2019
Notes to the financial statements
(All amounts in millions of Naira unless otherwise stated)
c Details of sale of subsidiary
The book value of the net assets for the subsidiaries disposed at the date of disposal is as follows:
Skye bank
Gambia
Skye bank
Sierra-Leone
Total
Cash & balance with host Central Bank 656 312 968
Due from bank 612 983 1,595
Placements 1,971 460 2,431
Investment Securities - 1,884 1,884
Loans and Advances 194 778 972
Other Assets 111 324 435
Property Plant and Equipments 1,316 42 1,358
Intangible 216 - 216
Deferred tax asset - 139 139
Total Assets 5,076 4,922 9,998
Deposits from customers 2,830 2,067 4,897
Due to banks 124 - 124
Current income tax 2 - 2
Deferred income Tax 12 - 12
Accruals and other liabilities 635 909 1,544
Total Liabilities 3,603 2,976 6,579
Net assets of disposal group 1,473 1,946 3,419
The profit/ (loss) on the disposed subsidiaries is as follows:
Group
Gambia Sierra-Leone Total
Proceeds from sale of subsidiaries 719 1918 2,637
Disposal cost (243) (31) (274)
Net proceeds from sale of subsidiaries 476 1887 2363
Fair value of NCI 280 19 299
Net assets of subsidiaries at disposal (1,472) (1,947) (3,419)
Loss on sale (716) (41) (757)
Bank
31 December
2019
Proceeds from sale of subsidiaries 2,637
Disposal cost (274)
Net proceeds from sale of subsidiaries 2,363
Carrying amount of investments 1,876
Profit on sale 487
31 December
2019
Polaris bank fully disposed two of its subsidiaries: Skye bank Gambia and Skye bank Sierra-leone. The sale was effective 1 January 2019
122

Polaris Bank Limited
Consolidated and separate financial statements
For the year ended 31 December 2019
Notes to the financial statements
(All amounts in millions of Naira unless otherwise stated)
31 Due to other financial institutions
Group Group Bank Bank
31 December 31 December 31 December 31 December
2019 2018 2019 2018
Due to banks in Nigeria - 25 - 25
Due to banks outside Nigeria - - -
- 25 - 25
Current - 25 - 25
- 25 - 25
32 Deposits from customers
Group Group Bank Bank
31 December 31 December 31 December 31 December
2019 2018 2019 2018
Current accounts 265,045 279,819 265,045 279,819
Savings account 167,679 154,536 167,679 154,536
Term deposits 294,457 303,913 294,457 303,913
Domiciliary accounts 130,704 122,776 130,704 122,776
857,885 861,044 857,885 861,044
Current 857,885 861,044 857,885 861,044
Non-current - - - -
857,885 861,044 857,885 861,044
33 Borrowings from local and foreign institutions
Group Group Bank Bank
31 December 31 December 31 December 31 December
2019 2018 2019 2018
CBN - State Bailout Funds (note i) 52,813 54,174 52,813 54,174
African Export Import Bank (note ii) 7,461 36,233 7,461 36,233
CBN/BOI intervention fund (note iii) 4,317 5,899 4,317 5,899
European Investment Bank (note iv) 10,043 14,615 10,043 14,615
CBN - Excess Crude Account (note v) 18,298 18,678 18,298 18,678
Afrexim Bank - 201 - 201
CBN - CACS (note vi) 2,042 2,042 2,042 2,042
5,946 5,852 5,946 5,852
100,920 137,694 100,920 137,694
Borrowings
Local 77,470 80,792 77,470 80,792
Foreign 23,450 56,902 23,450 56,902
100,920 137,694 100,920 137,694
Current 51,952 51,952 51,952 51,952
Non-current 48,968 85,742 48,968 85,742
100,920 137,694 100,920 137,694
i
ii
iii
iv
Foreign loans and borrowings for letters
of credits(note vii)
This amount of N7.46billion represents outstanding balance on the $100Million it facility granted by African Export-
Import Bank on June 28 2019 to the Polaris bank Limited. AFREXIM ammended the structure of the facility to run until 30-Sept-
19.However, the facility was not fully paid in 2019, and hence the bank entered into a restructuring agreement with AFREXIM in 2019
The amount of N 10.04 billion (USD 34.45 million) represents the outstanding balance of a global credit granted to Polaris bank by
European Investment Bank used for the finance of small and medium sized investment projects in the productive and human capital
sectors in Nigeria. The facility is due to mature in May 2022. The facility is granted at a rate of 6.27% per annum.
The amount of N52.8billion represents the outstanding balance on bailout facilities granted to the Bank by the CBN for on-lending to
state governments for payment of salaries of the workers of each states. The facility has a tenor of 20 years with a 2% interest rate
per annum payable to the CBN. The Bank is under obligation to disburse the loan at an interest rate of 9% per annum.
This amount of N 4.3 billion represents outstanding balance on-lending facilities to various customers of the bank availed by the Central
Bank of Nigeria (CBN). CBN, in a bid to unlock the credit market in Nigeria during the financial year 2010, approved for disbursement a
total sum of N500 billion Debenture Stock through the Bank of Industry to various participating banks for onward lending to Nigerian
SME/Manufacturing sector. The bank accessed this fund to the tune of N9.5 billion for Agricultural financing, N9.1billion for
Manufacturing/SME funds and N263 million on Aviation with a term of 15 years at the rate of 1% per annum.
123

Polaris Bank Limited
Consolidated and separate financial statements
For the year ended 31 December 2019
Notes to the financial statements
(All amounts in millions of Naira unless otherwise stated)
v
vi
vii
34 Current tax liability
Group Group Bank Bank
31 December 31 December 31 December 31 December
2019 2018 2019 2018
Per statement of comprehensive incomeCurrent income tax - - - -
Education tax 197 - 197 -
Technology tax 280 25 280 25
Nigeria police trust fund 1 - 1 -
Capital gains tax 1 - 1 -
Income tax charge 479 25 479 25
Group Group Bank Bank
31 December 31 December 31 December 31 December
2019 2018 2019 2018
Per statement of financial position
As at 01 January 2019 365 340 365 340
Income tax charge 479 25 479 25
Tax Paid (25) - (25) -
As at 31 December 2019 819 365 819 365
Unrecognised deferred tax asset
Effective tax rate reconciliation
31 December 2019
Naira Rate Naira Rate
Profit/(Loss) Before Tax 27,971.00 100% 27,971.00 100%
Income tax using the 8,391.00 30% 8,391.00 30%
Effect of temporary - 0% - 0%
Impact Education Tax 197.00 1% 197.00 1%
Impact Information 280.00 1% 280.00 1%
Impact NPTF Levy/tax 1.00 0% 1.00 0%
Impact capital gain tax 1.00 0% 1.00 0%
Effect of permanent (8,391.00) -30% (8,391.00) -30%
Effective Tax Charge 479.00 2% 479.00 2%
Deferred tax assets of N6.6 Billion as at 31 December 2019 has not been recognised because it is not probable that future taxable profits
will be available against which they can be utilised.
Unused tax losses for which no deferred tax assets has been recognised was N2.3 billion.
The amount of N 2.04 billion represents the outstanding balance on the on-lending facilities provided by the Central Bank of Nigeria
through the Commercial Agricutlural Credit Scheme (CACS). This is an intervention activity granted by the Central bank of Nigeria in
collaboration with the Federal Government of Nigeria. The facility is for a maximum period of 7 years at a zero percent interest rate to the
Bank.
The computation of the Bank’s income tax expense and deferred tax was carried out in accordance with the new 2019 Finance Act, CITA
and other relevant tax laws.
The company has not recognised company income tax because it is within its first four years of commencement of business.
An assessment was carried out on Polaris bank Limited for the year ended December 31, 2019 to identify areas of uncertainty in tax
treatment in accordance with IFRIC 23. The new Finance Act introduces changes to the treatment and calculations of taxation: This
addresses the areas of losses of a capital nature, expenses incurred for the purpose of deriving tax-exempt income, taxes or penalties
borne on behalf of another person and other amendments from the standard.
BankGroup
Borrowings from correspondence banks include loans from foreign banks utilised in funding letters of credits negotiated on behalf of Polaris
Bank's customers for international trade.
The amount of N18.3 billion represents outstanding balance on the excess crude account loan granted to the Bank by the Central Bank of
Nigeria for on-lending to state governments. The facility has a tenor of 20 years with a 2% interest rate per annum payable to the CBN.
The Bank is under obligation to disburse the loan at an interest rate of 9% per annum.
projects in the productive and human capital sectors in Nigeria. The facility is due to mature in May 2022. The facility is granted at a rate of
6.27% per annum.
Income tax liability is to be settled within one year
124

Polaris Bank Limited
Consolidated and separate financial statements
For the year ended 31 December 2019
Notes to the financial statements
(All amounts in millions of Naira unless otherwise stated)
35 Accruals and other liabilitiesGroup Group Bank Bank
31 December 31 December 31 December 31 December
2019 2018 2019 2018
Financial liabilities
Accounts payable 39,163 37,382 39,215 37,382
Customer deposits for letters of credit 699 5,112 699 5,112
Manager's cheque 4,884 5,249 4,884 5,249
AMCON Payable 20,496 14,356 20,496 14,356
Deposit held for sale of subsidiaries 7,106 6,920 7,106 6,920
Uncleared effects 8 276 8 276
Cash card collection settlement 4,429 4,401 4,429 4,401
76,785 73,696 76,837 73,696
Non-financial liabilities
Litigation claims provision (35(i)) 7,559 7,059 7,559 7,059
Other credit balances 11,727 13,131 11,727 14,049
Off Balance Sheet ECL allowance 1,874 3,190 1,874 3,190
21,160 23,380 21,160 24,298
97,945 97,076 97,997 97,994
Current 37,614 36,038 37,614 36,038
Non-current 60,331 61,038 60,383 61,956
97,945 97,076 97,997 97,994
35 (i) Movement in litigation claims provision
Group Group Bank Bank
31 December 31 December 31 December 31 December
2019 2018 2019 2018
Opening balance 7,059 7,059 7,059 7,059
Additional provision 500 - 500 -
Closing balance - 7,559 7,059 7,559 7,059
36 Retirement benefit obligation
Group Group Bank Bank
31 December 31 December 31 December 31 December
2019 2018 2019 2018
Defined benefit contribution 11 11 11 11
11 11 11 11
37 Share capital and reserves
a Share capital
Group Group Bank Bank
31 December 31 December 31 December 31 December
2019 2018 2019 2018
Authorised
25,000 25,000 25,000 25,000
Issued and fully paid
Group Bank
31 December 31 December
2019 2018
Opening 25,000 -
Shares issued to AMCON - 25,000
Balance, end of year 25,000 25,000
b) Share premium
Share premium is the excess paid by shareholders over the nominal value of their shares
The movement on the issued and fully paid up share capital account during the year was as follows:
25 billion ordinary shares of N1 each
(31 December 2019: 25 billion ordinary
shares of N1 each)
125

Polaris Bank Limited
Consolidated and separate financial statements
For the year ended 31 December 2019
Notes to the financial statements
(All amounts in millions of Naira unless otherwise stated)
c) Other reserves
i Statutory reserve
ii Small and medium scale industries equity investment scheme (SMEEIS) reserves
iii Fair value reserve
iv Regulatory reserve
v Translation reserve
vi Intervention fund reserve
d Non-controlling interest
e Reorganisation reserve
38 Cash generated from operations
Group Group Bank Bank
31 December 31 December 31 December 31 December
2019 2018 2019 2018
Operating loss before tax 27,342 2,456 27,829 2,456
Adjustments for:
Depreciation of property and equipment 4,290 1,012 4,290 1,012
Amortisation of intangible assets 231 95 231 95
Profit from sale of subsidiary 0 0 (487) 0
(65) (191) (65) (191)
Fair value gain on OCI financial instruments - (98) - (98)
(500) (32) (500) (32)
Impairment on financial assets 14,126 420 14,126 420
Net (gain)/loss on sale of FVOCI investments - 989 - 989
Net interest income (86,284) (9,377) (86,284) (9,377)
Unrealised foreign exchange gain on revaluation (450) (8,788) (450) (8,788)
Dividend income (484) (196) (484) (196)
(41,794) (12,323) (41,794) (12,323)
Changes in operating assets and liabilities
1,254 431 1,254 431
Pledged assets 0 28,806 0 28,806
6,510 29,484 6,510 19,589
7,677 (3,811) 7,677 (3,811)
Changes in operating liabilities
(3,129) (9,375) (3,129) (9,375)
Accruals and other liabilities 1,319 594 1,319 594
Interest paid on deposits (40,533) (4,140) (40,533) (4,140)
Interest received on loans and advances 128 0 128
(68,697) 19,899 (68,697) 19,899
(25) - (25) -
Net cash used in operating activities (68,722) 19,899 (68,722) 19,899
This represents the net liabilty assumed by Polaris Bank Limited in line with its establishment as a bridge bank to assume the assets and
liabilities of Skye Bank Plc. The net liability assumed was transferred to reorganisation reserves.
This represents the non-controlling interest's (NCI) portion of the net assets of the Group.
Income tax paid
Gain on disposal of property and
Financial assets held at fair value
Reconciliation of profit before tax to
cash generated from operations:
The banking regulations require the bank and other banking subsidiaries of the bank to make an annual appropriation to a statutory
reserve. An appropriation of 30% of profit after taxation is made if the statutory reserve is less than the paid-up share capital and 15% of
profit after taxation if the statutory reserve is greater than the paid up share capital.
Statutory reserves also include other reserves as stipulated by the banking regulations.
The SMEEIS reserve is maintained to comply with the Central Bank of Nigeria (CBN) requirement that all licensed banks set aside a portion
of the profit after taxation in a fund to be used to finance equity investments in qualifying small and medium scale enterprises. Under the
terms of the guideline (amended by CBN letter dated 11 July 2006), the contributions will be 10% of profit after taxation and shall continue
after the first 5 years but banks’ contributions shall thereafter reduce to 5% of profit after taxation. However, this is no longer mandatory.
The small and medium scale industries equity investment scheme reserves are non-distributable. No appropriations was made to the
SMEEIS reserve during the period.
The risk regulatory risk reserves warehouses the difference between the allowance for impairment losses on balance on loans and advances
based on Central Bank of Nigeria prudential guidelines and Central Bank of the foreign subsidiaries regulations, compared with the
expected credit loss model used in calculating the impairment under IFRSs.
This represents the group's share of exchange differences relating to the translation of the results and net assets of the group’s foreign
operations.
Prepayments and other assets
Net fair value loss/(gain) on financial
assets held at fair value through profit
The fair value reserve includes the net cumulative change in the fair value of FVTOCI investments.
Loans and advances to customers
Deposits from customers
This represents 10% of the Gross revenue of the bank.
126

Polaris Bank Limited
Consolidated and separate financial statements
For the year ended 31 December 2019
Notes to the financial statements
(All amounts in millions of Naira unless otherwise stated)
39 Related parties
(a) Subsidiaries
(b) Transactions with key management personnel
40 Related party transactions
40.1 Transaction with Parent Company
31 December 31 December
2019 2018
Parent company deposit held within the Bank 14,142 94
Receivable from AMCON 182,593 -
196,735 94
40.2 Key management compensation
Group Group Bank Bank
31 December 31 December 31 December 31 December
2019 2018 2019 2018
Short-term employee benefits 250 90 250 90
250 90 250 90
The Group is controlled by the Asset Management Corporation of Nigeria who is also the ultimate parent.
Transactions between Polaris Bank Ltd and its subsidiaries also meet the definition of related party transactions.
Where these are eliminated on consolidation, they are not disclosed in the consolidated financial statements but
are disclosed in the books of the Bank.
The Group's key management personnel, and persons connected with them, are also considered to be related
parties. The definition of key management includes the close members of family of key personnel and any entity
over which they exercise control. The key management personnel have been identified as executive and non-
executive directors of the Group as well as their close family members. Close members of family are those family
members who may be expected to influence, or be influenced by that individual in their dealings with Polaris Bank
Ltd and its subsidiaries.
The compensation paid to key management is shown below:
Balances and transactions between the bank, its parent and its subsidiaries, which are related parties of the Bank,
have been eliminated on consolidation and are not disclosed in this note. Details of transactions between the Group
and other related parties are disclosed below.
Parties are considered to be related if one party has the ability to control the other party or to exercise significant
influence over the other party in making financial and operational decisions, or one other party controls both. The
definition includes subsidiaries, associates, joint ventures and the Group's pension schemes, as well as key
management personnel.
Bank
127

Polaris Bank Limited
Consolidated and separate financial statements
For the year ended 31 December 2019
Notes to the financial statements
(All amounts in millions of Naira unless otherwise stated)
40.3 Companies'/directors' related deposit liabilities
31 December 31 December
2019 2018
Balance, beginning of year 47 28
Deposits received during the year 1,253 1,140
Deposits repaid during the year (1,247) (1,121)
Balance, end of year 53 47
40.4 Subsidiaries deposit account balances
Name of company 31 December 31 December
2019 2018
Mainstreet Bank Estate Company Ltd 15 15
Mainstreet Securities Ltd 2 119
Skye Bank Guinea 365 359
Skye Finance and Investment Limited Dublin 1,251 1,182
1,633 1,675
40.5 Loans and advances to related parties
31 December 31 December
2019 2018
Loans outstanding at 1 January 328,965 288,111
Loans issued during the year 259 30
Exchange difference/Accrued interest Capitalized 30,510 40,842
Loan repayments during the year (16) (18)
Transferred to AMCON (325,371) -
Loans Outstanding as 31 December 2019 34,347 328,965
40.6 Other transactions with related parties
31 December 31 December
2019 2018
Interest income 2 6
Interest expense 84 228
Fee and commission income 1 1
Interest rates charged on balances outstanding are at rates that would be charged in the normal course of business.
Directors (and close family
members)
Directors (and close family
members)
Directors (and close family
members)
128

Polaris Bank Limited
Consolidated and separate financial statements
For the year ended 31 December 2019
(All amounts in millions of Naira unless otherwise stated)
40.7 Insider related credits
31 December 2019
Name of company/individual Name of related interest Relationship to
Reporting
Institution
Type Amount Loan status Collateral perfection
status
Nature of security and security
status
ABIMBOLA IZU Abimbola Izu Ex-Director MORTGAGE LOAN 103 Lost Not Applicable Legal mortgage & Domicilition
ABIMBOLA IZU Abimbola Izu Ex-Director TERM LOAN 17 Lost Not Applicable Legal mortgage & Domicilition
DEMANTA NIGERIA LIMITED Mrs Ibiye Ekong Ex-Director C/A BAL 112 Lost Not Perfected Legal mortgage
DOTUN ADENIYI Dotun Adeniyi Ex-Director MORTGAGE LOAN 27 Lost Not Applicable Legal mortgage & Domicilition
HOME AND YOU LIMITED Tokunbo M. Abiru Director OVERDRAFT 0 Performing Perfected Debenture
Ib. Elect. Distr. Mkt. Co. Ltd Tunde Ayeni Ex-Director C/A Bal 7 Performing Not Applicable
Fets Float Account Tunde Ayeni Ex-Director C/A Bal 209 Performing Not Applicable
Ibiye Ekong Ibiye Ekong Ex-Director Mortgage Loan 4 Lost Not Applicable Legal mortgage
Ibiye Ekong Ibiye Ekong Ex-Director Auto Loan 4 Lost Not Applicable Lien on Asset
Newcross Exploration and Production Jason Fadeyi Ex-Director Term Loan 13,051 Watchlist Perfected Debenture on Assets of the
CompanyNewcross Exploration and Production Jason Fadeyi Ex-Director C/A Bal 6,747 Watchlist Perfected Debenture on Assets of the
CompanySanni Adebayo Lateef Sanni Adebayo Lateef Ex-Director Mortgage Loan 73 Lost Not Applicable Legal mortgage & Domicilition
Theodora Amaka Onwughalu Theodora Amaka Onwughalu Ex-Director Mortgage Loan 19 Lost Not Applicable Legal mortgage & Domicilition
Timothy A Oguntayo Timothy A Oguntayo Ex-Director Mortgage Loan 100 Lost Not Applicable Legal mortgage & Domicilition
Yedc-Emcon Capmi A/C Tunde Ayeni Ex-Director C/A Bal 0 Lost Not Applicable Legal mortgage & Domicilition
20,473
The Group granted various credit facilities to companies whose directors are also directors of Polaris Bank Plc. at rates and terms comparable to other facilities in the Group's portfolio. An aggregate of N20.47 billion was
outstanding on these facilities at the end of the period. This disclosure is in compliance with the requirements of the Banking and Other Financial Institutions Act (BOFIA). The table below provides further details:
129

Polaris Bank Limited
Consolidated and separate financial statements
For the year ended 31 December 2019
(All amounts in millions of Naira unless otherwise stated)
40.7 Insider related credits
31 December 2018
Name of
company/individual
Name of related interest Relationship to
Reporting
Institution
Type Amount Loan status Collateral perfection
status
Nature of security and
security status
HOME AND YOU LIMITED Tokunbo M. Abiru Director OVERDRAFT 6 Performing Perfected Fixed and floating debenture
on all the company's assetsHOME AND YOU LIMITED Tokunbo M. Abiru Director TERM LOAN 9 Performing Perfected Lien on plant & machineries
HOME AND YOU LIMITED Tokunbo M. Abiru Director LEASE 7 Performing Perfected Lien on plant & machineries
HOME AND YOU LIMITED Tokunbo M. Abiru Director ADVANCE 9 Performing Perfected Lien on plant & machineries
Abimbola Izu Abimbola Izu Ex-Director Term Loan 120 Non Performing Perfected Legal mortgage
Beam Corporate Resources
Limited
Dr Jason Fadeyi Ex-Director Term Loan 56,107 Non Performing Not Applicable Domiciliation
Everest Nominees Limited Dr Jason Fadeyi Ex-Director Term Loan 80,829 Non Performing Not Applicable Domiciliation
Newcross Exploration and
Production
Dr Jason Fadeyi Ex-Director Term Loan 18,939 Non Performing Registered Debenture Asset debenture
Pan Ocean Oil Corporation Dr Jason Fadeyi Ex-Director Term Loan 62,371 Non Performing Not Applicable Domiciliation
Trensix Energy Services
Limited
Dr Jason Fadeyi Ex-Director Term Loan 55,934 Non Performing Not Applicable Corporate guarantee
Premiere Academy Akinsola Akimfemiwa Ex-Director Term Loan 50 Non Performing Not Perfected Legal mortgage
Bayo Sanni Bayo Sanni Ex-Director Term Loan 73 Non Performing Not Applicable Legal mortgage
Theodora Amaka Onwughalu Theodora Amaka Onwughalu Ex-Director Term Loan 19 Non Performing Not Applicable Lien on fixed deposit
Dotun Adeniyi Dotun Adeniyi Ex-Director Term Loan 27 Non Performing Not Perfected Debenture
Markie Magdalene Idowu Markie Magdalene Idowu Ex-Director Term Loan 10 Non Performing Not Perfected Legal mortgage
Michael Tarfa Michael Tarfa Ex-Director Term Loan 12 Non Performing Not Perfected Domiciliation of funds
Integrated Energy Distribution Tunde Ayeni Ex-Director Term Loan 24,290 Non Performing Not Perfected Legal mortgage and debenture
Natcom Development &
Investment Ltd
Tunde Ayeni Ex-Director Term Loan 10,388 Non Performing Not Perfected Legal mortgage
Olutoyl Estate Devt ltd Tunde Ayeni Ex-Director Term Loan 3,769 Non Performing Not Perfected Legal mortgage and debenture
PPP Fluid Mechanics Tunde Ayeni Ex-Director Term Loan 113 Non Performing Not Applicable Legal Mortgage
Demanta Nigeria Limited Ibiye Ekong Ex-Director Term Loan 130
Mr Timothy Oguntayo Mr Timothy Oguntayo Ex-Director Term Loan 100 Non Performing Not Applicable Domiciliation of funds
313,312
130

Polaris Bank Limited
Consolidated and separate financial statements
For the year ended 31 December 2019
(All amounts in millions of Naira unless otherwise stated)
40.8 Risk assets outstanding
Directors' off balance-sheet engagement
Name of
company/Individual
Name of related interest Type Loan status Collateral
perfection
status
Nature of security
and security status
31
December
2019
31
December
2018
Home and You Mr. Tokunbo Abiru Bank Guarantee Performing Not perfected Legal mortgage 181 131
Ibadan Electricity Distribution
Co
Mr. Tunde Ayeni Bank Guarantee Lost N/A Cash backed 10,980 10,980
Yola Electricity Distribution
Co
Mr. Tunde Ayeni Bank Guarantee Lost N/A Guarantee 2,715 2,715
Metropolitan Construction
Coy Ltd
Alh. Musiliu Smith Advance Payment
Guarantee
- 819
Natcom Development &
Investment Ltd
Mr. Tunde Ayeni Bank Guarantee - 1,010
13,876 15,655
41 Contingent liabilities and commitments
41.1 Legal proceedings
41.2 Capital commitments
41.3
Group Group Bank Bank
31 December 31 December31 December31 December
2019 2018 2019 2018
Performance bonds and
guarantees
50,427 40,356 50,427 40,356
Letters of credit 4,418 2,187 4,418 2,187
54,845 42,543 54,845 42,543
In the normal course of business, the Group is party to financial instruments with off-balance sheet risk - acceptances, performance bonds and indemnities. The
instruments are used to meet the credit and other financial requirements of customers.
Guarantees and letters of credit are given as security to support the performance of a customer to third parties. As the Group will only be required to meet these
obligations in the event of the customer’s default, the cash requirements of these instruments are expected to be considerably below their nominal amounts.
Other contingent liabilities include transaction related customs and performances bond and are, generally, commitments to third parties which are not directly
dependent on the customer’s creditworthiness. Documentary credits commit the Group to make payments to third parties, on production of documents, which are
usually reimbursed immediately by customers. The following tables summarises the nominal principal amount of contingent liabilities and commitments.
Off-balance sheet engagements
There were contingent liabilities in respect of claims and litigations against the Group as at 31 December 2019 amounting to N212 billion. These claims arose in
the normal course of business and are being contested by the Group. The solicitors of the Group are of the view that probable liability which may arise from the
cases pending against the bank is not likely to exceed N 7.8 billion. This probable liability has been fully provided for. (Please refer to note 35)
At the balance sheet date, the Group had no capital commitments in respect of authorized and contracted capital projects for information technology equipment
and software.
131

Polaris Bank Limited
Consolidated and separate financial statements
For the year ended 31 December 2019
(All amounts in millions of Naira unless otherwise stated)
42 Statement of prudential adjustment
Total impairment Total Total impairment Total
Provision per CBN Guidelines 70,007 70,007 254,579 254,579
Impairment allowance per IFRS 100,607 100,607 226,662 226,662
Amount required in regulatory risk reserve - - 27,917 27,917
43 Events after the reporting period
43.1
43.2
Regulatory Body
Central Bank of Nigeria
Central Bank of Nigeria
43.3
The reconciliation between the CBN recommended provisions and that under IFRS is as shown in the table below:
The new Finance Act was signed into law on 13th January 2020 and is the basis upon which the Bank's tax was calculated.
20182019
Contraventions of the Banks and Other Financial Institutions Act of Nigeria and CBN circulars
Sum of N2 million relating to failure of the bank to implement
two of the prior year's recommendations from the external
auditor's management letter.
Sum of N4 million relating to the bank writing-off an insider
related loan to Onas Farms Limited without CBN approval.
Infraction
For the contraventions mentioned above, the bank was fined in year 2020
A novel strain of coronavirus (COVID-19) that first surfaced in China was classified as a pandemic by the World Health Organization
on March 11, 2020, impacting countries globally. The potential impacts from COVID-19 remain uncertain, including, among other
things, on economic conditions, businesses and consumers.
The Nigerian financial industry is committed to preserving confidence, financial stability and support for the economy. The Central
Bank has committed over N3.5 trillion in stimulus and various moratorium arrangements for loans to the Nigerian economy to
ameliorate the pains arising from the COVID-19 health and economic crisis. The Federal Government and the private sector have also
committed to provide support required to raise public awareness as well as the resources to combat this deadly disease.
The bank plans to restructure certain credit facilities in line with pronouncement of the Central bank of Nigeria . Also in the short
term,the bank would only continue to advance credit facilities to companies whose services have been defined as essential by the
government.
The directors of the bank are confident that the bank will continue to operate in the forseeable future as the banking activities are
essential. The bank continues to operate and serve its customers.
132

Polaris Bank Limited
Consolidated and separate financial statements
For year ended 31 December 2018
(All amounts in millions of Naira unless otherwise stated)
44 Segment reporting
44.1 Operating segments by business segment
Retail banking
Commercial banking
Treasury, Corporate and Investment banking
No single external customer accounts for 10% or more of the Bank’s revenue.
Information regarding the results of each reportable segment is included below. Performance is measured based
on segment profit before income tax, as included in the internal management reports that are reviewed by the
Executive Management Committee. Segment profit is used to measure performance as management believes that
such information is the most relevant in evaluating the results of certain segments relative to other entities that
operate within these industries. Inter-segment pricing is determined on an arm’s length basis.
The measurement policies the Bank uses for segment reporting are the same as those used in its financial
statements. There have been no changes from prior periods in the measurement methods used to determine
reported segment profit or loss.
The Bank is divided into three main business segments, as described below, which are the Bank's strategic
business units. The strategic business units offer varied products and services and are managed separately based
on the Bank Management's structure.
Operating segments are reported in accordance with the internal reports provided to the Bank's Executive
Management Committee which is responsible for allocating resources to the operating segments and assessing its
performance.
Retail banking incorporates private banking services, private customer current accounts, deposits, investment
savings products, custody, credit and debit cards, consumer loans and mortgages.
Commercial banking incorporates direct debit facilities, current accounts, deposits, overdrafts, loan and other
credit facilities, foreign currency and derivative products.
Treasury, corporate and investment banking incorporates financial instruments trading, structured financing and
corporate leasing.
133

Polaris Bank Limited
Consolidated and separate financial statements
For year ended 31 December 2018
(All amounts in millions of Naira unless otherwise stated)
Bank
31 December 2019Treasury
corporate
Retail
banking
Commercial
banking
Total
Revenue:Derived from external customers 51,269 42,349 57,230 150,848
Derived from other business segments - - - -
Total revenue 51,269 42,349 57,230 150,848
Interest expenses (8,596) (12,746) (24,472) (45,814)
Fee and commission
expenses
(688) (1,438) (1,141) (3,267)
Net operating (loss)/
income
41,985 28,165 31,617 101,767
Expense:
Employee benefit and compensation cost (5,582) (11,627) (9,219) (26,428)
Administration and general expenses (7,692) (11,939) (10,397) (30,028)
(10,734) (463) (1,762) (12,959)
(865) (2,039) (1,617) (4,521)
Total cost (24,873) (26,068) (22,995) (73,936)
17,111 2,097 8,622 27,830
Income tax expense - - - -
17,111 2,097 8,622 27,830
Assets
Loans and advances to customers 63,875 25,013 99,851 188,739
Others 921,617 14,146 18,765 954,528
Total assets 985,492 39,159 118,616 1,143,267
Liabilities
Deposits from customers 59,759 385,518 412,609 857,886
Others (excluding Tax) 96,797 3,662 101,453 201,912
Total liabilities 156,556 389,180 514,062 1,059,798
Revenue is made up of : 131,650
Interest income on fair value through profit/loss 1,961
Net fee and commission 11,803
Other operating income 4,484
Net trading and foreign 950
150,848
Loan impairment charges and impairment charges
on other financial assets
Depreciation and amortisation
Profit before income tax from reportable segments
Loss after income tax from reportable
segments
Interest income on amortized cost financial assets
134

Polaris Bank Limited
Consolidated and separate financial statements
For year ended 31 December 2019
(All amounts in millions of Naira unless otherwise stated)
Other National Disclosures

Polaris Bank Limited
Consolidated and separate financial statements
For the year ended 31 December 2019
(All amounts in millions of Naira unless otherwise stated)
Other National Disclosures
31
December
31
December
31
December
31
December
Group 2019 % 2019 % 2018 % 2018 %
Gross income 147,094 147,581 37,392 37,392
Interest expense (45,814) (45,814) (15,212) (15,212)
101,280 101,767 22,180 22,180
Administrative overheads:
- Local (28,863) (28,863) (9,215) (9,215)
- Foreign - - - -
Value added 72,417 72,904 12,965 12,965
Distribution
Employees
- Wages & salaries and other staff cost 26,428 36% 26,428 36% 6,606 51% 6,606 51%
Government
- Taxation 479 1% 479 1% 25 0% 25 0%
The future
- Asset replacement (depreciation) 4,290 6% 4,290 6% 1,012 8% 1,012 8%
- Local
- Asset replacement (amortisation) 231 0% 231 0% 95 1% 95 1%
- Local
- Impairment loss 14,126 20% 14,126 19% 2,796 22% 2,796 22%
- Expansion (transfers to reserves) 26,863 37% 27,350 38% 2,431 19% 2,431 19%
72,417 100% 72,904 100% 12,965 100% 12,965 100%
Group BankGroup Bank
136