consolidated and separate financial statements … statements... · union bank of nigeria plc and...
TRANSCRIPT
Union Bank of Nigeria Plc
Consolidated and Separate Financial Statements
For the year ended 31st December 2014
Union Bank of Nigeria Plc and Subsidiary Companies
Consolidated and separate financial statements - 31 December 2014
Together with Directors’ and Auditor’s Reports
1
Table of Contents Page
Corporate information 2
Corporate governance 4
Directors’ report 15
Statement of directors’ responsibilities 25
Report of the Audit Committee 26
Independent auditor’s report 27
Consolidated and separate statement of profit or loss and other comprehensive income 29
Consolidated and separate statements of financial position 31
Consolidated and separate statements of changes in equity 32
Consolidated and separate statements of cash flow 34
Notes to the consolidated financial statements 36
Value Added Statement 106
Financial summary 107
Union Bank of Nigeria Plc and Subsidiary Companies
Consolidated and separate financial statements - 31 December 2014
Together with Directors’ and Auditor’s Reports
2
CORPORATE INFORMATION
Directors
Udoma Udo Udoma, CON - Chairman
Emeka Emuwa - Group Managing Director
Adekunle Mickey Adeosun - Executive Director
Oyinkansade Adewale - Executive Director/Chief Financial Officer
Kandolo Kasongo - Executive Director/Chief Risk Officer
Ibrahim Abubakar Kwargana - Executive Director
Godson Chukwuemeka Okonkwo - Executive Director
Mansur Ahmed - Non-Executive Director
Onikepo Olufunmike Akande, CON - Non-Executive Director
John Botts - Non-Executive Director
Richard Burrett - Non-Executive Director
Richard Lee Kramer - Non-Executive Director
Douglas Munatsi - Non-Executive Director ****
Cyril Odu - Non-Executive Director
Adeyemi Osindero - Non-Executive Director
Dickie Agumba Ulu - Non-Executive Director ****
Ian Clyne - Non-Executive Director *
Saidu Mohammed-Jallo - Non-Executive Director **
James Macarthur - Non-Executive Director ***
* Appointed with effect from 27th August, 2014
** Appointed with effect from 4th November, 2014 and resigned 24th February, 2015
*** Resigned with effect from 26th February, 2014
**** Resigned with effect from 24th February, 2015
Company Secretary
Somuyiwa Adedeji Sonubi
FRC/2013/NBA/00000002061
Registered office
Union Bank of Nigeria Plc
Stallion Plaza
36 Marina
Lagos
Union Bank of Nigeria Plc and Subsidiary Companies
Consolidated and separate financial statements - 31 December 2014
Together with Directors’ and Auditor’s Reports
3
Auditors:
KPMG Professional Services
KPMG Tower
Bishop Aboyade Cole Street
Victoria Island,
Lagos
Registrar & Transfer Office
GTL Registrars Limited (formerly Union Registrars Limited)
2, Burma Road
Apapa
Lagos
Union Bank of Nigeria Plc and Subsidiary Companies
Consolidated and separate financial statements - 31 December 2014
Together with Directors’ and Auditor’s Reports
4
CORPORATE GOVERNANCE
Introduction
Corporate Governance practices in Union Bank of Nigeria Plc are as codified in the Central Bank of Nigeria Code
of Corporate Governance 2006, and the 2014 revision with effect from 1st October 2014, the Securities and
Exchange Commission Code of Corporate Governance 2003, the Banks’ and Other Financial Institutions Act
1991 (as amended) and other relevant statutes which provide guidance for the governance of the Bank and in
compliance with regulatory requirements as well as the core values upon which the Bank was founded. These
codes/statutes are geared towards ensuring the accountability of the Board and Management to the stakeholders of
the Bank in particular and emphasize the need to meet and address the interests of a range of stakeholders so as to
promote the long-term sustainability of the Bank.
Union Bank of Nigeria Plc is committed to the best corporate governance practices and believes that adherence
and commitment to high governance principles and standards is the panacea for effective control and management
of the Bank. The principle of good corporate governance practices remains one of our core values and an
important ingredient in creating, protecting, promoting and sustaining shareholders’ interests, rights and values as
well as delivering excellent service to our customers. The Bank is committed to the highest ethical standards and
transparency in the conduct of its business.
In compliance with the requirements of the CBN, the Bank undertakes internal reviews of its compliance with
defined corporate governance practices and submits reports on the Bank’s compliance status to the CBN. An
annual Board Appraisal review is also conducted by an Independent Consultant appointed by the Bank whose
report is submitted to the CBN and presented to Shareholders at the Annual General Meeting of the Bank in
compliance with the provisions of the CBN Code of Corporate Governance.
Governance Structure
The following governance bodies are in place;
A. The Board of Directors
The Bank is managed by a Board of Directors, which comprises a Non-Executive Chairman, ten Non-Executive
Directors, the Group Managing Director/Chief Executive and five Executive Directors as listed below:
Udoma Udo Udoma, CON - Chairman
Emeka Emuwa - Group Managing Director
Adekunle Mickey Adeosun - Executive Director
Oyinkansade Adewale - Executive Director/Chief Financial Officer
Kandolo Kasongo - Executive Director/Chief Risk Officer

Union Bank of Nigeria Plc and Subsidiary Companies
Consolidated and separate financial statements - 31 December 2014
Together with Directors’ and Auditor’s Reports
5
Ibrahim Abubakar Kwargana - Executive Director
Godson Chukwuemeka Okonkwo - Executive Director
Mansur Ahmed - Non-Executive Director
Onikepo Olufunmike Akande, CON - Non-Executive Director
John Botts - Non-Executive Director
Richard Burrett - Non-Executive Director
Richard Lee Kramer - Non-Executive Director
Douglas Munatsi - Non-Executive Director ****
Cyril Odu - Non-Executive Director
Adeyemi Osindero - Non-Executive Director
Dickie Agumba Ulu - Non-Executive Director ****
Ian Clyne - Non-Executive Director *
Saidu Mohammed-Jallo - Non-Executive Director **
James Macarthur - Non-Executive Director ***
* Appointed with effect from 27th August, 2014
** Appointed with effect from 4th November, 2014 and resigned 24th February, 2015
*** Resigned with effect from 26th February, 2014
**** Resigned with effect from 24th February, 2015
Responsibilities of the Board of Directors
The Board, the highest decision making body approved by the Shareholders, met five (5) times during the year to
provide strategic direction, policies and leadership in attaining the objectives of the Bank.
The Board monitors the activities of the Group Managing Director and Executive Directors and the
accomplishment of set objectives through reports at its meetings. In performing its oversight function over the
Bank’s business, the Board operates through the following Board and Management Committees whose
composition and functions are listed below:
B. Standing Board Committees
The Board of Directors has five Standing Committees, which deal with specific operations of the Bank, namely:
1. Board Credit Committee
2. Board Finance & General Purpose Committee
3. Board Establishment & Services Committee
4. Board Risk Management Committee
5. Board Remuneration Committee
In addition, there is an Independent Committee – The Audit Committee.

Union Bank of Nigeria Plc and Subsidiary Companies
Consolidated and separate financial statements - 31 December 2014
Together with Directors’ and Auditor’s Reports
6
1. Board Credit Committee
The Committee met seven (7) times during the year. It is comprised of the following members:
Yemi Osindero - Chairman
Emeka Emuwa - Member
Adekunle Mickey Adeosun - Member
John Botts - Member
Ian Clyne - Member*
Kandolo Kasongo - Member
Ibrahim Kwargana - Member
James Macarthur - Member**
Douglas Munatsi - Member ***
Cyril Odu - Member
Godson Chukwuemeka Okonkwo - Member
Dickie Agumba Ulu - Member ***
* Appointed on 27th August, 2014
** Resigned with effect from 26th February, 2014
*** Resigned with effect from 24th February, 2015
Its responsibilities include the following amongst others:
consider and approve credits within its set limit;
recommend credits above its limit to the Board for consideration and approval;
review of credit portfolio; and
serve as a catalyst for credit policy changes from the Credit committee to the Board.
2. Board Finance and General Purposes Committee
The Committee met eleven (11) times during the year. It is comprised of the following members:
Richard Kramer - Chairman
Emeka Emuwa - Member
Adekunle M. Adeosun - Member
Oyinkansade Adewale - Member
Mansur Ahmed - Member
Onikepo Olufunmike Akande, CON - Member
Richard Burrett - Member
Ian Clyne - Member*
Kandolo Kasongo - Member

Union Bank of Nigeria Plc and Subsidiary Companies
Consolidated and separate financial statements - 31 December 2014
Together with Directors’ and Auditor’s Reports
7
James Macarthur - Member**
Cyril Odu - Member
Godson Chukwuemeka Okonkwo - Member
* Appointed on 27th August, 2014
** Resigned with effect from 26th February, 2014
Its responsibilities include the following amongst others:
consider and approve tenders, purchases and expenditure of up to 30% of approved Budget;
consider, review and recommend to the Board all tenders, purchases and expenditure above 30% of approved
Budget;
receive and consider monthly expenditures on leases, sales of assets, donations and scholarships and where
appropriate, recommend to the Board;
formulate guidelines from time to time on cost control, reductions consistent with maximum efficiency and
make appropriate recommendations to the Board;
consider proposals on strategic planning and assets/liability management and make appropriate
recommendation to the Board; and
consider and recommend the Bank’s accounts and budgets to the Board.
3. Board Establishment and Services Committee
The Committee met seven (7) times during the year. It is comprised of the following members:
Dickie Agumba Ulu - Chairman *
Emeka Emuwa - Member
Adekunle Mickey Adeosun - Member
Oyinkansade Adewale - Member
Mansur Ahmed - Member
Onikepo Olufunmike Akande, CON - Member
John Botts - Member
Richard Burrett - Member
Saidu Mohammed-Jallo - Member**
Richard Kramer - Member
Ibrahim Kwargana - Member
* Appointed with effect from 24th February, 2015
** Appointed with effect from 4th November, 2014 and resigned 24th February, 2015

Union Bank of Nigeria Plc and Subsidiary Companies
Consolidated and separate financial statements - 31 December 2014
Together with Directors’ and Auditor’s Reports
8
Its responsibilities include the following amongst others:
consider, approve and recommend appointments, promotions and discipline of Principal Managers and above;
consider and recommend increments for Principal Managers and above;
consider and review staff welfare and industrial relations matters and make appropriate recommendations to
the Board from time to time; and
formulate and recommend strategic and succession plans for the Bank.
4. Board Risk Management and Control Committee
The Committee met four (4) times during the year. It is comprised of the following members:
Cyril Odu - Chairman
Emeka Emuwa - Member
Oyinkansade Adewale - Member
Mansur Ahmed - Member
Onikepo Olufunmike Akande, CON - Member
Saidu Mohammed-Jallo - Member*
Kandolo Kasongo - Member
Ibrahim Kwargana - Member
Douglas Munatsi - Member **
Yemi Osindero - Member
Godson Chukwuemeka Okonkwo - Member
Dickie Agumba Ulu - Member **
* Appointed with effect from 4th November, 2014 and resigned 24th February, 2015
** Resigned with effect from 24th February, 2015
Its responsibilities include the following amongst others:
develop an organization-wide Risk Management framework;
exercise a Board oversight function on all risk related issues;
ensure compliance with the Bank’s organization-wide policies/framework covering all risk types (credit,
market, assets & liabilities, strategic, legal, human resources etc);
ensure compliance with all statutory/regulatory requirements; and
consider departmental reports and advise Management on risks.

Union Bank of Nigeria Plc and Subsidiary Companies
Consolidated and separate financial statements - 31 December 2014
Together with Directors’ and Auditor’s Reports
9
5. Board Remuneration Committee
The Committee met five (5) times during the year. It is comprised of the following members:
John Botts - Chairman
Richard Burrett - Member
Ian Clyne - Member*
Richard Kramer - Member
Douglas Munatsi - Member **
Yemi Osindero - Member
* Appointed on 27th August, 2014
** Resigned with effect from 24th February, 2015
The Committee’s responsibilities include amongst others:
consider, approve and recommend the performance parameters for Executive Management;
consider and recommend compensation for Executive Management;
consider and review the performance of the Group Managing Director.
6. Audit Committee
This is a Committee constituted at the Bank’s Annual General Meeting (AGM).
It is comprised of the following members:
Musa Bichi - Chairman
Mansur Ahmed - Member
Onikepo Olufunmike Akande, CON - Member
Matthew Akinlade - Member
Marcel Ojinka - Member
Dickie Agumba Ulu - Member *
** Resigned with effect from 24th February, 2015
The Audit Committee has oversight responsibility for the following within the Bank:
accounting and financial reporting functions;
accounting system;
internal control structures;
recommending the appointment, remuneration and removal of external auditors to the Board; and
reviewing and recommending the financial statements to the Board for approval.

Union Bank of Nigeria Plc and Subsidiary Companies
Consolidated and separate financial statements - 31 December 2014
Together with Directors’ and Auditor’s Reports
10
C. Management Committees
The Bank has the following Management Committees:
1. Executive Management Committee (EXCO)
2. General Management Committee (GEMCO)
3. Assets and Liabilities Committee (ALCO)
4. Credit Committee (CRECO)
5. IT Steering Committee
6. Criticized Assets Committee
7. Customer Operations and Service Committee (COSCO)
1. Executive Management Committee – (EXCO)
The Executive Management Committee, which comprises of all Executive Directors and the Group Managing
Director, holds weekly meetings. It is chaired by the Group Managing Director.
The Committee is charged with the responsibility of:
deliberating and taking decisions on the effective and efficient management of the Bank;
ensuring the implementation of strategies approved by the Board;
providing leadership to the management team; and
ensuring efficient deployment and management of the Bank’s resources
2. General Management Committee – (GEMCO)
The Committee is composed of all staff in the General Management cadre. The actual composition is dynamic
and depends on the operational structures of the Bank at any given time. It meets quarterly or as the need arises.
Its responsibilities include the following amongst others:
review the performance reports from Branch, zonal offices and Head Office departments and identify
strategies for meeting agreed targets;
deliberate and resolve outstanding and/or peculiar problems of any business development centre and zone;
and
update managers and other executives with latest developments in the Bank’s operations and/or new policy
thrusts from the Central Bank of Nigeria and other Regulatory Bodies.
3. Assets and Liabilities Committee (ALCO)
The Assets and Liabilities Committee meets fortnightly and is charged with the following responsibilities:
management of the Bank’s assets and liabilities;
balance sheet management;
interest rate management;
cash flow management;

Union Bank of Nigeria Plc and Subsidiary Companies
Consolidated and separate financial statements - 31 December 2014
Together with Directors’ and Auditor’s Reports
11
foreign exchange and trading portfolio management; and
management of market and liquidity risks of the business.
4. Credit Committee (CRECO)
The Credit Committee meets weekly and its specific functions include the following:
to formulate and review policies regarding loans and advances;
to approve credits within the set limit;
to consider and recommend all credit matters above its limit to the Board Credit Committee or the Board for
approval; and
to review the quality and structure of the Bank’s credit portfolio.
5. IT Steering Committee
This Committee deals with IT related policy matters as follows:
developing and reviewing regularly, an appropriate IT Strategy for the Bank;
ensuring the Bank is well positioned for current and emerging information technology issues;
establishing programs that ensure high computer literacy among the Bank’s staff; and
advising Management on IT trends and developments.
Monitoring the progress of key IT projects such as Flexcube Universal Banking Solution (FCUBS)
6. Criticized Assets Committee
The Committee meets fortnightly to deliberate on the following:
monthly credit portfolio review;
weekly review of recovery and the recovery process;
7. Customer Operations and Services Committee (COSCO)
The Customer Operations and Services Committee reviews and identify major weaknesses/challenges inhibiting
effective service delivery in the Bank with a view to proffering and implementing solutions to issues identified
within a given time frame.
The Committee meets weekly with the following terms of reference:
weekly review of outstanding reconciliation Items;
identify gaps, issues and challenges in service delivery;
streamline processes to address the issues identified;
improve the bank’s capability for efficient service delivery;
maintain and improve the controls around processes of enabler departments; and
adequately capacitate enabler departments such as IT, Operations, Quality Assurance, Revenue Assurance,
Internal Control, Inspection, Legal, Customer Care, Marketing, Property, Human Resources, E-Business, Risk
and Finance/Business Strategy.

Union Bank of Nigeria Plc and Subsidiary CompaniesConsolidated and separate financial statements - 31 December 2014
Together with Directors’ and Auditor’s Reports
BOARD ATTENDANCE SCHEDULE
S/NO NAME 25-Feb-14 29-Apr-14 17-Jun-14 17-Jun-14 23-Sep-14 25-Nov-141 UDOMA, Udo Udoma (CON) X X X X X X2 EMEKA, Emeka X X X X X X3 ADEOSUN, Mickey Adekunle X X X X X X4 ADEWALE, Oyinkansade X X X X X X5 KASONGO, Kandolo x X X X X X6 KWARGANA Ibrahim Abubakar X X X X X X7 OKONKWO, Godson Chukwuemeka x X X X X X8 AHMED, Mansur x X X X X O9 AKANDE, Onikepo Olufunmike (CON) X X X X O X
10 BOTTS, John X X X X X X11 BURRETT, Richard O X X X X O12 CLYNE, Ian X X13 JALLO, Saidu Mohammed X14 KRAMER, Richard Lee X X X X X X15 MACARTHUR, James X16 MUNATSI, Douglas X X O O O O17 ODU, Akporuere Cyril X X X X X O18 OSINDERO, Adeyemi X X X X X O19 ULU, Dickie Agumba X X X X X X
X PRESENTO ABSENTX AGM
12

Union Bank of Nigeria Plc and Subsidiary CompaniesConsolidated and separate financial statements - 31 December 2014
Together with Directors’ and Auditor’s Reports
BOARD CREDIT COMMITTEE ATTENDANCE SCHEDULE
S/NO NAME 19-Feb-14 23-Apr-14 16-Jun-14 21-Jul-14 17-Sep-14 27-Oct-14 28-Nov-141 OSINDERO, Adeyemi X X X X X X X2 EMEKA, Emuwa X X X X X X X3 ADEOSUN, Adekunle Mickey X X X X X X X4 BOTTS, John X X X X O X X5 CLYNE, Ian X X X6 KANDOLO, Kasongo X X X X X X X7 KWARGANA Ibrahim Abubakar X X X X X X O8 ODU, Cyril X X X X X X X9 OKONKWO, Godson Chukwuemeka X X X X X X X
10 MUNATSI, Douglas O O O X X X X11 ULU, Dickie Agumba X X X X X X X
X PRESENTO ABSENT
BOARD RISK MANAGEMENT COMMITTEE
S/NO NAME 24-Feb-14 28-Apr-14 22-Sep-14 24-Nov-141 ODU, Cyril X X X X2 EMEKA, Emuwa X X X X3 ADEWALE, Oyinkan X X X X4 AHMED, Mansur O O X O5 AKANDE Onikepo (Dr) Mrs X X O X6 KANDOLO, Kasongo X X X X7 KWARGANA Ibrahim Abubakar X X X X8 MUNATSI, Douglas X X X O9 OKONKWO, Godson Chukwuemeka X X X X
10 OSINDERO Adeyemi X X X O11 ULU, Dickie Agumba X X X X
X PRESENTO ABSENT
13

Union Bank of Nigeria Plc and Subsidiary CompaniesConsolidated and separate financial statements - 31 December 2014
Together with Directors’ and Auditor’s Reports
BOARD ESTABLISHMENT & SERVICES COMMITTEE
S/NO NAME 24-Feb-14 26-Mar-14 23-Apr-14 28-Apr-14 16-Jun-14 17-Sep-14 19-Nov-141 ULU,Dickie Agumba X X X X X X X2 EMEKA, Emeka X X X X X X X3 ADEOSUN Mickey Adekunle X X X X X X X4 ADEWALE, Oyinkansade X X X X X X X5 AHMED, Mansur X X X X X X X6 AKANDE Onikepo (Dr) Mrs X O X X X X X7 BOTTS, John X X X X X O x8 BURRETT, Richard X X X X X X O9 KRAMER, Richard Lee O O X X X O x
10 KWARGANA Ibrahim Abubakar X X X X X X X
X X PRESENTO O ABSENT
BOARD FINANCE & GENERAL PURPOSE COMMITTEE
S/NO NAME 30-Jan-14 19-Feb-14 26-Mar-14 23-Apr-14 22-May-14 16-Jun-14 21-Jul-14 22-Sep-14 27-Oct-14 24-Nov-14 10-Dec-141 KRAMER, RICHARD LEE X X O X X X O X X X X2 EMEKA, Emeka X X X X X X X X X X X3 ADEOSUN Mickey Adekunle X X X X X X X X X X X4 ADEWALE, Oyinkansade X X X X X X X X X X X5 AHMED, Mansur X X X X O O X X X X O6 AKANDE Onikepo (Dr) Mrs X X O X O X X O X X O7 BURRETT, Richard X O X X X X X X O O X8 CLYNE, Ian X X X X9 KASONGO, Kandolo X X X X X X X X X X X
10 ODU, Akporuere Cyril X X X X X X X X X X X11 OKONKWO, Godson Chukwuemeka X X X X X X X X X X X12 MACARTHUR, James X O
X PRESENTO ABSENT
14

Union Bank of Nigeria Plc and Subsidiary Companies
Consolidated financial statements for the year ended 31 December 2014
Together with Directors’ and Auditor’s Reports
15
Directors’ Report
For the year ended 31st December 2014
The Directors present their report on the affairs of Union Bank of Nigeria Plc (“the Bank”) and its subsidiaries
(“the Group”), together with the consolidated audited financial statements and the auditor’s report for the
financial year ended 31st December 2014.
Legal form and principal activity
The Bank commenced operations in Nigeria in 1917 as a branch of Barclays Bank Dominion Colonial Overseas
(DCO) and was incorporated as a private company limited by Shares in Nigeria in 1969. It became a public
company limited by shares in 1970 with the Bank’s shares quoted on the Nigerian Stock Exchange.
During the year, the bank continued the divestment from its non-banking subsidiaries in line with the CBN
Regulation 3 on the Scope of Banking Activities and Ancillary Matters. The subsidiaries divested from so far are:
Union Assurance Company Limited, Union Registrars Limited, Union Capital Markets Limited, Union Insurance
Brokers Limited and Union Homes, Savings and Loans Plc.
As at 31 December 2014, the disposals of two other subsidiaries, Union Trustees Limited and Union Pension
Custodian Limited were almost concluded.
The principal activity of the Bank is the provision of banking and related financial services to corporate and
individual customers. Such services include the granting of loans and advances, acceptance of deposits and money
market activities.
The Group financial statement comprise the result of Union Bank Plc, Union Bank UK, while Atlantic Nominees
Limited, Union Trustees Limited and Union Properties Limited have been included as “Assets classified as held
for sale”.
Following a review of the Nigerian social and economic environments, including various government legislations
in recent years such as the Pension Reform Act (2004), Employee Compensation Act (2010), and the National
Health Insurance Scheme, the Directors approved the discontinuation of the Bank’s gratuity benefit scheme with
effect from 1st May 2014. Consequently, staff accrued gratuity liability as at 1st May 2014 was determined in
line with the gratuity and pension table in the Trust Deeds and all qualifying staff were paid a total of N12.59
billion in the form of cash and investments in term deposits on behalf of the staff members.
Union Bank of Nigeria Plc and Subsidiary Companies
Consolidated financial statements for the year ended 31 December 2014
Together with Directors’ and Auditor’s Reports
16
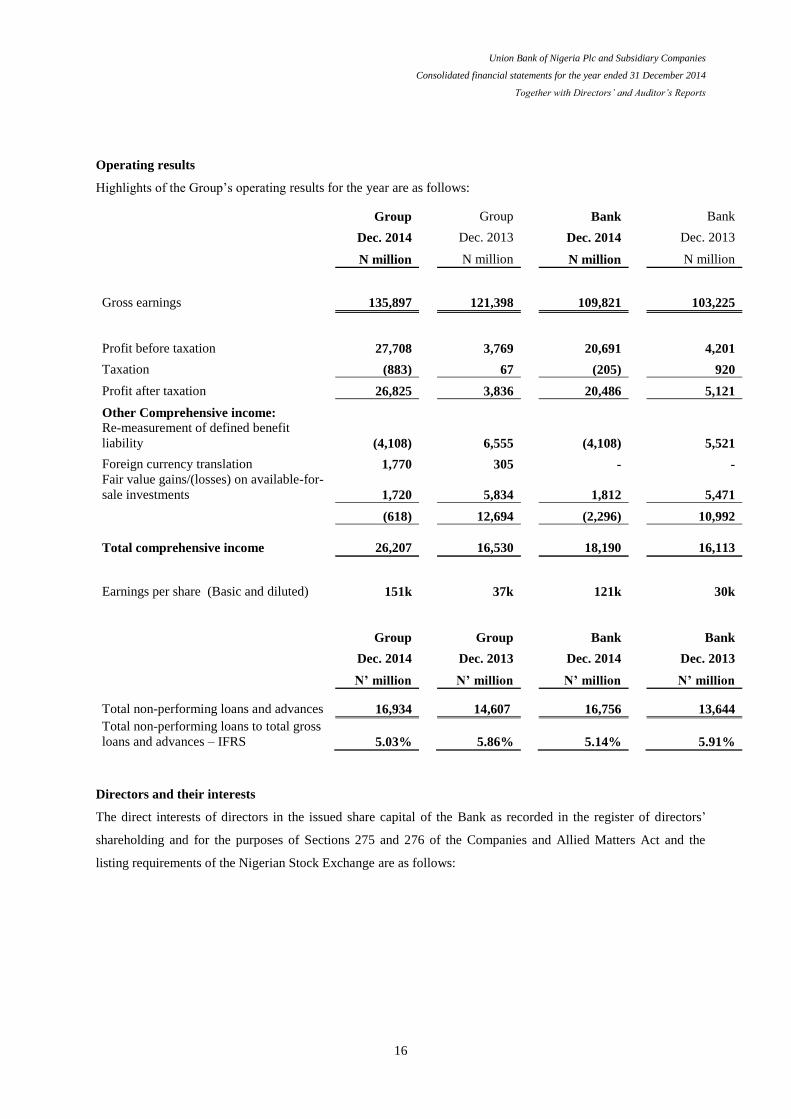
Operating results
Highlights of the Group’s operating results for the year are as follows:
Group
Group
Bank
Bank
Dec. 2014
Dec. 2013
Dec. 2014
Dec. 2013
N million
N million
N million
N million
Gross earnings 135,897
121,398
109,821
103,225
Profit before taxation 27,708
3,769
20,691
4,201
Taxation (883)
67
(205)
920
Profit after taxation 26,825
3,836
20,486
5,121
Other Comprehensive income:
Re-measurement of defined benefit
liability (4,108)
6,555
(4,108)
5,521
Foreign currency translation 1,770
305
-
-
Fair value gains/(losses) on available-for-
sale investments 1,720
5,834
1,812
5,471
(618)
12,694
(2,296)
10,992
Total comprehensive income
26,207
16,530
18,190
16,113
Earnings per share (Basic and diluted) 151k 37k 121k 30k
Group
Group
Bank
Bank
Dec. 2014
Dec. 2013
Dec. 2014
Dec. 2013
N’ million
N’ million
N’ million
N’ million
Total non-performing loans and advances 16,934
14,607
16,756
13,644
Total non-performing loans to total gross
loans and advances – IFRS 5.03%
5.86%
5.14%
5.91%
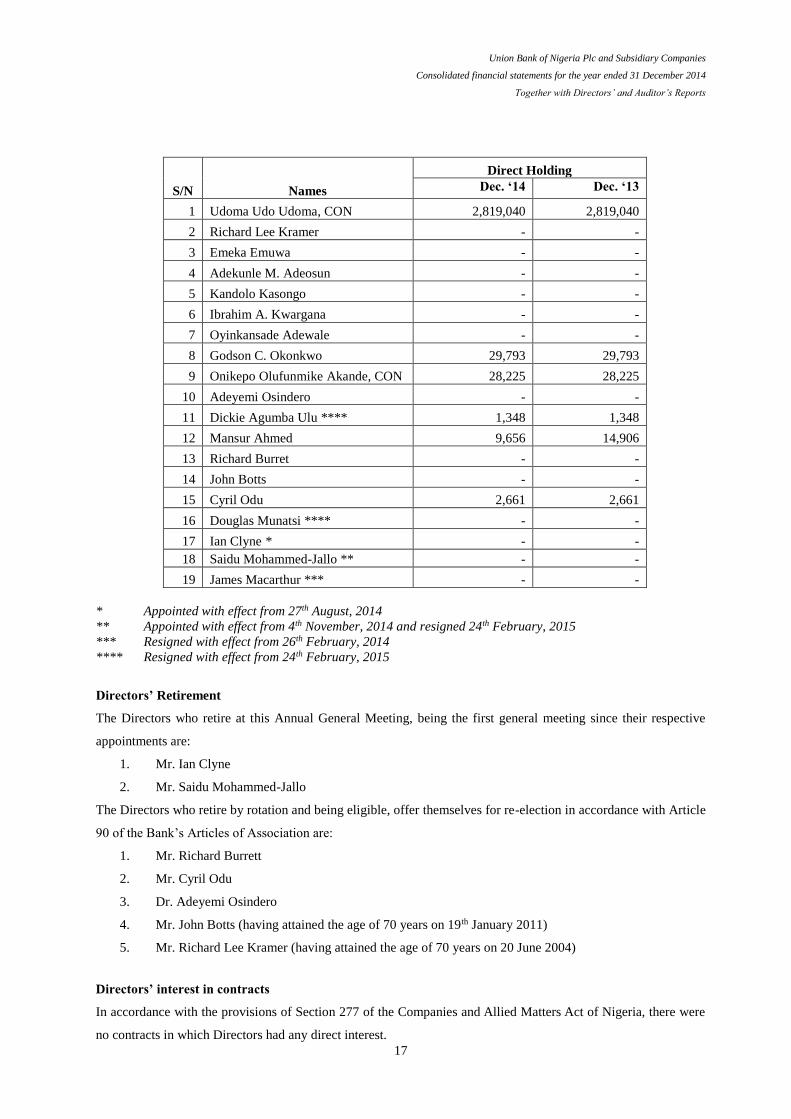
Directors and their interests
The direct interests of directors in the issued share capital of the Bank as recorded in the register of directors’
shareholding and for the purposes of Sections 275 and 276 of the Companies and Allied Matters Act and the
listing requirements of the Nigerian Stock Exchange are as follows:
Union Bank of Nigeria Plc and Subsidiary Companies
Consolidated financial statements for the year ended 31 December 2014
Together with Directors’ and Auditor’s Reports
17
S/N Names
Direct Holding
Dec. ‘14 Dec. ‘13
1 Udoma Udo Udoma, CON 2,819,040 2,819,040
2 Richard Lee Kramer - -
3 Emeka Emuwa - -
4 Adekunle M. Adeosun - -
5 Kandolo Kasongo - -
6 Ibrahim A. Kwargana - -
7 Oyinkansade Adewale - -
8 Godson C. Okonkwo 29,793 29,793
9 Onikepo Olufunmike Akande, CON 28,225 28,225
10 Adeyemi Osindero - -
11 Dickie Agumba Ulu **** 1,348 1,348
12 Mansur Ahmed 9,656 14,906
13 Richard Burret - -
14 John Botts - -
15 Cyril Odu 2,661 2,661
16 Douglas Munatsi **** - -
17 Ian Clyne * - -
18 Saidu Mohammed-Jallo ** - -
19 James Macarthur *** - -
* Appointed with effect from 27th August, 2014
** Appointed with effect from 4th November, 2014 and resigned 24th February, 2015
*** Resigned with effect from 26th February, 2014
**** Resigned with effect from 24th February, 2015
Directors’ Retirement
The Directors who retire at this Annual General Meeting, being the first general meeting since their respective
appointments are:
1. Mr. Ian Clyne
2. Mr. Saidu Mohammed-Jallo
The Directors who retire by rotation and being eligible, offer themselves for re-election in accordance with Article
90 of the Bank’s Articles of Association are:
1. Mr. Richard Burrett
2. Mr. Cyril Odu
3. Dr. Adeyemi Osindero
4. Mr. John Botts (having attained the age of 70 years on 19th January 2011)
5. Mr. Richard Lee Kramer (having attained the age of 70 years on 20 June 2004)
Directors’ interest in contracts
In accordance with the provisions of Section 277 of the Companies and Allied Matters Act of Nigeria, there were
no contracts in which Directors had any direct interest.
Union Bank of Nigeria Plc and Subsidiary Companies
Consolidated financial statements for the year ended 31 December 2014
Together with Directors’ and Auditor’s Reports
18
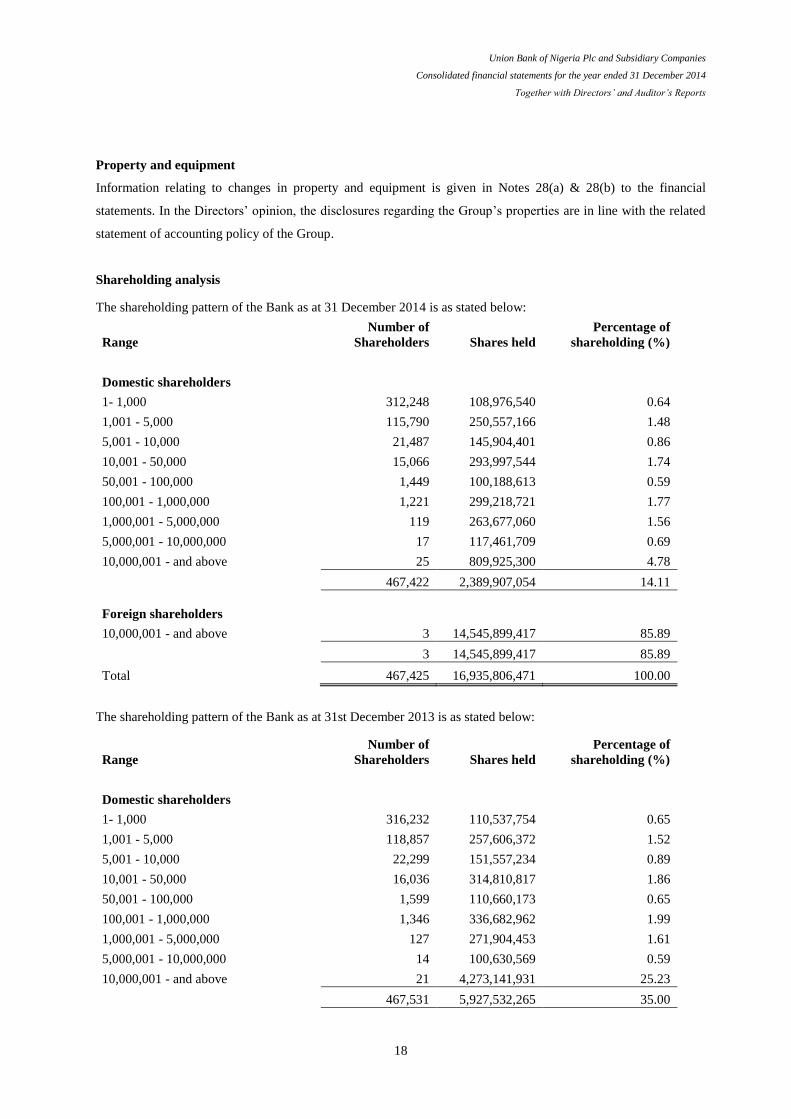
Property and equipment
Information relating to changes in property and equipment is given in Notes 28(a) & 28(b) to the financial
statements. In the Directors’ opinion, the disclosures regarding the Group’s properties are in line with the related
statement of accounting policy of the Group.
Shareholding analysis
The shareholding pattern of the Bank as at 31 December 2014 is as stated below:
Range
Number of
Shareholders Shares held
Percentage of
shareholding (%)
Domestic shareholders
1- 1,000 312,248 108,976,540 0.64
1,001 - 5,000 115,790 250,557,166 1.48
5,001 - 10,000 21,487 145,904,401 0.86
10,001 - 50,000 15,066 293,997,544 1.74
50,001 - 100,000 1,449 100,188,613 0.59
100,001 - 1,000,000 1,221 299,218,721 1.77
1,000,001 - 5,000,000 119 263,677,060 1.56
5,000,001 - 10,000,000 17 117,461,709 0.69
10,000,001 - and above 25 809,925,300 4.78
467,422 2,389,907,054 14.11
Foreign shareholders
10,000,001 - and above 3 14,545,899,417 85.89
3 14,545,899,417 85.89
Total 467,425 16,935,806,471 100.00
The shareholding pattern of the Bank as at 31st December 2013 is as stated below:
Range
Number of
Shareholders Shares held
Percentage of
shareholding (%)
Domestic shareholders
1- 1,000 316,232 110,537,754 0.65
1,001 - 5,000 118,857 257,606,372 1.52
5,001 - 10,000 22,299 151,557,234 0.89
10,001 - 50,000 16,036 314,810,817 1.86
50,001 - 100,000 1,599 110,660,173 0.65
100,001 - 1,000,000 1,346 336,682,962 1.99
1,000,001 - 5,000,000 127 271,904,453 1.61
5,000,001 - 10,000,000 14 100,630,569 0.59
10,000,001 - and above 21 4,273,141,931 25.23
467,531 5,927,532,265 35.00

Union Bank of Nigeria Plc and Subsidiary Companies
Consolidated financial statements for the year ended 31 December 2014
Together with Directors’ and Auditor’s Reports
19
Foreign shareholders 2 11,008,274,206 65.00
10,000,001 - and above 2 11,008,274,206 65.00
Total 467,533 16,935,806,471 100.00
According to the register of members as at 31st December 2014, no individual shareholder held more than 5% of
the issued share capital of the Bank except the following:
Dec. 2014 Dec. 2013
Shareholder Shares Held Percentage of
Shareholding
%
Shares Held Percentage of
Shareholding
%
Atlas Mara Limited (formerly
Atlas Mara Co-Nvest Limited)
Asset Management Corporation of
Nigeria (AMCON)
3,537,625,211
-
20.89
-
143,217,946
3,394,407,265
0.85
20.04
Union Global Partners Limited
10,396,703,405
61.39
10,396,703,405
61.39
Compliance plan with Central Bank of Nigeria's regulation on the scope of banking activities
Section 6(1) of the Central Bank of Nigeria Regulation on the Scope of Banking Activities and Ancillary Matters
(“Regulation 3”) requires every bank operating under a universal banking license to submit to the Central Bank of
Nigeria (CBN), for approval, a compliance plan duly approved by the bank's Board of Directors. Three broad
alternative options are available to banks to comply with Regulation 3, include retaining Portfolio Companies by
restructuring into a holding company structure, absorption of permissible activities by the Bank or full divestment
from Portfolio Companies.
The Bank received CBN’s approval to proceed with its plans to comply with the Regulation 3 (the “Compliance
Plan”) in 2013. The CBN’s approval allows the Bank eighteen months within which to implement its Compliance
Plan. The Bank’s Board and shareholders approved a Compliance Plan which involves the Bank divesting of its
interests in all its Portfolio Companies, with the exception of Union Bank (UK) Plc, and applying for an
International Commercial Banking license.
As at the end of the year, the Bank had successfully completed its divestment from the following subsidiaries:
Union Capital Markets Limited, Union Assurance Company Limited, UBN Insurance Brokers Limited, Union
Registrars Limited and Union Homes Savings and Loans Plc. The Bank opted to voluntarily wind up Union
Pension Custodians Limited and this process is ongoing. The divestment from Union Trustees Limited was
completed subsequent to the reporting date.

Union Bank of Nigeria Plc and Subsidiary Companies
Consolidated financial statements for the year ended 31 December 2014
Together with Directors’ and Auditor’s Reports
20
Donations and charitable gifts
In order to identify with the aspirations of the community and the environment within which the Group operates, a
total sum of N223, 235,000 (Dec. 2013: N54, 976,300) was given out as donations and charitable contributions
during the year. Details of the donations are as follows:
S/N TRANSACTION DESCRIPTION
AMOUNT (N)
1 Victims of terrorist activities (an initiative of the Central Bank of Nigeria) 175,000,000
2 Donation of two Toyota Hilux vans to educational institution in Ibadan 13,000,000
3 Cross River Calabar Carnival 10,000,000
4 Donation of 40 units of Samsung laptops to Federal University of Technology, Minna 3,570,000
5 Donation of generator to Lagos Diocesan Youth Camp Library, Epe 3,300,000
6 Arthur Mbanefo Research Centre (University of Lagos) 1,950,000
7 Children Development Centre, Surulere, Lagos 1,250,000
8 Sinking of Borehole at Ita Osu Market, Ijebu-ode, Ogun State 1,165,000
9 Women in Successful Career (WISCAR) graduation/induction 1,000,000
10 Pacelli School for the Blind 1,000,000
11 SOS Children’s Village 1,000,000
12 Arrow of God Orphanage 1,000,000
13 Heart of Gold Child Hospice 1,000,000
14 Winiseph Care Home 1,000,000
15 Special Olympics 1,000,000

Union Bank of Nigeria Plc and Subsidiary Companies
Consolidated financial statements for the year ended 31 December 2014
Together with Directors’ and Auditor’s Reports
21
16 Modupe Cole Memorial Childcare 1,000,000
17 Down Syndrome Association of Nigeria 1,000,000
18 Children Emergency Relief Fund 1,000,000
19 Child Life Line Charity 1,000,000
20 Christian Care for Widows/Widowers and the Aged (CCWA) International 1,000,000
21 Atunda Olu School Project 1,000,000
22 Samaritan Project –NGO 1,000,000
TOTAL 223,235,000
Human resources
(1) Employment of disabled persons
The Bank operates a non-discriminatory policy in the consideration of applications for employment, including
those received from disabled persons. The Bank’s policy is that the most qualified and experienced persons are
recruited for appropriate job levels, irrespective of an applicant’s state of origin, ethnicity, religion or physical
condition.

Union Bank of Nigeria Plc and Subsidiary Companies
Consolidated financial statements for the year ended 31 December 2014
Together with Directors’ and Auditor’s Reports
22
In the event of any employee becoming disabled in the course of employment, the Bank is in a position to arrange
appropriate training to ensure the continuous employment of such a person without subjecting him/her to any
disadvantage in his/her career development. Currently, the Bank has 4 persons (2013: 4 persons) on its staff list
with physical disability.
(2) Health, safety and welfare of employees
The Bank maintains business premises designed with a view to guaranteeing the safety and healthy living
conditions of its employees and customers alike. Employees are adequately insured against occupational and other
hazards. In addition, the Bank provides medical facilities to its employees and their immediate families at its
expense.
Fire prevention and fire-fighting equipment are installed in strategic locations within the Bank’s premises.
The Bank operates a Group Personal Account Accident Insurance in accordance with the provisions of the
Employee Compensation Act for the benefits of its employees. It also operates a contributory pension plan in line
with the Pension Reform Act 2004.
(3) Diversity of employment
The Group is an equal opportunity employer that is committed to maintaining a positive workforce that facilitates
high level of professional efficiency at all times. The Bank's policy prohibits discrimination by gender, disability
or health status in the recruitment, training and career development of its employees.
(i) Persons with Disability
The Bank continues to maintain a policy of giving fair consideration to applications for employment made by
disabled persons with due regard to their abilities and aptitude.
(ii) Gender Diversity within the Group
Group (2014) Group (2013)
Workforce % Gender
Composition
Workforce % Gender
Composition
Total workforce:
Women 1,119 37 1,882 41
Men 1,923 63 2,706 59
3,042 100 4,588 100
Recruitment during the year:
Women 238 27 222 41
Men 653 73 320 59
891 100 542 100
Diversity of Senior Management – Assistant
General Manager to General Manager:
Women 19 29 20 27
Men 46 71 55 73
65 100 75 100

Union Bank of Nigeria Plc and Subsidiary Companies
Consolidated financial statements for the year ended 31 December 2014
Together with Directors’ and Auditor’s Reports
23
Diversity of Board Executives:
Women 1 9 1 14
Men 10 91 6 86 11 100 7 100
Diversity of Board Members:
Women 2 9 2 12
Men 20 91 15 88
21 100 17 100
Bank (2014) Bank (2013)
Workforce % Gender
Composition
Workforce % Gender
Composition
Total workforce:
Women 1,095 37 1,620 43
Men 1,881 63 2,158 57
2,976 100 3,778 100
Recruitment during the year:
Women 235 27 220 42
Men 649 73 307 58
884 100 527 100
Diversity of Senior Management – Assistant
General Manager to General Manager:
Women 16 30 17 30
Men 37 70 39 70
53 100 56 100
Diversity of Board Executives:
Women 1 14 1 14
Men 6 86 6 86
7 100 7 100
Diversity of Board Members:
Women 2 11 2 12
Men 15 89 15 88
18 100 17 100
Employee involvement and training
The Bank encourages the participation of employees in arriving at decisions in respect of matters affecting their
well being. To this end, the Bank provides opportunities where employees deliberate on issues affecting the Bank
and employee interests.
The Bank places a high premium on the development of its manpower. Consequently, the Bank sponsored its
employees for various training courses, both locally and overseas, and engaged staff in e-learning activities during
the year under review.


Union Bank of Nigeria Plc and Subsidiary CompaniesConsolidated financial statements for the year ended 31 December 2014
29
Consolidated and Separate Statements of Profit or Loss and Other Comprehensive IncomeFor the year ended 31 December 2014
Group Group Bank BankNotes Dec.2014 Dec.2013 Dec.2014 Dec.2013
N million N million N million N million
Gross earnings 135,897 121,398 109,821 103,225
Continuing Operations:Interest income 9 76,192 80,869 74,863 79,045 Interest expense 9 (24,317) (23,576) (24,237) (23,918)
Net interest income 51,875 57,293 50,626 55,127 Net impairment charge for credit losses 13(a) (4,828) (12,066) (3,307) (13,255) Net interest income after impairment charge for credit losses 47,047 45,227 47,319 41,872
Net fee and commission income 10 9,572 9,079 9,168 8,677 Net trading income 11 2,154 (303) 2,069 (377) Other operating income 12 31,751 13,593 23,721 15,880
43,477 22,369 34,958 24,180 Operating income 90,524 67,596 82,277 66,052 Net impairment loss on other financial assets 13(b) (4,823) (3,670) (4,364) (5,165)
Net operating income after net impairment loss on other financial assets 85,701 63,926 77,913 60,887 Personnel expenses 14 (29,736) (39,544) (28,754) (38,519) Depreciation and amortisation (3,311) (3,113) (3,244) (3,060)Other operating expenses 15 (25,677) (15,936) (25,224) (15,107)
Total expenses (58,724) (58,593) (57,222) (56,686) Share of profit of equity accounted investee (6) (4) - -
Profit before income tax from continuing operations 26,971 5,329 20,691 4,201
Income tax expense from continuing operations 16 (409) 933 (205) 920 Profit for the year from continuing operations 26,562 6,262 20,486 5,121
Discontinued operationsGross income from discontinued operations 38 16,234 18,164 - - Gross expense from discontinued operations 38 (15,497) (19,724) - - Profit/(Loss) before tax from discontinued operations 38 737 (1,560) - - Income tax expense from discontinued operations 38 (474) (866) - -
Profit/(Loss) for the year from discontinued operations 38 263 (2,426) - -
Continuing and discontinued operations:Profit before tax 27,708 3,769 20,691 4,201 Income tax (883) 67 (205) 920 Profit after tax 26,825 3,836 20,486 5,121
Other comprehensive income, net of income taxItems that will never be reclassified to profit or lossRemeasurement of defined benefit liability (4,108) 6,555 (4,108) 5,521
Items that are or may be reclassified to profit or lossForeign currency translation differences for foreign operations 1,770 305 - -
Fair value gains on available-for-sale investments 1,720 5,834 1,812 5,471 Tax on fair value gain/losses on available for sale investments - - - - Other comprehensive income for the year (618) 12,694 (2,296) 10,992 Total comprehensive income for the year 26,207 16,530 18,190 16,113

Union Bank of Nigeria Plc and Subsidiary CompaniesConsolidated financial statements for the year ended 31 December 2014
30
Group Group Bank BankNotes Dec.2014 Dec.2013 Dec.2014 Dec.2013
N million N million N million N million Profit attributable to: Equity holders of the Bank 25,627 6,276 20,486 5,121 Non-controlling interest 1,198 (2,440) - - Profit for the year 26,825 3,836 20,486 5,121
Total comprehensive income attributable to:
Equity holders of the Bank 25,009 18,970 18,190 16,113 Non-controlling interest 1,198 (2,440) - - Total comprehensive income for the year 26,207 16,530 18,190 16,113
Profit from continuing operations attributable to:
Equity holders of the Bank 26,207 18,299 18,190 16,113 Non-controlling interest - (2,947) - - Transfer to contingency reserve - 1,178 - Total comprehensive income for the year 26,207 16,530 18,190 16,113
Earnings per share for profit from total operationsattributable to equity holders of BankBasic and diluted (Kobo) 17 151 37 121 30
Earnings per share for profit from continuing operations attributable to equity holders of bankBasic and diluted (Kobo) 17 157 37 121 30
The notes on pages 36 to 105 are an integral part of these consolidated financial statements.


Union Bank of Nigeria Plc and Subsidiary CompaniesConsolidated financial statements for the year ended 31 December 2014
32
Consolidated and Separate Statements of Changes in EquityFor the year ended 31 December 2014
Group
Share capital Share premium Statutory
reserve Treasury shares Fair value
reserve Regulatory risk
reserve Other reserves Retained deficit Total Non-controlling
interest Total equity N million N million N million N million N million N million N million N million N million N million N million
Balance at 1 January 2014 8,468 391,641 17,544 (240) 31,201 7,390 11,048 (274,871) 192,181 7,162 199,343
Total comprehensive income for the yearProfit for the year - - - - - - - 25,627 25,627 1,198 26,825
Other comprehensive income, net of taxForeign currency translation diferrence - - - - - - 1,770 - 1,770 - 1,770 Fair value gains/(loss) on available-for-sale investment - - - - 1,720 - - - 1,720 - 1,720 Remeasurement of defined benefit liability - - - - - - (4,108) - (4,108) - (4,108)
- - - - 1,720 - (2,338) - (618) - (618)
Total comprehensive income for the year - - - - 1,720 - (2,338) 25,627 25,009 1,198 26,207
Appropriation:Transfer between reserves - - (1,213) - (4,859) 1,277 (5,303) 10,098 - - - Transfer to statutory reserve - - 3,073 - - - - (3,073) - - -
- - 1,860 - (4,859) 1,277 (5,303) 7,025 - - - Transactions with owners, recorded directly in equityContributions by and distributions to owners
Disposal of subsidiaries - - - 205 251 - - (750) (294) (3,022) (3,316) - - -
Total contribution and distributions to owners - - - 205 251 - - (750) (294) (3,022) (3,316) Balance at 31 December 2014 8,468 391,641 19,404 (35) 28,313 8,667 3,407 (242,969) 216,896 5,338 222,234
December 2013
Share capital Share premium Statutory
reserve Treasury shares Fair value
reserve Regulatory risk
reserve Other reserves Retained deficit Total Non-controlling
interest Total equity N million N million N million N million N million N million N million N million N million N million N million
Balance at 1 January 2013 8,468 391,641 16,776 (65) 26,492 1,005 4,188 (274,300) 174,205 4,979 179,184
Total comprehensive income for the yearProfit for the year - - - - - - - 5,457 5,457 (1,621) 3,836
Other comprehensive income, net of taxRemeasurement of defined benefit liability - - - - - - 6,555 - 6,555 - 6,555 Foreign currency translation diferrence - - - - - - 305 - 305 - 305 Fair value gains/(loss) on available-for-sale investment - - - - 5,834 - - - 5,834 - 5,834
- - - - 5,834 - 6,860 - 12,694 - 12,694
Total comprehensive income for the year - - - - 5,834 - 6,860 5,457 18,151 (1,621) 16,530
Appropriation:Transfer from retained earnings - - - - (1,125) 6,385 - (5,260) - - - Transfer to statutory reserve - - 768 - - - - (768) - - -
- - 768 - (1,125) 6,385 - (6,028) - - - Transactions with owners, recorded directly in equityContributions by and distributions to ownersAcquisition of own shares - - - (175) - - - - (175) - (175) Increase/dilution in non-controlling interest 4,118 4,118 Dividends to non-controlling interest - - - - - - - - - (314) (314) Total contribution and distributions to owners - - - (175) - - - - (175) 3,804 3,629 Balance at 31 December 2013 8,468 391,641 17,544 (240) 31,201 7,390 11,048 (274,871) 192,181 7,162 199,343
Union Bank of Nigeria Plc and Subsidiary Companies Consolidated financial statements for the year ended 31 December 2014
33
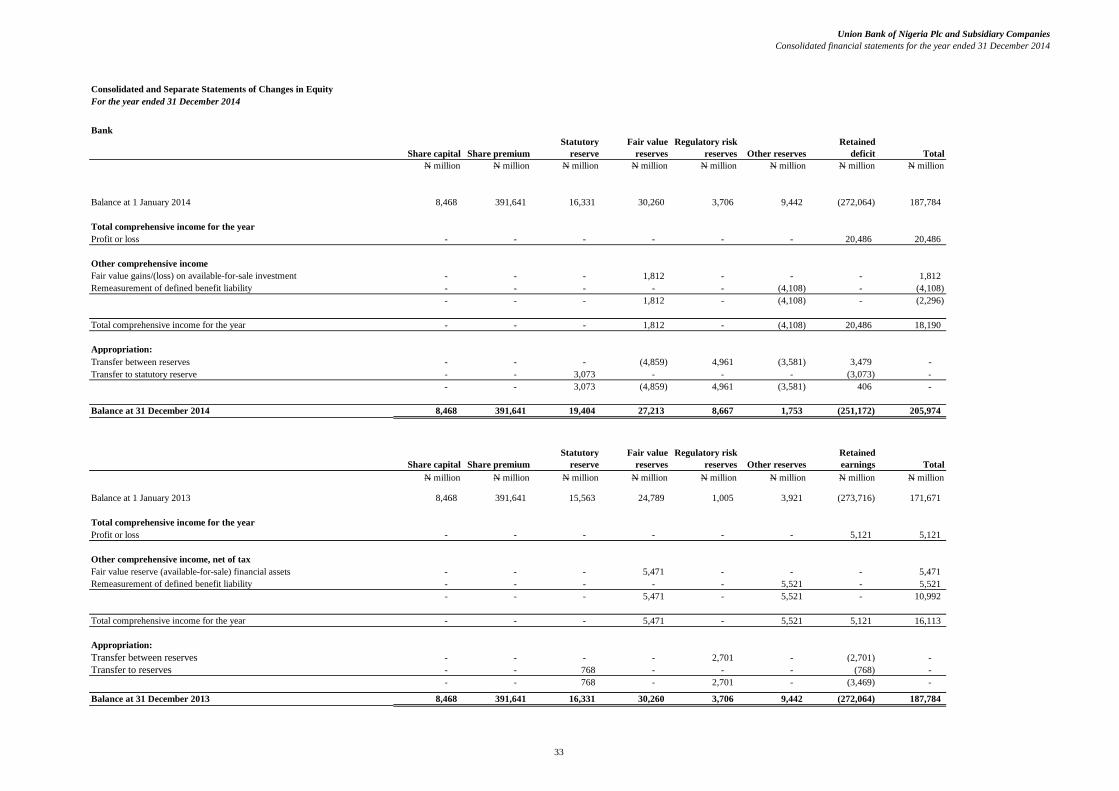
Consolidated and Separate Statements of Changes in EquityFor the year ended 31 December 2014
Bank
Share capital Share premium Statutory
reserve Fair value
reserves Regulatory risk
reserves Other reserves Retained
deficit Total N million N million N million N million N million N million N million N million
Balance at 1 January 2014 8,468 391,641 16,331 30,260 3,706 9,442 (272,064) 187,784
Total comprehensive income for the yearProfit or loss - - - - - - 20,486 20,486
Other comprehensive incomeFair value gains/(loss) on available-for-sale investment - - - 1,812 - - - 1,812 Remeasurement of defined benefit liability - - - - - (4,108) - (4,108)
- - - 1,812 - (4,108) - (2,296)
Total comprehensive income for the year - - - 1,812 - (4,108) 20,486 18,190
Appropriation:Transfer between reserves - - - (4,859) 4,961 (3,581) 3,479 - Transfer to statutory reserve - - 3,073 - - - (3,073) -
- - 3,073 (4,859) 4,961 (3,581) 406 -
Balance at 31 December 2014 8,468 391,641 19,404 27,213 8,667 1,753 (251,172) 205,974
Share capital Share premium Statutory
reserve Fair value
reserves Regulatory risk
reserves Other reserves Retained earnings Total
N million N million N million N million N million N million N million N million
Balance at 1 January 2013 8,468 391,641 15,563 24,789 1,005 3,921 (273,716) 171,671
Total comprehensive income for the yearProfit or loss - - - - - - 5,121 5,121
Other comprehensive income, net of taxFair value reserve (available-for-sale) financial assets - - - 5,471 - - - 5,471 Remeasurement of defined benefit liability - - - - - 5,521 - 5,521
- - - 5,471 - 5,521 - 10,992
Total comprehensive income for the year - - - 5,471 - 5,521 5,121 16,113
Appropriation:Transfer between reserves - - - - 2,701 - (2,701) - Transfer to reserves - - 768 - - - (768) -
- - 768 - 2,701 - (3,469) -
Balance at 31 December 2013 8,468 391,641 16,331 30,260 3,706 9,442 (272,064) 187,784

Union Bank of Nigeria Plc and Subsidiary CompaniesConsolidated financial statements for the year ended 31 December 2014
34
Consolidated and Separate Statements of Cash FlowsFor the year ended 31 December 2014
Group Group Bank BankNotes Dec.2014 Dec.2013 Dec.2014 Dec.2013
N million N million N million N millionCash flows from operating activitiesProfit for the year 26,825 3,836 20,486 5,121 Income tax expense 16 409 (933) 205 (920) Profit before tax 27,234 2,903 20,691 4,201
Adjustments for:Interest expense on borrowings 9 6,836 6,574 6,836 6,574 Gain on sale of property and equipment 12 - (759) - (761) Dividend income from equity investment 12 (408) (2,551) (2,015) (5,670) Gain on sale of trading property - (546) - - Gain on sale of subsidiaries 12 (15,689) - (6,315) - Impairment losses on loans and advances 13(a) 8,299 14,008 6,778 15,197 Recoveries on loans and advances 13(a) (3,471) (1,942) (3,471) (1,942) (Reversal of impairment)/impairment loss on investment 13(b) - (49) - 410 Contributions to defined contribution plans 14 702 1,622 702 1,613 Payment from defined contribution plan 36(a) (702) (1,738) (702) (1,729) Payment from defined benefit plan 36(b) (12,591) (33,981) (12,591) (34,925) Increase/ (decrease) in liability for defined benefit plans 14 (120) 1,410 (120) 1,410 Bad debts (recovered)/written off 22 (9,004) (4,460) (9,004) (4,460) Impairment loss on other investments 23 - 75 16 1,111 Write-off on Trading properties - 140 - - Revaluation gain on investment properties 26 - (655) - - Depreciation of property and equipment 28 2,879 2,943 2,854 2,899 Amortisation of intangible assets 29 432 179 389 161 Allowances on other assets 31 5,222 4,911 4,763 3,845 Share of profit of equity accounted investee 6 4 - -
9,625 (11,912) 8,811 (12,066)
Change in non-pledged trading assets 2,102 (2,001) 2,102 (1,980) Change in pledged assets (18,768) (20,664) (18,768) (20,664) Change in loans and advances to customers (79,079) (112,066) (86,557) (81,931) Change in other assets (28,196) 10,406 (23,736) 15,350 Change in deposits from banks 15,096 1,682 14,855 (300) Change in deposits from customers 44,911 (4,260) 27,475 (2,049) Change in other liabilities (46,146) 10,359 (46,097) 10,689
(100,455) (128,456) (121,915) (92,951) Income tax paid (64) (102) (42) (80) Cash flows from Discontinued operations (22,677) 22,021 - -
Net cash provided/(used in) by operating activities (123,196) (106,537) (121,957) (93,031)

Union Bank of Nigeria Plc and Subsidiary CompaniesConsolidated financial statements for the year ended 31 December 2014
35
Cash flows from investing activitiesPurchase of investment properties (39) (11,651) - - Proceeds from sale of investment properties 26 137 - - - Acquisition of trading properties - (28) - - Proceeds from sale of trading properties 635 2,658 - 352 Proceeds from sale of property and equipment 3 2,760 3 2,228 Proceed from disposal of subsidiaries 8,849 - 8,849 - Acquisition of property and equipment 28 (6,520) (4,853) (6,471) (4,580) Acquisition of intangible assets 29 (1,901) (354) (1,675) (324) Investment securities 93,873 (5,603) 98,533 (4,867) Dividend income received 408 2,551 2,015 5,670 Cash flows from Discontinued operations 25,830 12,166 - -
Net cash used in investing activities 121,276 (2,354) 101,254 (1,521)
Cash flows from financing activitiesInflow from other borrowings 35,087 11,412 35,087 11,329 Repayment of borrowings (2,232) - (2,232) - Interest paid on borrowings 9 (6,836) (6,574) (6,836) (6,574) Acquisition of own shares - (175) - - Dividend paid to non-controlling interest - (314) - - Inflows from non-controlling interest 495 4,118 - - Cash flows from Discontinued operations (2,259) 1,563 - - Net cash from financing activities 24,255 10,030 26,019 4,755
Net increase/(decrease) in cash and cash equivalents 22,334 (98,861) 5,316 (89,797) Cash and cash equivalents at beginning of year 100,925 200,260 53,141 142,938 Net change in cash and cash equivalent from discontinued operation (3,069) (779) - - Effect of exchange rate fluctuations on cash held 1,770 305 - - Cash and cash equivalents at end of year 18 121,960 100,925 58,457 53,141
The notes on pages 36 to 105 are an integral part of these consolidated financial statements.

Union Bank of Nigeria Plc and Subsidiary CompaniesConsolidated financial statements for the year ended 31 December 2014
Together with Directors' and Auditor's Reports
36
Notes to the Consolidated financial statementsFor the year ended 31 December 2014
1 Reporting entity
2 Basis of preparation
(a) Statement of compliance
(b) Functional and presentation currency
(c) Basis of measurement
(d) Use of estimates and judgements
- (e) Determination of regulatory risk reserves
(i)
These consolidated financial statements are prepared on the historical cost basis except for the following material items in the statement of financial position:
• the liability for defined benefit obligations is recognised as the present value of the defined benefit obligation less the net total of the plan assets, plus unrecognised actuarial gains, less unrecognised past service cost and unrecognised actuarial losses.
Provisions under Prudential Guidelines are determined using the time based provisioning regime prescribed by the Revised Central Bank of Nigeria (CBN) Prudential Guidelines. This is at variance with the requirements of the International Financial Reporting Standards. As a result of the differences in the methodology/provision regime, there may be variances in the impairments allowances required under the two methodologies.
• If Prudential provision is greater than IFRS impairment: the resultant excess provision should be transferred from the retained
Union Bank of Nigeria Plc (“the Bank”) is a company domiciled in Nigeria. The address of the Bank’s registered office is Stallion Plaza, 36 Marina,Lagos. The consolidated financial statements of the Bank as at and for the year ended 31 December 2014 comprise the Bank and its subsidiaries(together referred to as the “Group”and individually as 'Group entities'). The Group is primarily involved in investment, corporate, commercial andretail banking, as well as the provision of insurance, registrars, pension fund custodial, trusteeship and asset management services.
The consolidated financial statements have been prepared in accordance with International Financial Reporting Standards (IFRS).
• financial instruments at fair value through profit or loss are measured at fair value;• available-for-sale financial assets are measured at fair value;• investment property is measured at fair value; and
They were authorised for issue by the Board of Directors on 18 March 2015.
These consolidated financial statements are presented in Nigerian Naira, which is the Bank’s functional and presentation currency.Except as indicated, financial information presented in Naira has been rounded to the nearest million.
The Bank was in the process of divesting from all non-banking businesses within the Group in line with the CBN Regulation 3 on the Scope ofBanking Activities and Anciliary Matters. Consequently, Union Assurance Company Limited, Union Registrar Limited, Union Capital Limited,Union Insurance Brokers Limited and Union Homes Savings and Loans Plc have been sold during the year while Union Properties Limited andUnion Trustees Limited have been treated as discontinued operations in these consolidated financial statements in line with the provision of IFRS 5.
• If Prudential provision is less than IFRS impairment: IFRS determined impairments are charged to the income statement. The cumulative balance in the regulatory risk reserve is thereafter reversed to the retained earnings account.
earnings account to a "regulatory risk reserve".
Paragraph 12.4 of the revised Prudential Guidelines for Deposit Money Banks in Nigeria stipulates that Banks are required to make provisionsfor loans and other financial assets as prescribed in the relevant IFRS standards when IFRS is adopted. However, Banks would be required tocomply with the following:
The Bank has complied with the requirements of the Prudential Guidelines.
Provisions for loans and other financial assets recognised in the income statement should be determined based on the requirements ofIFRS. However, the IFRS impairments should be compared with provisions determined under Prudential Guidelines and the expectedimpact/changes in general reserves should be treated as follows:
The Central Bank of Nigeria (CBN) Prudential Guidelines requires that if the IFRS based impairment is lower than CBN Prudential Guidelinesprovision, the extent of the difference should be recognised as regulatory risk reserve in the statement of changes in equity.
The preparation of financial statements in conformity with IFRS requires management to make judgements, estimates and assumptions thataffect the application of accounting policies and the reported amounts of assets and liabilities, income and The estimates and associatedassumptions are based on historical experience and various other factors that are believed to be reasonable under the circumstances, the resultsof which form the basis of making the judgements about carrying values of assets and liabilities that are not readily apparent from othersources. Actual results may differ from these estimates.
The estimates and underlying assumptions are reviewed on an ongoing basis. Revisions to accounting estimates are recognised in the period inwhich the estimate is revised, if the revision affects only that period, or in the period of the revision and future periods, if the revision affectsboth current and future periods.
Information about significant areas of estimation uncertainty and critical judgements in applying accounting policies that have the mostsignificant effect on the amounts recognised in these financial statements are included in note 6.
Union Bank of Nigeria Plc and Subsidiary CompaniesConsolidated financial statements for the year ended 31 December 2014
Together with Directors' and Auditor's Reports
37
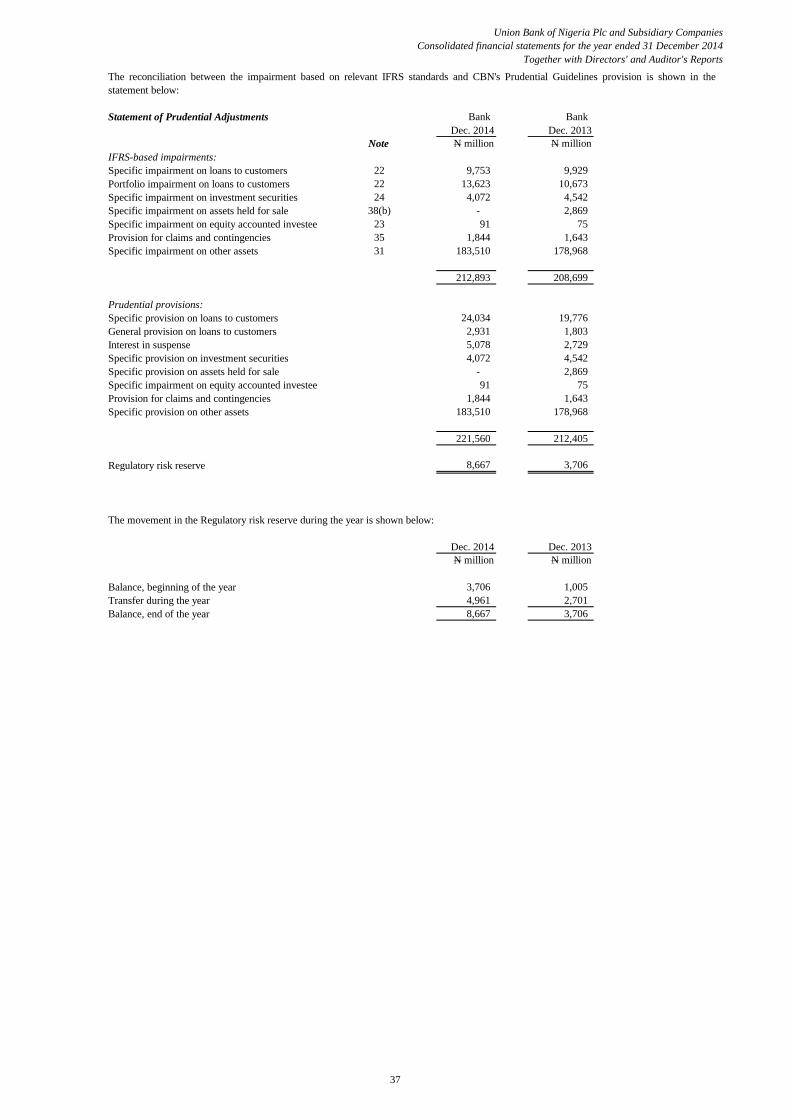
Statement of Prudential Adjustments Bank Bank Dec. 2014 Dec. 2013
Note N million N millionIFRS-based impairments:Specific impairment on loans to customers 22 9,753 9,929 Portfolio impairment on loans to customers 22 13,623 10,673 Specific impairment on investment securities 24 4,072 4,542 Specific impairment on assets held for sale 38(b) - 2,869 Specific impairment on equity accounted investee 23 91 75 Provision for claims and contingencies 35 1,844 1,643 Specific impairment on other assets 31 183,510 178,968
212,893 208,699
Prudential provisions:Specific provision on loans to customers 24,034 19,776 General provision on loans to customers 2,931 1,803 Interest in suspense 5,078 2,729 Specific provision on investment securities 4,072 4,542 Specific provision on assets held for sale - 2,869 Specific impairment on equity accounted investee 91 75 Provision for claims and contingencies 1,844 1,643 Specific provision on other assets 183,510 178,968
221,560 212,405
Regulatory risk reserve 8,667 3,706
The movement in the Regulatory risk reserve during the year is shown below:
Dec. 2014 Dec. 2013 N million N million
Balance, beginning of the year 3,706 1,005 Transfer during the year 4,961 2,701 Balance, end of the year 8,667 3,706
The reconciliation between the impairment based on relevant IFRS standards and CBN's Prudential Guidelines provision is shown in thestatement below:
Union Bank of Nigeria Plc and Subsidiary CompaniesConsolidated financial statements for the year ended 31 December 2014
Together with Directors' and Auditor's Reports
38
3 Significant accounting policies
The accounting policies have been applied consistently by Group entities.
(a) Basis of consolidationBusiness Combination
Associates
(b)
Changes in the Group's interest in a subsidiary that do not result in a loss of control are accounted for as equity transactions.
The accounting policies set out below have been consistently applied to all periods presented in these consolidated and separate financial
Non-controlling interestNon-controlling interests are measured at their proportionate share of the acquiree's identifiable net assets at the acquisition date
Loss of controlThe Group assesses whether there is loss of control in a variety of ways which includes: - sales of all or part of its ownership interest in its subsidiary; - expiry of a contractual agreement that gave control of the subsidiary to the Group;- issue of shares to third parties by the subsidiary, thereby reducing the Group's ownership interest in the subsidiary so that it no longer has
control of the subsidiary; - distribution of its ownership interest in the subsidiary by the Group; - when the subsidiary becomes subject to the control of a government, court, administrator or regulator.
statements.
Business combinations are accounted for using the acquisition method as at the acquisition date, that is, when control is transferred to the Group. Consideration transferred in the acquisition is generally measured at fair value, as are the identifiable net assets acquired. Transactioncosts are expensed as incurred, except if they relate to the issue of debt or equity securities.
Fund management
SubsidiariesSubsidiaries' are investees controlled by the Group. The Group controls an entity if it is exposed to, or has rights to, variable returns from itsinvolvement with the investee and has the ability to affect those returns through its power over the investee. The financial statements ofsubsidiaries are included in the consolidated financial statements from the date on which control commences until the date when control ceases.
Associates are those entities in which the Group has significant influence, but not control, over the financial and operating policies. Theconsolidated financial statements include the Group’s share of the total recognised gains and losses of associates on an equity-accounted basisfrom the date that significant influence commences until the date that significant influence ceases. When the Group’s share of losses exceeds itsinterest in an associate, the Group’s carrying amount is reduced to nil and recognition of further losses is discontinued except to the extent thatthe Group has incurred legal or constructive obligations or made payments on behalf of an associate.
The entities within the group manage and administer assets held in unit trusts and other investment vehicles on behalf of investors. The financialstatements of these entities are not included in these consolidated financial statements except when the Group controls the entity.
When the Group loses control over a subsidiary, it derecognises the assets and liabilities of a subsidiary, and any related non-controlling interestsand the other components of equity. Any interest retained in the former subsidiary is measured at fair value when control is lost. Any resultinggain or loss is recognised in profit or loss.The amount recognised in profit or loss on the loss of control of a subsidiary is measured as the difference between:(a) The sum of: - the fair value of the consideration received, if any; - the recognised amount of the distribution of shares, if applicable; - the fair value of any retained non-controlling investment; and - the carrying amount of the NCI in the former subsidiary, including the accumulated balance of each class of OCI attributable to the NCI
The carrying amount of the former subsidiary's net assets, together with any profit or loss reclassifications.From the Group's perspective, the loss of control of a subsidiary results in derecognition of the individual assets and liabilities of the subsidiary. On disposal, components of OCI related to the subsidiary's assets and liabilities are accounted for on the same basis as wouldbe required if the individual assets and liabilities had been disposed of directly. As a result, the following amounts are reclassified to profit or
loss: - exchange differences that were recognised in OCI; - changes in the fair value of available-for-sale financial assets previously recognised in OCI; and - the effective portion of gains and losses on hedging instruments in a cash flow hedge previously recognised in OCI.

Union Bank of Nigeria Plc and Subsidiary CompaniesConsolidated financial statements for the year ended 31 December 2014
Together with Directors' and Auditor's Reports
39
Transactions eliminated on consolidation
(b) Foreign currency transactionsForeign currency transactions
(c) Interest
Foreign operationsThe assets and liabilities of foreign operations, including goodwill and fair value adjustments arising on acquisition, are translated into naira atspot exchange rates at the reporting date. The income and expenses of foreign operations are translated into naira at spot exchange rates at thedates of the transactions.
Foreign differences on translation of foreign operations are recognised in other comprehensive income, and presented in the currency translationreserve (translation reserve) in equity. However, if the foreign operation is non-wholly owned subsidiary, then the relevant proportion of thetranslation differences is allocated to non-controlling interests. When a foreign operation is disposed off such that control is lost, the cumulativeamount in the translation reserve related to that foreign operation is reclassified to profit or loss as part of the gain or loss on disposal. When theGroup disposes of only part of its interest in a subsidiary that includes a foreign operation while retaining control, the relevant proportion of thecumulative amount is reattributed to non-controlling interests.When the settlement of a monetary intem receivable from or payable to a foreign operation is neither planned nor likely in the forseeable future,foreign currency gains and losses arising from such itemare considered to form part of a net investment in the foreign operation and arerecognised in other comprehensive income and presented in the translation reserve in equity.
Interest income and expense are recognised in profit or loss using the effective interest method. The effective interest rate is the rate that exactlydiscounts the estimated future cash payments and receipts through the expected life of the financial asset or financial liability (or, whereappropriate, a shorter period) to the carryin amount of the financial liability. when calculating the effective interest rate, the group estimatesfuture cash flow considering all contractual terms of the financial instrument, but not future credit losses.
The calculation of the effective interest rate includes transaction costs and fees and points paid or received that are an integral part of theeffective interest rate. transaction costs include incremental costs that are directly attributable to the acquisition or issue of a financial asset orfinancial liability.
Interest income and expense presented in the statement of profit or loss and OCI include:- Interest on financial asset and financial liabilities measured at amortised cost calculated on an effective interest basis;- Interest on available-for-sale investment securities calculated on an effective interest basis;
Interest income and expense on all trading assets and liablilties are considered to be incidental to the group's trading operation and are presentedtogether with all other changes in the fair value of trading assets and liabilities in net trading income(see(e).
Fair value change on other derivatives held for risk management purpose, and other financial assets and financial liabilities carried at fair valuethrough profit or loss are presented in net income from other financial instruments at fair value through profit or loss in the statement of profit orloss and OCI.
Foreign currency differences arising on translation are generally recognised in profit or loss. However, foreign currency differences arising fromthe translation of available for sale equity instruments are recognised in OCI
Transactions in foreign currencies are translated into the respective functional currency of Group entities at the spot exchange rates at the date ofthe transactions.Monetary assets and liabilities denominated in foreign currencies at the reporting date are translated using the functional currency at the spotexchange rate at that date. The foreign currrency gain or loss on monetary items is the difference between the amortised cost in the functionalcurrrency at the begining of the year, adjusted for effective interest and payments during the year, and the amortised cost in the foreign currencytranslated at the spot exchange rate at the end of the year.
Non-monatary assets and liabilities that are measured at fair value in a foreign currency are tramslated into the functional currency at the spotexchange rate at the date on which the fair value is determined. Non-monetary items that are measured based on historical cost in a foreigncurrency are translated using the spot exchange rate at the date of the transaction.
Intra-group balances, and any unrealised gains or losses or income and expenses arising from intra-group transactions, are eliminated inpreparing the consolidated financial statements. Unrealised gains arising from transactions with associates are eliminated to the extent of theGroup’s interest in the entity. Unrealised losses are eliminated in the same way as unrealised gains, but only to the extent that there is noevidence of impairment.

Union Bank of Nigeria Plc and Subsidiary CompaniesConsolidated financial statements for the year ended 31 December 2014
Together with Directors' and Auditor's Reports
40
(d) Fees and Commission
(e) Net trading income
(f) Net income from other financial instruments at fair value
(g) Dividends
(h) Lease payments - Lessee
(i) Income tax expense
(j) Financial instrumentsRecognition
Other fees and commission expense relates mainly to transaction and service fees, which are expensed as the services are received.
Net trading income comprises gains less losses related to trading assets and liabilities and includes all realised and unrealised fair value changes,interest, dividends and foreign exchange differences.
Fees and commission income and expenses that are integral to the effective interest rate on a financial asset or liability are included in themeasurement of the effective interest rate. Other fees and commission income, including account servicing fees, investment management andother fiduciary activity fees, sales commission, placement fees and syndication fees, are recognised as the related services are performed.
Net income from other financial instruments at fair value relates to financial assets and liabilities designated as at fair value through profit orloss and includes all realised and unrealised fair value changes, interest, dividends and foreign exchange differences.
Income tax comprises current and deferred taxes. Income tax expense is recognised in the income statement except to the extent that it relates toitems recognised directly in equity, in which case it is recognised in equity. Current tax payable also includes any tax liability arising from thedeclaration of dividends.
Current tax is the expected tax payable on taxable income for the year, using tax rates enacted or substantively enacted at the statement of financial position date, and any adjustment to tax payable in respect of previous years.
Additional taxes that arise from the distribution of dividends are recognised at the same time as the liability to pay the related dividend is recognised.
A financial asset or financial liability is measured initially at fair value plus, for an item not at fair value through profit or loss, transaction costthat are directly attributable to its acquisition or issue. Loans and advances, deposits and subordinated liabilities are recognised on the date thatthey are originated. All other financial assets and liabilities are initially recognised on the trade date at which the Group becomes a party to thecontractual provisions of the instrument.
A deferred tax asset is recognised for unused tax losses, tax credits and deductible temporary differences only to the extent that it is probablethat future taxable profits will be available against which the asset can be utilised. Deferred tax assets are reviewed at each reporting date andare reduced to the extent that it is no longer probable that the related tax benefit will be realised.
Deferred tax is provided using the balance sheet liability method, providing for temporary differences between the carrying amounts of assetsand liabilities for financial reporting purposes and the amounts used for taxation purposes. Deferred tax is not recognised for the followingtemporary differences: the initial recognition of goodwill, the initial recognition of assets or liabilities in a transaction that is not a businesscombination and that affects neither accounting nor taxable profit, and differences relating to investments in subsidiaries to the extent that theyprobably will not reverse in the foreseeable future. Deferred taxes aremeasured at the tax rates that are expected to be applied to the temporarydifferences when they reverse, based on laws that have been enacted or substantively enacted by the reporting date.
Commissions on insurance contracts are recognized on ceding business to the re-insurer, and are credited to the income statement.
Minimum lease payments made under finance leases are apportioned between the finance expense and the reduction of the outstanding liability.The finance expense is allocated to each period during the lease term so as to produce a constant periodic rate of return on the remaining balanceof the liability. Contingent lease payments are accounted for by revising the minimum lease payments over the remaining term of the lease whenthe lease adjustment is confirmed.
Dividend income is recognised when the right to receive income is established. Dividends are reflected as a component of other operatingincome and are recognised net of withholding tax.
Payments made under operating leases are recognised in profit or loss on a straight-line basis over the term of the lease. Lease incentivesreceived are recognised as an integral part of the total lease expense, over the term of the lease.
When a loan commitment is not expected to result in the draw-down of a loan, loan commitment fees are recognised on a straight-line basis overthe commitment period.

Union Bank of Nigeria Plc and Subsidiary CompaniesConsolidated financial statements for the year ended 31 December 2014
Together with Directors' and Auditor's Reports
41
Classification
(i)
(ii)
(a)
(b) (c)
(iii)
(iv)
a) financial assets classified as held for trading;b)
and that the Group does not intend to sell immediately or in the near term.
Loans and receivables are classified as loans and advances to customers and finance lease receivables.
Held-to-maturity
Loans and receivablesLoans and receivables are non-derivative financial assets with fixed or determinable payments that are not quoted in an active market,
The Group classifies its financial assets in the following categories:• loans and receivables;• held to maturity;• available for sale; or• at fair value through profit or loss and within the category as held for trading or designated at fair value through profit or loss.
Loans and advances to customers are initially measured at fair value plus incremental direct transaction costs, and subsequently measured at amortised cost using the effective interest method.
Available-for-sale
sales or reclassifications after the Group has collected substantially all of the asset's original principal; and
Fair value through profit or loss
sales or reclassification that are so close to maturity that changes in the market rate of interest would not have a significant effect on the financial asset's fair value;
This category comprises two sub-categories:
financial assets designated by the Group as fair value through profit or loss upon initial recognition (the "fair value option").A financial asset is classified as held for trading if it is acquired or incurred principally for the purpose of selling or repurchasing it in the nearterm or if it is part of a portfolio of identified financial instruments that are managed together and for which there is evidence of a recent actualpattern of short-term profit-taking. Derivatives are also categorised as held for trading unless they are designated and effective as hedginginstruments. Financial assets held for trading consist of debt instruments, including money-market paper, traded corporate and bank loans, andequity instruments, as well as financial assets with embedded derivatives.Financial instruments included in this category are recognised initially at fair value; transaction costs are taken directly to profit or loss. Gainsand losses arising from changes in fair value are included directly in the income statement and are reported as ‘Net trading income’.
When the Group is the lessor in a lease agreement that transfers substantially all of the risks and rewards incidental to ownership of the asset tothe lessee, the arrangement is classified as a finance lease and a receivable equal to the net investment in the lease is recognised and presentedwithin loans and advances.
Held-to-maturity investments are non-derivative assets with fixed determinable payments and fixed maturity that the Group has the positiveintent and ability to hold to maturity, and which are not designated as at fair value through profit or loss or as available for sale.
Held-to-maturity investments are carried at amortised cost, using the effective interest method, less any impairment losses. A sale or reclassification of a more than insignificant amount of held-to-maturity investments would result in the reclassification of all held-to-maturity investments as available for sale, and would prevent the Group from classifying investment securities as held to maturity for the current and the following two financial years. However, sales and reclassifications in any of the following circumstances would not trigger a reclassification:
sales or reclassifications attributable to non-recurring isolated events beyond the Group's control that could not have been reasonably anticipated.
Available-for-sale investments are non-derivative investments that are designated as available-for-sale or are not classified as another category offinancial assets. Available-for-sale investments comprise equity securities and debt securities. Unquoted equity securities whose fair valuecannot reliably be measured are carried at cost. All other available-for-sale investments are carried at fair value.
Other fair value changes, other than impairment losses, are recognised in other comprehensive income and presented in the fair value reserve inequity. When the investment is sold, the gain or loss accumulated in equity is reclassified to income statement.
Interest income is recognised in income statement using the effective interest method. Dividend income on available for sale financial assets isrecognised in profit or loss when the Group becomes entitled to the dividend. Foreign exchange gains or losses on available-for-sale debtsecurity investment are recognised in income statement. Impairment losses are recognised in profit or loss.
A non-derivative financial asset may be reclassified from the available-for-sale category to the loans and receivable category if it otherwisewould have met the definition of loans and receivables and if the Group has the intention and ability to hold that financial asset for theforeseeable future or until maturity.

Union Bank of Nigeria Plc and Subsidiary CompaniesConsolidated financial statements for the year ended 31 December 2014
Together with Directors' and Auditor's Reports
42
(i)
Financial liabilities are subsequently stated at amortised cost using the effective interest method; any differences between proceeds (net oftransaction costs) and the redemption value is recognised in the statement of profit or loss over the period of the transaction.
If there is no quoted price in an active market, then the Group uses valuation techniques that maximise the use of relevant observable inputs andminimise the use of unobservable inputs. The chosen valuation techniques incorporates all of the factors that market participants would take intoaccount in pricing a transaction.
Impairment of financial assetsAssets carried at amortised cost
The instruments are derecognised when the rights to receive cash flows have expired or the Group has transferred substantially all the risks and rewards of ownership and the transfer qualifies for derecognising.
The Group assesses at each reporting date whether there is objective evidence that a financial asset or group of financial assets is
The Group recognises transfers between levels of the fair value hierachy as of the end of the reporting period during which the change hasoccurred.
Fair value measurementFair value is the price that would be received to sell an asset or paid to transfer a liability in an orderly transaction between market particpant atthe measurment date in the princpal or, in its absence, the most advantageous market to which the Group has access at that date. The fair valueof a liability reflects its non-performance risk.When available, the Group measures the fair value of an instruments using the quoted price in an active market for that instruments. A market isregarded as active if transactions for the asset or liability take place with sufficiency frequency and volume to provide pricing information on anongoing basis.
If an asset or a liability measured at fair value has a bid and ask price, then the Group measures assets and long positions at a bid price andliabilites and short positions at an ask price.Portfolios of financial assets and financial liabilities that are exposed to market risk and credit risk that are managed by the Group on the basis ofthe net exposure to either market or credit risk are measured by the Group on the basis of the net exposure to either market or credit risk aremeasured on the basis of a price that would be recieved to sell a net long position (or paid to transfer a net short position) for a particular riskexposure. Those protfolio-level adjustments of each of the individual instruments in the portfolio.The fair value of a demand deposit is not less that the amount payable on demand, discounted from the first date on which that amount could berequired to be paid.
The Group designates some investment securities at fair value, with fair value changes recognised immediately in profit or loss.
The best evidence of fair value of a financial instrument at initial recognition is normally the transaction price - i.e the fair value of the
consideration given or received. If the Group determines that the fair value at initial recognition differs from the transaction price and the fair
value is evidenced by neither by a quoted price in an active market for an identical asset or liability nor based on a valuation techniques that uses
only data from observable markets, then the financial instrument is initially measured at fair value, adjusted to defer the difference between the
fair value at initial recognition and the transaction price, Subsequently, that difference is recognised in profit or loss on an appropriate basis over
the life of the instrument but later than when the valuation is wholly supported by observable market data or the transaction is closed out
• whether the customer's obligation is more than 90 days past due;
impaired. A financial asset or a group of financial assets is impaired and impairment losses are incurred if, and only if, there isobjective evidence of impairment as a result of one or more events that occurred after the initial recognition of the assets (a 'lossevent’), and that loss event (or events) has an impact on the estimated future cash flows of the financial asset or group of financialassets that can be reliably estimated.
The following factors are considered in assessing objective evidence of impairment:
• the Group consents to a restructuring of the obligation, resulting in a diminished financial obligation, demonstrated by a material forgiveness ofdebt or postponement of scheduled payments; or• there is observable data indicating that there is a measurable decrease in the estimated future cash flows of a group of financial assets, althoughthe decrease cannot yet be identified with specific individual financial assets.
The Group first assesses whether objective evidence of impairment exists individually for financial assets that are individually significant, andindividually or collectively for financial assets that are not individually significant.
If the Group determines that no objective evidence of impairment exists for an individually assessed financial asset, whether significant or not, itincludes the asset in a group of financial assets with similar credit risk characteristics and collectively assesses them for impairment. Assets thatare individually assessed for impairment and for which an impairment loss is or continues to be recognised, are not included in a collectiveassessment of impairment.
If there is objective evidence that an impairment loss on a loan and receivable or a held-to-maturity asset has been incurred, the amount of theloss is measured as the difference between the asset’s carrying amount and the present value of estimated future cash flows (excluding futurecredit losses that have not been incurred), discounted at the asset’s original effective interest rate. The carrying amount of the asset is reducedthrough the use of an allowance account and the amount of the loss is recognised in income statement. Such allowance is referred to as specificimpairment.

Union Bank of Nigeria Plc and Subsidiary CompaniesConsolidated financial statements for the year ended 31 December 2014
Together with Directors' and Auditor's Reports
43
(ii)
(i) (ii)
Sale and repurchase agreements
Offsetting financial instruments
Available-for-sale financial assets
assets are not derecognised from the statement of financial position. In transactions where the Group neither retains nor transfers substantially all the risks and rewards of ownership of a financial asset, it derecognises the asset if control over the asset is lost.
the consideration received (including and new asset obtained less any new liability assumed); andany cumulative gain or loss that had been recognised in other comprehensive income is recognised in income statement.
The Group enters into transactions whereby it transfers assets recognised on its balance sheet, but retains either all risks and rewards of the transferred assets or a portion of them. If all or substantially all risks and rewards are retained, then the transferred
Derecognition of financial instruments
The calculation of the present value of the estimated future cash flows of a collateralised financial asset reflects the cash flows that may resultfrom foreclosure, less costs for obtaining and selling the collateral, whether or not foreclosure is probable. For the purposes of a collectiveevaluation of impairment, financial assets are grouped on the basis of similar credit risk characteristics (i.e. on the basis of the Group’s gradingprocess which considers asset type, industry, geographic location, collateral type, past-due status and other relevant factors). Thesecharacteristics are relevant to the estimation of future cash flows for groups of such assets being indicative of the debtor’s ability to pay allamounts due according to the contractual terms of the assets being evaluated.
Future cash flows in a group of financial assets that are collectively evaluated for impairment are estimated on the basis of the historical lossexperience for assets with credit risk characteristics similar to those in the group. Historical loss experience is adjusted on the basis of currentobservable data to reflect the effects of current conditions that did not affect the period on which the historical loss experience is based, and toremove the effects of conditions in the historical period that do not exist currently.
To the extent a loan is irrecoverable, it is written off against the related allowance for loan impairment. Such loans are written off after all thenecessary procedures have been completed and the amount of the loss has been determined. Subsequent recoveries of amounts previouslywritten off decrease the amount of the allowance for loan impairment in income statement. If, in a subsequent period, the amount of theimpairment loss decreases and the decrease can be related objectively to an event occurring after the impairment was recognised (such as animprovement in the debtor’s credit rating), the previously recognised impairment loss is reversed by adjusting the allowance account. Theamount of the reversal is recognised in income statement.
Available-for-sale financial assets are impaired if there is objective evidence of impairment, resulting from one or more loss events that occurredafter initial recognition but before the balance sheet date, that have an impact on the future cash flows of the asset. In addition, an available-for-sale equity instrument is generally considered impaired if a significant or prolonged decline in the fair value of the instrument below its cost hasoccurred. Where an available-for-sale asset, which has been remeasured to fair value directly through equity, is impaired, the impairment loss isrecognised in income statement. If any loss on the financial asset was previously recognised directly in equity as a reduction in fair value, thecumulative net loss that had been recognised in equity is transferred to income statement and is recognised as part of the impairment loss. Theamount of the loss recognised in profit or loss is the difference between the acquisition cost and the current fair value, less any previouslyrecognised impairment loss.
If, in a subsequent period, the amount relating to an impairment loss decreases and the decrease can be linked objectively to an event occurringafter the impairment loss was recognised in the income statement, where the instrument is a debt instrument, the impairment loss is reversedthrough profit or loss. An impairment loss in respect of an equity instrument classified as available-for-sale is not reversed through profit or lossbut accounted for directly in equity.
Financial assets and liabilities are set off and the net amount presented in the statement of financial position when, and only when, the Grouphas a legal right to set off the amounts and intends either to settle on a net basis or to realise the asset and settle the liability simultaneously.
Income and expenses are presented on a net basis only when permitted by accounting standards, or for gains and losses arising from a group ofsimilar transactions such as in the Group’s trading activity.
Securities sold subject to linked repurchase agreements are reclassified in the consolidated financial statements as pledged assets when thetransferee has the right by contract or custom to sell or repledge the collateral. The liability to the counterparty is included in deposit from banks,or other deposits, as appropriate.
The Group derecognises a financial asset when the contractual rights to the cash flows from the asset expire, or it transfers the rights to receivethe contractual cash flows on the financial asset in a transaction in which substantially all the risks and rewards of ownership of the financialasset are transferred.
Any interest in such transferred financial assets that qualify for derecognition is created or retained by the Group is recognised as a separateasset or liability. On derecognition of a financial asset, the difference between the carrying amount of the asset (or the carrying amount allocatedto the portion of the asset transferred), and the sum of:

Union Bank of Nigeria Plc and Subsidiary CompaniesConsolidated financial statements for the year ended 31 December 2014
Together with Directors' and Auditor's Reports
44
(k)
(l)
(i)
(ii)
(m)
(n)
The rights and obligations retained in the transfer are recognised separately as assets and liabilities as appropriate. In transfers where control over the asset is retained, the Group continues to recognise the asset to the extent of its continuing involvement, determined by the extent to which it is exposed to changes in the value of the transferred asset.
assets, other than those designated at fair value through profit or loss on initial recognition, may be reclassified out of the fair value through i.e. trading category - if they are no longer held for the purposes of being sold or repurchased in the near term and the following conditions are met:
if the financial asset would have met the definition of loans and receivables (if the financial asset had not been required to be classified as held for trading at initial recognition), then it may be reclassified if the Group has the intention and ability to hold
Trading assets and liabilities are those assets and liabilities that the Group acquires or incurs principally for the purpose of selling or repurchasing in the near term, or holds as part of a portfolio that is managed together for short term profit or position taking.
Trading assets and liabilities are initially recognised and subsequently measured at fair value in the statement of financial position, with transaction costs recognised in profit or loss. All changes in fair value are recognised as part of net trading income in profit or loss. Trading assets and liabilities are not reclassified subsequent to their initial recognition, except that non-derivative trading
Cash and cash equivalentsCash and cash equivalents include notes and coins in hand, unrestricted balances held with central banks and highly liquidfinancial assets with original maturities of three months or less from the acquisition date, which are subject to insignificant risk of changes in their fair value, and are used by the Group in the management of its short-term commitments.
Cash and cash equivalents are carried at amortised cost in the statement of financial position.
Trading assets and liabilities
Purchased software that is integral to the functionality of the related equipment is capitalised as part of that equipment. When parts of an item of property or equipment have different useful lives, they are accounted for as separate items (major components) of property and equipment.
Any gain or loss on disposal of an item of property and equipment (calculated as the difference between the net proceeds from disposal and the carrying amount of the item) is recognised within other income in income statement.
(a) the cost of materials and direct labour;(b) any other costs directly attributable to bringing the assets to working condition for their intended use;(c) when the Group has an obligation to remove the asset or restore the site, an estimate of the costs of dismantling and removingthe items and restoring the site on which they are located; and(d) capitalised borrowing costs.
Property and equipmentsRecognition and measurementProperty and equipment are carried at cost less accumulated depreciation and impairment losses. Cost includes expenditures that are directly attributable to the acquisition of the asset. The cost of self-constructed assets includes the following:
the financial asset for the forseeable future or until maturity.if the financial asset would not have met the definition of loans and receivables, then it may be reclassified out of the trading category only in rare circumstances.
Derivatives held for risk management purposesDerivatives held for risk management purposes include all derivative assets and liabilities that are not classified as trading assets or liabilities.Derivatives are recognised initially at fair value in the statement of financial position; attributable transaction costs are recognised in incomestatement when incurred. Subsequent to initial recognition, derivatives are measured at fair value with changes in fair value recognised inincome statement.
Depreciation is recognised in income statement.
Items of property and equipment are depreciated from the date they are available for use or, in respect of self-constructed assets, from the date that the assets are completed and ready for use. Depreciation is calculated to write off the cost of items of property and equipment less their estimated residual values using the straight-line basis over their estimated lives. Leased assets are depreciated over the shorter of the lease term and their useful lives. Depreciation begins when an asset is available for use and ceases at the earlier of the date that the asset is derecognised or classified as held for sale in accordance with IFRS 5 - Non-current Assets Held for Sale and Discontinued Operations.
Subsequent costsThe cost of replacing part of an item of property or equipment is recognised in the carrying amount of the item if it is probable that the future economic benefits embodied within the part will flow to the Group and its cost can be measured reliably. The costsof the day-to-day servicing of property and equipment are recognised in income statement as incurred.
Union Bank of Nigeria Plc and Subsidiary CompaniesConsolidated financial statements for the year ended 31 December 2014
Together with Directors' and Auditor's Reports
45
Leasehold improvements Over the shorter of the useful life of item or lease periodBuildings 50 yearsComputer hardware 4 yearsFurniture and office equipments 5 yearsMotor vehicles 4 yearsCapital work-in-progress Not depreciated
(o)
(p)
(q)
(r)
The estimated useful lives for the current and comparative period are as follows:
Depreciation methods, useful lives and residual values are reassessed at each reporting date.
De-recognition
When the use of a property changes such that it is reclassified as property and equipment, its fair value at the date of reclassificationbecomes its cost for subsequent accounting.
Intangible assets
Trading propertiesTrading properties represents inventories held by the group which are designated for resale to customers. Trading properties are measured at thelower of cost and net realisable value. The cost includes expenditure incurred in acquiring the trading properties, production or conversion costsand other costs incurred in bringing them to their existing location.
Net realisable value is the estimated selling price in the ordinary course of business, less the estimated costs of completion and selling expenses.
initially measured at cost and subsequently at fair value with any change therein recognised in income statement in other income.Cost includes expenditure that is directly attributable to the acquisition of the investment property.
Any gain or loss on disposal of an investment property (calculated as the difference between the net proceeds from disposal and the carrying amount of the item) is recognised in income statement. When an investment property that was previously classified as property, plant and equipment is sold, any related amount included in the revaluation reserve is transferred to retained earnings.
An item of property and equipment is derecognised on disposal or when no future economic benefits are expected from its use or disposal. Any gain or loss arising on de-recognition of the asset (calculated as the difference between the net disposal proceeds and the carrying amount of the asset) is included in income statement in the year the asset is derecognised.
Investment property Investment property is property held either to earn rental income or for capital appreciation or for both, but not for sale in the ordinary course of business, use in the production of goods and services or for administrative purposes. Investment property is
Subsequent expenditure on software assets is capitalised only when it increases the future economic benefits embodied in the specific asset to which it relates. All other expenditure is expensed as incurred.
Amortisation is recognised in profit or loss on a straight-line basis over the estimated useful life of the software, from the date that it is available for use. The estimated useful life of software is five years. This is reassessed annually.
Non-current assets, or disposal groups comprising assets and liabilities, are classified as held-for-sale if it is highly probable that they will berecovered primarily through sale rather than through continuing use.Such assets, or disposal groups, are generally measured at the lower of their carrying amount and fair value less costs to sell. Any impairmentloss on a disposal group is allocated first to goodwill, and then to the remaining assets and liabilities on a pro rata basis, except that no loss isallocated inventories, financial assets, deferred tax assets, employee benefit analysis or investment property, which continue to be measured inaccordance with the Group's other accounting policies. Impairment losses on initial classification as held-for-sale or held-for-distribution andsubsequent gains and losses on remeasurement are recognised in profit or loss.Once classified as held-for-sale, intangible assets and property, plant and equipment are no longer amortised or depreciated, and any equityaccounted investee is no longer equity accounted
Non-current assets classified as held for sale and discontinued operations
Expenditure on internally developed software is recognised as an asset when the Group is able to demonstrate its intention and ability to complete the development and use the software in a manner that will generate future economic benefits, and can reliably measure the costs to complete the development. The capitalised costs of internally developed software include all costs directly attributable to developing the software, and are amortised over its useful life. Internally developed software is stated at capitalised cost less accumulated amortisation and impairment.
SoftwareSoftware acquired by the Group is stated at cost less accumulated amortisation and accumulated impairment losses.

Union Bank of Nigeria Plc and Subsidiary CompaniesConsolidated financial statements for the year ended 31 December 2014
Together with Directors' and Auditor's Reports
46
(s)
(t)
(u)
(v)
Classification as a discontinued operation occurs on disposal or when the operation meets the criteria to be classified as held for sale. When an operation is classified as a discontinued operation, the comparative income statement is re-presented as if the operation had beendiscontinued from the start of the comparative year.
Cash-generating unit is the smallest identifiable asset group that generates cash flows that largely are independent from other assets and groups. Impairment losses are recognised in profit or loss. Impairment losses recognised in respect of cash-generating units are allocated first to reduce the carrying amount of any goodwill allocated to the units and then to reduce the carrying amountof the other assets in the unit (group of units) on a pro rata basis.
The recoverable amount of an asset or cash-generating unit is the greater of its value in use and its fair value less costs to sell. In
Impairment of non-financial assetsThe carrying amounts of the Group’s non-financial assets other than deferred tax assets, are reviewed at each reporting date to determine whether there is any indication of impairment. If any such indication exists then the asset’s recoverable amount is estimated.
An impairment loss is recognised if the carrying amount of an asset or its cash-generating unit exceeds its recoverable amount. A
Leased assets - LeaseeLeases in terms of which the Group assumes substantially all the risks and rewards incidental to ownership are classified as finance leases. Upon initial recognition, the leased asset is measured at an amount equal to the lower of its fair value and the present value of the minimum lease payments discounted at incremental rate of borrowing. Subsequent to initial recognition, the asset is accounted for in accordance with the accounting policy applicable to that asset.
Other leases are operating leases and are not recognised on the Group’s statement of financial position.
determined, net of depreciation or amortisation, if no impairment loss had been recognised. Reversals of impairment losses are recognised in income statement.
assessing value in use, the estimated pre-tax future cash flows are discounted to their present value using a pre-tax discount rate that reflects current market assessments of the time value of money and the risks specific to the asset or cash generating unit.
An impairment loss in respect of goodwill is not reversed. In respect of other assets, impairment losses recognised in prior periods are assessed at each reporting date for any indications that the loss has decreased or no longer exists. An impairment loss is reversed only to the extent that the asset’s carrying amount does not exceed the carrying amount that would have been
Deposits, debt securities issued and surbordinated liabilitiesDeposits, debt securities issued and subordinated liabilities are Group's sources of debt funding.
When the Group sells a financial asset and simultaneously enters into an agreement to repurchase the asset (or similar asset) at a
A provision is recognised if, as a result of a past event, the Group has a present legal or constructive obligation that can be estimated reliably, and it is probable that an outflow of economic benefits will be required to settle the obligation. Provisions are determined by discounting the expected future cash flows at a pre-tax rate that reflects current market assessments of the time value of money and, where appropriate, the risks specific to the liability. The unwinding of the discount is recognised as finance cost.
Deposits, debt securities issued and subordinated liabilities are initially measured at fair value minus incremental direct transaction costs, and subsequently measured at their amortised cost using the effective method, except where the Group designates liabilities at fair value through profit or loss.
Provisions
fixed price on a future date) repo or stock lending), the arrangement is accounted for as a deposit, and the underlying asset continues to be recognised in the Group's financial statements.
The Group classifies capital instruments as financial liabilities or equity instruments in accordance with the substance of the contractual terms of the instruments. The Group's redeemable preference shares bear non-discretionary coupons and are redeemable by the holder, and are therefore included with subordinated liabilities.
provision is established, the Group recognises any impairment loss on the assets associated with that contract.
A provision for restructuring is recognised when the Group has approved a detailed and formal restructuring plan, and the restructuring either has commenced or has been announced publicly. Future operating losses are not provided for.
A provision for onerous contracts is recognised when the expected benefits to be derived by the Group from a contract are lower than the unavoidable cost of meeting its obligations under the contract. The provision is measured at the present value of the lower of the expected cost of terminating the contract and the expected net cost of continuing with the contract. Before a

Union Bank of Nigeria Plc and Subsidiary CompaniesConsolidated financial statements for the year ended 31 December 2014
Together with Directors' and Auditor's Reports
47
(w)
(x)
Financial guarantee liabilities are initially recognised at their fair value, which is the premium received, and then amortised over the life of the financial guarantee. Subsequent to initial recognition, the financial guarantee liability is measured at the higher of the present value of any expected payment, when a payment under the guarantee has become probable, and the unamortised premium. Financial guarantees are included within other liabilities.
Financial guarantee contractsFinancial guarantee contracts are contracts that require the Group (issuer) to make specified payments to reimburse the holder for a loss it incurs because a specified debtor fails to make payment when due in accordance with the original or modified termsof a debt instrument.
The discount rate is the yield at the reporting date on government bonds that have maturity dates approximating the terms of the Group’s obligations. The calculation is performed annually by a qualified actuary using the projected unit credit method. When the calculation results in a benefit to the Group, the recognised asset is limited to the net total of any unrecognised past service costs and the present value of any future refunds from the plan or reduction in future contributions to the plan.
When the benefits of a plan are improved, the portion of the increased benefit relating to past service by employees is recognised
Remeasurements of the net defined benefit liability, which comprise actuarial gains and losses, the return on plan assets (excluding interest) andthe effect of the asset ceiling (if any, excluding interest), are recognised immediately in OCI. The Group determines the net interest expense(income) on the net defined benefit liability (asset) for the period by applying the discount rate used to measure the defined benefit obligation atthe beginning of the annual period to the then-net defined benefit liability (asset), taking into account any changes in the net defined benefitliability (asset) during the period as a result of contributions and benefit payments. Net interest expense and other expenses related to defined benefit plans are recognised in personnel expenses in profit or loss.
When the benefits of a plan are changed or when a plan is curtailed, the resulting change in benefit that relates to past service or the gain or losson curtailment is recognised immediately in profit or loss. The Group recognises gains and losses on the settlement of a defined benefit planwhen the settlement occurs.
Defined benefit plansThe Group’s net obligation in respect of defined benefit plans is calculated separately for each plan by estimating the amount of future benefit that employees have earned in return for their service in the current and prior periods; that benefit is discounted to determine its present value, and any unrecognised past service costs and the fair value of any plan assets are deducted.
Employee benefitsPost-employment benefitsDefined contribution plansA defined contribution plan is a post-employment benefit plan under which an entity pays fixed contributions into a separate entity and has no legal or constructive obligation to pay any further amount(s). Obligations for contributions to defined contribution plans are recognised as personnel expenses in income statement in the periods during which related services are rendered.
Short-term benefits
realisable during the life of the plan or on settlement of the plan liabilities.
Termination benefits
in income statement on a straight-line basis over the average period until the benefits become vested. To the extent that the benefits vest immediately, the expense is recognised immediately in income statement.
When the calculation above results in a benefit to the Group, the recognised asset is limited to the net total of any cumulativeunrecognised actuarial losses and past service costs and the present value of any economic benefit available in the form of anyrefunds from the plan or reductions in future contribution to the plan. An economic benefit is available to the Group if it is
Short-term employee benefit obligations are measured on an undiscounted basis and are expensed as the related service is provided.
Termination benefits are recognised as an expense when the Group is demonstrably committed, without realistic possibility of withdrawal, to aformal detailed plan to either terminate employment before the normal retirement date, or to provide termination benefit as a result of an offermade to encourage voluntary redundancy. Termination benefits for voluntary redundancies as an expense if the Group has made an offer ofvoluntary redundancy, it is probable that the offer will be accepted, and the number of acceptance can be estimated reliably. If benefits arepayable more than 12 months after the reporting date, then they are discounted to their present value.
A provision is recognised for the amount expected to be paid under short-term cash bonus or profit-sharing plans if the Group has a present legal or constructive obligation to pay this amount as a result of past service provided by the employee and the obligation can be estimated reliably.

Union Bank of Nigeria Plc and Subsidiary CompaniesConsolidated financial statements for the year ended 31 December 2014
Together with Directors' and Auditor's Reports
48
(y)
(z)
(aa)
(ab)
(ac)
(ad)
Share capital and reservesShare issue costsIncremental costs directly attributable to the issue of an equity instrument are deducted from the initial measurement of the equity instruments.
Other long-term employee benefitsThe Group’s net obligation in respect of long-term employee benefits other than pension plans is the amount of future benefit that employeeshave earned in return for their service in the current and prior periods; that benefit is discounted to determine its present value, and the fair valueof any related assets is deducted. The discount rate is the yield at the reporting date on government bonds that have maturity datesapproximating the terms of the Group’s obligations where relevant. The calculation is performed using the projected unit credit method. Anyactuarial gains or losses are recognised in profit or loss in the period in which they arise.
Diluted EPS is determined by adjusting the profit or loss attributable to ordinary shareholders and the weighted average number of ordinary shares outstanding for the effects of all dilutive potential ordinary shares.
Fiduciary activities
Earnings per share
Dividend on ordinary shares
Treasury shares
The Group presents basic and diluted earnings per share (EPS) data for its ordinary shares. Basic EPS is calculated by dividing the profit or lossattributable to ordinary shareholders of the Bank by the weighted average number of ordinary shares outstanding during the period.
Where the Bank or any member of the Group purchases the Bank’s share capital, the consideration paid is deducted from the shareholders’equity as treasury shares until they are cancelled. Where such shares are subsequently sold or reissued, any consideration received is included inshareholders’ equity. Gains and losses on sales or redemption of own shares are credited or charged to reserves.
Dividends on the Bank’s ordinary shares are recognised in equity in the period in which they are paid or, if earlier, approved by the Bank’sshareholders.
Borrowings are recognised initially at fair value, net of transaction costs incurred. Borrowings are subsequently stated at amortised cost using the effective interest method; any differences between proceeds (net of transaction costs) and the redemption value is recognised in the income statement over the period of the borrowings.
New standards and interpretations not yet adoptedA number of new standards, amendments to standards and interpretations are effective for annual periods beginning after 1
expenses, including revenues and expenses that relate to transactions with any of the Group’s other components, whose operatingresults are reviewed regularly by the Board of Directors (being the chief operating decision maker) to make decisions about resources allocated to each segment and assess its performance and for which discrete financial information is available. Segment results include items directly attibutable to a segment as well as those that can be allocated on a reasonable basis.
Borrowings
The Group commonly acts as trustees and in other fiduciary capacities that result in the holding or placing of assets on behalf of individuals, trusts, retirement benefit plans and other institutions. These assets and income arising thereon are excluded from these financial statements, as they are not assets of the Group.
Segment reportingAn operating segment is a component of the Group that engages in business activities from which it may earn revenues and incur
IFRS 9 is effective for annual periods beginning on or after 1 January 2018 with early adoption permitted.
IFRS 9, published in July 2014, replaces the existing guidance in IAS 39 Financial Instruments: Recognition and Measurement. IFRS 9 includesrevised guidance on the classification and measurement of financial instruments, including a new expected credit loss model for calculatingimpairment on financial assets, and the new general hedge accounting requirements. It also carries forward the guidance on recognition andderecognition of financial instruments from IAS 39.
January 2014, and have not been applied in preparing these consolidated financial statements. Those which may be relevant to the Group are set out below. The Group does not plan to adopt these standards early.
IFRS 9: Financial Instrument:
The Group has started the process of evaluation the potential effect of this standard but is awaiting finalization of the limited amendments beforethe evaluation can be completed. Given the nature of the Group’s operations, this standard is expected to have a pervasive impact on theGroup’s financial statements.

Union Bank of Nigeria Plc and Subsidiary CompaniesConsolidated financial statements for the year ended 31 December 2014
Together with Directors' and Auditor's Reports
49
i).ii).iii).iv).v).
4
(a)(b)
(a)
(b)
The change did not have a material impact on the Group's financial statement.
IFRIC 21 LeviesAs a result of IFRIC 21 Levies, the Group has changed its accounting policy on accounting for a liability to pay a levy that is a liability in thescope of IAS 37 Provisions, Contingent Liabilities and Contingent Assets.
IFRS 15 establishes a comprehensive framework for determining whether, how much and when revenue is recognised. It replaces the existingrevenue recognition guidance, including IAS 18 Revenue, IAS 11 Construction Contracts and IFRIC 13 Customer Loyalty Programmes.IFRS 15 is effective for annual reporting periods beginning on or after 1 January 2017, with early adoption permitted.
IFRS 15 - Revenue from contracts with customers
The Group is assessing the potential impact on its consolidated financial statements resulting from the application of IFRS 15.
Changes in accounting policies
Except for the changes below, the Group has consistently applied the accounting as set out in Note 3 to all periods presented in theseconsolidated financial statements.
The Group has adopted the following new standards and amendments to standards, including any consequential amendments to otherstandards,with a date of initial application of 1 January 2014.
The following new or amended standards are not expected to have a significant impact of the Group’s consolidated financial statements.
The change did not have a material impact on the Group's financial statement.
The nature and the effects of the changes are explained below:
Offsetting Financial Assets and Financial Liabilities (Amendments to IAS 32)IFRIC 21 Levies
Offsetting Financial Assets and Financial Liabilities (Amendments to IAS 32)As a result of the amendments to IAS 32, the Group has changed its accounting policy for offsetting financial assets and financial liabilities. Theamendments clarify when an entity currently has a legally enforceable right to set-off and when gross settlement is equivalent to net settlement.
Accounting for acquisitions of interests in Joint Operations (Amendments to IFRS 11) - effective 1 January 2016.
Defined Benefits Plans:Employee Contributions (Amendments to IAS 19) - effective 1 July 2014.Equity Method in Separate Financial Statements (Amendments to IAS 27) - effective 1 January 2016.
IFRS 14 Regulatory Deferral Accounts - effective 1 January 2016.
Clarification of Acceptable Methods of Depreciation and Amortisation (Amendments to IAS 16 and IAS 38)- effective 1 January 2016.

Union Bank of Nigeria Plc and Subsidiary CompaniesConsolidated financial statements for the year ended 31 December 2014
Together with Directors' and Auditor's Reports
50
5 Financial risk management
(a) Introduction and overview
• credit risk• liquidity risk• market risk• operational risk
(b) Credit risk
(i)
(ii)(iii) (iv)(v)(vi)
the Group.
Union Bank of Nigeria Plc and its subsidiary companies ("the Bank" or "the Group") have exposure to the following risks from financialinstruments:
This note presents information about the Group's exposure to each of the above risks, the Group's objectives, policies and processes for measuringand managing risk, and the Group's management of capital. Further quantitative disclosure are included throughout these consolidated financialstatements.
Credit risk is the current or potential risk to earnings and capital arising from the failure of an obligor of the Group to repay principal or interest atthe stipulated time or failure otherwise to perform as agreed. This risk is compounded if the assigned collateral only partly covers the claims madeto the borrower, or if its valuation is exposed to frequent changes due to changing market conditions (i.e. market risk). Credit risk arises anytimethe Group commits its funds with the result that capital or earnings are dependent on borrower’s performance.
The Bank’s Risk Management philosophy is that moderate and guarded risk attitude will ensure sustainable growth in shareholder value andreputation. The Plan also sets out the roles and responsibilities of different individuals and committees involved in the credit process. Extensionof credit in the Bank is guided by its Credit Risk and Portfolio Management Plan, which sets out specific rules for risk origination andmanagement of the loan portfolio.
The goal of the Group is to apply sophisticated but realistic credit models and systems to monitor and manage credit risk. Ultimately these creditmodels and systems are the foundation for the application of internal rating-based approach to calculation of capital requirements. Thedevelopment, implementation and application of these models are guided by the Group’s Basel II strategy.
We recognise the fact that loan assets constitute a significant portion of assets on the statement of financial position. Therefore, we activelysafeguard and strive to continually improve the health of our loan portfolio. We scrutinize all applications and weed out potential problem loansduring the loan application phase, as well as constantly monitor existing loan portfolio.
The pricing of each credit granted reflects the level of risks inherent in the credit. Subject to competitive forces, the Group implements a consistent pricing model for loans to its different target markets. The client’s interest is guarded at all times, and collateral quality is never the sole reason for a positive credit decision.
The Group’s credit process requires rigourous proactive and periodic review of the quality of the loan portfolio. This helps us to identify and remediate credit issues proactively.
The Stressed Assets Committee (SAC) performs a regional review of loans with emerging signs of weakness and also classified assets. TheManagement Credit Committee (CRECO) and the Board Risk Committee also perform reviews of the quality of our loan portfolio on aforthnightly/quarterly basis respectively. These are in addition to daily reviews performed by our Credit Risk Management department.
Principal Credit PoliciesThe following are the principal credit policies of the Group:
Special Approvals: Extension of credit to certain sectors may require unique approvals or prohibited altogether.
Extension of credit: Every extension of credit must be approved by at least three officers; one of whom must be from Independent CreditRisk Management. The final approving officer must have a credit limit for the total facilities extending to the obligor (or group of relatedobligors).
Annual Review of facilities: All extension of credits must be reviewed at least once every 12 months.Industry Limits: The Group utilizes industry limits to maintain a diversified portfolio of risk assets.Tenor Limits: The Group also utilizes tenor limits to ensure improvement in quality of risk assetsProblem Recognition: There are uniform and consistent standards for recognition of credit migration and remediation across

Union Bank of Nigeria Plc and Subsidiary CompaniesConsolidated financial statements for the year ended 31 December 2014
Together with Directors' and Auditor's Reports
51
Credit process
1 Credit risk measurementRisk Rating Methodology
Risk Rating Process
Responsibility of Independent Credit Risk Management
Risk Rating Scale and external rating equivalent
Credit Risk Rating Models An Obligor Risk Rating (ORR) model has been developed by the Group for corporate and commercial customers:
In the Group, all businesses must have a documented and approved Risk Rating process for deriving risk ratings for all obligors (including thosecovered under Credit Programs). The Risk Rating process is the end-to-end process for deriving ORRs and includes models, guidelines, processcontrols, as well as any other defined processes that a business undertakes in order to arrive at ORRs. Risk rating process of each business mustbe in compliance with the Group’s Risk Rating Policy and deviations must be explicitly approved.
Establishing the Risk Rating process is the responsibility of Independent Credit Risk Analyst associated with each business. The process must bedocumented and must be approved by the Management Credit Committee (CRECO).
The Risk Rating process for each business must be reviewed and approved every three years, unless more frequent review is specified as acondition of the approvals. Interim material changes to the Risk Rating process, as determined by the Independent Credit Risk Analyst or thebusiness, must be re-approved.
In the Group, Independent Credit Risk Management has the responsibility for the overall accuracy of risk ratings assigned to obligors.
Independent Credit Risk Management is responsible for reviewing and ensuring the correctness of the ORR assigned to a borrower. This reviewincludes ensuring the ongoing consistency of the business’ Risk Rating process with the Group's Risk Rating Policy; ongoing appropriateapplication of the Risk Rating process and tools; review of judgmental and qualitative inputs into the Risk Rating process; ensuring the timeliness
and thoroughness of risk rating reviews; and ensuring that the documentation of the Risk Rating process is complete and current.
The Bank’s credit process starts with portfolio planning and target market identification. Within identified target markets, credits are initiated byrelationship managers. The proposed credits are subjected to review and approvals by applicable credit approval authorities which include thecredit analysts. Further to appropriate approvals, loans are disbursed to beneficiaries after documentation review by Credit Risk Management. On-going management and monitoring of loans is undertaken by both relationship management teams and our Credit Risk Management Group. Theprocess is applied at the Head Office and in the subsidiaries. If a preliminary analysis of a loan request by the account manager indicates that it merits further scrutiny, it is then analyzed in greater detail bythe credit analyst. If the loan application passes their detailed analysis it is then submitted to the appropriate approval authority for the size offacilities.The standard credit evaluation process is based both on quantitative figures from the financial statements and on an array of qualitative factors.Factual information on the borrower is collected as well as pertinent macroeconomic data, such as an outlook for the relevant sector, etc. Thesesubjective factors are assessed by the analyst and all individuals involved in the credit approval process, relying not only on quantitative factorsbut also on extensive knowledge of the company in question and its management.
The credit rating of the counterparty plays a fundamental role in final credit decisions as well as in the terms offered for successful loan applications. The Group employs a robust credit rating system based on international best practices (including Basel II recommendations) in the determination of the Obligor and Facility risks and thus allows the Bank to maintain its asset quality at a desired level.
The objective of the Risk Rating Policy is to ensure reliable and consistent Obligor Risk Ratings (‘ORRs’) within the Group and to provideguidelines for risk rating for retail and non – retail exposures in the Group. Facility Risk Ratings (FRRs) are in process of implementation.
The Risk rating policy incorporates credit risk rating models which estimate risk of obligor default and facility risks (covering both recovery aswell as Exposure risk). These models are currently based on expert judgment for Retail and Non-Retail Exposures. Our long-term goal is to adoptthe Internal Rating Based (“IRB”) approach. The data required to facilitate the IRB approach are being gathered.
The Group operates a 10-grade numeric risk rating scale. The risk rating scale runs from 1 to 10. Rating 1 represents the best obligors andfacilities and rating 9/10 represents the worst obligors and facilities.
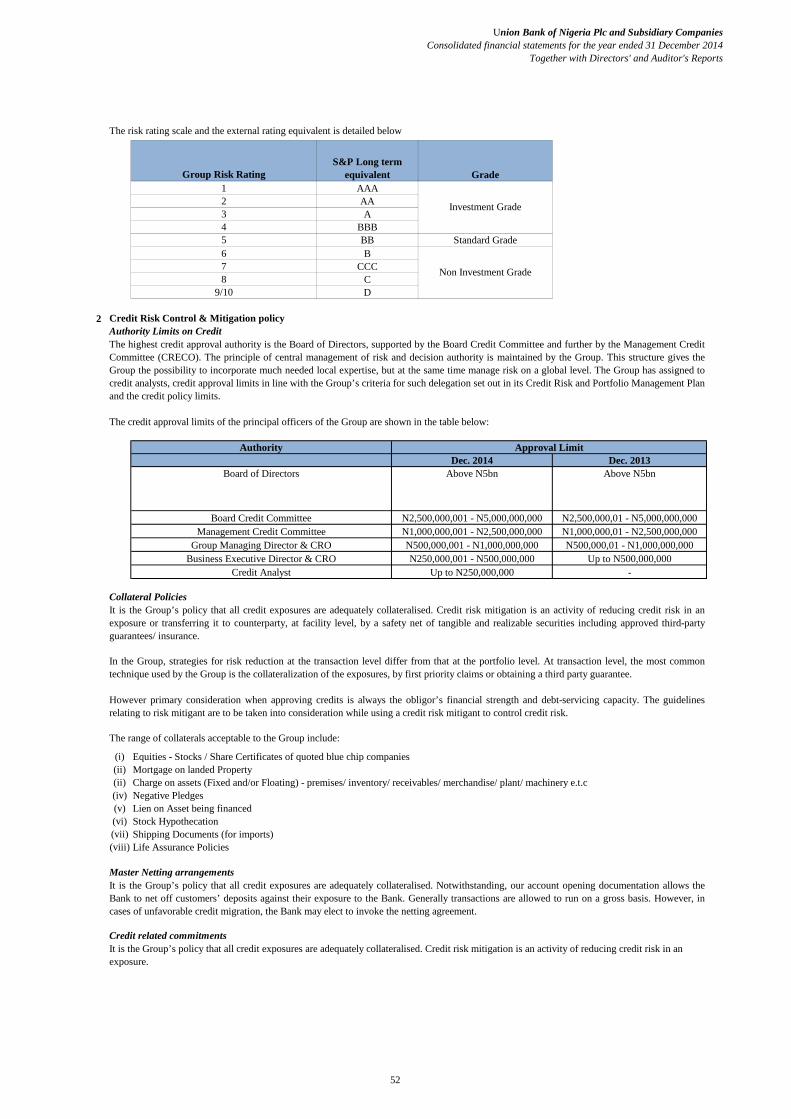
Union Bank of Nigeria Plc and Subsidiary CompaniesConsolidated financial statements for the year ended 31 December 2014
Together with Directors' and Auditor's Reports
52
Group Risk Rating12345678
9/10
2 Credit Risk Control & Mitigation policyAuthority Limits on Credit
Collateral Policies
(i)(ii)(ii)(iv)(v)(vi)(vii)(viii)
Master Netting arrangements
Credit related commitments
Credit Analyst Up to N250,000,000 -
It is the Group’s policy that all credit exposures are adequately collateralised. Credit risk mitigation is an activity of reducing credit risk in an exposure.
BB Standard GradeB
Non Investment GradeCCCCD
The risk rating scale and the external rating equivalent is detailed below
S&P Long term equivalent Grade
AAA
Investment GradeAAA
BBB
The highest credit approval authority is the Board of Directors, supported by the Board Credit Committee and further by the Management CreditCommittee (CRECO). The principle of central management of risk and decision authority is maintained by the Group. This structure gives theGroup the possibility to incorporate much needed local expertise, but at the same time manage risk on a global level. The Group has assigned tocredit analysts, credit approval limits in line with the Group’s criteria for such delegation set out in its Credit Risk and Portfolio Management Plan and the credit policy limits.
Business Executive Director & CRO
Board Credit CommitteeManagement Credit Committee
Group Managing Director & CRO
N2,500,000,001 - N5,000,000,000N1,000,000,001 - N2,500,000,000N500,000,001 - N1,000,000,000N250,000,001 - N500,000,000
N2,500,000,01 - N5,000,000,000N1,000,000,01 - N2,500,000,000N500,000,01 - N1,000,000,000
Up to N500,000,000
The credit approval limits of the principal officers of the Group are shown in the table below:
Authority
Board of Directors Above N5bn Above N5bn
Approval LimitDec. 2014 Dec. 2013
Equities - Stocks / Share Certificates of quoted blue chip companiesMortgage on landed Property
It is the Group’s policy that all credit exposures are adequately collateralised. Credit risk mitigation is an activity of reducing credit risk in anexposure or transferring it to counterparty, at facility level, by a safety net of tangible and realizable securities including approved third-partyguarantees/ insurance.
The range of collaterals acceptable to the Group include:
In the Group, strategies for risk reduction at the transaction level differ from that at the portfolio level. At transaction level, the most commontechnique used by the Group is the collateralization of the exposures, by first priority claims or obtaining a third party guarantee.
However primary consideration when approving credits is always the obligor’s financial strength and debt-servicing capacity. The guidelinesrelating to risk mitigant are to be taken into consideration while using a credit risk mitigant to control credit risk.
Life Assurance Policies
Charge on assets (Fixed and/or Floating) - premises/ inventory/ receivables/ merchandise/ plant/ machinery e.t.cNegative PledgesLien on Asset being financedStock HypothecationShipping Documents (for imports)
It is the Group’s policy that all credit exposures are adequately collateralised. Notwithstanding, our account opening documentation allows theBank to net off customers’ deposits against their exposure to the Bank. Generally transactions are allowed to run on a gross basis. However, incases of unfavorable credit migration, the Bank may elect to invoke the netting agreement.

Union Bank of Nigeria Plc and Subsidiary CompaniesConsolidated financial statements for the year ended 31 December 2014
Together with Directors' and Auditor's Reports
53
Exposure to credit risk
GroupNote Dec. 2014 Dec. 2013 Dec. 2014 Dec. 2013 Dec. 2014 Dec. 2013 Dec. 2014 Dec. 2013 Dec. 2014 Dec. 2013
N million N million N million N million N million N million N million N million N million N million
Carrying amount 22,24,20,19,18 312,797 229,542 197,200 289,353 83,935 65,167 745 2,847 60,395 46,566
Assets at amortised costIndividually impaired:Grade 6: Impaired 800 800 - - - - - - - - Grade 7: Impaired 1,546 1,528 - - - - - - - - Grade 8: Impaired 14,588 12,279 - - - - - - - - Gross amount 16,934 14,607 - - - - - - - - Allowance for impairment (9,931) (8,897) - - - - - - - - Carrying amount 7,003 5,710 - - - - - - - -
Collectively impaired:Grade 1-3: Low-fair risk 238,889 126,976 - - - - - - - - Grade 4-5: Watch list 70,103 88,549 - - - - - - - - Gross amount 308,992 215,525 - - - - - - - - Allowance for impairment (13,663) (10,709) - - - - - - - - Carrying amount 295,329 204,816 - - - - - - - -
Past due but not impaired:Grade 4-5: Low-fair risk 61 61 - - - - - - - - Gross amount 61 61 - - - - - - - - Allowance for impairment - - Carrying amount 61 61 - - - - - - - -
Past due comprises:30 -90 days 61 61 - - - - - - - - Carrying amount 61 61 - - - - - - - - Neither past due nor impaired:Grade 1-3: Low-fair risk 10,404 18,955 117,690 272,572 83,935 65,167 - - 60,395 46,566 Carrying amount 10,404 18,955 117,690 272,572 83,935 65,167 - - 60,395 46,566
Total carrying amount -amortised cost 312,797 229,542 117,690 272,572 83,935 65,167 - - 60,395 46,566
Loans and advances to customers Investment securities Pledged assets Non Pledged assets Placements

Union Bank of Nigeria Plc and Subsidiary CompaniesConsolidated financial statements for the year ended 31 December 2014
Together with Directors' and Auditor's Reports
54
GroupNote Dec. 2014 Dec. 2013 Dec. 2014 Dec. 2013 Dec. 2014 Dec. 2013 Dec. 2014 Dec. 2013 Dec. 2014 Dec. 2013
N million N million N million N million N million N million N million N million N million N million
Available-for-sale assets (AFS)Individually impaired:Grade 6: Impaired - - 20,067 14,456 - - - - - - Grade 7: Impaired - - - - - - - - - - Grade 8: Impaired - - - - - - - - - - Gross amount - - 20,067 14,456 - - - - - - Allowance for impairment - - (4,072) (4,083) Carrying amount - - 15,995 10,373 - - - - - -
Neither past due nor impaired:Grade 1-3: Low-fair risk - - 63,515 6,408 - - - - - - Grade 4-5: Low-fair risk - - - - - - - - - - Carrying amount - - 63,515 6,408 - - - - - -
Assets at fair value through profit or lossGrade 1-3: Low-fair risk - - - - - - 745 2,847 - - Grade 4-5: Low-fair risk - - - - - - - - - - Carrying amount - - - - - - 745 2,847 - -
Total carrying amount -fair value - - 79,510 16,781 - - 745 2,847 - -
Total carrying amount 312,797 229,542 197,200 289,353 83,935 65,167 745 2,847 60,395 46,566
Loans and advances to customers Investment securities Pledged assets Non Pledged assets Placements

Union Bank of Nigeria Plc and Subsidiary CompaniesConsolidated financial statements for the year ended 31 December 2014
Together with Directors' and Auditor's Reports
55
BankNote Dec. 2014 Dec. 2013 Dec. 2014 Dec. 2013 Dec. 2014 Dec. 2013 Dec. 2014 Dec. 2013 Dec. 2014 Dec. 2013
N million N million N million N million N million N million N million N million N million N million
Carrying amount 22,24,20,19,18 302,372 210,118 193,656 290,377 83,935 65,167 745 2,847 7,502 -
Assets at amortised costIndividually impaired:Grade 6: Impaired - - - - - - - - - - Grade 7: Impaired 1,546 1,528 - - - - - - - - Grade 8: Impaired 15,210 12,116 - - - - - - - - Gross amount 16,756 13,644 - - - - - - - - Allowance for impairment (9,753) (9,929) - - - - - - - - Carrying amount 7,003 3,715 - - - - - - - -
Collectively impaired:Grade 1-3: Low-fair risk 238,889 128,527 - - - - - - - - Grade 4-5: Watch list 70,103 88,549 - - - - - - - - Gross amount 308,992 217,076 - - - - - - - - Allowance for impairment (13,623) (10,673) - - - - - - - - Carrying amount 295,369 206,403 - - - - - - - -
Past due but not impaired:Grade 4-5: Low-fair risk - - - - - - - - Carrying amount - - - - - - - - - -
Past due comprises:30 -90 days - - - - - - - - - - Carrying amount - - - - - - - - - - Neither past due nor impaired:Grade 1-3: Low-fair risk - - 117,690 272,572 83,935 65,167 - - 7,502 - Grade 4-5: Low-fair risk - - - - - - - - - Carrying amount - - 117,690 272,572 83,935 65,167 - - 7,502 -
Total carrying amount -amortised cost 302,372 210,118 117,690 272,572 83,935 65,167 - - 7,502 -
PlacementsLoans and advances to Investment securities Pledged assets Non Pledged assets

Union Bank of Nigeria Plc and Subsidiary CompaniesConsolidated financial statements for the year ended 31 December 2014
Together with Directors' and Auditor's Reports
56
Note Dec. 2014 Dec. 2013 Dec. 2014 Dec. 2013 Dec. 2014 Dec. 2013 Dec. 2014 Dec. 2013 Dec. 2014 Dec. 2013N million N million N million N million N million N million N million N million N million N million
Available-for-sale assets (AFS)Individually impaired:Grade 6: Impaired - - 1,757 1,757 - - - - - - Grade 7: Impaired - - - - - - - - - - Grade 8: Impaired - - 3,738 3,738 - - - - - - Gross amount - - 5,495 5,495 - - - - - - Allowance for impairment - - (4,072) (4,542) Carrying amount - - 1,423 953 - - - - - -
Neither past due nor impaired:Grade 1-3: Low-fair risk - - 74,543 16,852 - - - - - - Grade 4-5: Low-fair risk - - - - - - - - - - Carrying amount - - 74,543 16,852 - - - - - -
Assets at fair value through profit or lossGrade 1-3: Low-fair risk - - - - - - 745 2,847 - - Grade 4-5: Low-fair risk - - - - - - - - - - Carrying amount - - - - - - 745 2,847 - -
Total carrying amount -fair value - - 75,966 17,805 - - 745 2,847 - -
Total carrying amount 302,372 210,118 193,656 290,377 83,935 65,167 745 2,847 7,502 -
Loans and advances to Investment securities Pledged assets Non Pledged assets Placements

Union Bank of Nigeria Plc and Subsidiary CompaniesConsolidated financial statements for the year ended 31 December 2014
Together with Directors' and Auditor's Reports
57
GroupGross Net Gross Net Gross Net Gross Net Gross Net
31 December 2014 N million N million N million N million N million N million N million N million N million N million
Grade 6-8: Individually impaired 16,934 7,003 20,067 15,995 - - - - - - Total 16,934 7,003 20,067 15,995 - - - - - -
31 December 2013
Grade 6-8: Individually impaired 14,607 5,710 14,456 10,373 - - - - - - Total 14,607 5,710 14,456 10,373 - - - - - -
BankGross Net Gross Net Gross Net Gross Net Gross Net
31 December 2014 N million N million N million N million N million N million N million N million N million N million
Grade 6-8: Individually impaired 16,756 7,003 5,495 1,423 - - - - - - Total 16,756 7,003 5,495 1,423 - - - - - -
31 December 2013
Grade 6-8: Individually impaired 13,644 3,715 5,495 953 - - - - - - Total 13,644 3,715 5,495 953 - - - - - -
Concentrations of credit riskThe Group monitors concentrations of credit risk by sector and by geographic location. An analysis of concentrations of credit risk from loans and advances and investment securities at the reportingdate is shown below:
Loans and advances to Investment securities Pledged assets Non Pledged assets Placements
Set out below is an analysis of the gross and net (of allowances for impairment) amounts of individually impaired assets by risk grade:
Loans and advances to Investment securities Pledged assets Non Pledged assets Placements

Union Bank of Nigeria Plc and Subsidiary CompaniesConsolidated financial statements for the year ended 31 December 2014
Together with Directors' and Auditor's Reports
58
GroupNote Dec. 2014 Dec. 2013 Dec. 2014 Dec. 2013 Dec. 2014 Dec. 2013 Dec. 2014 Dec. 2013 Dec. 2014 Dec. 2013
N million N million N million N million N million N million N million N million N million N million
Carrying amount 22,24,20,19,18 312,797 229,542 197,200 289,353 83,935 65,167 745 2,847 60,395 46,566
Concentration by sector:Agriculture 18,226 15,348 - - - - - - - - Oil and gas 93,537 63,380 - - - - - - - Capital market 39 1,765 - - - - - - - - Consumer credit 20,906 17,802 - - - - - - - - Manufacture 38,494 23,830 - 715 - - - - - - Mortgage 1,803 6,565 - - - - - - - - Real estate and construction 29,359 14,786 2,427 - - - - - - - General commerce 39,262 37,572 - - - - - - - - Finance and Insurance 1,761 64 - - - - - - 60,395 46,566 Government 17,308 6,959 188,171 277,280 67,246 65,167 745 2,847 - - Power 23,025 13,657 - - - - - - - - Other public utilities 19 24 - - - - - - - - Transportation 1,797 844 - - - - - - - - Communication 22,514 23,179 - - - - - - - - Education 1,368 372 - - - - - - - - Others 3,379 3,395 15,390 11,358 - - - - - -
312,797 229,542 205,988 289,353 67,246 65,167 745 2,847 60,395 46,566
Concentration by location:Nigeria 302,372 210,118 202,004 285,369 67,246 65,167 745 2,847 - 6,508 Europe 10,425 19,424 3,984 3,984 - - - - 54,853 40,058
312,797 229,542 205,988 289,353 67,246 65,167 745 2,847 54,853 46,566
Loans and advances to customers Investment securities Pledged assets Non Pledged assets Placements

Union Bank of Nigeria Plc and Subsidiary CompaniesConsolidated financial statements for the year ended 31 December 2014
Together with Directors' and Auditor's Reports
59
BankNote Dec. 2014 Dec. 2013 Dec. 2014 Dec. 2013 Dec. 2014 Dec. 2013 Dec. 2014 Dec. 2013 Dec. 2014 Dec. 2013
N million N million N million N million N million N million N million N million N million N million
Carrying amount 22,24,20,19,18 302,372 210,118 193,656 290,377 83,935 65,167 745 2,847 7,502 - Concentration by sector: - - - - - - Agriculture 18,226 15,348 - - - - - - - - Oil and gas 93,537 63,380 - - - - - - - Capital market 39 1,765 - - - - - - - - Consumer credit 20,906 17,802 - - - - - - - - Manufacture 38,494 23,830 - 715 - - - - - - Mortgage 1,803 6,565 - - - - - - - - Real estate and construction 29,359 14,786 2,195 - - - - - - - General commerce 28,837 18,147 - - - - - - - - Finance and Insurance 1,761 64 - - - - - - 7,502 - Government 17,308 6,959 175,466 274,281 83,935 65,167 745 2,847 - - Power 23,025 13,657 - - - - - - - - Other public utilities 19 24 - - - - - - - - Transportion 1,797 844 - - - - - - - - Communication 22,514 23,179 - - - - - - - - Education 1,368 372 - - - - - - - - Others 4,955 3,395 15,995 15,381 - - - - - -
303,948 210,118 193,656 290,377 83,935 65,167 745 2,847 7,502 -
Concentration by location:Nigeria 303,948 210,118 193,656 290,377 83,935 65,167 745 2,847 7,502 - Europe - - - - - - - - - -
303,948 210,118 193,656 290,377 83,935 65,167 745 2,847 7,502 -
Non Pledged assets Placements
Concentration by location for loans and advances is measured based on the location of the Group entity holding the asset, which has a high correlation with the location of the borrower.
Loans and advances to customers Investment securities Pledged assets
fulfilled their contractual settlement obligations. Settlement limits form part of the credit approval/limit monitoring process described earlier. Acceptance of settlement risk on free settlement trades requires transaction specific or counterparty specific approvals from Group risk.
Concentration by location for investment securities is measured based on the location of the issuer of the security.
The Group’s activities may give rise to risk at the time of settlement of transactions and trades. Settlement risk is the risk of loss due to the failure of an entity to honour its obligations to deliver cash, securities or other assets as contractually agreed.
For certain types of transactions the Group mitigates this risk by conducting settlements through a settlement/clearing agent to ensure that a trade is settled only when both parties have

Union Bank of Nigeria Plc and Subsidiary CompaniesConsolidated financial statements for the year ended 31 December 2014
Together with Directors' and Auditor's Reports
60
(c) Liquidity risk
2014 2013
Average for the period 61.44 90.79Maximum for the period 71.30 97.13Minimum for the period 54.60 76.30
The Bank recognizes the importance of liquidity in the day-to-day operations of its business as a stand-alone bank and also as a parent entity, hence It believesthat it is crucial to have a plan for addressing liquidity in times of crisis. The Bank has a contingency funding plan in place which clearly defines the Key RiskIndicators (KRIs) to monitor the market conditions and measure its impact on the Bank’s liquidity position and funding strategies and It also addresses thereporting, communications and confidence management in the unlikely event of a liquidity crisis caused by unstable market.
Exposure to Liquidity RiskDetails of the reported Group ratio of net liquid assets to deposits from cutomers at the reporting date and during the reporting period were as follows:
At 31 December
Contingency Funding Plan
The following table shows the undiscounted cash flows on the Group’s financial assets and liabilities and on the basis of their earliest possible contractualmaturity. The Gross nominal inflow / (outflow) disclosed in the table is the contractual, undiscounted cash flow on the financial liability or commitment.
Liquidity Risk Appetite
Liquidity Risk Measurement, monitoring and reportingThe Bank's Market and Liquidity Risk Management Department is responsible for active management of Union Bank's liquidity risk, guided by the Boardapproved liquidity risk framework. The Department uses various tools to assess the bank's liquidity risk, capturing information related to balance sheetstructure, cash inflows and outflows, off-balance sheet activities and market operations. Contractual maturity report, Structural liquidity reports, concentrationin funding, liquidity ratio reports, liquidity risk stress test reports, etc are prepared in assessing its liquidity risk position and taking risk mitigation measures.All limits are monitored at defined intervals with exceptions escalated at the bank's ALCO and Board Risk Committees meetings which hold monthly andquarterly respectively.
The bank views its exposure limits for liquidity risk as an essential component for a prudent liquidity risk management. Consequently, Limits for liquidity riskare maintained under the following categories: Maturity mismatches, Liquidity ratios ( regulatory and internal), prudent portfolio limits on the mix of balancesheet assets (e.g. loans by credit category, financial instruments, etc.) and concentration limits from funding sources.
Identification of Liquidity Risk
Union Bank's Asset and Liability Management Policy defines Liquidity Risk as the risk that arises due to inability of the bank to meet its obligations and fundits asset growth without incurring unacceptable cost arising from borrowing at above market cost and asset sale at off-market prices. The bank is principallyexposed to liquidity risk due to mismatch in fund inflows and outflows arising from its borrowing and lending activities and market operations. Key elementsof the bank's liquidity risk management framework include:
The bank's liquidity management framework recognises two major sources of liquidity risk: (i) Funding liquidity Risk and (ii) Market Liquidity Risk.
The risk that Union Bank will be unable to meet its obligations as they become due because of the inability to liquidate assets or obtain adequate funding isviewed as the bank's funding risk. This risk is structural in nature and lies in the mismatches in assets and liabilities of bank’s balance sheet.
Market liquidity risk however, is the risk that Union bank will be unable to meet its obligations as they become due because it cannot easily unwind or offsetspecific exposures without significantly lowering market prices due to lack of market depth or market disruptions. This risk could arise due to illiquidity of itsassets and weak standing in market to raise fund. Market liquidity risk comes to play in stressed market conditions.

Union Bank of Nigeria Plc and Subsidiary CompaniesConsolidated financial statements for the year ended 31 December 2014
Together with Directors' and Auditor's Reports
61
Residual contractual maturities of financial assets and liabilities
Group NoteCarrying
amount
Gross nominal inflow / (outflow)
Less than 3 month 3 - 6 months
6 - 12 months 1 - 5 years
More than 5 years
31 December 2014 N million N million N million N million N million N million N million
Non-derivative assets:Cash and cash equivalents 18 121,960 121,960 121,960 - - - - Non-pledged trading assets 19 745 745 745 - - - - Pledged assets 20 83,935 116,181 16,340 9,520 3,418 52,554 34,348 Loans and advances to customers 22 312,797 335,853 105,009 24,745 29,661 125,139 51,299 Investment securities 24 197,200 248,829 28,932 47,371 13,504 110,981 48,042 Other receivables 31 114,233 114,233 114,233 - - - -
830,870 937,801 387,219 81,636 46,583 288,674 133,689 Derivative assets:Risk Management 7 7 7 - - - -
830,877 937,808 387,226 81,636 46,583 288,674 133,689 Non-derivative liabilitiesDeposits from banks 32 (61,890) (61,890) (61,512) (378) - - - Deposits from customers 33 (527,617) (527,617) (515,023) (11,608) (917) (69) - Other financial liabilities 35 (62,748) (62,748) (62,748) - - - - Other borrowed funds 37 (78,135) (78,135) (13,915) (5,054) (17,429) (38,757) (2,980)
(730,390) (730,390) (653,198) (17,039) (18,346) (38,826) (2,980) Derivative liabilities:Risk Management (7) (7) (7) - - - -
(730,397) (730,397) (653,205) (17,039) (18,346) (38,826) (2,980)
Gap (asset - liabilities) 830,870 207,411 (265,979) 64,597 28,238 249,848 130,709 Cumulative liquidity gap 207,411 (265,979) (201,383) (173,145) 76,703 207,412
Group NoteCarrying
amount
Gross nominalinflow /(outflow)
Less than 3month 3 - 6 months
6 - 12months 1 - 5 years
More than 5years
31 December 2013 N million N million N million N million N million N million N million
Non-derivative assets:Cash and cash equivalents 18 100,925 100,925 100,925 - - - - Non-pledged trading assets 19 2,847 2,847 2,847 - - - - Pledged assets 20 65,167 65,167 2,578 3,209 - 33,384 25,996 Loans and advances to customers 22 229,542 229,542 124,826 12,485 21,090 68,151 2,990 Investment securities 24 289,353 289,353 84,809 41,179 72,288 31,497 59,580 Other receivables 31 73,119 73,119 73,119 - - - -
760,953 760,953 389,104 56,873 93,378 133,032 88,566
Non-derivative liabilitiesDeposits from banks 32 (46,794) (46,794) (46,794) - - - - Deposits from customers 33 (482,706) (482,706) (477,018) (3,495) (2,153) (40) - Other financial liabilities 35 (104,394) (104,394) (104,394) - - - - Other borrowed funds 37 (45,280) (45,280) (4,607) (513) (3,026) (34,443) (2,691)
(679,174) (679,174) (632,813) (4,008) (5,179) (34,483) (2,691) Gap (asset - liabilities) 81,779 81,779 (243,709) 52,865 88,199 98,549 85,875 Cumulative liquidity gap 81,779 (243,709) (190,844) (102,645) (4,096) 81,779
Bank NoteCarrying
amount
Gross nominalinflow /(outflow)
Less than 3month 3 - 6 months
6 - 12months 1 - 5 years
More than 5years
31 December 2014 N million N million N million N million N million N million N million
Non-derivative assets:Cash and cash equivalents 18 58,457 58,457 58,457 - - - - Non-pledged trading assets 19 745 745 745 - - - - Pledged assets 20 83,935 116,181 16,340 9,520 3,418 52,554 34,348 Loans and advances to customers 22 302,372 325,428 98,820 24,004 29,661 121,731 51,211 Investment securities 24 193,656 245,286 28,932 45,512 13,504 109,297 48,042 Other receivables 31 114,233 114,233 114,233 - - - -
753,398 860,330 317,527 79,036 46,583 283,583 133,601
Non-derivative liabilitiesDeposits from banks 32 (18,055) (18,055) (17,677) (378) - - - Deposits from customers 33 (507,431) (507,431) (498,955) (7,552) (917) (7) - Other financial liabilities 35 (62,748) (62,748) (62,748) - - - - Other borrowed funds 37 (78,135) (78,135) (13,915) (5,054) (17,429) (38,757) (2,980)
(666,369) (666,369) (593,295) (12,984) (18,346) (38,763) (2,980) Gap (asset - liabilities) 87,029 193,961 (275,769) 66,052 28,238 244,819 130,621 Cumulative liquidity gap 193,961 (275,769) (209,717) (181,479) 63,340 193,961

Union Bank of Nigeria Plc and Subsidiary CompaniesConsolidated financial statements for the year ended 31 December 2014
Together with Directors' and Auditor's Reports
62
Bank NoteCarrying
amount
Gross nominal inflow
/(outflow)Less than 3
month 3 - 6 months6 - 12
months 1 - 5 yearsMore than 5
years31 December 2013 N million N million N million N million N million N million N million
Non-derivative assets:Cash and cash equivalents 18 53,141 53,141 53,141 - - - - Non-pledged trading assets 19 2,847 2,847 2,847 - - - - Pledged assets 20 65,167 65,167 2,578 3,209 - 33,384 25,996 Loans and advances to customers 22 210,118 210,118 96,378 12,055 20,906 68,112 12,667 Investment securities 24 290,377 290,377 90,618 40,381 71,491 30,512 57,375 Other receivables 31 73,119 73,119 73,119 - - - -
694,769 694,769 318,681 55,645 92,397 132,008 96,038
Non-derivative liabilitiesDeposits from banks 32 (3,200) (3,200) (3,200) - - - - Deposits from customers 33 (479,956) (479,956) (476,495) (2,686) (775) - - Other financial liabilities 35 (104,045) (104,045) (104,045) - - - - Other borrowed funds 37 (45,280) (45,280) (4,607) (513) (3,026) (34,443) (2,691)
(632,481) (632,481) (588,347) (3,199) (3,801) (34,443) (2,691) Gap (asset - liabilities) 62,288 62,288 (269,666) 52,446 88,596 97,565 93,347 Cumulative liquidity gap 62,288 (269,666) (217,220) (128,624) (31,059) 62,288
(d) Market risk
Interest rate risk management and control
GroupThe table below summarizes the Group's interest rate gap positions:
In millions of Naira Carrying Less than 3 More thanNote amount months 6 months 12 months 5 years 5 years
31 December 2014
Non-derivative assetsCash and cash equivalents 18 121,960 60,395 60,395 - - - - Non-pledged trading assets 19 745 745 745 - - - - Pledged assets 20 83,935 117,228 17,387 9,520 3,418 52,554 34,348 Loans and advances to customers 22 312,797 290,027 271,664 1,681 4,318 12,276 88 Investment securities 24 197,200 174,938 17,797 46,310 14,301 110,282 42,669 Other receivables 31 114,233 - - - - - -
830,870 643,333 367,987 57,511 22,038 175,112 77,104 Non-derivative liabilitiesDeposits from banks 32 (61,890) (61,890) (61,890) - - - - Deposits from customers 33 (527,617) (305,437) (292,843) (11,608) (917) (69) - Other financial liabilities 35 (62,748) - - - - - - Other borrowed funds 37 (78,135) (78,135) (13,915) (5,054) (17,429) (38,757) (2,980)
(730,390) (445,462) (368,648) (16,662) (18,346) (38,826) (2,980)Total interest re-pricing gap 100,480 197,871 (661) 40,850 3,692 136,287 74,124
One of the integral elements of the bank's interest rate risk management framework is an articulated appetite for interest rate risk sensitive exposures. Interestrate risk limits are set for Price value per basis point (PV01), value at risk (VaR), stop loss, management action triggers and economic value of equity (EVE).The bank's Market Risk Department is responsible for measuring, monitoring, reporting actual positions against set limits and carrying out stress tests atdefined intervals.
The table below summarizes the Group's interest rate gap positions. Using the re-pricing gap, the bank is able to measure interest rate risks arising from yieldcurve, basis and re-pricing risks in its balance sheet using the Economic value of equity model.
Re-pricing period
Union Bank’s ability to effectively identify, assess, monitor and manage market risks involved in its activities is critical to its soundness and profitability. Thebank's exposure to market risk is through proprietary investments and asset and liability management activities which have direct exposure to adversemovements in market risk factors such as foreign exchange rates and interest rates.
Total amount sensitive to
Rate
Interest rate risk is the potential loss to the income and/or economic value of equity of the bank as a result of adverse movement in interest rates. Union Bankis exposed to three dominant interest rate risks; re-pricing risk, basis risk and yield curve risk due to its primary function of borrowing and lending and takingproprietary positions, as part of strategy, to improve earnings.
Re-pricing risk is caused by changes in interest rates at different times due to re-pricing maturities of assets, liabilities and off-balance sheet instruments.Yield curve risk arises due movement of yields (parallel and non-parallel shifts of yield curve) at different times. The re-pricing mismatches of assets andliabilities expose the bank to loss in revenue and economic value due to unanticipated changes in interest rates. Basis risk arises from imperfect correlationsbetween interest rate benchmarks leading to changes in rates earned and paid on different instrument otherwise with similar re-pricing maturities.

Union Bank of Nigeria Plc and Subsidiary CompaniesConsolidated financial statements for the year ended 31 December 2014
Together with Directors' and Auditor's Reports
63
Group
In millions of Naira NoteCarrying
amount
Total amount sensitive to
RateLess than 3
months 6 months 12 months 5 yearsMore than 5
years31 December 2013
Non-derivative assetsCash and cash equivalents 18 100,925 46,566 46,566 - - - - Non-pledged trading assets 19 2,847 2,847 2,847 - - - - Pledged assets 20 65,167 65,167 2,578 3,209 - 33,384 25,996 Loans and advances to customers 22 229,542 229,542 124,826 12,485 21,090 68,151 2,991 Investment securities 24 289,353 289,353 84,809 41,179 72,288 31,497 59,579 Other receivables 31 73,119 - - - - - -
760,953 633,475 261,626 56,873 93,378 133,032 88,566 Non-derivative liabilitiesDeposits from banks 32 (46,794) (46,794) - - - - Deposits from customers 33 (482,706) (281,258) (275,570) (3,495) (2,153) (40) - Other financial liabilities 35 (104,394) - - - - - - Other borrowed funds 37 (45,280) (45,280) (4,607) (513) (3,026) (34,443) (2,692)
(679,174) (373,332) (280,177) (4,008) (5,179) (34,483) (2,692)Total interest re-pricing gap 81,779 260,143 (18,551) 52,865 88,199 98,549 85,874
Bank
In millions of Naira NoteCarrying
amount
Total amount sensitive to
RateLess than 3
months 6 months 12 months 5 yearsMore than 5
years31 December 2014
Non-derivative assetsCash and cash equivalents 18 58,457 7,502 7,502 - - - - Non-pledged trading assets 19 745 745 745 - - - - Pledged assets 20 83,935 113,283 16,512 6,450 3,418 52,554 34,348 Loans and advances to customers 22 302,372 279,601 265,474 940 4,318 8,869 - Investment securities 24 193,656 170,477 17,230 41,270 7,625 85,364 18,988 Other receivables 31 114,233 - - - - - -
753,398 571,608 307,464 48,660 15,362 146,787 53,335 Non-derivative liabilitiesDeposits from banks 32 (18,055) (18,055) (17,677) (378) - - - Deposits from customers 33 (507,431) (298,822) (290,346) (7,552) (917) (7) - Other financial liabilities 35 (62,748) - - - - - - Other borrowed funds 37 (78,135) (53,465) (53,465) - - - -
(666,369) (370,343) (361,488) (7,930) (917) (7) - Total interest re-pricing gap 87,029 201,266 (54,025) 40,730 14,444 146,781 53,335
In millions of Naira Carrying Less than 3 More thanBank Note amount months 6 months 12 months 5 years 5 years31 December 2013
Non-derivative assetsCash and cash equivalents 18 53,141 - - - - - - Non-pledged trading assets 19 2,847 2,847 2,847 - - - - Pledged assets 20 65,167 65,167 2,578 3,209 - 33,384 25,996 Loans and advances to customers 22 210,118 210,119 176,563 2,561 1,450 16,667 12,878 Investment securities 24 290,377 290,377 90,617 40,381 71,491 30,512 57,376 Other receivables 31 73,119 - - - - - -
621,650 568,510 272,605 46,151 72,941 80,563 96,250 Non-derivative liabilitiesDeposits from banks 32 (3,200) (3,200) (3,200) - - - - Deposits from customers 33 (479,956) (285,763) (282,302) (2,686) (775) - - Other financial liabilities 35 (104,045) - - - - - - Other borrowed funds 37 (45,280) (45,280) (4,607) (513) (3,026) (34,443) (2,691)
(632,481) (334,243) (290,109) (3,199) (3,801) (34,443) (2,691)Total interest re-pricing gap 234,267 (17,504) 42,952 69,140 46,120 93,559
Re-pricing period
Re-pricing period
Total amount sensitive to
Rate
Re-pricing period

Union Bank of Nigeria Plc and Subsidiary CompaniesConsolidated financial statements for the year ended 31 December 2014
Together with Directors' and Auditor's Reports
64
Security Position VaR 1-Day VaR 10-Day
Treasury Bills 404 0 1 0 FGN Bonds 300 3 9 3
Foreign currency risk
Group Total US Dollar Euro Pound Naira OthersN million N million N million N million N million N million
31 December 2014Cash and cash equivalents 18 121,960 79,498 6,482 8,507 27,281 192 Non-pledged assets 19 745 - - - 745 - Pledged assets 20 83,935 4,695 - - 79,240 - Loans and advances to customers 22 312,797 143,795 658 1,689 166,605 50 Investment securities 24 197,200 3,543 - - 193,657 - Other receivables 31 114,233 - 114,233 Total financial assets 830,870 231,531 7,140 10,196 581,760 242
Deposits from banks 32 (61,890) (43,835) - - (18,055) - Deposit from customers 33 (527,617) (32,780) (1,631) (7,036) (486,014) (155) Other financial liabilities 35 (62,748) - - - (62,748) - Other borrowed funds 37 (78,135) (53,465) - - (24,670) - Total financial liabilities (730,390) (130,080) (1,631) (7,036) (591,487) (155)
Net on-balance sheet position 100,480 101,451 5,509 3,160 (9,727) 87
Total US Dollar Euro Pound Naira OthersN million N million N million N million N million N million
31 December 2013Cash and cash equivalents 18 100,925 55,638 7,717 8,093 29,211 266 Non-pledged assets 19 2,847 - - - 2,847 - Pledged assets 20 65,167 - - - 65,167 - Loans and advances to customers 22 229,542 92,667 658 1,689 134,478 50 Investment securities 24 289,353 3,984 - - 285,369 - Other receivables 31 73,119 73,119 Total financial assets 760,953 152,289 8,375 9,782 590,191 316
Deposits from banks 32 (46,794) - - (43,594) (3,200) - Deposit from customers 33 (482,705) (39,733) (3,048) (3,996) (435,773) (155) Other financial liabilities 35 (104,394) - - - (104,394) - Other borrowed funds 37 (45,280) (15,735) - - (29,545) - Total financial liabilities (679,173) (55,468) (3,048) (47,590) (572,912) (155)
81,780 96,821 5,327 (37,808) 17,279 161
As a licensed foreign exchange dealer and member of the Interbank foreign exchange market, the bank is exposed to foreign exchange risk, hence the need toeffectively identify, assess, monitor and manage foreign exchange rate risk as part of its overall market risk management process.
To complement the re-pricing gap, the group adopted the value at risk model during the year which was prospectively applied, for measuring interest rate risk inherentin any trading position or portfolio. The value at risk (VaR) of a position or portfolio is the loss or change in value that is not expected to be exceeded with a givendegree of confidence (99%) over a specified time period. VaR is therefore a statistical measure of variability in the value of a portfolio of positions or earnings fromeconomic activity arising from the changes in the market prices of the commodities or other variables underlying the portfolio or activity. Value at Risk measurement ismost appropriate for marked-to-market portfolios.The value at risk for the bank's interest rate risk trading portfolio as at December 31, 2014 is as follows:
Diversified VaR1-Day
In millions of naira
Foreign exchange rate risk management and control
The table below summarizes the Group's foreign exchange balance sheet as at December 31, 2014:
In line with the bank's overall market risk management framework, an articulated appetite for foreign exchange rate risk is approved by the Board. Limits are set forForeign exchange net open positions (NOPL) in line with regulation, value at risk (VaR), stop loss and management action triggers. The bank's Market RiskDepartment is responsible for measuring, monitoring, reporting actual positionsagainst set limits and carrying out stress tests at defined intervals.
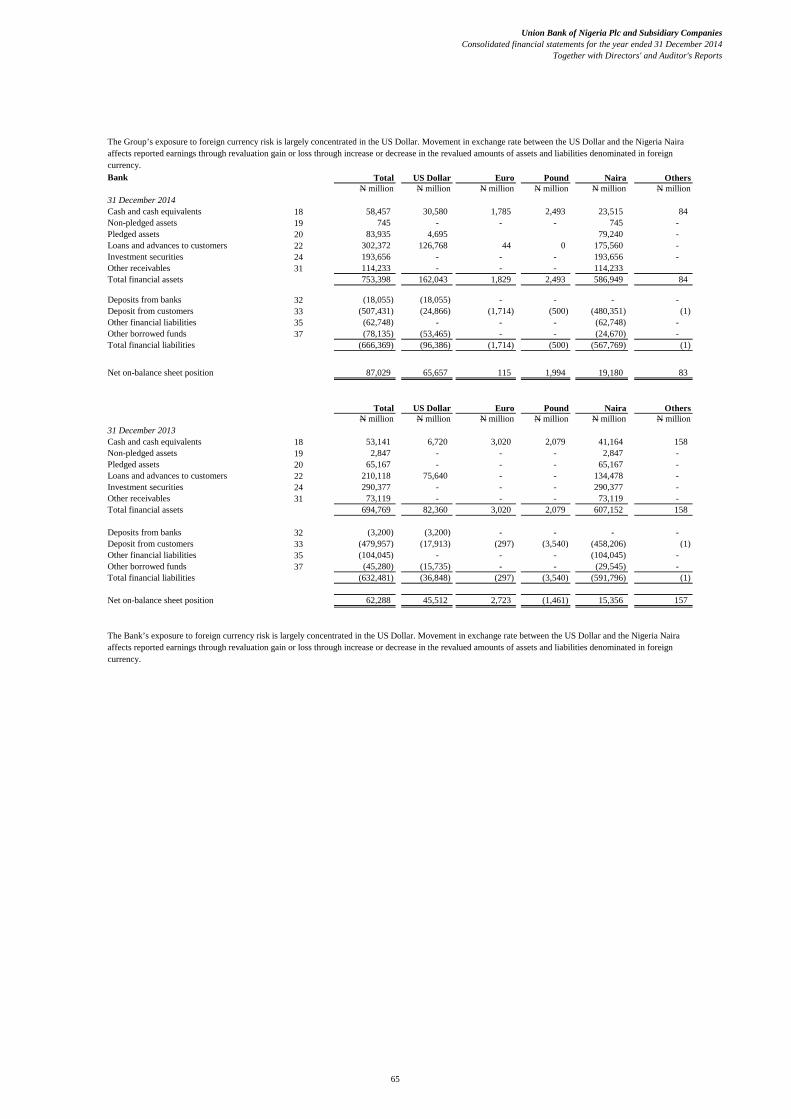
Union Bank of Nigeria Plc and Subsidiary CompaniesConsolidated financial statements for the year ended 31 December 2014
Together with Directors' and Auditor's Reports
65
Bank Total US Dollar Euro Pound Naira OthersN million N million N million N million N million N million
31 December 2014Cash and cash equivalents 18 58,457 30,580 1,785 2,493 23,515 84 Non-pledged assets 19 745 - - - 745 - Pledged assets 20 83,935 4,695 79,240 - Loans and advances to customers 22 302,372 126,768 44 0 175,560 - Investment securities 24 193,656 - - - 193,656 - Other receivables 31 114,233 - - - 114,233 Total financial assets 753,398 162,043 1,829 2,493 586,949 84
Deposits from banks 32 (18,055) (18,055) - - - - Deposit from customers 33 (507,431) (24,866) (1,714) (500) (480,351) (1) Other financial liabilities 35 (62,748) - - - (62,748) - Other borrowed funds 37 (78,135) (53,465) - - (24,670) - Total financial liabilities (666,369) (96,386) (1,714) (500) (567,769) (1)
Net on-balance sheet position 87,029 65,657 115 1,994 19,180 83
Total US Dollar Euro Pound Naira OthersN million N million N million N million N million N million
31 December 2013Cash and cash equivalents 18 53,141 6,720 3,020 2,079 41,164 158 Non-pledged assets 19 2,847 - - - 2,847 - Pledged assets 20 65,167 - - - 65,167 - Loans and advances to customers 22 210,118 75,640 - - 134,478 - Investment securities 24 290,377 - - - 290,377 - Other receivables 31 73,119 - - - 73,119 - Total financial assets 694,769 82,360 3,020 2,079 607,152 158
Deposits from banks 32 (3,200) (3,200) - - - - Deposit from customers 33 (479,957) (17,913) (297) (3,540) (458,206) (1) Other financial liabilities 35 (104,045) - - - (104,045) - Other borrowed funds 37 (45,280) (15,735) - - (29,545) - Total financial liabilities (632,481) (36,848) (297) (3,540) (591,796) (1)
Net on-balance sheet position 62,288 45,512 2,723 (1,461) 15,356 157
The Group’s exposure to foreign currency risk is largely concentrated in the US Dollar. Movement in exchange rate between the US Dollar and the Nigeria Naira affects reported earnings through revaluation gain or loss through increase or decrease in the revalued amounts of assets and liabilities denominated in foreign currency.
The Bank’s exposure to foreign currency risk is largely concentrated in the US Dollar. Movement in exchange rate between the US Dollar and the Nigeria Naira affects reported earnings through revaluation gain or loss through increase or decrease in the revalued amounts of assets and liabilities denominated in foreign currency.

Union Bank of Nigeria Plc and Subsidiary CompaniesConsolidated financial statements - 31 December 2014
Together with Directors' and Auditor's Reports
66
(e) Operational risk management
• • • • •
(f) Capital management
(i)(ii)
(iii)
(i)(ii)
(a)
(b)
To safeguard the Group’s ability to continue as a going concern so that it can continue to provide returns for shareholders and benefits forother stakeholders; and
Maintain a ratio of total regulatory capital to the risk-weighted asset at a minimum of 15%.
In addition, those individual banking subsidiaries or similar financial institutions not incorporated in Nigeria are 'directly regulated and supervised by their local banking supervisor, which may differ from country to country.
The Group’s regulatory capital as managed by its Financial Control and Treasury Units is divided into two tiers:
The Group has adopted the Basel II definition of Operational Risk as the risk of loss resulting from inadequate or failed internal processes, people,or from external events. This definition includes legal risk but excludes strategic and reputational Risk.
Our overall objective for managing Operational Risk in the Bank is to establish and maintain a sound system which adequately identifies,measures, assesses, monitors, reports, controls and reviews Operational Risks across the Bank.
Effective implementation of our Operational Risk Management program guarantees:A more risk awareness culture amongst staff;Better understanding of the Bank’s operational risk profile;
The CBN requires each international bank to:
Hold the minimum level of the regulatory capital of N25 billion, and
To maintain a strong capital base to support the development of its business.
Capital adequacy and the use of regulatory capital are monitored by the Group’s management, employing techniques based on the guidelinesdeveloped by the Central Bank of Nigeria (CBN), for supervisory purposes. The required information is filed with the CBN on a monthly basis.
The Group’s objectives when managing capital, which is a broader concept than the ‘equity’ on the face of the statement of financial position, are:
To comply with the capital requirements set by the regulators of the banking markets where the entities within the Group operate;
Significant reduction in operational losses, hence improved profitability;Improved processes and systems in the Bank; and
Tier 1 capital: share capital, retained earnings and reserves created by appropriations of retained earnings. The book value of goodwill andintangible assets is deducted in arriving at Tier 1 capital; and
Tier 2 capital: preference shares, non-controlling interests arising on consolidation, qualifying debt stock, fixed assets revaluation reserves,foreign currency revaluation reserves, general provisions subject to maximum of 1.25% of risk assets and hybrid instruments – convertiblebonds.
As directed by the CBN, the Bank crossed over to the Basel II capital measurement standard by October, 2014, replacing the Basel I CapitalAdequacy Ratio (CAR) computation with the Basel II Standardised Approach (Currently, CBN requires all deposit money banks in Nigeriato adopt the Standardised Approach for the computation of Capital Adequacy Ratio under Pillar 1)In line with the CBN guideline for the Standardised Approach, the Risk Weighted Assets (RWA) are derived using the CBN specified risk weigths (RW) for the different asset classes:- 0% for Exposures to Central Governments and Central Banks-100% for Exposures to Non‐Central Government Public Sector Entities- Exposures to State Governments and Local Authorities; 20% for State Government bonds that meet the CBN eligibility criteria for classification as liquid assets 100% for other State and Local Government bonds and exposures- State and Local Governments of other jurisdictions are assigned the Sovereign RW of those jurisdictions. 0% for Exposures to Multilateral Development Banks (MDBs)- Exposures to Supervised Institutions 20% for Short- term exposures to supervised institutions in Nigeria with an original maturity of three months or less 100% for long‐term exposures to supervised institutions in Nigeria with an original maturity of three months or less 100% for Exposures to Corporate and Other Persons 75% for Regulatory Retail Portfolio. However, to qualify, such exposures must meet the following criteria:
i) Orientation criterion – the exposure is to an individual person or persons or to a small business.ii) Product criterion - the exposure takes the form of any of the following: revolving credits and lines of credit (including credit cards andoverdrafts), personal term loans and other term loans (for example installment loans, auto financing loans, student and educational loans,personal finance) and small business facilities. Investment in debt and equity securities, whether listed or not, are excluded from thisportfolio. Mortgage loans are also excluded to the extent that they qualify for treatment as exposures secured by residential property. iii) l i i i h d f h ll l il f li
Improved business resilience, which would guarantee enhanced responses to business disruptions.

Union Bank of Nigeria Plc and Subsidiary CompaniesConsolidated financial statements - 31 December 2014
Together with Directors' and Auditor's Reports
67
Bank Note Dec. 2014 Dec. 2013N million N million
Tier 1 CapitalOrdinary share capital 8,468 8,468 Share premium 391,641 391,641 Retained deficit (251,172) (272,064) Statutory reserve 19,404 16,331 Other reserves 1,753 13,148
170,094 157,524 Less:Investment in subsidiaries (50%) 27 (4,186) (12,892)Investment in equity accounted investee (50%) 23 - (16)Deferred tax assets 30 (95,875) (95,875) Intangible assets 29 (2,071) (685) Total qualifying Tier 1 Capital 67,962 48,056
Tier 2 CapitalFair value reserves 27,213 30,260 Investment in subsidiaries (50%) (4,186) - Investment in equity accounted investee (50%) - - Collective allowances for impairment - 10,673 Total qualifying Tier 2 Capital 23,027 40,933
Total regulatory capital 90,989 88,989
Risk weighted assetsOn balance sheet and off balance sheet - 358,796 Risk-weighted Amount for Credit Risk 439,655 - Risk-weighted Amount for Operational Risk 105,550 - Risk-weighted Amount for Market Risk 9,992 - Total weighted risk assets 555,197 358,796
Risk weighted Capital Adequacy Ratio (CAR) 16.39% 24.80%
Regulatory risk reserves are excluded from capital adequacy ratio computation
Capital Adequacy RatioThe Basel II capital adequacy ratio was 16% for the Bank, as at 31 December 2014, which is above the CBN minimum capital adequacyrequirements of 15% as computed below. Basel II rule for computation of Capital Adequacy Ratio only came to force in the current year and hasbeen prospectively applied.
iii) Granularity criterion - the aggregate exposure to one counterpart cannot exceed 0.2% of the overall regulatory retail portfolio; iv) Low value of individual exposures - the aggregate retail exposure to one counterparty cannot exceed an absolute threshold of N100million.- 100% for Exposures secured by Mortgages on Residential Property. - 100% for Exposures secured by Mortgages on Commercial Real Estate. - Qualifying residential mortgage loans that are past due: i) 100% when specific provisions are less than 20% of the outstanding amount of the exposure; and ii) 50% when specific provisions are 20% or more of the outstanding amount of the exposure. - Other unsecured Past Due Exposures (excluding past due residential mortgages):i) 150% risk weight when specific provisions are less than 20% of the outstanding amount of the exposure; ii) 100% risk weight when specific provisions are no less than 20% of the outstanding amount of the exposure.Other Assets:i) Cash in hand and equivalent cash items shall be assigned a 0% risk weight. ii) Cheques and Cash items in transit shall be assigned a 20% risk weight.- 100% risk weight for the following: fixed assets; prepayments; investments in equity or regulatory capital instruments (unless deductedfrom capital); collective investment schemes; real estate; bank lending to subsidiaries in the same group (but to be deducted from capitalwhere loan is not fully secured).- Off-Balance Sheet Exposures are first converted to credit equivalent amount by multiplying the exposures by the related conversion factors(CCF). The Capital requirement is then derived by multiplying the credit equivalent by the risk weight of the counterparty.

Union Bank of Nigeria Plc and Subsidiary CompaniesConsolidated financial statements for the year ended 31 December 2014
Together with Directors' and Auditor's Reports
68
6 Use of estimates and judgements
(a)
(b)
(c)
For financial instruments that traded infrequently and have little price transparency, fair value is less objective, and requires varying degrees ofjudgement depending on liquidity, concentration, uncertainty of market factors, pricing assumptions and other risks affecting the specificinstrument.
Financial asset and liability classification
Assets accounted for at amortised cost are evaluated for impairment on a basis described in the accounting policy in note 3(j).
These disclosures supplement the commentary on financial risk management (see note 5).
Impairment
The preparation of the consolidated financial statements in conformity with IFRS requires management to make judgments, estimates andassumptions that affect the application of accounting policies and the reported amounts of assets, liabilities, income and expenses.
Estimates and underlying assumptions are reviewed on an ongoing basis. Revisions to accounting estimates are recognized in the period in whichthe estimates are revised and in any future periods affected.
Management discusses with the Group Audit Committee the development, selection and disclosure of the Group’s critical accounting policies and their application, and assumptions made relating to major estimation uncertainties. Information about assumptions and estimation uncertaintiesthat have a significant risk of resulting in a material adjustment within the next financial year and about critical judgments in applyingaccounting policies that have the most significant effect on the amounts recognized in the consolidated financial statements is disclosed below.
The specific counterparty component of the total allowances for impairment applies to claims evaluated individually for impairment and is basedupon management’s best estimate of the present value of the cash flows that are expected to be received. In estimating these cash flows,management makes judgements about a counter party’s financial situation and the net realisable value of any underlying collateral. Each impairedasset is assessed on its merits, and the workout strategy and estimate of cash flows considered recoverable are independently reviewed by theCredit Risk function.
Collectively assessed impairment allowances cover credit losses inherent in portfolios of loans and advances and held to maturity investmentsecurities with similar economic characteristics when there is objective evidence to suggest that they contain impaired loans and advances andheld to maturity investment securities, but the individual impaired items cannot yet be identified. A component of collectively assessedallowances is for country risks. In assessing the need for collective loan loss allowances, management considers factors such as credit quality,portfolio size, concentrations, and economic factors. In order to estimate the required allowance, assumptions are made to define the way inherentlosses are modelled and to determine the required input parameters, based on historical experience and current economic conditions. Theaccuracy of the allowances depends on how well future cash flows for specific counterparty allowances and the model assumptions andparameters used in determining collective allowances are estimated.
Investments in equity securities were evaluated for impairment on the basis described in note 3(j). For an investment in an equity security, asignificant or prolonged decline in its fair value below its cost was objective evidence of impairment. In this respect, the Group regarded a declinein fair value in excess of 20 percent to be significant and a decline in a quoted market price that persisted for nine months or longer to beprolonged.
The Group’s accounting policies provide scope for assets and liabilities to be designated on inception into different accounting categories incertain circumstances:
Determining fair valuesThe fair value of financial assets and liabilities that are traded in active markets are based on quoted market prices or dealer price quotations. Forall other financial instruments, the Group determines fair values using other valuation techniques.
Actual results may differ from these estimates.
In classifying financial assets or liabilities as “trading”, the Group has determined that it meets the description of trading assets andliabilities set out in the accounting policy in note 3(j). In designating financial assets or liabilities as available for sale, the Group has determined that it has met one of the criteria for thisdesignation set out in the accounting policy in 3(j).In classifying financial assets as held-to-maturity, the Group has determined that it has both the positive intention and ability to hold theassets until their maturity date as required by the accounting policy in note 3(j).
Details of the Group’s classification of financial assets and liabilities are given in note 7.
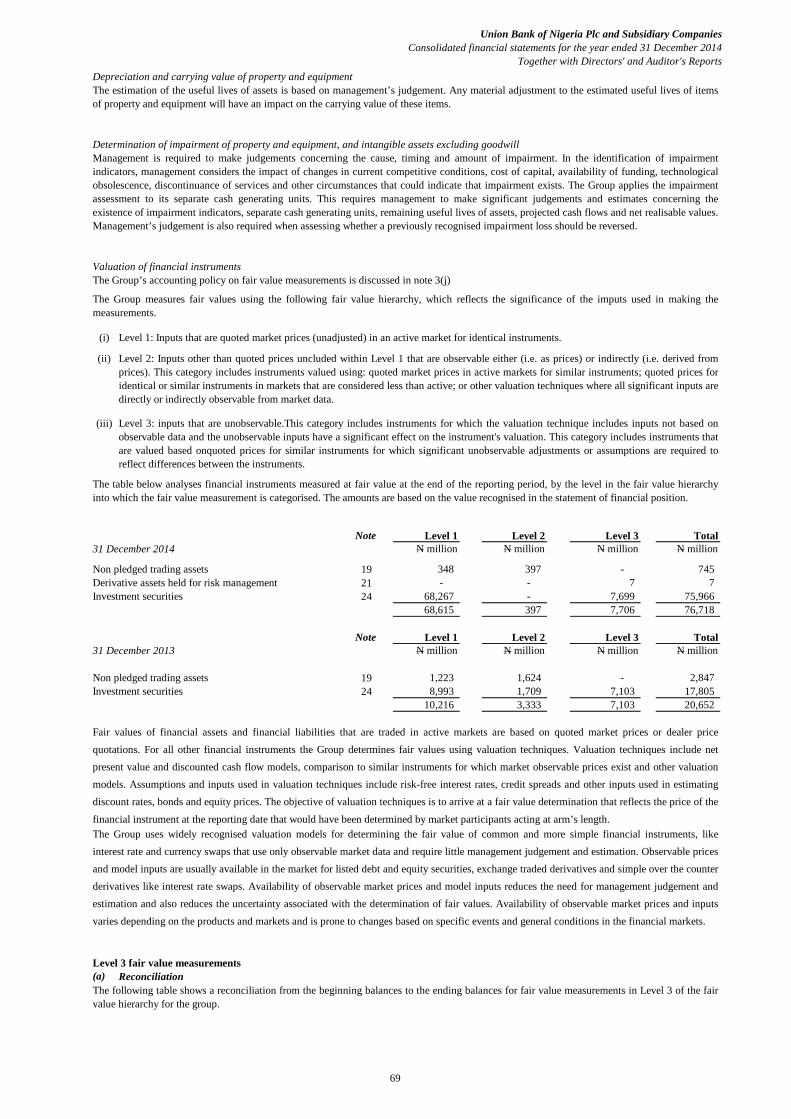
Union Bank of Nigeria Plc and Subsidiary CompaniesConsolidated financial statements for the year ended 31 December 2014
Together with Directors' and Auditor's Reports
69
(i)
(ii)
(iii)
Note Level 1 Level 2 Level 3 Total31 December 2014 N million N million N million N million
Non pledged trading assets 19 348 397 - 745 Derivative assets held for risk management 21 - - 7 7 Investment securities 24 68,267 - 7,699 75,966
68,615 397 7,706 76,718
Note Level 1 Level 2 Level 3 Total31 December 2013 N million N million N million N million
Non pledged trading assets 19 1,223 1,624 - 2,847 Investment securities 24 8,993 1,709 7,103 17,805
10,216 3,333 7,103 20,652
(a)Level 3 fair value measurements
The following table shows a reconciliation from the beginning balances to the ending balances for fair value measurements in Level 3 of the fairvalue hierarchy for the group.
Reconciliation
Determination of impairment of property and equipment, and intangible assets excluding goodwillManagement is required to make judgements concerning the cause, timing and amount of impairment. In the identification of impairmentindicators, management considers the impact of changes in current competitive conditions, cost of capital, availability of funding, technologicalobsolescence, discontinuance of services and other circumstances that could indicate that impairment exists. The Group applies the impairmentassessment to its separate cash generating units. This requires management to make significant judgements and estimates concerning theexistence of impairment indicators, separate cash generating units, remaining useful lives of assets, projected cash flows and net realisable values.Management’s judgement is also required when assessing whether a previously recognised impairment loss should be reversed.
The Group uses widely recognised valuation models for determining the fair value of common and more simple financial instruments, likeinterest rate and currency swaps that use only observable market data and require little management judgement and estimation. Observable pricesand model inputs are usually available in the market for listed debt and equity securities, exchange traded derivatives and simple over the counterderivatives like interest rate swaps. Availability of observable market prices and model inputs reduces the need for management judgement andestimation and also reduces the uncertainty associated with the determination of fair values. Availability of observable market prices and inputsvaries depending on the products and markets and is prone to changes based on specific events and general conditions in the financial markets.
The table below analyses financial instruments measured at fair value at the end of the reporting period, by the level in the fair value hierarchyinto which the fair value measurement is categorised. The amounts are based on the value recognised in the statement of financial position.
The Group measures fair values using the following fair value hierarchy, which reflects the significance of the imputs used in making themeasurements.
Fair values of financial assets and financial liabilities that are traded in active markets are based on quoted market prices or dealer pricequotations. For all other financial instruments the Group determines fair values using valuation techniques. Valuation techniques include netpresent value and discounted cash flow models, comparison to similar instruments for which market observable prices exist and other valuationmodels. Assumptions and inputs used in valuation techniques include risk-free interest rates, credit spreads and other inputs used in estimatingdiscount rates, bonds and equity prices. The objective of valuation techniques is to arrive at a fair value determination that reflects the price of thefinancial instrument at the reporting date that would have been determined by market participants acting at arm’s length.
Level 1: Inputs that are quoted market prices (unadjusted) in an active market for identical instruments.
Level 2: Inputs other than quoted prices uncluded within Level 1 that are observable either (i.e. as prices) or indirectly (i.e. derived fromprices). This category includes instruments valued using: quoted market prices in active markets for similar instruments; quoted prices foridentical or similar instruments in markets that are considered less than active; or other valuation techniques where all significant inputs aredirectly or indirectly observable from market data.
Level 3: inputs that are unobservable.This category includes instruments for which the valuation technique includes inputs not based onobservable data and the unobservable inputs have a significant effect on the instrument's valuation. This category includes instruments thatare valued based onquoted prices for similar instruments for which significant unobservable adjustments or assumptions are required toreflect differences between the instruments.
Valuation of financial instruments
The estimation of the useful lives of assets is based on management’s judgement. Any material adjustment to the estimated useful lives of itemsof property and equipment will have an impact on the carrying value of these items.
Depreciation and carrying value of property and equipment
The Group’s accounting policy on fair value measurements is discussed in note 3(j)

Union Bank of Nigeria Plc and Subsidiary CompaniesConsolidated financial statements for the year ended 31 December 2014
Together with Directors' and Auditor's Reports
70
Investment Securities
Derivative Assets
Total
Balance at 1 January 2014 7,103 - 7,103 596 - 596 - 7 7 7,699 7 7,706
Note Level 1 Level 2 Level 3 Total31 December 2014 N million N million N million N millionAssetsCash and Cash equivalent 18 - 58,457 - 58,457 Pledget assets 20 - 55,553 - 55,553 Loans and advances to customers 22 - 284,413 - 284,413 Investment securities 24 - 93,724 - 93,724 Other receivables 31 - 113,376 - 113,376
- 605,523 - 605,523 LiabilitiesDeposits from banks 32 - 18,055 - 18,055 Deposits from customers 33 - 507,431 - 507,431 Other financial liabilities 35 - 62,748 - 62,748 Other borrowed funds 37 - 78,135 - 78,135
- 666,369 - 666,369
Note Level 1 Level 2 Level 3 Total31 December 2013 N million N million N million N millionAssetsCash and Cash equivalent 18 - 53,141 - 53,141 Pledget assets 20 - 57,169 - 57,169 Loans and advances to customers 22 - 186,118 - 186,118 Investment securities 24 - 269,356 - 269,356 Other receivables 31 - 72,971 - 72,971
- 638,755 - 638,755 LiabilitiesDeposits from banks 32 - 3,200 - 3,200 Deposits from customers 33 - 479,956 - 479,956 Other financial liabilities 35 - 104,045 - 104,045 Other borrowed funds 37 - 45,280 - 45,280
- 632,481 - 632,481
Total gains recognised in OCI
Balance at 31 December 2014Purchases
31 December 2014In millions of naira
Financial instruments not measured at fair valueThe following table sets out the fair values of financial instruments not measured at fair value and analyses them by the level in the fair value hierarchy into which each fair value measurement is categorised.

Union Bank of Nigeria Plc and Subsidiary CompaniesConsolidated financial statements for the year ended 31 December 2013
Together with Directors' and Auditor's Reports
71
7 Operating segments
(a) By business segment
Retail banking
Corporate banking
Treasury and investment banking
Asset management
31 December 2014Retail
bankingCommercial
bankingCorporate
banking
Treasury and investment
banking TotalN million N million N million N million N million
Revenue:Derived from external customers 5,605 21,479 25,367 67,211 119,663 Derived from other business segments 33,549 2,762 (8,476) (27,835) - Total Revenue 39,154 24,241 16,891 39,377 119,663
Interest expenses (13,951) (2,641) (961) (6,764) (24,317)
(Loss)/profit before income tax 1,076 6,287 6,923 12,684 26,971
Income tax expense (409)Profit after tax 26,562
Assets and liabilities:Reportable segment assets 108,486 219,487 282,946 396,258 1,007,176 Reportable segment liabilities (321,426) (155,746) (66,517) (243,198) (786,887) Net Assets/(Liabilities) (212,940) 63,741 216,429 153,060 220,289
31 December 2013
Revenue:Derived from external customers 29,683 17,318 58,474 105,475 Derived from other business segments 33,702 6,567 (40,269) - Total Revenue 63,385 23,885 18,205 105,475
Interest expenses (12,921) (2,704) (7,951) (23,576)
(Loss)/profit before income tax 2,579 1,783 778 5,329
Income tax expense 933 Profit after tax 6,262
Assets and liabilities:Reportable segment assets 241,319 280,404 481,033 1,002,756 Reportable segment liabilities (465,327) (193,051) (145,035) (803,413) Net Assets/(Liabilities) (224,008) 87,353 335,998 199,343
Segment information is presented in respect of the Bank’s business segments which represents the primary segment reporting format and is based onthe Bank’s management and reporting structure.
The Banking Group is divided into four main business segments on a worldwide basis:
Retail banking incorporates private banking services, private customer current accounts, deposits, investment savings products, custody, creditand debit cards, consumer loans and mortgages.
Corporate banking incorporates direct debit facilities, current accounts, deposits, overdrafts, loan and other credit facilities and foreign currencyproducts.
Treasury and investment banking incorporates financial instruments trading, structured financing, corporate leasing and advisory service.
Asset management which involves the provision of financial intermediation services to its corporate and individual customers comprises of trustservices, granting of loans and advnaces, equipment leasing, LPO financing, loan syndication, fixed tenured borrowings and insurance brokerage.

Union Bank of Nigeria Plc and Subsidiary CompaniesConsolidated financial statements for the year ended 31 December 2013
Together with Directors' and Auditor's Reports
72
(b) By geographical location
(i) Nigeria(ii) Europe
Segment report by geographical location:Nigeria Europe Total
31 December 2014 N million N million N million
Derived from external customers 117,599 2,070 119,669 Derived from other segments - - - Total revenues 117,599 2,070 119,669 Interest and similar expenses (24,135) (182) (24,317) Operating income 93,463 1,889 95,352 Share of profit of equity accounted investee (6) - (6)
93,457 1,889 95,346 Operating expenses (57,175) (1,549) (58,724) Net impairment loss on financial assets (9,682) 31 (9,651) (Loss)/profit before taxation 26,600 371 26,971 Income tax expense (355) (54) (409) (Loss)/profit after taxation 26,245 317 26,562
Nigeria Europe TotalN million N million N million
Assets and liabilities:Total assets 928,893 80,265 1,009,157 Total liabilities (796,212) 9,289 (786,923) Net assets 132,681 89,554 222,234
Nigeria Europe Total31 December 2013 N million N million N million
Derived from external customers 103,436 2,043 105,479 Derived from other segments - - - Total revenues 103,436 2,043 105,479 Interest and similar expenses (23,354) (222) (23,576) Operating income 80,082 1,821 81,903 Share of profit of equity accounted investee (4) - (4)
80,078 1,821 81,899 Operating expenses (58,420) (1,536) (59,956) Net impairment loss on financial assets (15,374) (362) (15,736) (Loss)/profit before taxation 6,284 (77) 6,207 Income tax expense 914 19 933 (Loss)/profit after taxation 7,198 (58) 7,140
Assets and liabilities:Total assets 921,937 80,819 1,002,756 Total liabilities (734,236) (69,177) (803,413) Net assets 187,701 11,642 199,343
Transactions between the business segments are on normal commercial terms and conditions.
Funds are ordinarily allocated between segments, resulting in funding cost transfers disclosed in operating income. Interest charged on thesefunds is based on the Group's cost of capital. There are no other material items of income or expense between the business segments.
The Group's business is organized along two (2) main geographical areas:
Internal charges and transfer pricing adjustments have been reflected in the performance of each segment. Revenue sharing agreements are usedto allocate external customer revenues to a segment on a reasonable basis.

Union Bank of Nigeria Plc and Subsidiary CompaniesConsolidated financial statements for the year ended 31 December 2013
Together with Directors' and Auditor's Reports
73
8 Financial assets and liabilitiesAccounting classification, measurement basis and fair values
Group NoteAt fair value through P/L
Held - to- maturity
Loans and receivables at
amortised cost Available -
for sale
Other financial liabilities
Total carrying amount Fair value
31 December 2014 N million N million N million N million N million N million N million
Cash and cash equivalents 18 - - 121,960 - - 121,960 121,960 Non pledged trading assets 19 745 - - - - 745 745 Pledged assets 20 - 83,935 - - - 83,935 55,553 Derivative assets held for risk management 21 7 - - - - 7 7 Loans and advances to customers 22 - - 312,797 - - 312,797 294,838 Investment securities 24 117,690 79,510 - 197,200 173,234 Other receivables 31 113,376 113,376 113,376
752 201,625 548,133 79,510 - 830,020 759,713
Derivative liabilites held for risk management 21 7 - - - - 7 7 Deposits from banks 32 - - - - 61,890 61,890 61,890 Deposits from customers 33 - - - - 527,617 527,617 527,617 Other financial liabilities 35 - - - - 62,748 62,748 62,748 Interest bearing loans and borrowings 37 - - - - 78,135 78,135 78,135
- - - - 730,390 730,390 730,390
31 December 2013-
Cash and cash equivalents 18 - - 100,925 - - 100,925 100,925 Non pledged trading assets 19 2,847 - - - - 2,847 2,847 Pledged assets 20 - 65,167 - - - - 57,169 Derivative assets held for risk management 21 - - - - - - - Loans and advances to customers 22 - - 229,542 - - 229,542 201,248 Investment securities 24 - 272,572 - 16,781 - 289,353 286,137 Other receivables 31 72,971 72,971 72,971
2,847 337,739 403,438 16,781 - 695,638 721,297
Derivative liabilites held for risk management 21 - - - - - - - Deposits from banks 32 - - - - 46,794 46,794 46,794 Deposits from customers 33 - - - - 482,706 482,706 482,706 Other financial liabilities 35 - - - - 104,394 104,394 104,394 Interest bearing loans and borrowings 37 - - - - 45,280 45,280 45,280
- - - - 679,174 679,174 679,174
The table below sets out the Group’s and Bank's classification of each class of financial assets and liabilities, and their fair values (excluding accrued interest).

Union Bank of Nigeria Plc and Subsidiary CompaniesConsolidated financial statements for the year ended 31 December 2013
Together with Directors' and Auditor's Reports
74
Bank NoteAt fair value through P/L
Held - to- maturity
Loans and receivables at
amortised cost Available -
for sale
Other financial liabilities
Total carrying amount Fair value
31 December 2014 N million N million N million N million N million N million N million
Cash and cash equivalents 18 - - 58,457 - - 58,457 58,457 Non pledged trading assets 19 745 - - - - 745 745 Pledged assets 20 - 83,935 - - - 83,935 55,553 Loans and advances to customers 22 - - 302,372 - - 302,372 284,413 Investment securities 24 - 117,690 - 75,966 - 193,656 169,690 Other receivables 31 113,376 113,376 113,376
745 201,625 474,205 75,966 - 752,541 682,234
Deposits from banks 32 - - - - 18,055 18,055 18,055 Deposits from customers 33 - - - - 507,431 507,431 507,431 Other financial liabilities 35 - - - - 62,748 62,748 62,748 Interest bearing loans and borrowings 37 - - - - 78,135 78,135 78,135
- - - - 666,369 666,369 666,369
31 December 2013
Cash and cash equivalents 18 - - 53,141 - - 53,141 53,141 Non pledged trading assets 19 2,847 - - - - 2,847 2,847 Pledged assets 20 - 65,167 - - - 65,167 57,169 Loans and advances to customers 22 - - 210,118 - - 210,118 186,118 Investment securities 24 - 272,572 - 17,805 - 290,377 287,161 Other receivables 31 72,971 72,971 72,971
2,847 337,739 336,230 17,805 - 694,621 659,407
Deposits from banks 32 - - - - 3,200 3,200 3,200 Deposits from customers 33 - - - - 479,956 479,956 479,956 Other financial liabilities 35 - - - - 104,045 104,045 104,045 Interest bearing loans and borrowings 37 - - - - 45,280 45,280 45,280
- - - - 632,481 632,481 632,481
Investment securities - unquoted equity securities at costThe above table includes N9, 868million for the Group and also the Bank (December 2013: N11,986 million (Group) and N11,186 million (Bank)) of available for sale investmentsecurities in both the carrying amount and fair value columns that are measured at cost and for which disclosure of fair value is not provided because their fair value cannot be reliably measured.

Union Bank of Nigeria Plc and Subsidiary CompaniesConsolidated financial statements for the period ended 31 December 2014
75
9 Net interest incomeGroup Group Bank Bank
Dec.2014 Dec.2013 Dec.2014 Dec.2013N million N million N million N million
Interest incomeCash and cash equivalents 1,069 6,933 1,069 6,366 Loans and advances to customers 39,334 31,230 38,118 30,223 Investment securities 35,789 42,706 35,676 42,456 Total interest income 76,192 80,869 74,863 79,045
Interest expenseDeposits from customers 17,481 16,874 17,401 17,344 Other borrowed funds 6,836 6,574 6,836 6,574 Total interest expense 24,317 23,576 24,237 23,918
Net interest income 51,875 57,293 50,626 55,127
10 Net Fee and commission incomeGroup Group Bank Bank
Dec.2014 Dec.2013 Dec.2014 Dec.2013N million N million N million N million
Retail banking customer fees & commissions 3,813 3,520 3,813 3,520 1,445 732 1,445 442
Commission on turnover (COT) 2,260 3,224 2,260 3,224 Commission on off balance sheet transactions 1,639 1,399 1,639 1,399 Other fees and commissions 415 204 11 92
9,572 9,079 9,168 8,677
(a)
11 Net trading income/(loss)Group Group Bank Bank
Dec.2014 Dec.2013 Dec.2014 Dec.2013N million N million N million N million
Fixed income securities 34 (808) 34 (808) Equities - (2) - - Foreign exchange trading gain 2,120 507 2,035 431
2,154 (303) 2,069 (377)
12 Other operating incomeGroup Group Bank Bank
Dec.2014 Dec.2013 Dec.2014 Dec.2013N million N million N million N million
Dividends on available-for-sale equity securities 408 2,551 2,015 5,670 Gains on disposal of trading property - 759 - 761
27 - - - Gain on disposal of investments - 828 - 1,374 Gain on disposal of subsidiaries (see (a) below) 15,689 - 6,315 - Foreign exchange revaluation gain 3,575 1,060 3,575 1,060 Rental income 406 610 406 224 Provisions for liabilities no longer required (see (b) below) 8,166 - 8,166 - Sundry income 3,480 7,785 3,244 6,791
31,751 13,593 23,721 15,880
(a)Group Group Bank Bank
Dec.2014 Dec.2013 Dec.2014 Dec.2013N million N million N million N million
Union Registrars Limited 4,149 - 5,807 - Union Assurance Coy Ltd 877 - 400 - Union Homes Savings Loans 10,688 - - - Union Capital Markets Ltd (143) - (10) - Union Insurance Brokers 118 - 118 -
15,689 - 6,315 -
Interest expense on financial liabilities not measured at fair value through profit or loss amounted to N24,317 million (Group) and N24,237 million (Bank) for the yearended 31 December 2014 (31 December 2013: N23,576 million (Group); N23,918 million (Bank))
Corporate banking credit related fees & commissions (See note (a) )
Interest income for the year ended 31 December 2014 for the Group includes N2.63 billion (2013: N1.45 billion) accrued income on impaired financial assets and the assetshave been specifically tested for impairment.
Credit related fees and commissions relate to fees charged to corporate customers other than fees included in determining the effective interest rates relating to loans andadvances carried at amortised cost.
Net trading (loss)/income includes the gains and losses arising both on the purchase and sale of trading instruments and from changes in fair value.
The Gain/(loss) on disposal of subsidiaries is as analysed below:
Revaluation gain on 'fair value through profit or loss

Union Bank of Nigeria Plc and Subsidiary CompaniesConsolidated financial statements for the period ended 31 December 2014
76
Union Registrars Limited
Union Assurance Coy Ltd
Union Homes Savings Loans
Union Capital Markets Ltd
Union Insurance Brokers
N million N million N million N million N millionProceeds on disposal 6,000 1,923 - 806 119 Net Assets (2,198) (2,027) 16,425 (939) - Non Controlling Interest 391 1,006 (5,210) - - Fair value reserves 34 49 (527) - - Cost incurred on disposal (79) (75) - (11) (2)
4,149 877 10,688 (143) 118
Union Registrars Limited
Union Assurance Coy Ltd
Union Homes Savings Loans
Union Capital Markets Ltd
Union Insurance Brokers
N million N million N million N million N millionProceeds on disposal 6,000 1,923 - 806 119 Cost of investment (114) (1,449) - (806) - Cost incurred on disposal (79) (75) - (11) (2)
5,807 400 - (10) 118
(b)
13 Net Impairment loss on financial assets(a) Net impairment charge for credit losses
Group Group Bank BankDec.2014 Dec.2013 Dec.2014 Dec.2013N million N million N million N million
Net impairment charge for credit losses:-specific impairment (see note 22 below) 6,271 11,172 4,750 12,361 -portfolio impairment (see note 22 below) 2,028 2,836 2,028 2,836
Total impairment charge on loans and advances 8,299 14,008 6,778 15,197 Recoveries on loans and advances (see note 22 below) (3,471) (1,942) (3,471) (1,942)
4,828 12,066 3,307 13,255
(b) Net impairment loss on other financial assets:Reversal of impairment on cash and short termfunds - (201) - (201) (Reversal of impairment)/impairment loss on investment - - - - securities (see note 24) - (49) - 410 Impairment loss on other investments - 75 - 1,111 Impairment loss on other assets (see note 31(ii)) 5,222 3,845 4,763 3,845 Allowance no longer required on other assets (see note 31(ii)) (399) - (399) -
4,823 3,670 4,364 5,165
Total net impairment loss on financial assets 9,651 15,736 7,671 18,420
14 Personnel expensesGroup Group Bank Bank
Dec.2014 Dec.2013 Dec.2014 Dec.2013N million N million N million N million
Wages and salaries 27,637 28,721 26,655 27,696 Contributions to defined contribution plans (See note 36 (a) ) 702 1,613 702 1,613 Increase/(decrease) in liability for defined benefit plans (120) 1,410 (120) 1,410 Terminal benefits 1,517 7,800 1,517 7,800
29,736 39,544 28,754 38,519
The gain or loss on disposal of subsidiaries for the Bank at 31 December 2014 is arrived at as shown below:
The gain or loss on disposal of subsidiaries for the Group at 31 December 2014 is arrived at as shown below:
The amount relates to liabilities no longer required after a review of balances in other liabilities was carried out during the year; the review revealed that the total sum ofN8,166 million was no longer required.
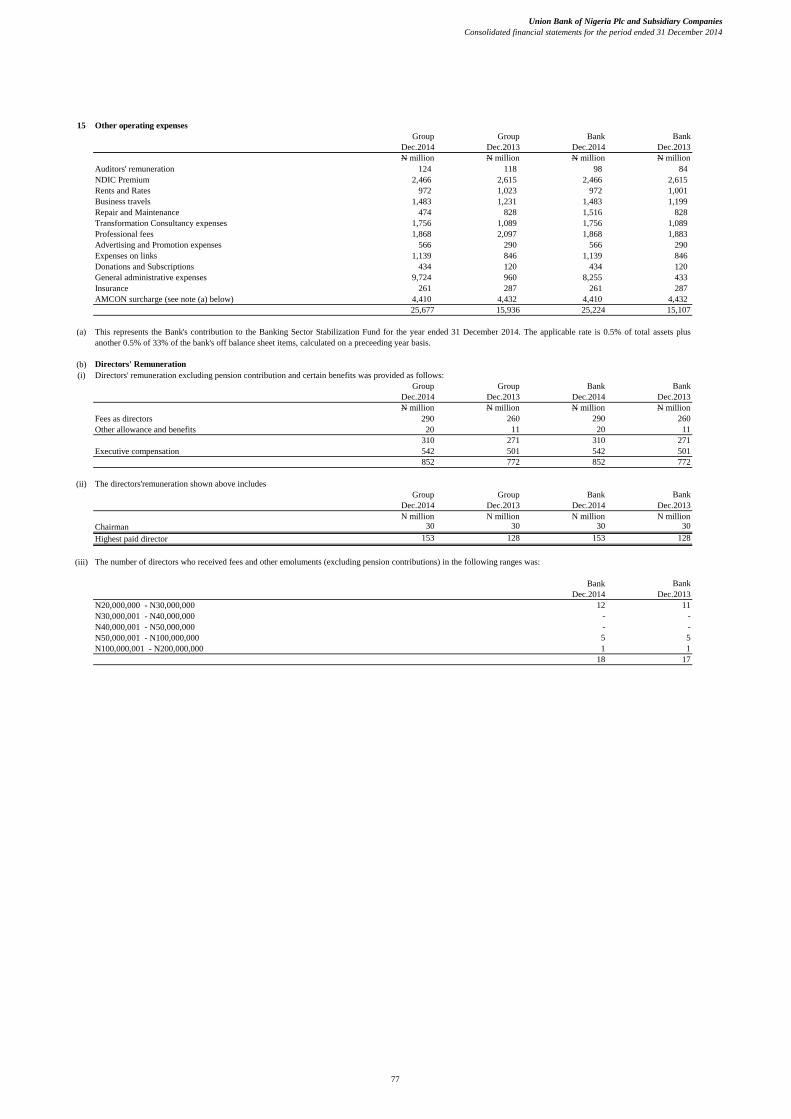
Union Bank of Nigeria Plc and Subsidiary CompaniesConsolidated financial statements for the period ended 31 December 2014
77
15 Other operating expensesGroup Group Bank Bank
Dec.2014 Dec.2013 Dec.2014 Dec.2013N million N million N million N million
Auditors' remuneration 124 118 98 84 NDIC Premium 2,466 2,615 2,466 2,615 Rents and Rates 972 1,023 972 1,001 Business travels 1,483 1,231 1,483 1,199 Repair and Maintenance 474 828 1,516 828 Transformation Consultancy expenses 1,756 1,089 1,756 1,089 Professional fees 1,868 2,097 1,868 1,883 Advertising and Promotion expenses 566 290 566 290 Expenses on links 1,139 846 1,139 846 Donations and Subscriptions 434 120 434 120 General administrative expenses 9,724 960 8,255 433 Insurance 261 287 261 287 AMCON surcharge (see note (a) below) 4,410 4,432 4,410 4,432
25,677 15,936 25,224 15,107
(a)
(b) Directors' Remuneration(i) Directors' remuneration excluding pension contribution and certain benefits was provided as follows:
Group Group Bank BankDec.2014 Dec.2013 Dec.2014 Dec.2013N million N million N million N million
Fees as directors 290 260 290 260 Other allowance and benefits 20 11 20 11
310 271 310 271 Executive compensation 542 501 542 501
852 772 852 772
(ii) The directors'remuneration shown above includesGroup Group Bank Bank
Dec.2014 Dec.2013 Dec.2014 Dec.2013N million N million N million N million
Chairman 30 30 30 30 Highest paid director 153 128 153 128
(iii)
Bank BankDec.2014 Dec.2013
N20,000,000 - N30,000,000 12 11 N30,000,001 - N40,000,000 - - N40,000,001 - N50,000,000 - - N50,000,001 - N100,000,000 5 5 N100,000,001 - N200,000,000 1 1
18 17
This represents the Bank's contribution to the Banking Sector Stabilization Fund for the year ended 31 December 2014. The applicable rate is 0.5% of total assets plusanother 0.5% of 33% of the bank's off balance sheet items, calculated on a preceeding year basis.
The number of directors who received fees and other emoluments (excluding pension contributions) in the following ranges was:

Union Bank of Nigeria Plc and Subsidiary CompaniesConsolidated financial statements for the year ended 31 December 2014
Together with Directors' and Auditor's Reports
78
16 Income tax expense from continuing operation
(a) Recognised in the profit or lossGroup Group Bank Bank
Dec. 2014 Dec.2013 Dec. 2014 Dec.2013N million N million N million N million
Current tax expenseCompany Income Tax 204 (22) - - Education tax - - - - NITDA Levy 205 57 205 57 Prior year over provision - (978) - (977)
409 (943) 205 (920)Deferred tax expense Origination and reversal of temporary differences - 10 - -
Total income tax expense 409 (933) 205 (920)
(b) Reconciliation of effective tax rateGroup Group Group Group Bank Bank Bank Bank
Dec. 2014 Dec. 2014 Dec.2013 Dec.2013 Dec. 2014 Dec. 2014 Dec.2013 Dec.2013N million N million N million N million
Profit/(loss) before income tax 26,971 5,329 20,691 4,201 Income tax using the domestic corporation tax rate 30% 8,091 30% 1,599 30% 6,207 30% 1,260 Income tax based on minimum tax computation 0% - 0% - 0% - 0% - Effect of tax rates in foreign jurisdictions 0% 19 0% 19 0% - 0% - Education tax levy 0% - 0% - 0% - 0% - Capital gains tax 0% - 0% - 0% - 0% - NITDA levy 1% 205 1% 57 1% 205 1% 57 Tax losses (utilised)/unutilised -29% (7,906) -30% (1,573) -30% (6,207) -30% (1,260) Change to estimates for prior years 0% - -18% (978) 0% - -23% (977) Total income tax expense in compre 2% 409 -17% (933) 1% 205 -22% (920)
The effective income tax rate for 31 December 2014 is 2% (December 2013:19%)
17 Earnings per share
(a) Basic earnings per share
Weighted average number of ordinary shares
Group Group Bank BankDec. 2014 Dec.2013 Dec. 2014 Dec.2013
Issued ordinary shares at beginning of the year 16,936 16,936 16,936 16,936 Weighted effect of shares issued during the year 16,936 16,936 16,936 16,936
(b) Profit attributable to ordinary shareholdersIn millions of Nigerian Naira Group Group Bank Bank
Dec. 2014 Dec.2013 Dec. 2014 Dec.2013
Profit/(Loss) for the year attributable to equity holders 25,627 6,276 20,486 5,121 Basic earnings/(loss) per share (in kobo) 151 37 121 30 Profit from continuing operations attributable to equity holders of bank 26,562 6,262 20,486 5,121
Basic earnings/(loss) per share (in kobo) 157 37 121 30
(c) Diluted earnings per shareThe Group does not have any dilutive potential ordinary shares, therefore, Basic EPS and Diluted EPS are the same for the Group.
Earnings/(loss) per share has been computed based on profit after taxation attributable to the Group ordinary shareholders and the weighted average number of shares in issue during the year is as follows.
In line with the Company Income Tax Act, 1990, as amended, the Bank is not liable to pay income tax as the Bank recorded a tax loss for the year. The Bank isexempted from paying minimum tax under the Act, as it has imported share capital of over 25%. No education tax was charged because the Bank has no assessableprofit for the year.

Union Bank of Nigeria Plc and Subsidiary CompaniesConsolidated financial statements for the year ended 31 December 2014
Together with Directors' and Auditor's Reports
79
18 Cash and cash equivalents Group Group Bank BankDec. 2014 Dec.2013 Dec. 2014 Dec.2013
N million N million N million N million
Cash and balances with banks 52,661 27,288 42,051 26,070 Unrestricted balances with central bank 8,904 27,071 8,904 27,071 Money market placements 60,395 46,566 7,502 -
121,960 100,925 58,457 53,141
19 Non-pledged Assets (Held for trading)Group Group Bank Bank
Dec. 2014 Dec.2013 Dec. 2014 Dec.2013N million N million N million N million
Government bonds 348 1,223 348 1,223 Treasury bills 397 1,624 397 1,624
745 2,847 745 2,847
20 Pledged assetsFinancial assets that may be repledged or resold by counterparties
Group Group Bank BankDec. 2014 Dec.2013 Dec. 2014 Dec.2013N million N million N million N million
Treasury bills 17,034 3,208 17,034 3,208 Bonds 62,206 61,919 62,206 61,919 Placement 4,695 40 4,695 40
83,935 65,167 83,935 65,167
21 Derivative financial instrumentsGroup
Assets Liabilities Assets Liabilities N million N million N million N million
Instrument Type:Foreign exchange 7 7 - -
7 7 - -
22 Loans and advances to customers at amortised costGroup Group Bank Bank
Dec. 2014 Dec.2013 Dec. 2014 Dec.2013N million N million N million N million
(a) Gross amount 336,392 249,148 325,748 230,720
Specific impairment (9,931) (8,897) (9,753) (9,929)Portfolio impairment (13,664) (10,709) (13,623) (10,673)
Total impairment (23,595) (19,606) (23,376) (20,602)
Carrying amount 312,797 229,542 302,372 210,118
At 31 December 2014, N153,381 million (2013: N71,142million) of the Group's loan and advances to customers are expected to be recovered more than 12 months after the reporting date.
Financial assets are pledged as collateral as part of securities borrowing under terms that are usual and customary for such activities.
The Group uses derivatives not designated in a qualifying hedge relationship, to manage its exposure to foreign currency risks. Theinstruments used include forward contracts and cross currency linked forward contracts.
Dec. 2014 Dec.2013

Union Bank of Nigeria Plc and Subsidiary CompaniesConsolidated financial statements for the year ended 31 December 2014
Together with Directors' and Auditor's Reports
80
(b) Impairment allowance on loans and advances to customers
Group Group Bank BankDec. 2014 Dec.2013 Dec. 2014 Dec.2013N million N million N million N million
Specific impairment
Balance, beginning of the year 8,897 22,779 9,929 3,970
Impairment loss for the year:- Charge for the year (See note 13(a)) 6,271 11,172 4,750 12,361 - Recoveries (See note 13(a)) (3,471) (1,942) (3,471) (1,942)
Net impairment for the year/year 2,800 9,230 1,279 10,419 Effect of foreign currency movements (310) 3 - - Provision re-instated during the year 7,549 - 7,549 - Write-offs (9,004) (4,460) (9,004) (4,460) Impairment transferred to discontinued operations - (18,655) - - Balance, end of year 9,932 8,897 9,753 9,929
Portfolio impairment
Balance, beginning of the year 10,709 8,346 10,673 7,838
Impairment credit/loss for the year: 2,028 2,836 2,028 2,836 Net impairment for the year/year 2,028 2,836 2,028 2,836 Effect of foreign currency movements 4 - - - Reclassifications 923 - 922 - Impairment transferred to discontinued operations - (473) - - Balance, end of the year 13,664 10,709 13,623 10,673
(c) Included in loans and advances are finance leases as analysed below:
Gross Finance LeaseGroup Group Bank Bank
Dec. 2014 Dec.2013 Dec. 2014 Dec.2013N million N million N million N million
Receivable within 1 year 388 425 388 425 Receivable after 1 year but within 5 years 3,909 3,305 3,909 3,305
4,297 3,730 4,297 3,730
Specific impairment on finance lease (132) (394) (132) (394) Collective impairment on finance lease (217) (233) (217) (233)
Net finance lease 3,948 3,103 3,948 3,103

Union Bank of Nigeria Plc and Subsidiary CompaniesConsolidated financial statements for the year ended 31 December 2014
Together with Directors' and Auditor's Reports
81
23 Investment in equity accounted investeeGroup Group Bank Bank
Dec. 2014 Dec.2013 Dec. 2014 Dec.2013N million N million N million N million
CostBalance, beginning of the year 100 15,242 91 91 Prior year adjustments - (9,685) - - Balance, beginning of the year 100 5,557 91 91 Share of current year result (6) (4) - - Assets classified as discontinued operations - (5,453) - - Disposal of subsidiaries 21 - - -
115 100 91 91
(Impairments) /increase in value (91) (75) (91) (75) Balance, end of the year 24 25 - 16
31 December 2014 Reporting date Total assets Total liabilitiesNet liabilities Profit/(loss)
Group share of profit/ (loss)
Group share of net
liabilities
Unique Venture Capital Management Limited 31 December 175 (190) (15) (16) (6) (5)
175 (190) (15) (16) (6) (5)
31 December 2013 Reporting date Total assets Total liabilities Net assets Profit/(loss)Group share of
profit/ (loss)Group share of net assets
Unique Venture Capital Management Limited 31 December 174 (139) 35 (11) (4) 13
174 (139) 35 (11) (4) 13
24 Investment securitiesGroup Group Bank Bank
Dec. 2014 Dec.2013 Dec. 2014 Dec.2013N million N million N million N million
Available-for-sale investment securities comprise:
Treasury bills 50,988 3,304 49,128 1,709 Equity: Quoted 2,195 824 2,195 7,091 Unquoted 20,067 13,632 20,067 12,832 Managed funds - 715 - 715 Bonds 10,332 1,404 8,648 - Others - 985 - -
83,582 20,864 80,038 22,347 Less: specific impairment allowance (4,072) (4,083) (4,072) (4,542)
79,510 16,781 75,966 17,805
Held to maturity investment securities comprise:
Treasury bills 9,197 122,148 9,197 122,148 Bonds 108,493 150,424 108,493 150,424
117,690 272,572 117,690 272,572 Investment securities 197,200 289,353 193,656 290,377
Specific allowance for impairment on available-for-sale investment securities:
Group Group Bank BankDec. 2014 Dec.2013 Dec. 2014 Dec.2013N million N million N million N million
Balance, beginning of the year 4,083 9,604 4,542 8,492 Allowance no longer required) (11) (49) (470) 410 Reclassification - (4,360) - (4,360) Assets classified as discontinued operations - (1,112) - - Balance, end of the year 4,072 4,083 4,072 4,542
Summary of the financial information for equity-accounted investees is as follows:
This represents the Group’s equity investment in Unique Venture Capital Management Company Limited (40%).
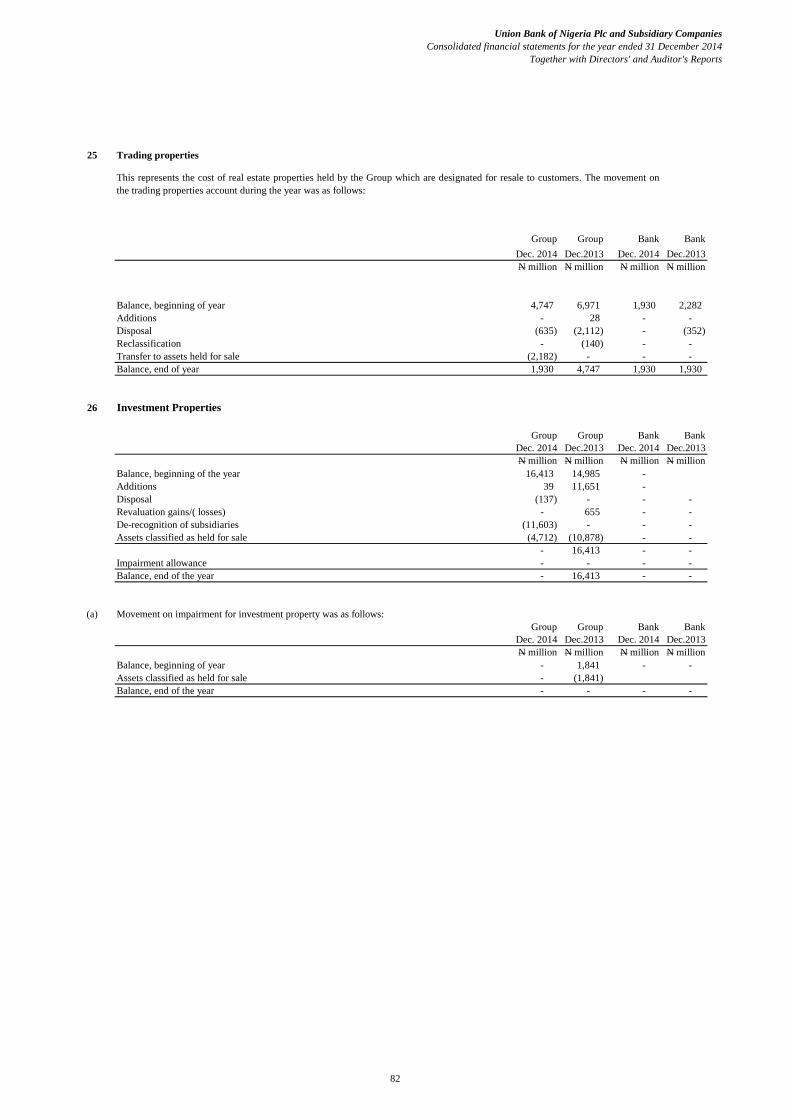
Union Bank of Nigeria Plc and Subsidiary CompaniesConsolidated financial statements for the year ended 31 December 2014
Together with Directors' and Auditor's Reports
82
25 Trading properties
Group Group Bank BankDec. 2014 Dec.2013 Dec. 2014 Dec.2013N million N million N million N million
Balance, beginning of year 4,747 6,971 1,930 2,282 Additions - 28 - - Disposal (635) (2,112) - (352) Reclassification - (140) - - Transfer to assets held for sale (2,182) - - - Balance, end of year 1,930 4,747 1,930 1,930
26 Investment Properties
Group Group Bank BankDec. 2014 Dec.2013 Dec. 2014 Dec.2013N million N million N million N million
Balance, beginning of the year 16,413 14,985 - Additions 39 11,651 - Disposal (137) - - - Revaluation gains/( losses) - 655 - - De-recognition of subsidiaries (11,603) - - - Assets classified as held for sale (4,712) (10,878) - -
- 16,413 - - Impairment allowance - - - - Balance, end of the year - 16,413 - -
(a) Movement on impairment for investment property was as follows:Group Group Bank Bank
Dec. 2014 Dec.2013 Dec. 2014 Dec.2013N million N million N million N million
Balance, beginning of year - 1,841 - - Assets classified as held for sale - (1,841) Balance, end of the year - - - -
This represents the cost of real estate properties held by the Group which are designated for resale to customers. The movement onthe trading properties account during the year was as follows:

Union Bank of Nigeria Plc and Subsidiary CompaniesConsolidated financial statements for the year ended 31 December 2014
Together with Directors' and Auditor's Reports
83
27 Investment in subsidiariesCost
Bank BankDec. 2014 Dec.2013
N million N millionContinued operations:Union Bank UK Plc 8,372 8,372
8,372 8,372
Discontinued operations classified as held for sale:Union Homes Savings and Loans Plc - 1,834 Union Trustees Limited 5 5 Union Assurance Company Limited - 1,448 UBN Property Company Limited 2,195 2,195 Union Registrars Limited - 114 Union Capital Markets Limited - 1,842 Union Pension Fund Custodian - 2,000 Atlantic Nominees Limited 325 325 Reclassification to assets classified as held for sale (2,525) (5,243)
- 4,520
Impairment on investment in subsidiary (See (a) below) - - 8,372 12,892
(a) The movement on impairment on investment in subsidiaries during the year is as follows:
Bank BankDec. 2014 Dec.2013
N million N millionBalance, beginning of year - 1,834 Additional/(Writeback) during the year - 1,036 Reclassification to assets classified as held for sale - (2,870) Balance, end of the year - -
(b) The subsidiary companies, country of incorporation, nature of business and percentage equity holding are detailed below:
Country Direct ownership interestCompany Name Incorporation Nature of business Year end Dec. 2014 Dec.2013
% %
Union Homes Savings and Loans Plc (i) Nigeria Property Development and Mortgage Finance 31 December - 31
Union Trustees Limited (ii) Nigeria Trusteeship 31 December 90 90Union Assurance Company Limited (iii) Nigeria Insurance 31 December - 30UBN Property Company Limited (iv) Nigeria Property Development 31 December 39 39Union Bank UK Plc (v) Nigeria Licensed UK Bank 31 December 100 100Union Registrars Limited Nigeria Registrar 31 December - 80Union Capital Markets Limited Nigeria Investment Banking 31 December - 48Union Pension Custodian Limited (vi) Nigeria Pension Custodial 31 December - 100Atlantic Nominees Limited (vii) Nigeria Real Estate 31 December 100 100
(i) Union Homes Savings and Loans Plc (Registered office at 153, Ikorodu Road, Lagos)In line with the CBN Regulation 3 on the Scope of Banking Activities and Ancillary Matters, the Bank has divested its interest in Union HomesSavings and Loans Ltd in the current year.
Union Bank of Nigeria Plc and Subsidiary CompaniesConsolidated financial statements for the year ended 31 December 2014
Together with Directors' and Auditor's Reports
84
(ii) Union Trustees Limited (Registered Office at 131, Broad Street, Lagos)
(iii) Union Assurance Company Limited (Registered office at 131 Broad Street, Lagos)
(iv) UBN Property Company Limited (Registered office at 36, Marina, Lagos)
(v) Union Bank UK Plc (Registered office at 14-18 Copthal Avenue, London EC2R7BN)
(vi) Union Pension Limited (Registered Office 9b Oko Awo Street, Victoria Island, Lagos )
(vii) Atlantic Nominees Limited
(viii) Union Homes Real Estate Investment Trust (REIT)
(c)● Union Registrars Limited - Thursday, June 19, 2014● Union Homes and Savings Plc - Wednesday, December 31, 2014● Union Capital Markets Limited - Monday, October 27, 2014● Union Insurance Brokers Limited - Friday, October 31, 2014● Union Assurance Company Limited - Monday, November 10, 2014
The following subsidiaries were disposed during the year with effective date of loss of control as follows:
The Group has derecognised the assets and liabilities of Union Pension Limited in its books as a result of the voluntary liquidation of thecompany.
The Bank holds 28,840 (approx. 100%) out of 28,846 ordinary shares of N1 each. The balance of 6 is held by Union Trustees Limited. TheCompany is a Special Purpose Vehicle of former Universal Trust Bank Plc, one of the banks acquired by Union Bank in 2005. The Company wasincorporated to hold interests in landed properties.
The bank holds 90% direct equity of the ordinary shares of the company. The carrying value of the investment in Union Trustees Limited in 2014is included in 'assets classified as held for sale'. (See Note 38)
In line with the CBN Regulation 3 on the Scope of Banking Activities and Ancillary Matters, the Bank has divested its interest in Union Assurance Company Limited in the current year.
The Company has 5,626,416,051 ordinary shares of N1.00 each of which 39.01% (December 2013 - 39.01%) is held by the Bank. In line with
IFRS 10- Consolidated Financial Statement, Union Bank of Nigeria Plc has control over this entity as it has the power, exposure to variability of
returns and a strong link between power and variability of returns. The Bank also governs the financial and operating policies of UBN Property
Company Limited.
The carrying value of the investment in Union Property Company Limited in 2014 is included in 'assets classified as held for sale' (see Note 38)
The Bank directly holds 100% holding of Union Bank UK's 60,000,000 ordinary shares and 99% of its 50,000 deferred shares of GBP1 each and1% indirect holding through Williams Street Trustees Limited, the nominee company for Union Bank of Nigeria Plc . Union Bank UK Plc wasincorporated in October, 2004 as an authorised United Kingdom subsidiary to carry out the business formerly conducted by the London Branchof Union Bank of Nigeria Plc.
The Group ceased to control Union Homes Real Estate Investment Trust (REIT) as a result of the divestment of its interest in Union Homes andhence the Group shareholding has reduced to an ordinary investment and has been accounted for as such.
Thirty-three (33) plots out of the total Seventy-eight (78) plots held by the company were sold in August 2014.

Union Bank of Nigeria Plc and Subsidiary CompaniesConsolidated financial statements for the year ended 31 December 2014
Together with Directors' and Auditor's Reports
85
(c) Condensed results of consolidated entities(i) The condensed financial data of the continuing operations as at 31 December 2014, are as follows
Condensed statement of comprehensive income
Statement of Comprehensive income Group
balances Consolidation
entries Total Bank Union Pension Union Bank
UK N million N million N million N million N million N million
Operating income 95,352 7,879 87,472 85,583 - 1,889 Net operating income after net impairment loss 85,701 102 79,832 77,913 - 1,919 Operating Expenses (58,724) 46 (58,770) (57,222) - (1,549) Net impairment loss on financial assets (9,650) (2,011) (7,640) (7,671) - 31
Share of profit of equity accounted investees (6) (6) -
Profit before income tax 26,971 5,915 21,056 20,691 - 371
Taxation (409) (150) (259) (205) - (54)
Profit after income tax 26,562 5,765 20,797 20,486 - 317
Condended Statement of financial position Group
balances Consolidation
entries Total Bank Union Pension Union Bank
UK N million N million N million N million N million N million
Cash and cash equivalents 121,960 (1,960) 123,920 58,457 - 65,463 Non-pledged trading assets 745 - 745 745 - - Pledged assets 83,935 - 83,935 83,935 - - Derivative financial instrument 7 - 7 - - 7 Loans and advances to customers 312,797 - 312,797 302,372 - 10,425 Investments in equity-accounted investee 24 24 - - - - Investment securities 197,199 - 197,199 193,656 - 3,543 Assets held for sale 22,951 20,426 2,525 2,525 - - Trading properties 1,930 - 1,930 1,930 - - Investment in subsidiaries (2,525) (10,897) 8,372 8,372 - - Property and equipment 49,522 - 49,522 49,428 - 94 Intangible assets 2,422 - 2,422 2,071 - 351 Deferred tax assets 95,883 - 95,883 95,875 - 8 Other assets 122,307 (77) 122,384 121,570 434 380
Total assets 1,009,157 7,516 1,001,641 920,936 434 80,271
Financed by:Derivative financial instruments 7 - 7 - - 7 Deposits from banks 61,890 - 61,890 18,055 - 43,835 Deposits from customers 527,617 (1,960) 529,577 507,431 - 22,146 Current tax liabilities 822 149 673 635 - 38 Other liabilities 110,261 (70) 110,331 109,861 - 470 Retirement benefit obligations 845 - 845 845 - - Other borrowed funds 78,135 - 78,135 78,135 - - Liabilities classified as held for sale 7,346 7,346 - - - - Equity and reserves 222,234 2,051 220,183 205,974 434 13,775
Total liabilities 1,009,157 7,516 1,001,641 920,936 434 80,271

Union Bank of Nigeria Plc and Subsidiary CompaniesConsolidated financial statements for the period ended 31 December 2014
86
(c) Condensed results of consolidated entities(ii) The condensed financial data of the continuing operations as at 31 December 2013, are as follows
Condended statement of comprehensive income
Statement of Comprehensive income Group
balances Consolidation
entries Total Bank Union
Pension Union Bank
UK
Union Homes
REIT N million N million N million N million N million N million N million
Operating income 81,903 (3,414) 85,317 79,307 270 1,806 1,694 Net operating income after net impairment loss 65,102 564 65,469 60,887 270 1,443 1,694 Operating Expenses (59,957) - (59,957) (56,686) (111) (1,536) (261) Net impairment loss on financial assets (16,801) 3,047 (19,848) (18,420) - (362) - Share of proit of equity accounted investees (4) (4) -
Profit before income tax 5,141 (367) 5,508 4,201 159 (92) 1,433
Taxation 933 - 933 920 (6) 19 -
Profit after income tax 6,074 (367) 6,441 5,121 154 (74) 1,433
Condensed Statement of financial position
Group balances
Consolidation entries Total Bank
Union Properties
Union Pension
Atlantic Nominees
Union Bank UK
Union Homes REIT
N million N million N million N million N million N million N million N million N million
Cash and cash equivalents 100,925 (15,780) 116,705 53,141 1,460 2,538 - 56,880 2,686 Non-pledged trading assets 2,847 - 2,847 2,847 - - - - - Pledged assets 65,167 - 65,167 65,167 - - - - - Derivative financial instrument - - - - - - - - - Loans and advances to customers 229,542 - 229,542 210,118 - - - 19,424 - Investments in equity-accounted investee 25 9 16 16 - - - - - Investment securities 289,353 (5,808) 295,161 290,377 800 - - 3,984 - Assets held for sale 51,684 51,684 - - - - - - - Trading properties 4,747 - 4,747 1,930 2,817 - - - - Investment properties 16,413 - 16,413 - 4,485 - 325 - 11,603 Investment in subsidiaries - (15,266) 15,266 15,266 - - - - - Property and equipment 45,526 - 45,526 45,351 22 88 - 65 - Intangible assets 808 - 808 685 - - - 123 - Deferred tax assets 95,889 - 95,889 95,875 - - - 14 - Other assets 99,829 (2,303) 102,132 101,324 78 77 - 327 326
- Total assets 1,002,755 12,536 990,219 882,097 9,662 2,703 325 80,817 14,615
Financed by:Deposits from banks 46,794 - 46,794 3,200 - - - 43,594 - Deposits from customers 482,706 (22,339) 505,045 479,956 - - - 25,089 - Current tax liabilities 534 - 534 472 56 6 - - - Other liabilities 156,405 (1,172) 157,577 155,190 950 264 - 492 681 Retirement benefit obligations 10,261 - 10,261 10,216 45 - - - - Other borrowed funds 45,280 - 45,280 45,280 - - - - - Liabilities classified as held for sale 61,432 61,432 - - - - - - - Equity and reserves 199,343 (25,385) 224,728 187,783 8,611 2,434 325 11,642 13,934
Total liabilities 1,002,755 12,536 990,219 882,097 9,662 2,703 325 80,817 14,615

Union Bank of Nigeria Plc and Subsidiary CompaniesConsolidated and Separate financial statements for the year ended 31 December 2014
87
28 Property and equipment(a) Group:
The movement in these accounts during the year was as follows:
Leasehold land and buildings
Leasehold improvements
Furniture & equipment Motor vehicles
Capital work in progress Total
N million N million N million N million N million N millionCost
Balance at 1st January, 2014 52,343 - 11,676 1,160 818 65,997 Exchange difference 26 - 26 2 - 54 Additions 1,239 - 4,252 39 990 6,520 Disposals - - (6) (34) - (40) Reclassification to other assets (1,551) - (935) 2,608 525 647 Transfers 490 - 366 - (972) (116) Assets classified as discontinued operations - - (1,234) (20) - (1,255) Balance as at 31 December 2014 52,547 - 14,145 3,755 1,361 71,808
Balance at 1st January, 2013 52,794 922 28,147 7,115 2,049 91,027 Exchange difference 5 - 3 1 - 9 Additions 1,402 - 2,061 42 1,348 4,853 Disposals (247) - (46) (1,320) - (1,613) Reclassification to other assets 3,773 (922) 802 (1,074) (2,579) - Write off (2,065) - (17,768) (2,802) - (22,635) Balance as at 31 December 2013 52,343 - 11,676 1,160 818 65,997
Depreciation and impairment lossesBalance at 1st January, 2014 11,530 - 7,909 872 159 20,470 Exchange difference 24 - 16 2 - 42 Charge for the year 1,156 - 1,613 110 - 2,879 Disposals - - (5) (32) - (37) Reclassifications (1,687) - (849) 2,612 - 76 Assets classified as discontinued operations (351) - (780) (13) - (1,143) Balance as at 31 December 2014 10,673 - 7,904 3,552 159 22,287
Balance at 1st January, 2013 10,997 87 25,692 5,785 - 42,561 Exchange difference 3 - 2 - - 5 Charge for the year 1,170 - 1,447 326 - 2,943 Disposals (36) - (46) (1,310) - (1,392) Write-off/Adj 66 - (19,360) (2,753) (22,047) Reclassification to other assets 450 (87) 1,295 (516) - 1,142 Assets classified as held for sale and discontinued o (1,120) - (1,121) (660) 159 (2,742) Balance as at 31 December 2013 11,530 - 7,909 872 159 20,470
(iii) Net Book Value Balance as at 31 December 2014 41,874 - 6,241 203 1,202 49,521 Balance as at 3I December 2013 40,813 - 3,767 288 659 45,527

Union Bank of Nigeria Plc and Subsidiary CompaniesConsolidated and Separate financial statements for the year ended 31 December 2014
88
(iv) In the opinion of the directors, the market value of the Group's properties is not less than the value shown in the financial statements.
(v)
(vi) There were no capitalised borrowing costs related to the acquisition of property and equipment during the year (December 2013: nil)
(b) Bank: The movement in these accounts during the year was as follows:
Leasehold land and buildings
Leasehold improvements
Furniture & equipment Motor vehicles
Capital work in progress Total
(i) Cost N million N million N million N million N million N million
Balance at 1st January, 2014 52,182 - 10,315 1,124 818 64,439 Additions 1,230 - 4,212 39 990 6,471 Disposals - - (6) (34) - (40) Reclassifications (1,551) - (935) 2,608 525 647 Transfers 490 - 366 - (972) (116) Reversals - - - - - -
Balance as at 31 December 2014 52,351 - 13,952 3,737 1,361 71,401
Balance at 1st January, 2013 53,190 - 26,038 5,195 197 84,620 Additions 1,163 - 2,031 38 1,348 4,580 Disposals (247) - (46) (1,307) (201) (1,801) Reclassification to other assets - - - - - - Transfers 141 - 60 - - 201 Write off (2,065) - (17,768) (2,802) (526) (23,161) Balance as at 31 December 2013 52,182 - 10,315 1,124 818 64,439
Capital work in progress represents construction costs in respect of new offices. On completion of construction, the related amounts are transferred to appropriate categories of property and equipment.

Union Bank of Nigeria Plc and Subsidiary CompaniesConsolidated and Separate financial statements for the year ended 31 December 2014
89
.
Leasehold land and buildings
Leasehold improvements
Furniture & equipment Motor vehicles
Capital work in progress Total
(ii) Accumulated depreciation N million N million N million N million N million N million
Balance at 1st January, 2014 11,397 - 6,845 846 19,088 Charge for the year 1,136 - 1,605 113 - 2,854 Disposals - - (5) (32) - (37) Reclassifications (1,690) - (851) 2,609 68 Write-off/Adj - - - - -
Balance, end of the year 10,843 - 7,594 3,536 - 21,973
Balanceas at 1 January 2013 10,219 - 24,681 4,583 - 39,483 Charge for the year 1,148 - 1,432 319 - 2,899 Disposals (36) - (46) (1,303) - (1,385) Reclassification to other assets 66 - (19,222) (2,753) - (21,909)
Balance as at 31 December 2013 11,397 - 6,845 846 - 19,088
(iii) Net Book Value Balance as at 31 December 2014 41,508 - 6,358 201 1,361 49,428 Balance as at 31 December 2013 40,785 - 3,470 278 818 45,351
(iv) In the opinion of the directors, the market value of the Bank's properties is not less than the value shown in the financial statements.
(v)
(vi) There were no capitalised borrowing costs related to the acquisition of property and equipment during the year (December 2013: nil)
Capital work in progress represents construction costs in respect of new offices. On completion of construction, the related amounts are transferred to appropriate categories of property and equipment.

Union Bank of Nigeria Plc and Subsidiary CompaniesConsolidated financial statements for the period ended 31 December 2014
90
29 Intangible assetsGroup Group Bank Bank
Dec. 2014 Dec.2013 Dec. 2014 Dec.2013N million N million N million N million
CostBalance, beginning of the year 2,134 2,725 1,610 1,318 Additions 1,901 381 1,675 292 Transfer from work-in-progress 116 - 116 - Write-off - (63) Exchange translation difference 112 10 - - Assets of subsidiaries disposed - (919) Balance, end of year 4,263 2,134 3,401 1,610
Amortization and impairment lossesBalance, beginning of the year 1,326 1,670 925 796 Amortisation for the year 432 179 389 161 Reclassification 16 (16) 16 (16) Write-off - (16) - (16) Exchange translation difference 67 6 - - Assets of subsidiaries disposed - (497) - - Balance, end of year 1,841 1,326 1,330 925
Carrying amounts as at year end 2,422 808 2,071 685
(i)
(ii) There were no capitalised borrowing costs related to the acquisition of software during the year (December 2013 : nil)
30 Deferred tax assets and liabilitiesRecognised deferred tax assets and liabilitiesDeferred tax assets and liabilities are attributable to the following:
Group31 December 2014
Assets Liabilities NetN million N million N million
Property, equipment, and software - 6,847 (6,847) Allowances for loan losses - 192 (192) Foreign exchange gains 573 - 573 Tax loss carry forward 100,638 - 100,638 Others 1,711 - 1,711 Net tax assets (liabilities) 102,922 7,039 95,883
31 December 2013Assets Liabilities Net
N million N million N million
Property, equipment, and software - 6,847 (6,847) Allowances for loan losses - 192 (192) Foreign exchange gains 573 - 573 Tax loss carry forward 100,644 - 100,644 Others 1,711 - 1,711 Net tax assets (liabilities) 102,928 7,039 95,889
In the opinion of the directors, the market value of the Group's software is not less than the value shown in the financialstatements.

Union Bank of Nigeria Plc and Subsidiary CompaniesConsolidated financial statements for the period ended 31 December 2014
91
Bank31 December 2014
Assets Liabilities NetN million N million N million
Property, equipment, and software - 6,847 (6,847) Allowances for loan losses - 192 (192) Foreign exchange gains 573 - 573 Tax loss carry forward 100,630 - 100,630 Others 1,711 - 1,711 Net tax assets (liabilities) 102,914 7,039 95,875
31 December 2013Assets Liabilities Net
N million N million N millionProperty, equipment, and software - 6,847 (6,847) Allowances for loan losses - 192 (192) Foreign exchange gains 573 - 573 Tax loss carry forward 100,630 - 100,630 Others 1,711 - 1,711 Net tax assets (liabilities) 102,914 7,039 95,875
Deferred tax assets and liabilities Movement on the net deferred tax assets/(liabilities) account during the year/year:
Group Group Bank BankDec. 2014 Dec.2013 Dec. 2014 Dec.2013N million N million N million N million
Balance, beginning of the year 95,889 98,354 95,875 95,875 Credit for the year (16) (10) - - Credit/(reversal) - - - - Charge for the year - - - - Net assets/(liabilities) of discontinued operations 10 (2,455) - - Net deferred tax assets/(liabilities) 95,883 95,889 95,875 95,875
Made up ofDeferred tax assets 102,922 102,928 102,914 102,914 Deferred tax liabilities (7,039) (7,039) (7,039) (7,039)
Recognised and unrecognised deferred tax assets
31 Other assetsGroup Group Bank Bank
Dec. 2014 Dec.2013 Dec. 2014 Dec.2013N million N million N million N million
Cash Reserve Requirement (see (i)) 113,376 72,971 113,376 72,971 Other assets:Accounts receivable and prepayments 4,086 4,462 3,783 4,366 Receivable from AMCON (see note (ii) below) - 7,447 - 7,447 Sundry assets 187,498 194,834 187,064 195,360 Clearing 857 148 857 148
192,441 206,891 191,704 207,321 Impairment on other assets (183,510) (180,033) (183,510) (178,968) Net other assets 8,931 26,858 8,194 28,353 122,307 99,829 121,570 101,324
Recognition of deferred tax assets of N95,883 (2013: 95,889) is based on management's profit forecasts (which are based on theavailable evidence, including historical levels of profitability), which indicate that it is probable that the Group's enitities willhave taxable profits against which these assets can be utilized. As at year end, the Bank and Group have unrecognised deferredtax assets of N56billion (2013: N47billion).

Union Bank of Nigeria Plc and Subsidiary CompaniesConsolidated financial statements for the period ended 31 December 2014
92
(i)
(ii)
Movement in impairment on other assets:Group Group Bank Bank
Dec. 2014 Dec.2013 Dec. 2014 Dec.2013N million N million N million N million
Balance, beginning of the year 180,033 154,680 178,967 151,093 Charge for the year 5,222 4,911 4,763 3,845 Allowance written off (1,301) (10) (842) (10) Reclassification 1,021 24,039 1,021 24,039 Allowance no longer required (399) - (399) - Assets classified as held for sale (1,066) (3,587) - - Balance, end of year 183,510 180,033 183,510 178,967
32 Deposits from banksGroup Group Bank Bank
Dec. 2014 Dec.2013 Dec. 2014 Dec.2013N million N million N million N million
Money market deposits 18,055 3,200 18,055 3,200 Other deposits from banks 43,835 43,594 - -
61,890 46,794 18,055 3,200
33 Deposits from customersGroup Group Bank Bank
Dec. 2014 Dec.2013 Dec. 2014 Dec.2013N million N million N million N million
Term deposits 167,388 147,468 160,773 151,973 Current deposits 222,180 201,448 208,609 194,193 Savings 138,049 133,790 138,049 133,790
527,617 482,706 507,431 479,956
The Bank had restricted balances of N113.376 billion (Dec. 2013: N72,971 billion) with the Central Bank of Nigeria (CBN) asat 31 December 2014. The cash reserve requirement (CRR) is a mandatory cash deposit which is held with the Central Bank ofNigeria as a regulatory requirement. The CRR is non interest bearing and is not available for use in the Group’s day-to-dayoperations. As at the end of 2014, the CRRs in force were Public Sector Deposits 75% (Dec 2013: 75%) and Private SectorDeposits 20% (Dec 2013: 15%).
This represents a receivable from Asset Management Corporation of Nigeria (AMCON) as at 2013 year end in respect of proceeds on sale of loans and accrued interest thereon. As at 31 December 2014, the Bank had received full payment from AMCON.

Union Bank of Nigeria Plc and Subsidiary CompaniesConsolidated financial statements for the period ended 31 December 2014
93
34 Current tax liabilitiesGroup Group Bank Bank
Dec. 2014 Dec.2013 Dec. 2014 Dec.2013N million N million N million N million
Balance, beginning of the year 534 2,312 472 495 Prior year over provision - (978) - (977) Reclassification - 977 - 977 Charge for the year 409 35 205 57 Payments during the year (64) (102) (42) (80) Transfer to assets held for sale (57) (1,710) Balance, end of year 822 534 635 472
35 Other liabilitiesGroup Group Bank Bank
Dec. 2014 Dec.2013 Dec. 2014 Dec.2013N million N million N million N million
Deposits for foreign currency 36,879 40,633 36,879 40,633 PAYE and other statutory deductions 474 1,937 474 1,841 Draft and Bills payable 15,526 23,278 15,526 23,278 Sundry creditors 4,777 21,774 4,777 21,791 Creditors and accruals 27,949 26,641 27,949 25,977 Provision for claims andcontigencies 1,844 1,643 1,844 1,643 Accounts payable 5,566 18,709 5,566 18,343 Other credit balances 17,245 21,791 16,846 21,683
110,260 156,406 109,861 155,189

Union Bank of Nigeria Plc and Subsidiary CompaniesConsolidated financial statements for the year ended 31 Decenber 2014.
Together with Directors'and Auditors'Reports
94
36 Retirement benefit obligationsGroup Group Bank Bank
Dec. 2014 Dec. 2013 Dec. 2014 Dec. 2013N million N million N million N million
Defined contribution scheme (see (a) below) 131 131 131 131 Other long-term employee benefits 714 10,130 714 10,085
845 10,261 845 10,216
(a) Defined Contribution SchemeGroup Group Bank Bank
Dec. 2014 Dec. 2013 Dec. 2014 Dec. 2013N million N million N million N million
Balance, beginning of year 131 304 131 247 Charge during the year 702 1,613 702 1,613 Reclassification to discontinued operations - (5) - - Reclassification to defined benefit obligation - (43) - - Contribution remitted during the year/year (702) (1,738) (702) (1,729) Balance, end of year 131 131 131 131
(b) Other long-term employee benefits
(i) Less than 5 years of service: 12 weeks total emolument for each completed year of service.(ii) 5 years but less than 15 years of service: 14 weeks total emolument for each completed year of service.(iii) 15 years of service and above: 16 weeks total emolument for each completed year of service.
(i)
Group Group Bank BankDec. 2014 Dec. 2013 Dec. 2014 Dec. 2013
N million N million N million N million
Present value of unfunded obligation 714 10,130 714 10,085 Present value of funded obligation - - - - Total present value of the obligation 714 10,130 714 10,085 Fair value of plan assets - - - - Present value of net obligation 714 10,130 714 10,085
Recognized liability for defined benefit obligations 714 10,130 714 10,085
benefits under the scheme but has now commenced the transfer of such benefits to the Retirement Savings Accounts (RSA) of the affected
The Group and its employees make respective contributions of 10% and 8% of basic salary, housing and transport allowance to each retirement savings account maintained with employees' nominated Pension Fund Administrators.
The Group has discontinued its defined benefit sheme in the current year and has derecognised such in its books as at 31st December 2014.Outstanding balance on long term employee benefits represents liability in respect of long service award.
The basis of determining the benefit due to an employee is as stated below:
The total emolument is defined as basic salary, housing and transport allowance and lunch subsidy.
The Group also has a Legacy defined benefits pension scheme for its staff, prior to passage of the Pension Reform Act. Under the scheme,terminal benefits were determined with reference to the employees' salaries upon disengagement. The Bank has continued to carry accrued
employees.
The amounts recognised in the statement of financial position are as follows:

Union Bank of Nigeria Plc and Subsidiary CompaniesConsolidated financial statements for the year ended 31 Decenber 2014.
Together with Directors'and Auditors'Reports
95
(i) The movement in present value of defined benefit obligation includes:
Group Group Bank BankDec. 2014 Dec. 2013 Dec. 2014 Dec. 2013
N million N million N million N million
Defined benefit obligation at 1 January 10,130 51,606 10,085 49,121 Benefits paid by the plan (12,591) (17,700) (12,591) (17,693) Current service costs and interest (120) 3,650 373 3,650 Past service cost - - - - Curtailment - (2,240) (492) (2,240) Actuarial gain - (5,521) - (5,521) Reclassification to other liabilities - (17,232) (769) (17,232) Reclassification from defined contribution scheme - 52 - - Reclassification to discontinued operations (813) (2,485) - - Remeasurement of defined benefit obligation 4,108 - 4,108 -
Defined benefit obligation at 31 December 714 10,130 714 10,085
(iii) Expense recognised in income statement
Current service costs and interest (120) 1,410 (120) 1,410
The above expense is recognised as personnel expenses, see note 14.

Union Bank of Nigeria Plc and Subsidiary CompaniesConsolidated financial statements for the year ended 31 Decenber 2014.
Together with Directors'and Auditors'Reports
96
37 Other borrowed fundsGroup Group Bank Bank
Dec. 2014 Dec. 2013 Dec. 2014 Dec. 2013 N million N million N million N million
Due to CAC ( see (a)) 14,488 16,667 14,488 16,667 BOI on-lending facilities (see note (b) below) 10,182 12,878 10,182 12,878 Other borrowings ( see (c)) 53,465 15,735 53,465 15,735
78,135 45,280 78,135 45,280
(a)
(b)
(c)2014 2013
Lender $million Naira equivalent
=N=bn
Naira equivalent
=N=bn3-year medium term loan for generalcorporate and trade finance; secured byFGN bonds with face value of N19.5bn Standard Chartered Bank
100.00 19.09 15.74
3-year unsecured syndicated medium termloan for general corporate and trade
Syndicate; lead arranger:Standard Chartered Bank
100.00 19.33 -
Short term borrowing, for general corporateand trade finance
Citi Group Global MarketLimited
50.00 7.70 -
1-year unsecured term loan for generalcorporate and trade finance purposes.
Commerzbank 40.00 7.35 -
290.00 53.47 15.74
38 Discontinued operations
(a) Profit for the year from discontinued operations
The profit for the year from discontinued operations comprises:
Group Group Dec. 2014 Dec.2013
N million N million
Gross income 16,234 18,164Gross expense (15,497) (19,724)
Profit for the year from discontinued operations represents the operating results of subsidiaries held for sale in linewith the Bank's Regulation 3 compliance plan to divest from non-banking subssidiaries.Included in discontinued operations are the results and balances of Union Trustees Limited, Atlantic NomineesLimited and Union Properties Limited.
This represents the outstanding balance on an unsecured facility of N18.167billion disbursed by the Central Bankof Nigeria (CBN), as part of its developmental role, in collaboration with the Federal Government of Nigeria,represented by the Federal Ministry of Agriculture and Water Resources, which established the CommercialAgriculture Credit Scheme for promoting agricultural enterprises in Nigeria. The funds are made available toparticipating banks at zero cost for on lending to commercial agricultural enterprises at a maximum rate of9.00%p.a.
This represents the outstanding balance of an intervention credit granted to the Bank by the Bank of Industry(BOI), a company incorporated in Nigeria for the purpose of refinancing / or restructuring existing loans to Smalland Medium Scale Enterprises (SMEs) and manufacturing companies. The total facility is secured by FederalGovernment of Nigeria securities worth N18.4 billion (Dec. 2013: N18.4 billion) and has a 15-year tenor andrepayable quarterly.
A management fee of 1% , deductible at source, is paid by the Bank to BOI under the on-lending agreement andthe Bank is under obligation to on-lend to customers at an all-in interest rate of 7% per annum. Though the facilityis meant for on-lending to borrowers in specified sectors, the Bank remains the primary obligor to the BOI andtherefore assumes the risk of default of customers.
Other borrowings consist of the following facilities:

Union Bank of Nigeria Plc and Subsidiary CompaniesConsolidated financial statements for the year ended 31 Decenber 2014.
Together with Directors'and Auditors'Reports
97
Interest Income 11,120 9,871 Interest Expense (2,894) (3,465) Net interest income 8,226 6,406
Net fee and commission income 1,444 1,214 Net trading income 238 1,195 Other operating income 2,760 5,884
Total non-interest income 5,114 8,293
Operating Income 13,340 14,699
Net impairment loss on financial assets (7,383) (6,771) Net operating income after net impairment loss on other financial assets 5,957 7,929
Personnel expenses (1,487) (3,161) Depreciation and amortisation (452) (704) Other operating expenses (3,281) (5,623)
(5,220) (9,489) Share of profit of equity accounted investee - -
Loss before tax from discontinued operations 737 (1,560)Income tax expense (474) (866) Loss from discontinued operations (net of tax) 263 (2,426)
(b) Assets classified as held for saleGroup Group Bank Bank
Dec. 2014 Dec. 2013 Dec. 2014 Dec. 2013 N million N million N million N million
Cash and cash equivalents 3,848 779 - - Investments in subsidiaries - - 2,525 5,243 Non-pledged trading assets 137 991 - - Loans and advances to customers - 9,719 - - Investment securities 8,342 26,715 - - Trading properties 2,182 - Investment properties 4,712 5,494 - - Property and equipment 25 2,292 - - Intangible assets - 323 - - Deferred tax assets 13 1,393 - - Other assets 1,167 3,978 - -
20,426 51,684 2,525 5,243 Impairment allowance - - - (2,869)
20,426 51,684 2,525 2,374
(c) Liabilities for assets classified as held for saleGroup Group Bank Bank
Dec. 2014 Dec.2013 Dec. 2014 Dec.2013N million N million N million N million
Deposits from customers - 26,615 - - Liability on investment contract - 1,143 - - Liability on insurance contract - 3,689 - - Current tax liabilities 293 1,373 - - Deferred tax liabilities 1 305 - - Other liabilities 6,947 25,434 - - Retirement benefit obligations 106 614 - - Other borrowed funds - 2,259 - -
7,347 61,432 - -
In the opinion of the Directors, assets held for sale have been recognised at the lower of their carrying amount and fair valueless costs to sell.

Union Bank of Nigeria Plc and Subsidiary CompaniesConsolidated financial statements for the year ended 31 Decenber 2014.
Together with Directors'and Auditors'Reports
98
(d) Condensed results of discontinued operations
The condensed financial data of the discontinued operations as at 31 December 2014, are as follows
Statement of Comprehensive income Union
Properties Union Homes
Atlantic Nominees
Union Trustees
Union Assurance
Union Registrars
Union Capital
Intragroup adjustments
Group Total
N million N million N million N million N million N million N million N million N millionInterest income 181 9,169 - 812 - 958 - - 11,120 Interest expense - (2,894) - - - - - - (2,894)
Net interest income 181 6,275 - 812 - 958 - - 8,226 Impairment charge for credit losses - - - - - - - - Net interest income after impairment charge for credit losses 181 6,275 - 812 - 958 - - 8,226
Net fee and commission income 581 130 - 683 - 26 24 - 1,444 Net trading (loss)/income 37 - 154 - - 47 - 238 Other operating income 81 457 72 953 825 299 74 - 2,760 Underwriting profit - - - - 672 - - - 672
662 624 72 1,791 1,497 325 145 - 5,113 Operating income 843 6,899 72 2,603 1,497 1,283 145 - 13,339 Net impairment loss on other financial assets - (6,433) - - - - (950) (7,383) Net operating income after net impairment loss
on other financial assets 843 466 72 2,603 1,497 1,283 145 (950) 5,956 Personnel expenses (76) (405) (308) (437) (261) - - (1,487) Depreciation and amortisation (9) (322) (7) (82) (32) - - (452) Other operating expenses (610) (872) (124) (370) (1,186) (118) - (3,281)
Total expenses (695) (1,599) - (438) (890) (1,479) (118) - (5,220) Share of profit of equity accounted investee - - - -
Profit/(loss) before income tax 147 (1,133) 72 2,165 607 (196) 27 (950) 736
Income tax (25) - (165) (33) (250) - - (474) Profit/(loss) for the year 122 (1,133) 72 1,999 574 (446) 27 (950) 263

Union Bank of Nigeria Plc and Subsidiary CompaniesConsolidated financial statements for the year ended 31 Decenber 2014.
Together with Directors'and Auditors'Reports
99
Condensed statement of financial position for discontinued operations
Statement of financial position Union
trustees Union
properties Atlantic Nominee Intragroup
adj Total N million N million N million N million
ASSETS
Cash and cash equivalents 2,101 1,746 - - 3,848 Non-pledged trading assets 137 - - - 137 Investment securities 7,275 1,086 - (19) 8,342 Trading properties - 2,182 - - 2,182 Investment properties - 4,524 188 - 4,712 Property and equipment 7 18 - - 25 Deferred tax assets 13 - - - 13 Other assets 941 18 209 - 1,167
TOTAL ASSETS 10,474 9,574 397 (19) 20,426
LIABILITIES
Current tax liabilities 212 82 - - 293 Deferred tax liabilities - 1 - - 1 Other liabilities 6,372 724 - (149) 6,947 Retirement benefit obligations 69 37 - - 106 TOTAL LIABILITIES 6,653 843 - (149) 7,346
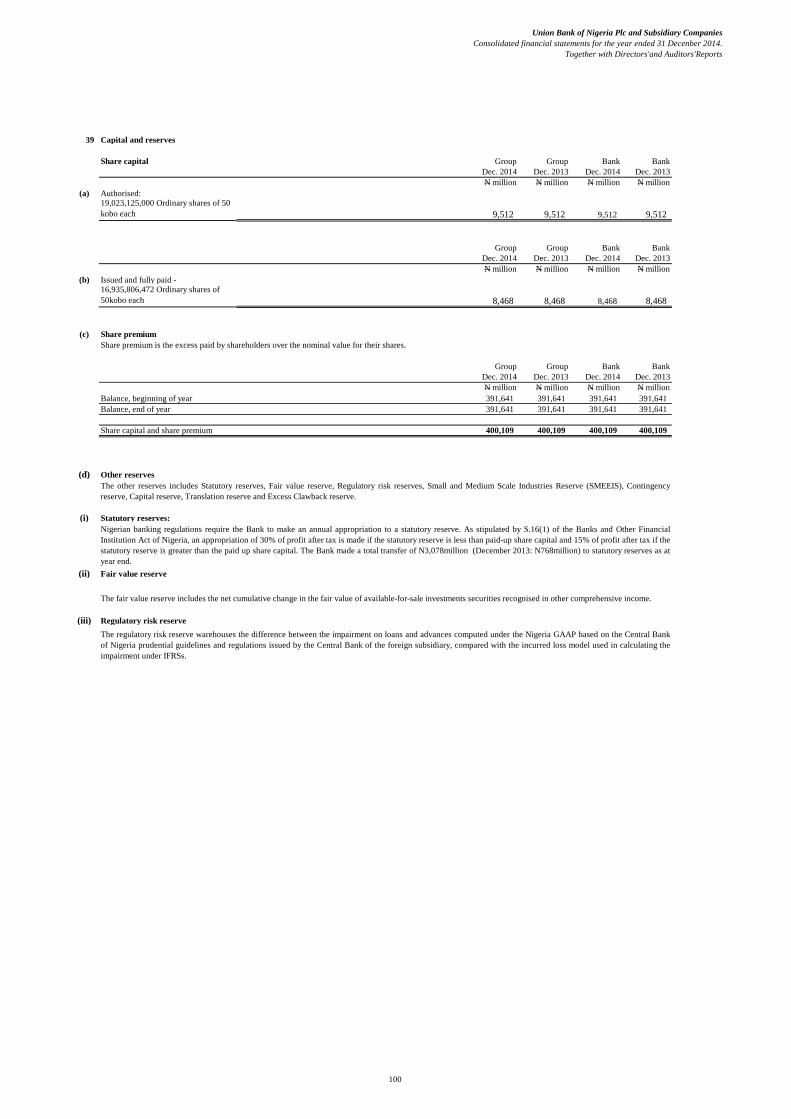
Union Bank of Nigeria Plc and Subsidiary CompaniesConsolidated financial statements for the year ended 31 Decenber 2014.
Together with Directors'and Auditors'Reports
100
39 Capital and reserves
Share capital Group Group Bank Bank Dec. 2014 Dec. 2013 Dec. 2014 Dec. 2013
N million N million N million N million(a) Authorised:
19,023,125,000 Ordinary shares of 50 kobo each 9,512 9,512 9,512 9,512
Group Group Bank Bank Dec. 2014 Dec. 2013 Dec. 2014 Dec. 2013
N million N million N million N million(b) Issued and fully paid -
16,935,806,472 Ordinary shares of 50kobo each 8,468 8,468 8,468 8,468
(c) Share premiumShare premium is the excess paid by shareholders over the nominal value for their shares.
Group Group Bank Bank Dec. 2014 Dec. 2013 Dec. 2014 Dec. 2013
N million N million N million N millionBalance, beginning of year 391,641 391,641 391,641 391,641 Balance, end of year 391,641 391,641 391,641 391,641
Share capital and share premium 400,109 400,109 400,109 400,109
(d) Other reserves
(i) Statutory reserves:
(ii) Fair value reserve
(iii) Regulatory risk reserve
The other reserves includes Statutory reserves, Fair value reserve, Regulatory risk reserves, Small and Medium Scale Industries Reserve (SMEEIS), Contingencyreserve, Capital reserve, Translation reserve and Excess Clawback reserve.
Nigerian banking regulations require the Bank to make an annual appropriation to a statutory reserve. As stipulated by S.16(1) of the Banks and Other FinancialInstitution Act of Nigeria, an appropriation of 30% of profit after tax is made if the statutory reserve is less than paid-up share capital and 15% of profit after tax if thestatutory reserve is greater than the paid up share capital. The Bank made a total transfer of N3,078million (December 2013: N768million) to statutory reserves as atyear end.
The fair value reserve includes the net cumulative change in the fair value of available-for-sale investments securities recognised in other comprehensive income.
The regulatory risk reserve warehouses the difference between the impairment on loans and advances computed under the Nigeria GAAP based on the Central Bankof Nigeria prudential guidelines and regulations issued by the Central Bank of the foreign subsidiary, compared with the incurred loss model used in calculating theimpairment under IFRSs.

Union Bank of Nigeria Plc and Subsidiary CompaniesConsolidated financial statements for the year ended 31 Decenber 2014.
Together with Directors'and Auditors'Reports
101
(iv) Small and Medium Scale Industries Reserve (SMEEIS):
(v) Capital reserve
(vi) Translation reserve
(vii) Excess Capital Clawback
(e) Retained deficit
40 Non-controlling Interest Group GroupMovement in the non controlling interest Dec. 2014 Dec. 2013
N million N millionBalance, beginning of year 7,162 4,979 Profit/(loss) for the year 1,198 (1,621) Increase/(dimunition) in non controlling interest (3,022) 4,118 Dividend to non-controling interest - (314)
Balance, end of year 5,338 7,162
42 Events after the reporting date
43 Contingencies
(a) Litigations and claims
(b)
(b)
(c) Provision ClawbackUnder a Clawback Rights Agreement (CRA) executed among the Bank, Union Global Partners Limited (UGPL) and Asset Management Corporation of Nigeria(AMCON) as part of the recapitalisation program of the Bank, if specified provisions that were in the books of the Bank as at 31 December 2011 do not crystaliseand/or are not utilised in settlement of intended obligations within 5 years from December 2011, the extent of the provisions which do not crystalise and/or are notutilised shall be refunded to AMCON. The refund is on the ground that the Financial Accomodation provided by AMCON to bring the Bank's Completion Net AssetsValue (NAV) to zero funded those provisions.Total interest of N1.16 billion was accrued during the year in respect of AMCON clawback arrangement.
The Financial Accommodation provided by AMCON exceeded the Bank's Completion NAV of zero, calculated as at 31 December 2011, by N14.918 billion. Thisexcess amount has been refunded to AMCON.
Retained deficit represents the carried forward income net of expenses plus current year profit attributable to Group's shareholders.
In common with other banks, the Group conducts business involving acceptances, performance bonds and indemnities. The majority of these facilities are offset bycorresponding obligations of third parties. Contingent liabilities and commitments comprise performance bonds, acceptances, guarantees and letters of credit.
There are contingent liabilities in respect of legal actions against the Bank for amounts totalling N142 billion (December 2013: N138 billion) for which provisionsamounting to N1.8 billion (December 2012: N1.6 billion) have been made. The actions are being vigorously contested and the Directors are of the opinion that nosignificant liability will arise therefrom in excess of the provision made in the financial statements.
Subsequent to year end, the Bank has completed the sales process of one of its subsidiaries - Union Trustees Limited.
The Group in the ordinary course of business is currently involved in 726 litigation cases (December 2013: 639 cases). The Directors are of the opinion that none ofthe aforementioned cases is likely to have a material adverse effect on the Bank and are not aware of any other pending or threatened claims and litigations besidesthose included in the above number.
The SMEEIS reserve is maintained to comply with the Central Bank of Nigeria (CBN) requirement that all licensed banks set aside a portion of the profit after tax in afund to be used to finance equity investment in qualifying small and medium scale enterprises. Under the terms of the guideline (amended by CBN letter dated 11 July2006), the contributions will be 10% of profit after tax and shall continue after the first 5 years but banks’ contributions shall thereafter reduce to 5% of profit aftertax. However, this is no longer mandatory and therefore no reserve was made during the year. The small and medium scale industries equity investment schemereserves are non-distributable.
Capital reserve warehouses the nominal value of shares cancelled during the capital reconstruction exercise that occurred during the financial year ended December 2012.
Translation reserve comprises all foreign exchange differences arising from translation of the financial statements of foreign operations.
Under the recapitalisation plan of the Bank executed in 2011, the Asset Management Corporation of Nigeria (AMCON) provided Financial Accommodation to bringthe Bank's Completion Net Assets Value (NAV) to zero.
Contingent liabilities and commitments
Warranties on sale of subsidiariesUnder the Share Purchase Agreement executed between the Bank and the various buyers of the disposed subsidiaries, the Bank has a maximum potential liability ofN432 million in the event of breaches of representation or warranty made by the Bank to the various buyers. However, the Directors have reviewed this potentialliability and are of the opinion that no significant liability will crystalized in respect of the sales transaction.
The Bank currently have warranties to the tune of N2.2 billion with respect to sale of subsidiaries during the year.

Union Bank of Nigeria Plc and Subsidiary CompaniesConsolidated financial statements for the year ended 31 Decenber 2014.
Together with Directors'and Auditors'Reports
102
44 Acceptances, bonds, guarantees and other obligations for the account of customers
Group Group Bank Bank Dec. 2014 Dec. 2013 Dec. 2014 Dec. 2013
N million N million N million N millionPerformance bonds and guarantees 37,891 41,596 37,891 41,596 Letters of credit 69,332 12,226 69,332 12,226 Fx-Sold Spot 23,312 15,816 23,312 15,816
130,535 69,638 130,535 69,638
45 Customers' complaints
Description Dec 2014 Dec 2013Unresolved brought forward 154 120Complaints received 2,466 #Complaints resolved 2,520 #Complaints unresolved 100 154
In the normal course of business, the Group is a party to financial instruments with off-balance sheet risks. These instruments are issued to meet the credit and otherfinancial requirements of customers. The total off-balance sheet assets for the Group was N62.81 billion (December 2013: N69.64 billion).The following tables summarise the nominal principal amount of contingent liabilities and commitments with off-financial position risk:
The Bank in its ordinary course of business received 2,466 complaints (2013: 3,489) as at December 31, 2014. The details of the complaints are illustrated in the tablebelow:
The total amount resolved was N3,843,487,514.77 (2013: N12,755,095,104.75) while the total disputed amount in cases which remain unresolved stood atN2,843,764,238.96 (2013: N5,760,698,856.88). No complaints were referred to the Central Bank of Nigeria (CBN) for intervention during the year (2013: nil).
The Directors are of the opinion that these outstanding complaints will be ultimately resolved. The Bank has a total provision of N9.92 billion (2013: N2.58 billion)for these complaints.
Interest on the provision clawback is computed on the outstanding balance of the provision amount, using an interest rate equal to the prevailing Monetary Policy Rate (MPR) plus 2%.

Union Bank of Nigeria Plc and Subsidiary CompaniesConsolidated and financial statements - 30 September 2014.
103
46 Related party transactions
(i)
(ii)
Loans and advances: Dec. 2014 Dec. 2013N million N million
Loans and advances (see note (a) below) 12,850 13,764 Total loans and advances 12,850 13,764
(a) Secured loans and advances
Borrower Relationship Facility Type Amount Status Amount StatusN million N million
Emeka Emuwa Group ManagingDirector
Takeover Loan - - 8 Performing
Adewale Oyinkansade Executive Director
Mortgage Loan 54 Performing 65 Performing
Akin Ishola Former ExecutiveDirector
Term Loan - - 1 Performing
C. J. Omoijiade Director, UnionHomes
Term Loan/Overdraft
- - 2 Performing
Union Homes Savings andLoans Plc Subsidiary Overdraft - - 1,552 Non performingNotore Chemicals Industries Former Director Fcy Term Loan 6,463 Non performing 7,352 WatchlistNotore Chemicals Industries Former Director Overdraft 1,185 Non performing - Sailand Nig. Ltd Former Director Overdraft 25 Non performing 25 Non performingSwift Networks Ltd Non-Executive
DirectorsTerm Loan
3,525 Performing 4,000 PerformingSwift Networks Ltd Non-Executive
DirectorsFinancial Guarantee 1,322 Performing - Performing
Swift Networks Ltd Non-Executive Directors
Overdraft276 Performing 759 Performing
12,850 13,764
Key management personnel compensation for the year comprises:Dec. 2014 Dec. 2013N million N million
Salaries, short term benefits and pensions 617 564 Other allowances and benefits 20 11 Fees as directors 290 260
927 835
Dec. 2013Dec. 2014
A number of banking transactions are entered into with related parties in the normal course of business. These include loans, deposits,placements and off balance sheet transactions. The volumes of related-party transactions, outstanding balances at the year-end was asfollows:
Transactions with key management personnel
Key management personnel and their immediate relatives engaged in the following transactions with the Group during the year:
The status of performance of each facility is as shown below:
The Group’s key management personnel, and persons connected with them, are also considered to be related parties for disclosurepurposes. The definition of key management personnel includes close members of family of key personnel and any entity over whichkey management personnel exercises control. The key management personnel have been identified as the executive and non-executive directors of the Group and other relevant senior management personnel. Close members of family are those familymembers who may be expected to influence, or be influenced by that individual in their dealings with the Bank and its subsidiaries.
ParentThe parent company, which is also the ultimate parent company, is Union Bank Plc of Nigeria.
SubsidiariesTransactions between Union Bank of Nigeria Plc and its subsidiaries also meet the definition of related party transactions. Where these are eliminated on consolidation, they are not disclosed in the consolidated financial statements.

Union Bank of Nigeria Plc and Subsidiary CompaniesConsolidated and financial statements - 31 December 2014.
104
47 Compliance with banking regulations
Banking Legislation Nature of transaction PenaltiesN million
(a) 1 (b) 4
(c) 2
(d) Section 3.8 of the CBN prudential guideline
2
9
48 Current/non-current classification
Group Note Carrying amount Current Non- current Carrying amount Current Non- current
N million N million N million N million N million N millionASSETS
Cash and cash equivalents 18 121,960 121,960 - 100,925 100,925 - Non-pledged trading assets 19 745 745 - 2,847 2,847 - Pledged assets 20 83,935 29,279 54,656 65,167 5,787 59,380 Derivative assets held for risk management 21 7 7 - - - - Loans and advances to customers 22 312,797 159,416 153,381 229,542 158,400 71,142 Investments in equity accounted investee 23 24 - 24 25 - 25 Investment securities 24 197,200 89,806 107,394 289,353 198,277 91,076 Trading properties 25 1,930 - 1,930 4,747 - 4,747 Investment properties 26 - - - 16,413 - 16,413 Property and equipment 28 49,521 2,879 46,643 45,527 2,943 42,584 Intangible assets 29 2,422 432 1,990 808 179 629 Deferred tax assets 30 95,883 - 95,883 95,889 - 95,889 Other assets 31 122,307 8,931 113,376 99,829 15,814 84,015
988,731 413,454 575,277 951,072 482,050 469,022 Assets classified as held for sale 38(b) 20,426 20,426 - 51,684 51,684 - TOTAL ASSETS 1,009,157 433,880 575,277 1,002,756 533,734 469,022
Bank's credit print out did not comply with the requirements of the CBN prudential guideline.
The following table shows the analysis of the Group’s financial assets and liabilities and on the basis of their current/ non-current classification.
31 December 2014 31 December 2013
Details of the banking regulation which the Bank contravened during the year was as follows:
COD/DIR/GEN/CIT/05/031 Non compliance with cashless policyCode of corporate governance Non compliance with corporate governance code
(Section 5.3.6 and 8.2.4) Assessment Criteria for Approved Persons Regime for Financial Institutions dated June 21, 2011
Appointments to top management position without prior approval from CBN.

Union Bank of Nigeria Plc and Subsidiary CompaniesConsolidated and financial statements - 31 December 2014.
105
Group Carrying amount Current Non- current Carrying amount Current Non- current
N million N million N million N million N million N millionLIABILITIES
Derivative liabilities held for risk management 21 7 7 - - - - Deposits from banks 32 61,890 61,890 - 46,794 46,794 - Deposits from customers 33 527,617 527,548 69 482,706 482,666 40 Current tax liabilities 34 822 822 - 534 534 - Other liabilities 35 110,260 105,483 4,777 156,406 127,777 28,629 Retirement benefit obligations 36 845 131 714 10,261 10,261 - Other borrowed funds 37 78,135 36,398 41,737 45,280 8,146 37,134
779,576 732,279 47,297 741,981 676,178 65,803
Liabilities classified as held for sale 38(c) 7,347 7,347 - 61,432 61,432 - TOTAL LIABILITIES 786,923 739,626 47,297 803,413 737,610 65,803
Bank
Carrying amount Current Non- current Carrying amount Current Non- current
N million N million N million N million N million N millionASSETS
Cash and cash equivalents 18 58,457 58,457 - 53,141 53,141 - Non-pledged trading assets 19 745 745 - 2,847 2,847 - Pledged assets 20 83,935 29,279 54,656 65,167 5,787 59,380 Loans and advances to customers 22 302,372 152,485 149,887 210,118 129,339 80,779 Investments in equity accounted investee 23 - - - 16 - 16 Investment securities 24 193,656 87,947 105,709 290,377 202,489 87,888 Trading properties 25 1,930 - 1,930 1,930 - 1,930 Investment in subsidiaries 27 8,372 - 8,372 12,892 - 12,892 Property and equipment 28 49,428 2,854 46,574 45,351 2,899 42,452 Intangible assets 29 2,071 389 1,682 685 161 524 Deferred tax assets 30 95,875 - 95,875 95,875 - 95,875 Other assets 31 121,570 8,194 113,376 101,324 18,489 82,835
918,411 340,350 578,061 879,723 415,152 464,571 Assets classified as held for sale 38(b) 2,525 2,525 - 2,374 2,374 - TOTAL ASSETS 920,936 342,875 578,061 882,097 417,526 464,571
LIABILITIES
Deposits from banks 32 18,055 18,055 - 3,500 3,500 - Deposits from customers 33 507,431 507,424 7 482,005 482,005 - Current tax liabilities 34 635 635 - 495 495 - Other liabilities 35 109,861 105,084 4,777 145,478 111,488 33,990 Retirement benefit obligations 36 845 131 714 49,368 49,368 - Other borrowed funds 37 78,135 36,398 41,737 33,951 - 33,951
714,962 667,727 47,235 714,797 646,856 67,941
31 December 2014 31 December 2013
31 December 2014 31 December 2013

Union Bank of Nigeria Plc and Subsidiary CompaniesConsolidated financial statements for the year ended 31 Decenber 2014.
Together with Directors'and Auditors'Reports
106
Value Added StatementFor the year ended 31 Dec 2014
Group:Dec. 2014 Dec. 2013
N million % N million %
Gross earnings 135,903 121,402 Group share of associate's profit (6) (4) Interest expenses (27,211) (27,041)
108,686 94,357 Net impairment loss on financial assets (17,034) (22,507)
91,652 71,851 Bought in materials and services (30,897) (25,425)
Value added 60,755 100 46,426 100
Distribution:
Employee- Employees as personnel expenses 29,736 49 39,544 85
Government- Taxation 883 1 (67) (0)
Retained in the Group- For replacement of property and equipment and intangible assets 3,311 5 3,113 7 - Profit for the year (including non controlling interests) 26,825 44 3,836 8
60,755 100 46,426 100
Bank:Dec. 2014 Dec. 2013
N million % N million %
Gross earnings 109,821 103,225 Interest expenses (24,237) (23,918)
85,584 79,307 Net impairment loss on financial assets (7,671) (18,420)
77,913 60,887 Bought in materials and services (25,224) (15,107)
Value added 52,689 100 45,780 100
Distribution:
Employee- Employees as personnel expenses 28,754 55 38,519 84
Government- Taxation 205 0 (920) (2)
Retained in the Group- For replacement of property and equipment and intangible assets 3,244 6 3,060 7 - Profit for the year 20,486 39 5,121 11
52,689 100 45,780 100

Union Bank of Nigeria Plc and Subsidiary CompaniesConsolidated financial statements for the year ended 31 Decenber 2014.
Together with Directors'and Auditors'Reports
107
Financial summaryFor the year ended 31 Dec 2014Group
Restated RestatedSTATEMENT OF FINANCIAL POSITION Dec. 2014 Dec. 2013 Dec. 2012 Dec. 2011 Dec. 2010
N million N million N million N millionASSETSCash and cash equivalents 121,960 100,925 200,260 239,013 150,811 Non-pledged trading assets 745 2,847 1,895 5,863 9,516 Pledged assets 83,935 65,167 44,503 69,694 51,019 Derivative assets held for risk management 7 - 78 - - Loans and advances to customers 312,797 229,542 156,375 166,172 198,296 Investments in equity-accounted investee 24 25 5,557 75 6,588 Investment securities 197,200 289,353 313,754 269,666 343,091 Trading properties 1,930 4,747 6,971 - - Investment properties - 16,413 19,296 29,133 21,960 Property and equipment 49,521 45,527 48,466 50,533 58,229 Intangible assets 2,422 808 921 600 522 Deferred tax assets 95,883 95,889 95,349 95,349 68,403 Other assets 122,307 99,829 121,297 120,364 86,744 Assets classified as held for sale 20,426 51,684 84 807 1,404
1,009,157 1,002,756 1,014,806 1,047,269 996,583
LIABILITIESShare capital 8,468 8,468 8,468 8,468 6,755 Share premium 391,641 391,641 391,641 391,641 53,023 Reserves (183,213) (207,928) (226,762) (219,790) (187,161) Non-controlling interest 5,338 7,162 4,979 5,346 6,996 Derivative financial instrument 7 - 78 - - Deposits from banks 61,890 46,794 45,112 62,214 97,045 Deposits from customers 527,617 482,706 522,443 500,973 646,186 Liability on investment contract - - 803 569 225 Liability on insurance contract - - 2,691 2,644 2,734 Current tax liabilities 822 534 2,317 2,668 4,198 Other liabilities 110,260 156,406 178,587 206,200 161,775 Deferred tax liabilities - - - - - Retirement benefit obligations 845 10,261 49,886 59,386 55,048 Other borrowed funds 78,135 45,280 34,564 26,950 149,759 Liabilities included in discontinued operations 7,347 61,432 - - -
1,009,157 1,002,756 1,014,806 1,047,269 996,583
STATEMENT OF COMPREHENSIVE INCOME Dec. 2014 Dec. 2013 Dec. 2012 Dec. 2011 *Dec. 2010 N million N million N million N million N million
Net operating income 95,352 79,662 79,079 50,789 93,892 Group share of associates' profits (6) (4) 34 952 1,117 Exceptional item - - - - 59,836 Impairment losses on financial assets (9,651) (15,736) (1,767) (69,528) (37,164)
85,695 63,922 77,346 (17,787) 117,681 Operating expenses (58,724) (58,593) (73,004) (89,897) (81,227)
Profit before tax 26,971 5,329 4,342 (107,684) 36,454 Taxation (409) 933 (391) 25,133 70,018 Profit after tax 26,562 6,262 3,951 (82,551) 106,472
Profit for the year from discontinued operations 263 (2,426) (2,764) - - Profit for the period 26,825 3,836 1,187 (82,551) 106,472
Non-controlling interest 1,198 (1,621) (2,947) (4,883) (5,599) Profit attributable to equity holders 25,627 5,457 4,134 (77,668) 112,071
Earnings/(Loss) per share (basic) 151k 37k 24k (1266)k 830kEarnings/(Loss) per share (adjusted) 151k 37k 24k (1266)k 1827k

Union Bank of Nigeria Plc and Subsidiary CompaniesConsolidated financial statements for the year ended 31 Decenber 2014.
Together with Directors'and Auditors'Reports
108
Bank
STATEMENT OF FINANCIAL POSITION Dec. 2014 Dec. 2013 Dec. 2012 Dec. 2011 Dec. 2010 N million N million N million N million
ASSETSCash and cash equivalents 58,457 53,141 142,938 84,658 52,309 Non-pledged trading assets 745 2,847 867 2,851 7,385 Pledged assets 83,935 65,167 44,503 69,694 51,019 Derivative assets held for risk management - - - - - Loans and advances to customers 302,372 210,118 136,982 144,358 172,140 Investments in equity-accounted investee - 16 91 75 75 Investment securities 193,656 290,377 280,449 246,725 324,845 Assets classified as held for sale 2,525 2,374 84 807 1,404 Trading properties 1,930 1,930 2,282 - - Investment properties - - - - - Investment in subsidiaries 8,372 12,892 17,445 19,279 16,697 Property and equipment 49,428 45,351 45,137 46,567 53,827 Intangible assets 2,071 685 522 109 33 Deferred tax assets 95,875 95,875 95,875 95,875 68,944 Other assets 121,570 101,324 119,293 116,155 89,927
920,936 882,097 886,468 827,153 838,604
LIABILITIESShare capital 8,468 8,468 8,468 8,468 6,755 Share premium 391,642 391,641 391,641 391,641 53,023 Reserves (194,136) (212,326) (228,438) (221,207) (202,813) Deposits from banks 18,055 3,200 3,500 1,580 32,028 Deposits from customers 507,431 479,956 482,005 399,775 598,922 Liability on investment contract - - - - - Liability on insurance contract - - - - - Current tax liabilities 635 472 495 1,358 2,609 Deferred tax liabilities - - - - - Other liabilities 109,861 155,189 145,478 159,960 143,204 Dividend payable - - - - - Retirement benefit obligations 845 10,216 49,368 58,628 54,119 Other borrowed funds 78,135 45,280 33,951 26,950 150,757
920,936 882,097 886,468 827,153 838,604
STATEMENT OF COMPREHENSIVE INCOME Dec. 2014 Dec. 2013 Dec. 2012 Dec. 2011 *Dec. 2010 N million N million N million N million N million
Net operating income 85,584 79,307 73,867 39,942 81,102 Exceptional item - - - - 59,836 Impairment losses on financial assets (7,671) (18,420) 470 (69,367) (29,291)
77,913 60,887 74,337 (29,425) 111,647 Operating expenses (57,222) (56,686) (70,899) (73,208) (64,209)
Profit before tax 20,691 4,201 3,438 (102,633) 47,438 Taxation (205) 920 (268) 25,922 70,578 Profit after tax 20,486 5,121 3,170 (76,711) 118,016
Earnings/(Loss) per share (basic) 121k 30k 19k (1251)k 874kEarnings/(Loss) per share (adjusted) 121k 30k 19k (1251)k 1924k
* - Information relating to these years have been presented based on a different financial reporting framework, Statement of Accounting Standards (Nigerian GAAP), and is therefore not directly comparable .