confidence intervals kuramoto - vch research institute · pdf fileconfidence intervals lisa...
TRANSCRIPT

Confidence Intervals
Lisa KuramotoCentre for Clinical Epidemiology and
Evaluation
Overview
Outline• Background• Confidence intervals (CIs)• Examples
Learning objectives• to understand CI construction• to be able to name 3 factors that affect CIs• to be able to interpret CIs found in literature

Background
Terminology
• population
• sample
group of individuals or objects that we would like to study
subset of a population
BackgroundTerminology
•
•
•process of drawing conclusions about a population based on observations in a sample
an estimate of the population parameter
a quantity that describes a populationpopulation parameter
sample statistic
statistical inference
⎪⎪⎭
⎪⎪⎬
⎫
⎪⎪⎩
⎪⎪⎨
⎧
ρπσ
μ2
⎪⎪⎭
⎪⎪⎬
⎫
⎪⎪⎩
⎪⎪⎨
⎧
rpsX
2
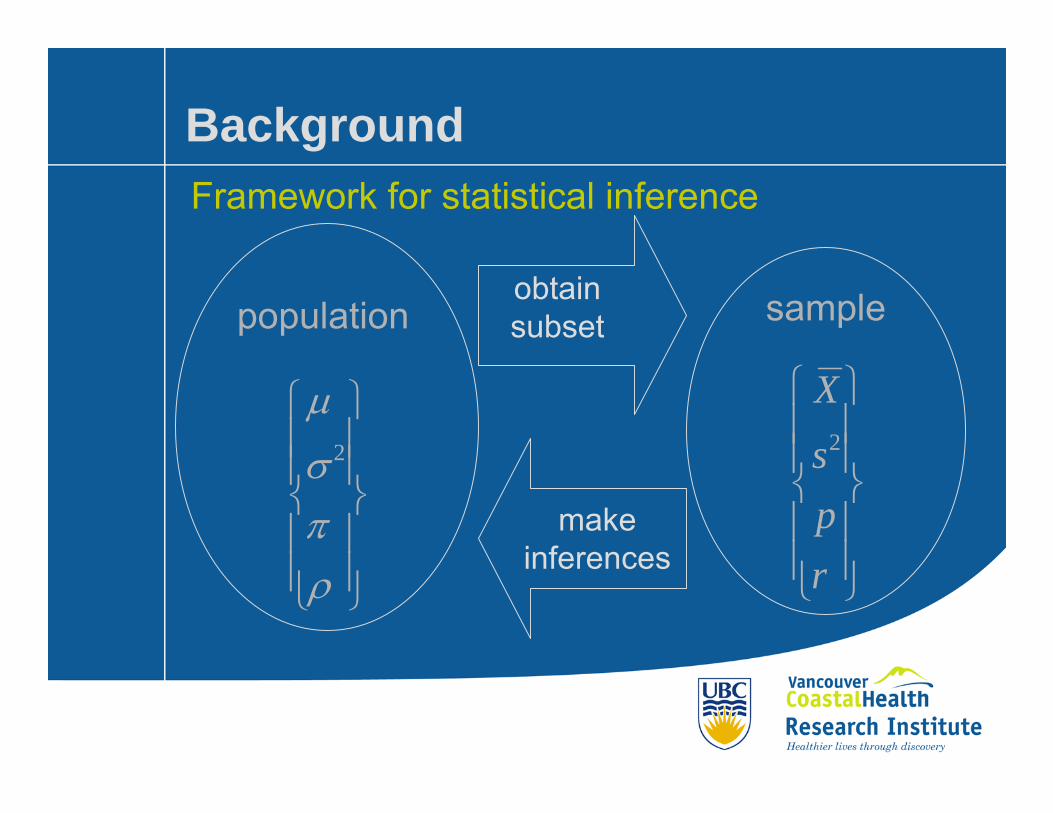
population sample
make inferences
obtain subset
Framework for statistical inference
Background
Background
Terminology
• point estimatea to estimate a population parameter
• interval estimatea to estimate a population parameter
single value
range of values

Confidence intervals
MotivationWe know:• not practical to measure entire population, so take a
random sample• there is random error
We want to:• summarize information on effect size and variability• infer statistically significant results
Confidence intervals
Definitions
• confidence interval, CIa range of values that probably contains the population value
• confidence limitsthe values that state the boundaries of the confidence interval
Confidence intervals
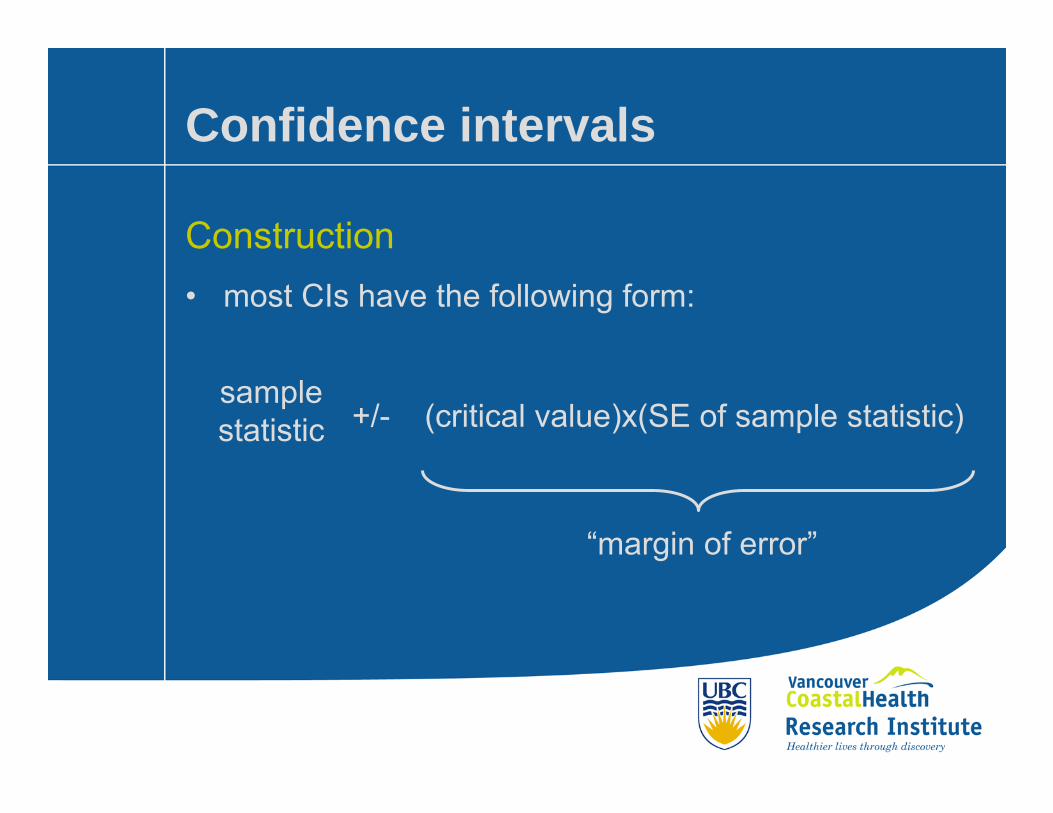
Construction• most CIs have the following form:
sample statistic +/- (critical value)x(SE of sample statistic)
“margin of error”
Confidence intervalsConstruction• the critical value represents the desired
based on distribution theory
• the sample statistic is a point estimate based on data
• the SE of sample statistic is a measure of based on data
confidence level
variability
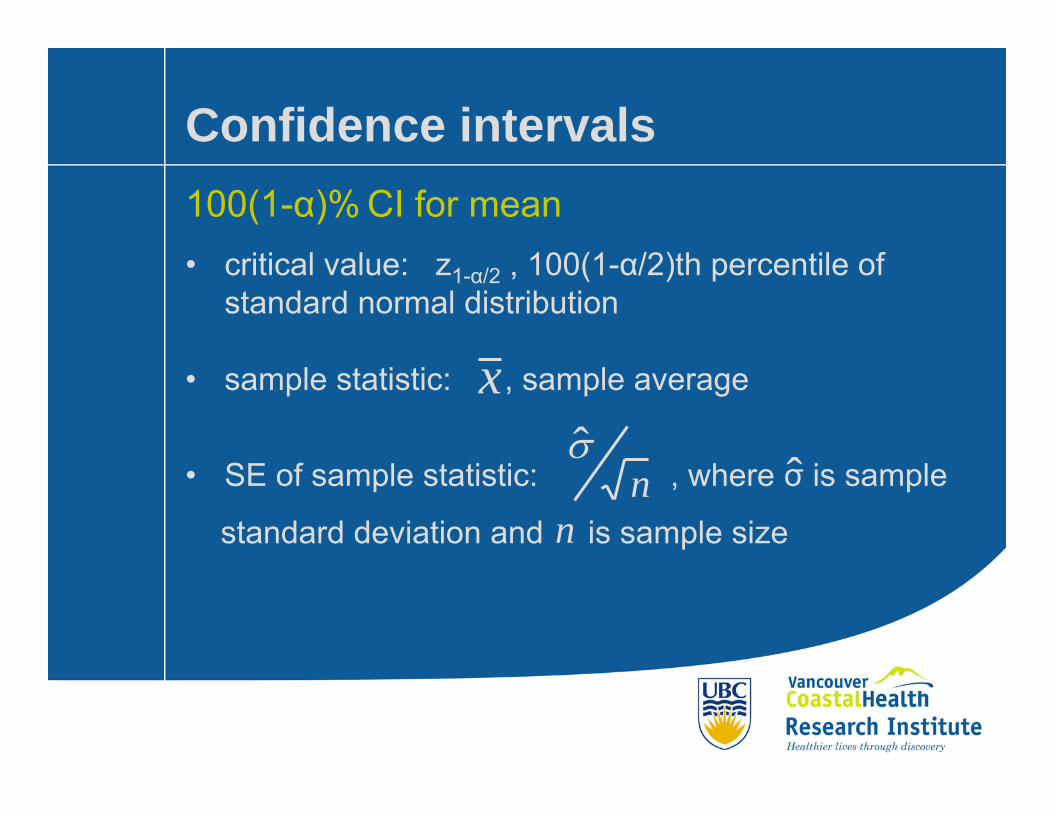
Confidence intervals100(1-α)% CI for mean• critical value: z1-α/2 , 100(1-α/2)th percentile of
standard normal distribution
• sample statistic: , sample average
• SE of sample statistic: , where σ is sample
standard deviation and is sample size
x
nσ
ˆˆ
n
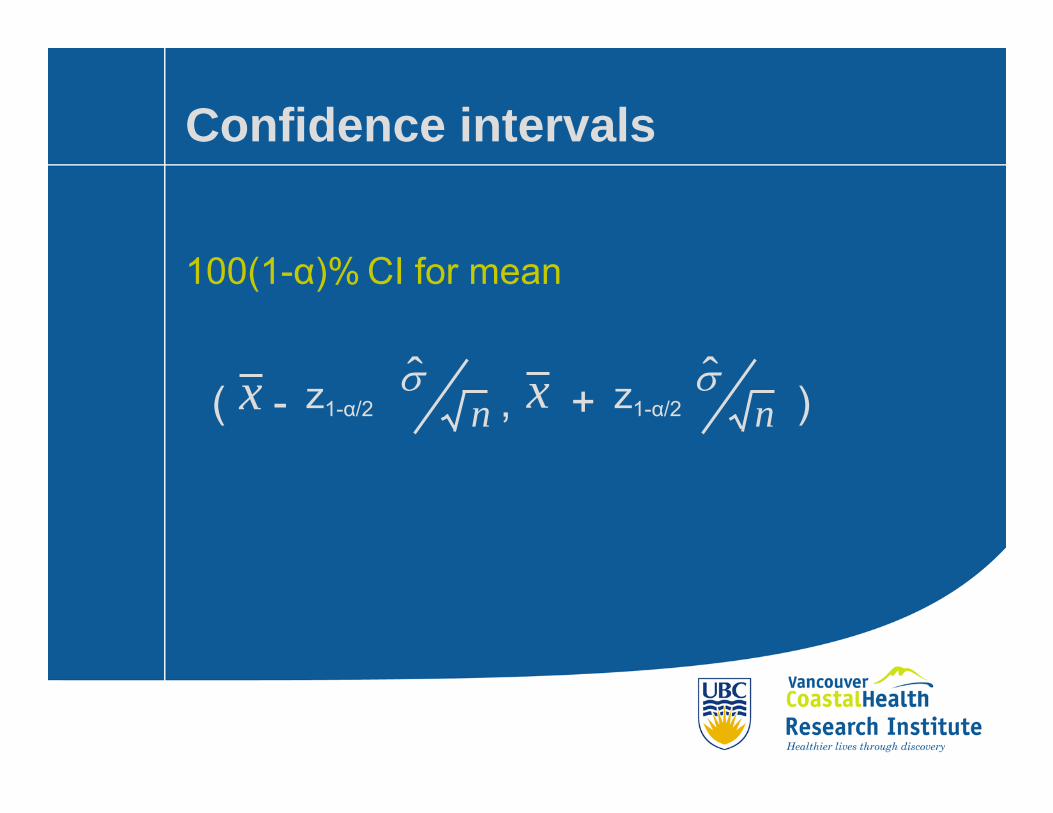
Confidence intervals
100(1-α)% CI for mean
( - , + )x nσz1-α/2 x z1-α/2
σn
ˆ ˆ
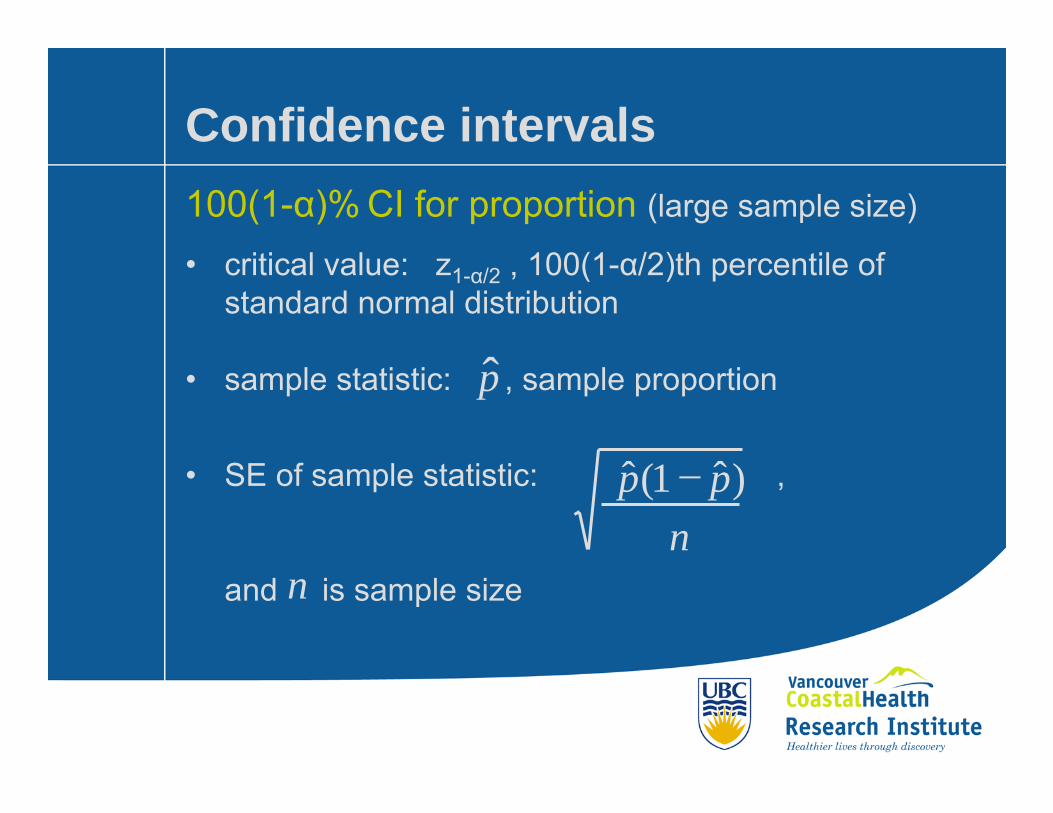
Confidence intervals100(1-α)% CI for proportion (large sample size)
• critical value: z1-α/2 , 100(1-α/2)th percentile of standard normal distribution
• sample statistic: , sample proportion
• SE of sample statistic: ,
and is sample size
ˆ
npp )ˆ1(ˆ −
p
n
pp
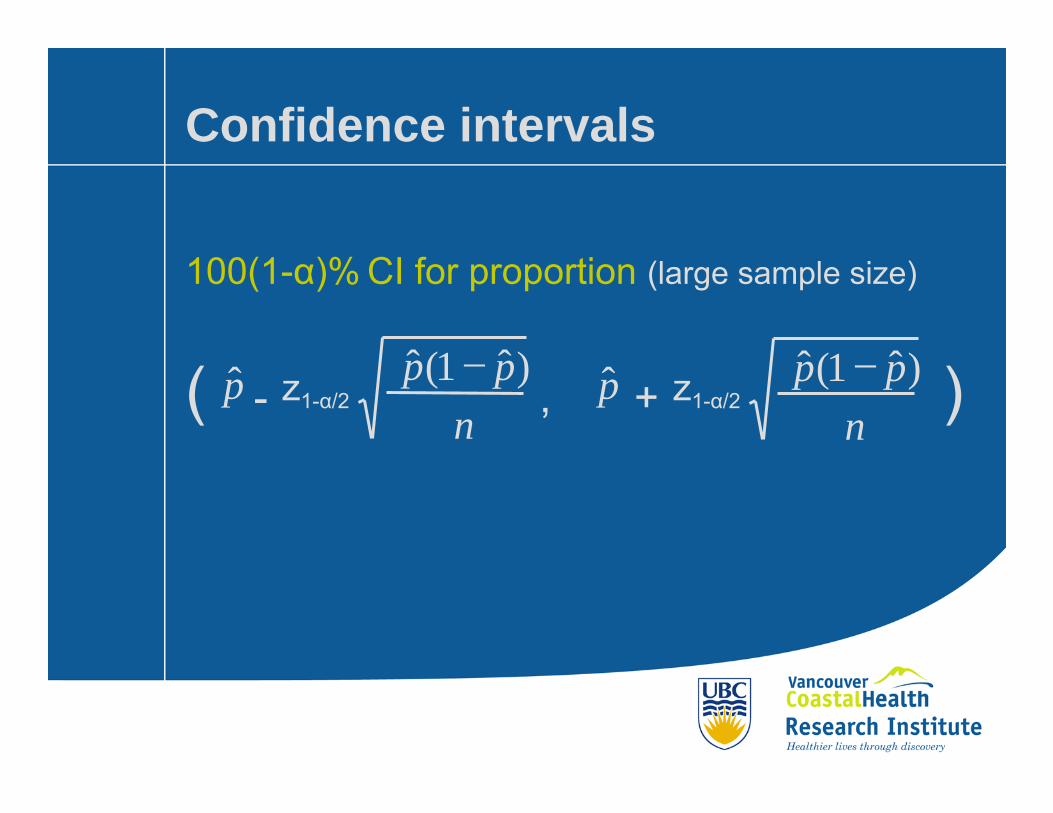
Confidence intervals
100(1-α)% CI for proportion (large sample size)
( - , + )z1-α/2 z1-α/2n
pp )ˆ1(ˆ −
npp )ˆ1(ˆ −ˆ ˆ
Example: scenarioConstruction example
Suppose that you would like to know the effect of a newly developed drug (drug A) and a current drug (drug B) on systolic blood pressure (sbp).
You would like to know the effect of drug A.
What information do we need?

Examplepopulation
Q: What is the population parameter?A: mean sbp, μ
Examplesample
Q: What is the sample statistic?A: The average sbp among drug A and drug B patients
was 107 mmHg and 125 mmHg, respectively.So, = .x 107 mmHg
Exampleconfidence level & critical value
Q: What is desired confidence level?A:
Q: What is the critical value?A:
95% CI, so 1-α = 0.95 and α = 0.05
z1-α/2 = 1.96
Examplevariability
Q: What was the variability of the data?A: The estimated standard deviation of sbp among
drug A and drug B patients was 19 mmHg and 20 mmHg, respectively.
Q:How many patients were sampled?A: You took a random sample of 35 patients on drug A
and 35 patients on drug B.So, .n = 35
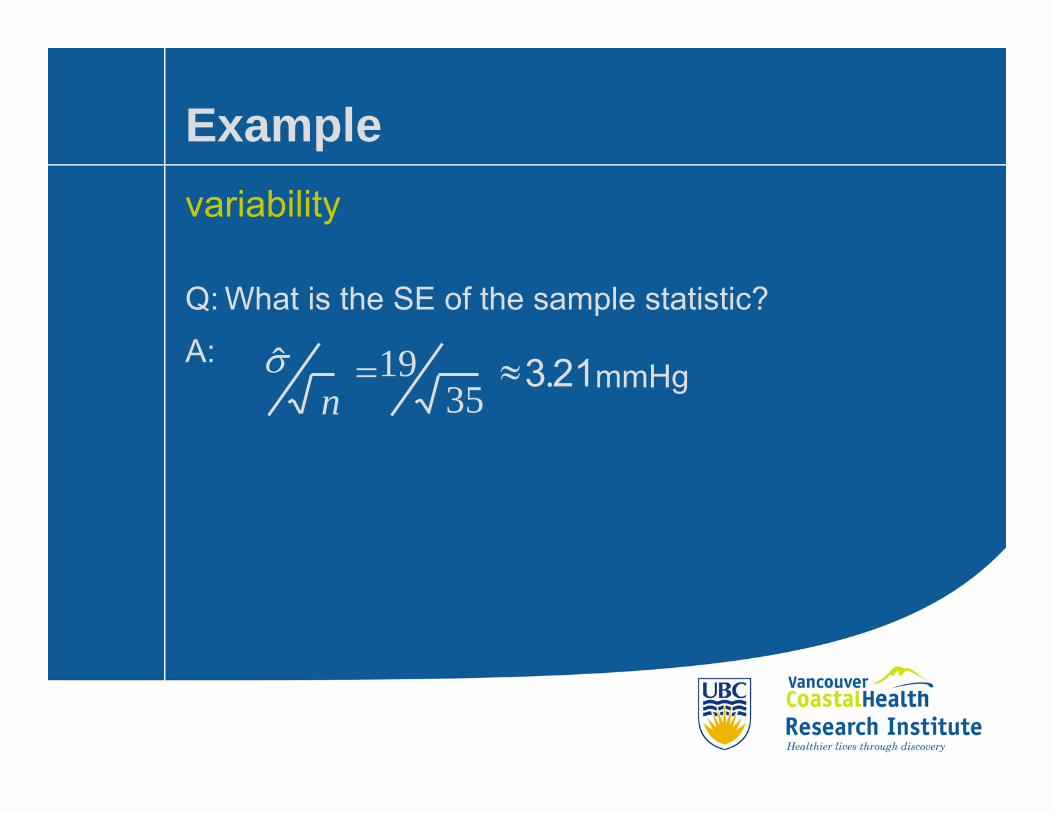
Examplevariability
Q: What is the SE of the sample statistic?A:
mmHgn
21.335
19ˆ ≈=σ
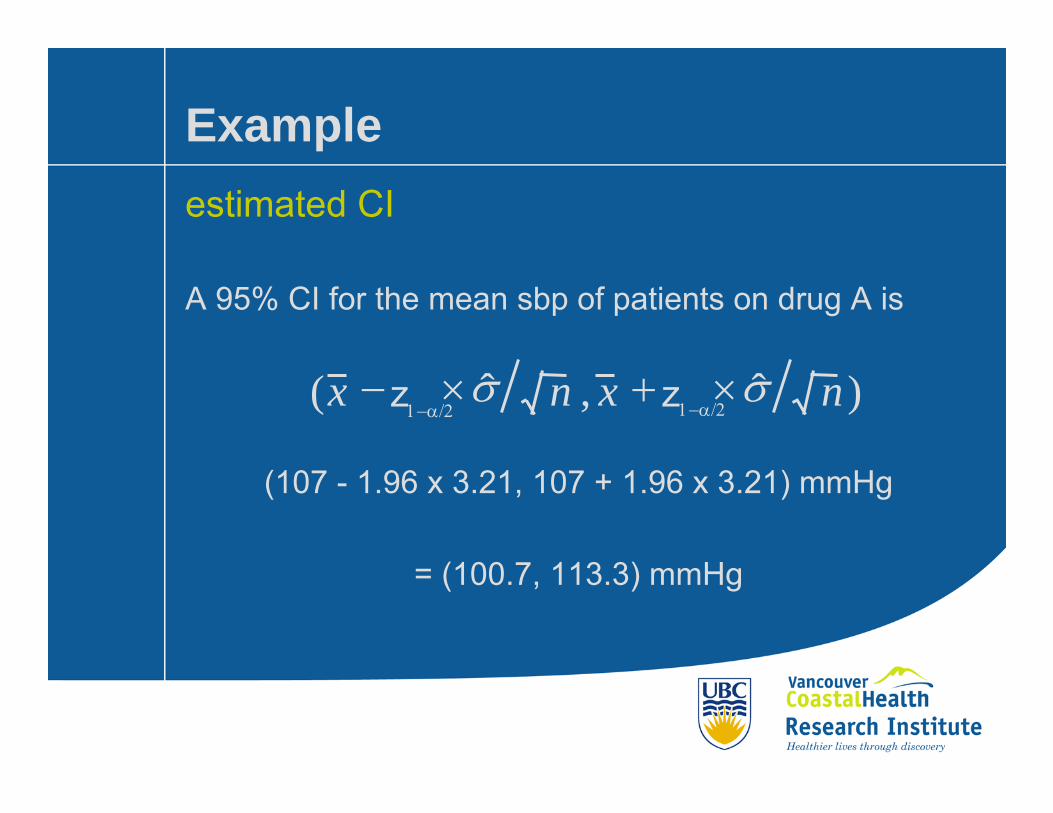
Exampleestimated CI
A 95% CI for the mean sbp of patients on drug A is
(107 - 1.96 x 3.21, 107 + 1.96 x 3.21) mmHg
= (100.7, 113.3) mmHg
)ˆ,ˆ( nzxnzx σσ ×+×−1−α/2 1−α/2
Example: follow-upExercise
What is a 95% CI for mean sbp of patients on drug B?
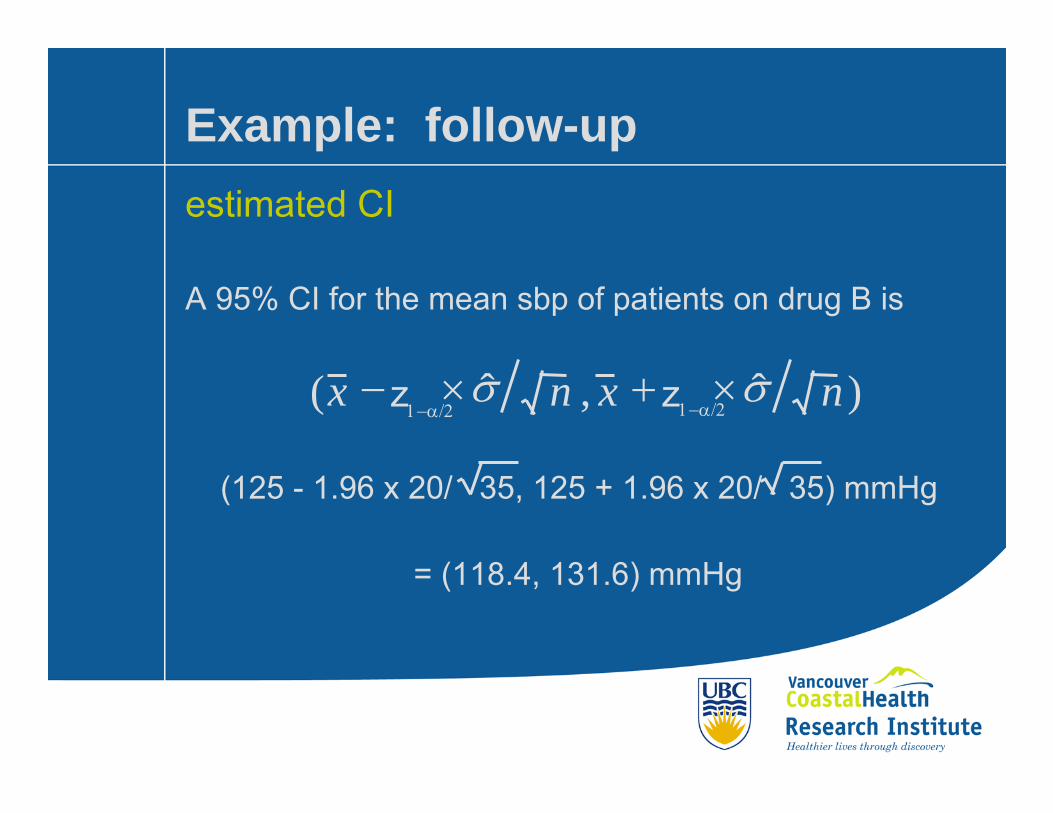
Example: follow-upestimated CI
A 95% CI for the mean sbp of patients on drug B is
)ˆ,ˆ( nzxnzx σσ ×+×−
(125 - 1.96 x 20/ 35, 125 + 1.96 x 20/ 35) mmHg
= (118.4, 131.6) mmHg
1−α/2 1−α/2

ExampleGraphing CIs
100 110 120 130 140
100 110 120 130 140
mmHg
mmHg
drug A
drug B
CIs and influencing factorsFactors that affect the width of a CI are:•
•
•
desired confidence level, 1-α
sample size, n
variability or standard deviation, σ
CIs and influencing factorsDesired confidence level, 1-α• intuition: a higher confidence level without improving
data quality means a margin of error
• as the desired confidence level increases, the confidence interval width , given all other quantities remain fixed
larger
increases
CIs and influencing factorsSample size, n• intuition: a larger sample size means more
information, which implies inference
• as the sample size increases, the confidence interval width , given all other quantities remain fixed
better
decreases
CIs and influencing factorsVariability/Standard deviation, σ• intuition: more variability or larger spread means
difficult to estimate population value without large amounts of data
• as the variability/standard deviation increases, the CI width , given all other quantities remain fixed
more
increases
InterpretationThought experiment• Imagine taking many samples of equal size and
constructing 95% CIs
InterpretationThought experiment observations• the population value is fixed
• some CIs contain the population value and some do not
• about 95% of the CIs contain the population value
InterpretationProper interpretation of 95% CI• the probability that the CI contains the population
value is 0.95
• “Our estimate is sample estimate. This result is accurate to within margin of error, 19 times out of 20.”
Improper interpretation of 95% CI• the probability that the population value lies within
the CI is 0.95
InterpretationNotes• assume measurements are not biased (ie. no
systematic error)
• statistical significance does not imply clinical significance
LiteratureBerry, et al. (2003).• population parameter?
• confidence interval?
• width of confidence intervals?
• overlap of confidence intervals?
References• Berry, MJ, et al. (2003). A Randomized, Controlled
Trial Comparing Long-term and Short-term Exercise in Patients with Chronic Obstructive Pulmonary Disease. Journal of Cardiopulmonary Rehabilitation. 23:60-68.
• Norman, GR and Streiner, DL. (2005). Biostatistics: The Bare Essentials 2E. Hamilton: BC Decker.