competitive dynamics in forecasting: the interaction of...
TRANSCRIPT
Competitive dynamics
1
Running head: COMPETITIVE DYNAMICS
Competitive dynamics in forecasting: The interaction of skill and uncertainty
Theodoros Evgeniou
Lily Fang
Robin M. Hogarth
Natalia Karelaia
In press, Journal of Behavioral Decision Making
Author Note
Theodoros Evgeniou, INSEAD, Fontainebleau, France; Lily Fang, INSEAD, Singapore;
Robin M. Hogarth, ICREA & Universitat Pompeu Fabra, Barcelona, Spain; Natalia Karelaia,
INSEAD, Fontainebleau, France.
The authors appreciate the insightful comments on earlier versions of this paper by Gilles
Hilary, Joro Kolev, two anonymous reviewers, and the editor. Hogarth's work was supported
by Spanish Ministerio de Ciencia e Innovación Grant ECO2009-09834.
The authors’ names are listed alphabetically. Correspondence concerning this article
should be addressed to Natalia Karelaia, INSEAD, Boulevard de Constance, 77305
Fontainebleau, France, phone: + 33 1 6072 4511, fax: + 33 1 60 74 55 00, e-mail:
Competitive dynamics
2
Abstract
The outcomes in many competitive tasks depend upon both skill and luck. Behavioral
theories on risk-taking in tournaments indicate that low-skill individuals may have
incentives to take more risks than high-skill ones. We build on these theories and suggest, in
addition, that when luck is more important in determining outcomes, the increase in risk
taking is larger for low- than high-skill individuals. We test this hypothesis by analyzing
stock analysts’ forecasts of companies’ earnings per share under market conditions that vary
in volatility and thus imply different levels of luck in outcomes. Specifically, noting that
forecasts that deviate widely from the consensus—which is observable by the analyst—
potentially carry career-related rewards but also reputational risks, we examine the degree of
deviation from consensus exhibited by analysts of different skill levels (measured by both
past forecasting accuracy and education) in different market conditions. We find that
average deviations from consensus increase as markets become more volatile. At the same
time, under conditions of high volatility, low-skill analysts exhibit larger increases in
deviations from consensus than high-skill analysts. These field data results support our
hypothesis based on risk-taking in tournaments. We discuss alternative interpretations such
as, for example, self-serving attributions, and indicate directions for future research.
Keywords: Risk taking, skill, chance, uncertainty, contests, financial analysts, earnings
forecasts.
Competitive dynamics
3
Competitive dynamics in forecasting: The interaction of skill and uncertainty
Outcomes of many decisions depend on both skill and luck and illuminating their relative
contributions has long attracted attention in the psychological literature (e.g., Atkinson, 1957;
Cohen & Dearnley, 1962; Langer, 1975). Heath and Tversky (1991), for example, have
investigated whether greater levels of uncertainty increase risk taking. Our goal in this paper
is to contrast agents’ attitudes toward risk under conditions that vary in uncertainty, and how
changes in such attitudes differ depending on the agents’ skill level. In other words, do low-
skill agents become more or less willing to take risks relative to high-skill agents when
uncertainty increases?
To do this, we study the behavior of stock analysts making forecasts of companies’
earnings per share (EPS). We capture uncertainty (and hence the level of luck in outcomes)
by the volatility of the companies’ stock returns, and we measure analyst skill using two
proxies. Our primary proxy is the analysts’ track record: the accuracy of their past forecasts.
As a second proxy, we use the analysts’ education; specifically, whether they attended top
universities. The behavioral risk taking we focus on is the extent to which the analysts’
forecasts deviate from the consensus—which the analysts can observe. As we explain below,
these deviations carry potentially important reputational risks as well as rewards for analysts
and, as such, provide insight into their attitudes toward risk.
FOLLOWING THE CROWD OR STANDING OUT?
Stock analysts play a key role in collecting, analyzing, and disseminating company
information to investors, and making EPS forecasts is an integral part of this process. Much
work in finance and accounting shows that analysts’ forecasts provide market-relevant
information that can move stock prices (e.g., Clemens & Tse, 2003; Gleason & Lee, 2003).
The analyst profession is characterized by high monetary stakes and asymmetric payoffs, two
Competitive dynamics
4
features that make this setting resemble a tournament and relevant for studying attitudes
toward risk taking. Winners—those relatively few analysts who make accurate forecasts and
good stock calls—become stars and garner multimillion dollar pay packages on Wall Street.
The rest try to keep their jobs in a highly competitive labor market. Thus analysts have strong
incentives to establish reputations for being “smart” and making accurate forecasts is
important for this (Fang & Yasuda, 2009, 2011; Hong, Kubic, & Solomon, 2000).
On the other hand, because investors value unique viewpoints, analyst “boldness”—
saying something different from the crowd—is rewarded, provided, of course, that it is
accurate (Hong, Kubic, & Solomon, 2000). For example, when in 2007 Meredith Whitney
bucked the trend and downgraded banking stocks to “sell” (in hindsight the right call), she
won star status and a loyal following among investors. In this context, the “boldness” of an
analyst’s forecast can be measured, as in the literature, by its deviation from the consensus,
which the analyst can observe since forecasts are published and not made simultaneously. In
the finance and economics literature, deviation from the crowd is often referred to as anti-
herding or exaggeration. In contrast, herding refers to the tendency for agents to mimic their
peers (Avery & Chevalier, 1999; Clement & Tse, 2005; Hong et al., 2000; Scharfstein & Stein,
1990; Trueman, 1994; see also Avci, Loufti, Mihm, & Keck, 2011).
In the context of EPS forecasts, analysts differ in skill, a term we use broadly to
include ability and knowledge. For example, some analysts may have more relevant
experience than others (Clement, 1999; Mikhail, Walther, & Willis, 1997), are more
resourceful (Clement, 1999; Fang & Yasuda, 2009), or even more closely connected with
company insiders (Cohen, Frazzini, & Malloy, 2010). In short, they are better at obtaining
and/or processing information that helps them uncover the “true value” of the firms they
analyze. Empirically, an extensive body of work uses analysts’ track records, i.e., their past
Competitive dynamics
5
forecasting accuracy as a measure of skill (e.g., Clement & Tse 2005; Cooper, Day, & Lewis,
2001; Fang & Yasuda, 2009; Hong, Kubic, & Stein, 2000).
When analysts differ in skill, reputational concern predicts that low-skill analysts will
have an incentive to herd for two reasons. First, almost by definition, low-skill analysts do
not have insights that are superior to the rest; thus the consensus may simply be more accurate
than the analyst’s own forecast (Scharfstein & Stein, 1990; Trueman, 1994). Second, as John
Maynard Keynes wrote in the General Theory, “Worldly wisdom teaches that it is better for
reputation to fail conventionally than to succeed unconventionally” (Keynes, 1965, p. 158).
Similarly, literature in decision making suggests that relying on “the wisdom of crowds”
(Surowiecki, 2004) by following the consensus is probably the most advisable strategy for
decision makers who lack information about the event to be forecast (Armstrong, 2001;
Clemen, 1989; Hogarth & Karelaia, 2007; Karelaia, 2006; Larrick, Mannes, & Soll, 2011).
On the other hand, a bold call may not be so risky for high-skill analysts whose views
might be justified by access to specific information or a unique insight. In addition, Heath and
Tversky (1991, p. 8) argue that “competence or expertise … helps people take credit when
they succeed and sometimes provides protection against blame when they fail.” That is,
experts can, on occasion, attribute failure to chance, while attributing success to knowledge.
In sum, making bold forecasts is a risky move, particularly for low-skill analysts.
Thus, reputational concerns imply that low-skill analysts would be more prudent than their
more knowledgeable peers by making forecasts that deviate less from the consensus. Theories
on competition in tournaments, however, make a different prediction.
RISK TAKING IN CONTESTS
As discussed above, the analyst profession is a competitive labor market with high
monetary stakes and asymmetric payoffs. A small set of successful analysts (either by skill or
by luck) make millions of dollars per year while the rest try to hang on to their jobs. For

Competitive dynamics
6
example, a key indicator of success for an analyst is to be named an all-star analyst by
institutional investors such as mutual funds and hedge funds through opinion polls. The
influential Institutional Investor magazine conducts one such poll and awards the so-called
“All-American” title to the winners. Fewer than 8% of all analysts ever attain the All-
American title, and fewer than 2% ever get named as the top analyst in his or her industry
(Fang & Yasuda, 2009, 2011). The average All-American makes $1.5 million a year, three
times the compensation of the average senior analyst (with over 5 years of experience). Some
top analysts are reported to make $15-20 million per year.
Thus, this set-up is similar to the tournament or contest paradigm where agents’
rewards depend on their performance relative to competitors. Various scholars have suggested
that in such contests, players can enhance their chances of success by increasing the
variability of their responses. March (1991, p. 83) states that, “In competition to achieve
relatively high positions, variability plays a positive effect.” Gaba, Tsetlin, and Winkler (2004)
show theoretically that a riskier performance distribution is preferred in contests with a low as
opposed to high proportion of winners. As Gaba et al. (2004) suggest, increasing variability
is possible in many types of contests. For example, an academic seeking tenure can choose to
work on a potentially high-impact but harder—and thus riskier—problem. Financial analysts
can adopt riskier forecasting strategies by deviating further from consensus.
How does skill affect risk taking in contests? Tsetlin, Gaba, and Winkler (2004)
compare “weak” and “strong” agents—as defined by past performance—in various multi-
round contests. They show that to maximize the probability of a positive outcome, weak
agents should maximize the variability of their performance distribution (i.e., take more risks),
while strong agents should minimize it (i.e., pursue a low-risk strategy). In a similar vein,
Cabral (2003) models R&D races where firms compete to develop new products and shows
Competitive dynamics
7
that contestants with poor past performance should prefer high-risk strategies while their
better performing peers should be more prudent.
These results suggest that, in a competitive environment, low-skill analysts might have
an incentive to take more risks—i.e., to make forecasts that deviate more from the
consensus—than their high-skilled peers. Such a high-variance strategy will at least give them
a bigger chance of standing out from the crowd, which is associated with large rewards (if
they are lucky and ex-post “correct”). Indeed, some empirical evidence corroborates this idea.
Mutual fund managers who lag behind their competitors in a given period have been observed
to increase the riskiness of their portfolios in the next period in attempts to outperform
competitors (Chevalier & Ellison, 1997). Similarly, Denrell and Fang (2010) use data from
the Wall Street Journal survey of economic forecasts to illustrate that poor forecasters make
more extreme predictions and, as a result, ex post are overrepresented among those who are
able to see “the next big thing.”
INTERACTION BETWEEN SKILL AND UNCERTAINTY
The above discussions indicate that low-skill analysts may deviate more or less from
consensus than their high-skill peers. On the one hand, research on reputational concerns (e.g.,
Scharfstein & Stein, 1990; Trueman, 1994) predicts that they deviate less. On the other hand,
theories on contests (e.g., Tsetlin et al., 2004) generate the opposite prediction.
Our contribution is to suggest that the willingness of analysts to deviate from
consensus may change as the level of uncertainty they face increases, and moreover, that this
change is more pronounced for low-skill analysts. We argue that when markets are calm,
deviations from consensus by low-skill analysts are highly salient and, if these forecasts are
inaccurate—which is likely—deviations will be costly since they are easily characterized as
foolish. In these conditions, there is little incentive to issue extreme forecasts that deviate a lot
Competitive dynamics
8
from consensus. On the other hand, in volatile markets, extreme predictions are far less
salient per se and thus, for low-skill analysts, easier to defend—to themselves or others.
For high-skill analysts, we would also expect increasing deviations from consensus as
market volatility increases. However, since their judgments involve more skill than their low-
skill colleagues, we would not expect disproportionately large increases in deviations from
consensus when uncertainty rises. The following hypothesis summarizes our reasoning:
Hypothesis: Compared to highly skilled analysts, low-skill analysts exhibit a greater
increase in their deviation from consensus in high-uncertainty periods relative to low-
uncertainty periods.
As we point out in the Discussion section (below), this hypothesized effect is
consistent with various alternative explanations. It is important to note, however, that
deviations from consensus also capture the variability in analysts’ forecasts. How might
variability differ among low-skill and high-skill analysts in periods of low and high market
volatility? Research in psychology (in both field and laboratory settings) suggests that the
variability in human predictive judgments matches the variability experienced in the
environment (Brehmer, 1976). This matching hypothesis suggests two effects. First, we
would expect greater variability in predictions in periods of high as opposed to low volatility
for both skill types. Second, since low-skill analysts generally know less than high-skill
analysts, we expect that, as a group, the forecasts of the former will exhibit more variability
than those of the latter. That is, there should be more variability in the forecasts of low-skill
analysts compared to high-skill analysts, in conditions of both low and high market volatility.
What the matching hypothesis does not predict is that in high-volatility conditions we will
observe additional variability by low-skill analysts.
The existing literature has not considered how analysts’ degree of deviation from
consensus changes when the volatility of financial markets—and thus uncertainty—increases.
Competitive dynamics
9
The domain of financial analysts provides a unique opportunity to use field data to investigate
the interactive effect of uncertainty and analysts’ skill on their deviation from consensus. We
use an extensive dataset to test our hypothesis that heightened uncertainty in the environment
triggers a greater behavioral change—as measured by deviation from consensus—in low-skill
analysts as compared to their high-skill peers. Our dataset includes all quarterly EPS
forecasts made by 4,732 stock analysts from 1990 to 2009 for all US stocks covered by these
analysts. Using two measures of analyst skill—the track record of past forecast accuracy
(over the past three years) and education, our main prediction is validated: namely, low-skill
analysts (those with poor past track records or those who did not attend prestigious
universities) exhibit larger increases in deviations from consensus in volatile relative to calm
markets as compared to high-skill analysts.
Our results on the interaction between uncertainty and skill in forecasting provide a
three-fold contribution. First, we add to the literature on judgment and decision making under
uncertainty by showing the interplay of uncertainty and skill using large-scale field data.
Second, we contribute to the literature on behavior in contests since financial analysts operate
in an environment characterized by fierce competition. Third, this study enriches the finance
literature on the behavior of high- and low-skill analysts by demonstrating that uncertainty (as
measured by market volatility) plays an important role in distinguishing the quality of
forecasts issued by the two types.
METHOD
Data
We used quarterly Earnings per Share (EPS) forecast data from I/B/E/S for the period
from January 1, 1990 to December 31, 2009. We performed data pre-processing steps
common in the literature that uses this type of data (e.g., Clement & Tse, 2005; Hilary &
Menzly, 2006; Hong et al., 2000). In particular, we only kept forecasts made during the same
Competitive dynamics
10
quarter of the company announcement. We removed forecasts reported after the company
announcement. All actual and predicted quarterly EPS were divided by the average stock price
of the company during the quarter, and multiplied by 100. Hence, all EPS, forecasted and
actual, were “dollars earned/lost per 100 dollars.” We only used company quarters if the
average stock price during the quarter is more than five dollars, and we only used the last EPS
forecast of each analyst in each quarter. We also controlled for the number of days left from
the time of this last company forecast of the analyst in the quarter till the company
announcement date. Finally, we removed outliers defined as company quarters for which at
least one analyst had a forecast error larger than 40 (hence more than 40 dollars per 100
dollars) – which was the 99th percentile of the maximum forecast error during a calendar
quarter.
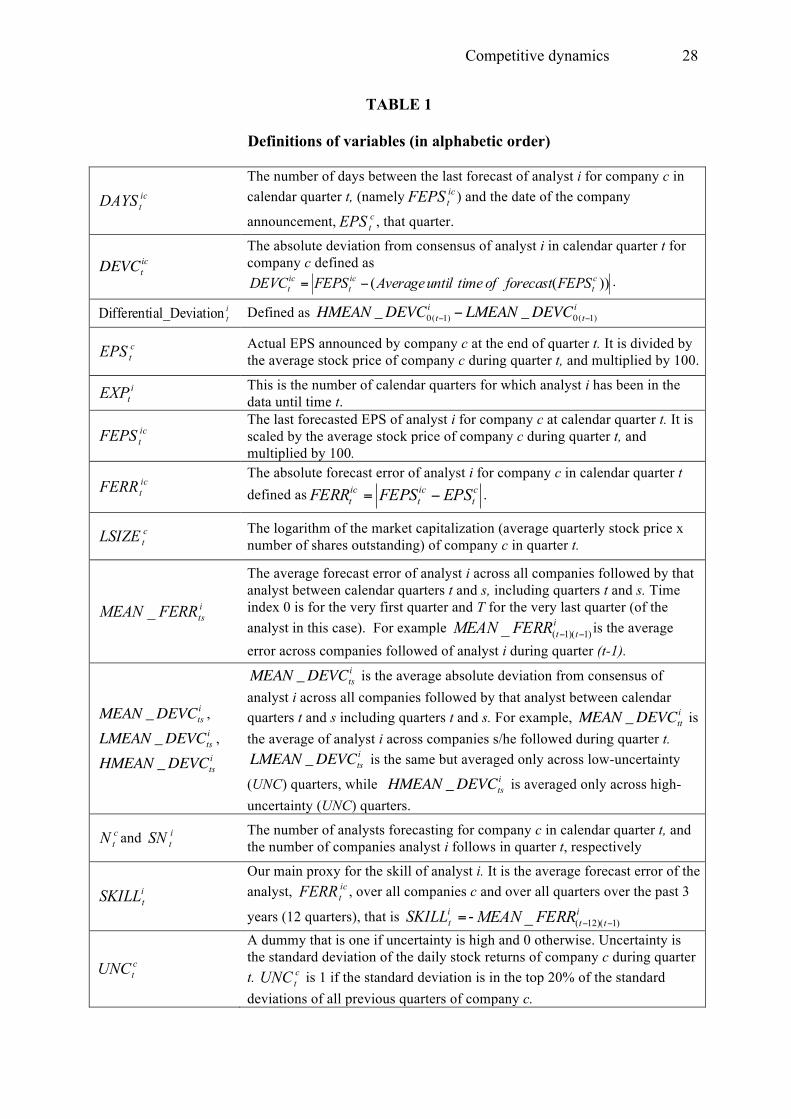
Definitions of the variables used in the analysis appear in Table 1. We defined
“deviation-from-consensus” as the absolute difference between an analyst’s EPS forecast and
the mean EPS forecasts made prior to this analyst’s forecast during the same quarter for the
same firm. In other words, it is the distance between an analyst’s forecast and the consensus
that the analyst can observe at the time of making his/her own forecast.
To have reliable estimates of deviation-from-consensus we only considered company
quarters where we had at least five analysts, as also done in the literature (e.g., Hilary &
Menzly, 2006; Hong et al., 2000). Varying this threshold did not alter the results qualitatively.
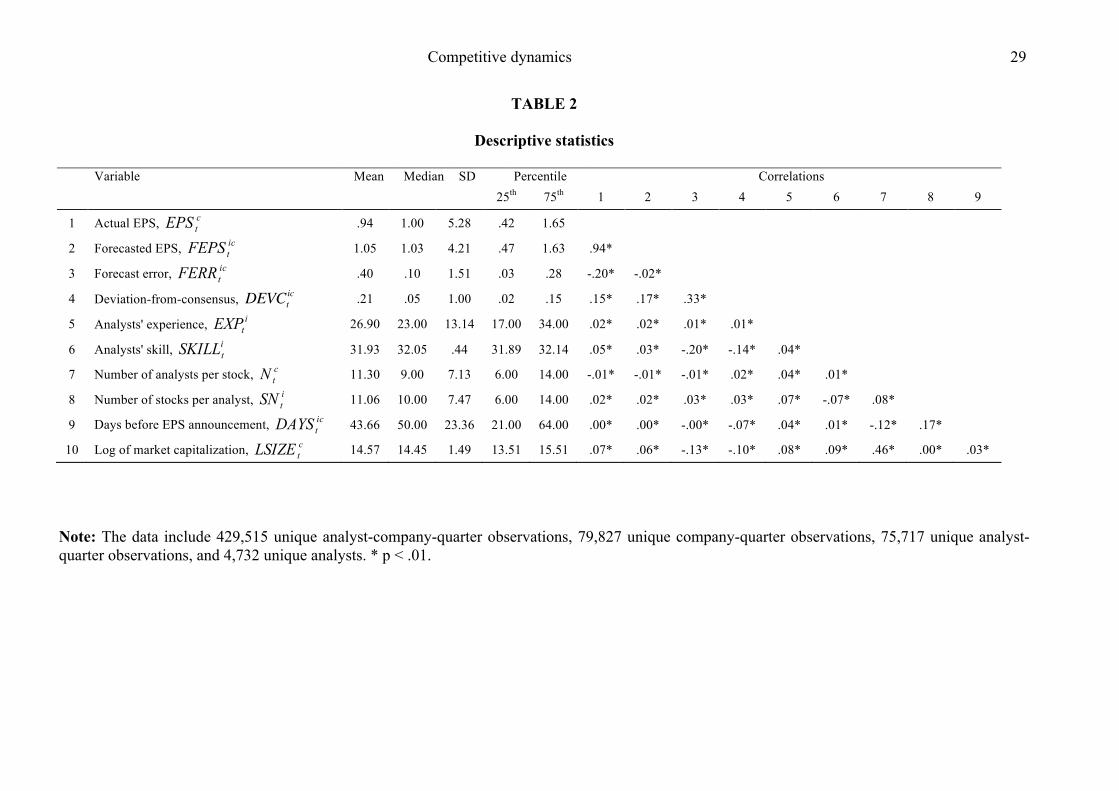
We defined the forecast error of an analyst for a company in a quarter to be the absolute
difference between the forecasted and actual EPS. Means, standard deviations, and
correlations of the main variables appear in Table 2.
------------------------------------------- Insert Tables 1 and 2 about here
-------------------------------------------
Measures
Competitive dynamics
11
Skill. While skill is not directly measurable, it is reflected in an analyst’s track
record—how accurate s/he has been in the past. Following a large body of existing literature,
we used the accuracy of an analyst’s past forecasts as a proxy for the analyst’s skill (e.g.,
Clement & Tse, 2005; Cooper, Day, & Lewis, 2003; Fang & Yasuda, 2009). Specifically, we
used the negative of the mean absolute forecast error (so the higher the more skill) of the
analyst over the previous twelve quarters available for this analyst, namely =itSKILL
- ittFERRMEAN )1)(12(_ !! . By considering a rolling twelve-quarter time window of
performance, we allowed for skill to change slowly over time. Using longer lengths of time,
including the average error since the very first time an analyst appears in the dataset, namely
=itSKILL2 - i
tFERRMEAN )1(0_ ! , led to similar results. The correlation between consecutive
non-overlapping twelve-quarter windows of SKILL was .32, indicating that there was a
persistent, analyst-level effect in this measure, consistent with previous literature (e.g.,
Clement & Tse, 2003; Fang & Yasuda, 2009). In the analysis below, we only used data from
analysts for whom we had at least twelve quarters of data (so that SKILL can be estimated)
and at least one quarter of data for each particular company (so that past short-term company
specific performance and deviation-from-consensus could be used as control variables).
Uncertainty. We measured the degree of uncertainty about a firm during a quarter as
the standard deviation of the daily stock returns of that company during the quarter. This is a
firm-level measure that changes every quarter, as opposed to a market-level measure such as
overall market volatility. We used this measure because analysts make forecasts for firm-
specific earnings per share, and the relevant forecasting environment should capture the
uncertainty in that firm’s prospects. This firm-specific measure more accurately reflects the
level of uncertainty commonly faced by those analysts making forecasts for that firm, and
allows for more variation than a measure of market-level volatility. To compare analysts’
behavior under low and high uncertainty, we defined as high-uncertainty company quarters
Competitive dynamics
12
those when the standard deviation of the daily returns of the company’s stock was within the
top 20% of the standard deviations of daily returns for that company in all previous quarters
(see Table 1, variable UNC). Our results are robust to changes of this 20% threshold, and also
hold if we use the continuous measure of actual standard deviation instead of the dummy
variable measure UNC.
RESULTS
Interaction between uncertainty and skill
We first note that the mean across companies and quarters of the standard deviation of
the analysts’ (company-quarter) forecasts (FEPS) was .16 for the low-uncertainty quarters
and .34 for the high-uncertainty quarters. This implies that when uncertainty is high, the
overall variability across forecasts is greater. In turn, the larger variance across forecasts in
high-volatility periods indicates that analysts exhibit more divergent opinions in such times,
consistent with the matching hypothesis (Brehmer, 1976).
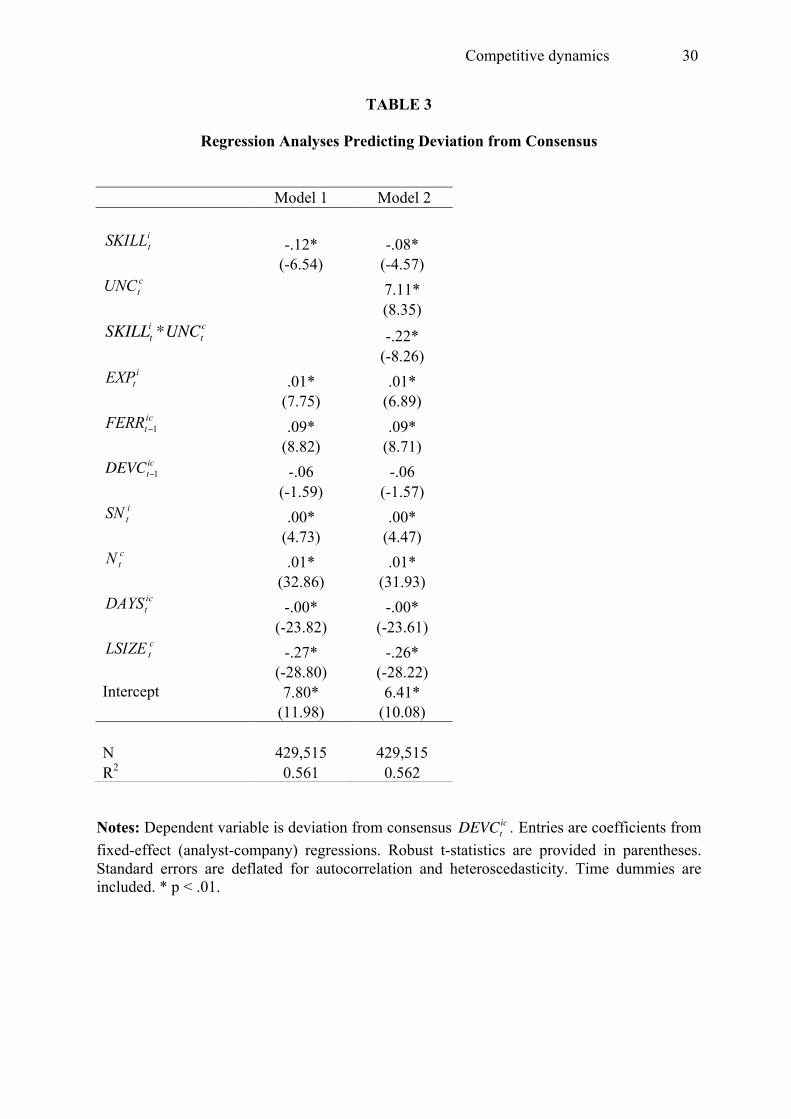
To examine the interactive effect of uncertainty and skill on analysts’ deviations-from-
consensus, we used multivariate analyst-company fixed-effect regressions. In Model 1, we
used skill (proxied by past accuracy) as the key explanatory variable. In Model 2, we added
uncertainty (proxied by stock-level return volatility) and the interaction of skill and
uncertainty. In both models, we included a number of controls that past research identified as
potentially relevant to analysts’ deviations-from-consensus. First, previous studies suggest
that analysts with longer careers in the industry might take more risk by deviating from
consensus since they face fewer reputational and career concerns than less experienced
analysts (e.g., Chevalier & Ellison, 1999; Clement & Tse, 2005; Hong et al., 2000). We thus
controlled for analysts’ overall experience, ictEXP (using company-specific experience instead
does not alter the results). Second, we included the previous-period deviation-from-consensus
Competitive dynamics
13
and forecast accuracy, DEVCt!1ic and ic
tFERR 1! , to control for the possibility that analysts
change their behavior as a reaction to their poor performance in the previous period (e.g.,
Clarke & Subramanian, 2006; Hilary & Menzly, 2006). Third, we controlled for the number
of companies each analyst follows, itSN , since analysts with large portfolios may be more
likely to deviate from consensus (Clement & Tse, 2005). Fourth, consistent with previous
research using similar data (e.g., Hilary & Menzly, 2006), we controlled for the amount of
information available to the market for a particular firm by including the timing of forecast,
ictDAYS , the size of the firm, c
tLSIZE , and the number of analysts making forecasts for the
firm, ctN (see Table 1 for definitions). Finally, we included a full set of year dummies. The
full model tested is:
ict
ict
ct
ict
ct
it
ict
ict
it
ct
it
ct
it
ict
DTIMELSIZEDAYSNSNDEVCFERREXPUNCSKILLUNCSKILLDEVC
!"######
#####"
+++++++
++++++=
$
$
111098716
154321 )*( (2)
where DTIME is a dummy for each year (from 1990 to 2009), ic! is the analyst-firm fixed
effect, and ict! is the error term. In all models, standard errors were adjusted for clustering by
analysts and firms since observations are independent across clusters but not necessarily
within clusters. Estimating Fama-Macbeth regressions (Fama-MacBeth, 1973) instead does
not alter the results.
------------------------------------------- Insert Table 3 about here
-------------------------------------------
The results are displayed in Table 3. First, skill had a negative and statistically
significant effect, suggesting that on average, low-skill analysts deviate from consensus more
than their highly skilled peers. This is consistent with the literature on contests (e.g., Tsetlin et
al., 2004). Second, uncertainty had a positive and statistically significant effect, suggesting
that in times of high uncertainty deviation-from-consensus increases for all analysts. This

Competitive dynamics
14
result is consistent with the past research on financial analysts (Song, Kim, & Won, 2009) and
the matching hypothesis (Brehmer, 1976). Third, and most important, the interactive effect of
skill and uncertainty on deviation-from-consensus was negative and statistically significant,
providing support for our main hypothesis that low-skill analysts increase their deviation-
from-consensus more when uncertainty increases.
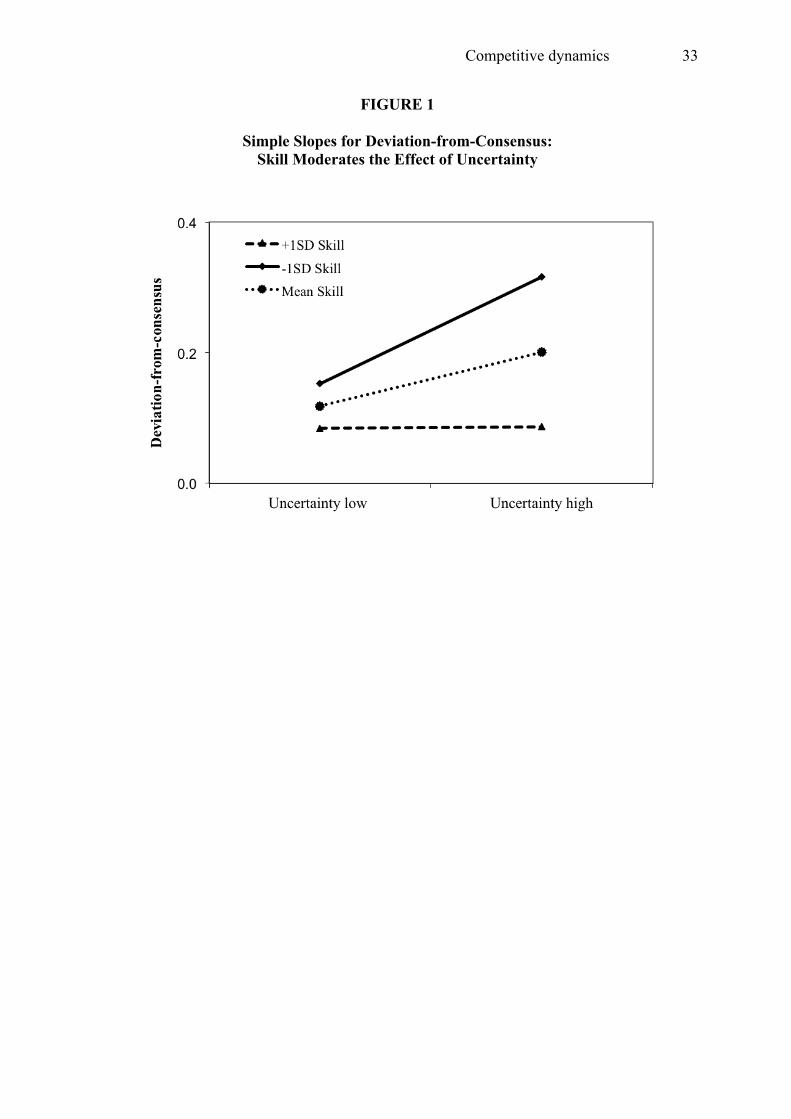
To interpret this interaction, we plotted the values of deviation-from-consensus—as
predicted by our model—at high (one standard deviation above mean) and low (one standard
deviation below the mean) values of analysts’ skill, following the methodology suggested by
Aiken and West (1991). For comparison, we also included the predicted values of deviation-
from-consensus evaluated at the mean level of analysts’ skill. For each level of skill, we
calculated the predicted values of deviation-from-consensus (y-axis) for low- and high-
uncertainty (x-axis). Control variables were entered in this calculation at their mean level,
except for the dummy variables for each year that were entered at the value of zero. As Figure
1 also shows, the effect of uncertainty on analysts’ deviation-from-consensus was stronger for
low-skill analysts.
To further analyze the interaction, we tested analogous regression models on the two
subgroups of analysts: a group with skill below the median (32.05) and a group with skill
equal to or superior than the median. The analyses confirmed that the positive relationship
between uncertainty and deviation from consensus was stronger for low-skill analysts (N =
228,462, b = .13, t = 12.23, p < .001) than for their highly skilled peers (N = 201,053, b = .05,
t = 12.13, p < .001): the F-test for coefficient equality showed that the probability of the two
coefficients being equal was less than .001. Thus, compared to their more skilled peers, low-
skill analysts exhibit larger increases in deviation-from-consensus in high-uncertainty periods
relative to low-uncertainty periods.
------------------------------------------- Insert Figure 1 about here
Competitive dynamics
15
-------------------------------------------
Further tests
Length of career. As a robustness check, we repeated the same analysis for analysts
with longer and shorter experiences. We expected the main result to hold in both populations.
As suggested by previous work (e.g., Chevalier & Ellison, 1999; Hong et al., 2000), analysts
with more experience (“older” analysts) may have fewer reputational and career concerns than
younger ones. Hence we would expect that the interaction of skill and uncertainty might be
more pronounced for the older analysts. These additional analyses revealed that for both
younger (the analysts at the bottom quartile in terms of years of experience) and older analysts
(the analysts at the top quartile in terms of years of experience), the interaction was negative
and statistically significant (N = 40,118, b = -.12, t = -2.08, p < .05 for younger analysts, and
N = 29,167, b = -.26, t = -3.36, p < .001 for older analysts), thereby supporting our main result.
The significance level of the effect for older analysts was larger than for younger ones (t =
-3.36 vs. t = -2.08), but the difference between the interaction coefficients was not statistically
significant (p < .12, F-test), suggesting that factors other than reputational and career concerns
might be affecting analysts’ behavior.
Education as a proxy for skill. In the analysis above, we used past forecast accuracy
to proxy for analysts’ skill. As an additional robustness test, we repeated our analyses using a
different measure. Specifically, we used educational data since empirical research suggests
that scholastic aptitude is correlated with unobserved “ability.” For example, mutual fund
managers with higher SAT scores outperform managers with lower scores (Chevalier &
Ellison, 1999). Education data—university or post-graduate degree information—was
available for a sub-sample of 1,913 analysts. Since we do not have individual SAT scores and
because average SAT scores of schools change from year to year, we used as an alternative
proxy of skill whether the analyst attended an Ivy League college, MIT, or Stanford.
Competitive dynamics
16
Aggregate statistics show that the average SAT scores of students in Ivy League colleges,
MIT, and Stanford are about 200 points higher than those in other top 50 universities (see, e.g.,
http://www.satscores.us/). Hence we repeated our main analysis, presented in Table 3, using
this alternative proxy of skill and following the exact same econometric specifications.
Table 4 displays the results of this analysis. The results replicate those presented in
Table 3. The interaction of skill—proxied by education—and market uncertainty was negative
and marginally significant at p = .064, suggesting that analysts who attended high-ranking
schools did exhibit somewhat smaller increases in deviation-from-consensus when volatility
increased. The weaker statistical significance compared to our main test (Table 3) indicates
that education is a noisy proxy of skill.
------------------------------------------- Insert Table 4 about here
-------------------------------------------
Using differential deviation to predict future performance. Our results suggest that,
compared to high-skill analysts, low-skill analysts exhibit greater increases in deviation-from-
consensus in volatile relative to calm markets. Does this differential deviation add incremental
value—after controlling for analysts’ past performance (i.e., past accuracy)—in predicting
their future forecasting performance? After all, one main objective for investors is to identify
analysts who can provide accurate forecasts. To assess the predictive value of this differential
deviation, for each analyst we computed the difference in his/her mean deviation-from-
consensus between high- and low-uncertainty periods:
it
it
it DEVCLMEANDEVCHMEANDeviationalDifferenti )1(0)1(0 ___ !! != (3)
This measure assesses the extent to which the analyst deviates more from consensus in
volatile than in calm markets. It uses past information based solely on the behavioral effect
we have demonstrated. Importantly, our objective was not to forecast future accuracy using
past accuracy, but to assess the incremental predictive value of differential deviation. We
Competitive dynamics
17
expected that the larger this deviation, the lower the skill of the analyst, hence the larger the
future forecast error.
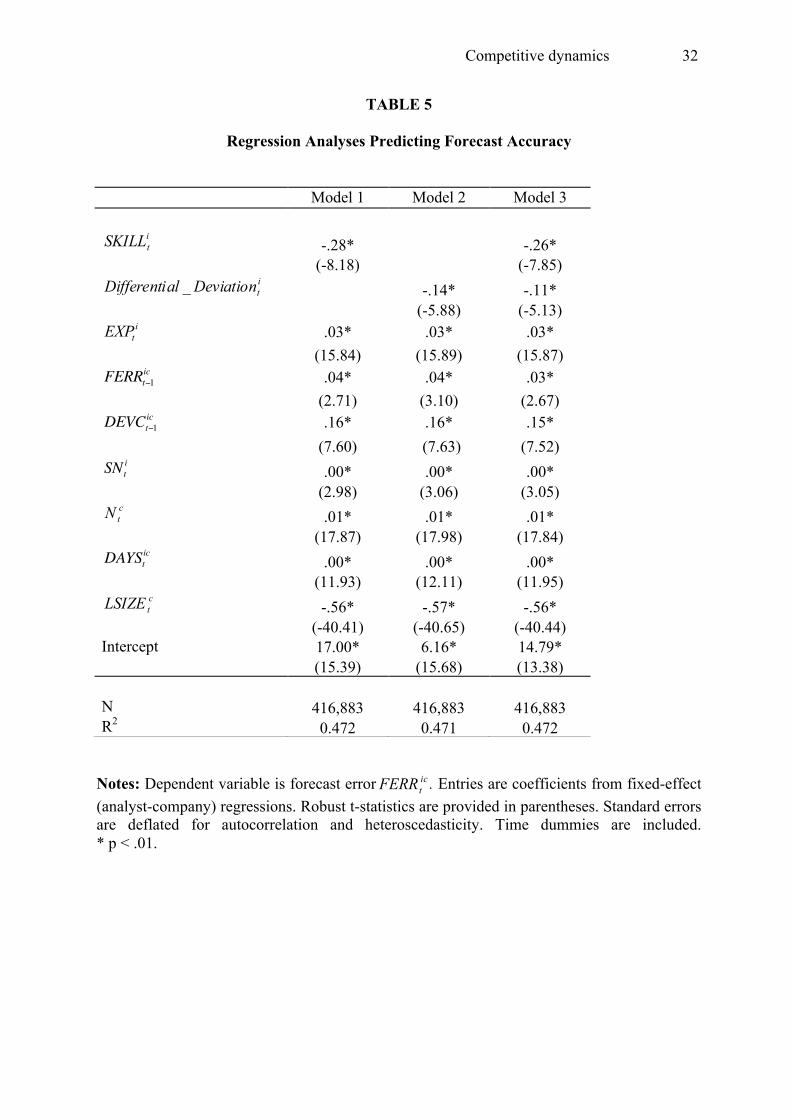
To examine whether differential deviation helps predict future forecasting
performance, we used multivariate analyst-company fixed-effect regressions. Our dependent
variable was forecast error, ictFERR . In Model 1, we entered skill, i
tSKILL1 (proxied by past
long-term accuracy)—to allow for analyst-level persistence, and the same control variables as
in Table 3. In Model 2, instead of skill we entered the measure of differential deviation,
Differential _Deviationti . Finally, in Model 3, we estimated a model with both differential
deviation and skill, to assess the incremental value of differential deviation for predicting
forecasting accuracy. Results, presented in Table 5, confirmed that skill (proxied by past long-
term accuracy) is negatively related to forecast error, suggesting that skill is persistent. Most
important, the coefficient of differential deviation was statistically significant and positive
even after controlling for skill, suggesting that differential deviation predicts forecasting
accuracy above and beyond past performance. We also note that when both variables are
included to predict future performance (Model 3), their magnitude and statistical significance
do not change substantially.
------------------------------------------- Insert Table 5 about here
-------------------------------------------
DISCUSSION
We studied risk taking of stock analysts under market conditions that vary in volatility
and thus imply different levels of luck in outcomes. We characterized the degree of risk that
analysts take by the extent to which their forecasts deviate from the consensus. We predicted
and tested the hypothesis that low-skill analysts take greater risks in volatile markets by
issuing forecasts that deviate more widely from consensus than in calm markets. Importantly,
although all analysts’ forecasts are more dispersed when markets are volatile, our results
Competitive dynamics
18
revealed that the differential deviation-from-consensus between volatile and calm conditions
exhibited by low-skill analysts is larger than the corresponding differential exhibited by high-
skill analysts.
Theoretical contribution
Our result on the interaction between skill and uncertainty in forecasting provides an
important contribution to different streams of research. First, our findings extend knowledge
on human judgment and behavior under uncertainty. For example, Heath and Tversky (1991)
provided experimental evidence of a so-called competence effect whereby individuals prefer
ambiguous alternatives when they feel competent about the source of uncertainty. Our
research, based on large-scale field data, suggested an extension of this finding. We showed
that, under competitive remuneration schemes, higher uncertainty leads to low-skill
individuals exhibiting even greater risk taking than their more skilled (i.e., competent) peers.
Moreover, the interaction we observed between skill and uncertainty refines our
understanding of the main effects of the latter. For example, this interaction would not be
predicted by the matching hypothesis (Brehmer, 1976). Nor would one anticipate it by
considering the “hard-easy” effect in judgments of relative self-competence (Moore & Healy,
2008). This holds that people tend to overestimate their competence relative to others in easy
situations but underestimate this in difficult tasks. In other words, people implicitly take more
relative risk when tasks are easy. If anything, our results run counter to this implication. That
is, whereas we did not measure self-assessed competence per se, we note that forecasting is
more difficult in times of high volatility, and yet this is when low-skill analysts exhibit more
boldness in their forecasts—that could indicate more relative overconfidence.
Second, our research provides a theoretical and methodological contribution to the
literature that models human judgment. Specifically, researchers have shown how accuracy
across a set of judgments is affected by both the variability of the predictions made by
Competitive dynamics
19
individuals and the level of environmental uncertainty (Karelaia & Hogarth, 2008; Lee &
Yates, 1992). In this paper, we also considered the interrelation between accuracy and the
variability of judgments. However, in contrast to previous research, we showed that past long-
term accuracy (i.e., our primary measure of skill) affects judgmental variability, and that this
effect differs as a function of skill and the variability of the prediction environment.
Third, our research also provides insights on behavior in contests. That is, the situation
we studied can be characterized as a tournament where analysts compete for financial
compensation and professional recognition and “winners” and “losers” are determined by both
skill and luck. Previous literature has suggested that, in such settings, risk-taking behavior
differs between individuals with low and high skills (Tsetlin et al., 2004). Specifically, the
former take more risk in attempts to outperform their stronger competitors (Chevalier &
Ellison, 1997). Our finding that low-skill analysts deviate more from consensus than their
highly skilled peers is consistent with this literature. Moreover, our main empirical result that
low-skill analysts exhibit greater increase in deviation-from-consensus when market volatility
increases is also consistent with experimental evidence from market-entry contests where
payoffs are determined by relative performance (e.g., Camerer & Lovallo, 1999). In one such
study, Karelaia and Hogarth (2010) investigated the effects of a random perturbation of
relative performance rankings. They found that low-skill participants took greater risk by
entering the market more in the presence as opposed to absence of this factor. That is, the
participants with less skill were more risk seeking when randomness played a greater role.
Our empirical findings replicate this experimental result on increased risk taking by unskilled
individuals when relative performance of contestants is more affected by random factors.
Finally, our work also contributes to studies in finance on the behavior of high- and
low-skill analysts (Clarke & Subramanian, 2006; Easterwood & Nutt, 1999; Friesen & Weller,
2006; Hilary & Menzly, 2006). While much research already considers the interplay of
Competitive dynamics
20
analysts’ skill and herding behavior (e.g., Clement & Tse, 2005; Hong et al., 2000), we are
among the first to examine the moderating effect of market conditions. By considering skill,
we also augment the results of Song, Kim, and Won (2009) who documented the effect of
market conditions (specifically, the uncertainty about companies’ earnings) on analysts’
deviation from consensus. Importantly, our work is distinct from the existing literature on
financial analysts’ behavioral biases. For example, Hilary and Menzly (2006) studied the
short-term dynamics of analysts’ forecasts and showed that analysts become overconfident
after a series of accurate forecasts, leading to greater deviation-from-consensus and lower
accuracy in the short-term. Our work differs by considering past forecast accuracy over a long
time period, as opposed to the recent past. The long-term track record is more likely to reflect
analysts’ skill independent of short-term behavioral biases such as overreaction.
Limitations and future directions
Our work is subject to limitations that suggest opportunities for future research. First,
whereas deviating from consensus forecasts implies reputational and career risks for financial
analysts, the upside of outperforming peers by providing more extreme forecasts—if they turn
out to be correct ex post—is also substantial. However, one might still question whether
deviating from consensus implies explicit risk taking since, psychologically, analysts may not
necessarily experience this as risky. Future research should address this issue by assessing
analysts’ perceptions of the riskiness of different strategies.
Second, we based our hypothesis on the idea that, compared to their high-skill
counterparts, low-skill analysts have much to lose by issuing extreme forecasts when market
conditions are calm, but less when conditions are volatile. In the latter, their behavior is
similar to buying lottery tickets with highly skewed payoffs. That is, while success is unlikely
for almost all low-skill analysts, such behavior may increase their chances of “winning” the
professional contest (Cabral, 2003; Tsetlin et al., 2004). Nonetheless, other reputation-related
Competitive dynamics
21
issues should also be investigated in future research. Prendergast and Stole (1996) suggest
that people who desire to establish reputations for being quick learners—i.e., those who learn
and respond to new information—may end up exaggerating their information and making
long shots. For example, an executive who does not change the course of action established
by her predecessor may be viewed as lacking initiative. Thus, her incentives are to “overact.”
Similarly, in volatile markets, where information is arriving at a fast pace, there are strong
incentives for low-skill financial analysts to exaggerate—by making outlandish forecasts—in
order to establish a reputation for effective learning.
On a related note, literature on self-serving attributions can provide an alternative
explanation for our results. In particular, self-serving attribution bias implies that people take
individual credit for success but blame failure on external causes (Heider, 1976). In Western
cultures, this and other illusions help satisfy the need to maintain positive self-views (Heine,
Lehman, Markus, & Kitayama, 1999). It can be argued that when market volatility is high,
and luck is important in affecting outcomes, the risk of damaging self-image by failing after
making outlandish calls is reduced—because uncontrollable events can be used to explain
poor performance. In other words, market uncertainty provides external reasons to dissipate
self-doubts as well as manage professional reputation in case of failure. Since low-skill
analysts lack demonstrated expertise that might protect them from negative attributions
(Dodgson & Wood, 1998; Heath & Tversky, 1991), these additional possible explanations
should be more important than for high-skill analysts. Thus, in striving to demonstrate high
performance relative to peers, low-skill analysts will take even more risk in the periods of
high volatility than their high-skill counterparts.
Importantly, our hypothesis assumes that to reach their reputational goals, analysts
take rational, calculated reputational risks—by choosing whether to make outlandish forecasts.
On the other hand, an alternative explanation is that forecasting is more difficult for all
Competitive dynamics
22
analysts when market uncertainty is high—that is, they all “know” less in such conditions.
Consistent with the matching hypothesis (Brehmer, 1976), greater variability in judgment
reflects more variability in the environment. The finding that the difference in deviation-
from-consensus between low- and high-skill analysts is amplified when markets become
more volatile could simply mean that low-skill analysts do their best in volatile markets but
do not know any better. While our empirical results support our hypothesis, our data did not
allow for explicit tests of the mechanisms. Further research—both experimental and
empirical—is needed to explicate the processes underlying our findings.
Finally, our conclusions are based on the behavior of financial analysts. In common
with many other professions, the tasks of financial analysts are competitive and outcomes
depend on both skill and luck. A natural question, therefore, is to specify boundary conditions.
Do the same types of skill x luck interactions occur in other competitive environments in the
financial world (e.g., portfolio and fund managers) or elsewhere (e.g., launching new
products or services, competitions in sports or for jobs, etc.)? Our paradigm provides a useful
framework for considering these issues.
Conclusion
Our empirical results suggest that, when market volatility increases, low-skill analysts
exhibit greater risk taking by making forecasts that deviate more from consensus. While the
explicit processes underlying our findings should be addressed in future research, our results
are robust to several control variables, alternative econometric estimations, and measures of
skill and market uncertainty. Moreover, our findings also provide novel proxies for analysts’
skill in forecasting. Specifically, observing how much bolder an analyst becomes during
times of high uncertainty can signal the analyst’s skill level and predict future accuracy
beyond traditional measures of skill based on analysts’ past performance.
Competitive dynamics
23
References
Aiken, L. S., & West, S. G. (1991). Multiple regression: Testing and interpreting interactions.
Newbury Park, CA: Sage.
Armstrong, J. S. (2001). Principles of forecasting: A handbook for researchers and
practitioners. Boston, MA: Kluwer Academic.
Atkinson, J. W. (1957). Motivational determinants of risk-taking behavior. Psychological
Review, 64, 359–372.
Avci, B., Loufti, Z., Mihm, J., & Keck, S. (2011). Comparison as incentive: Newsvendor
decisions in a social context. INSEAD Working Paper.
Avery, C. N., & Chevalier, J. A. (1999). Herding over the career. Economics Letters, 63, 327–
333.
Brehmer, B. (1976). Note on clinical judgment and the formal characteristics of clinical tasks.
Psychological Bulletin, 83(5), 778–782.
Cabral, L. (2003). R&D competition when firms choose variance. Journal of Economics and
Management Strategy, 12, 139–150.
Camerer, C., & Lovallo, D. (1999). Overconfidence and excess entry: An experimental
approach. American Economic Review, 89(1), 306–318.
Chevalier, J. A., Ellison, G. (1997). Risk-taking by mutual funds as a response to incentives.
Journal of Political Economy, 105(5), 1167–1200.
Chevalier, J. A., & Ellison, G. (1999). Career concerns of mutual fund managers. Quarterly
Journal of Economics, 114(2), 389–432.
Clarke, J., & Subramanian, A. (2006). Dynamic forecasting behavior by analysts: Theory and
evidence. Journal of Financial Economics, 80, 81–113.
Clemen, R. T. (1989). Combining forecasts: A review and annotated bibliography.
International Journal of Forecasting, 5, 559–609.
Competitive dynamics
24
Clement, M. (1999). Analyst forecast accuracy: Do ability, resources, and portfolio
complexity matter? Journal of Accounting and Economics, 27, 285–303.
Clement, M., & Tse, S. Y. (2003). Do investors respond to analysts’ forecast revisions as if
forecast accuracy is all that matters? Accounting Review, 78, 227–249.
Clement, M., & Tse, S. (2005). Financial analyst characteristics and herding behavior in
forecasting. Journal of Finance, 60(1), 307–341.
Cohen, J., & Dearnaley, E. J. (1962). Skill and judgment of footballers in attempting to score
goals: A study of psychological probability. British Journal of Psychology, 53, 71–86.
Cohen, L., Malloy, C., & Frazzini, A. (2010). Sell-side school ties. Journal of Finance, 65,
1409–1437.
Cooper, R. A., Day, T. E., & Lewis, C. M. (2001). Following the leader: A study of individual
analysts’ earnings forecasts. Journal of Financial Economics, 61, 383–416.
Denrell, J., & Fang, C. (2010). Predicting the next big thing: Success as a signal of poor
judgment. Management Science, 56(10), 1653–1667.
Dodgson, P. G., & Wood, J. V. (1998). Self-esteem and the cognitive accessibility of
strengths and weaknesses after failure. Journal of Personality and Social Psychology,
75(1), 178–197.
Easterwood, J., & Nutt, S. R. (1999). Inefficiency in analysts' earnings forecasts: Systematic
misreaction or systematic optimism? Journal of Finance, 54(5), 1777–1797.
Fama, E. F., & MacBeth, J. D. (1973). Risk, return and equilibrium: Empirical tests. Journal
of Political Economy, 81, 607–636.
Fang, L., & Yasuda, A. (2009). The effectiveness of reputation as a disciplinary mechanism in
sell-side research. Review of Financial Studies, 22, 3735–3777.
Friesen, G., & Weller, P. (2006). Quantifying cognitive biases in analyst earnings forecasts.
Journal of Financial Markets, 9(4), 333–365.
Competitive dynamics
25
Gaba, A., Tsetlin, I., & Winkler, R. L. (2004). Modifying variability and correlations in
winner-take-all contests. Operations Research, 52(3), 384–395.
Gleason, C., & Lee, C. (2003). Analyst forecast revisions and market price discovery.
Accounting Review, 78, 193–225.
Heath, C., & Tversky, A. (1991). Preference and belief: Ambiguity and competence in choice
under uncertainty, Journal of Risk and Uncertainty, 4, 5–28.
Heider, F. (1976). A conversation with Fritz Heider. In J. H. Harvey, W. J. Ickes, & R. F.
Kidd (Eds.), New directions in attribution research, Vol. 1, 47–61. Hillsdale, NJ:
Erlbaum.
Heine, S. J., Lehman, D. R., Markus, H. R., & Kitayama, S. (1999). Is there a universal need
for positive self-regard? Psychological Review, 106, 766–794.
Hilary, G., & Menzly, L. (2006). Does past success lead analysts to become overconfident?
Management Science, 52(4), 489–500.
Hogarth, R. M., & Karelaia, N. (2007). Heuristic and linear models of judgment: Matching
rules and environments. Psychological Review, 114(3), 733–758.
Hong, H., Kubik, J., & Solomon, A. (2000). Security analysts’ career concerns and herding of
earnings forecasts. RAND Journal of Economics, 31(1), 121–144.
Keynes, J. M. (1965). The general theory of employment, interest, and money. New York:
Harcourt, Brace & World, First Harbinger Edition.
Karelaia, N. (2006). Thirst for confirmation in multi-attribute choice: Does search for
consistency impair decision performance? Organizational Behavior and Human Decision
Processes, 100, 128–143.
Karelaia, N., & Hogarth, R. M. (2008). Determinants of linear judgment: a meta-analysis of
lens model studies. Psychological Bulletin, 134(3), 404–426.
Competitive dynamics
26
Karelaia, N., & Hogarth, R. M. (2010). The attraction of uncertainty: Interactions between
skill and levels of uncertainty in market-entry games. Journal of Risk and Uncertainty,
41(2), 141–166.
Langer, E. J. (1975). The illusion of control. Journal of Personality and Social Psychology,
32(2), 311-328.
Larrick, R. P., Mannes, A. E., & Soll, J. B. (2011). The social psychology of the wisdom of
crowds. In J. I. Krueger (Ed.), Frontiers of Social Psychology: Social Psychology and
Decision Making. Philadelphia: Psychology Press.
Lee, J.-W., & Yates, J. F. (1992). How quantity judgment changes as the number of cues
increases: An analytical framework and review. Psychological Bulletin, 112(2), 363-377.
March, J. (1991). Exploration and exploitation in organizational learning. Organization
Science, 2(1), 71–87.
Mikhail, M. B., Walther, B. R., & Willis, R. H. (1997). Do security analysts improve their
performance with experience? Journal of Accounting Research, 35, 131-157.
Moore, D. A., & Healy, P. J. (2008). The trouble with overconfidence. Psychological Review,
115(2), 502–517.
Prendergast, C., & Stole, L. (1996). Impetuous youngsters and jaded old-timers: Acquiring a
reputation for learning. Journal of Political Economy, 104(6), 1105–1134.
Scharfstein, D. S., Stein, J. C. (1990). Herd behavior and investment. American Economic
Review, 80(3), 465–489.
Song, M., Kim, D., & Won, C. (2009). Earnings uncertainty and analyst forecast herding.
Asia-Pacific Journal of Financial Studies, 38(4), 545-474.
Surowiecki, J. (2004). The wisdom of crowds. London: Little, Brown.
Trueman, B. (1994). Analyst forecasts and herding behavior. Review of Financial Studies,
7(1), 97–124.

Competitive dynamics
27
Tsetlin, I., Gaba, A., & Winkler, R. (2004). Strategic choice of variability in multi-round
contests and contests with handicaps. Journal of Risk and Uncertainty, 29(2), 143–158.
Competitive dynamics
28
TABLE 1
Definitions of variables (in alphabetic order)
ictDAYS
The number of days between the last forecast of analyst i for company c in calendar quarter t, (namely ic
tFEPS ) and the date of the company
announcement, ctEPS , that quarter.
DEVCtic
The absolute deviation from consensus of analyst i in calendar quarter t for company c defined as
))(( ct
ict
ict FEPSforecastoftimeuntilAverageFEPSDEVC != .
itonal_DeviatiDifferenti Defined as HMEAN _DEVC0(t!1)
i ! LMEAN _DEVC0(t!1)i
ctEPS Actual EPS announced by company c at the end of quarter t. It is divided by
the average stock price of company c during quarter t, and multiplied by 100.
itEXP This is the number of calendar quarters for which analyst i has been in the
data until time t.
ictFEPS
The last forecasted EPS of analyst i for company c at calendar quarter t. It is scaled by the average stock price of company c during quarter t, and multiplied by 100.
ictFERR
The absolute forecast error of analyst i for company c in calendar quarter t defined as c
tict
ict EPSFEPSFERR != .
ctLSIZE The logarithm of the market capitalization (average quarterly stock price x
number of shares outstanding) of company c in quarter t.
itsFERRMEAN _
The average forecast error of analyst i across all companies followed by that analyst between calendar quarters t and s, including quarters t and s. Time index 0 is for the very first quarter and T for the very last quarter (of the analyst in this case). For example i
ttFERRMEAN )1)(1(_ !! is the average error across companies followed of analyst i during quarter (t-1).
MEAN _DEVCtsi ,
LMEAN _DEVCtsi ,
HMEAN _DEVCtsi
MEAN _DEVCtsi is the average absolute deviation from consensus of
analyst i across all companies followed by that analyst between calendar quarters t and s including quarters t and s. For example, MEAN _DEVCtt
i is the average of analyst i across companies s/he followed during quarter t. LMEAN _DEVCts
i is the same but averaged only across low-uncertainty
(UNC) quarters, while HMEAN _DEVCtsi is averaged only across high-
uncertainty (UNC) quarters.
ctN and i
tSN The number of analysts forecasting for company c in calendar quarter t, and the number of companies analyst i follows in quarter t, respectively
itSKILL
Our main proxy for the skill of analyst i. It is the average forecast error of the analyst, ic
tFERR , over all companies c and over all quarters over the past 3
years (12 quarters), that is =itSKILL - ittFERRMEAN )1)(12(_ !!
ctUNC
A dummy that is one if uncertainty is high and 0 otherwise. Uncertainty is the standard deviation of the daily stock returns of company c during quarter t. c
tUNC is 1 if the standard deviation is in the top 20% of the standard deviations of all previous quarters of company c.
Competitive dynamics
29
TABLE 2
Descriptive statistics
Variable Mean Median SD Percentile Correlations
25th 75th 1 2 3 4 5 6 7 8 9
1 Actual EPS, ctEPS .94 1.00 5.28 .42 1.65
2 Forecasted EPS, ictFEPS 1.05 1.03 4.21 .47 1.63 .94*
3 Forecast error, ictFERR .40 .10 1.51 .03 .28 -.20* -.02*
4 Deviation-from-consensus, DEVCtic .21 .05 1.00 .02 .15 .15* .17* .33*
5 Analysts' experience, itEXP 26.90 23.00 13.14 17.00 34.00 .02* .02* .01* .01*
6 Analysts' skill, itSKILL 31.93 32.05 .44 31.89 32.14 .05* .03* -.20* -.14* .04*
7 Number of analysts per stock, ctN 11.30 9.00 7.13 6.00 14.00 -.01* -.01* -.01* .02* .04* .01*
8 Number of stocks per analyst, itSN 11.06 10.00 7.47 6.00 14.00 .02* .02* .03* .03* .07* -.07* .08*
9 Days before EPS announcement, ictDAYS 43.66 50.00 23.36 21.00 64.00 .00* .00* -.00* -.07* .04* .01* -.12* .17*
10 Log of market capitalization, ctLSIZE 14.57 14.45 1.49 13.51 15.51 .07* .06* -.13* -.10* .08* .09* .46* .00* .03*
Note: The data include 429,515 unique analyst-company-quarter observations, 79,827 unique company-quarter observations, 75,717 unique analyst-quarter observations, and 4,732 unique analysts. * p < .01.
Competitive dynamics
30
TABLE 3
Regression Analyses Predicting Deviation from Consensus
Notes: Dependent variable is deviation from consensus DEVCt
ic . Entries are coefficients from fixed-effect (analyst-company) regressions. Robust t-statistics are provided in parentheses. Standard errors are deflated for autocorrelation and heteroscedasticity. Time dummies are included. * p < .01.
Model 1 Model 2
itSKILL -.12* -.08*
(-6.54) (-4.57) ctUNC 7.11*
(8.35) SKILLt
i *UNCtc -.22*
(-8.26) itEXP .01* .01*
(7.75) (6.89) ictFERR 1! .09* .09*
(8.82) (8.71) DEVCt!1
ic -.06 -.06 (-1.59) (-1.57)
itSN .00* .00*
(4.73) (4.47) ctN .01* .01*
(32.86) (31.93) ictDAYS -.00* -.00*
(-23.82) (-23.61) ctLSIZE -.27* -.26*
(-28.80) (-28.22) Intercept 7.80* 6.41* (11.98) (10.08) N 429,515 429,515 R2 0.561 0.562

Competitive dynamics
31
TABLE 4
Replicating Main Results using Education as Skill Proxy Model 1 Model 2 Elite_ Schooli -.01 -.00 (-1.72) (-.62)
ctUNC .13*
(12.88) Elite_ Schooli *UNCt
c -.03 a (-1.85)
itEXP .00* .00*
(2.66) (2.64) ictFERR 1! .10* .10*
(9.92) (9.86) DEVCt!1
ic .06* .06* (2.81) (2.82)
itSN .00 .00
(1.05) (.58) ctN .01* .01*
(24.30) (23.46) ictDAYS -.00* -.00*
(-15.78) (-15.56) ctLSIZE -.17* -.16*
(-26.48) (-26.03) Intercept 2.42* 2.27* (26.33) (25.16) N 166,418 166,418 R2 0.353 0.355
Notes: Dependent variable is deviation from consensus DEVCt
ic . Entries are coefficients from fixed-effect (analyst-company) regressions. Robust t-statistics are provided in parentheses. Standard errors are deflated for autocorrelation and heteroscedasticity. Time dummies are included. * p < .01, a p = .064.
Competitive dynamics
32
TABLE 5
Regression Analyses Predicting Forecast Accuracy
Notes: Dependent variable is forecast error ic
tFERR . Entries are coefficients from fixed-effect (analyst-company) regressions. Robust t-statistics are provided in parentheses. Standard errors are deflated for autocorrelation and heteroscedasticity. Time dummies are included. * p < .01.
Model 1 Model 2 Model 3
itSKILL -.28* -.26*
(-8.18) (-7.85) itDeviationalDifferenti _ -.14* -.11*
(-5.88) (-5.13) itEXP .03* .03* .03*
(15.84) (15.89) (15.87) FERRt!1
ic .04* .04* .03* (2.71) (3.10) (2.67) DEVCt!1
ic .16* .16* .15* (7.60) (7.63)! (7.52) SNt
i .00* .00* .00* (2.98) (3.06) (3.05)
ctN .01* .01* .01*
(17.87) (17.98) (17.84) DAYSt
ic .00* .00* .00* (11.93) (12.11) (11.95)
ctLSIZE -.56* -.57* -.56*
(-40.41) (-40.65) (-40.44) Intercept 17.00* 6.16* 14.79* (15.39) (15.68) (13.38) N 416,883 416,883 416,883 R2 0.472 0.471 0.472
Competitive dynamics
33
FIGURE 1
Simple Slopes for Deviation-from-Consensus: Skill Moderates the Effect of Uncertainty