comparison of the efficacy of chitongo theileria parva
TRANSCRIPT

Comparison of the efficacy of chitongo
Theileria parva sporozoites carried on ice to
that carried in liquid nitrogen
B Y
CHANDA CHITALA
A dissertation submitted to the University of Zambia in partial fulfilment of the requirements
for the degree of Master of Science in One Health Analytical Epidemiology
The University of Zambia
Lusaka
©2015

ii
DECLARATION
I, Chanda Chitala do hereby declare that the contents of the dissertation being submitted
herein are my original work and have not been previously submitted to any university for the
award of a degree or any other qualification.
Signature……………………………………….
Date……………………………………………

iii
CERTIFICATE OF APPROVAL
This dissertation submitted by Chanda Chitala is approved as fulfilling the partial
requirements for the award of the degree of Masters of Science in One Health Analytical
Epidemiology by the University of Zambia.
…………………………………………………………………………………………………..
Supervisor Signature
Examiner ….………………………………Sign …………………………. Date …………….
Examiner ………………………………….Sign……………………………Date ……………
Examiner ………………………………….Sign …………………………..Date …………….

iv
ABSTRACT
Theileria parva is a tick-transmitted protozoan parasite that causes an economically
important disease of cattle called East Coast fever (ECF), in East, Central, and Southern
Africa, including Zambia. Immunization against ECF by the infection and treatment method
using the T. Parva chitongo strain in the Southern province has been found to be an efficient
prophylactic technique to control the disease in the endemic areas. However, delivery of the
vaccine to most rural areas is expensive because of the bulky transport medium which
requires a four wheel drive vehicle to transport to the destination area. The aim of this study
was to compare the efficacy of Theileria parva chitongo sporozoites carried on ice to that
carried in liquid nitrogen in cattle.
The study was done in two phases, phase one was a field trial, while phase two was an indoor
trial. In the field trial, 305 cattle were vaccinated with T. parva chitongo stabilate carried in
liquid nitrogen (VCLf), while another 291 cattle were vaccinated with a stabilate carried on
ice (VCIf). These were aged 3 months and above with no history of immunization. His was
done in 5 districts in the southern province of Zambia.
The indoor trial, 17 male Friesian cattle aged between 3 months and 1 year, sourced from
farms around Lusaka were used. Only cattle that tested negative for theileriosis on IFAT and
microscopic examination of blood/lymph smears were included. The calves were randomly
allocated to two treatment groups, one with calves vaccinated using conventional vaccine
carried in liquid nitrogen (VGLi)(n1=9) and the other group vaccinated with the vaccine
carried on ice (VGIi)(n2=8). Dual blood samples were aseptically collected from the jugular
vein and stored in well labelled plain and EDTA tubes. Thin blood smears, PCV
determination, temperature and IFAT for both field and indoor trials were done. However,
blood smears, temperature and PCV for the field trial were only done before immunization.
Differential white blood cell count was determined only for the indoor trial.
The results of the study showed that, in the field trial, piroplasms on microscopy were
detected in Choma, Kalomo, and Namwala districts before immunization with Namwala and
Kalomo having the highest prevalence 16.67% (95% CI 9.96 - 23.38). The field trial also
showed an overall seroprevalence on IFAT of 20% (95% CI 16.7 - 23.1) and 8.4% (95% CI
6.2 - 10.7) in the 1/40 and 1/80 dilution respectively before immunization. There was no
significant difference in efficacy between T. parva chitongo stabilate carried on ice, and that
carried on liquid nitrogen in both the 1/40 (p=0.450) and 1/80 (p=0.242) dilutions between
group VCLf and group VCIf. In the indoor trial, the PCVs in both group VCLi and group
VCIi were reducing as the trial went on, howevever, there was no significant difference in
PCV (p=0.768). Differential white blood counts were done for both goups immunized wth
VCLi and VCIi. The leucocyte count reduced as the study went on due to the reduction of the
lymphocyte count. However, there was no significant difference between the two groups in
lymphocyte counts (p=0.208). There was no significant in temperatures (p=0.0.248) between
the group VCLi and group VCIi. There was also no significant difference in the probability of
survival (p=0.829), the relative risk (p=0.889) and relative vaccine efficacy (95% CI -183 -
59) between group VCLi and group VCIi. These results show that T. parva chitongo stabilate
carried on ice has the same efficacy as that carried on liquid nitrogen. Carrying of the vaccine
stabilate on ice after removal from the liquid nitroge would greatly reduce the cost of ECF
immunisation and make the procedure more adoptable to rural livestock keepers.

v
DEDICATION
This work is dedicated to my father Mbita Chitala for all the support given in order to help
me be the best that I can be, my late Mother Esther Pepkai who never got the chance to see
what I have turned out to be, my children Jennifer and Taizya who give me every reason to
wake up each day and work hard, my siblings and finally my husband Eugene Bwalya who
has always believed in me. Without these people I would not be who I am today.

vi
ACKNOWLEDGEMENTS
I would like to express my sincere gratitude to my supervisor Dr. Martin Simunza,
Department of Disease control, School of Veterinary Medicine, University of Zambia and my
co-supervisor Dr. Paul Fandamu, Central Veterinary Research Institute (CVRI), for their
support, inspiration and guidance to complete this work. I am thankful to SACIDS for
awarding me the scholarship to pursue this Master degree. I am thankful to Mrs. Lilly
Sinyangwe for the help and support rendered to me. I am thankful to the late Mr. Douglas
Banda of the University of Zambia, School of Veterinary Medicine, in the Department of
Disease Control, Mr. Maxwell Banda, Mr. Botha Chonya, Mrs Jane Moya, Mr. Bukowa
Kizito, Mr. Choopa Chimvwele for technical assistance rendered in the laboratory. I am
thankful to Dr. Bwalya Muma, Department of Disease Control, School of Veterinary
Medicine for his assistance in data analysis. I am very grateful to Mr. Simweba and Mr.
Moses for the assistance rendered to me during sample collection and taking care of my
experimental animals. I am also thankful to CVRI, for allowing me to carry out my research
at the institute. Most of all I am thankful to my God who has been with me, every step of the
way.

vii
TABLE OF CONTENTS
LIST OF TABLES …………………………………………………………………………...ix
LIST OF FIGURES …………………………………………………………………………..x
LIST OF ABBREVIATION …………………………………………………………………xi
CHAPTER ONE ……………………………………………………………………………...1
1.0 Introduction .......................................................................................................................... 1
1.1 Problem statement and study justification ........................................................................... 2
1.2 Objectives ............................................................................................................................ 3
1.2.1 General objective .............................................................................................................. 3
1.2.2 Specific Objectives ........................................................................................................... 3
CHAPTER TWO ……………………………………………………………………………..4
2.0 Literature review .................................................................................................................. 4
2.1 Livestock production system in Zambia .............................................................................. 4
2.2 Aetiology of ECF ................................................................................................................. 5
2.3 Vectors of Theileria parva ................................................................................................... 6
2.4 Distribution .......................................................................................................................... 6
2.5 Life cycle and transmission ................................................................................................. 7
2.6 Clinical signs ........................................................................................................................ 9
2.7 Diagnosis............................................................................................................................ 10
2.8 Epidemiology ..................................................................................................................... 11
2.9 Control and treatment ........................................................................................................ 12
2.9.1 Tick control ..................................................................................................................... 12
2.9.2 Use of resistant Breeds.................................................................................................... 13
2.9.3 Livestock movement control........................................................................................... 13
2.9.4 Chemotherapy ................................................................................................................. 14
2.9.5 Immunisation .................................................................................................................. 14
CHAPTER THREE ………………………………………………………………………….17
3.0 Materials and Methods ....................................................................................................... 17

viii
3.1 Study Design ...................................................................................................................... 17
3.2 Field trial ............................................................................................................................ 17
3.2.1 Sample Size calculation for field trial ............................................................................. 17
3.2.2. Sample collection for the field trial ............................................................................... 18
3.2.3 Vaccination of calves in the field trial ............................................................................ 18
3.3 Indoor trial ......................................................................................................................... 19
3.3.1 Study animals .................................................................................................................. 19
3.3.2 Sample Size determination ............................................................................................. 20
3.3.3 Sample collection ............................................................................................................ 20
3.3.4 Vaccination of the indoor trial calves ............................................................................. 20
3.3.5 Challenge of animals in the indoor trial .......................................................................... 21
3.4. Lab analysis of samples .................................................................................................... 21
3.4.2 Determination of packed cell volume (PCV).................................................................. 21
3.5 Data Analysis ..................................................................................................................... 23
CHAPTER FOUR …………………………………………………………………………...24
4.0 Results ................................................................................................................................ 24
4.1 Field trial ............................................................................................................................ 24
4.3 Indoor trial ......................................................................................................................... 28
CHAPTER FIVE …………………………………………………………………………….37
5.0 Discussion .......................................................................................................................... 37
CHAPTER SIX ……………………………………………………………………………...41
6.0 Conclusion ......................................................................................................................... 41
6.1 Reccomendations ............................................................................................................... 41
REFERENCES ……………………………………………………………………………...42

ix
LIST OF TABLES
Table 2.1: Comparison of methods for detection of ECF……………………………………11
Table 4.1: Pre-immunization prevalence of Theileria piroplasms in the study districts……..25
Table 4.2: Pre-immunization prevalence of Theileria parva chitongo on IFAT 1/40 and IFAT
1/80 in the study districts…………………………………………………………………….26
Table 4.3: proportions of samples that tested positive after immunization from those that were
negative before immunization per district in the 1/40 and 1/80 dilutions at 95%
CI……………………………………………………………………………………………..27
Table 4.4: positive post sampling proportions of IFA Test of 1/40 and 1/80 dilutions, T.parva
vaccine carried in liquid nitrogen and that carried on
ice…………………………………………………………………………………………….28
Table 4.5: Mean number of lymphocytes between the two groups throughout the
study………………………………………………………………………………………….32
Table 4.6: Showing List of survival time by vaccine according to type of carriage
material……………………………………………………………………………………….34
Table 4.7: Log-rank test for equality of survivor functions………………………………….35

x
LIST OF FIGURES
Figure 2.1: Distribution range of Theileria parva………………………………………………….7
Figure 2.2: Schematic diagram of the life cycle for theileria parva………………………….9
Figure 4.1: Weekly Mean PCV of animals immunized with VCLi and VCIi……………….29
Figure 4.2: Mean daily temperatures of the calves in the two groups……………………….30
Figure 4.3: Mean percentage of lymphocytes for animals vaccinated with VCIe and VCLe
per week......................................................................................................................32
Figure 4.4: Differential blood cell count for animals immunized with vaccine carried on
liquid nitrogen (VCLi) and vaccine carried on ice (VCIi)…………………………………...33
Figure 4.8: showing the Kaplan meier survival estimates of each group…………………….35

xi
LIST OF ABBREVIATION
ANOVA Analysis of Variance
CVRI Central Veterinary Research Institute
CI Confidence Interval
˚C Degree Celsius
ECF East Coast Fever
EDTA Ethylenediamine Tetra-acetic Acid
ELISA Enzyme-linked Immunosorbent Assay
GDP Gross Domestic Product
IFAT Indirect Fluorescent Antibody Test
ITM Infection and Treatment Method
KG Kilogram
LAMP Loop-mediated Isothermal Amplication
MEM Minimum Essential Media
n Sample size
PCR Polymerase Chain Reaction
PCV Packed Cell Volume
RBC Red Blood Cell
STATACorp Stata Corporation Statistical Software
SELISA Slide Enzyme-linked Immunosorbent Assay
VCLf Vaccine Carried in Liquid Nitrogen -field
VCIf Vaccine Carried on Ice -field
VCLi Vaccine Carried in Liquid Nitrogen- indoor
VCIi Vaccine Carried on Ice –indoor

1
CHAPTER ONE
1.0 Introduction
Theileria parva is a tick-transmitted protozoan parasite that causes an economically
important disease of cattle called East Coast fever (ECF), in East, Central, and Southern
Africa, including Zambia (Minjauw et al., 1997, Konnai et al., 2007). The parasite is
transmitted by the three host tick, Rhipicephalus appendiculatus (Konnai et al., 2007).
Chizyuka and Mangani (1985) estimated that about 540,000 out of 1,115,000 cattle were at
risk of the disease in the Eastern, Northern, Central and Southern provinces of Zambia by
1985. This estimate was adjusted upwards to 1,259,000 by Nambota (1988) for Eastern,
Northern, Lusaka, Central and Southern provinces.
ECF has major economic implications especially when livelihoods depend on livestock
rearing (Mbao et al., 2006). The disease is a major constraint to development of the livestock
industry in Zambia due to the high morbidity and mortality associated with it. Nambota et al.,
(1994), estimated the losses associated with the disease in the country to about 10,000 cattle
deaths per annum. During the year 2010, it was estimated that a total of 18,073 cases of ECF
and 4,911 deaths were reported in Zambia. The majority of these cases were reported from
Southern, Eastern, Central, Copperbelt, Lusaka and Northern Provinces (Anon, 2010a). Thus,
the control of ECF is a matter of utmost importance if the livestock industry has to gain its
full potential, especially as a tool for poverty alleviation among the resource poor rural
farmers.
Methods that have been used to control the disease include livestock movement control, tick
control with acaricides, use of resistant breeds, chemotherapy and immunisation by the
infection and treatment method (Radley, 1981). Prolonged use of chemicals to control ticks
has resulted in various problems such as tick resistance, residues in animal products,
environmental pollution and high costs (Ghosh et al., 2007). Intensive use of acaricides
interferes with enzootic stability, creating a susceptible population of animals which are
liable to disease epidemics whenever there are disruptions to control programmes (Kocan et

2
al. 2000; Lawrence, 1985). In addition, drugs that are effective in treating the disease are
expensive, making them unaffordable for most resource poor traditional farmers. These
concerns have reinforced the need for alternative approaches to control tick infestations
(Ghosh et al. 2007). Immunisation is a useful way of reducing reliance on acaricides to
control tick-borne diseases.
Immunization against ECF by the infection and treatment method using the T. Parva
chitongo strain in the Southern province has been found to be an efficient prophylactic
technique to control the disease in the endemic areas (Marcotty et al. 2001, Anon. 2010a).
This consists of the inoculation of live cryopreserved Theileria parva sporozoites (stabilate)
and the simultaneous injection of a long-acting formulation of oxytetracycline (Radley et al.
1975). However delivery of the vaccine to most rural areas is expensive because of the bulky
transport medium (liquid nitrogen) which requires a four wheel drive vehicle to transport to
the destination area (Anon, 2011b). There is therefore a need to devise affordable ways of
vaccine delivery to the resource poor farmers where it is desperately needed.
The purpose of this study was to determine whether vaccination with T. parva chitongo
sporozoites transported on ice offer similar protection to that carried in liquid nitrogen in
calves. These results of this study will help in deciding whether ice which is cheaper and
easier to carry can be used as an alternative carriage material for T. parva Chitongo vaccine.
1.1 Problem statement and study justification
East Coast fever is assuming more importance as it continues to be a major economic
problem not only in Zambia, but in many parts of Eastern, Southern and Central Africa
(Makala et al., 2003). While the ITM offers hope in the control of the disease in the long run,
it has a number of drawbacks. Stabilate vials should at all times be stored in either liquid
nitrogen (-196 degrees Celsius) or ultra-freezer (-70 degrees Celsius). The diluent should be
stored in a frozen state at -20 degrees celsius. The requirement for the maintenance of this
cold chain up to the farm level makes the method less appropriate for rural use and it is
expensive for livestock keepers (Mbao et al, 2007). There is therefore a need to devise ways
in which the vaccine stabilate can be carried to the farms without a need for the liquid
nitrogen. This will drastically reduce the cost of the infection and treatment method and
improve its applicability in the immunisation of cattle against ECF. Such developments will

3
make the vaccine more accessible to rural areas (motorbike may be used), and immunization
can be done in more than one place at the same time.
1.2 Objectives
1.2.1 General objective
To compare the efficacy of chitongo theileria parva sporozoites carried on ice to that carried
in liquid nitrogen in cattle.
1.2.2 Specific Objectives
To compare the proportions of the animals that seroconverted after vaccinating with
chitongo theileria parva carried on ice and in liquid nitrogen.
To compare the efficacy of the T. parva chitongo stabilates in calves vaccinated with
sporozoites carried on ice and those carried on liquid nitrogen.
To compare hematological profiles in calves vaccinated with T. parva chitongo
stabilates carried on ice and to those carried on liquid nitrogen.
4
CHAPTER TWO
2.0 Literature review
2.1 Livestock production system in Zambia
The livestock sector has continued to play an important role in socio-economic development
of the country and contributes towards household food security and wellbeing. It accounts for
about 35% of total agricultural production (Anon, 2011b). During the year 2011, the livestock
sector contributed about 8.9% to the national gross domestic product (GDP) (Anon, 2011b).
With an estimated population of 3.9 million (Anon, 2011b), cattle are the most important type
of livestock in Zambia and can be divided into three breeds or: European (Bos taurus),
indigenous (Bos indicus) and the crosses of indigenous and taurine breeds. There are three
main types of indigenous traditional cattle: (i) Barotse, a longhorned Sanga type found in
Western Province, (ii) Tonga, a medium-horned Sanga type found in Southern and Central
Provinces and (iii) Angoni, a short-horned Zebu type in Eastern Province (Pegram et al.
1986).
Livestock production system in the country is divided into commercial and traditional
sectors. In the traditional sector, three main breeds types of cattle are the Tonga, the Baroste
(Sanga types) and the Ngoni (Zebu types) (Aregheore, 1994). Traditional livestock farming is
the preserve of rural families (Chilonda et al. 1999) and is conducted mostly in Western,
Southern, Central and Eastern Provinces. Besides being used as a source of food and draught
power, cattle serve many other functions in the traditional sectors. They are regarded as a
symbol of wealth, are used in marriage ceremonies, are used in setting court fines, and
provide income for the family. Cattle dung is used as inorganic fertilizer in the crop fields.
Small scale cattle farms are family holdings characterized by low input and low output
(Aregheore, 1994). Disease control is limited and in most cases tick control is intermittent or
absent. Because of the extensive production system, herd intermixing and poor disease
control, a variety of cattle diseases, including TBDs, are prevalent in the traditional sector
(Chilonda et al. 1999)
Commercial farms are large undertakings, both beef ranches and dairy farms. They require
big capital investment but also have large economic returns. Commercially, cattle ranching

5
and dairy farming provide a good source of employment to many unskilled people. The main
commercial livestock areas are Southern province, Central province, Lusaka province,
Copperbelt province and the Eastern province (Aregheore, 1994). The main breeds of cattle
in the commercial sector are Boran, Afrikander, Sussex, Gelbvieh, Brahman, Friesian and
Simental. Tick control is practised intensively leaving the animals highly susceptible to TBDs
if challenged. In contrast to the traditional sector, these diseases can be clinically important
and can reach epidemic proportions when intensive control measures break down (Chilonda
et al. 1999).
2.2 Aetiology of ECF
Theilerioses are protozoan infections of wild and domestic Bovidae which occur throughout
much of the world. Theileria parva, a protozoan parasite of domestic cattle and wild buffalo
is the most important Theileria species in Africa, south of the equator (Fandamu, 2005;
Mtambo, 2008; Norval et al., 1992). The classification of Theileria parva has for a long time
been controversial (Irvin and Mwamachi, 1987). However Levine et al. (1980) classified the
parasite as follows; Phylum: Apicomplexa, Class: Sporozoea, Subclass: Piroplasmia, Order:
Piroplasmida, Family: Theileriidae, Genus: Theileria, Species: Theileria parva
Other species under the genera Theileria are T. annulata, T. taurotragi, T. mutans, T. velifera
and T. orientalis. Of the six identified Theileria spp. that infects cattle, the two most
pathogenic and economically important are T. parva and T. annulata. Theileria parva occurs
in Eastern and Southern Africa and causes East Coast fever (ECF or Corridor disease) in
East, Central and Southern Africa, while T. annulata causes tropical theileriosis (TT), also
known as Mediterranean theileriosis and occurs in North Africa, southern Europe and Asia
(OIE, 2008)
ECF was first recognized in Southern Africa as East Coast fever when it is was introduced at
the beginning of the 19th
century with cattle imported from East Africa where the disease is
believed to have been endemic for several centuries. This was after the cattle population was
devastated by Rinderpest (Norval et al., 1992) and this new disease caused dramatic losses
with high mortalities and was initially confused with red water. This virulent cattle disease
later known as ECF was identified for the first time at several locations south of the Zambezi

6
River in 1901 with its principal vector the brown ear tick, Rhipicephalus appendiculatus,
which was already widespread in the region but previously not associated with any disease
(Norval et al., 1992).
2.3 Vectors of Theileria parva
The ticks Rhipicephalus appendiculatus and Rhipicephalus zambeziensis (Walker et al, 1981,
Mtambo, 2008) and to a lesser extent Rhipicephalus duttoni (Neumann 1907, Mtambo 2008)
are the only known field vectors of Theileria parva. In Zambia collections of R.
appendiculatus have been reported in all provinces (Akafekwa, 1976, Mtambo 2008), while
R. zambeziensis has been reported in the major depressions of the Luangwa and Zambezi
river valley systems (MacLeod, 1978) and in Southern province (Speybroeck et al., 2002). In
the Southern province of Zambia R. appendiculatus and R. zambeziensis co-occur in the same
areas and on the same host at the same time (Speybroeck et al., 2002).
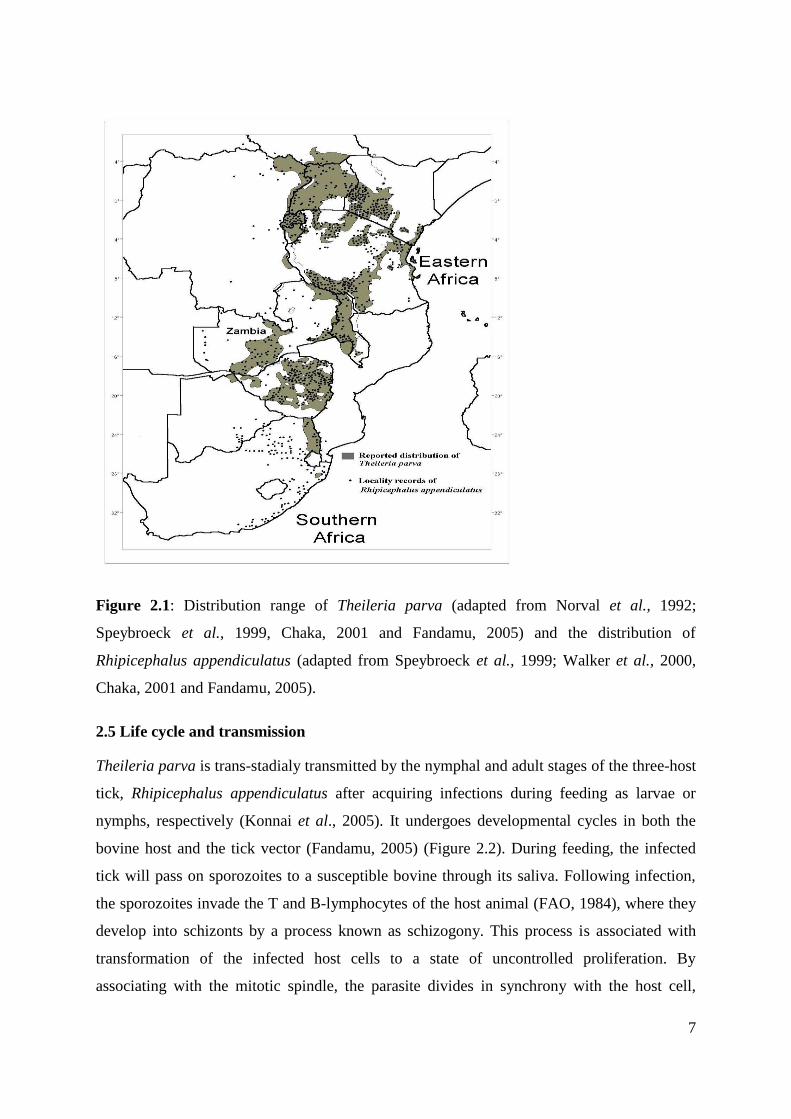
2.4 Distribution
The factors known to affect the occurrence of T. parva include the distribution of R.
appendiculatus, the presence of cattle and wild bovidae, resistance of the host cattle to ticks
and tick-borne diseases and tick control policies that affect tick populations (Lessard et al.,
1990). The distribution of R. appendiculatus is influenced by several factors, the most
important of which are climate, vegetation and host availability (Fandamu, 2005). Theileria
parva is currently distributed within eleven countries in Eastern, Central and Southern Africa,
where it is a major constraint to cattle production (Mukhebi et al., 1992, Fandamu 2005). The
affected countries include Burundi, Democratic Republic of Congo, Kenya, Malawi,
Mozambique, Rwanda, Sudan, Tanzania, Uganda, Zambia and Zimbabwe as shown in Figure
2.1. In Zambia Theileriosis is currently reported in Southern, Eastern, Lusaka, Central,
Copperbelt, Muchinga and Northern Provinces. Western Province is the only major cattle
rearing province that has been spared from the disease to date. The disease has also not been
reported from Luapula and North-western provinces that have least cattle population (Anon,
2010b).
7
Figure 2.1: Distribution range of Theileria parva (adapted from Norval et al., 1992;
Speybroeck et al., 1999, Chaka, 2001 and Fandamu, 2005) and the distribution of
Rhipicephalus appendiculatus (adapted from Speybroeck et al., 1999; Walker et al., 2000,
Chaka, 2001 and Fandamu, 2005).
2.5 Life cycle and transmission
Theileria parva is trans-stadialy transmitted by the nymphal and adult stages of the three-host
tick, Rhipicephalus appendiculatus after acquiring infections during feeding as larvae or
nymphs, respectively (Konnai et al., 2005). It undergoes developmental cycles in both the
bovine host and the tick vector (Fandamu, 2005) (Figure 2.2). During feeding, the infected
tick will pass on sporozoites to a susceptible bovine through its saliva. Following infection,
the sporozoites invade the T and B-lymphocytes of the host animal (FAO, 1984), where they
develop into schizonts by a process known as schizogony. This process is associated with
transformation of the infected host cells to a state of uncontrolled proliferation. By
associating with the mitotic spindle, the parasite divides in synchrony with the host cell,

8
resulting in each daughter cell inheriting the infection (Rocchi et al., 2006). This stage of host
and parasitic cell division is associated with the severity of the pathology and clinical signs
seen in ECF (Rocchi et al., 2006).
Later in infection, some of the schizonts undergo merogony with the resultant merozoites
giving rise to piroplasms that infect red blood cells (Mtambo 2008). It is the presence of these
piroplasms in the infected animal’s blood that provide the source of infection for other ticks
when they feed at the time of parasitaemia. After being taken up by the feeding tick,
piroplasms differentiate into micro and macro-gametes in the tick mid-gut, subsequently
fusing to produce zygotes that invade the epithelial cells (Watt and Walker, 2000).The
zygotes transform into motile kinetes and migrate into salivary glands where they invade the
"e" cells of the type III acini and develop into multinucleated sporoblasts (Fawcett et al.,
1982).When the tick starts feeding, the sporoblast syncytium undergoes cytoplasmic fission
resulting in mature uni-nucleated sporozoites (Fawcett et al., 1982) that are infective to cattle.
9
Figure 2.2: Schematic diagram of the life cycle for Theileria parva: Adopted from
Simuunza, 2009).
2.6 Clinical signs
The incubation period of T. Parva ranges from 8-12 days under experimental conditions
(Fandamu, 2005), but may be much more variable in the field. Schizogony is associated with
transformation of the infected cells to a state of uncontrolled proliferation. This stage of
parasitic division is associated with the severity of the pathology and clinical signs seen in T.
parva infections (Rocchi et al., 2006). An occult phase of 5-10 days follows before infected
lymphocytes can be detected in Giemsa-stained smears of cells aspirated from lymph nodes
(Kahn et al, 2005). Piroplasms can be detected 5-8 days after the detection of schizonts.
Fever occurs 7-10 days after parasites are introduced (inoculated) in the host (Fandamu,
2005). Death usually occurs within 30 days after infection of susceptible cattle by infected
ticks (Irvin and Morrison, 1987).

10
East Coast Fever is characterized by lymphadenopathy, pyrexia, dyspnea and frothing due to
interstitial pneumonia and pulmonary oedema. Other signs may include subcutaneous
oedema, diarrhoea, lacrimation and mortality. Petechiation on mucous membranes,
inappetance, ceasation of rumination, salivation, serous and nasal discharge, rapid and weak
heartbeat, and intestinal ulceration may be exhibited (Mtambo et al., 2008).
2.7 Diagnosis
ECF is initially suspected from the presence of clinical signs described above. Confirmative
diagnosis will require demonstration of the presence of or evidence of exposure to the
parasites. In the Laboratory, East Coast fever is diagnosed by either detection of piroplasms
in the blood, schizonts in lymph node biopsies, antibodies by the Immuno-Fluorescent
Antibody Test (IFAT) (Burridge and Kimber,1972) or polymerase chain reaction (PCR)
(Ogden et al., 2003). PCR, although highly sensitive, is not suitable for routine field use due
to high cost. It however is described as the best test for discriminating T. Parva from acute
infections caused by other Theileria species. The disease can also be diagnosed using loop-
mediated isothermal amplification (LAMP) (Skilton et al., 2002) and reverse line blot assay
which is based on hybridisation of PCR products to specific oligonucleotide probes
immobilised on a membrane (Gubbels et al., 1999).
A slide enzyme-linked immunosorbent assay (SELISA), described by Kung'u and Goodger
(1990) for Babesia cacacahas has also been adapted to use schizont-infected lymphoblasts as
antigen for ECF diagnosis.
The most widely used field diagnostic test for Theileria species is the indirect-fluorescent
antibody (IFA) test. For the IFA test, both schizont and piroplasm antigens may be prepared
on slides or in suspension and preserved by freezing at ≤ –20°C, except in the case of the
piroplasm suspension, which is stored at 4°C (OIE ,2008). Test sera are diluted with bovine
lymphocyte lysate and incubated with the antigen in suspension, and anti-bovine
immunoglobulin conjugate is then added. Using the test as described, the fluorescence is
specific for the causative agent. The IFA test is sensitive, fairly specific, and usually easy to
perform (OIE terrestrial manual, 2008).The major drawback of the IFA test is its lack of
specificity as T. Parva cross reacts with other Theileria parasites like T. Taurotragi and T.
11
Annulata (Burridge et al., 1974; Norval et al., 1992) and it is also often difficult to assess the
degree of fluorescence.
PCR and ELISA are the most sensitive tests followed by IFAT and then blood smear. PCR is
also the most specific test and blood smears the least specific. The comparison of the
sensitivity, specificity, cost and throughput of four methods used in the diagnosis of TBDs of
cattle is shown in table 2.1.
Table 2.1: Comparison of methods for detection of ECF. +=very low, ++=low, +++=high
and ++++=very high (adapted from Simuunza, 2009)
Method Sensitivity Specificity Cost Throughput
PCR ++++ ++++ ++++ ++++
Blood smear + + + ++
IFAT ++ ++ ++ ++
ELISA +++ ++ ++ +++
2.8 Epidemiology
Risk factors that have been identified to influence the occurrence of TBDs include the
distribution and abundance of tick vectors, the abundance and movement of cattle
populations and the host resistance to both the tick and the responsible pathogen (Bakheit et
al, 2002; Norval et al., 1988; Salih et al., 2007, Simuunza et al., 2010). The ability of larval
and nymphal R. appendiculatus ticks to pick-up T. parva from carrier cattle and to transmit it
to naive animals after moulting into nymphs and adults, respectively, was assessed (Marcotty
et al., 2002). Although both instars were capable of picking up infection and subsequently
transmitting the sporozoites to induce clinical and lethal ECF in susceptible cattle, it was
observed that the prevalence of T. parva infection in nymphs was much lower than in adult
ticks, confirming the primary role of adults in the transmission of ECF in endemic conditions.
Similar results were obtained from the field where by the increase in the incidence of ECF
clinical cases corresponded with the peak of adult R. appendiculatus activity (Marcotty et al.,
2002). Natural infection rates found in vector ticks were much lower than that observed in
experimental conditions. These findings indicate that an important proportion of the vector

12
ticks in the field tend to feed on alternative hosts other than cattle. It has also been reported
that older ticks seem to lose part of their infectivity (Marcotty et al., 2002).
Carrier status in animals exists for T. parva. A carrier animal is one that has survived the
primary infection and afterwards maintains the infectious parasite stages (piroplasms) in
blood at levels high enough to infect ticks but often too low to be detected by normal
parasitological investigations (Medley et al., 1992). Animals that recover are immune to
subsequent challenge with homologous strains, but may be susceptible to some heterologous
strains. Most recovered or immunized animals remain carriers of the infection (Kahn, 2005)
Epidemiological state of theileriosis can be determined in a population of cattle, by using five
indicators: herd antibody prevalence, disease incidence, age group of cattle affected by the
disease and case-fatality (Norval et al., 1992). These indicators can be used to classify ECF
affected areas into endemic, epidemic and free areas.
The Endemic areas: These are areas where the parasite (T. parva) and the disease
(ECF) are established and only calves are affected by the disease and all older animals
have been exposed to the disease and are considered to be immune. Case fatality rate is
low.
Epidemic areas: These are newly ECF infected areas where conditions for disease
transmission exist. In these areas, all age groups of cattle are affected and the case
fatality ratio is close to 100%.
Free areas: These are areas where the parasite (T. parva) is absent and the disease is
not reported.
2.9 Control and treatment
East Coast fever can be controlled by different and/or a combination of these methods: tick
control, livestock movement restrictions, chemotherapy and immunisation (Mbao et al.,
2007).
2.9.1 Tick control
Vector control includes application of acaricides, immunisation and selection of tick resistant
cattle. Acaricides need prolonged application to be effective but with time. However,

13
prolonged use of chemicals to control ticks has various problems which includes: the tick
developing resistance, accumulation of residues in animal products, environmental pollution
and the high cost of arcaricides (Ghosh et al. 2007). Intensive use of acaricides may also
interfere with enzootic stability, hence creating a susceptible animal population which are
liable to disease epidemics whenever there are disruptions to control programmes (Kocan et
al. 2000; Lawrence et al. 1980). Tick resistant breeds of cattle and anti-tick vaccines have
also been used. At the moment no vaccine is available for the control of the vectors of T.
parva.
2.9.2 Use of resistant Breeds
Genetically resistant animals, i.e. animals which show a heritable ability to become
immunologically resistant to tick infestation, are a vital component of many tick control
strategies (Willadsen 2004). The Zebu (Bos indicus) breeds are generally more resistant than
the European Bos Taurus cattle (De Castro, 1997). However it may be difficult to breed for
tick resistance while at the same time preserving some of the desirable traits or, resistance
may simply fail to develop in some hosts (Simuunza et al., 2011; Wilkinson et al., 1962).
2.9.3 Livestock movement control
The movement of livestock in Zambia is controlled by cattle movement permits issued by
Government Veterinary Officers from the Department of Veterinary Services (Anon, 2010c).
Whilst the restrictions on cattle movements can restrict trade, they are necessary to limit the
spread of cattle diseases in general and ECF in particular.
In Zambia, movements within ECF endemic areas are allowed. However, movements from
endemic areas to non-endemic areas are only allowed on the following conditions (Anon,
2010b):
Animals to be moved must test negative by immunofluorescent antibody test, and
lymph and blood smear microscopy.
Cattle can only be allowed to move within seven days after the test. If they overstay
for more than seven days, they should be subjected to a new set of tests;

14
Animals are treated with acaricides before they are moved to ensure that they are tick
free;
Animals are treated with Buparvaquone before they are moved to ensure increased
probability of freedom from parasite;
Animals are subjected to compulsory quarantine at destination under close veterinary
supervision for a minimum period of 26 days (The incubation period for East Coast
fever is 7-25 days) and are checked for any signs of ECF by the local veterinary officer
before they could be allowed to mix with other animals; and,
Animals for slaughter must be branded with slaughter brands and must be slaughtered
under veterinary supervision within 24 hours of their arrival at destination.
2.9.4 Chemotherapy
There are three effective drugs for the treatment of ECF: parvaquone (ClexonTM
and
ParvaxoneTM®
), buparvaquone (ButalexTM®
), and halofuginone lactate (TeritTM®
). Each of
these drugs was introduced to the market within the last 20 years (Norval et al., 1992).
However, there are two constraints to the widespread use of medication: the drugs are too
expensive for most African farmers, and rapid, accurate diagnosis and immediate
administration of the drug are required for effective therapy (Norval et al., 1992).
Halofuginone is toxic and is no longer available on the markets.
2.9.5 Immunisation
Theiler (1911) demonstrated that cattle could be infected with T. parva by transfer of infected
cells from tissues of clinically affected animals, and that recovered animals were immune to
subsequent challenge (Theiler, 1911). These results by Theiler and other observations, led to
Spreull taking a field trial in which he vaccinated 283,000 cattle with spleen and lymph node
cell suspensions from T. parva infected cattle (Spreull 1914). Unfortunately, about 25 % of
the animals died as a result of infection established by the immunisation procedure. However,
70 % of the cattle that survived were immune to subsequent challenge. This led to the
development of the infection and treatment method (ITM) which is currently the only
available technique for immunoprophylaxis against homologous challenge (Radley et al.,
1975). A long-acting tetracycline and defined doses of cryo-preserved sporozoites given to

15
cattle was found to induce immunity against T. parva. This protocol results in solid immunity
to challenge with only homologous parasite. A polyvalent vaccine termed Muguga cocktail,
was developed in the early 1980's (Radley et al., 1975a; Radley, 1981).this was known as the
Muguga cocktail, and caused immunity against a range of heterologous isolates (Radley et al.
1975b). It contained a mixture of three selected parasite isolates (Muguga, Kiambu 5 and
Serengeti). This vaccine has been deployed extensively in Tanzania and Uganda and to a
lesser extent in Malawi and Zambia (McKeever 2007). In addition, experimental
immunisation with a single parasite isolate (Marikebuni) provided protection against
challenge from a number of heterologous isolates (Morzaria et al. 1987). This parasite stock
has been used to successfully vaccinate cattle in the field in Kenya (Morrison & McKeever
2006). In the Eastern province of Zambia, the local T. parva Katete stock is used to immunize
cattle, while in the Southern province, the local Chitongo strain has been used. Major
histocompatibility complex (MHC) class I-restricted cytotoxic T lymphocytes are believed to
be the major protective immune effector echanism in cattle (McKeever et al. 1999; Preston
and Jongejan 1999). For T. parva sporozoit antigens and schizont antigens were used in
vaccine development. These provoke MHC class I- and class II-restircted T cells (Preston and
Jongejan 1999).
Theileria parva is an obligate intra-cellular organism and needs its vertebrae and invertebrate
host to survive. It can only survive outside these hosts through suspension of the metabolic
reactions by cryopreservation. The preparation of cryopreserved stabilates in the I&T method
of immunisation has been adapted from preservation of trypanosomes was developed by
Cunningham et al. (1973) (Mbao,2006).
The maintenance of the cold chain in liquid nitrogen up to the time of inoculation and the
cost of the reference long-acting oxytetracycline (Terramycin LA, Pfizer) have been the main
drawbacks of the method (Marcotty et al. 2001). In addition, there are occasional difficulties
arising from either failure to achieve immunisation due to cold chain breakdown and
sporozoites inactivation or severe, possible fatal, clinical reaction due to inadequate doses or
quality of tetracycline used to attenuate pathogenic effects of administration of live parasites
(Minjauw and Mcleod, 2001). Other draw backs are that immunized animals become carriers
of the parasite (Kariuki et al., 1995) and most vaccines can only offer protection to
homologous challenge, limiting wider use of this method in a country. No literature could be

16
found about why it was previously assumed that it was better to keep the stabilate in liquid
nitrogen rather than ice.

17
CHAPTER THREE
3.0 Materials and Methods
3.1 Study Design
The study was carried out in two phases. Phase one was a field trial and the second phase was
an indoor trial. The study was done to compare the efficacy of Theileria parva chitongo
sporozoites carried on ice to that carried in liquid nitrogen in cattle. The indoor trial was also
done to compare haematological profiles in calves vaccinated with T. parva chitongo
stabilates carried on ice and to those carried in liquid nitrogen. The vaccine used in both the
field and indoor trial was purchased from Centre for tick and tick borne diseases (CTTBD) in
Malawi.
3.2 Field trial
The field trial was similar to that conducted by Marcotty et al., (2001). It was conducted in
southern province of Zambia. Five districts, selected purposively, were included in this study,
namely Mazabuka, Choma, Monze, Namwala and Kalomo. In each district, herds were
randomly selected. All animals in each herd aged three months and two years that had no
history of vaccination against ECF or were not ear tagged were included in the trial. Each
herd was then divided into two groups. Cattle in the first group were vaccinated with the
conventional vaccine carried in liquid nitrogen (VGLf) and the second group was vaccinated
with the vaccine carried on ice (VGIf). Blood samples in EDTA tubes were collected and
temperature taken before immunisation on day zero and 35 days after immunisation for each
animal. The temperature of the animals was also taken once prior to vaccination. This study
was comparing the efficacy of theileria parva chitongo sporozoites carried on ice to that
carried in liquid nitrogen in the field. This was done by comparing seroconversion ratios
between group vaccinated with T. parva carried on ice and the group vaccinated with T.
parva carried in liquid nitrogen.
3.2.1 Sample Size calculation for field trial
This was determined using stataSE12®. In calculating the sample size, the significance level
(α) was set at 0.05, the study power at 0.95, the proportion of animals to seroconvert with

18
VGLf was 0.9 and with VGIf was 0.78 and n1/n2=1. This gave us a sample size of n1=256 and
n2=256. In this study n1=302 were vaccinated with T. parva chitongo carried in liquid
nitrogen and n2=291 cattle were vaccinated with T. parva chitongo carried on ice. The basic
rules considered for sample size calculation for clinical trials were as described by Tushar
(2010).
Thus a total of 593 from 29 herds in 5 districts were sampled at the beginning of the field
trial. Choma, Kalomo and Namwala had each 120 cattle included, while Mazabuka had 116
and 117 from Monze.
3.2.2. Sample collection for the field trial
Whole Blood samples in EDTA coated vacutainer tubes were collected from all cattle
included in the study, in the five different districts prior to immunisation. These animals’ ages
included in the study were approximately from three months to two years with no history of
vaccination. However, the animals were vaccinated without knowing their T. parva antibody
status. The blood was checked later on. Blood smears on blood slides were also prepared. In
addition, rectal temperatures to ensure that only animals that are generally healthy are
vaccinated and packed cell volume (PCV) were also recorded prior to vaccination. Whole
blood in EDTA coated vacutainer tubes was collected from the same animals after 35 days to
check whether the animals had seroconverted.
3.2.3 Vaccination of calves in the field trial
For the VCLf (Theileria parva Chitongo vaccine carried in liquid nitrogen), the vaccine vials
were removed from liquid nitrogen then thawed in water at 37°C for 5 minutes. The
stabilate was then diluted with a diluent which contained Eagle’s minimum essential medium
(MEM) and antibiotics (Penicillin, streptomycin and kanamycin). One ml of stabilate was
mixed with nine mls of diluent for a final dilution of 1:10. The diluted vaccine was left at
ambient temperature for five minutes for stabilization of the stabilate in the diluents before
immunization could be done. The diluted stabilate was then given to the first group of
animals from the same herd. All animals were immunized within 30 minutes after dilution.
For the VCIf (Chitongo Theileria parva vaccine carried on ice) the vaccine vials were
removed from liquid nitrogen thawed in water at 37°C for five minutes. The vaccine was then
diluted with a diluent as described above and transferred onto ice bath (ice cubes + water in a

19
small cooler box). This was done from the respective district veterinary office. The diluted
stabilates were then transported to the field in the cooler box. The animals were brought to a
central place and vaccination took place four to six hours after thawing. This was because
previous studies reported that immunisation performed with a stabilate kept on ice for up to
4- 6 hours had an efficiency of 90% (Marcotty et al ., 2001). Animals in each vaccination
group were tagged with ear tags of different colours after vaccinating.
These were injected subcutaneously over the pre-parotidian lymph node and injecting a long
acting oxytetracycline intramuscularly. All the Immunised animals were closely monitored
for 2 weeks post-vaccination for side effects (anaphylactic shock and dysimmunisation,). The
animals were also monitored for fever (>40) and presence of schizonts on lymph node smear.
The rectal temperatures were recorded and the parotid glands palpated for any signs of
swelling once a week.
In the field, animals showing signs of illness from diseases other than tick borne diseases
(TBDs) during the monitoring period were treated with drugs that would not have an effect
on development T. parva (penicillin or penicillin based drugs).
3.3 Indoor trial
3.3.1 Study animals
A parallel group study design that involved the use of male Friesian cattle aged between 3
months and 1 year was done. The cattle were sourced from farms around Lusaka which
practiced strict tick control. The sourced cattle were only included in the study after they
tested negative for theileriosis on IFAT and microscopic examination of blood/lymph smears.
The calves were assigned identity numbers after which they were randomly allocated to two
treatment groups, one with calves vaccinated using conventional vaccine carried in liquid
nitrogen (VCLi)(n1=9) and the other group vaccinated with the vaccine carried on ice
(VCIi)(n2=8). This study was comparing efficacy of theileria parva chitongo carried in liquid
nitrogen to that carried on ice between two groups and further to see whether temperature and
haematological parameter results could be replicated under controlled conditions. It was also
done to compare the survival chance or probability after challenging between the group VCLi
and the group VCIi.

20
3.3.2 Sample Size determination
For the experimental study the sample size was determined using sigmaXL® (version 6.1),
considering the basic rules for sample size calculation for clinical trials as described by
Tushar (2010), with the following assumptions:
Alternative proportion (P0): The proportion of surviving animals after challenge with a neat
stablilate among those that were vaccinated with the vaccine carried in liquid nitrogen was
taken as 0.97
Hypothesised proportion (P1): The proportion of surviving animals after challenge with neat
stabilate among those that were vaccinated with the vaccine carried on ice was taken as 0.7
Statistical power (1-Beta) used was 0.95.
Significance level (alpha) used was 0.05.
From this, the sample size for the whole study including the control group was 20 (10
animals per group). However, due to financial challenges only 19 bull calves ranging from
three months to eight months old were included in the study.
3.3.3 Sample collection
Before each sampling, the calves were examined clinically to determine their health status.
From clinical examination, basic parameters for each subject such as the rectal temperature,
presence or absence of lymphadenopathy were determined. The approximate age of the
animals was obtained from the owners. Dual blood samples were aseptically collected from
the jugular vein using vacutainer needles and adapter in EDTA and plain tubes. The Blood in
the EDTA tubes were used to make blood slides and PCV determination. The Sera in the
plain tubes was separated and stored at -20⁰C until needed for laboratory analysis. The
samples were collected twice before vaccinating, 41 days post vaccinating and 30 days after
challenge. Sample collection was done every other day or after three days when it was not
possible to do it every other day throughout the course of the study.
3.3.4 Vaccination of the indoor trial calves
For both the VCLi (Theileria parva Chitongo vaccine carried in liquid nitrogen) and the VCIi
(Chitongo theileria parva vaccine carried on ice), the vaccine vials were prepared as in
21
section 3.2.3. The vaccines were administered subcutaneously over the pre-parotidian lymph
node concurrently with a long acting oxytetracycline intramuscularly.
All the Immunised animals were closely monitored for 2 weeks post-vaccination for side
effects (anaphylactic shock and dysimmunisation,) as described in section 3.2.3.
3.3.5 Challenge of animals in the indoor trial
The animals were challenged 41 days post vaccination. Neat stabilate of T. parva chitongo
was used to challenge the animals. Each vial of the neat stabilate normally has a
concentration of sporozoites which is equivalent to 10 ticks per ml but may have been
adjusted depending on whether parasite infection rates in a particular batch were either very
high or very low (OIE, 2008). This was given to the animals by injecting subcutaneously over
the pre-parotidian lymph node
3.4. Lab analysis of samples
3.4.1 Thin blood slide examination
Thin blood smears were made for both field and experimental animals. Thin blood smears
were made as described by Dacie (1984). Briefly, a drop of blood was placed on the centre
line of a glass slide. Another slide, which was used as a spreader was placed at an angle of 45
degrees to the slide containing the blood drop and moved back to make contact with the drop.
The drop was allowed to spread along the line of the spreader and the film was spread by a
rapid, smooth, forward movement of the spreader. The smears were dried and fixed with 70%
methanol and stained with Giemsa and examined at x100 under oil immersion for the
detection of haemoparasites. A minimum of 100 fields were examined per slide to determine
whether parasitaemia was present.
3.4.2 Determination of packed cell volume (PCV)
Determination of PCV was done for both field and indoor animals. The PCV was measured
using the microhaematocrit method as described by Embert (1986). Briefly, blood was
collected into heparinised capillary tubes. The blood was allowed to enter the tube by
capillarity, leaving at least 15 mm of the tube unfilled. The tube was then sealed at one end
using a sealant. The sealed tubes were placed in a microhaematocrit centrifuge and span at 9
000 revolutions per minute (rpm) for five minutes before measuring the PCV using a PCV
reader.

22
3.4.3 Differential white blood cell counts
This was only done for the experimental animals. The resultant stained thin smears prepared
for haemoparasite examination, were used for differential leukocyte counts as described by
Embert (1986). Briefly, stained thin blood smears were examined using the oil immersion
objective for accurate cell identification. The slides were examined starting with the thin end
of the smear, and systematically traversing the slide. The fields that were used for
examination were those in which erythrocytes were well separated and the leukocytes thinly
spread. Cells were identified as previously described (Anon., 2012) and a record was made
using a multiple tally counter. A total of 100 cells were counted per slide.
3.4.4 Indirect fluorescent antibody test
This was done for both field and experimental animals. Plasma for the field trial and sera for
the indoor trial was used for this test. Prior to testing, if the plasma were frozen, it was
thawed before proceeding. Using U- shaped micropipette plates 195 ul of phosphate buffer
saline (PBS) were dispensed into all wells in column 1, 3, 5, 7, 9 and 11 using a multi-
channel pipette. Five ul of test plasma was sensed into each well containing 195 ul of PBS.
This was the 1:40 dilution. Each well corresponded to one particular animal’s plasma. 100 ul
of PBS was then dispensed into all wells in columns 2, 4, 6, 8, 10 and 12 using a multi
channeled pipette. Then 100 µl of diluted plasma with PBS was transferred from column 2
into column 1, i.e. 100 µl from well A1 into A2 and B1 into B2 and so on. This is the 1:80
dilutions. The negative and positive controls were also diluted in a similar manner. Then The
IFAT- T. parva antigen slides where then removed from the -20⁰C deep freezer and dried
using a hair dryer. Then, ten circles were made on the antigen slides using nail polish. These
dilutions were performed for each sample. Fifteen µls of each diluted test plasma was
pipetted into each ring for the 1:80. For the field trial 1:40 and 1:80 dilutions were made were
examined. This was to make sure that weak positives and weak negatives were also detected.
The 1:40 dilution is more sensitive than the 1:80. For the indoor trial only 1:80 dilutions were
examined, because this is what is normally used for routine diagnosis for animal movements
at Central Veterinary Research Institute (CVRI) and has it been validated. Fluorescein
labelled antiglobulin (conjugate) was placed on the preparation which gave a yellowish-green
fluorescent on positive samples when visualised under a fluorescent microscope.

23
3.5 Data Analysis
Stata SE 12 was used as the data analysis software. Descriptive statistics were generated for
each group of animals in both the field and indoor trials. The chi-square test was used to test
for association among categorical variables measured between the groups and the student’s t-
test for association between continuous variables. The relative risk for the indoor trial and
survival analysis was done and Kaplan-meier curves were generated for each group and a
log-rank test carried out to check for statistical significant differences in survival time
between animals immunized with T. parva chitongo carried on ice and those immunized with
that carried in liquid nitrogen. The relative vaccine efficacy (VE) was calculated as described
by Orientien et al., (1985):
VE(%)=(1-RR)*100, where RR is the relative risk
And the 95% Confidence interval for the vaccine efficacy was calculated as follows:
For the lower limit of VE=(1-RRu)*100, where RRu is the upper limit of the relative
risk
For the upper limit of VE=(1-RRl)*100, where RRl is the lower limit of the relative
risk

24
CHAPTER FOUR
4.0 Results
4.1 Field trial
A total of 593 cattle comprising of 29 herds from five districts were sampled at the beginning
of the field trial. Hundred and twenty animals in each district were sampled in Choma,
Kalomo and Namwala, 116 from Mazabuka and 117 from Monze (Table 4.1). From the 593
samples 291 were from cattle vaccinated with T. parva Chitongo stabilate carried on ice
(VCIf), while 302 were from cattle vaccinated with T. parva chitongo stabilate carried in
liquid nitrogen (VCLf). These animals were vaccinated without knowing whether they were
positive or negative for T. parva.
The temperature, weight and PCVs of the animals were taken before vaccinating. The
temperature of the cattle before vaccinating ranged from 37.7 ⁰C to 39.9 ⁰C with a mean
value of 39.1 ⁰C (95% CI 39 - 39.1). The weight ranged from 33 kgs to 340 kgs, with a mean
value of 120.1 kgs (95%CI =115.6 - 124.5) and standard deviation of 55.5Kgs. The PCVs
ranged from 20% to 50%, with a mean value of 34.9% (95% CI=34.5 - 35.4).
From the 593 blood smears collected, No piroplasms were seen in 549 of the animals, while
Theileria piroplasms were seen in 44 of them at the time of vaccination (this was known later
in the study as the analysis could not be done immediately). Kalomo and Namwala districts
had the highest number of cattle positive for T. parva piroplasms on microscopy, with 16.7%
each (95% CI = 10 - 23.4) (Table 4.1). No T.parva piroplasms were observed from cattle
from Mazabuka and Monze districts.

25
Table 4.1: Pre-immunization prevalence of Theileria piroplasms in the study districts.
District No. animals sampled Prevalence (%) 95% Conf.
Interval
Choma 120 2.5
0 -5.3
Kalomo 120 16.7 10 - 23.4
Namwala 120 16.7
10 - 23.4
Mazabuka 116 0 -
Monze 117 0 -
The overall pre-immunization results for the IFA test showed that in the 1/40 dilution 20.0 %
(95% CI=16.7% - 23.1%) were positive, while in the 1/80 dilution 8.4% (95%CI=6.2%
to10.7% were positive. The IFAT pre-immunisation results showed that in the 1/40 dilutions
Monze had the highest proportion of positives with 33.3% (95% CI= 24.7 -41.9) and in the
1/80 dilutions Choma had the highest proportions of positives with 12.5% (95% CI= 6.5 -
18.7) as shown in table 4.2. Furthermore, 3.39% (95% CI=0.10%-0.67%) of the samples
collected on the day of vaccination were positive both on blood smears and IFAT (In the 1:40
dilution).

26
Table 4.2: Pre-immunization prevalence of Theileria parva chitongo on IFAT 1/40 and IFAT
1/80 in the study districts
District n Proportion of
animals that
tested positive
before
immunizations
in 1/40 (%)
95% Conf.
Interval
Proportion of
animals that
test positive
before
immunization
in 1/80 (%)
95% Conf.
Interval
Choma 120 13.3 7.2 - 19.5 12.5 6.5 - 18.5
Kalomo 120 11.7 5.9 - 17.4 5.8 1.6 - 10.1
Mazabuka 116 30.2 21.8 - 38.6 11.2 5.4 - 17
Monze 117 33.3 24.7 - 41.9 6.8 2.2 - 11.4
Namwala 120 11.7 5.9 - 17.4 5.8 1.6 - 10.1
Tables 4.3 shows the number of animals that were negative before immunization and were
presented by owners in each district and tested positive after immunization. These post
immunization results in table 4.3 show that Namwala had the highest proportion of positives
in the 1/40 dilution with 95.1 % (95% CI=90.8 – 99.3) and Mazabuka had the highest
proportion of positives in the 1/80 dilution with 93% (95% CI=86.9 - 99).

27
Table 4.3: Proportions of samples that tested positive after immunization from those that
were negative before immunization per district in the 1/40 and 1/80 dilutions at 95% CI
District n1 Proportion of
animals that
tested positive
after
immunization
1/40 (%)
95% Conf.
Interval
Proportion of
animals that
test positive
after
immunization
1/80 (%)
95% Conf.
Interval
Choma 97 84.5 77.3 - 91.8 81.4 73.6 - 89.2
Kalomo 91 89 82.5 - 95.5 84.6 77.1 - 92.1
Mazabuka 71 93 86.9 - 99 93 86.9 - 99
Monze 61 77.1 66.4 - 87.7 75.4 64.5 - 86.3
Namwala 101 95.1 90.8 - 99.3 58.4 48.7 - 68.1
The 1/40 dilution results showed that from the animals immunized with VCLf 89.6% (95%
CI= 85.5 - 93.7) had seroconverted and from those immunized with VCIf 87.1% (95% CI=
82.5 - 91.7) had seroconverted (table 4.4). The 1/80 dilution results showed that VCLf 80.2%
(95% CI= 74.8 - 85.6) seroconverted while in VCIf 75.1% (95% CI= 69.2 - 81) had
seroconverted (table 4.4).
There was no significant difference in seroconversion between those animals vaccinated with
stabilate carried in liquid nitrogen and that carried on ice for both the 1/40 and 1/80dilutions
(P=0.450, P=0.242, respectively)(Tables 4.4 and 4.5 respectively)
1 Number of animals that tested negative before immunization

28
Table 4.4: Positive post sampling proportions of IFA Test of 1/40 and 1/80 dilutions,
T.parva vaccine carried in liquid nitrogen and that carried on ice
Dilutions Vaccine type n Prevalence
(%)
95%
Confidence
Interval
p-value
1/40 VCLf 212 89.6 85.5 – 93.7
0.450 VCIf 209 87.1 82.5 -91.7
1/80 VCLf 212 80.2 74.8 – 85.6
0.242 VCLi 209 75.1 69.2 - 81
.
4.3 Indoor trial
Of the 19 animals that were procured, 2 animals died before the experiment begun due to
causes not related to the study. The remaining 17 animals (Nine in the group immunized with
vaccine carried in liquid nitrogen-VCLi and eight in group immunized with vaccine carried
on ice-VCIi) were immunized on the 28th
day of the study as shown by the red arrow (Figure
4.1) and challenged after 41 days post-immunization as shown by the green arrow. The first
piroplasms were seen from the group immunized with stabilate carried on ice on day six post-
immunization and were seen 12 days post-immunization in the group vaccinated with
stabilate carried on liquid nitrogen. The first schizonts were detected 12 days post
immunization in some animals of both groups. Antibodies to T. parva on IFAT were detected
from day 8 post immunization in some animals in both groups (6 in group VCLi and 6 in
group VCIi. According to the IFAT test all animals in the two groups had seroconverted by
day 14 post-immunization. During the experiment 4 more animals had died due to causes
unrelated to the disease under study. These were on the 1st, 8
th, 20
th and 23
rd day post-
immunization. These were not included in the analysis. This left 14 animals to follow-up
during the experiment: six in the group immunized with the vaccine carried on ice (VCIi) and
8 in the group immunized with vaccine carried in liquid nitrogen (VCLi).
Mean PCVs in each group per week were calculated and the results are shown in Figure 4.1
for the two groups. The figure shows that both groups had similar PCVs during the period of

29
the trial. The PCVs of the animals reduced in both groups as the trial went on. In group
VCLi the mean PCV before immunization was 33.2% (95% CI 31 – 35.5), after
immunization it was 33.3% (95%CI 32.4 – 34.2) and after challenging it was 30.1% (95% CI
28.3 – 31.9). In group VCIi the mean PCV before immunization was 32.9% (95% CI 30.6 –
35.2), after immunization it was 34% (95% CI 32.9 – 35.2) and after challenging it was
29.8% (95% CI 28 – 31.6). The PCVs continued to reduce in both groups after challenging
the animals. The overall mean PCV in group VCLi was 32.10% (95% CI 31.2 - 32.1), while
it in group VCIi was 32.29% (95% CI 31.3 - 33.3). There was no significance difference in
the change in PCV between the two groups (p = 0.768).
20
25
30
35
40
PC
V
0 20 40 60 80 100Days
VCLi VCIi
Fitted values for VCLi Fitted values VCIi
Day of immunization
Day of Challenge
Figure 4.1. Weekly mean PCV of animals immunized with VCLi and VCIi
The mean temperature in each group per week was calculated and scatter plot and fitted lines
are shown in Figure 4.2. The two groups also had similar mean temperatures during the
30
course of the experiment. The mean temperature in group VCLi before immunizations was
38.5˚C (95%CI 38.4 – 38.6), after immunization it was 38.6˚C (95%CI 38.4 – 38.7) and after
challenging it was 38.7˚C (95%CI 38.4 – 38.9). The mean temperature in group VCIi before
immunizations was 38.8˚C (95%CI 38.4 – 39.2), after immunization it was 38.4˚C (95%CI
38.3 – 38.7) and after challenging it was 38.4˚C (95%CI 38.1 – 38.6). Mean variations in
temperature within the groups from before immunizations to after challenging were minimal.
The overall mean temperature in group VCLi was 38.6˚C (95%CI 38.5 - 38.7) and that in
group VCIi was 38.5 C (95%CI 38.3 - 38.6). There was no significant difference in the
change in temperatures between the two groups (P=0.2484).
37.5
38
38.5
39
39.5
40
Tem
pera
ture
(de
gre
es c
els
ius)
0 20 40 60 80 100Days
VCLi VCIi
Fitted values for VCLi Fitted values for VCIi
Day of immunization
Day of challenge
Figure 4.2 Mean daily temperatures of the calves in the two groups.
The mean numbers of leucocytes per week for each group were calculated (figure 4.4).
Everything apart from the lymphocyte count was within normal range. There was a slight

31
increase in the leukocyte count probably due to the slight increase in the lymphocytes after
immunizing the animals in both groups. A graph generated to compare the mean lymphocyte
count between two groups (figure 4.3). The mean lymphocyte count (in percentages) for
group VCLi before immunizations was 47.8% (95% CI 38.3 – 57.3), after immunization it
was 54.9% (95% CI 52.3 – 57.4) and after challenging it was 52.7% (95% CI 49.7 – 55.7).
The mean lymphocyte count (percentages) for group VCIi before immunizations was 44.3%
(95% CI 34.7 – 53.9), after immunization it was 58.7% (95% CI 56.5 – 60.8) and after
challenging it was 53% (95% CI 49.7 – 55.3). The increase in percentage count of
lymphocytes in both groups was from the day of vaccination to the end of the experiment.
The mean percentage of the lymphocytes in group VCLi was 53.4% (95% CI = 51.4 - 55.3)
while in group VCIi was 55.3% (95% CI = 53.2 - 57.2 as shown in table 4.5. There was no
significant difference in values of lymphocytes between the two groups as shown in table 4.5
(P=0.2081). There was no change in the number of Neutrophils, Eosinophils and Platelets in
both groups during the course of the experiment as shown in Figures 4.6 and 4.7. These were
within normal range of 2-7% for Monocytes, 2-20% for Eosinophils, 15-45% Neutrophils,
and 0-2% basophils.

32
45
50
55
60
65
Num
ber
of ly
mph
ocyte
s
0 20 40 60 80 100days
VCLi VCIi
Fitted values for VCLi Fitted values for VCIi
Day of immunization
Day of Challenge
Figure 4.3. Mean percentage of lymphocytes for animals vaccinated with VCIe and VCLe
per week
Table 4.5 Mean number of lymphocytes for the two groups throughout the study
Group mean 95%
confidence
interval
p-value
VCLi 53.4 51.4 55.3
0.208 VCIi 55.2 53.2 57.2

33
02
04
06
01
03
05
0
VCLi VCIi
mean of lymp mean of band_neut
mean of seg_neut mean of eosino
mean of mono mean of basop
(%)
Figure 4.4. Differential blood cell count for animals immunized with vaccine carried on
liquid nitrogen (VCLi) and vaccine carried on ice (VCIi)
Survival analysis was done on 14 animals from the group vaccinated with VCLi and VCIi.
Only right censoring was considered in our study. Two animals in each group did not die
during the study. These where put down at the end of the study time. The total time at risk
was 663 animal days. The failure event was death of an animal. Table 4.6 below shows
survival time by vaccine according to the carriage material. The calves in the VCLi group
started dying on the 20th
day after challenge, while the animals in VCIi group started dying
23 days after challenge. The column fail represents the number of animals that died during
the time interval. At the end of 63 days post challenge only 2 animals were left in each group.
The row function represents the probability that the subject will die in the given time
interval, conditional upon surviving without the outcome up to the beginning of the time
interval at 95% confidence interval for each time interval. A log-rank test was carried out
(Table 4.7) to compare the survival probability between the group VCLi and group VCIi. The
test showed that there was no significant difference between this two groups (p=0.8294)

34
Table 4.6. List of survival time by vaccine according to type of carriage material
Time in Days from post-
immunisation
Total
No. of
animals
at time
t
Fail Lost Function [95% CI of
survival
function]
VCLi
20 8 2 0 0.7500 0.3148 0.9309
42 6 1 0 0.6250 0.2293 0.8607
51 5 1 0 0.5000 0.1520 0.7749
59 4 2 0 0.2500 0.0371 0.5581
63 2 0 2 0.2500 0.0371 0.5581
VCIi
23 6 1 0 0.8333 0.2731 0.9747
29 5 1 0 0.6667 0.1946 0.9044
49 4 1 0 0.5000 0.1109 0.8037
59 3 1 0 0.3333 0.0461 0.6756
63 2 0 2 0.3333 0.0461 0.6756
Kaplan-meier graph (Figure 4.5) shows the probability of survival for animals immunized
with VCLi and of animals immunized with VCIi. There was no significant difference in the
survival time between the two groups (p=0.8294) (Table 4.8).

35
Su
rviv
al fu
nctio
n0
.00
0.2
50
.50
0.7
51
.00
0 5 10 15 20 25 30 35 40 45 50 55 60 65analysis time
VCLi VCIi
Kaplan-Meier survival estimates
Figure 4. 5. Kaplan meier survival time estimates for group VCLi and group VCIi
Table 4.7.Log-rank test for equality of survivor functions
In the group vaccinated with stabilate carried on liquid nitrogen, six out of eight calves died
due to challenge with T. parva, while in the other group, four out of six calves died. Relative
Vaccine Events observed Events expected p-value
Stabilate in liquid
nitrogen
6 5.68
0.829
Stabilate on ice 4 4.32
Total 10 10.00

36
risk was calculated 1.07(95%CI 0.41-2.83). There was no significant difference in relative
risk between VCLi and VCIi (p=0.889).
The relative vaccine efficacy was estimated as 7% (95% CI = -183 - 59). Since the estimated
95% confidence interval included zero, it can be concluded that there was no significant
difference in efficacy between the stabilate carried on ice and that carried in liquid nitrogen.

37
CHAPTER FIVE
5.0 Discussion
The aim of the field trial was to compare the efficacy of Theileria parva chitongo sporozoites
carried on ice to that carried in liquid nitrogen. This was done by comparing seconversion
ratios between the group vaccinated with stabilate carried carried on ice and the group
vaccinated with stabilate carried in liquid nitrogen. The field study found no significant
difference in seronversion rates between cattle immunized with stabilated carried in liquid
nitrogen and that carried on ice for up to 4-6 hours in both the 1:40 and 1:80 dilutions.
However, a similar study by Marcotty et al., (2001) in katete district using the katete strain
found that immunisation performed with a stabilate kept on ice up to 6 hours was more
efficient than the standard method (stabilate carried in liquid nitrogen). However, the
difference in results could be due to many other factors that need further study. These factors
may include the difference in stabilate used or regions where the immunization was carried
out or difference in cultures.
In the field trial, animals positive for ECF on IFA test and blood smears examination were
detected in some districts even though the animals were showing no clinical signs. This could
be an indication of the endemic status of the disease in most plateau districts of Southern
province of Zambia (Nambota et al., 1994). The IFA test may also have been less accurate
because in endemic regions the seroprevalence fluctuates considerably although most animals
have been infected (Billiouw et al., 2005). The detection of piroplasms from the blood smears
could be due to the presence of carrier animals. These are animals that have recovered from
the primary infection but maintain piroplasms circulating in the blood at levels that are high
enough to infect ticks but not always detectable by routine diagnostic techniques (Medley et
al., 1992). Given the low specificity of microscopy (Darghouth et al 1996, Simuunza, 2009),
the detection of piroplasms only without schizonts, may also have been due to other non
pathogenic Theileria sp. (Norval et al., 1992). Mazabuka and Choma despite being endemic
to Theileria parva showed 0% prevalence in piroplasms. This may have been due the low
sensitivity of microscopy/blood smears (Darghouth et al 1996, Simuunza, 2009).

38
Generally from the pre-immunization results, the study showed that the IFA test was more
sensitive than microscopy in detecting theileria parva. However, this detection of piroplasms
without schizonts is inconclusive because this might be due to the presence of other theileria
species. Blood smears are not the most accurate form of diagnosis for T.parva because
accurate diagnosis relies on the training and experience of the laboratory personnel, and is
considered to have low sensitivity and specificity (Darghouth et al 1996, Simuunza, 2009).
This could explain the lower detection of positives from the blood slides as compared to the
IFA test. The 1:40 is more sensitive than the 1:80 dilutions as demonstrated by Billiouw et
al., (2005). From our study both pre and post immunization results show that the 1/40
dilution detected more positives compared to the 1/80 dilution.
The mean temperatures of the animals at time of sampling were within the normal range,
though on the high side. According to the Merck manual, (2005) the temperature range of
beef cattle is from 36.7⁰C to 39.1⁰C. This may be because the sampling was done at a time of
the day when tempratures were high. The body temperature of cattle increases as the day
progresses and latter starts to reduce in the night and in addition, it may further increase
depending on the activity and stress that is exerted on the animals (Parish et al., 2009). The
animals were being chased around in the kraal to be caught before vaccinating. However, it is
important to note that some of the cattle sampled were positive for ECF. Therefore, it is
possible that some of the higher than normal temperatures could have been due to the disease.
The weights of cattle included in the field study were very variable, with large standard
deviations. The Cattle breed mostly found in southern province is the Tonga and its crosses
(Aregheore 1994). Traditional herds normally reach weights of 500kgs for bulls and 300 kgs
for cows (Aregheore 1994). Our study included all animals ranging from three months and
above that were not ear tagged or had no history of vaccination. This partly explains the wide
variations in the obtained weights of animals
The estimated mean PCVs of the study animals were slightly below range. According to the
Navarre (2007), the PCV of beef cattle ranges from 24% to 46%. Navarre (2007) also
observed that the PCV was usually on the upper 20s in adult cattle and slightly higher in
calves. Our study animals consisted of both calves and adults as long as they had no history
of vaccination. Anaemia has not been recognised as a major feature in classical T. parva

39
infections (Maxie et al., 1982) although it has been described in cattle infected with certain
stocks of T. parva (Norval et al., 1992e4). From the pre-immunisation IFA test and blood
smears, some of the cattle were infected with Theileriosis. These could explain the lower
ranges in the PCVs, although the effect of other anaemia causing infectious and non-
infectious diseases could not be ruled out. However from the mean value these results show
that the animals were generally in good health before vaccinating.
The aim of the indoor trial was also to compare efficacy of Yheileria parva chitongo carried
in liquid nitrogen to that carried on ice between two groups and further to see whether
temperature and haematological parameter results could be replicated under controlled
conditions. Only male dairy animals were included in this study due to financial contain.
Male dairy animals tend to be cheaper than female dairy animals which are mainly used for
milk production. Some study animals were lost before the experiment due to causes not
related to the diseases under study. This could have most likely reduced the power of the
study (Eng, 2003), although it is unlikely that it could have resulted in wrong conclusions.
The survival analysis data showed that there is no significant difference in survival time
between the two groups hence the animals responded the same despite the difference in the
carriage of the vaccines. The study also showed that the relative vaccine efficacy was not
significantly different between VCLi and VCIi. Marcotty et al., (2001), showed that there
was a significant difference between T. parva katete strain vaccine carried in liquid nitrogen
and that carried on ice. In their study T. parva katete strain carried on ice was better.
However, Mbao et al., (2007) showed that Chitongo and Katete strains have similar
infectivity losses when stored on ice.
The two groups had similar PCVs during the course of the trial. The PCVs started reducing
after vaccinating the animals on the 28th day of the trial and reduced further after challenging
the animals on the 69th
day of the trial. This finding is similar to that reported in the study by
Fandmu et al., (2007), where they found that anaemia occured in both lethal and non-lethal
Theileria parva infected animals due to a reduction in PCV and Mean corpuscular volume
(MCV). IIana (2012) also found that theileriosis caused a significant decrease in PCVs in
cattle.

40
The average temperatures in both groups were within normal range apart from days six-eight
after immunisation and days 10-12 after challenging. High temperatures were expected in
theileriosis infection according to Fandamu, (2005). Variations in body temperature were
observed throughout the study, mainly because they were not taken at the same time of the
day. Temperature variations could have been further been attributed to environmental factors
such as weather and also exercise of animals during the process of restraining.
The average number of lymphocytes in both groups per week was increasing from the day of
immunization until the end of the experiment. However these were within the normal range
of lymphocytes. The normal range of lymphocytes of dairy cattle is 45%-75% (Merck
Manual, 2005), The slight increase of leukocytes in both groups was probably due to
proliferation of lymphocytes in the lymphoid organs as defensive response to invading
parasite. The sporozoites invade host lymphocytes where they rapidly differentiate into
schizonts, a process associate with transformation of the infected cells to a state of
uncontrolled proliferation (Fawcet et al. 1982). All other white blood cells were within
normal range (Merck Veterinary Manual , 2005).
Blood and lymph smears showed that piroplasms and schizonts could be detected 6-12 days
and 12 days post-immunisation respectively. According to the IFAT results, seroconversion
of the animals had started by day 8 and all animals had seroconverted before challenge.
According to Fandamu (2005), under experimental conditions, using either infected ticks or
sporozoites stabilate, the incubation period ranges from 8 to 12 days.
It was observed that a number of animals had died during the experiment. Freisian cattle
which are bos taurus were used in this experiment. Bos taurus breeds are very susceptible to
T. parva infection (Norval et al., 1992). It should be pointed out that resistance can be
reduced in situations where there is malnutrition and stress of the animal (Fandamu et al.,
2007). Housing the animals may have stressed them and also the experiment was carried out
in the cold season of the year making it difficult to keep them warm.

41
CHAPTER SIX
6.0 Conclusion
The field and indoor trials were conducted to compare the vaccine efficacy of Theileria parva
chitongo carried in liquid nitrogen to that carried on ice. In the field trial it was found out that
the seroconvesion rates were not significantly for cattle vaccinated with stabilate carried on
liquid nitrogen and that carried on ice. In the indoor trial it was also found that the probability
of survival between the two groups after challenge was not significantly different time.
Further, the efficacy, temperature and haematological profiles were also similar. It can
therefore be concluded from these results that the T. parva chitongo stabilate carried on ice
has the same efficacy as that carried in liquid nitrogen and that the hematological parameters
were the same accross the two experimental groups.
6.1 Reccomendations
This study indicates that Theileria parva chitongo stabilates can be carried on ice for upto six
hours in the districts where it is used. Therefore, the carrying of theileria parva chitongo
stabilates up to six hours should be encouraged because this method is cheaper and
logistically easier. However, there is need for further studies to compare why the katete
stabilate in a previous study was more efficacious on ice while our study concluded no
significant difference when they have the similar infectivity losses when stored on ice.

42
REFERENCES
1. Anon, (2010a). A report on a field trial of the efficacy of Theileria parva chitongo
vaccine stored on ice. Small holder Livestock Investment Project (SLIP),
Department of Veterinary services, Ministry of Agriculture and Livestock,
Lusaka.
2. Anon, (2010b). Annual report 2012, Government of the Republic of Zambia,
Ministry of livestock and Fisheries development, Department of Veterinary
Services, Lusaka.
3. Anon, (2010c). East Coast fever Control Strategy. Government of the Republic of
Zambia, Ministry of Livestock and Fisheries Development, Department of
Veterinary Services, Lusaka.
4. Anon, (2011a). A report on a field trial of the efficacy of chitongo vaccine stored
on ice. Government of the Republic of Zambia, Ministry of Agriculture and
livestock development, Department of Veterinary services, Smallholder Livestock
Investment Project (SLIP).
5. Anon, (2011b). Annual report 2011, Department of Veterinary services, Ministry
of Agriculture and livestock development, Government of the Republic of
Zambia.
6. Anon, (2012). Parasitology Laboratory Manual, Haematology unit, Department of
Disease control, Samora Machel School of Veterinary Medicine. Zambia.
7. Akafekwa, G. (1976). Control of tick-borne diseases in Zambia with special
emphasis on East Coast fever. Bulletin de l’Office International des Epizooties,
86, 105-116.
8. Aregheore E. M., (1994). Country Pasture/Forage Resource Profiles. Zambia II.
Available at: <www.fao.org/ag/AGP/AGPC/doc/countryprof/zambia/zambia.htm.
[Accessed 10 October, 2012].

43
9. Bakheit M. A., Latif A. A., and Ann N. Y. (2002).The innate resistance of
Kenana cattle to tropical theileriosis (Theileria annulata infection) in the Sudan.
Academy of Sciences.969, 159–163.
10. Billiouw, M., Brandt, J., Vercruysse, J., Speybroeck, N., Marcotty, T., Mulumba,
M. and Berkvens, D. (2005). Evaluation of the Indirect Fluorescent Antibody Test
as diagnostic tool for East Coast fever in eastern Zambia. Veterinary Parasitology
127, 189-198.
11. Burridge, M. J. and Kimber, C. D. (1972). The Indirect Fluorescent Antibody Test
for experimental East Coast fever (Theileria parva infection of cattle): evaluation
of a cell culture schizont antigen. Research in Veterinary Science 13, 451-455.
12. Burridge, M. J., Brown, C. G. D. and Kimber, C. D. (1974). Theileria annulata:
Crossreactions between a cell culture schizont antigen and antigens of East
African species in the indirect fluorescent antibody test. Experimental
Parasitology 35, 374-380.
13. Chaka, G. 2001. Eco-physiology of Rhipicephalus appendiculatus (Acari:
Ixodidae in Eastern Zambia. PhD thesis No. 12. Institute of Tropical Medicine,
Antwerp, Belgium.
14. Chizyuka, G. H. & Mangani P. M. C. (1985): Theileriosis in Zambia. In: Irvin, A.
D. ed. Immunization against theileriosis in Africa. ILRAD, Nairobi, 41-44.
15. Chilonda, P., Huylenbroeck G. V., D’Haese L., Samui K.L., Musaba E.C.,
Imakando M., and Ahmadu (1999). Cattle production and veterinary care system
in Zambia. Outlook on Agriculture. 28, 109-118.
16. Cunningham, M.P., Brown, C.G.D. and Burridge, M.J. (1973). Cryopreservation
of infective particles of Theileria parva. International Journal for Parasitology, 3,
583-587.

44
17. De Castro, J. J. (1997). Sustainable tick and tick-borne diseases control in
livestock improvement in developing countries. Veterinary Parasitology 71, 77-
97.
18. Dacie, V. J. and Lewis S. M. (1984.) Practical haematology. 6th
ed. Churchill
Livingstone, New York. pp 32-34, 50-52, 138-142.
19. Darghouth M. E, Bouattout A, Ben Miled L, Kilani M, and Brown C. G. (1996).
Epidemiology of tropical theileriosis (theileria annulata infection of cattle) in an
endemic region of Tunisia: characterisation of endemicity states. Ecole Nationale
de Medicine de Veterinaire, Sidi Thabet, Tunisia. Veterinary parasitology,
25;65(3-4):199-211.
20. Embert, H. C., (1986). Veterinary clinical pathology. 4th
ed. W. B. Saunders
Company, Philadelphia. pp 42-78.
21. Eng J., (2003), Sample Size Estimation: How Many Individuals Should Be
Studied. 10.1148/radiol.2272012051. Radiology 2003; 227:309–313
22. Fosgate G. T., Urdaz-Rodríguez J. H., Dunbar M. D., Rae D.O., Donovan G. A.,
Melendez P., Dobek G. L., Alleman A. R., (.2010). Diagnostic accuracy of
methods for detecting Anaplasma marginale infection in lactating dairy cattle of
Puerto Rico. Journal of Veterinary Diagnosis and Investigation.22(2):192-9
23. Fandamu P, Marcotty T, Brandt J.R.A, Duchateau L, Speybroeck N, Dolan T.T
and D. Berkvens D., (2007). Red Blood Cell Volume as a predictor of fatal
reactions in cattle infected with Theileria parva katete. Onderstepoort Journal of
Veterinary Research, 74:37–43
24. Fandamu P., (2005). Transmission and infection dynamics of theileriosis in
southern Zambia: the effect of environmental and host factors.Ghent University,
Faculty of Veterinary Medicine Department of Physiology and Biometrics,
Salisburylaan 133, B-9820, Merelbeke, Belgium. Doctoral Dissertation.

45
25. Fawcett, D. W., Doxsey, S and Buscher, G., (1982). Salivary glands of the tick
vector ofEast Coast fever: IV. Cell type selectivity and host responsiveness to
Theileria parva. Tissue cell 14, 397-414.
26. Food and Agriculture Organisation of the United Nations (F.A.O.) (1984). Ticks
and Tick-borne Diseases Control. A Practical Field manual, Volume II, pp. 457-
507.
27. Ghosh S1, Azhahianambi P, Yadav MP, (2007) Upcoming and future strategies of
tick control: a review. J Vector Dis. Jun; 44(2):79-89.
28. Gubbels G., De vos A., Vander weilde M., Viseras J., Schouls L., Devries E. &
Jongejan F. (1999).Simultaneous detection of bovine Theileria and Babesia
species by reverse line blot hybridisation. Journal of Clinical Microbiology, 37,
1782–178913.
29. Irvin A. D., Morrison W. I., (1987). Immunopathology, immunology and
immunoprophylaxis of Theileria infections. In: Immune Responses in Parasitic
infections: Immunology, Immunopathlogy and Immunoprophylaxis, Volume iii,
Soulsby E J L (Editor), CRC Press, Inc. Boca Raton, Florida, Tropical animal
production 20, 234-242.
30. Irvin, A. D. and Mwamachi, D. M. (1983). Clinical and diagnostic features of East
Coast fever (Theileria parva infection of cattle). Veterinary Record 113, 192-198.
31. IIana Conradie Van Wyk., (2012) Anaemia in East African Short-horn Zebu
calves: field diagnosis, infectious causes and pathogen interactions, Doctor of
philosophy in Veterinary and tropical diseases, Faculty of Veterinary Science,
University of Pretoria, South Africa.
32. Kariuki D.P, Young A.S, Morzaria S. P, Lessen A. C, Mining S. K, Omwoyo P.
Wafula J. L, and Molyneux D. H. (1995). Theileria parva carrier state in naturally
infected and artificially immunised cattle. Tropical animal health production,27,
15-25.

46
33. KahnC. M., Line S, Allen D. G, Anderson D. P, Jeffcott L. B, Quesenberry K. E,
Radostits O. M, Reeeves P. T, Wolf A. M. The Merck veterinary manual. 9th
edition. Whitehouse station, New jersey: Merck and Co. Inc; 2005
34. Kocan K M, Blouin F E, Barbet F A (2000). Anaplasmosis Control: Past, Present
and Future, Annals of the New York Academy of Sciences, 916, 501-509.
35. Konnai S.,Imamura S., Nakajima C., Witola W. H., Yamada S., Simuunza M.,
Nambota A., Yasuda J., Ohashia K., Onuma M., (2005). Acquisition and
transmission of Theileria parva by vector tick, Rhipicephalus appendiculatus.
Department of Disease Control, Graduate School of Veterinary Medicine,
Hokkaido University, Sapporo, Hokkaido 060-0818, Japan. Phone: +81-11-706-
5215. Fax: +81-11-706-5217. Email:[email protected].
36. Konnai S., Yamada S., Imamura S., Simuunza M., Chembensof M., Chota A.,
Nambota A.,Ohashi K., and Onuma M. (2007). Attachment Duration Required for
Rhipicephalus appendiculatus to Transmit Theileria parva to the Host. Vector-
borne and Zoonotic diseases,Volume 7, Number 2, Mary Ann Liebert, Inc. DOI:
1089/vbz.2006.0616. 241-248.
37. Kung’u M. W and Googer B. V. (1990). A slide enzyme-linked immunosorbent
assay (SELISA) for the diagnosis of Babesia bovis infections and for the
screening of Babesia-specific monoclonal antibodies. Department of parasitology,
University of Queensland, St. Lucia, Australia. International Journal of
parasitology. May 20(3):341-5.
38. Lawrence, J. A., Foggin, F. M., and Noval, R. A. (1980). The effects of war on the
control of diseases of livestock in Rhodesia (Zimbabwe), Vet. Rec., 107,82-85.
39. Lawrence, J. A. (1985). Theileria parva in Southern Africa: Past and Present. In:
Immunisation against Theileriosis in Africa. Proceedings of a joint workshop
sponsored by ILRAD and F.A.O., held in Nairobi, Kenya, 1-5 October 1984,
Irvin, A.D. (Editor), pp. 123-124.

47
40. Lessard, P., L’Eplattenier, R., Norval, R. A. I., Kundert, K., Dolan, T. T., Croze,
H.,Walker, J. B., Irvin, A. D. and Perry, B. D. (1990). Geographical information
systems for studying the epidemiology of cattle diseases caused by Theileria
parva. Veterinary Record 126, 255-262.
41. Levine, N. D., Corliss, J. O., Cox, F. E. G., Deroux, G., Grain, J., Honigberg, B.
N.,Leedale, G. F., Loeblich, A. R. II., Lom, J., Lynn, D. H., Nerinfield, F. G.,
Page,F. C., Poljansky, G., Sprague, V., Vaura, J. and Wallace, F. G. (1980). A
newlyrevised classification of the protozoa. Journal of Protozoology
42. Makala L. H., Mangani P., Fujisaki K., NagasawaH.,(2003). The current status of
major tick borne diseasesin Zambia. Vet. Res. 34 (2003) 27–45 27 © INRA, EDP
Sciences, 2003 DOI: 10.1051/vetres: 2002056. 27-40.
43. Marcotty T., Billiouw M., Chaka G., Berkvens D., Losson B., Brandt J.,
(2001).Immunisation against East Coast fever by the infection and treatment
method: evaluation of the use of ice baths for field delivery and appraisal of an
acid formulation of long-acting tetracycline.Department of Animal Production and
Health, Institute of Tropical Medicine, Nationalestraat 155, 2000, Antwerpen,
Belgium. · Veterinary Parasitology. ·pubmed no. 11502365.110, 45-56.
44. Maxie M. G., Dolan T. T., Jura W. G. Z., Tabel H. & Flowers M. J. A. (1982).
Acomparative study of the diseases incattle caused by Theileria parva or T.
lawrencei, II. Haema tology,clinical chemistry, coagulation studies and
complement. Veterinary Parasitology, 10:1–19.
45. MacLeod, J. and B. Mwanaumo. 1978. Ecological studies of ixodid ticks
(Acari,Ixodidae) in Zambia IV. Some anomalous infestations in the northern and
eastern regions. Bulletin of Entomological Research, 68, 409-429.
46. Mbao V. (2006). In vitro quantitation of theileria parva sporozoites for use in
vaccination and sporozoite neutralisation assays. Proefschrift voorgedragen tot het
behalen van de graad van. Doctor in de Diergeneeskundige Wetenschappen
Laboratorium voor Parasitologie Vakgroep Virologie, Parasitologie en

48
Immunologie Faculteit Diergeneeskunde, Universiteit Gent. Institute of Tropical
Medicine, Department of Animal.
47. Mbao V., Derkins D., Dorny P., Van Den Bosshe P. AndMarcottyT.,(2007).
Comparison of the survival on ice thawed theileriosis parva sporozoites of
different stocks cryoprotected by glycerol or sucrose. Onderspoort journal of
veterinary research, 74, 9-15.
48. McKeever, D. J.,(2007). Live immunisation against Theileria parva: containing
or spreading the disease?, Trends parasitology.,23.565-568.
49. McKeever, D. J., Taracha, E. L. N., Morrison, W. I., Musoke, A. J. and Morzaria,
S. P. (1999). Protective mechanisms against Theileria parva: Evolution of vaccine
development strategies. Parasitology Today 15, 263-267.
50. Medley, G. F., Perry, B. D. and Young A. S. (1992). Preliminary analysis of the
transmission dynamics of Theileria parva in eastern Africa. Parasitology 106, 251-
264.
51. The Merck Veterinary Manual. (2000). 8th
Edition, Merck and Co. Inc.,
Whitehouse Station, N. J., U. S.A and Merial Limited.
52. The Merck Veterinary Manual 9th
editon, (2005), Merck and Co.,INC.
Whitehouse station, N.J., U.S.A.
53. Minjauw B. and Mcleod A.,(2001). Epidemiology and economics of tick-borne
diseases and its effects on the livelihoods of the poor in east and southern Africa
and India. DFID report. 73pp.
54. Minjauw B. · Otte J. · James A.D. · de Castro J.J. · Sinyangwe P., (1997). Effect
of different East Coast Fever control strategies on fertility, milk production and
weight gain of Sanga cattle in the Central Province of Zambia.Experimental and
Applied Acarology. 21, 715-730.
55. Morrison W I, McKeever D J (2006). Current status of vaccine development
against Theileria parasites, Parasitology, 133, 169-187.

49
56. Morzaria, S. P., Irvin, A. D., Voigt, W. P. and Taracha, E. L. N. (1987). Effect of
timing and intensity of challenge following immunisation against East Coast
fever. Veterinary Parasitology 26, 29-41.
57. Mtambo J., Dorny (2008). Rhipicephalus appendiculatus/zambeziensis complex
from southern and eastern Zambia: genetic and phenotypic diversity related to the
associated variation epidemiology of Bovine theileriosis, PhD Thesis, Institute of
Tropical Medicine Antwerp, Belgium.
58. Mukhebi, A.W., B.D. Perry, and R. Kruska. 1992. Estimated economics of
theileriosis control in Africa. Preventive Veterinary Medicine, 12, 73-85.
59. Nambota, A. (1988). Immunization against theileriosis in the Southern province
of Zambia. Dolan, T. T., ed. Theileriosis in Eastern, Central and Southern Africa.
Proceedings of a Workshop of E.C.F immunization, held in Lilongwe, Malawi,
20-22 September, 1988. Nairobi, ILRAD, pp. 87-89.
60. Nambota, A., Samui K., Sugimoto, C., Kakutal, T., and Onuma, M., (1994).
Theileriosis in Zambia: Etiology, Epidemiology and Control measures.Hokkaido
University.lPn. l. Veterinary Research. 42(1): 1-18.
61. Nambota A., Samui K., Sugimoto C., (1994). Theileriosis in Zambia: Etiology,
Epidemiology and Control measures, Japan Journal of Veterinary Research, 42,
233-245.
62. Norval R. A. I., LawrenceJ. A., YoungA. S., PerryB. D., DolanT. T. AndScottJ.,
(1991). Theileria parva: influence of vector, parasite and host relationships on the
epidemiology of theileriosis in southern Africa. Parasitology, 102 , 347-356
doi:10.1017/S0031182000064295
63. Norval R. A. I., Perry B. D., Young A. S. (1992). The Epidemiology of
Theileriosis in Africa. Academic Press. London, UK.

50
64. Norval, R.A.,Sutherst,R.W.,Kurki,J.,Gibson,J.D.,Kerr,J.D., (1988).Theeffect of
thebrownear-tick Rhipicephalus appendiculatus on the growth of Sanga and
European breed cattle. Veterinary Parasitology.30,149–164.
65. Navarre C., (2007) blood work: revelations, limitations for cattle. DVM360
Magazine Louisiana state university, department of veterinary science.
66. Ogden N. H., Gwakisa P., Swai E., French N. P., Fitzpatrick J., Kambarage D.,
Bryant., (2003). Evaluation of PCR to detect Theileria parva in field-collected
tick and bovine samples in Tanzania, Veterinary Parasitology, 0.
67. OIE-Theileriosis- Aetiology Epidemiology Diagnosis Prevention and Control
References.http://www.oie.int/fileadmin/Home/eng/Animal_Health_in_the_World
/docs/pdf/THEILERIOSIS_FINAL.pdf. Last accessed on 08/11/2012.
68. OIE Terrestial Manual, 2008. 789-804
69. Orenstein W. A., Berner R. H., Dondero T. J., Hinman A. R., Marks J. S., Bart K.
J., and Sirotkin., (1985). Field evaluation of vaccine efficacy. Bulletin of the
World Health Organisation, 63(6) 1055-1068.
70. Parish A. J., Rhinehart D. J., (2009). Identifying sick or injured cattle. Extension
Service of Mississipi State University. Publication 2551. POD 06-09.
71. Pegram, R.G., B.D. Perry, F.L. Musisi and B. Mwanaumo., (1986). Ecology and
phenology of ticks in Zambia: seasonal dynamics on cattle. Experimental and
Applied Acarology, 2, 25-45.
72. Preston P.M and Jongejan F. (1999)Protective mechanisms to Ticks and Tick-
borne diseases of Ruminants. Parasitology Today 15, 255-258.
73. Radley, D.E., Brown, C.G.D., Burridge, M.J., Cunningham, M.P., Kirimi, I.M.,
Purnell, R.E. and Young, A.S. (1975a). East coast fever: 1. Chemoprophylactic
immunization of cattle against Theileria parva (Muguga) and five theilerial
strains. Veterinary Parasitology, 1, 35-41.

51
74. Radley D.E., Brown C.G.D., Cunningham M.P., Kimber C.D., Musisi F.L., Payne
R.C., Purnell R.E., Stagg S.M. & Young A.S. (1975b). – East Coast Fever. 3.
Chemoprophylactic immunisation of cattle using oxytetracycline and a
combination of theilerial strains. Veterinary Parasitology.,1, 51-60.
75. Radley, D. E., (1981). Infection and Treatment Method of Immunization against
theileriosis. In:Irvin, A., Cunningham, M. P., and Young, A. S. (Eds.). Volume
14: Advances in the Control of Theileriosis. MartinusNijhoff Publishers, The
Hague, pp 227-237.
76. Proceedings of an FAO/ILRI/OAU-IBAR workshop held at ILRI/ Nairobi, Kenya
10-12 March (1997).
77. Rocchi M. S., Ballingall K. T., MacHugh N. D., McKeever D. J., (2006). The
kinetics of Theileria parva infection and lymphocyte transformation in vitro,
International Journal of Parasitology, 36, 771-778.
78. Salih D.A., ElHussein A.M., Kyule M.N., Zessin K.H., Ahmed J.S.,Seitzer U.,
(2007).Determinationofpotentialriskfactorsassociatedwith Thei-leria annulata and
Theileria parva infections ofcattleintheSudan. Parasitol. Res.101,1285–1288.
79. Simuunza M. C., (2009).Differential diagnosis of tick-borne diseases and
population genetic analysis of Babesia bovis and Babesia bigemina. Division of
Veterinary Infection and immunity,DoctoralDissertation, Faculty of Veterinary
Medicine. University of Glasgow.
80. Simuunza, M., Weir, W., Courier, E., Tait, A., and Sheils, B., (2010).
Epidemiology of tick-borne diseases in Zambia, Elsevier, Veterinary parasitology
175 (2011) 331-342.
81. Simuunza M, Bilgic H, Karagenc T, Syakalima M, Shiels B, Tait A, Weir W.,
(2011). Population genetic analysis and sub-structuring in Babesia bovis,
Molecular Biochemical Parasitology, 177, 106-115.

52
82. Skilton R A, Bishop R P, Katende J M, Mwaura S, Morzaria S P., (2002). The
Persistence of Theileria parva infection in cattle immunized using two stocks w
hich differ in their ability to induce a carrier state: analysis using a novel blood
spot PCR assay, Parasitology, 124, 265-276.
83. Speybroeck, N., Belot, J., Madder, M., Mulumba, M, Brandt, J.R.A.., Geysen,
D.M., Sinyangwe, P., Geerts, S. and Berkvens, D.L. (1999) A spatial
representation of the point prevalence of Theileria parva and the distribution of
Rhipicephalus appendiculatus during the period 1995-1998 in the Southern
Province of Zambia. In: Proceedings of the 7th annual meeting of the Flemish
Society for Veterinary Epidemiology and Economics, Laevens, H. (Editor).
Antwerp,Belgium. pp. 156-166.
84. Speybroeck, N., M. Madder, P. Van Den Bossche, J. Mtambo, N. Berkvens,
G.Chaka, M. Mulumba, J. Brandt, L. Tirry and D. Berkvens. 2002. Distribution
and phenology of ixodid ticks in southern Zambia. Medical and
VeterinarEntomology, 16, 430-441.
85. Spreull J., (1914). East Coast fever inoculation in the Transkeian Territories,
South Africa. Journal of Comparative Pathology and Therapeutics 27:299.304.
86. Tushar V. S., (2010). Sample size estimation in clinical trials. Perspective clinical
research. April-June; 1(2): 67-69.
87. Walker, J.B., R.A.I. Norval and M.D. Corwin. 1981. Rhipicephalus zambeziensis
sp.nov., a new tick from eastern and southern Africa, together with aredescription
of Rhipicephalus appendiculatus Neumann, 1901 (Acarina,Ixodidae).
Onderstepoort Journal of Veterinary Research, 48, 87-104.
88. Walker, J. B., Keirans, J. E. and Horak, I. G. (2000). The genus Rhipicephalus
(Acari:Ixodidae). A guide to the Brown Ticks of the World. Cambridge University
Press.

53
89. Watt, D.M. and A.R. Walker. 2000. Pathological effects and reduced survival in
Rhipicephalus appendiculatus ticks infected with Theileria parva protozoa.
Parasitology Research, 86, 207-214.
90. Wilkinson P R (1962). Selection of Cattle for tick resistance and the effects of
herds of different susceptibility on Boophilus popualations, Australian journal of
Agricultural Research, 13 (5), 974-983.
91. Willadsen P., (undated) Anti-tick vaccines. CSIRO Livestock Industries,
Queensland Bioscience Precinct, 306 Carmody Road, St Lucia, Queensland 4067,
Australia http://cbpv.org.br/artigos/CBPV_artigo_002.pdf. last accessed
22/01/2013.