community transitions and the spatial distribution of crime anna stewart, james ogilvie and troy...
Post on 22-Dec-2015
213 views
TRANSCRIPT
Community Transitions and the Spatial Distribution of Crime
Anna Stewart, James Ogilvie and Troy Allard

Workshop presentation 11 July 20082
Background• Queensland fastest growing state in Australia
– Between 2001 and 2006 10% increase in population to just over 4 million people– Expected to double in next 40 years– Hospitals, water, roads and public transport– Increase in 25 to 30 year old couples
• Key growth factor is natural resources– Coal, gas, minerals (copper, lead, zinc, gold and silver), petroleum – China demand for commodities
• Government focus on infrastructure – 1.6 million dollars every hour spent on infrastructure
• Little or no focus of the impact of growth on crime

Workshop presentation 11 July 20083
Research Questions
• What is the impact of this growth on crime?
• Data– ABS 2001 and 2006 census data by SLA
– QPS 2001 and 2006 reported crime data by SLA
Workshop presentation 11 July 20084
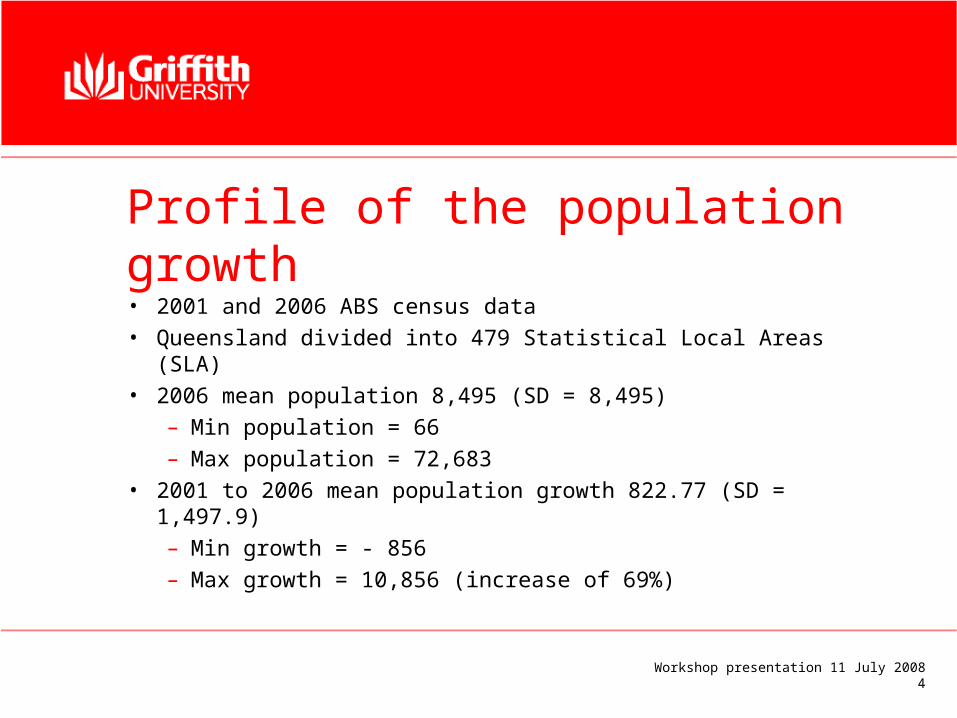
Profile of the population growth• 2001 and 2006 ABS census data• Queensland divided into 479 Statistical Local Areas (SLA)• 2006 mean population 8,495 (SD = 8,495)
– Min population = 66– Max population = 72,683
• 2001 to 2006 mean population growth 822.77 (SD = 1,497.9)– Min growth = - 856– Max growth = 10,856 (increase of 69%)

Workshop presentation 11 July 20085
Workshop presentation 11 July 20086

Workshop presentation 11 July 20087

Workshop presentation 11 July 20088
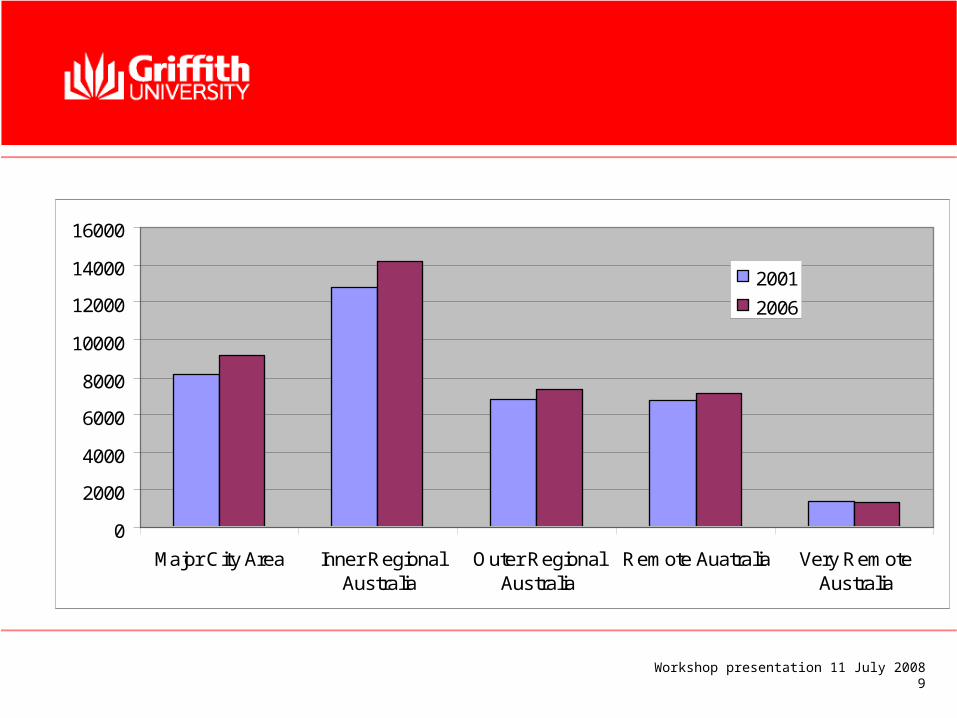
Remoteness areas• Major Cities (N = 256)
– Highest population growth• Inner Regional (N = 60)
– Highest total population– High population growth
• Outer Regional (N = 77)• Remote (N = 28)• Very Remote (N = 57)
– No growth• Migratory (N = 2)
Workshop presentation 11 July 20089
0
2000
4000
6000
8000
10000
12000
14000
16000
Major City Area Inner RegionalAustralia
Outer RegionalAustralia
Remote Auatralia Very RemoteAustralia
2001
2006

Workshop presentation 11 July 200810
Change in population heterogeneity by SLA• Percentage of population between 10-19
– Decrease, 14% to 13.4%, range 0 - 27%
• Percentage of population Indigenous
– Increase, 8.9% to 9.3%, range 0 – 97%
• Percentage of population born overseas
– Increase 15.5% to 16%, range 0 – 52%
• Short term Residential Stability:
– Prop of families with different residential address one year ago
– Increase in stability 26.4% to 23%, range 06 to 58%
• Long term residential stability
– Prop of families with different residential address five years ago
– Increase in stability drop from 54% to 51%, range 12% to 94%
Workshop presentation 11 July 200811
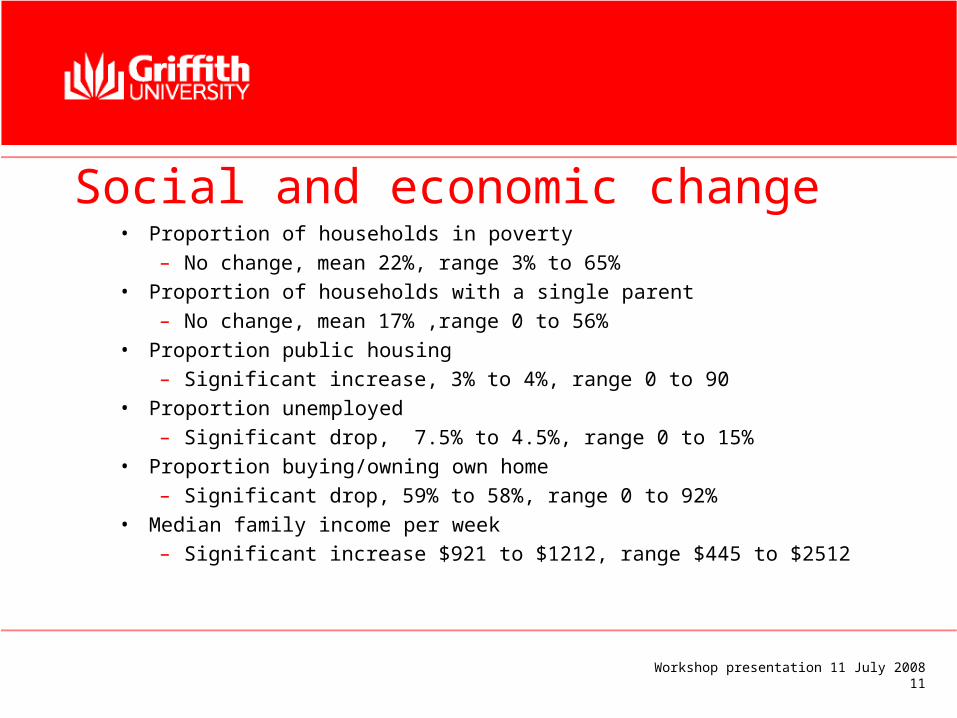
Social and economic change• Proportion of households in poverty
– No change, mean 22%, range 3% to 65%• Proportion of households with a single parent
– No change, mean 17% ,range 0 to 56%• Proportion public housing
– Significant increase, 3% to 4%, range 0 to 90• Proportion unemployed
– Significant drop, 7.5% to 4.5%, range 0 to 15% • Proportion buying/owning own home
– Significant drop, 59% to 58%, range 0 to 92%• Median family income per week
– Significant increase $921 to $1212, range $445 to $2512
Workshop presentation 11 July 200812
Police offending data
• QPS data for reported offences by SLA
– 2006 total of 420,454 reported offences • personal (8%), • property (54%) • other (38%)
• Between 2001 and 2006, overall 6% drop in reported offences
Workshop presentation 11 July 200813
Crime by SLA• Personal crime
– No change between 2001 and 2006– Average rate 1.2 offences per 100 population– Maximum 17.3 offences per 100 population
• Property crime– Decrease between 2001 and 2006– 9.3 offences per 100 population to 6.5 offences per 100 population
• Other crime– Increase between 2001 and 2006– 3.6 offences per 100 population to 5.0 offences per 100 population
Workshop presentation 11 July 200814
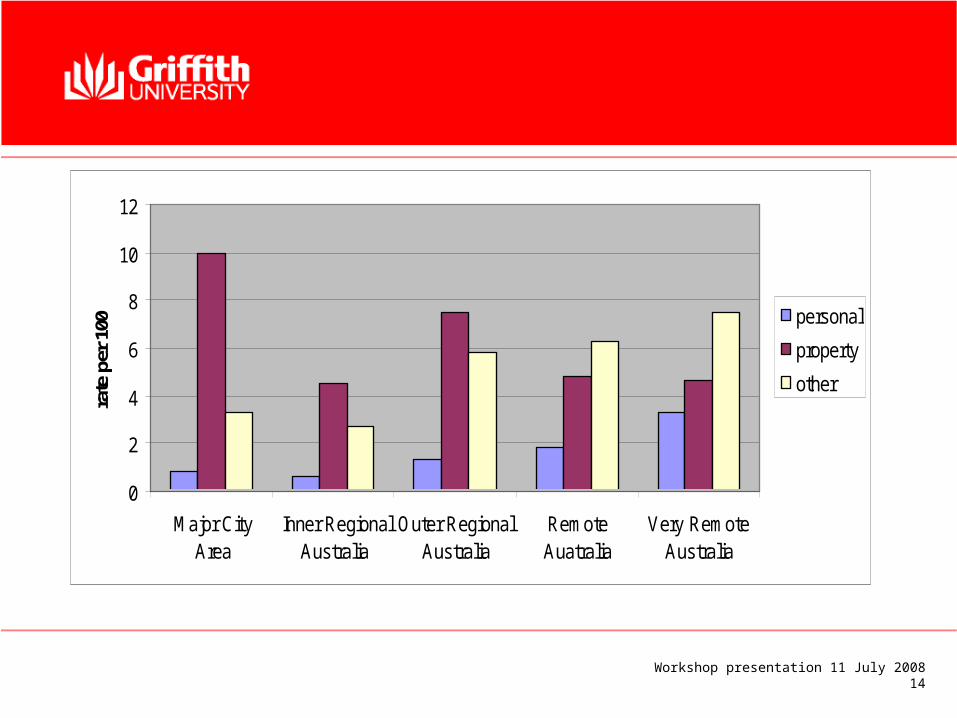
0
2
4
6
8
10
12
Major CityArea
Inner RegionalAustralia
Outer RegionalAustralia
RemoteAuatralia
Very RemoteAustralia
rate
per
100 personal
property
other

Workshop presentation 11 July 200815
Workshop presentation 11 July 200816
Workshop presentation 11 July 200817
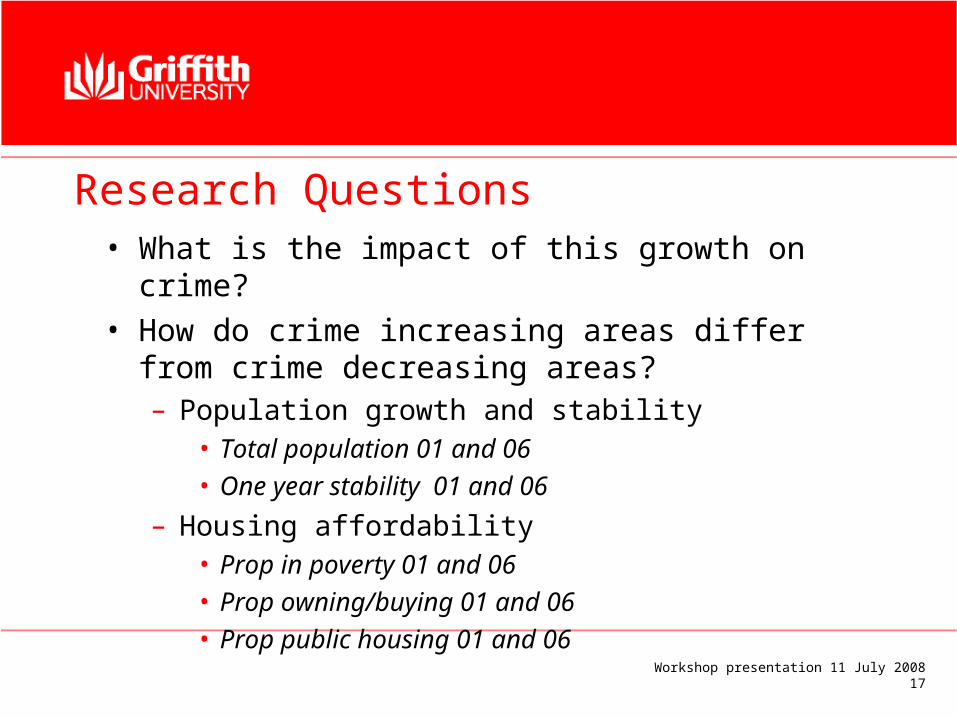
Research Questions• What is the impact of this growth on crime?• How do crime increasing areas differ from crime
decreasing areas?– Population growth and stability
• Total population 01 and 06• One year stability 01 and 06
– Housing affordability• Prop in poverty 01 and 06• Prop owning/buying 01 and 06• Prop public housing 01 and 06
Workshop presentation 11 July 200818
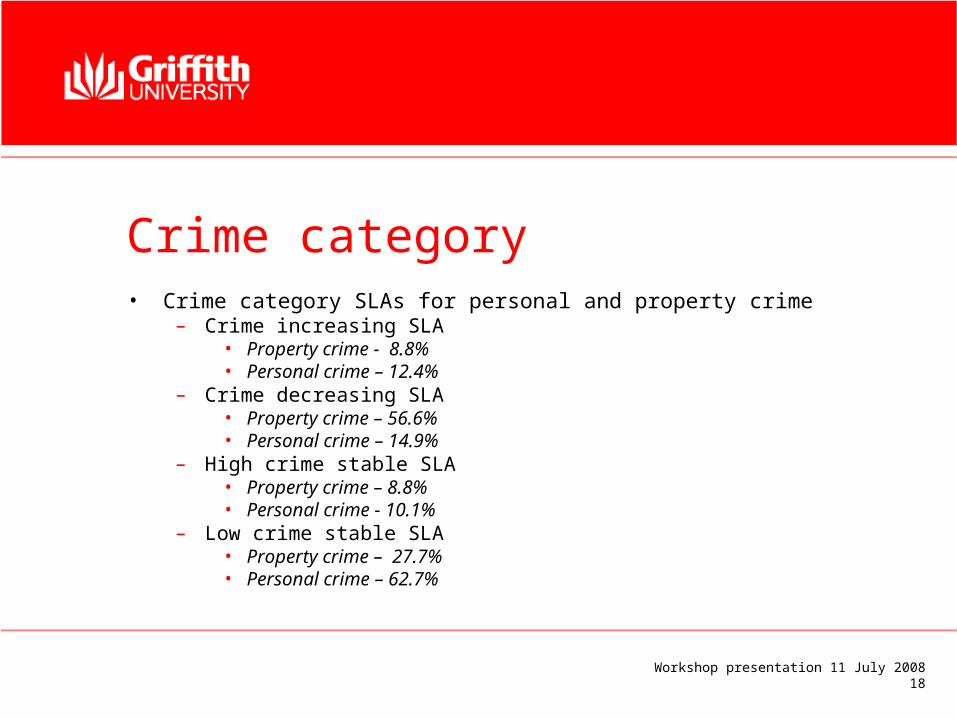
Crime category• Crime category SLAs for personal and property crime
– Crime increasing SLA• Property crime - 8.8%• Personal crime – 12.4%
– Crime decreasing SLA• Property crime – 56.6%• Personal crime – 14.9%
– High crime stable SLA• Property crime – 8.8%• Personal crime - 10.1%
– Low crime stable SLA• Property crime – 27.7%• Personal crime – 62.7%

Workshop presentation 11 July 200819
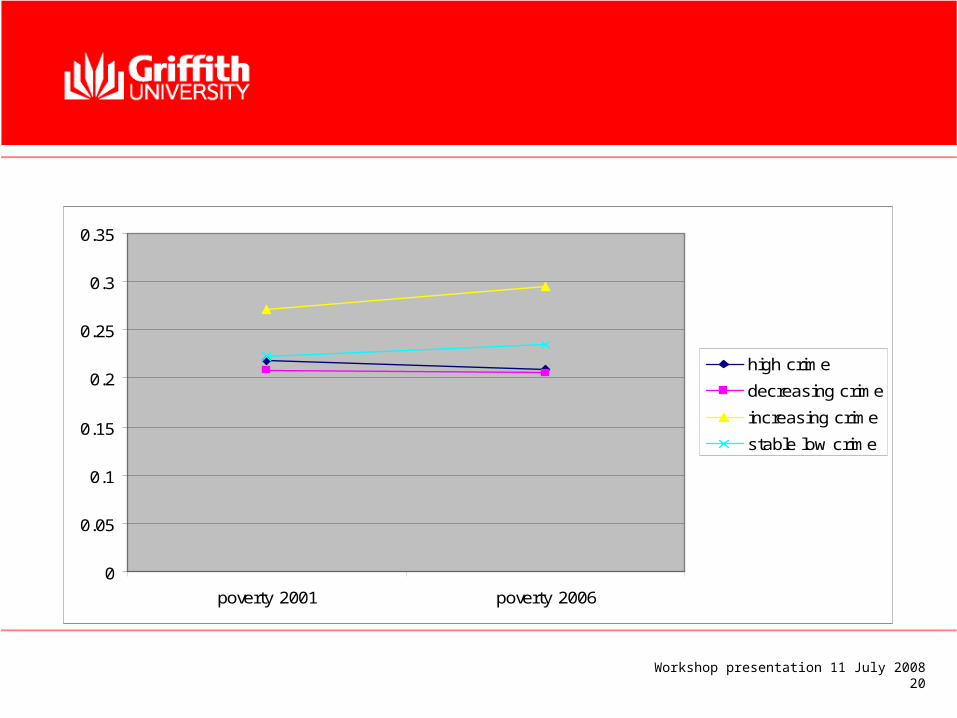
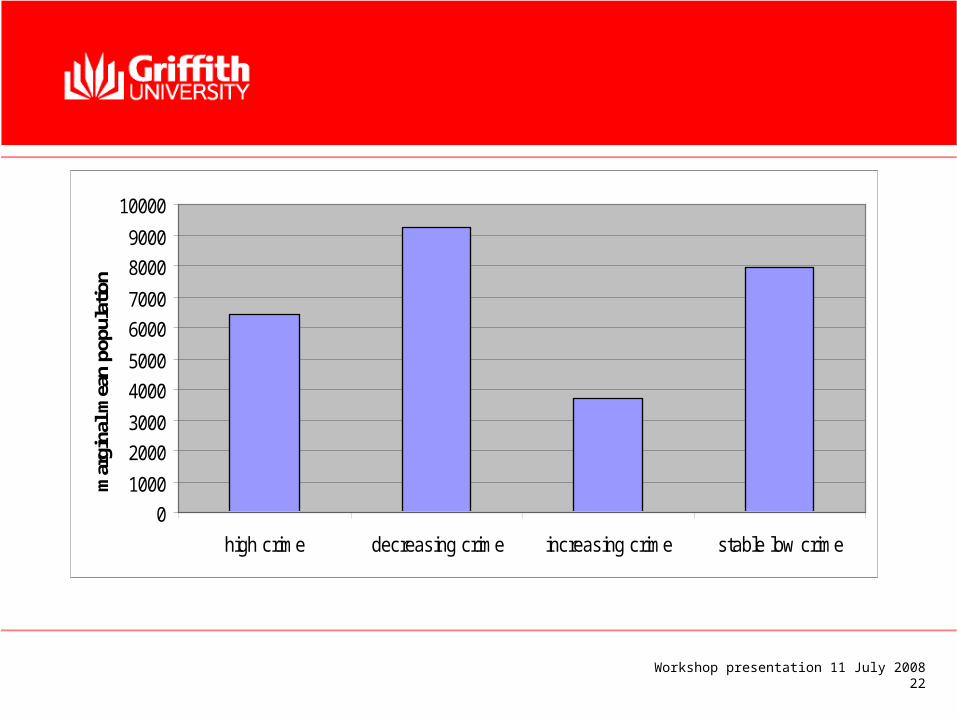
Property crime
• Interaction effect time*crime category– Poverty
– Own/buy home
• Main effect– Population
– Stability
Workshop presentation 11 July 200820
0
0.05
0.1
0.15
0.2
0.25
0.3
0.35
poverty 2001 poverty 2006
high crime
decreasing crime
increasing crime
stable low crime

Workshop presentation 11 July 200821
0
0.1
0.2
0.3
0.4
0.5
0.6
0.7
Own/buy 2001 Own/buy 2006
high crime
decreasing crime
increasing crime
stable low crime
Workshop presentation 11 July 200822
0
1000
2000
3000
4000
5000
6000
7000
8000
9000
10000
high crime decreasing crime increasing crime stable low crime
mar
gina
l mea
n po
pula
tion

Workshop presentation 11 July 200823
0.21
0.22
0.23
0.24
0.25
0.26
0.27
0.28
high crime decreasing crime increasing crime stable low crime
pro
po
rtio
n d
iffe
ren
t ad
dre
ss 1
year
ag
o

Workshop presentation 11 July 200824
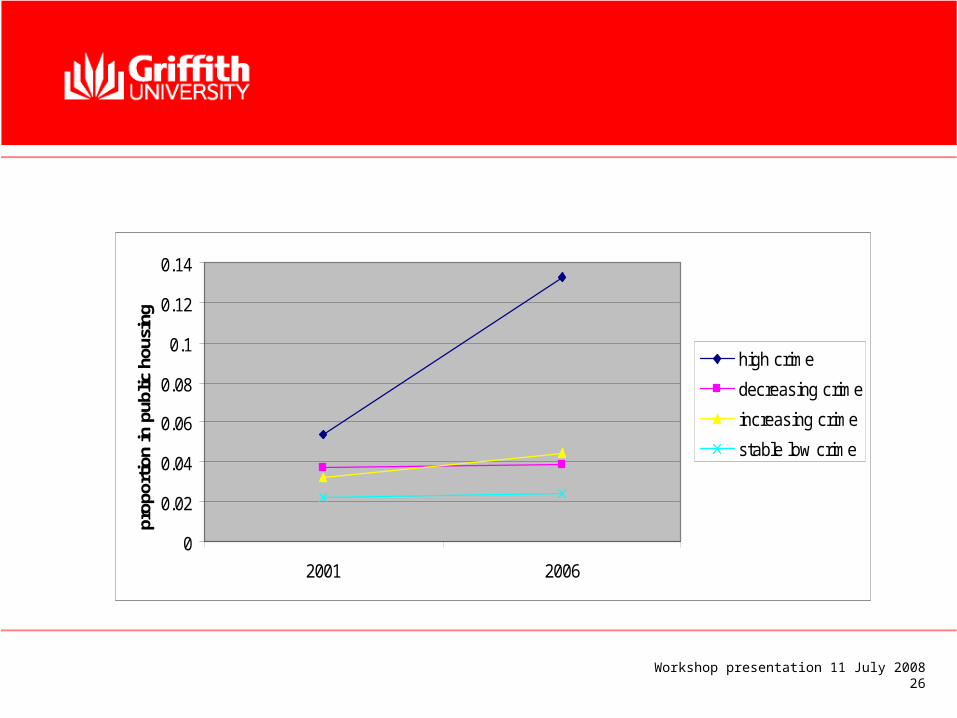
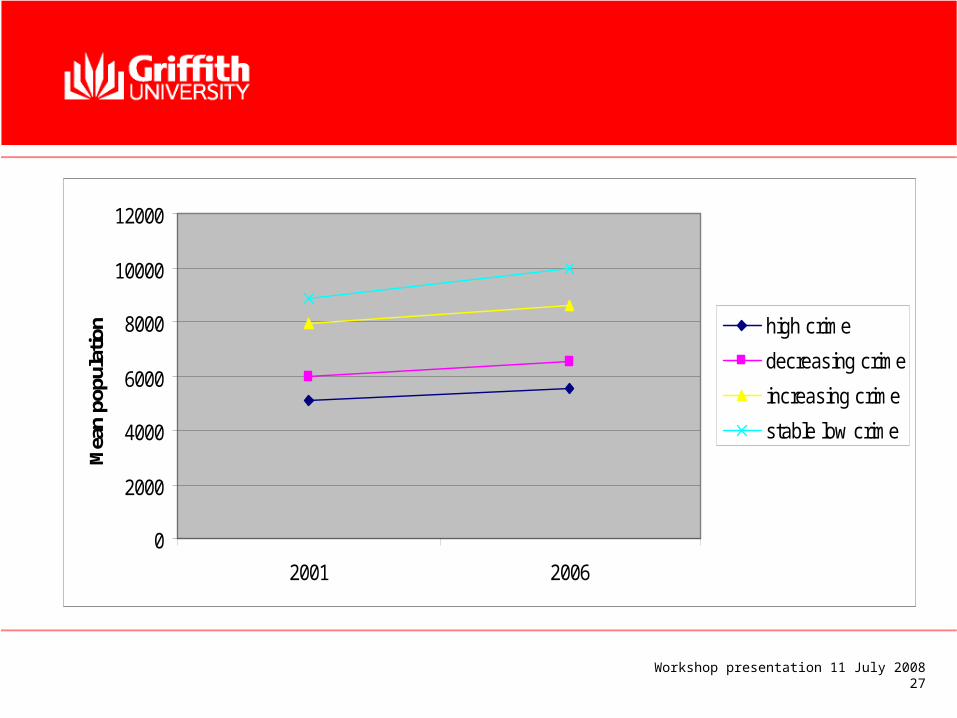
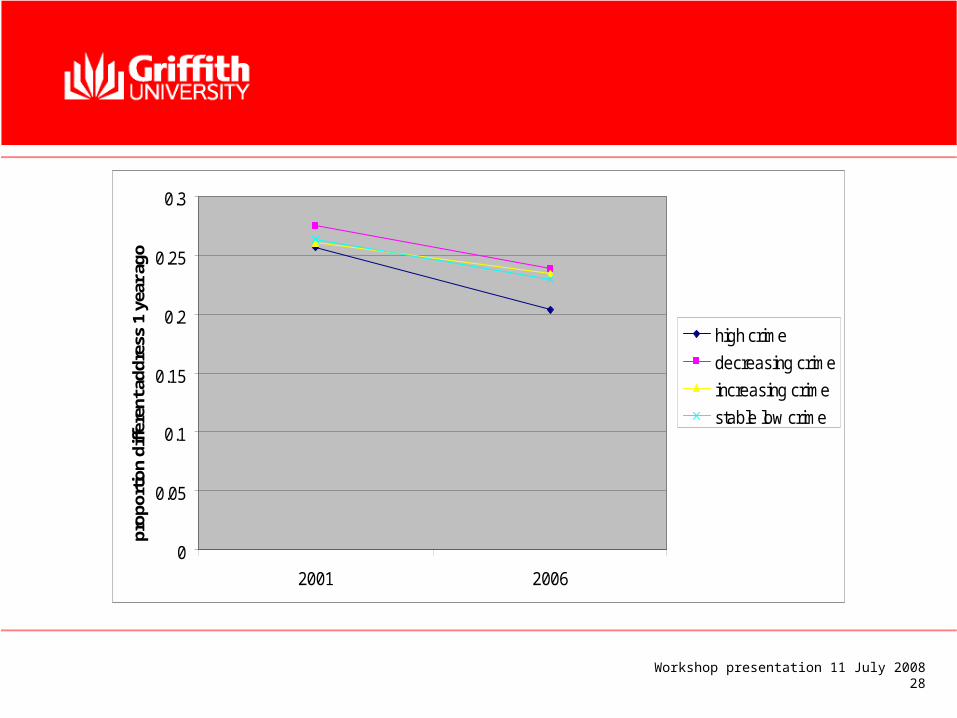
Personal crime
• Significant interaction effect– Poverty– Public housing– Population– Stability
• Main effect– own

Workshop presentation 11 July 200825
0
0.05
0.1
0.15
0.2
0.25
0.3
0.35
0.4
Poverty 2001 Poverty 2006
high crime
decreasing crime
increasing crime
stable low crime
Workshop presentation 11 July 200826
0
0.02
0.04
0.06
0.08
0.1
0.12
0.14
2001 2006
prop
ortio
n in
pub
lic h
ousi
ng
high crime
decreasing crime
increasing crime
stable low crime
Workshop presentation 11 July 200827
0
2000
4000
6000
8000
10000
12000
2001 2006
Mea
n po
pula
tion high crime
decreasing crime
increasing crime
stable low crime
Workshop presentation 11 July 200828
0
0.05
0.1
0.15
0.2
0.25
0.3
2001 2006
prop
ortio
n di
ffere
nt a
ddre
ss 1
yea
r ago
high crime
decreasing crime
increasing crime
stable low crime

Workshop presentation 11 July 200829
0
0.1
0.2
0.3
0.4
0.5
0.6
0.7
high crime decreasing crime increasing crime stable low crime
marg
inal
mean
pro
p o
wn
/bu
yin
g
Workshop presentation 11 July 200830
What does it all mean?
• Place is important• Complex interactions among variables• Factors that drive personal crime not necessarily
the same as property crime
• I should not put up an abstract before I have done the analyses