community survey on ict usage and e-commerce in
TRANSCRIPT

Survey on ICT usage and e-Commerce in enterprises 2013; Template
version 1.0, 16 April 2013 p1 EU
Community Survey on ICT Usage and
e-Commerce in Enterprises for 2013
Quality report
1. Cover information
1.1 Country Please insert here the name of the Country to which the survey refers to.
Luxembourg
1.2 Organisation(s) Here you should put the names of the organisations responsible for the survey under Eurostat (e.g. Statistical Office) and / or any other organisations involved in the conduction of the survey.
Responsible for the survey and statistical results (co-ordinator)
Institut national de la statistique et des études économiques (STATEC)
Other organisations involved in carrying out the survey (co-partner)
Centre d'Etudes de Populations, de Pauvreté et de Politiques Socio-Economiques /
International Networks for Studies in Technology, Environment, Alternatives, Development
(CEPS/Instead)
1.3 Contact Person Please indicate the name, unit and the contact information of the person that should be contacted in case there is any question concerning the survey and this report.
Contact persons at STATEC Georges ZANGERLE – [email protected] (Project Manager)
Tel. +352 247-84242 Bob JUNG – [email protected] Tel. +352 247-84336
Contact persons at CEPS/INSTEAD Nicolas POUSSING - [email protected]
Tel. +352 585855-503 Ludivine MARTIN – [email protected]
Tel. +352 585855-631
1.4 Name of the statistical operation or collection Here you should put the national name of the survey in its original language and in English if there is any national reference (i.e. in the web-site of the statistical office) to the survey in English.
Enquête relative à l’usage des technologies de l’information et de la communication dans les
entreprises - 2013
1.5 Date of this report Please indicate the date of the last update of this report, for the case we have several versions (i.e. use different dates for the metadata report and the quality report).
05/11/2013

Survey on ICT usage and e-Commerce in enterprises 2013; Template
version 1.0, 16 April 2013 p2 EU
2. General methodological information
2.1 Reference period
In this section please indicate if the reference periods defined in the model questionnaire for the several variables were followed in the national survey and highlight the differences.
The reference periods defined in the model questionnaire were followed in the national survey.
2.2 Survey period
Please indicate the dates between which the data collection took place, i.e., when the questionnaires were sent out (or the web-questionnaire made available) and when the last filled in questionnaire treated and used for the results was received. Please indicate also the collection dates for the financial sector and the micro-enterprises (if conducted), even if they are the same as the general survey.
Survey / Collection
Date of sending out of questionnaires
Date of reception of the last questionnaire treated
General survey 15-18/03/2013
July for most questionnaires; Questionnaires for several important
enterprises were received during August/October
Financial sector N/A N/A
Micro-enterprises N/A N/A
2.3 Survey vehicle
Stand-alone or embedded in another survey. Please introduce an “x” in the column next to the type of survey vehicle used for the general survey (enterprises with 10 or more persons employed). In addition, please indicate if the data collection for micro-enterprises was integrated with the general survey, i.e. the same questionnaire was used and the sending out of questionnaires was simultaneous.
General survey: Stand-alone survey X General survey: Embedded in another survey
Was collection of micro-enterprises integrated with the general survey? Yes No X
2.4 Survey type
Please give a short description of the survey type (e.g. web survey, face-to-face interviews, self-administered mail survey, telephone interview, combination of techniques, other).
Possibility to choose between self-administered mail survey or web survey.
2.5 Survey participation
Please indicate if the survey was mandatory or voluntary, by introducing an “x” in the column next to the type of survey participation.
Mandatory X Voluntary
2.6 Main methodological differences compared to previous survey(s)
Please indicate any changes in the survey from the previous year that may have an impact on the comparability over time of the results delivered to Eurostat (and not particularly those relating to results released only nationally).
No methodological changes occurred compared to the 2013 survey.

Survey on ICT usage and e-Commerce in enterprises 2013; Template
version 1.0, 16 April 2013 p3 EU
3. Statistical Unit and Target Population
3.1 Statistical Unit
Please indicate the statistical unit used. If it wasn’t the “enterprise”, as defined in the model survey, please mention the reasons.
The statistical unit used was the Enterprise, based on the Enterprise unit in Luxembourg’s Business Register.
3.2 Target Population
3.2.1 Enterprise size
As required by Annex I of the Commission Regulation (EC) No 1083/2012 of 19th November 2012, enterprises with 10 or more persons employed are intended to be covered by the survey.
Indicate below what is the scope for the coverage of micro-enterprises in terms of size and if the breakdown in the size classes is provided or not. For each one of the two items below introduce an “x” in the column next to the appropriate response.
If the variable used to define enterprise size was not the number of persons employed, indicate which one was used (number of employees, number of FTE's …), the reason and the possible impact on results.
Scope in terms of persons employed 1 to 9 persons employed 5 to 9 persons employed
Breakdown between size classes [1 to 4] and [5 to 9] persons employed provided?
Yes No
If different size delimitation or different variable was used, please indicate it.
3.2.2 Economic Activity
All economic activities in the scope of Annex I of the Commission Regulation (EC) No 1083/2012 of 19th November 2012 are intended to be included in the general survey, covering enterprises with 10 or more
persons employed. These activities are: NACE Rev. 2 sections C, D, E, F, G, H, I, J, L and N, divisions 69-74, groups 65.1, 65.2 and 95.1 and classes 64.19, 64.92, 66.12 and 66.19.
In this section, please indicate for the micro-enterprises if all the NACE categories were covered – by introducing an "x" in the column next to the appropriate response; if not which ones were included.
Economic Activity Micro-enterprises
All NACE Rev. 2 categories covered?
Yes No
If not, which ones were covered?
3.2.3 Geographic scope
Please indicate here if all the territory of the country was considered or if any part of the country was not included. All territory of the country should be covered. In case parts of the country were not included indicate which, the reasons why, and an estimate of the percentage of the target population not covered.
Not applicable
Survey on ICT usage and e-Commerce in enterprises 2013; Template
version 1.0, 16 April 2013 p4 EU
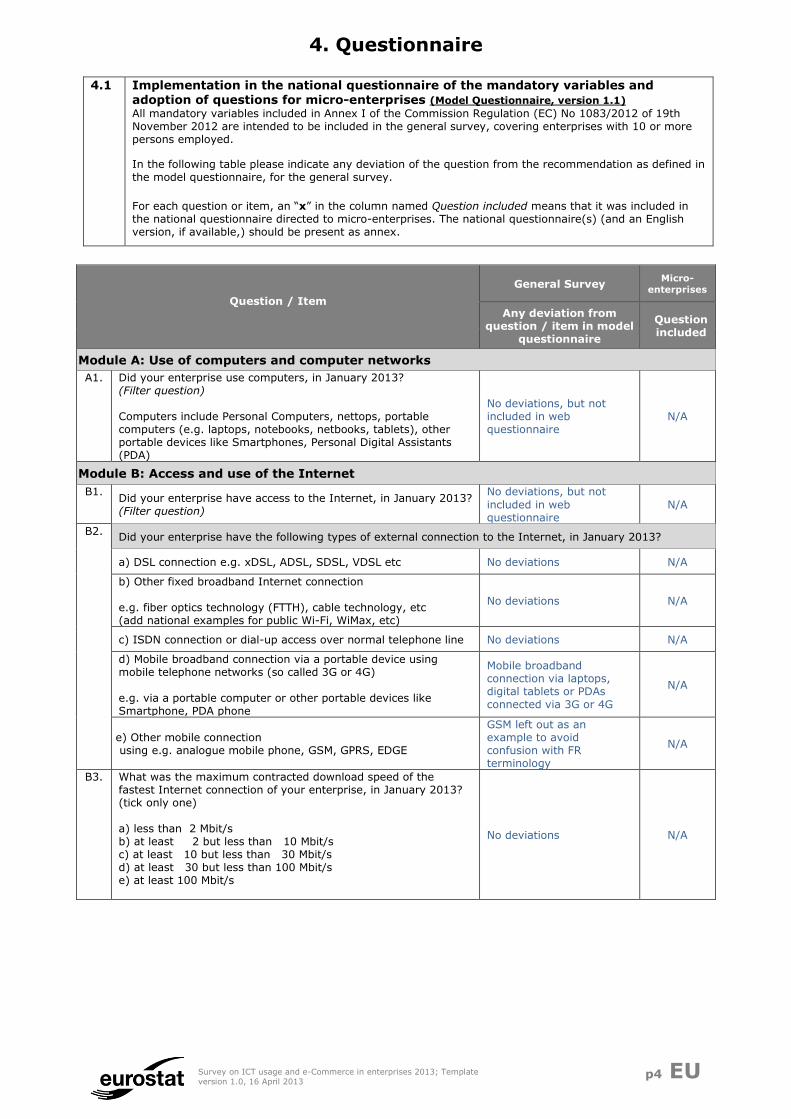
4. Questionnaire
4.1 Implementation in the national questionnaire of the mandatory variables and
adoption of questions for micro-enterprises (Model Questionnaire, version 1.1) All mandatory variables included in Annex I of the Commission Regulation (EC) No 1083/2012 of 19th November 2012 are intended to be included in the general survey, covering enterprises with 10 or more persons employed.
In the following table please indicate any deviation of the question from the recommendation as defined in the model questionnaire, for the general survey.
For each question or item, an “x” in the column named Question included means that it was included in the national questionnaire directed to micro-enterprises. The national questionnaire(s) (and an English version, if available,) should be present as annex.
Question / Item
General Survey Micro-
enterprises
Any deviation from question / item in model
questionnaire
Question included
Module A: Use of computers and computer networks
A1. Did your enterprise use computers, in January 2013? (Filter question) Computers include Personal Computers, nettops, portable computers (e.g. laptops, notebooks, netbooks, tablets), other portable devices like Smartphones, Personal Digital Assistants (PDA)
No deviations, but not included in web questionnaire
N/A
Module B: Access and use of the Internet
B1. Did your enterprise have access to the Internet, in January 2013? (Filter question)
No deviations, but not
included in web questionnaire
N/A
B2. Did your enterprise have the following types of external connection to the Internet, in January 2013?
a) DSL connection e.g. xDSL, ADSL, SDSL, VDSL etc No deviations N/A
b) Other fixed broadband Internet connection e.g. fiber optics technology (FTTH), cable technology, etc (add national examples for public Wi-Fi, WiMax, etc)
No deviations N/A
c) ISDN connection or dial-up access over normal telephone line No deviations N/A
d) Mobile broadband connection via a portable device using mobile telephone networks (so called 3G or 4G) e.g. via a portable computer or other portable devices like Smartphone, PDA phone
Mobile broadband connection via laptops, digital tablets or PDAs connected via 3G or 4G
N/A
e) Other mobile connection using e.g. analogue mobile phone, GSM, GPRS, EDGE
GSM left out as an example to avoid confusion with FR terminology
N/A
B3. What was the maximum contracted download speed of the fastest Internet connection of your enterprise, in January 2013? (tick only one) a) less than 2 Mbit/s b) at least 2 but less than 10 Mbit/s c) at least 10 but less than 30 Mbit/s d) at least 30 but less than 100 Mbit/s e) at least 100 Mbit/s
No deviations N/A

Survey on ICT usage and e-Commerce in enterprises 2013; Template
version 1.0, 16 April 2013 p5 EU
Question / Item
General Survey Micro-
enterprises
Any deviation from question / item in model
questionnaire
Question included
B4. How many persons employed used computers with access to the World Wide Web at least once a week, in January 2013? Or Please indicate an estimate of the percentage of the total number of persons employed who used computers with access to the World Wide Web at least once a week, during January 2013. Computers include Personal Computers, nettops, portable computers (e.g. laptops, notebooks, netbooks, tablets ), other portable devices like Smartphone, PDA phone.
Only percentages collected N/A
Mobile connection to the Internet for business use
B5. In January 2013, did any persons employed have portable devices provided by the enterprise that allowed a mobile connection to the Internet for business use? Tick 'No' if the devices allowed Internet connection only via wireless networks (i.e. local wireless networks or public hotspots such as [add national examples of Wi-Fi hotspots, hotzones e.g.
HotCity for Luxembourg]) and not via mobile telephone networks (filter question) (e.g. portable computers or other portable devices like Smartphone, PDA phone)
No deviations N/A
B6. In January 2013, how many persons employed had a portable
device provided by the enterprise that allowed a mobile connection to the Internet for business use? (e.g. portable computers or other portable devices like Smartphone, PDA phone) or Please indicate an estimate of the percentage of the total number of persons employed who had a portable device provided by the enterprise that allowed a mobile connection to the Internet for business use, in January 2013? (e.g. portable computers or other portable devices like Smartphone, PDA phone)
Only percentages collected N/A
Use of a Website or Home Page
B7. In January 2013, did your enterprise have a Website or Home Page? (Filter question)
No deviations N/A
B8. In January 2013, did the Website or Home Page have any of the following?
a) Online ordering or reservation or booking, e.g. shopping cart No deviations N/A
b) A privacy policy statement, a privacy seal or certification related to website safety
No deviations N/A
c) Product catalogues or price lists No deviations N/A
d) Order tracking available on line No deviations N/A
e) Possibility for visitors to customise or design the products No deviations N/A
f) Personalised content in the website for regular/repeated visitors
No deviations N/A
Use of the Internet in contact with public authorities
B9. During 2012, did your enterprise use the Internet for interaction with public authorities to: (excluding any interaction via e-mails)
a) obtain information from public authorities' websites or home pages?
No deviations N/A
b) obtain forms from public authorities' websites or home pages? No deviations N/A
c) submit completed forms electronically? e.g. forms for customs or VAT declaration
No deviations N/A

Survey on ICT usage and e-Commerce in enterprises 2013; Template
version 1.0, 16 April 2013 p6 EU
Question / Item
General Survey Micro-
enterprises
Any deviation from question / item in model
questionnaire
Question included
d) declare VAT completely electronically without the need for paper work? (including electronic payment, if required)
Regrouped under heading “Treating an administrative procedure completely electronically without the need for additional paper work (including payment if required)”
N/A
e) declare social contributions completely electronically without the need for paper work? (including electronic payment, if required)
Regrouped under heading “Treating an administrative procedure completely electronically without the need for additional paper work (including payment if required)”
N/A
Public electronic Procurement
B10. During 2012, did your enterprise use the Internet for accessing tender documents and specifications in electronic procurement systems of public authorities?
No deviations N/A
B11. During 2012, did your enterprise use the Internet for offering goods or services in public authorities' electronic procurement systems (eTendering)?
a) in your own country No deviations N/A
b) in other EU countries No deviations N/A
Use of Social Media
B12. In January 2013, did your enterprise use any of the following social media? (add national examples; replace existing examples if necessary)
a) Social networks (e.g. Facebook, LinkedIn, Xing, Viadeo, Yammer, etc)
Options split into “External / Internal / No”
N/A
b) Enterprise's blog or microblogs (e.g. Twitter, Present.ly, etc) Options split into “External / Internal / No”
N/A
c) Multimedia content sharing websites (e.g. YouTube, Flickr, Picassa, SlideShare, etc)
Options split into “External / Internal / No”
N/A
d) Wiki based knowledge sharing tools Options split into “External / Internal / No”
N/A
e) The enterprise did not use any of the above mentioned social media or used them only for posting paid adverts
Separate question to facilitate filtering after B12
N/A
B13. In January 2013, did your enterprise use social media to:
a) Develop the enterprise's image or market products (e.g. advertising or launching products, etc)
No deviations N/A
b) Obtain or respond to customer opinions, reviews, questions No deviations N/A
c) Involve customers in development or innovation of goods or services
No deviations N/A
d) Collaborate with business partners (e.g. suppliers, etc.) or other organisations (e.g. public authorities, non-governmental organisations, etc.)
No deviations N/A
e) Recruit employees No deviations N/A
f) Exchange views, opinions or knowledge within the enterprise No deviations N/A
B14. In January 2013, did your enterprise have a formal policy for using social media? (e.g. objectives, rules, procedures, etc)
No deviations N/A
Module C: Electronic invoicing (Scope: enterprises with Computers)
C1. In January 2013, did your enterprise send electronic invoices?
a) e-invoices in a standard structure suitable for automatic processing e.g. EDI, UBL, XML, (please add national examples)
No deviations N/A
b) Electronic invoices not suitable for automatic processing e.g. emails, email attachment in PDF format
No deviations N/A
C2. In January 2013, did your enterprise receive e-invoices in a standard structure suitable for automatic processing? e.g. EDI, UBL, XML, (please add national examples)
No deviations N/A

Survey on ICT usage and e-Commerce in enterprises 2013; Template
version 1.0, 16 April 2013 p7 EU
Question / Item
General Survey Micro-
enterprises
Any deviation from question / item in model
questionnaire
Question included
Module D: Automatic share of information within the enterprise (Scope: enterprises with Computers) D1. In January 2013, did your enterprise use an ERP software
package? No deviations N/A
Module E: e-Commerce (Scope: enterprises outside the financial sector with Computers)
E-commerce Sales
Web sales
E1. During 2012, did your enterprise receive orders for goods or services placed via a website? (excluding manually typed e-mails) (Filter question)
No deviations N/A
E2. Please state the value of the turnover resulting from orders received that were placed via a website (in monetary terms, excluding VAT), in 2012. If you can't provide this value, Please indicate an estimate of the percentage of the total turnover resulting from orders received that were placed via a website, in 2012.
Only percentages collected N/A
E3. In 2012, did your enterprise receive orders placed via a website by customers located in the following geographic areas?
a) Own country No deviations N/A
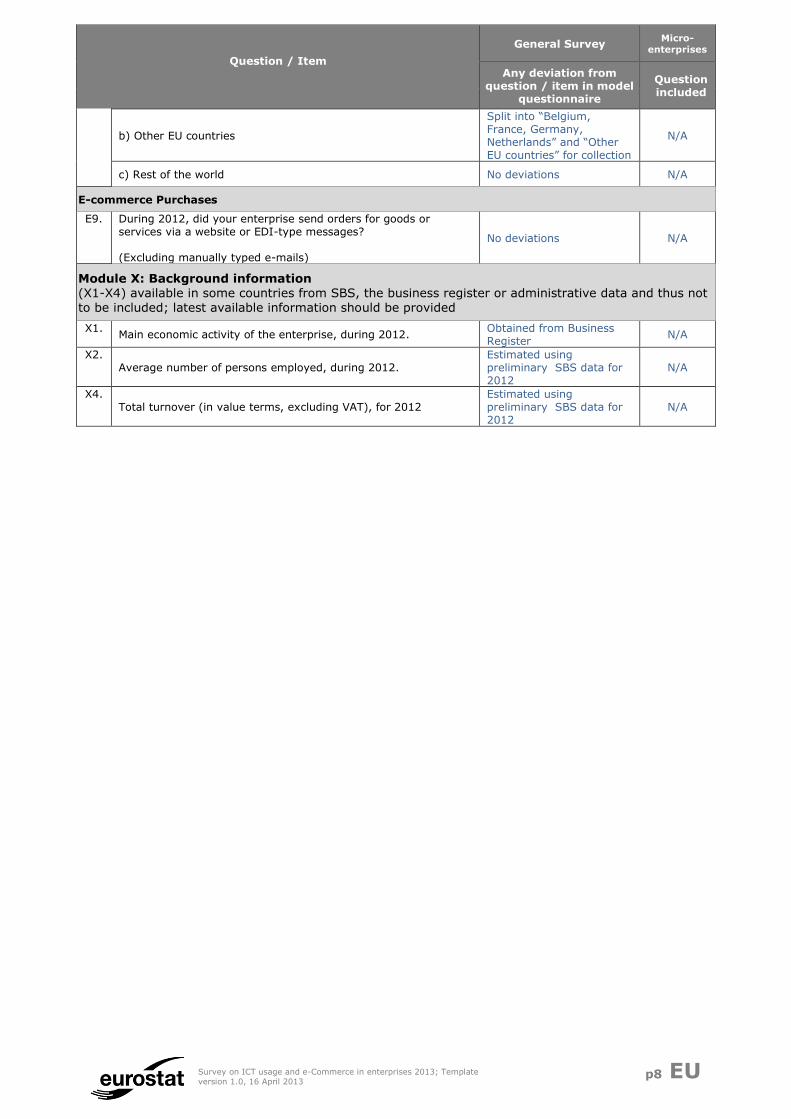
b) Other EU countries
Split into “Belgium, France, Germany, Netherlands” and “Other EU countries” for collection
N/A
c) Rest of the world No deviations N/A
E4. Please provide a percentage breakdown of the turnover from orders received that were placed via a website in 2012 by type of customer (estimates in percentage of the monetary values, excluding VAT)
a) B2C (Sales to private consumers) No deviations N/A
b) B2B (Sales to other enterprises) and B2G (Sales to public authorities)
Split into “B2B” and “B2G” separately for collection
N/A
c) TOTAL
E5. Did any of the following obstacles limit or prevent your enterprise from selling via a website?
a) The enterprise's goods or services were not suitable for web sales
No deviations N/A
b) Problems in web sales related to logistics (shipping of goods or delivery of services)
No deviations N/A
c) Problems in web sales related to payments No deviations N/A
d) Problems in web sales related to ICT security or data protection
No deviations N/A
e) Problems in web sales related to the legal framework No deviations N/A
f) The cost of introducing web sales was, or would have been, too high compared to the benefits
No deviations N/A
EDI-type sales
E6. During 2012, did your enterprise receive orders for goods or services placed via EDI-type messages? (Filter question)
No deviations N/A
E7. Please state the value of the turnover resulting from orders received that were placed via EDI-type messages (in monetary terms, excluding VAT), in 2012. or Please indicate an estimate of the percentage of the total turnover resulting from orders received that were placed via EDI-type messages, in 2012.
Only percentages collected N/A
E8. In 2012, did your enterprise receive orders placed via EDI-type messages by customers located in the following geographic areas?
a) Own country No deviations N/A
Survey on ICT usage and e-Commerce in enterprises 2013; Template
version 1.0, 16 April 2013 p8 EU
Question / Item
General Survey Micro-
enterprises
Any deviation from question / item in model
questionnaire
Question included
b) Other EU countries
Split into “Belgium, France, Germany, Netherlands” and “Other EU countries” for collection
N/A
c) Rest of the world No deviations N/A
E-commerce Purchases
E9. During 2012, did your enterprise send orders for goods or services via a website or EDI-type messages? (Excluding manually typed e-mails)
No deviations N/A
Module X: Background information (X1-X4) available in some countries from SBS, the business register or administrative data and thus not
to be included; latest available information should be provided
X1. Main economic activity of the enterprise, during 2012.
Obtained from Business Register
N/A
X2. Average number of persons employed, during 2012.
Estimated using preliminary SBS data for 2012
N/A
X4. Total turnover (in value terms, excluding VAT), for 2012
Estimated using preliminary SBS data for 2012
N/A

Survey on ICT usage and e-Commerce in enterprises 2013; Template
version 1.0, 16 April 2013 p9 EU
4.2 Coverage of the optional variables of the Model Questionnaire (MQ version 1.1) Indicate below which optional variables and questions were included in the national questionnaire.
For each question or item, an “x” in the column named Question included means that it was included in the national questionnaire. The column "10+" refers to enterprises with 10 or more persons employed and column "Micr" refers to micro-enterprises.
Optional Question / Item
Question included Any deviations from question /
item in model questionnaire 10+ Micr
Module A: Use of computers and computer networks (optional questions/items)
A2. How many persons employed used computers at least once a week, in January 2013? If you can't provide this value, Please indicate an estimate of the percentage of the total number of persons employed who used computers at least once a week, in January 2013.
No N/A
A3. In January 2013, did any persons employed have remote access to the enterprise's e-mail system, documents or applications (via fixed, mobile or wireless connection to the Internet)?
Yes N/A Split into 3 separate questions, calculated for delivery
Module B: Access and use of the Internet (optional questions/items)
B2. Did your enterprise have the following types of external connection to the Internet, in January 2013?
d1) via portable computer using mobile telephone networks (so called 3G or 4G) e.g. notebook, netbook, laptop, Ultra Mobile PC-UMPC, tablet, etc
No N/A
d2) via other portable devices like Smartphone, PDA phone using mobile telephone networks (so called 3G or 4G)
No N/A
B8. In January 2013, did the Website or Home Page have any of the following?
g) Advertisement of open job positions or online job application
Yes N/A No deviations
Module D: Automatic share of information within the enterprise (optional questions/items) (Scope:
enterprises with Computers)
D2. In January 2013, did your enterprise use CRM software to manage:
a) the collection, storing and making available information about customers to various business functions
Yes N/A No deviations
b) the analysis of information about customers for marketing purposes. (e.g. setting prices, sales promotion, choosing distribution channels, etc.)
Yes N/A No deviations
Module E: e-Commerce (optional questions/items) (Scope: enterprises outside the financial sector with Computers)
E10. During 2012, did your enterprise place orders for goods or services via a website?
Yes N/A Combined with E11 in a single question (2 options)
E11. During 2012, did your enterprise place orders for goods or services via EDI-type messages?
Yes N/A Combined with E10 in a single question (2 options)
E12. Please indicate for 2012 the value of orders that were sent electronically in relation to the total purchases' value (in monetary terms, excluding VAT) Less than 1% 1% or more and less than 5% 5% or more and less than 10% 10% or more and less than 25% 25% or more and less than 50% 50% or more and less than 75% 75% or more or Please state the value of the purchases resulted from orders placed electronically (in monetary terms, excluding VAT), in 2012. or Please provide an estimate of the percentage of the total purchases that resulted from orders placed electronically, in 2012.
Yes N/A Only percentages collected

Survey on ICT usage and e-Commerce in enterprises 2013; Template
version 1.0, 16 April 2013 p10 EU
E13. In 2012, did your enterprise place orders via a website or EDI-type messages to suppliers located in the following geographic areas?
a) Own country Yes N/A
b) Other EU countries Yes N/A Split into “Belgium, France, Germany, Netherlands” and “Other EU countries” for collection
c) Rest of the world Yes N/A
Module X: Background information (optional questions/items) (X1-X4) available in some countries from SBS, the business register or administrative data and thus not to be included; latest available information should be provided X3. Total purchases of goods and services (in value
terms, excluding VAT), for 2012 No N/A
Not included, but will be estimated using preliminary SBS data for 2012
4.3 General remarks on the national questionnaire
This section can be filled in with general information about the variables collected. For example if any of the variables was collected outside the scope of the survey (administrative sources, other survey, etc.).
N/A
4.4 Additional questions introduced in national questionnaire(s)
In this section you can introduce general information on the adoption of additional national questions. In the following table you can provide the designation of these questions and any other additional information on that question you wish to provide.
Variable Additional information
Does your enterprise belong to a group -
On how many site(s) on the Luxembourgish
territory is your enterprise located? -
How would you consider the position of your firm on its market?
Options: Leader, Challenger, Follower
How would you consider the competition of your firm on its market?
Options: Very intense, intense, limited, very limited
Does your enterprise use any ICT standards producing its main products or services?
Options: Formal standards, Consortia
Standards
Is your enterprise currently participating into the
elaboration of ICT standards? (Filter question) Options: Recognized body, Consortia
Is your enterprise interested to participate in ICT standardization in any of the following areas?
Includes various types (cloud computing, security, data management, etc.)
Please state the reasons why your enterprise currently does not participate in ICT
standardization.
Includes various options: not aware of opportunities, IPR issues, No need, etc.

Survey on ICT usage and e-Commerce in enterprises 2013; Template
version 1.0, 16 April 2013 p11 EU
5. Frame population
5.1 Description of frame population
This section includes a description of the frame population. Please indicate if the frame population is the same as, or is in some way coordinated with, the one used for the Structural Business Statistics. If there was any deviation from the recommendation of the model survey, please refer to it explicitly. Please describe if different frames are used during different stages of the statistical process (e.g. frame used for sampling vs. frame used for grossing up).
The frame population used for sampling w drawn from the business register in March. Since quantitative data for the last two months of the reference year 2012 are not yet available at this date, we take into account the average number of persons employed from January to October 2012 for the definition of size-classes when the frame population is drawn.
All mandatory activities laid out in the model survey are covered. In order to be in line with the SBS frame population (for size classes of 10 employees or more), we also take into
account concepts such as market activity and economic territory when defining the frame population.
For the production of the final results, an updated frame population from the business register
is used (covering all of 2012), as well as information from SBS preliminary results for 2012. For this reason, some quantitative data is under embargo until official transmission of preliminary SBS results to Eurostat.
5.2 Known shortcomings of the frame population, if any
Indicate shortcomings in terms of timeliness (e.g. time lag between last update of the sampling frame and the moment of the actual sampling), geographical coverage, coverage of different subpopulations, data available etc., and any measures taken to correct it, for this survey.
As described above, the frame population used for sampling is updated for the production of the final results, which can lead to differences between the two frames. We try to minimize the effect on the final sample by taking into account the average number of employees, as well as a sufficiently high sampling rate.
Since a lot of the requested breakdowns comprise a low number of enterprises, some NACE Rev. 2 aggregates for calculation at the European level will have to be flagged because of disclosure risks (too few firms in the population of several strata, e.g. S95.1).

Survey on ICT usage and e-Commerce in enterprises 2013; Template
version 1.0, 16 April 2013 p12 EU
5.3 Frame population distribution In the following table, please provide the number of statistical units (e.g. enterprises) in the frame population, by size and by economic activity. Grey cells correspond to optional size classes, and are to be filled in only when these were covered by the survey. Include in the totals all filled in cells listed above the Total.
Frame Population
1 to 4 persons
employed
5 to 9 persons
employed
10 to 49 persons
employed
50 to 249
persons
employed
250 or more
persons
employed
Total
10-12 39 17 7 63
13-15 3 3 1 7
16-18 22 7 2 31
19-23 13 21 6 40
24-25 75 17 4 96
26 3 0 2 5
27-28 12 11 4 27
29-30 5 3 0 8
31-33 29 5 0 34
35-39 24 8 2 34
41-43 756 141 17 914
45 119 23 2 144
46 250 50 2 302
47 364 45 10 419
49-53 181 66 13 260
55 82 13 0 95
56 257 9 6 272
58-60 28 8 1 37
61 12 7 3 22
62-63 133 33 1 167
68 28 1 0 29
69-74 360 55 9 424
77-78+80-82 134 52 23 209
79 8 3 0 11
95.1 1 0 0 1
Total 2938 598 115 3651
Of which ICT sector (in:
26.1-26.4+
26.8+46.5+
58.2+61+
62+63.1+95.1)
179 46 5 230
64.19+64.92
65.1+65.2
66.12+66.19
Total financial
sector

Survey on ICT usage and e-Commerce in enterprises 2013; Template
version 1.0, 16 April 2013 p13 EU
6. Sampling design
6.1 Sampling method
This section includes a description of the sampling method used (e.g. stratified random sample, quota sampling, cluster sampling; one-stage or two-stage sampling). If stratification was used, please indicate which variables were used to stratify, the categories of those variables, in particular for the NACE categories related to the "possible calculation of European aggregates", and the final number of strata.
Include also in this section the method used for the determination of the sample size and the method used for sample selection. In particular, mention if any procedures for the coordination or non- overlapping with samples of other surveys was used.
The frame population was stratified using the following criteria:
- 3 size classes (i.e. 10-49, 50-249, 250+ employees)
- 15 NACE categories. These categories are mainly based on the aggregates listed in the model questionnaire for possible calculation of national NACE Rev. 2 aggregates, the only
difference being that division 56 and group 95.1 are included as separate categories:
o C10_18
o C19_23
o C24_25
o D26_36
o D35_39
o F41_43
o G45_47
o H49_53
o I55
o I56
o J58_63
o L68
o M69_74
o N77_82
o S951
The method used for sampling was a stratified random sample, with varying sampling rates depending on size class:
- For the two size classes 50-249 and 250+, the sampling rate was 100% (i.e. a census);
- For the size class 10-49, the sampling rate was generally fixed 60%, the only exception being I56 with a sampling rate of 30%, as it is not calculated at the national level.
The sampling rate of 60% was chosen after simulating the effect of various sampling rates on the coefficients of variation of the 2011 and 2012 data, taking into account historical response rates. Simulations were performed on the coefficients of variation for the following indicators: cuse, iacc, web, ade, awsell, aebuy.

Survey on ICT usage and e-Commerce in enterprises 2013; Template
version 1.0, 16 April 2013 p14 EU
6.2 Gross sample distribution In the following table, please provide the number of statistical units (e.g. enterprises) selected for sampling without any posterior correction for misclassification, by size and by economic activity. Grey cells correspond to optional size classes or economic activities, and are to be filled in only when these were covered by the survey. Include in the totals all filled in cells listed above the Total.
Gross sample
1 to 4 persons
employed
5 to 9 persons
employed
10 to 49 persons
employed
50 to 249
persons
employed
250 or more
persons
employed Total
10-Dec 20 17 6 43
13-15 1 3 1 5
16-18 16 6 2 24
19-23 7 20 6 33
24-25 44 18 4 66
26 1 0 2 3
27-28 7 11 4 22
29-30 3 3 0 6
31-33 17 4 . 21
35-39 13 8 2 23
41-43 434 139 15 588
45 70 23 2 95
46 138 47 2 187
47 199 41 10 250
49-53 109 67 12 188
55 45 12 0 57
56 73 7 6 86
58-60 13 8 1 22
61 10 5 3 18
62-63 81 33 1 115
68 19 1 0 20
69-74 196 53 9 258
77-78+80-82 76 52 24 152
79 3 3 0 6
95.1 1 0 0 1
Total 1596 581 112 2289
Of which ICT
sector (in:
26.1-26.4+
26.8+46.5+
58.2+61+
62+63.1+95.1)
105 44 5 154
64.19+64.92
65.1+65.2
66.12+66.19
Total financial
sector

Survey on ICT usage and e-Commerce in enterprises 2013; Template
version 1.0, 16 April 2013 p15 EU
7. Response and non-response
(Quality Report)
7.1 Unit Response
The following table should be filled in with the number of units (e.g. enterprises), by type of
response to the survey and by the percentage of these values in relation to the gross sample size.
Type of response
1-9 persons
employed
10 or more persons
employed
Number % Number %
Gross sample size (as in section 6.2) …. 100% 2289 100%
1. Response (questionnaires returned by the enterprise) …. % 1884 82.3%
1.1 Used for tabulation and grossing up (Net sample or Final Sample; as in section 7.2)
…. % 1869 81.6%
1.2 Not used for tabulation …. % 15 0.07%
1.2.1 Out of scope (deaths, misclassified originally in
the target population, etc.) …. % 15 0.07%
1.2.2 Other reasons (e.g. unusable questionnaire, etc.)
…. % n/a
2. Non-response (e.g. non returned mail, returned mail by post office, etc.)
…. % 405 17.7%

Survey on ICT usage and e-Commerce in enterprises 2013; Template
version 1.0, 16 April 2013 p16 EU
7.2 Net sample distribution In the following table, please provide the number of enterprises used for grossing up and tabulation, by size and by economic activity. Grey cells correspond to optional size classes or economic activities, and are to be filled in only when these were covered by the survey. Include in the totals all filled in cells listed above the Total.
Net sample 1 to 4 persons
employed
5 to 9 persons
employed
10 to 49 persons
employed
50 to 249
persons
employed
250 or more
persons
employed
Total
10-12 17 15 4 36
13-15 1 3 1 5
16-18 11 4 2 17
19-23 7 18 6 31
24-25 35 15 4 54
26 1 0 2 3
27-28 7 10 4 21
29-30 2 3 0 5
31-33 13 4 0 17
35-39 11 8 2 21
41-43 338 120 15 473
45 53 23 2 78
46 111 42 2 155
47 155 35 10 200
49-53 89 52 10 151
55 33 11 0 44
56 56 8 6 70
58-60 11 6 1 18
61 8 6 3 17
62-63 66 28 1 95
68 12 1 0 13
69-74 162 49 7 218
77-78+80-82 58 43 21 122
79 3 1 0 4
95.1 1 0 0 1
Total 1261 505 103 1869
Of which ICT
sector (in:
26.1-26.4+
26.8+46.5+
58.2+61+
62+63.1+95.1)
85 38 5 128
64.19+64.92
65.1+65.2
66.12+66.19
Total financial
sector

Survey on ICT usage and e-Commerce in enterprises 2013; Template
version 1.0, 16 April 2013 p17 EU
7.3 Comments on unit response, if any
The response rate is comparable to the 2012 survey.
7.4 Methods used for minimizing unit non-response
Where applicable, give a description of measures taken to reduce the unit non-response: advance notification in the form of a letter or phone call; showing respondents how the data they are providing are being used; system of reminders; etc.
A short document outlining the results of previous surveys is sent together with the first letter/questionnaire to show one of the usages of the survey.
As of 2012, we provide the possibility to complete the survey via an online
questionnaire. Nearly 39% of responding enterprises chose this method.
The number of reminders has been increased in recent years. Units in strata with low response-rates (< 80%) are contacted specifically via mail or telephone.
7.5 Methods used for unit non-response treatment Indicate the method used to correct for unit non-response
(Please tick the appropriate box)
1. No treatment for unit non-response
2. Treatment by re-weighting X
2.1 Re-weighting by the sampling design strata considering that non-
response is ignorable inside each stratum (the naïve model)
2.2 Re-weighting by identified response homogeneity groups
(created using sample-level information)
2.3 Re-weighting through calibration/post-stratification (performed using population information) by the groups used for
calibration/post-stratification X
3. Treatment by imputation (done distinctly for each variable/item)
4. Please briefly describe below the method(s) and the model(s) corresponding to the above or other method(s) used for the treatment of unit non-response. (e.g. Re-weighting using Horvitz-Thompson estimator, ratio estimator or regression
estimator, auxiliary variables, etc.)
Re-weighting was done in two steps.
First, the original sampling weights for each stratum were adjusted to compensate for unit non-response (original weight divided by response
rate for the survey stratum).
The adjusted sampling weights were than calibrated to increase coherence
with SBS preliminary data. Auxiliary variables were turnover and number of persons employed, the strata used were the same as those used for sampling, when possible (Eurostat strata used for possible calculation of national NACE Rev. 2 aggregates). Please refer to section 8 for further details on the weighting process.
7.6 Other comments relating to the unit non-response If any, please use this box to inform on additional issues on the non-response calculation (e.g. method used in national publications, etc.).
n/a

Survey on ICT usage and e-Commerce in enterprises 2013; Template
version 1.0, 16 April 2013 p18 EU
7.7 Questions or items with item response rates below 90% If any, identify the items with low response rates (the cut-off value to be used is 0.90) and indicate their respective response rates. The item non-response rate should of course be calculated taking into account the routing and filtering in the questionnaire.
There are no questions with response rates lower than 90%. The lowest-scoring variable is the “maximum contracted download speed (ISPD)” with a response rate slightly above 94%. All other variables have response rates around or above 97%.
7.8 Methods used for item non-response treatment Indicate whether imputations are made for item non-response and give a short description of the methods used. Please see also guidance on this subject in the model questionnaire and the Methodological Manual.
1. No treatment for item non-response X
2. Deductive imputation An exact value can be derived as a known function of other characteristics.
3. Deterministic imputation (e.g. mean/median, mean/median by class, ratio-
based, regression-based, single donor nearest-neighbour, etc) Deterministic imputation leads to estimators with no random component, that is, if the
imputation were to be re-conducted, the outcome would be the same
4. Random imputation (e.g., hot-deck, cold-deck etc) Random imputation leads to estimators with a random component, that is, if the imputation were re-conducted, it would have led to a different result
5. Re-weighting
6. Multiple imputation In multiple imputation each missing value is replaced (instead of a single value) with a set of plausible values that represent the uncertainty of the right value to impute. Multiple imputation methods offer the possibility of deriving variance estimators by taking imputation into account. The incorporation of imputation into the variance can be easily derived based on variability of estimates among the multiply imputed data sets.
7. Please briefly describe below the method(s) and the model(s) corresponding to the above or other method(s) used for the treatment of item non-response.
Item non response is generally not imputed. However, some corrections are performed based on the answers to other questions or filter questions.
7.9 Other comments relating to the item non-response If any, please use this box to inform on additional issues on the non-response calculation (e.g. method used in national publications, etc.).
n/a

Survey on ICT usage and e-Commerce in enterprises 2013; Template
version 1.0, 16 April 2013 p19 EU
8. Grossing-up
(Quality Report)
8.1 Grossing-up procedures Please give a description of the extrapolation or weighting procedures used to gross up the number of enterprises, number of persons employed, turnover and purchases in the net sample to the (target) population. Please present the different steps taken or factors applied to the design weighting to take into account the (post)stratification, balancing for unit non-response, etc. Please describe the different categories of questions – if any – that have been grossed up differently (see also the model questionnaire and the Methodological Manual).
To treat non-response, the initial sampling weight is first adjusted using the response rate for each stratum. Strata are defined by crossing the following size classes and NACE groupings.
In order to obtain reliable results for quantitative variables (that are in line with SBS totals) the corrected weights are calibrated using to the number of units, the total turnover and the total employment per stratum as auxiliary information. Calibration is carried out in R, using the “calib” method of the “sampling” package with a “logit” distance function.
Please note that due to the small number of observations leading to co-linearity problems,
some strata (i.e. C26_33, D35_39, H49_53, I55, I56, L68) cannot be calibrated over all size classes. For these strata, several size classes were combined.
The strata used for calibration consist of the following sampling strata (combinations in parenthesis when applicable):
Size classes:
S - 10-49 employees
M - 50-249 employees
L - 250 employees
NACE groupings:
C10_18
C19_23
C24_25
C26_33 (S+M+L combined)
D35_39 (S+M+L combined)
F41_43
G45_47
H49_53 (S+M+L combined)
I55 (S+M+L combined)
I56 (S+M+L combined)
J58_63
L68 (S+M+L combined)
M69_74
N77_82
S951

Survey on ICT usage and e-Commerce in enterprises 2013; Template
version 1.0, 16 April 2013 p20 EU
9. Standard error
(Quality Report)
9.1 Standard error (for a selection of indicators) Precision measures related to variability due to sampling, unit non-response (the size of the subset of respondents is smaller as compared to the size of the original sample) and other (imputation for item non-response, calibration etc.) are not (yet) required from the Member-State for all indicators. Eurostat will make basic assumptions to compute these measures for all indicators produced (e.g. stratified random sampling assuming as strata the crossing of the variables “Number of Persons Employed” and “Economic Activity” as it was defined in the tables of sections 5.3, 6.2 and 7.2).
In order to evaluate the reasonability of the assumptions made by Eurostat, we need to compare the estimated standard error computed under these assumptions and those computed by the country, taking into account the real sampling design used and other sources of variability, for at least some of the indicators. We also need to compare these measures not only for the overall population, but also for the several breakdowns, in which case the standard error is commonly higher. Please, describe also the method used for the estimation of the standard error in §9.2 below.
We kindly ask you to provide in the following table the estimated standard error in percentage points for each of the listed indicators. Both aggregates for "possible calculation of national aggregates" and for "possible calculation of European aggregates" are included in the table.
Grey cells correspond to optional size classes, and are to be filled in only when these were covered by the survey.
In the third column of the table, a technical reference is made to the question and scope in the same terms as used in the Transmission Format.
Indicator1
Question associated
Estimated
proportion
%2
Standard
error
Percentage
points3
Flag
C: Confidential
U: unreliable Variable Breakdown Unit
e_pmd 10_C10_S951_XK % ent B5. In January 2013, did any persons employed have portable devices provided by the enterprise that allowed a mobile connection to the Internet for business use?
53.7 0.762
e_webord 10_C10_S951_XK % ent B8. In January 2013, did your enterprise have a website that offered online ordering or reservation or booking, e.g. shopping cart?
15.9 0.522
e_erp1 10_C10_S951_XK % ent D1. In January 2013, did your enterprise have in use an ERP software package?
36.3 0.709
e_invsndap 10_C10_S951_XK % ent C1a. In January 2013, did your enterprise send electronic invoices in a standard structure suitable for automatic processing e.g. EDI, UBL, XML?
7.4 0.377
e_invrecap 10_C10_S951_XK % ent C2. In January 2013, did your enterprise receive e-invoices in a standard structure suitable for automatic processing e.g. EDI, UBL, XML?
29.6 0.765
e_awsell 10_C10_S951_XK % ent E1. During 2012, did your enterprise receive orders for products or services placed via a website? (excluding manually typed e-mails)
14.8 0.602
e_aws_b2c 10_C10_S951_XK % ent Derived from E4a. Enterprises which sold to private consumers (B2C) via a website over the last calendar year
9.3 0.119
e_axsell 10_C10_S951_XK % ent E6. During 2012, did your enterprise receive orders for goods or services placed via EDI-type messages?
4.8 0.344
e_aebuy 10_C10_S951_XK % ent E9. During 2012, did your enterprise send orders for goods or services via a website or EDI-type messages (excluding manually typed e-mails)
45.8 0.845
e_web 10_C10_S951_XK % ent B7. In January 2013, did your enterprise have a Website or Home Page?
78.6 0.681
e_web MC_C10_S951_XK % ent B7. In January 2013, did your enterprise have a Website or Home Page?
U
e_web MI_C10_S951_XK % ent B7. In January 2013, did your enterprise have a Website or Home Page?
U
1 The first item of the indicator consists of the variable code as included in the Transmission format, the second is the breakdown (by
activity and/or size class), whereas the third indicates to what the proportion (and standard error) should be related, i.e. % ent: as a
percentage of the total number of enterprises within the scope; % turn: as a percentage of the total turnover of enterprises within the
scope; % emp: as a percentage of the number of persons employed in the enterprises within the scope. 2 The estimated proportion is to be expressed as a percentage; please use decimal points only and as many decimals as needed. Values
should correspond to the latest transmitted data. 3 The standard error is to be expressed in percentage points (absolute precision measure); please use decimal points only and as many
decimals as needed. Values should correspond to the latest transmitted data.

Survey on ICT usage and e-Commerce in enterprises 2013; Template
version 1.0, 16 April 2013 p21 EU
Indicator1
Question associated
Estimated
proportion
%2
Standard error
Percentage
points3
Flag
C: Confidential
U: unreliable Variable Breakdown Unit
e_web S_C10_S951_XK % ent B7. In January 2013, did your enterprise have a Website or Home Page?
U
e_web M_C10_S951_XK % ent B7. In January 2013, did your enterprise have a Website or Home Page?
U
e_web L_C10_S951_XK % ent B7. In January 2013, did your enterprise have a Website or Home Page?
U
e_web 10_C10_12 % ent B7. In January 2013, did your enterprise have a Website or Home Page?
U
e_web 10_C13_15 % ent B7. In January 2013, did your enterprise have a Website or Home Page?
U
e_web 10_C16_18 % ent B7. In January 2013, did your enterprise have a Website or Home Page?
U
e_web 10_C10_18 % ent B7. In January 2013, did your enterprise have a Website or Home Page?
72.7 3.724
e_web 10_C19_23 % ent B7. In January 2013, did your enterprise have a Website or Home Page?
84.7 3.317
e_web 10_C24_25 % ent B7. In January 2013, did your enterprise have a Website or Home Page?
82.1 3.600
e_web 10_C26 % ent B7. In January 2013, did your enterprise have a Website or Home Page?
U
e_web 10_C27_28 % ent B7. In January 2013, did your enterprise have a Website or Home Page?
U
e_web 10_C29_30 % ent B7. In January 2013, did your enterprise have a Website or Home Page?
U
e_web 10_C31_33 % ent B7. In January 2013, did your enterprise have a Website or Home Page?
U
e_web 10_C26_33 % ent B7. In January 2013, did your enterprise have a Website or Home Page?
97.6 1.395
e_web 10_D35_E39 % ent B7. In January 2013, did your enterprise have a Website or Home Page?
81.9 4.963
e_web 10_F41_43 % ent B7. In January 2013, did your enterprise have a Website or Home Page?
76.3 1.436
e_web 10_G45 % ent B7. In January 2013, did your enterprise have a Website or Home Page?
U
e_web 10_G46 % ent B7. In January 2013, did your enterprise have a Website or Home Page?
U
e_web 10_G47 % ent B7. In January 2013, did your enterprise have a Website or Home Page?
U
e_web 10_G45_47 % ent B7. In January 2013, did your enterprise have a Website or Home Page?
73.6 1.522
e_web 10_H49_53 % ent B7. In January 2013, did your enterprise have a Website or Home Page?
62.6 2.405
e_web 10_I55 % ent B7. In January 2013, did your enterprise have a Website or Home Page?
94.7 2.767
e_web 10_I55_56 % ent B7. In January 2013, did your enterprise have a Website or Home Page?
e_web 10_J58_60 % ent B7. In January 2013, did your enterprise have a Website or Home Page?
U
e_web 10_J61 % ent B7. In January 2013, did your enterprise have a Website or Home Page?
U
e_web 10_J62_63 % ent B7. In January 2013, did your enterprise have a Website or Home Page?
U
e_web 10_J58_63 % ent B7. In January 2013, did your enterprise have a Website or Home Page?
96.4 0.249
e_web 10_L68 % ent B7. In January 2013, did your enterprise have a Website or Home Page?
5.474 CU
e_web 10_M69_74 % ent B7. In January 2013, did your enterprise have a Website or Home Page?
86.6 1.700
e_web 10_N77_82_X79 % ent B7. In January 2013, did your enterprise have a Website or Home Page?
U
e_web 10_N79 % ent B7. In January 2013, did your enterprise have a Website or Home Page?
U
e_web 10_N77_82 % ent B7. In January 2013, did your enterprise have a Website or Home Page?
80.9 2.581
e_web 10_S951 % ent B7. In January 2013, did your enterprise have a Website or Home Page?
0.000 C
e_web 10_ICT_T % ent B7. In January 2013, did your enterprise have a Website or Home Page?
U

Survey on ICT usage and e-Commerce in enterprises 2013; Template
version 1.0, 16 April 2013 p22 EU
Indicator1
Question associated
Estimated
proportion
%2
Standard error
Percentage
points3
Flag
C: Confidential
U: unreliable Variable Breakdown Unit
p_empmd 10_C10_S951_XK % emp B6. Please indicate an estimate of the percentage of the total number of persons employed who had a portable device provided by the enterprise that allowed a mobile connection to the Internet for business use, in January 2013
16.1 0.306 U
e_awsval 10_C10_S951_XK % turn E2. Please indicate an estimate of the percentage of the total turnover resulting from orders received that were placed via a website, in 2012.
CU
e_axsval 10_C10_S951_XK % turn E7. Please indicate an estimate of the percentage of the total turnover resulting from orders received that were placed via EDI-type messages, in 2012.
U
9.2 Calculation of the standard error
Various methods can be used for the calculation of the standard error for an estimated proportion. The aim is to incorporate into the standard error the sampling variability but also variability due to unit non-response, item non-response (imputation), calibration etc. In case of census / take-all strata, the aim is to calculate the standard errors comprising the variability due to unit non-response and item non-response.
Please, describe below the approach which you have followed. This information will help Eurostat to evaluate the comparability of the standard errors supplied in the previous section by the different statistical institutes participating in the survey.
a) Name and brief description of the applied estimation approach
Estimations of the variables of interest were performed with the calibrated weights (please refer to section 8.1 for more information on weights).
For a sufficiently large sample size, the calibration estimator is equivalent to the linear
regression estimator and its bias tends to be minor. Consequently, the variance of the estimation is based on the residuals resulting from the relationship between the variable of interest and the ancillary variables which have been used for the calibration.
The standard error for a given survey stratum (which is normally also the stratum used
for grossing-up) is calculated based on these properties. If necessary, these standard errors are than aggregated to the breakdowns requested by Eurostat.
b) Basic formula
The variance of the estimated proportion for a given stratum is equivalent to the variance of the residuals:
)()( UVYV
where
K
kkk XbYU1
represents the residual of the unit k in the linear
regression of Y on the ancillary variables X
More precisely, the estimation of the variance for a given stratum is obtained by applying the following formula
n
sfYV U
2
)1()(
with :
N
nf representing the response rate for a given stratum;
s2U = the variance of the residuals for a given stratum.
The standard error is obtained by taking the square root of )ˆ
(YV .
c) Main reference in the literature

Survey on ICT usage and e-Commerce in enterprises 2013; Template
version 1.0, 16 April 2013 p23 EU
“Techniques de sondage” by Pascal Ardilly (ISBN 10: 2-7108-0847-1)
d) How has the stratification been taken into account?
The same strata used for the grossing-up procedure (see section 8.1) were used to calculate the standard error. The standard error was calculated for each stratum
individually. These individual strata were then aggregated using the following formula:
h
hh
H
h
hW
n
sf
N
NYV
2
1
2
)1()(
with :
N
Nh = the relative importance of a given stratum h in the total population;
h
h
hN
nf representing the response rate for a given stratum h;
s2h = the variance of the residuals of a given stratum h;
H = the total number of strata.
The standard error is obtained by taking the square root of )ˆ
( WYV .
Since the strata used for grossing-up were based on the NACE groupings requested for calculation of national aggregates, this method is only valid for standard errors relating to Totals (10+ No K), Totals by size class (10-49 No K, 50-249 No K, 250+ No K) or related to NACE groupings used for the calculation of national aggregates.
Given that they were not used in the grossing-up procedure, we are unable to determine accurately determine the standard error of breakdowns used for possible calculation of European aggregates. Given that the survey and grossing-up strata,
these breakdowns are flagged as “unreliable”.
Due to insufficient observations for several strata, this method cannot be applied to the variables e_awsval and e_axsval.
e) Which strata have been considered?
The strata used were the ones used for grossing-up. In cases were several strata had to be combined to allow calibration, these regroupings were also taken into account for the
calculation of standard errors. Generally, strata were defined by crossing the following size classes and NACE groupings (exceptions in parenthesis):
Size classes:
S - 10-49 employees
M - 50-249 employees
L - 250 employees
NACE groupings:
C10_18
C19_23
C24_25
C26_33 (S+M+L combined)
D35_39 (S+M+L combined)
F41_43
G45_47
H49_53 (S+M+L combined)
I55 (S+M+L combined)
I56 (S+M+L combined)
J58_63
L68 (S+M+L combined)
M69_74
N77_82
S951

Survey on ICT usage and e-Commerce in enterprises 2013; Template
version 1.0, 16 April 2013 p24 EU
9.3 Comments on reliability and representativeness of results and completeness of dataset
These comments should reflect on the standard errors reported for the indicators and subgroups in section 9.1 as well as on the other indicators and breakdowns. The estimated standard error should not exceed 2% for the overall proportions and should not exceed 5% for the proportions relating to the different subgroups of the population (for those NACE aggregates for calculation and dissemination on national aggregates). If problems were found, these could have implications for future surveys (e.g. need to improve sampling design, to increase sample sizes, to increase the response rates etc.).
Indicators and breakdowns in section 9.1:
The standard errors referring to NACE groupings used for the possible calculation of European aggregates cannot be determined accurately. This is due to the fact that these groupings are different from the strata used in the calibration process (e.g. C10-18 was used in calibration, but the breakdowns for the calculation of European
aggregates are C10-12, C13-15 and C16-18). All breakdowns for the calculation of European aggregates are flagged as unreliable for this reason.
Other indicators and breakdowns:
Standard errors for each variable were calculated for all NACE groupings used for the
possible calculation of European aggregates as well as for totals size class and population totals. This year, combinations of breakdowns/variables with standard errors above 5% were flagged as unreliable (D35-E39 and L68 were most affected by this). No variable showed standard errors above 2% for population totals.
For all indicators and breakdowns:
If significant standard errors were found, were data cells in the transmitted dataset flagged as unreliable?
Yes X No4
4 Please note that if data were not flagged as unreliable they will be released

Survey on ICT usage and e-Commerce in enterprises 2013; Template
version 1.0, 16 April 2013 p25 EU
9.4 Reliability of aggregates for the "possible calculation of European aggregates"
- Please indicate for both the general survey and for micro-enterprises the aggregates for the "possible calculation of European aggregates" that have a sufficiently high quality to be released at national level by introducing an "x" in the column next to the Y/N responses.
- Note: In the case there is a grant agreement that foresees that certain breakdowns will be provided with sufficiently high quality to allow the release at national level, the following table should reflect the grant agreement ("x" next to "Yes" for the respective breakdowns).
- In the case data for few variables/breakdowns cannot be released - although the particular breakdowns had been taken into account in the sampling design as foreseen in the grant agreement - it is expected that the breakdowns are marked with "Yes", data are accordingly flagged as unreliable and explanations should be provided in point 9.3.
- In all cases the data will be evaluated for completeness and compliance with the grant, based on the grant agreement's technical annex and the current quality report; clarifications may be requested.
Economic Activity Micro-enterprises General Survey
10-12 Yes No Yes No X
13-15 Yes No Yes No X
16-18 Yes No Yes No X
26 Yes No Yes No X
27-28 Yes No Yes No X
29-30 Yes No Yes No X
31-33 Yes No Yes No X
45 Yes No Yes No X
46 Yes No Yes No X
47 Yes No Yes No X
55-56 Yes No Yes No X
58-60 Yes No Yes No X
61 Yes No Yes No X
62-63 Yes No Yes No X
64.19+64.92 Yes No Yes No
65.1+65.2 Yes No Yes No
66.12+66.19 Yes No Yes No
77-78+80-82 Yes No Yes No X
79 Yes No Yes No X
95.1 Yes No Yes X No

Survey on ICT usage and e-Commerce in enterprises 2013; Template
version 1.0, 16 April 2013 p26 EU
10. National dissemination of results
(Quality Report)
10.1 National dissemination of results Please indicate if there was any dissemination of results or if any dissemination of results is foreseen. If possible, provide links to any results available on-line.
Results will be published on http://www.statistiques.public.lu/fr/entreprises/
Selected results will also appear in the annual statistical yearbook and in “Luxembourg in figures”.
It is also planned to have a publication in our “Regards”-series.

Survey on ICT usage and e-Commerce in enterprises 2013; Template
version 1.0, 16 April 2013 p27 EU
11. Closing remarks
(Quality Report)
11.1 Problems encountered and lessons to be learnt These comments can relate to methodological issues as well as to the questionnaire itself (item construction, clarity of definitions to respondents, routing and filtering, etc.)
11.2 Other comments, if any
12. Annexes
Note: Please also provide the annexes in a computer-readable format and in English
12.1 Questionnaire in national language FR/DE
12.2 Questionnaire in English (if available)