commercial building ventilation effects on iaq, human ......commercial building ventilation effects...
TRANSCRIPT
Commercial Building Ventilation Effects on IAQ, Human Health and Performance, Building Energy Use and Implications for Future Ventilation StandardsWanyu R. Chan, Ph.D. [email protected] Research Scientist, Indoor Environment GroupEnergy Analysis and Environmental Impacts Division
February 1, 2017
HZEB Research Team
LBNL StaffMike Apte (PI), William Fisk (PI), Rengie Chan (co-PI), Sebastian Cohn, Spencer Dutton, Randy Maddalena, Tom McKone, Mark Mendell, Marion Russell, Meera Sidheswaran, Mike Spears, Douglas Sullivan, Srinandini Parthasarathy, Henry Willem
CEC Program ManagerMarla Mueller
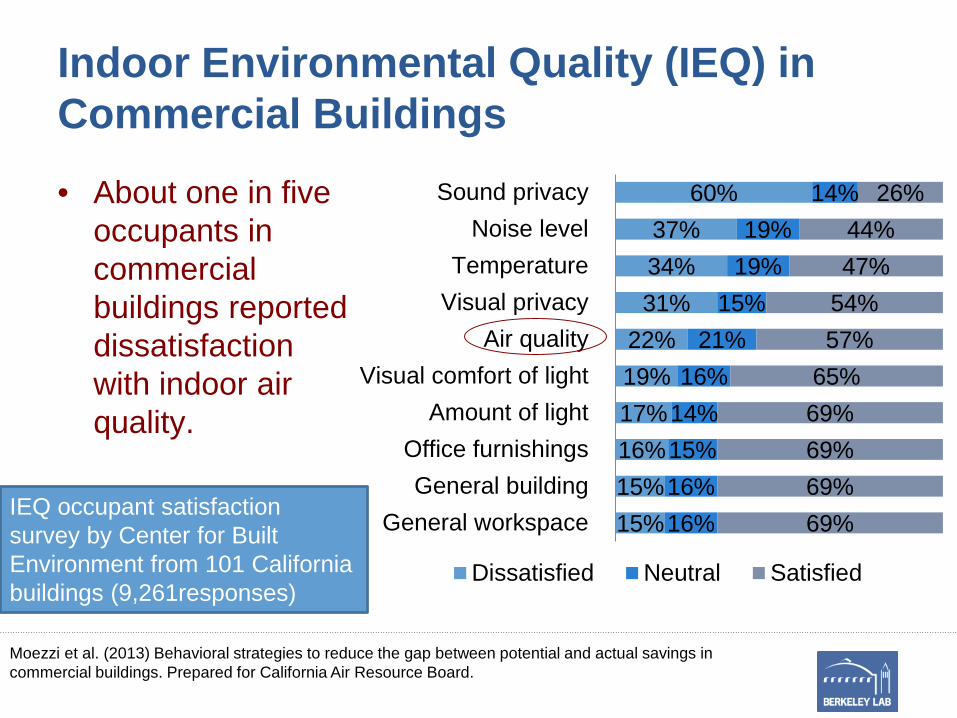
Indoor Environmental Quality (IEQ) in Commercial Buildings
• About one in five occupants in commercial buildings reported dissatisfaction with indoor air quality.
15%15%16%17%19%22%
31%34%37%
60%
16%16%15%14%16%
21%15%
19%19%
14%
69%69%69%69%65%57%54%47%44%
26%
General workspaceGeneral building
Office furnishingsAmount of light
Visual comfort of lightAir quality
Visual privacyTemperature
Noise levelSound privacy
Dissatisfied Neutral Satisfied
IEQ occupant satisfaction survey by Center for Built Environment from 101 California buildings (9,261responses)
Moezzi et al. (2013) Behavioral strategies to reduce the gap between potential and actual savings in commercial buildings. Prepared for California Air Resource Board.
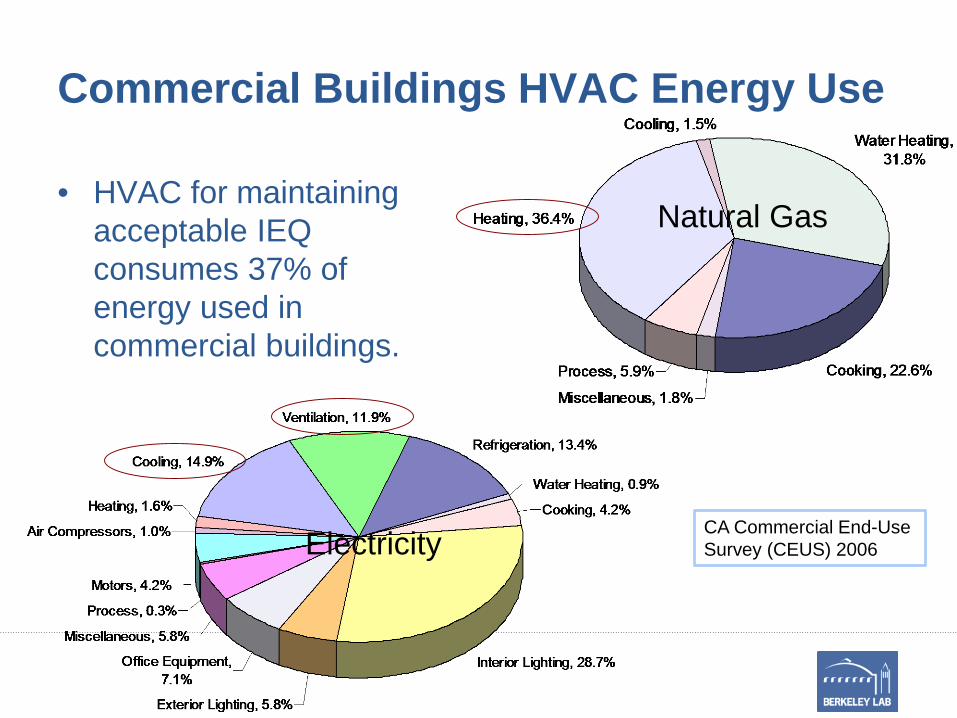
Commercial Buildings HVAC Energy Use
• HVAC for maintaining acceptable IEQ consumes 37% of energy used in commercial buildings.
CA Commercial End-Use Survey (CEUS) 2006
Natural Gas
Electricity
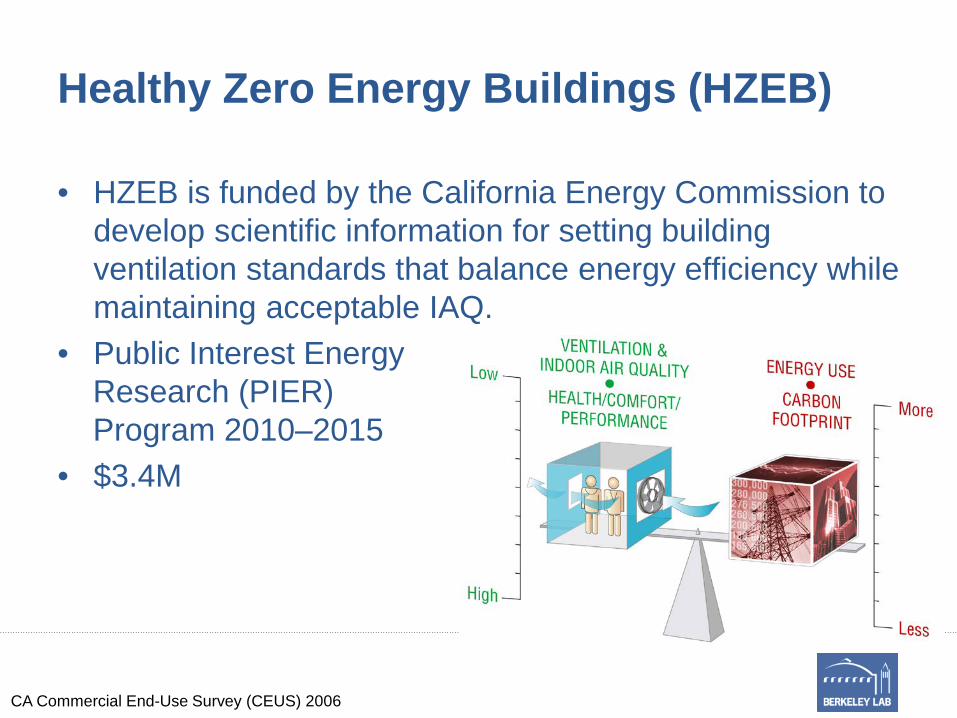
Healthy Zero Energy Buildings (HZEB)
• HZEB is funded by the California Energy Commission to develop scientific information for setting building ventilation standards that balance energy efficiency while maintaining acceptable IAQ.
• Public Interest Energy Research (PIER) Program 2010–2015
• $3.4M
CA Commercial End-Use Survey (CEUS) 2006
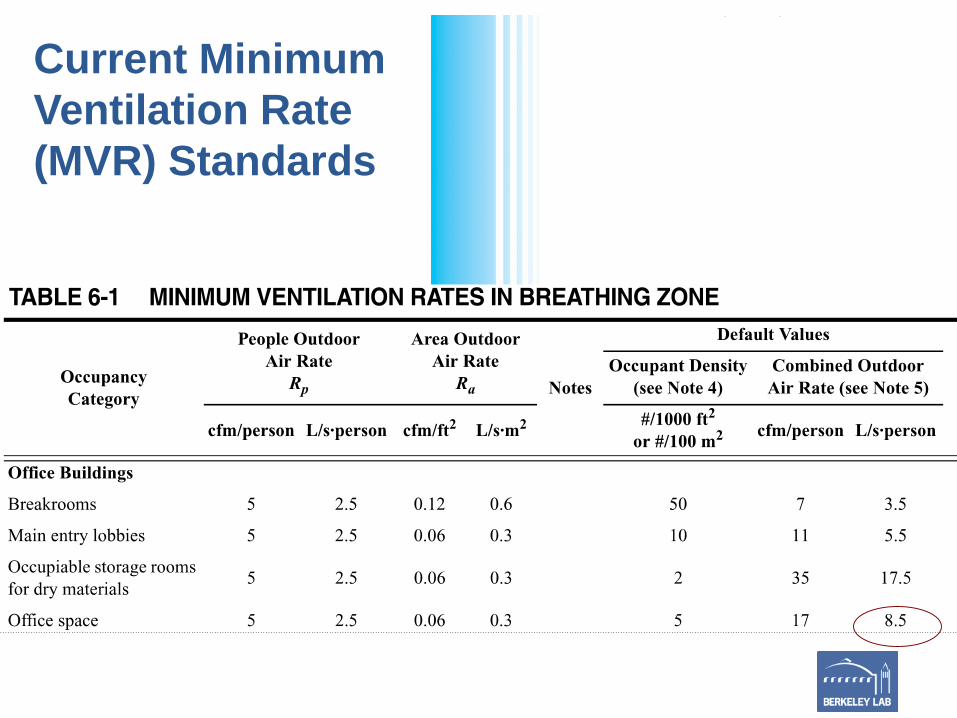
Current Minimum Ventilation Rate (MVR) Standards
Current Minimum Ventilation Rate (MVR) Standards
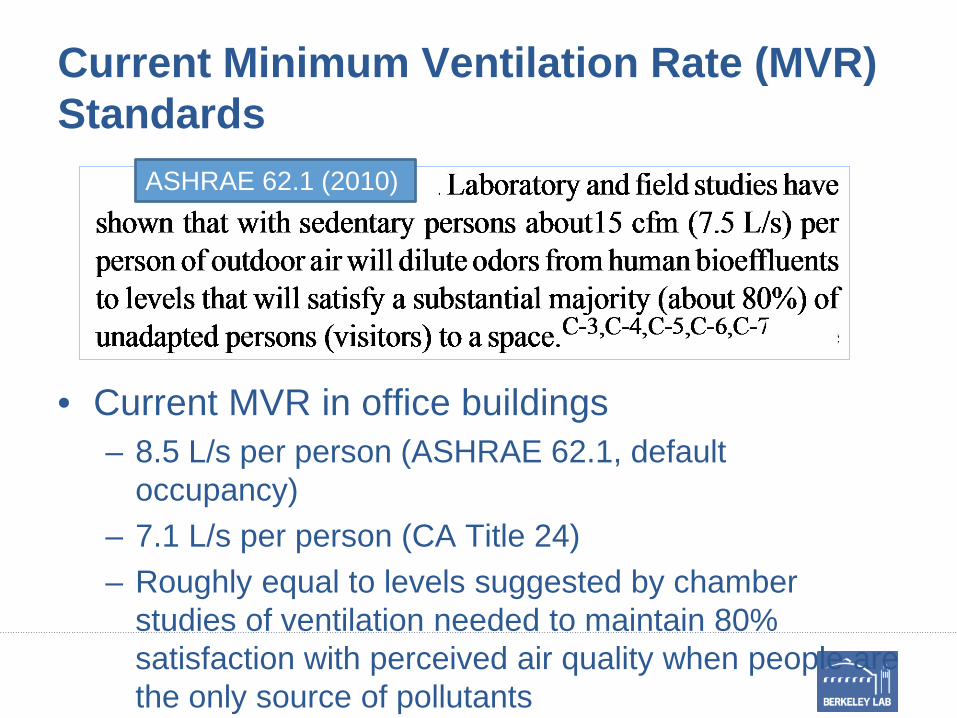
• Current MVR in office buildings– 8.5 L/s per person (ASHRAE 62.1, default
occupancy)– 7.1 L/s per person (CA Title 24) – Roughly equal to levels suggested by chamber
studies of ventilation needed to maintain 80% satisfaction with perceived air quality when people are the only source of pollutants
ASHRAE 62.1 (2010)
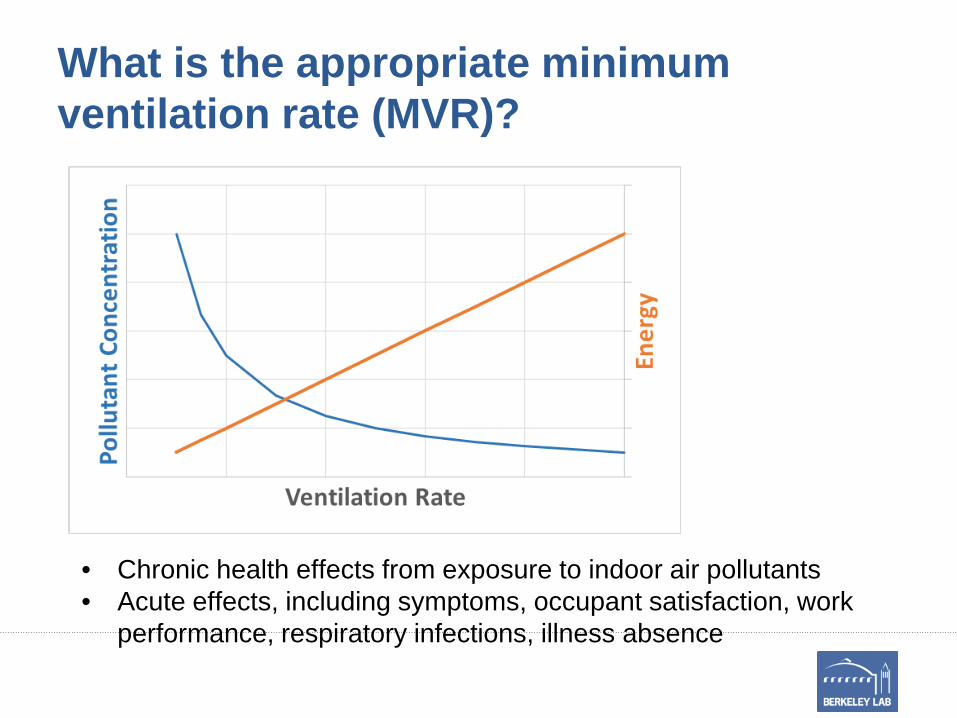
What is the appropriate minimum ventilation rate (MVR)?
• Chronic health effects from exposure to indoor air pollutants• Acute effects, including symptoms, occupant satisfaction, work
performance, respiratory infections, illness absence
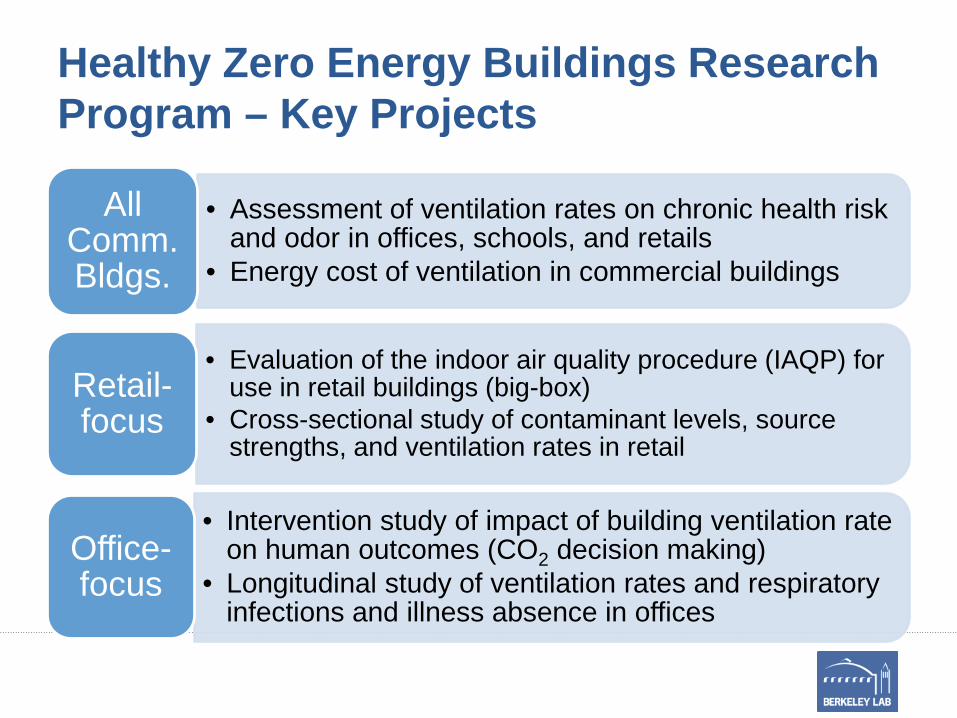
Healthy Zero Energy Buildings Research Program – Key Projects
• Assessment of ventilation rates on chronic health risk and odor in offices, schools, and retails
• Energy cost of ventilation in commercial buildings
All Comm. Bldgs.
• Evaluation of the indoor air quality procedure (IAQP) for use in retail buildings (big-box)
• Cross-sectional study of contaminant levels, source strengths, and ventilation rates in retail
Retail-focus
• Intervention study of impact of building ventilation rate on human outcomes (CO2 decision making)
• Longitudinal study of ventilation rates and respiratory infections and illness absence in offices
Office-focus
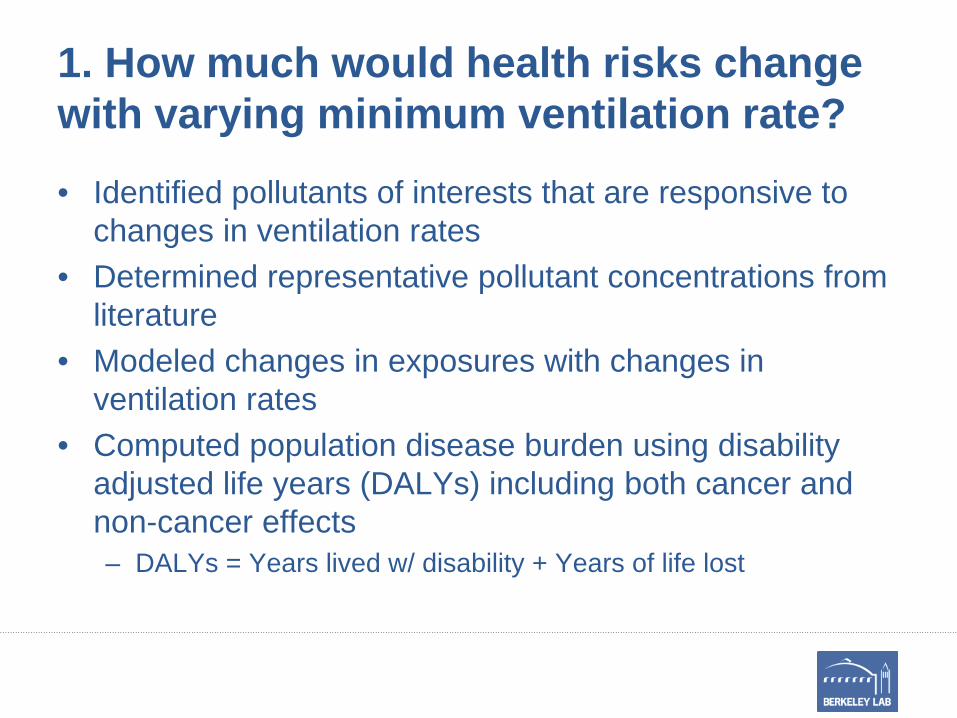
1. How much would health risks change with varying minimum ventilation rate?
• Identified pollutants of interests that are responsive to changes in ventilation rates
• Determined representative pollutant concentrations from literature
• Modeled changes in exposures with changes in ventilation rates
• Computed population disease burden using disability adjusted life years (DALYs) including both cancer and non-cancer effects– DALYs = Years lived w/ disability + Years of life lost
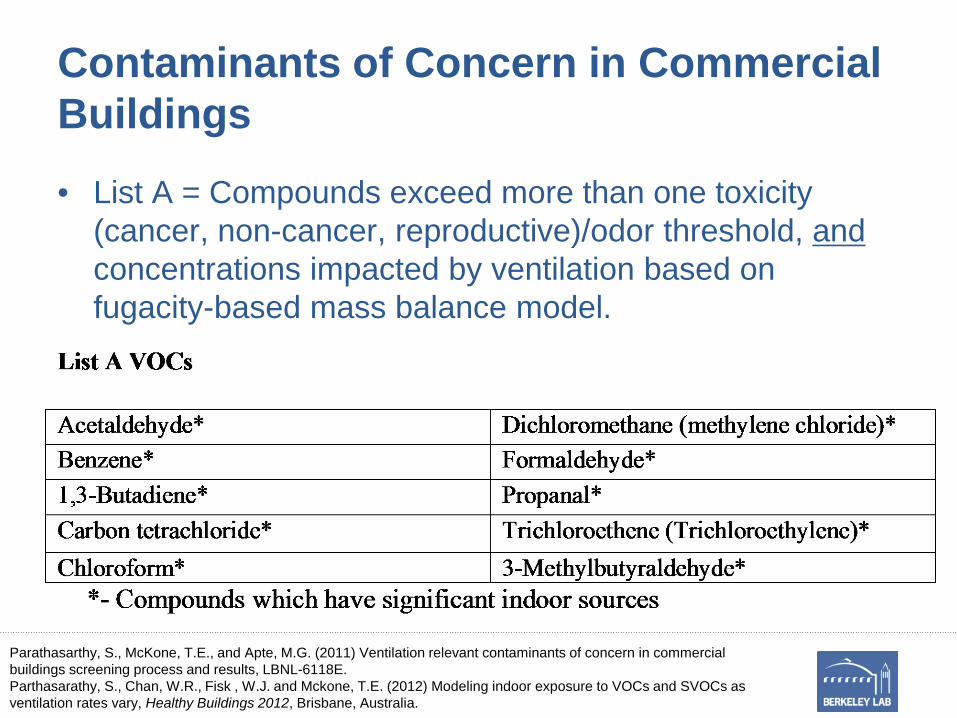
Contaminants of Concern in Commercial Buildings
• List A = Compounds exceed more than one toxicity (cancer, non-cancer, reproductive)/odor threshold, andconcentrations impacted by ventilation based on fugacity-based mass balance model.
Parathasarthy, S., McKone, T.E., and Apte, M.G. (2011) Ventilation relevant contaminants of concern in commercial buildings screening process and results, LBNL-6118E.Parthasarathy, S., Chan, W.R., Fisk , W.J. and Mckone, T.E. (2012) Modeling indoor exposure to VOCs and SVOCs as ventilation rates vary, Healthy Buildings 2012, Brisbane, Australia.
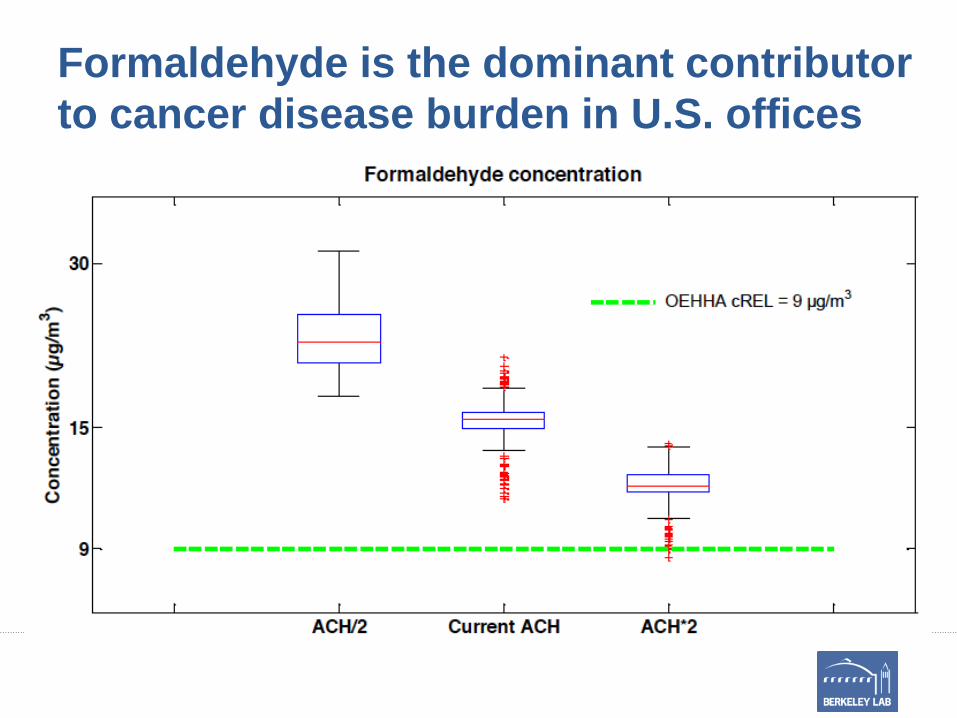
Formaldehyde is the dominant contributor to cancer disease burden in U.S. offices
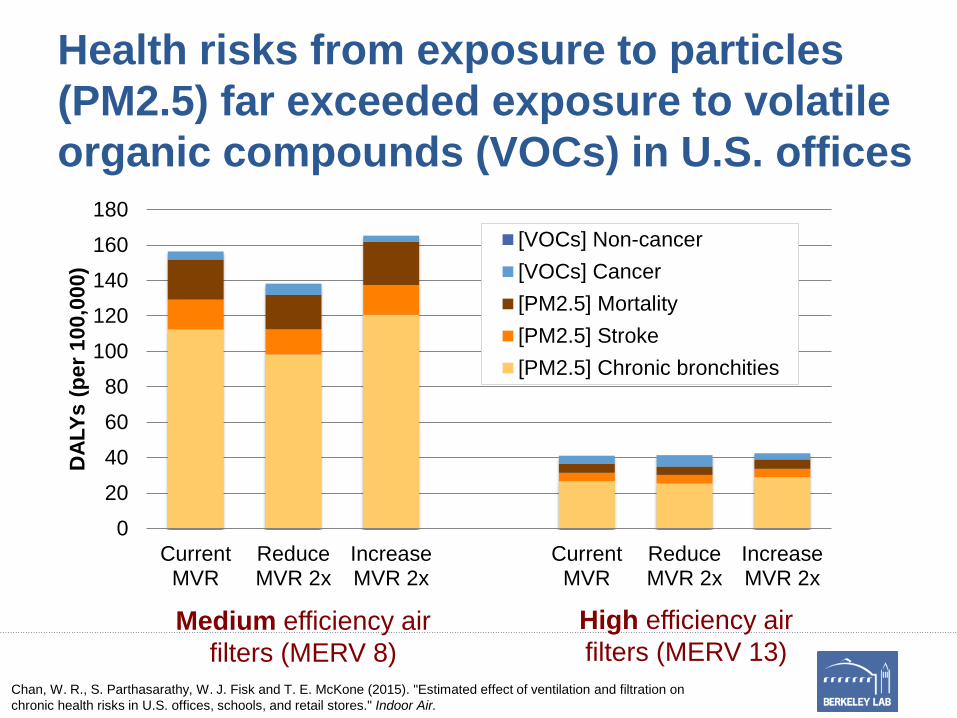
Health risks from exposure to particles (PM2.5) far exceeded exposure to volatile organic compounds (VOCs) in U.S. offices
0
20
40
60
80
100
120
140
160
180
CurrentMVR
ReduceMVR 2x
IncreaseMVR 2x
CurrentMVR
ReduceMVR 2x
IncreaseMVR 2x
DAL
Ys (p
er 1
00,0
00)
[VOCs] Non-cancer[VOCs] Cancer[PM2.5] Mortality[PM2.5] Stroke[PM2.5] Chronic bronchities
Medium efficiency air filters (MERV 8)
High efficiency air filters (MERV 13)
Chan, W. R., S. Parthasarathy, W. J. Fisk and T. E. McKone (2015). "Estimated effect of ventilation and filtration on chronic health risks in U.S. offices, schools, and retail stores." Indoor Air.
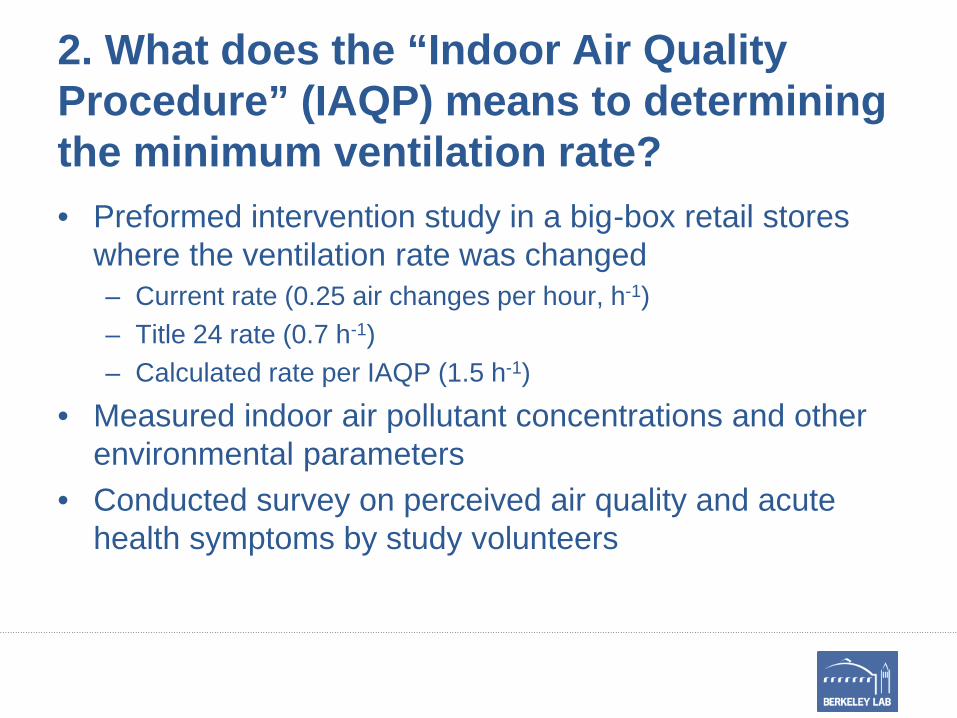
2. What does the “Indoor Air Quality Procedure” (IAQP) means to determining the minimum ventilation rate?• Preformed intervention study in a big-box retail stores
where the ventilation rate was changed– Current rate (0.25 air changes per hour, h-1)– Title 24 rate (0.7 h-1)– Calculated rate per IAQP (1.5 h-1)
• Measured indoor air pollutant concentrations and other environmental parameters
• Conducted survey on perceived air quality and acute health symptoms by study volunteers
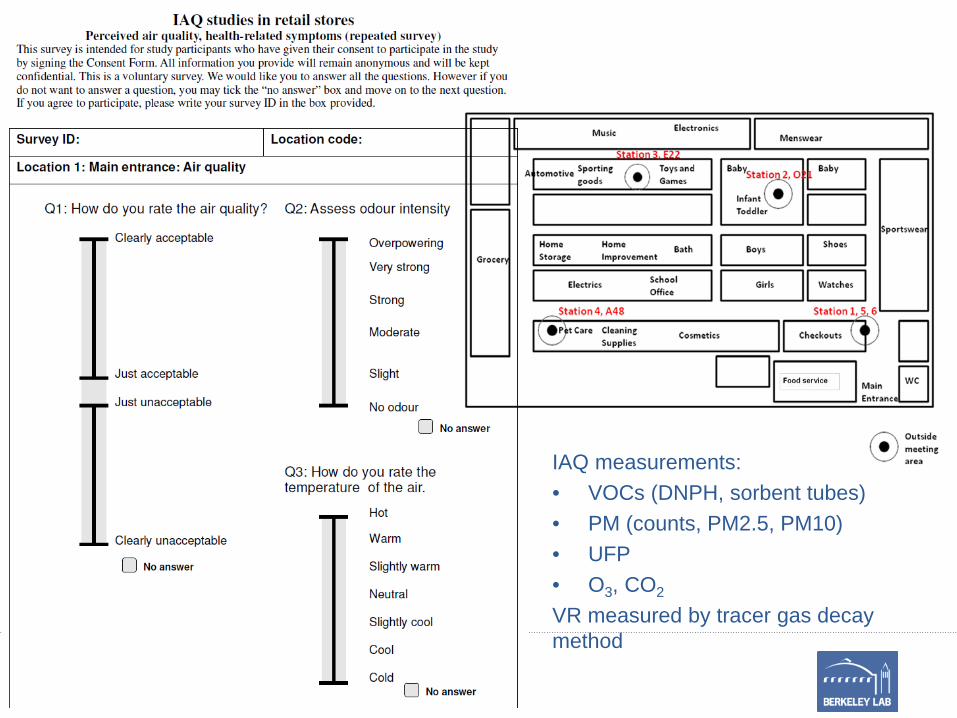
IAQ measurements:• VOCs (DNPH, sorbent tubes)• PM (counts, PM2.5, PM10)• UFP• O3, CO2
VR measured by tracer gas decay method
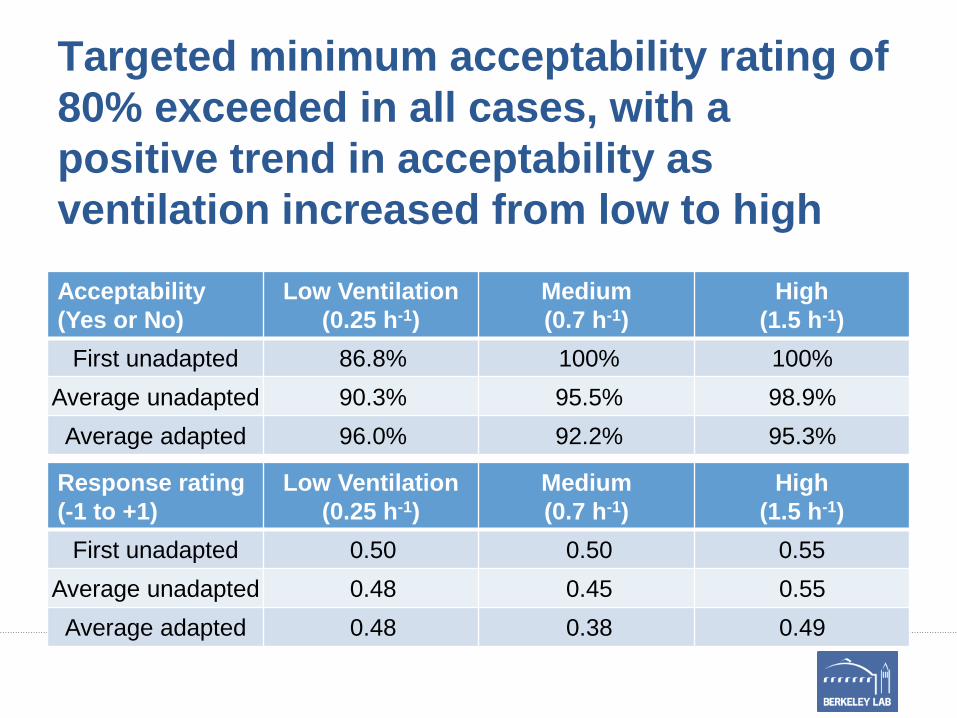
Targeted minimum acceptability rating of 80% exceeded in all cases, with a positive trend in acceptability as ventilation increased from low to high
Acceptability (Yes or No)
Low Ventilation(0.25 h-1)
Medium(0.7 h-1)
High(1.5 h-1)
First unadapted 86.8% 100% 100%Average unadapted 90.3% 95.5% 98.9%Average adapted 96.0% 92.2% 95.3%
Response rating(-1 to +1)
Low Ventilation(0.25 h-1)
Medium(0.7 h-1)
High(1.5 h-1)
First unadapted 0.50 0.50 0.55Average unadapted 0.48 0.45 0.55Average adapted 0.48 0.38 0.49
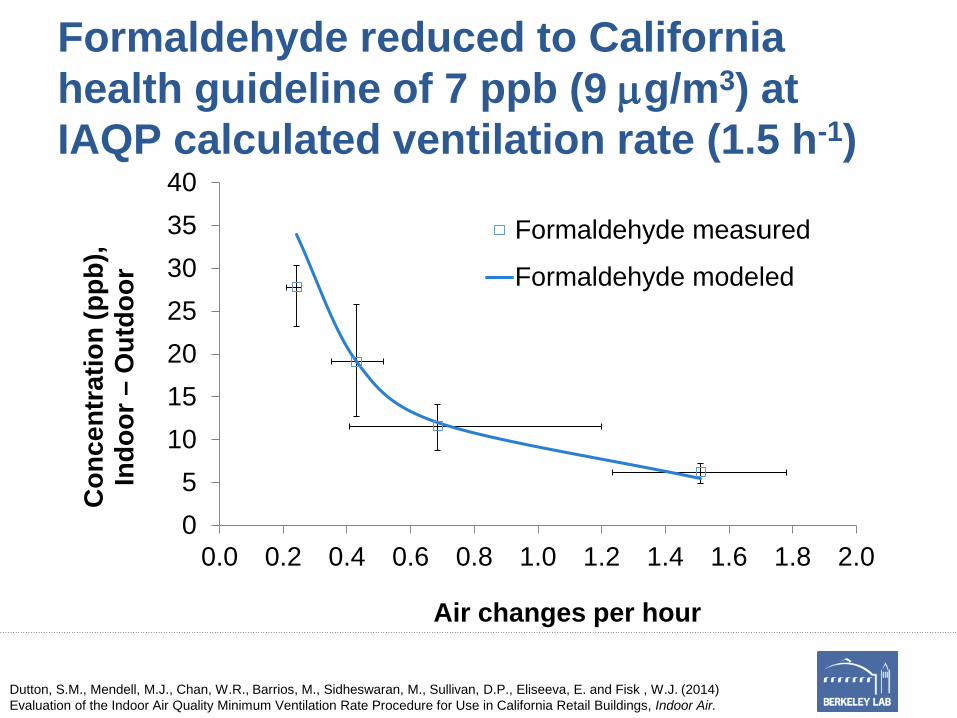
Formaldehyde reduced to California health guideline of 7 ppb (9 µg/m3) at IAQP calculated ventilation rate (1.5 h-1)
05
10152025303540
0.0 0.2 0.4 0.6 0.8 1.0 1.2 1.4 1.6 1.8 2.0
Con
cent
ratio
n (p
pb),
Indo
or –
Out
door
Air changes per hour
Formaldehyde measured
Formaldehyde modeled
Dutton, S.M., Mendell, M.J., Chan, W.R., Barrios, M., Sidheswaran, M., Sullivan, D.P., Eliseeva, E. and Fisk , W.J. (2014) Evaluation of the Indoor Air Quality Minimum Ventilation Rate Procedure for Use in California Retail Buildings, Indoor Air.
Buildings would need to greatly increase ventilation rate from current level following IAQP• IAQP would only save energy if coupled with
source control and air cleaning• Consider alternative ventilation strategies
– For example, an alterative ventilation strategy would allow minimum ventilation to be set lower if an effective air cleaning system is demonstrated to make up for the difference
• In addition, standard should specify a list of critical indoor air pollutants that must be considered
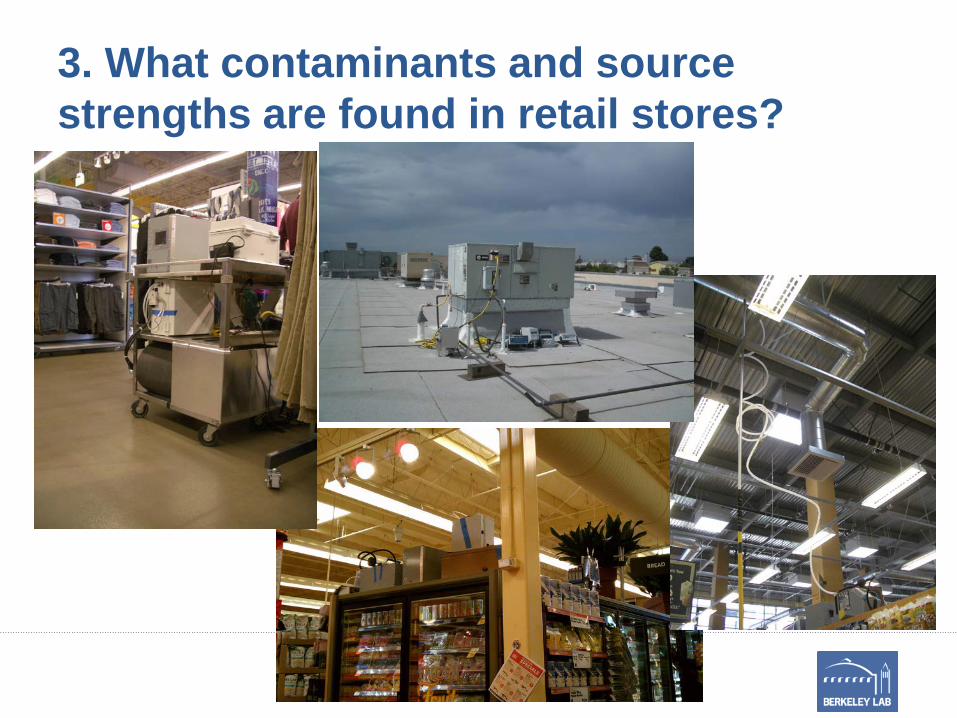
3. What contaminants and source strengths are found in retail stores?
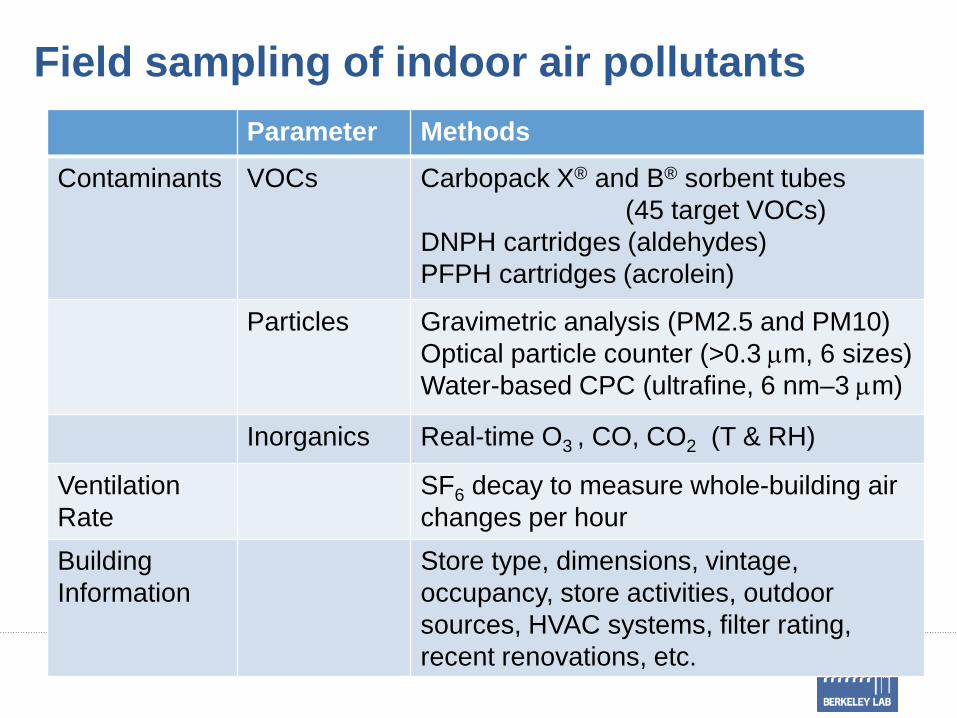
Field sampling of indoor air pollutantsParameter Methods
Contaminants VOCs Carbopack X® and B® sorbent tubes (45 target VOCs)
DNPH cartridges (aldehydes)PFPH cartridges (acrolein)
Particles Gravimetric analysis (PM2.5 and PM10)Optical particle counter (>0.3 µm, 6 sizes)Water-based CPC (ultrafine, 6 nm–3 µm)
Inorganics Real-time O3 , CO, CO2 (T & RH)
Ventilation Rate
SF6 decay to measure whole-building air changes per hour
Building Information
Store type, dimensions, vintage, occupancy, store activities, outdoor sources, HVAC systems, filter rating, recent renovations, etc.
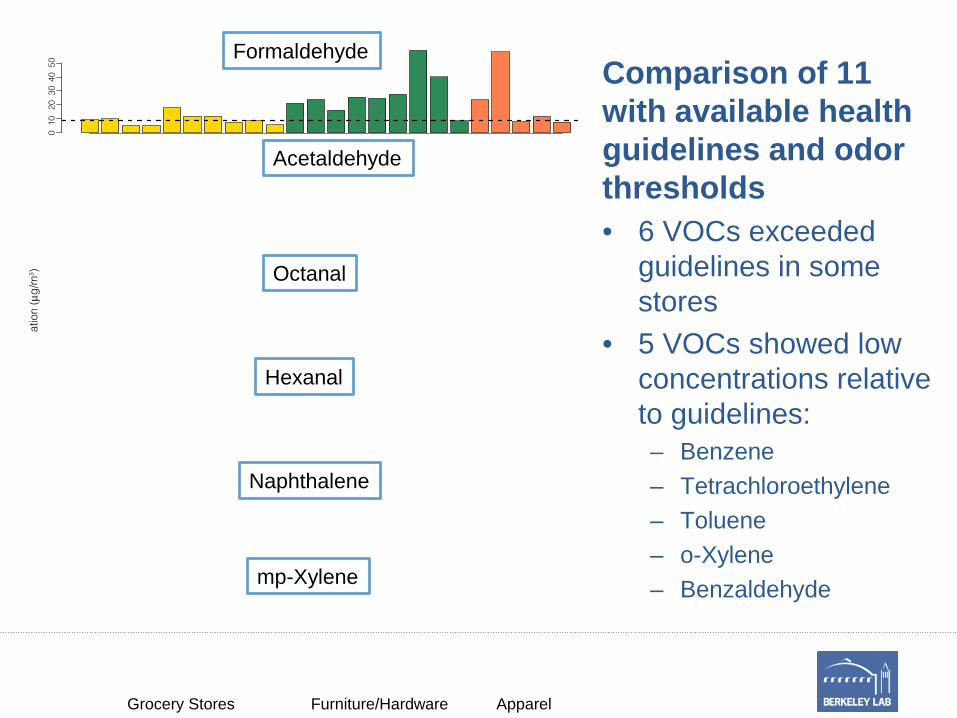
Comparison of 11 with available health guidelines and odor thresholds• 6 VOCs exceeded
guidelines in some stores
• 5 VOCs showed low concentrations relative to guidelines: – Benzene– Tetrachloroethylene– Toluene– o-Xylene– Benzaldehyde
Formaldehyde
Acetaldehyde
Octanal
Hexanal
Naphthalene
mp-Xylene
Grocery Stores Furniture/Hardware Apparel
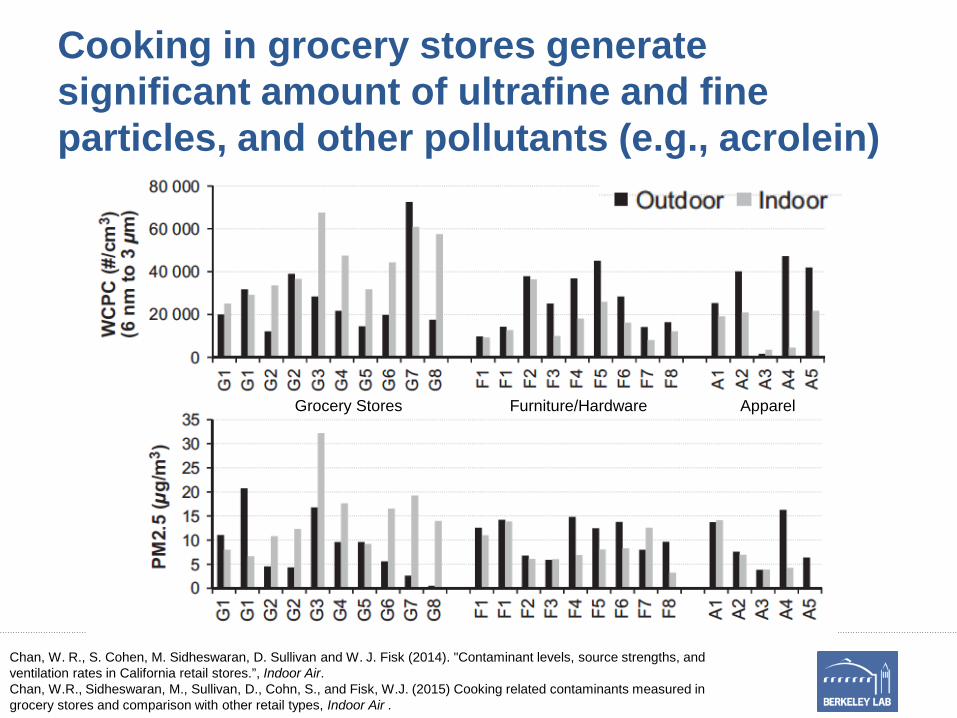
Cooking in grocery stores generate significant amount of ultrafine and fine particles, and other pollutants (e.g., acrolein)
Chan, W. R., S. Cohen, M. Sidheswaran, D. Sullivan and W. J. Fisk (2014). "Contaminant levels, source strengths, and ventilation rates in California retail stores.”, Indoor Air.Chan, W.R., Sidheswaran, M., Sullivan, D., Cohn, S., and Fisk, W.J. (2015) Cooking related contaminants measured in grocery stores and comparison with other retail types, Indoor Air .
Grocery Stores Furniture/Hardware Apparel
4. Does building ventilation impact occupant outcomes and decision making?
• Minimum ventilation rate is set based on both number of occupants (to dilute bioeffluents) and floor area (to dilute indoor pollutants emitted from materials and products)
• In a laboratory study, the per-person and per-floor area ventilation rate was independently varied
• Study subjects were surveyed on perceived air quality (PAQ), sick building syndrome (SBS) symptoms, and decision-making performance
• What matters: per-person ventilation rate, per-floor area ventilation rate, or both?
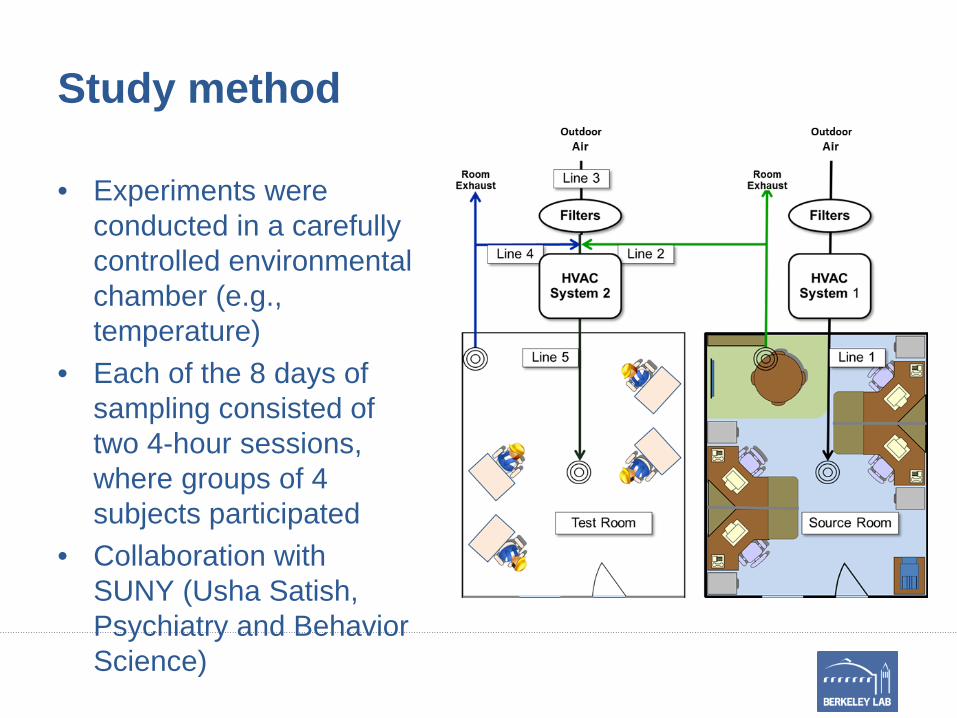
Study method
• Experiments were conducted in a carefully controlled environmental chamber (e.g., temperature)
• Each of the 8 days of sampling consisted of two 4-hour sessions, where groups of 4 subjects participated
• Collaboration with SUNY (Usha Satish, Psychiatry and Behavior Science)
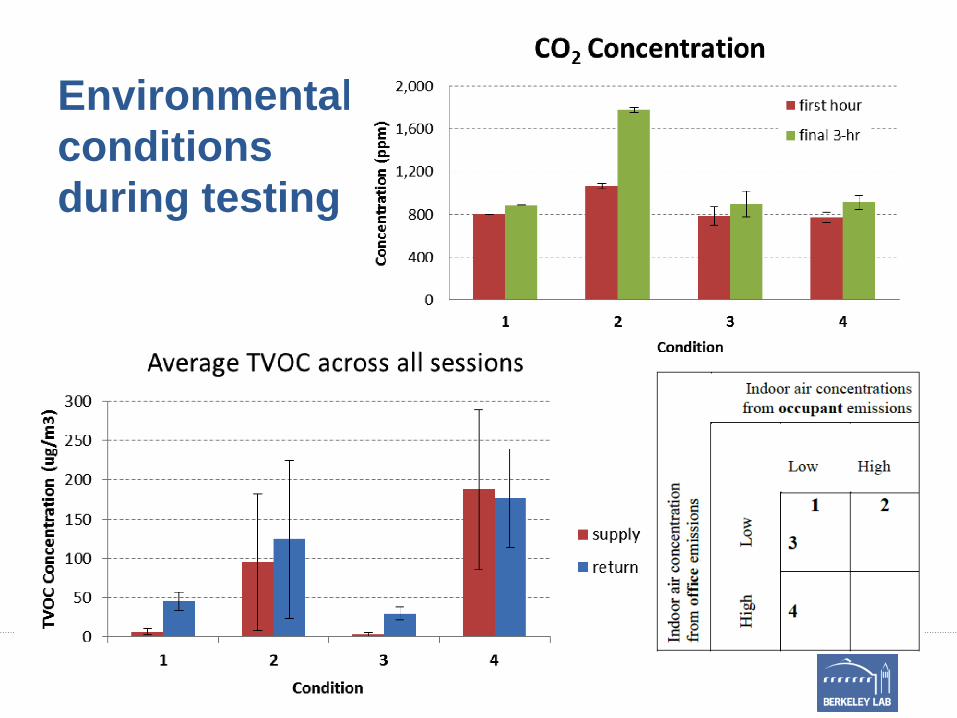
Environmental conditions during testing
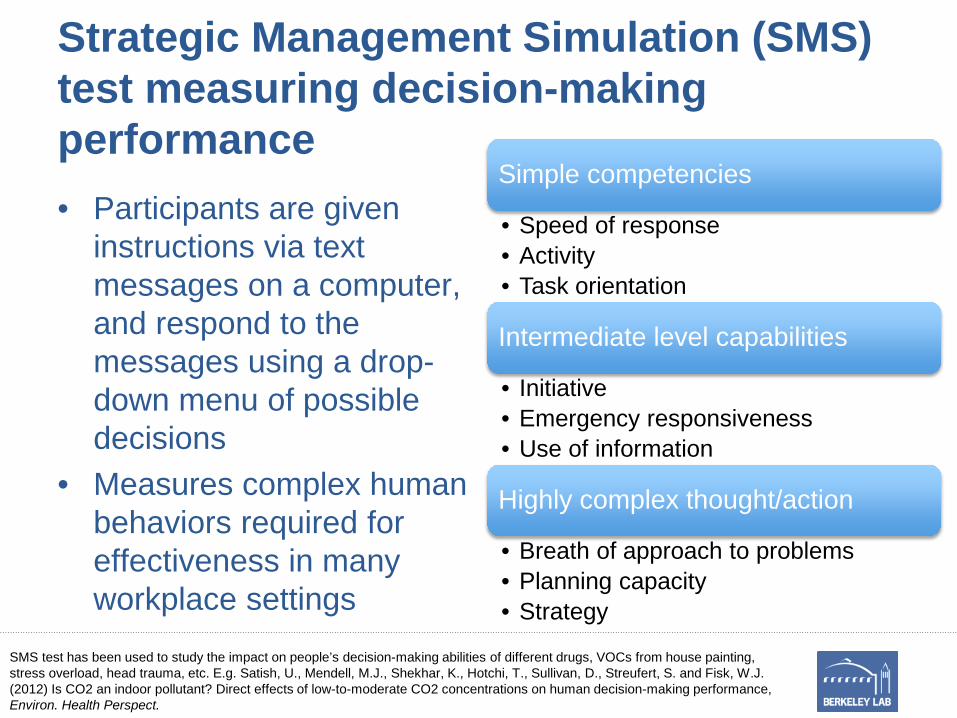
Strategic Management Simulation (SMS) test measuring decision-making performance• Participants are given
instructions via text messages on a computer, and respond to the messages using a drop-down menu of possible decisions
• Measures complex human behaviors required for effectiveness in many workplace settings
Simple competencies
• Speed of response• Activity• Task orientation
Intermediate level capabilities
• Initiative• Emergency responsiveness• Use of information
Highly complex thought/action
• Breath of approach to problems• Planning capacity• Strategy
SMS test has been used to study the impact on people’s decision-making abilities of different drugs, VOCs from house painting, stress overload, head trauma, etc. E.g. Satish, U., Mendell, M.J., Shekhar, K., Hotchi, T., Sullivan, D., Streufert, S. and Fisk, W.J. (2012) Is CO2 an indoor pollutant? Direct effects of low-to-moderate CO2 concentrations on human decision-making performance, Environ. Health Perspect.
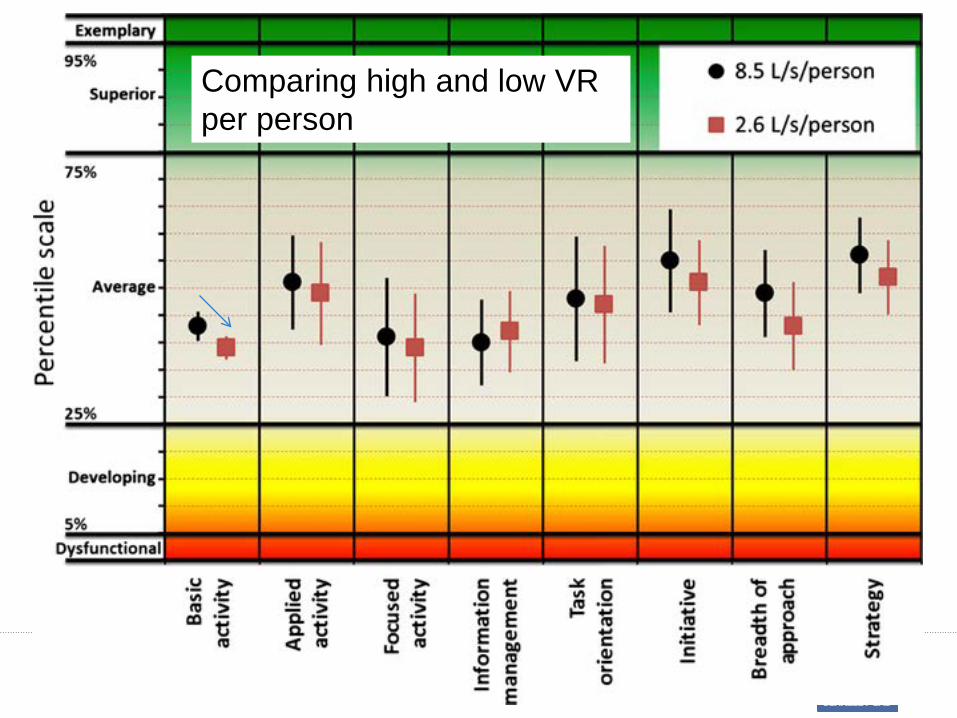
Comparing high and low VR per person
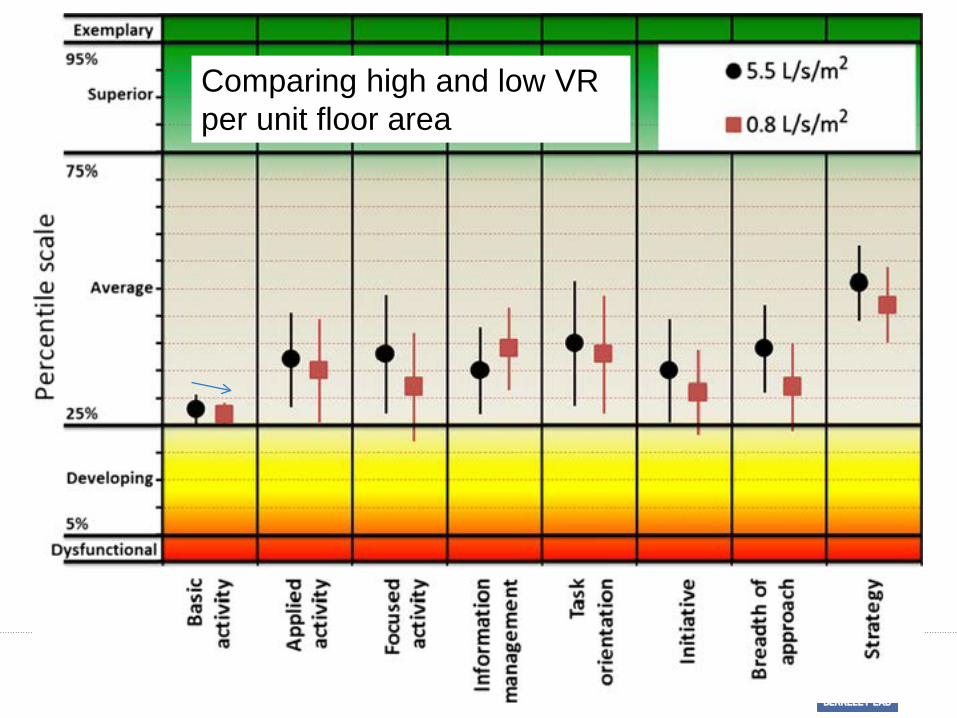
Comparing high and low VR per unit floor area
SMS tests showed highly statistically significant improvement in decision-making performance at higher ventilation• Data further implies that a unit change in per-
person ventilation rate has a larger impact on decision-making performance than a unit change in per-floor area ventilation rate
• Perceived air quality (PAQ) and sick building syndrome (SBS) symptom survey show little evidence of hypothesized effects, possibly due to the small size of the study
Maddalena, D., M. J. Mendell, E. Eliseeva, W. R. Chan, D. Sullivan, M. Russell, U. Satish and W. J. Fisk (2014). "Effects of ventilation rate per person and per floor area on perceived air quality, sick building symptoms, and decision making." Indoor Air.
5. Do buildings with lower ventilation rates have higher rates of illness absence?
• Monitored 16 office spaces from 9 buildings in California for one year
• CO2 concentrations measured in three location per space at 10-minute time intervals
• Occupants filled out online survey on perceived air quality, symptoms, respiratory illness, and illness absence every 3 months
• Analyze relationship between CO2, estimated ventilation rate, and illness absence in study spaces
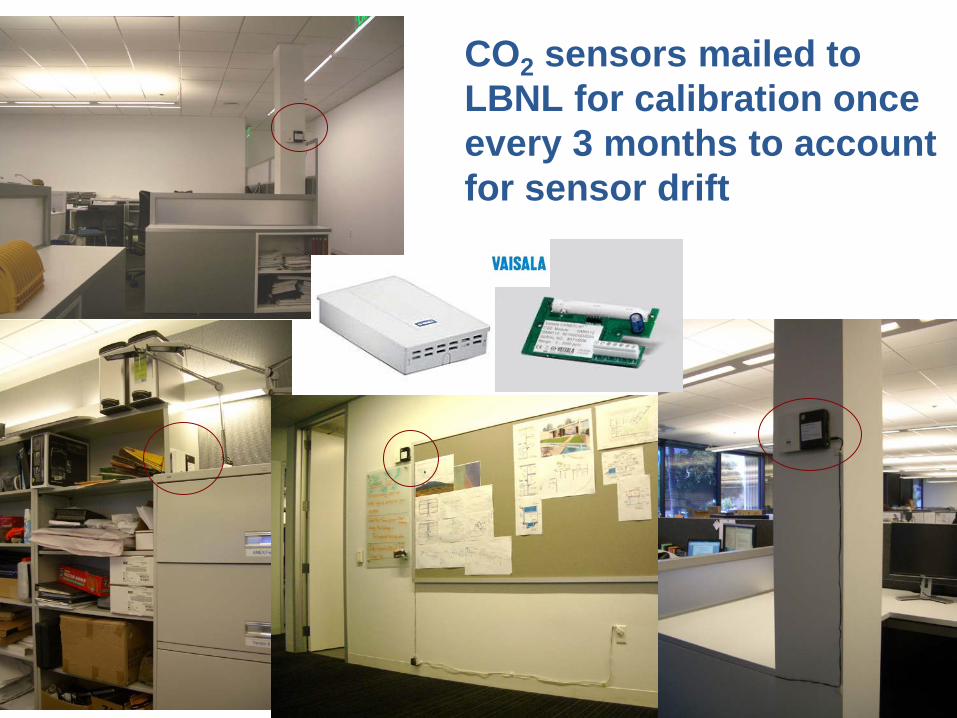
CO2 sensors mailed to LBNL for calibration once every 3 months to account for sensor drift
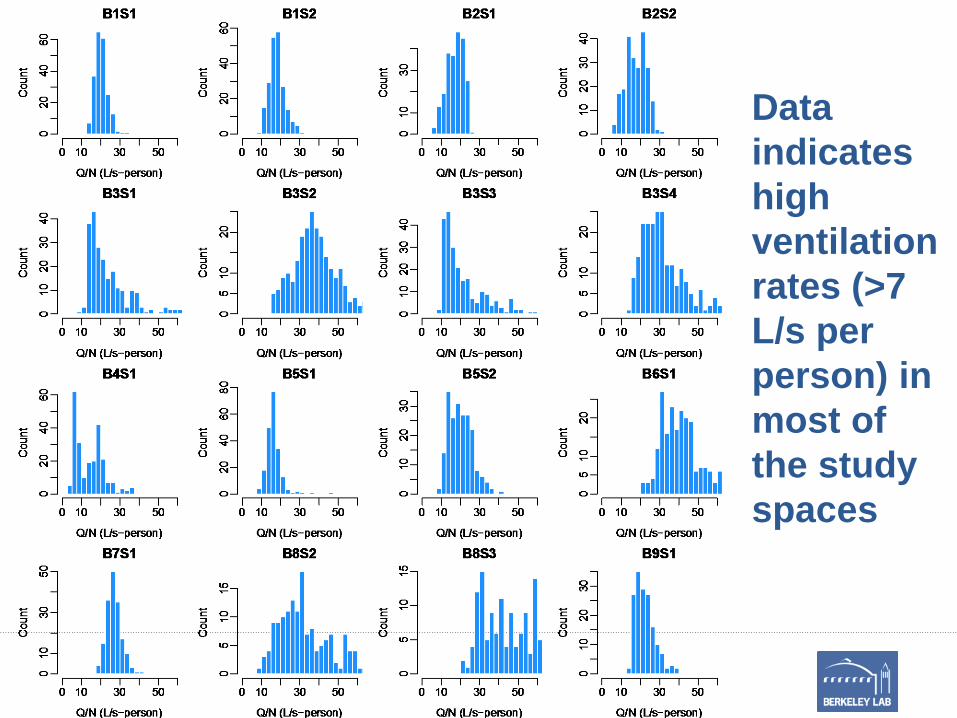
Data indicates high ventilation rates (>7 L/s per person) in most of the study spaces
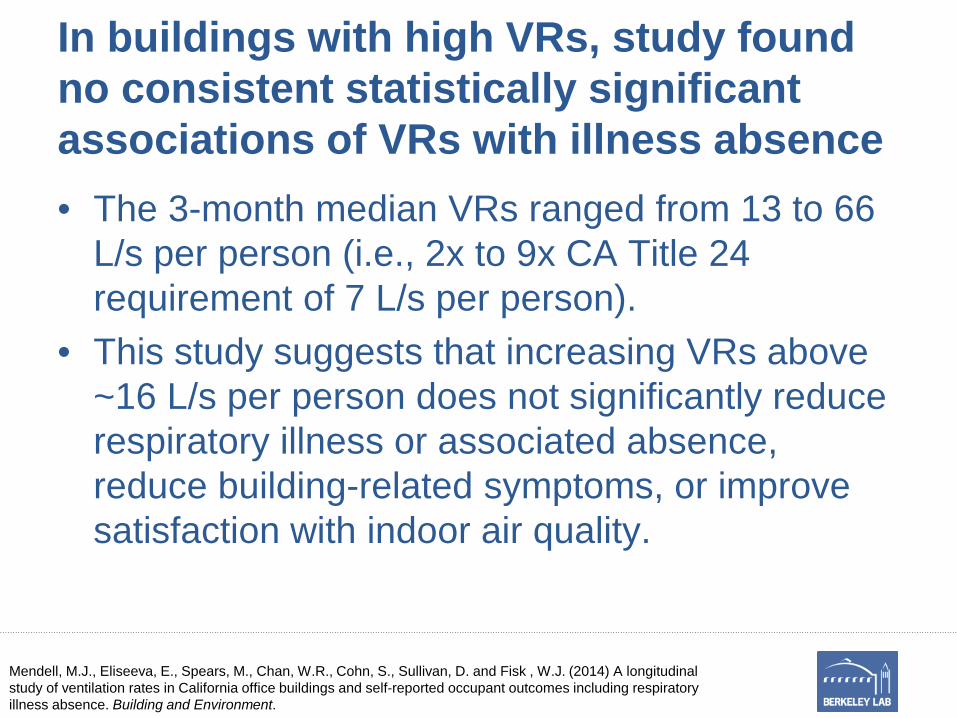
In buildings with high VRs, study found no consistent statistically significant associations of VRs with illness absence • The 3-month median VRs ranged from 13 to 66
L/s per person (i.e., 2x to 9x CA Title 24 requirement of 7 L/s per person).
• This study suggests that increasing VRs above ~16 L/s per person does not significantly reduce respiratory illness or associated absence, reduce building-related symptoms, or improve satisfaction with indoor air quality.
Mendell, M.J., Eliseeva, E., Spears, M., Chan, W.R., Cohn, S., Sullivan, D. and Fisk , W.J. (2014) A longitudinal study of ventilation rates in California office buildings and self-reported occupant outcomes including respiratory illness absence. Building and Environment.
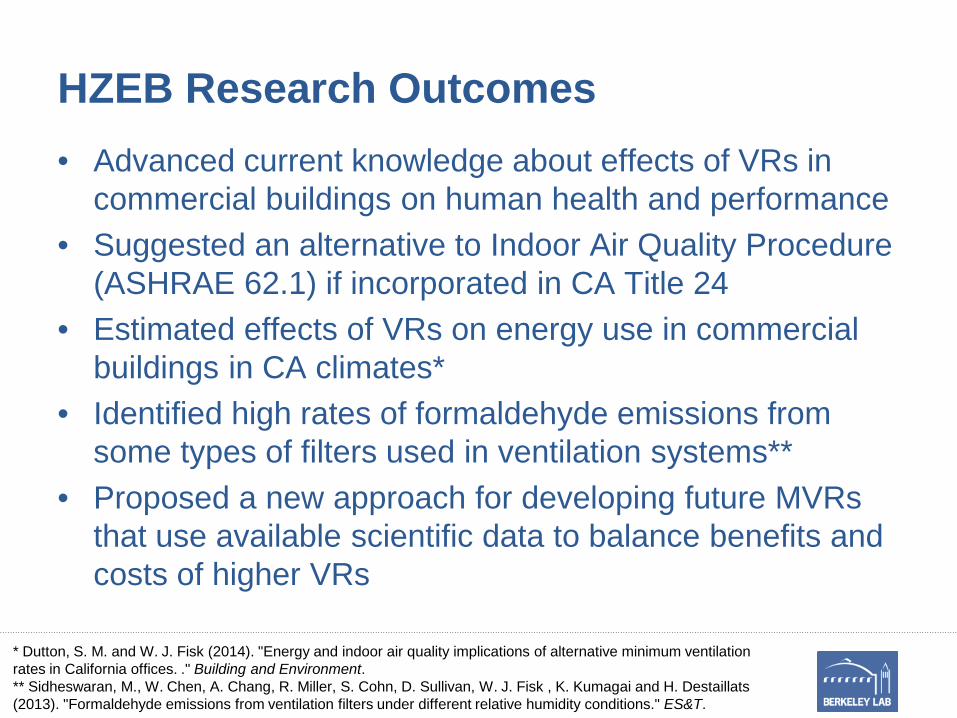
HZEB Research Outcomes• Advanced current knowledge about effects of VRs in
commercial buildings on human health and performance• Suggested an alternative to Indoor Air Quality Procedure
(ASHRAE 62.1) if incorporated in CA Title 24• Estimated effects of VRs on energy use in commercial
buildings in CA climates*• Identified high rates of formaldehyde emissions from
some types of filters used in ventilation systems**• Proposed a new approach for developing future MVRs
that use available scientific data to balance benefits and costs of higher VRs
* Dutton, S. M. and W. J. Fisk (2014). "Energy and indoor air quality implications of alternative minimum ventilation rates in California offices. ." Building and Environment.** Sidheswaran, M., W. Chen, A. Chang, R. Miller, S. Cohn, D. Sullivan, W. J. Fisk , K. Kumagai and H. Destaillats (2013). "Formaldehyde emissions from ventilation filters under different relative humidity conditions." ES&T.
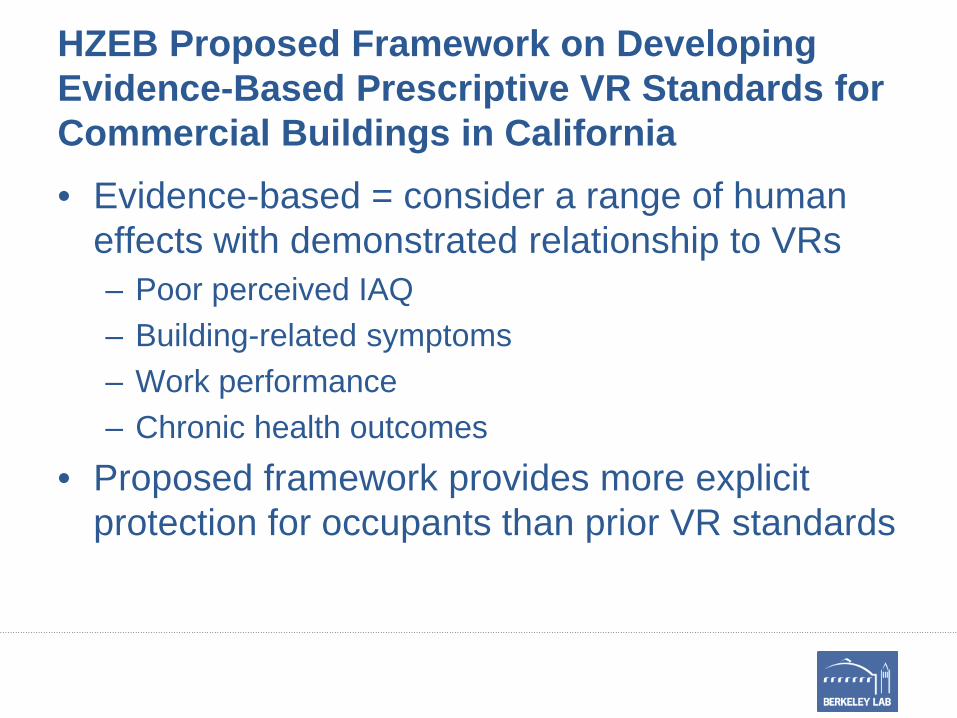
HZEB Proposed Framework on Developing Evidence-Based Prescriptive VR Standards for Commercial Buildings in California• Evidence-based = consider a range of human
effects with demonstrated relationship to VRs– Poor perceived IAQ– Building-related symptoms– Work performance– Chronic health outcomes
• Proposed framework provides more explicit protection for occupants than prior VR standards
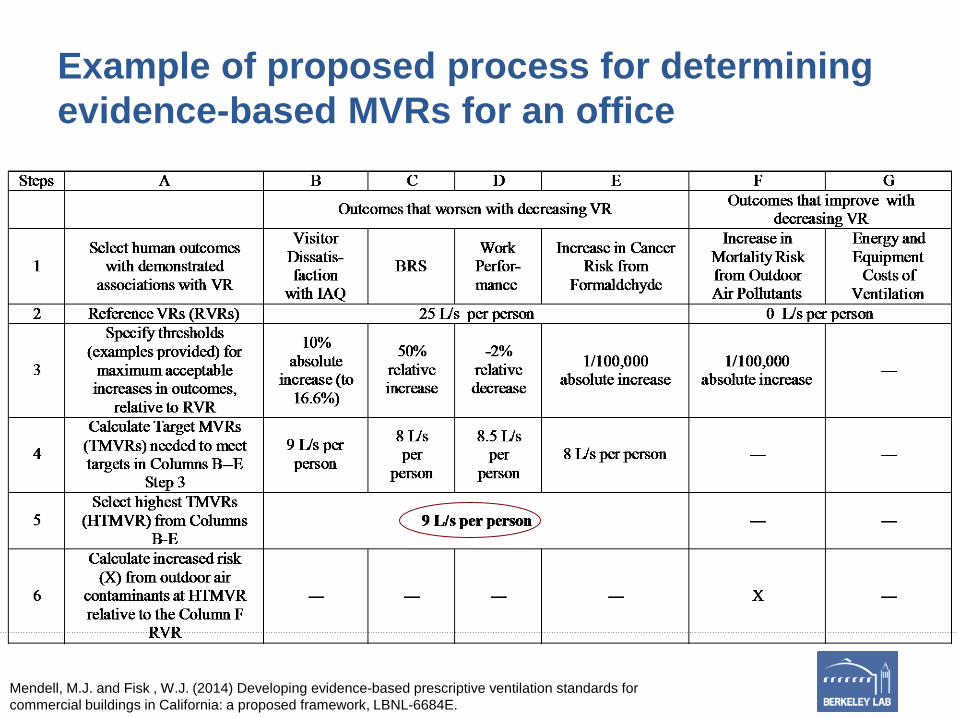
Example of proposed process for determining evidence-based MVRs for an office
Mendell, M.J. and Fisk , W.J. (2014) Developing evidence-based prescriptive ventilation standards for commercial buildings in California: a proposed framework, LBNL-6684E.
High Priority Research Needs to Address Effects of VRs on People
• Effects on cognitive performance of longer-term high exposures to elevated CO2 levels
• Effects of VRs on acute health outcomes in schools and daycare centers
• Effects of VRs on acute respiratory infections and absence rate
• MVR requirements per person and per unit floor area• Health and performance benefits of outdoor air
economizer controls• Development of performance-based MVR procedures
HZEB Final Report Fisk, William J., et al. 2015. Commercial Building Ventilation Effects on Indoor Air Quality, Human Health and Performance, and Building Energy Use and Implications for Future Ventilation Standards. California Energy Commission. Publication number: CEC-500-2016-048.
Wanyu R. Chan, Ph.D. [email protected] Scientist, Indoor Environment GroupEnergy Analysis and Environmental Impacts Division
February 1, 2017