collagen cross-linking as a determinant of bone quality
TRANSCRIPT
COLLAGEN CROSS-LINKING AS A DETERMINANT OF BONE QUALITY: THE IMPORTANCE OF CROSS-LINKING TO
MECHANICAL PROPERTIES AS EXPLORED BY CROSS-LINK INHIBITION AND EXERCISE
by
Erin Margaret Brontë McNerny
A dissertation submitted in partial fulfillment of the requirements for the degree of
Doctor of Philosophy (Biomedical Engineering)
in The University of Michigan 2014
Doctoral Committee: Professor David H. Kohn, Chair Professor Renny Franceschi
Emeritus Professor Steven A. Goldstein Professor Michael D. Morris
Professor James Simmer
Erin Margaret Brontë McNerny
All rights reserved
2014

ii
To Dan, my rock.

iii
ACKNOWLEDGEMENTS
My first thank you is to David Kohn. Throughout my tenure in his lab, his guidance,
difficult questions, and steady stream of devil’s advocacy worked to shape me into an
independent researcher capable of defining my ideas and defending them from nearly any
assault. I also want to thank my committee members, Renny Franceschi, Jim Simmer,
Mike Morris and Steve Goldstein, for their time, advice and support throughout this
work.
Thank you to all the members of the Kohn lab, past and present: Sid Bhandari, Michael
Friedman, Joe Gardinier, Shan Lee, Linh Lo, Sharon Miller, Harsha Ramaraju, Janani
Ramaswamy, Ram Rao, Mike Ron, Ricky Rossello, Nadder Sahar, Kyungsup Shin,
Robert Szczepankiewicz, Margaret Tantillo, Joey Wallace, and Nianli Zhang. They
showed me the ropes, helped with experiments, shared their ideas, commiserated with me
through the trials and tribulations of grad school, and, most importantly, gave me their
friendship.
I am indebted to Bo Gong for his expertise and effort completing the Raman
spectroscopy for this thesis. Yasuo Yamakoshi was very helpful when I was first learning
the basics of HPLC. Jaclynn Kreider was kind to help me troubleshoot the odd
mechanical behavior of young Bl6 bones, and Jeff Megnack took time to train me in µCT
just weeks before own PhD defense. I can only now understand just how generous he
was with his time. Michelle Lynch expanded my µCT knowledge, and I am thankful for
her expertise, our shared efforts in figuring out the quirks of Scanco, and many hours of
conversation.
Thank you to my parents, Myrna and Chris Gatenby, for always helping me to succeed in
my educational pursuits. I am where I am today thanks to their efforts to give me the best
opportunities and their constant encouragement to aim high in everything I do.

iv
During my time at Michigan I was fortunate to make lifelong friends who, even separated
by thousands of miles, will always remain close. Thank you for the many dinner dates,
home brews, shared bottles of wine, inside jokes, baked goods, shoulders to cry on,
dancing like nobody is watching, and for always being there when I needed you the most.
Finally, I must thank my husband, Dan. Our marriage is the greatest thing I will take with
me from Ann Arbor. His unshakeable belief in me sustained me through the lowest of
lows, and I am a stronger person with him by my side.

v
TABLE OF CONTENTS
DEDICATION .................................................................................................................... ii
ACKNOWLEDGEMENTS ............................................................................................... iii
LIST OF FIGURES .......................................................................................................... vii
LIST OF TABLES ........................................................................................................... viii
LIST OF APPENDICES .................................................................................................... ix
ABSTRACT ........................................................................................................................ x
CHAPTER ONE: Introduction ........................................................................................... 1
Collagen Structure and Post-Translational Modification ............................................ 1
Collagen Cross-Links .................................................................................................. 3
Cross-Links and Mechanical Properties ...................................................................... 4
Control of Cross-Linking ............................................................................................. 5
Aims & Hypotheses ..................................................................................................... 7
References .................................................................................................................. 11
CHAPTER TWO: Bone Toughness and Strength Correlate with Collagen Cross-link Maturity in a Dose-Controlled Lathyrism Mouse Model ..................................... 14
Abstract ...................................................................................................................... 14
Introduction ................................................................................................................ 15
Materials and Methods .............................................................................................. 16
Results ........................................................................................................................ 21
Discussion .................................................................................................................. 24
Acknowledgments ..................................................................................................... 29
vi
Supplement ................................................................................................................ 40
References .................................................................................................................. 43
CHAPTER THREE: Interactive Effects of Cross-link Inhibition and Exercise on Growing Bone .............................................................................................................. 47
Introduction ................................................................................................................ 47
Methods ..................................................................................................................... 49
Results ........................................................................................................................ 52
Discussion .................................................................................................................. 56
References .................................................................................................................. 70
CHAPTER FOUR: Conclusions and Future Work .......................................................... 75
Relationship of Cross-links to Bone Mechanical Properties ..................................... 75
Cross-Link Changes in Response to Exercise ........................................................... 77
Direct and Indirect Measures of Collagen Cross-linking .......................................... 78
Future Work ............................................................................................................... 79
References .................................................................................................................. 82
APPENDICES .................................................................................................................. 83
vii
LIST OF FIGURES
Figure 2.1 – Group distributions of TMD measured at the standard site 30
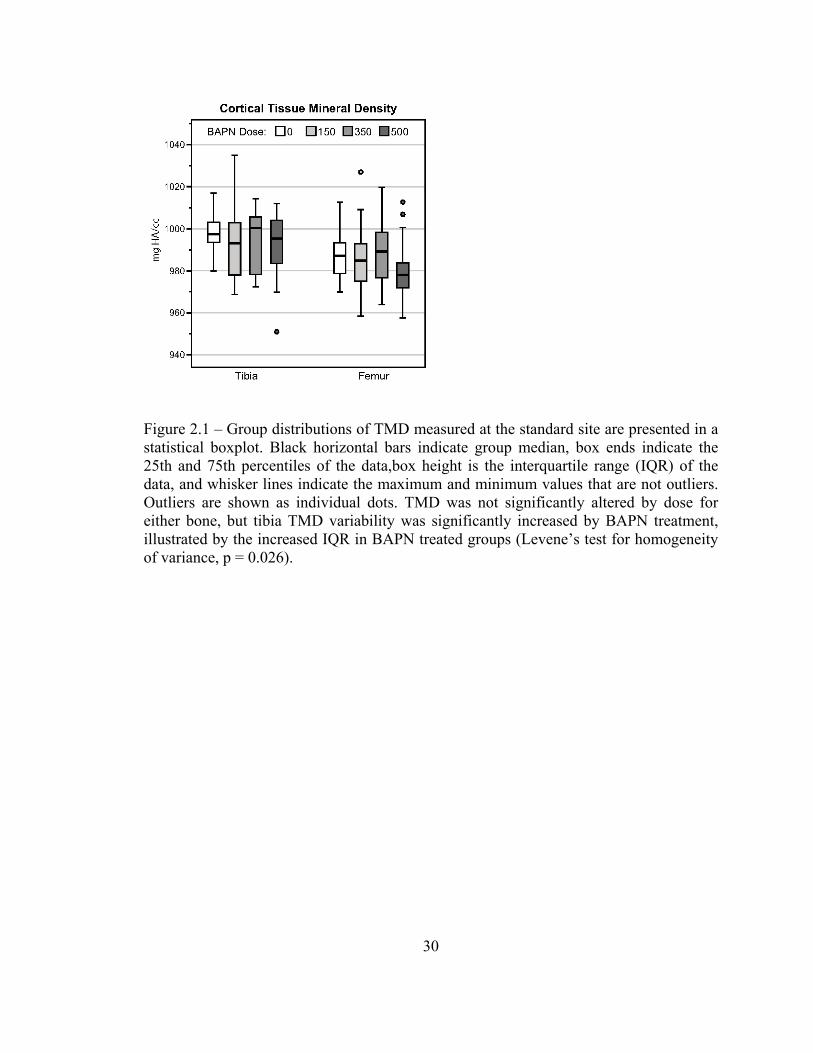
Figure 2.2 – Collagen cross-link quantification 31
Figure 2.3 – Crosslink ratios 32
Figure 2.4 – KC fracture toughness of the femur 33
Figure 2.5 – Whole bone and tissue level mechanical properties 34
Figure 2.6 – Fluorescent images of tibia cross sections show calcein labels 35
Figure 2.7 – Raman spectroscopy measures 36
Figure 2.S1 – Amide I sub-band intensities measured for cell culture 41
Figure 2.S2 – Amide I sub-band intensities measured for embedded bone 42
Figure 3.1 – Traces of tibia cortical geometry 62
Figure 3.2 – Tissue mineral density 63
Figure 3.3 – Collagen enzymatic cross-link content 64
Figure 3.4 – Cross-link profile ratios 65
Figure 3.5 – Whole bone mechanical properties 66
Figure 3.6 – Tissue level mechanical properties 67
Figure 3.7 – Linear regression of cross-links as predictors of modulus 69
viii
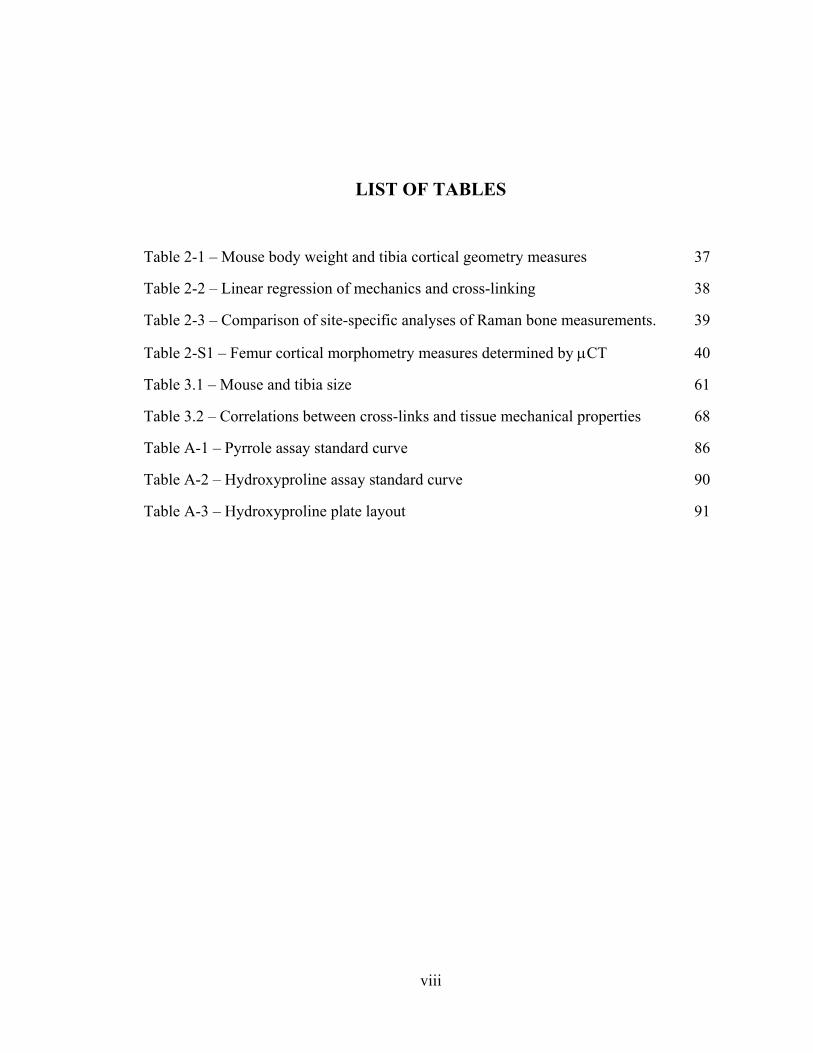
LIST OF TABLES
Table 2-1 – Mouse body weight and tibia cortical geometry measures 37
Table 2-2 – Linear regression of mechanics and cross-linking 38
Table 2-3 – Comparison of site-specific analyses of Raman bone measurements. 39
Table 2-S1 – Femur cortical morphometry measures determined by µCT 40
Table 3.1 – Mouse and tibia size 61
Table 3.2 – Correlations between cross-links and tissue mechanical properties 68
Table A-1 – Pyrrole assay standard curve 86
Table A-2 – Hydroxyproline assay standard curve 90
Table A-3 – Hydroxyproline plate layout 91

ix
LIST OF APPENDICES
APPENDIX
A: Protocols for the Quantification of Collagen Cross-links ............................................ 83
B: Protocol for the Analysis and Quantification of Cortical Geometry from MicroComputed Tomography scans ............................................................................ 95
x
ABSTRACT
Bone mineral density (BMD) and mass are primary clinical measures of fracture risk but
do not fully describe bone quality. The organic matrix also contributes to bone
mechanical properties and is stabilized by enzymatically controlled collagen cross-links.
Osteoporosis, aging, increased fracture incidence, and diseases including osteogenesis
imperfecta are all associated with alterations in bone collagen cross-link profile. Collagen
cross-links are important to bone mechanical properties, but the details of how cross-link
quantity, type and maturity affect bone quality are not well understood. Bone quality, in
addition to quantity, is altered in response to exercise; I hypothesized that modulation of
cross-linking is a part of this adaptation. A new animal model of lathyrism was developed
to explore the importance of cross-link profile to bone strength and fracture toughness,
collagen cross-link alteration in response to exercise, and the ability of exercise to
prevent detrimental effects of cross-link inhibition on bone mechanical properties.
Inhibition of cross-linking by beta-aminopropionitrile (BAPN) treatment in growing mice
dose-dependently reduced bone fracture toughness, strength, and pyridinoline cross-link
content. Relative cross-link maturity significantly predicted fracture toughness, whereas
mature lysylpyridinoline (LP) cross-links were the most significant predictor of tissue
strength.
Three weeks of treadmill running caused a shift from pyrrole to pyridinoline cross-links
and increased BMD but did not alter tissue-level mechanical properties in growing mice.
Concurrent exercise counteracted the effects of BAPN treatment, increasing mature
cross-link content and returning BAPN-reduced modulus and BAPN-increased yield
strain to control levels. Pyrrole, LP and hydroxylysinorleucine cross-links were
significant predictors of bone rigidity, with pyrrole content explaining 22% of the
variability in modulus.
xi
Understanding which cross-link changes are significant to bone fracture resistance is
critical for developing and evaluating therapies for fracture prevention and disease
management. This work suggests greater importance of mature collagen cross-links,
especially pyrrole and LP, to bone quality. Pyrrole and LP form preferentially at the
collagen N-terminus, suggesting a potential importance of mature cross-linking at this
site. Importantly, the grand total of enzymatic cross-links, the abundant immature cross-
links, and, counter to common doctrine, BMD were not good predictors of mechanical
properties among bones of the same age.
1
CHAPTER ONE:
Introduction
The ability of bone to perform its mechanical function and resist fracture is dependent on
both the quantity and the quality of the tissue. Bone density (BMD) has long been a
primary clinical measure of bone health and fracture risk. Though mineral density has its
place in prediction of fracture, it does not provide a complete explanation of bone quality.
The organic matrix, with 85% of its protein content being type I collagen, also
contributes to bone’s mechanical properties and is widely accepted to control post-yield
behavior. Furthermore, changes in bone mineral density may be reflective of underlying
changes in the organic matrix. One factor affecting the mechanical properties of the
collagen matrix that also influences whole bone properties is collagen cross-linking, the
focus of this dissertation. Without cross-linking, the collagen fibrils would only be held
together by non-covalent bonds, giving them little to no resistance to tensile forces
beyond those imparted by the presence of mineral. Less understood, however, is how
cross-link quantity, type, and maturation affect bone and to what mechanical and material
effect.
COLLAGEN STRUCTURE AND POST-TRANSLATIONAL MODIFICATION
Collagen is the most abundant protein in vertebrates and consists of a family of
extracellular proteins characterized by repeating peptide (Glycine-X-Y) sequences and a
rope-like helical structure. The X and Y can be any residues, but proline and
hydroxyproline occur most frequently. The most abundant collagen in humans, genetic
type I, is a heterotrimer with two identical α-1(I) peptide chains and one α-2(I) chain.

2
These collagen peptide chains are synthesized with carboxy- and aminoterminal
propeptides that assist in the formation of the triple helix, called procollagen at this stage.
After a procollagen molecule is secreted from the cell, peptidases cleave off the terminal
propeptides to leave tropocollagen, a single collagen molecule. In the case of type I
collagen, tropocollagens self-assemble outside the cell in a quarter-staggered gap pattern
to form collagen fibrils that are then stabilized by intermolecular cross-linking.
The characteristics of collagen are in part controlled by post-translational modifications
(PTMs). These PTMs include hydroxylation, glycosylation, and cross-linking. Collagen
protein contains the majority of hydroxyproline found in the body, and the amino acid is
derived from proline as a PTM by the action of prolyl hydroxylase. The sequence
specificity of the enzyme limits its activity to specific prolines along the peptide chain,
with no activity affecting free proline. The exclusivity of proline hydroxylation to
collagen, particularly bone, allows it to be used as a quantitative measure of total collagen
in a sample.
Like proline, lysine residues of collagen are also hydroxylated under enzymatic control
but by a separate enzyme: lysyl hydroxylase. Three isoforms of lysyl hydroxylase,
expressed from closely related genes and referred to as LH 1-3, are identified in mice,
rats and humans. LH1-LH3 are expressed from PLOD1-PLOD3 in humans. LH1
preferentially acts on helical lysines, while LH2 (also found as a splice variant, LH2b) is
specific for telopeptide lysine.(1) This specificity controls cross-link profile, discussed in
the next section. LH3 has helical lysyl hydroxylation activity, but in osteoblastic cells it
primarily functions as a hydroxylysine galactosyltransferase and as a
galactosylhydroxylsyine-glucosyltransferase. (2) Mutations of PLOD1 and PLOD2 have
been linked to human genetic diseases, Bruck and Ehlers-Danlos syndromes respectively,
both of which demonstrate bone pathology.(3) LH spatial/site specificity is believed to
contribute to tissue-specific patterns of lysine hydroxylation, thereby controlling tissue-
specific patterns of cross-linking.(4) Additionally, lysine hydroxylation (and its impact on
cross-link profile) may provide a control mechanism for matrix mineralization, thereby
affecting bone formation and function. Bone marrow stromal cells show a 6-fold increase
3
in expression of LH2 at the onset of mineralization, correlating with increased telopeptide
lysyl hydroxylation and increased numbers of hydroxylysine-derived cross-links. For
comparison, minimal LH2 expression is found in non-mineralizing normal skin fibroblast
cultures.(5)
Lysyl oxidase (LOX) is a copper enzyme responsible for PTM of collagen, but unlike the
hydroxylases, LOX activity takes place extracellularly. The enzyme selectively
deaminates telopeptide lysines and hydroxylysines of fibrillar aggregated collagen to
form reactive lysyl aldehydes capable of forming intra- and intermolecular cross-links as
described below.(4)
COLLAGEN CROSS-LINKS
Collagen cross-links are covalent linkages formed at specific telopeptide and helical
lysine or hydroxylysine residues on collagen chains. Before a cross-link can form, a
telopeptide lysine or hydroxylysine residue must undergo oxidation by the enzyme lysyl
oxidase, leaving behind a lysyl or hydroxlysyl aldehyde (also called an allysine).
Assuming proper juxtaposition exists between this allysine and a lysyl or hydroxylysyl
residue on a neighboring collagen chain, a divalent (immature/reducible) cross-link can
form spontaneously. The specific chemistry of the cross-link formed is dependent on the
location and hydroxylation of lysine residues.(6,7) Divalent cross-links mature to trivalent
(mature/irreducible) forms by what is thought to also be a spontaneous process. The
chemistry of the trivalent cross-links is dependent on the divalent cross-link chemistry,
and, by extension, the original lysyl hydroxylation of the collagen. With tissue aging, the
number of mature cross-links is expected to increase by pulling from the pool of existing
immature cross-links. Bone maintains high levels of immature cross-links, even in
mature tissues, presumably because mineralization interferes with the process.(8)
The specific profile of enzymatic cross-linking is not collagen specific but tissue specific,
implying that collagen cross-linking may play a role in functional adaptation by
providing a means other than protein composition for regulating collagenous tissue
4
properties. For example, both bone and dentin display high fractions of immature cross-
links compared to non-mineralizing collagen tissues such as skin or tendon; the
mature:immature cross-link ratio is low. Skin and corneal collagen are primarily cross-
linked by the lysine-aldehyde pathway, while skeletal collagen tissues, including bone,
ligament and tendon, are predominantly cross-linked by the hydroxylysine-aldehyde
pathway(4). Specificity within a single tissue is also observed; dentin has fewer cross-
links and lower levels of lysine hydroxylation in the tooth crown compared to the root(9),
and cross-link profile correlates with trabecular structure.(10) Thus there are similarities
in cross-link profile between tissues with similar functions and properties, suggesting a
relationship between function and cross-linking.
In addition to the enzymatic cross-links, an additional class of cross-links known as
advanced glycation endproducts, or AGEs, are formed by Maillard reactions. The most
frequently reported AGE is the easily quantified (fluorescent) pentosidine cross-link.
Glycation cross-links are less specifically controlled than enzymatic cross-links both in
placement and number. Pentosidine concentration increases with bone tissue age and is
thought to be a contributing factor in the reduction of bone mechanical strength with age.
Diabetics, who have increased serum and tissue glucose levels, typically have increased
quantities of pentosidine cross-links which correlate with bone fragility.(11)
CROSS-LINKS AND MECHANICAL PROPERTIES
Alterations in bone collagen cross-linking type and quantity are commonly observed both
in genetic and developmental disorders, such as osteogenesis imperfecta, and acquired
diseases associated with diet, aging or adaptation, such as vitamin-D or copper
deficiency, osteoporosis and disuse osteopenia. Importantly, impaired collagen cross-
linking is associated with a loss of whole bone and tissue strength, signifying that cross-
linking deficiencies may contribute to the fracture risk prevalent in these and other bone
pathologies. This concept is supported by increasing numbers of reports showing
correlations between cross-link profile and fracture incidence in humans.(12–16) Computer

5
modeling has predicted significant importance of collagen cross-links to the mechanical
behavior of both mineralized(17,18) and un-mineralized(19) collagens. Additional impact of
cross-links on mechanical properties may proceed indirectly through effects on
mineralization; for example, cross-link inhibition in rats is detrimental to the
mineralization rate of new bone and suspected to lower the maximum mineral deposition
achieved.(20)
Many studies have considered the possible role of cross-linking in mechanical properties;
a review of the literature in search for such data finds many reports characterizing and
relating a subset of cross-links to bone mechanical properties.(13,21–27) Of those that do
consider the full spectrum of cross-links and mineralization, some use fracture incidence
as the metric representing bone mechanics(16) and others use a Raman/FTIR metric
related to a ratio of mature to immature cross-links, thus limiting conclusions that can be
made concerning specific cross-link changes.(12,28,29) In summary, although much of the
existing literature gives support for a significant role of cross-linking in bone mechanics,
it is difficult to synthesize the data into a global picture given the variations in how and
what data are obtained.
A demonstration of collagen cross-linking’s contribution to bone mechanical properties is
observed in osteolathyrism, a condition pursuant to the ingestion of significant levels of
β-aminopropionitrile (BAPN), typically from Lathyrus odoratus (sweet pea) seeds.
Lathyritic animals suffer from weak and deformed bones, resulting in gait abnormalities
and eventual death. BAPN covalently binds and inhibits lysyl oxidase, the enzyme
responsible for catalyzing the limiting step in the formation of enzymatic collagen cross-
links. Inhibition of cross-linking by treatment with BAPN is associated with losses of
both stiffness and strength in the long bones of rats.(22,30)
CONTROL OF CROSS-LINKING
Despite our understanding of how the activity of lysyl oxidase and lysyl hydroxylase
affect cross-link production, we do not understand at the tissue level how and what
6
factors influence the creation of a certain cross-link profile. One possible mediator is
hypoxia-induced transcription factor (HIF-1). LH1 and LH2 expression are upregulated
by HIF-1 in fibroblasts,(31,32) and LOX is upregulated by HIF-1 at the mRNA level.(33)
Thus, HIF-1 appears to regulate all three primary enzymes responsible for the control of
cross-link profile and, as a result, HIF-1 is potentially responsible for altering cross-link
profile.
The importance of mechanosensitivity to many of bone’s properties suggests that loading
may play a part in determining its cross-link profile. Indeed, a lack of normal loading in
growing bone leads to lowered levels of cross-links as well as a reduction in the
expression of LOX.(34,35) Exercise has a positive influence on cross-link production, with
young rats showing increases in lysyl pyridinoline (LP) levels in trabecular bone
following 10 weeks of moderate running.(23)
Physical load may affect cross-linking by means other than just cellular control of
enzyme activity, formation or remodeling. Applying tensile load during reaction
increases the glutaraldehyde cross-linking rate of collagen; in addition, introducing new
load to a glutaraldehyde cross-linked collagen matrix can cause new cross-links to form
above and beyond the level of cross-linking reachable before loading.(36) These results
suggest that loading may alter collagen fibril, molecule, telo-peptide or alpha-helix
conformation in ways that increase the alignment of cross-linking sites. The addition of
dynamic strain to a system likely alters local entropy, possibly influencing the driving
forces behind cross-linking reactions frequently referred to as “spontaneous”.
Enzymatic collagen cross-linking is a carefully controlled process that results in cross-
link profiles specific to different tissues. Bone disease is often marked by differences in
cross-link type and quantity that may both reflect and contribute to the pathology of the
tissue. By exploring the effects of cross-linking in bone adaptation and mechanical
properties, as well as the mechanisms by which cross-linking is controlled under normal,
cross-link inhibition and loading conditions, this project set out to better understand the
importance and roles of collagen cross-links in bone tissue. A more detailed knowledge
7
of cross-linking mechanisms will provide insight into altered states of cross-linking found
in bone disease and may provide new strategies for clinical intervention.
Finally, the composition and structure of any bone is a snapshot reflecting its history of
development, growth, modeling, maturation, damage, healing and turnover, all of which
occur under variable conditions of diet, mechanical loading, mineral homeostasis, disease
and aging. These factors are influential across the entire scale of bone’s hierarchical
structure, from mineral and collagen composition and packing to the structure of the
cortical shell and cancellous volume. Changes at the smallest compositional scale may
propagate upwards, just as forces at the largest scale may cause changes at the smallest.
Thus, in any endeavor to understand “bone quality”, it is critical to consider the history of
the tissue under examination. This is particularly true when a treatment affects some
areas of the bone and not others; measures made on the whole bone will reflect
contributions from both the affected and unaffected tissues, confounding the
interpretation of the treatment’s effects.
AIMS & HYPOTHESES
A better understanding of both the control and importance of cross-linking may shed light
on the importance of cross-link profile alterations observed in bone disease and possibly
provide new targets for therapy and strategies for functional tissue engineering.
This study used in vivo approaches to study the relationships between collagen cross-
linking, mechanical loading, and their contributions to bone formation and mechanical
properties. The goals were to understand 1) the importance of cross-link profile, rather
than just quantity, to mechanical properties of bone, 2) the ability of physiological
loading to promote cross-link formation, and 3) the effect of impairing cross-linking on
bone’s ability to adapt to exercise as measured by improvements in mechanical properties
or new tissue formation.
8
Global Hypothesis: The collagen cross-linking of bone is increased by moderate
mechanical loading, and, in turn, this cross-linking contributes to the tissue’s mechanical
properties and their enhancement in adaptation to loading.
The overall aim of this thesis was to determine the importance of collagen cross-linking
to bone mechanical properties and adaptation to exercise in a mouse model. Collagen
cross-linking mostly occurs prior to mineralization of new bone tissue, so growing mice
were used to assure sufficient new bone formation occurred over the course of the
experiments to make detection of cross-linking changes at the whole bone level possible.
Hypothesis 1: Collagen cross-linking and mechanical properties are BAPN dose
dependent, with decreases in cross-linking correlating with decreased fracture toughness
and strength.
Aim 1: A mouse model of lathyrism utilizing daily subcutaneous injection of
BAPN was developed. Mice were treated for 3 weeks from 5-8 weeks of age with
0, 150, 350, or 500mg/kg BAPN. Whole bone mechanical properties, fracture
toughness, collagen cross-link quantification and localized compositional changes
measured by Raman spectroscopy were quantified and used to determine
relationships between cross-link profile and mechanical properties, including
fracture toughness.
Hypothesis 2: Growing mice will respond to exercise with increases in collagen cross-
links and improvements in bone strength relative to age-matched controls. Inhibition of
collagen cross-link formation by BAPN treatment will mitigate these adaptive changes
with reduction of new bone formation, cross-link content, and mechanical properties
compared to untreated mice. Irrespective of exercise and BAPN treatment, a positive
correlation will exist between collagen cross-link content and bone mechanical
properties.
Aim 2: Four groups of male C57Bl6 mice were treated from 5-8 weeks of age to
determine the individual and combined effects of BAPN and exercise on bone

9
growth, mechanical properties, and collagen cross-link profile. A fifth group was
sacrificed at 5 weeks to provide a baseline measurement for all properties. These
results were used to determine relationships between cross-link profile and
mechanical properties.
Chapter 2 addresses Aim 1. Following 3 weeks of treatment, BAPN had dose dependent
effects on cortical bone fracture toughness, strength, and pyridinoline crosslink content.
Ratios reflecting relative crosslink maturity were significant predictors of fracture
toughness, whereas quantities of mature pyridinoline crosslinks were significant
predictors of tissue strength. The effect of BAPN treatment on mechanical properties was
dose specific, with the greatest impact found at an intermediate dose. Raman
spectroscopy of pre-existing normal bone and areas of cross-link deficient bone formed
during BAPN treatment revealed that BAPN treatment did not affect mineral measures
but significantly increased the Amide I ~1660/1690 ratio compared to newly formed
control tissue. Thus, it is concluded from this work that spatially localized effects of
short-term crosslink inhibition can alter the whole-bone collagen crosslink profile to a
measureable degree, and this crosslink profile is predictive of bone fracture toughness
and strength.
In Chapter 3, the intermediate BAPN dose studied in Chapter 2 was combined with
treadmill running to address Aim 2. Both exercise and BAPN reduced mouse growth, but
only exercise significantly reduced bone size. Bones of mice exercised for 3 weeks had
fewer pyrrole and more pyridinoline crosslinks than sedentary mice, as well as slightly
increased TMD. However, these material changes were not associated with changes in
tissue mechanical properties. BAPN significantly reduced both pyridinoline and pyrrole
crosslinks and marginally increased TMD. Unlike exercise, these changes were
associated with reductions in bone modulus and yield strain. Exercise was able to rescue
the effects of BAPN treatment. Bones from mice treated with both BAPN and exercise
had increased pyridinoline and total mature cross-link content associated with a return of
modulus and yield strain to control levels. Pyrrole and the less hydroxylated LP and
10
HLNL crosslinks were significant predictors of bone rigidity, with pyrrole cross-link
content explaining 22% of the variability in modulus across 8-week old mice.
Overall, this body of work demonstrates the clear importance of collagen cross-linking
profile to bone mechanical properties, as well as a role for cross-linking in bone’s
response to exercise. Although the exact relationships between cross-links and
mechanics differed across experiments (possible reasons are discussed in Chapters 3 and
4), an important point is conserved: neither total enzymatic crosslink quantities nor the
individual cross-links with greatest abundance are good predictors of bone mechanical
properties. Mature, trivalent cross-links were most important to bone properties,
especially those cross-links representative of lower levels of lysine hydroxylation at the
telopeptide (pyrroles) and helical (HLNL, LP) cross-linking sites. Perhaps not
coincidentally, pyrrole and LP are most abundant at the N-telopeptide to helix cross-
linking site,(6) unlike HP cross-links which are distributed more evenly at both
telopeptides. Thus, trivalent cross-link location, more than specific cross-link chemistry,
may explain their greater importance. Finally, cross-link profile is modulated in response
to exercise, potentially explaining the observed ability of exercise to prevent detrimental
mechanical effects of cross-link inhibition. Collectively, this thesis sheds light onto the
specificity of cross-link profile in determining bone mechanical properties, reveals that
lysyl hydroxylation may be modulated in response to physiological loading as part of
bone’s adaptive response, and provides direction for continuing to unravel the simple but
incredibly complicated question of what determines desirable bone quality.
11
REFERENCES
1. Eriksen HA, Sharp CA, Robins SP, Sassi M-L, Risteli L, Risteli J. Differently cross-linked and uncross-linked carboxy-terminal telopeptides of type I collagen in human mineralised bone. Bone. 2004;34(4):720–7.
2. Sricholpech M, Perdivara I, Nagaoka H, Yokoyama M, Tomer KB, Yamauchi M. Lysyl hydroxylase 3 glucosylates galactosylhydroxylysine residues in type I collagen in osteoblast culture. J Biol Chem. 2011;286(11):8846–56.
3. Ha-Vinh R, Alanay Y, Bank RA, et al. Phenotypic and molecular characterization of Bruck syndrome (osteogenesis imperfecta with contractures of the large joints) caused by a recessive mutation in PLOD2. Am J Med Genet A. 2004;131(2):115–20.
4. Eyre DR, Wu J-J. Collagen cross-links. Top Curr Chem. 2005;247:207–29.
5. Uzawa K, Grzesik WJ, Nishiura T, et al. Differential expression of human lysyl hydroxylase genes, lysine hydroxylation, and cross-linking of type I collagen during osteoblastic differentiation in vitro. J Bone Miner Res. 1999;14(8):1272–80.
6. Hanson DA, Eyre DR. Molecular Site Specificity of Pyridinoline and Pyrrole Cross-links in Type I Collagen of Human Bone. J Biol Chem. 1996;271(43):26508–16.
7. Eyre DR, Weis MA. Bone collagen: new clues to its mineralization mechanism from recessive osteogenesis imperfecta. Calcif Tissue Int. 2013;93(4):338–47.
8. Robins S. Fibrillogenesis and maturation of collagens. In: Seibel MJ, Robins SP, Bilezikian JP, editors. Dynamics of Bone and Cartilage Metabolism. Second. Burlington, MA: Academic Press; 2006. p. 41–53.
9. Miguez P., Pereira PNR, Atsawasuwan P, Yamauchi M. Collagen Cross-linking and Ultimate Tensile Strength in Dentin. J Dent Res. 2004;83(10):807–10.
10. Banse X, Devogelaer JP, Lafosse A, Sims TJ, Grynpas M, Bailey AJ. Cross-link profile of bone collagen correlates with structural organization of trabeculae. Bone. 2002;31(1):70–6.
11. Bailey AJ, Paul RG, Knott L. Mechanisms of maturation and ageing of collagen. Mech Ageing Dev. 1998;106(1-2):1–56.
12. Paschalis EP, Shane E, Lyritis G, Skarantavos G, Mendelsohn R, Boskey AL. Bone fragility and collagen cross-links. J Bone Miner Res. 2004;19(12):2000–4.

12
13. Shiraki M, Kuroda T, Tanaka S, Saito M, Fukunaga M, Nakamura T. Nonenzymatic collagen cross-links induced by glycoxidation (pentosidine) predicts vertebral fractures. J Bone Miner Metab. 2008;26(1):93–100.
14. Saito M, Fujii K, Marumo K. Degree of mineralization-related collagen crosslinking in the femoral neck cancellous bone in cases of hip fracture and controls. Calcif Tissue Int. 2006;79(3):160–8.
15. Saito M, Fujii K, Soshi S, Tanaka T. Reductions in degree of mineralization and enzymatic collagen cross-links and increases in glycation-induced pentosidine in the femoral neck cortex in cases of femoral neck fracture. Osteoporos Int. 2006;17(7):986–95.
16. Saito M, Fujii K, Mori Y, Marumo K. Role of collagen enzymatic and glycation induced cross-links as a determinant of bone quality in spontaneously diabetic WBN/Kob rats. Osteoporos Int. 2006;17(10):1514–23.
17. Hambli R, Barkaoui A. Physically based 3D finite element model of a single mineralized collagen microfibril. J Theor Biol. 2012;301:28–41.
18. Barkaoui A, Bettamer A, Hambli R. Failure of Mineralized Collagen Microfibrils Using Finite Element Simulation Coupled to Mechanical Quasi-brittle Damage. Procedia Eng. 2011;10:3185–90.
19. Uzel SGM, Buehler MJ. Molecular structure, mechanical behavior and failure mechanism of the C-terminal cross-link domain in type I collagen. J Mech Behav Biomed Mater. 2011;4:153–61.
20. Rosenquist J, Baylink D, Spengler D. The effect of beta-aminopropionitrile (BAPN) on bone mineralization. Proc Soc Exp Biol Med. 1977;154(2):310–3.
21. Nyman JS, Roy A, Acuna RL, et al. Age-related effect on the concentration of collagen crosslinks in human osteonal and interstitial bone tissue. Bone. 2006;39(6):1210–7.
22. Oxlund H, Barckman M, Ørtoft G, Andreassen T, Ortoft G. Reduced concentrations of collagen cross-links are associated with reduced strength of bone. Bone. 1995;17(4 Suppl):365S–371S.
23. Salem GJ, Zernicke RF, Martinez DA, Vailas AC. Adaptations of immature trabecular bone to moderate exercise: geometrical, biochemical, and biomechanical correlates. Bone. 1993;14(4):647–54.
24. Viguet-Carrin S, Garnero P, Delmas PD. The role of collagen in bone strength. Osteoporos Int. 2006;17(3):319–36.
13
25. Nyman JS, Roy A, Tyler JH, Acuna RL, Gayle HJ, Wang X. Age-related factors affecting the postyield energy dissipation of human cortical bone. J Orthop Res. 2007;25(May):646–55.
26. Hernandez CJ, Tang SY, Baumbach BM, et al. Trabecular microfracture and the influence of pyridinium and non-enzymatic glycation-mediated collagen cross-links. Bone. 2005;37(6):825–32.
27. Garnero P, Borel O, Gineyts E, et al. Extracellular post-translational modifications of collagen are major determinants of biomechanical properties of fetal bovine cortical bone. Bone. 2006;38(3):300–9.
28. Paschalis EP, Verdelis K, Doty SB, Boskey AL, Mendelsohn R, Yamauchi M. Spectroscopic characterization of collagen cross-links in bone. J Bone Miner Res. 2001;16(10):1821–8.
29. Farlay D, Duclos M-E, Gineyts E, et al. The ratio 1660/1690 cm(-1) measured by infrared microspectroscopy is not specific of enzymatic collagen cross-links in bone tissue. PLoS One. 2011;6(12):e28736.
30. Spengler DM, Baylink DJ, Rosenquist JB. Effect of beta-aminopropionitrile on bone mechanical properties. J Bone Joint Surg Am. 1977;59(5):670–2.
31. Hofbauer K-H, Gess B, Lohaus C, Meyer HE, Katschinski D, Kurtz A. Oxygen tension regulates the expression of a group of procollagen hydroxylases. Eur J Biochem. 2003;270(22):4515–22.
32. Gilkes DM, Bajpai S, Chaturvedi P, Wirtz D, Semenza GL. Hypoxia-inducible factor 1 (HIF-1) promotes extracellular matrix remodeling under hypoxic conditions by inducing P4HA1, P4HA2, and PLOD2 expression in fibroblasts. J Biol Chem. 2013;288(15):10819–29.
33. Erler JT, Bennewith KL, Nicolau M, et al. Lysyl oxidase is essential for hypoxia-induced metastasis. Nature. 2006;440(7088):1222–6.
34. Brama PA, Bank RA, Tekoppele JM, Weeren P, Van Weeren PR. Training affects the collagen framework of subchondral bone in foals. Vet J. 2001;162(1):24–32.
35. Lest C, Brama P, Weeren P. The influence of exercise on bone morphogenic enzyme activity of immature equine subchondral bone. Biorheology. 2003;40(1-3):377–82.
36. Chachra D, Gratzer PF, Pereira CA, Lee JM. Effect of applied uniaxial stress on rate and mechanical effects of cross-linking in tissue-derived biomaterials. Biomaterials. 1996;17(19):1865–75.
14
CHAPTER TWO: Bone Toughness and Strength Correlate with Collagen Cross-link
Maturity in a Dose-Controlled Lathyrism Mouse Model
ABSTRACT
Collagen cross-linking is altered in aged and diseased bone, and enzymatic collagen
cross-links are important to bone quality as evidenced by losses of strength following
lysyl oxidase inhibition (lathyrism). I hypothesized that cross-links also contribute
directly to bone fracture toughness. A mouse model of lathyrism using subcutaneous
injection of β-aminopropionitrile (BAPN) was developed and characterized. Three weeks
of BAPN treatment in young growing mice significantly reduced cortical bone fracture
toughness, strength, and pyridinoline cross-link content. Ratios reflecting relative cross-
link maturity were significant predictors of fracture toughness, whereas quantities of
mature pyridinoline cross-links were significant predictors of tissue strength. Immature
and pyrrole cross-links, which were not significantly reduced by BAPN, were not
predictive of mechanical properties. The effect of BAPN treatment on mechanical
properties was dose specific, with the greatest impact found at an intermediate dose.
Calcein labeling was used to define locations of new bone formation, allowing for the
identification of regions of normally cross-linked (preexisting) and BAPN treated (newly
formed, cross-link-deficient) bone. Raman spectroscopy revealed spatial differences due
to relative tissue age and effects of cross-link inhibition. Newly deposited tissues had
lower mineral/matrix, carbonate/phosphate and Amide I cross-link (matrix maturity)
ratios compared to preexisting tissues. BAPN treatment did not affect mineral measures
but significantly increased the cross-link (matrix maturity) ratio compared to newly
formed control tissue. This study reveals that spatially localized effects of short term
BAPN cross-link inhibition can alter the whole bone collagen cross-link profile to a
measureable degree, and this cross-link profile is predictive of bone fracture toughness
15
and strength. Thus, cross-link profile perturbations associated with bone disease may
provide insight into bone mechanical quality and fracture risk.
INTRODUCTION
Resistance to fracture is dependent not only on the quantity and distribution of bone but
also the quality of the bone material.(1–3) As a hierarchical composite primarily composed
of mineral and Type I collagen matrix, the strength and toughness of bone tissue are
derived from its components’ individual properties as well as their interfaces and
arrangements at multiple length scales. A stiff bone is desirable as a skeletal support, but
tough bone is necessary to resist fracture. Toughness is supplied primarily by the organic
matrix, and the task of stabilizing this polymeric network rests on a collection of covalent
collagen cross-links.
Numerous species of collagen cross-links have been characterized.(4–8) The conversion of
collagen telopeptide lyines to allysines by the extracellular enzyme lysyl oxidase (LOX)
is required for the formation of enzymatically controlled cross-links during tissue
development.(9) LOX-produced allysines react with helix (hydroxy)lysines on
neighboring collagen molecules to form immature divalent cross-links, quantified as their
reduced forms dihydroxylysinorleucine (DHLNL) and hydroxylysinorleucine (HLNL). A
fraction of these cross-links will subsequently mature to trivalent forms, known to
include both the pyridinolines (hydroxylysylpyridinoline and lysylpyridinoline, HP and
LP respectively) and pyrroles. Advanced glycation endproduct (AGE) cross-links, such
as pentosidine (PEN), form independently of enzyme activity and accumulate with tissue
age. Shifts in cross-link profile occur in many bone pathologies and with aging,(10–13) and
understanding which of these changes are significant to bone fracture resistance is critical
for developing and evaluating therapies for fracture prevention and disease management.
There are many reports of enzymatic and AGE cross-links differing in their contribution
to bone mechanics,(1,10,12,14,15) but a full characterization of cross-link profile (e.g.
immature vs mature, hydroxylation level, enzymatic vs AGE) with direct correlations to

16
tissue fracture toughness is unknown. Inhibition of lysyl oxidase by treatment with β-
aminopropionitrile (BAPN), known as lathyrism, inhibits enzymatic cross-link formation
in forming collagen and reduces bone strength in vivo.(16–18) The majority of BAPN bone
studies use animal models no smaller than rats.(18–21) Most commonly, BAPN is
administered through diet or ingested fluids which makes the dose difficult to
control.(16,18,21,22) Subcutaneous BAPN injection of mice was chosen to allow for dosage
control of cross-link inhibition in an inexpensive animal model. Enzymatic cross-linking
occurs primarily during tissue formation. Thus, young growing mice were chosen so that
significant quantities of cross-link-deficient tissue were deposited during the course of
BAPN exposure. Cross-link profile (DHLNL, HLNL, HP, LP, Pyrrole, and PEN), whole
bone mechanical properties, fracture toughness and localized matrix composition were
measured on hind limb bones from mice treated with 0-500mg BAPN/kg bodyweight
from 5 to 8 weeks of age. It was hypothesized that shifts in cross-link profile following
BAPN treatment would be dose dependent and would specifically correlate with resulting
reductions in bone fracture toughness and strength.
MATERIALS AND METHODS
Animals and BAPN Treatment
All animal procedures were performed at the University of Michigan with University
Committee on Use and Care of Animals (UCUCA) approval. Sixty male C57Bl6 mice
(Charles River) were weight matched into 4 experimental groups 2 days prior to the start
of the experiment. Animals were group housed in standard cages with free access to
standard chow, water and cage activity. All mice underwent 3 weeks of treatment
beginning when mice reached 5 weeks of age. Treatment consisted of daily subcutaneous
injections of phosphate buffered saline (PBS) containing 0, 150, 350, or 500 mg/kg
BAPN (β-aminopropionitrile fumarate, Sigma-Aldrich). Mice were weighed and dosages
adjusted every 3 days during the course of the 21 day experiment. On experiment days 2
and 16, mice received 15 mg/kg calcein (Sigma) by intraperitoneal injection. Mice were
17
sacrificed by CO2 inhalation on day 22 at 8 weeks of age. Femora and tibiae were
immediately harvested, cleaned of soft tissue, wrapped in calcium-buffered PBS soaked
gauze and frozen until use. Sample identity was tracked using a random numbering
system; investigators performed all analyses blinded to sample treatment.
µCT
Whole left tibiae and femora (n=15/group) were scanned while submerged in Ca-PBS
buffer using an eXplore Locus SP scanner (GE Healthcare Pre-Clinical Imaging) at a
voxel size of 18µm3 (80kVp, 80µA, 1600ms, 0.508mm Al filter).(23) Calibration of the
scanner using an air/water/Hydroxyapatite (HA) phantom was performed each day of
scanning. Regions of interest were analyzed using a combination of GE MicroView
software (reorientation, standard site selection, tissue mineral content (TMC) and tissue
mineral density (TMD)) and custom-written MATLAB scripts (quantification of cortical
geometry). Scans were reoriented to match the alignment of each bone in silico with its
eventual alignment during mechanical testing. A 5-slice thick standard site was taken
from each reoriented tibia at the point 23.5% of the distance from the tibia-fibula junction
to the proximal end of the tibia, closely corresponding to the center of the 3mm
mechanical testing span for all bones. Thus, the cortical site analyzed was reproducible
from bone to bone and appropriate for calculating tissue level properties from 4-point
testing data using classic beam theory. For the femur, a 5-slice standard site was located
at the site 48% of its length as measured from the distal condyle. TMC and TMD were
measured for both the femur and tibia using a fixed threshold of 2000 Hounsfield Units.
4 point bending
Following µCT–scanning, left tibiae (n=15/group) were tested in 4 point bending on an
eXpert 450 Universal Testing Machine (Admet; Norwood, MA) as previously described.
Both whole bone (load, displacement) and tissue level (stress, strain) properties were
quantified at the yield and ultimate points. Yield was defined using the 0.2% strain offset
method. Whole bone stiffness and tissue elastic modulus were calculated by linear
18
regression fitting of the linear-elastic pre-yield region. Pre-yield work and pre-yield
toughness (resilience) were calculated as the area under the load-displacement and stress-
strain curves, respectively, up to the previously defined yield point.
Collagen cross-link quantification
Left femora were used for collagen crosslink quantification of cortical bone (n=7-
11/group). Mature (HP, LP and pyrrole), reduced immature (DHLNL and HLNL) and
glycation (PEN) crosslinks were all measured from the same sample and normalized to
collagen content. Cortical diaphyses, flushed of marrow, were demineralized in 0.5M
EDTA. After extensive washing, demineralized samples were reacted with sodium
borohydride to stabilize immature crosslinks in preparation for acid hydrolysis.(24)
Because pyrrole crosslinks are neither reducible nor stable in strong acid, reduced
samples were first digested with TPCK-treated trypsin in a shaking water bath at 37oC for
22 hours.(24) An aliquot of digest was used to quantify pyrrole content colorimetrically in
a 384 well plate.(24) The remaining digest was mixed 1:1 with 12M HCl and hydrolyzed
at 110oC for 12 hours. An aliquot of the resulting hydrolysate was used for
hydroxyproline quantification to determine collagen content.(25) Another aliquot was
mixed with an internal standard (Quidel) and applied to an SPE column (Chromabond X-
Links, Machery-Nagel, Germany) optimized for the purification of collagen crosslinks
from biological samples.(26) Crosslinks and internal standard were eluted from the SPE
column in 600µl of 1% heptafluorobutyric acid (HFBA) in preparation for HPLC
injection.
HP and LP were quantified using a commercially available standard (Quidel).
Pentosidine was synthesized as poly-pentosidine, hydrolyzed and purified as
described.(27) Further purification on Chromabond Crosslinks SPE columns and repeated
HPLC injection with fraction collection of the pentosidine peak yielded a pentosidine
standard that was fluorescently pure (single HPLC peak) and matched published
absorption and fluorescence profiles.(28) The pentosidine standard was calibrated from its
19
absorbance at 326nm in 1mM HCl.(29) Standards for DHLNL and HLNL were a generous
gift from Simon Robins (University of Aberdeen).
All cross-links but the pyrroles were quantified using a binary pump Waters Breeze
HPLC system fitted with a column heater (set to 30oC) and Waters 2475 fluorescence
detector. Samples were separated on a Waters XBridge C18 column (3.5um,
4.6×150mm). Buffer A consisted of 0.12% HFBA and buffer B consisted of 50%
acetonitrile. The naturally fluorescent cross-links were quantified in a single injection by
monitoring at 297nm/395nm (HP, LP) and 335nm/385nm (PEN) ex/em wavelengths (10
min 85% A, linear gradient 85-75% A over 30 min, 10 min 75% A). The reduced
immature cross-links were quantified in a second injection with the addition of an o-
phthalaldehyde (OPA) post-column reaction (isocratic, 85% A). OPA reagent (0.8g OPA
dissolved in 15ml ethanol, added to 980mL boric acid buffer (0.4M, pH 10), 2ml
mercaptoethanol and 1g Brij-35) was delivered using a high pressure syringe pump
(Nexus 5000, Chemyx) at a rate of 0.5 ml/min with fluorescence monitored at
350nm/450nm (ex/em).
Bone Sectioning and Raman spectroscopy
Right tibiae (n=5-7/group) were dehydrated in a graded ethanol series, cleared with
Clear-Rite 3 (Thermo Scientific), and infiltrated and embedded using Koldmount (SPI
supplies). Sections ~150µm thick were cut from the mid-diaphysis using a low-speed
sectioning saw (Model 650; South Bay Technology, San Clemente, CA) with a diamond
wafering blade (Mager Scientific). Sections were mounted on glass slides and hand
ground and polished using wet silicon carbide paper to a final thickness of 75-100µm.
Calcein labels were imaged on a Nikon E800 fluorescence light microscope equipped
with a FITC filter and Photometrics coolsnap monochrome camera.
Using a locally constructed Raman microscope as described in detail previously,(30) 4
spectra were collected from each anatomical direction by means of line-focused laser
radiation (785 nm excitation). Calcein images were referenced to identify each Raman
collection site as preexisting or new tissue, thus identifying tissue age (prior to or with
20
treatment) (Figure 2.6). For all Raman spectra, both bone mineral and matrix-specific
Raman bands were analyzed and band intensities for calculating the ratios of
carbonate/phosphate (1070 cm-1
/960 cm-1
) and mineral/matrix(phosphate/phenylalanine,
958cm-1
/1001cm-1
) were measured (GRAMS/AI software, Thermo Nicolet, Middleton,
WI). The intensities of the two major components of amide I band, identified as 1660 and
1683 cm-1
, were used to calculate the cross-link (matrix maturity) ratio. Data were
averaged for each bone section or cell culture sample prior to calculating group means,
thus group sample sizes reflect only independent biological replicates.
Cell Culture
Since bone samples included tissue varying in treatment history and age, I used
extracellular matrix produced by MC3T3-E1 cells to verify the effect of collagen cross-
link deficiency on Raman signal. MC3T3-E1 cells were plated in osteogenic media at a
density of 8,400 cells/cm2 in 6 well plates. Media consisted of α-MEM supplemented
with 10% fetal bovine serum, 1% pen-strep, 50mg/L ascorbic acid, 10-8M
dexamethasone, 10mM β-glycerophosphate, and, for BAPN-treated wells only, 1.6mM
BAPN.(31) After 2.5 weeks of culture, cell layers were scraped and immediately
transferred to a sapphire disc in a minimal amount of media for Raman measurement.
Spectra were collected from each sample with the laser focused within the globule of
matrix. Raman parameters were the same as described for tissue sections.
Statistics
All statistical analysis was performed in IBM SPSS Statistics software. Results were
checked for assumptions of normality (Shapiro-Wilk) and homogeneity of variance
(Levene), and, when both assumptions were valid, ANOVA tests with Dunnett post-hoc
comparisons were used to check for significant effects of BAPN dose and specific
differences between BAPN treated groups and controls (0mg/kg dose). These results are
reported as the group mean +/- the standard error of the mean. In cases where normality
21
tests failed, the non-parametric Jonckheere-Terpstra (J-T) test for ordered alternatives,
optimized for detecting differences between ordered levels of a factor, was used to test
for a dose effect of BAPN. For these cases, step-wise post hoc comparisons were used to
test for specific group differences. Results for non-normally distributed measures are
reported as group median and 95% confidence interval. For Raman data, a two-way
repeated measures ANOVA was used to test for the effects of tissue age (within-subject
repeated measure) and BAPN dose (between-subjects measure). A one-way ANOVA was
also used to test the effect of BAPN dose within new tissue only. Step-wise multivariate
linear regressions were performed with mechanical properties as dependent variables and
cross-link measures and TMD as independent variables. Only single variable models
were found to be significant, thus only univariate regressions are presented. In all tests, a
p<0.05 was considered significant. Values of p<0.10 are noted as trends.
RESULTS
BAPN treatment reduces mouse growth and tibia cortical size
Mice were weight matched into 4 treatment groups 2 days prior to the start of treatment
with group mean bodyweights of 15.27 +/- 0.25g (mean +/- SEM) (Table 2-1). Although
all mice gained weight over the course of the 3 week experiment, the highest dose of
BAPN significantly reduced growth resulting in significant differences in body weight by
day 18 of the experiment (J-T p=0.028). At sacrifice, mice at the highest dose weighed
7.5% less than controls (J-T p=0.009, post hoc p<0.05). Despite this reduced growth, no
outward signs of ill health were observed and all mice survived the full experiment.
Tibia cortical cross-sectional geometry was significantly reduced with BAPN treatment
(Table 2-1). Tibia cross-sectional cortical area (Ct.Area) at the standard site was
significantly reduced with increasing BAPN dose (J-T, p=0.013), as were the second
moments of inertia about the anterior-posterior (IAP) and medial-lateral axes (IML),
indicating a reduction of the cross-section’s ability to resist bending in both the A-P and
22
M-L directions (J-T, p=0.007 and p=0.038, respectively). BAPN treatment had no
significant effects on femur cortical geometry (Table 2-S1). Though mean TMC and
TMD for the tibia and femur were not different between BAPN groups, tibial TMD
became more variable with BAPN treatment (Levene’s Homogeneity of Variance test,
p<0.05) (Figure 2.1).
BAPN treatment reduced pyridinoline cross-linking and cross-link maturity ratios
BAPN significantly reduced both species of pyridinoline cross-links compared to controls
(Figure 2.2a, ANOVA, HP: p=0.025, LP: p=0.011, (HP+LP): p=0.019). Pyrroles were
more abundant than the pyridinolines for all doses of BAPN (Figure 2.2a, two way
ANOVA with cross-link measures treated as repeated measures, p<0.001). No significant
effect of BAPN dose on pyrrole content was observed (Figure 2.2a). No differences in the
immature cross-links DHLNL and HLNL (Figure 2.2b) or pentosidine (Figure 2.2c) were
detected. Cross-link maturity ratios (Figure 2.3a) were significantly reduced with BAPN
treatment when HP or (HP+LP) was used as the measure of mature cross-links. The
proportions between the hydroxylated and non-hydroxylated forms of the pyridinolines
and divalent cross-links (HP:LP and DHLNL:HLNL, respectively) were also compared,
but there were no significant changes with BAPN treatment (Figure 2.3b). There were no
differences in the ratio of pyrroles to pyridinolines (Figure 2.3b).
Bone fracture toughness is reduced with intermediate doses of LOX inhibitor
Maximum load fracture toughness (KC.Max) reflects crack initiation and was significantly
affected by BAPN treatment (Figure 2.4, ANOVA p=0.010). The 150 mg/kg (p= 0.040)
and 350 mg/kg (p=0.019) doses led to reductions in KC.Max of 15.5% and 18.2%
respectively. No difference was found between the 500mg/kg dose and controls. Though
the data suggest a reduction in instability toughness (KC.Inst) at the 350mg/kg dose, there
was not a significant effect of BAPN dose (ANOVA p=0.408).

23
Bone strength, but not stiffness, is reduced at both the structural and tissue levels with intermediate doses of BAPN
Significant reductions in structural strength occurred with BAPN treatment (Figure 2.5b).
Increasing BAPN dose reduced yield (J-T, p=0.054) and ultimate (J-T, p=0.02) strength
(Figure 2.5b). No differences in stiffness (Figure 2.5a, p=0.154) or work to yield (Figure
2.5c, p=0.122) were detected. BAPN did not significantly change yield (p=0.460) or
ultimate (0.644) deformation (data not shown).
Tissue level properties (Figure 2.5d-f) were also impacted by BAPN treatment, with
significant reductions in yield (ANOVA, p=0.038) and ultimate (ANOVA, p=0.044)
stress (Figure 2.5e). The greatest reductions were not at the highest dose but at the
intermediate, 350mg/kg dose. Strains (data not shown) and modulus (Figure 2.5d) were
not different between groups. An effect of BAPN on pre-yield toughness was marginally
significant (Figure 2.5f, p=0.086).
Pyridinoline cross-links and cross-link maturity are predictive of bone strength and toughness
The mature/immature cross-link ratio of HP/(DHLNL+HLNL) was the strongest
predictor of instability fracture toughness (Table 2-2). Additional ratios reflecting cross-
link maturity were marginally significant predictors of KC.Inst. Pyridinoline cross-links
had significant predictive power both individually (HP and LP) and summed (HP + LP)
for bone strength. HP and the summed pyridinolines also related positively, though not
statistically significantly, with fracture toughness. Pyrroles and immature crosslinks did
not regress positively with any mechanical properties. No models found TMD to be a
significant factor in predicting mechanical properties.
Raman spectroscopy detects localized effects of BAPN treatment on new tissue as increases in the ~1660/1683 ratio
Calcein images were referenced to classify each site of Raman collection as new or
preexisting tissue (Figure 2.6). The cross-linking ratio (Figure 2.7c) was significantly
24
increased in new BAPN treated bone compared to newly formed control bone. Within
new (treated) tissue, BAPN treatment did not have significant effects on mineral
measures (phosphate content or carbonate substitution) (Figure 2.7a-b). Significant
differences between new (treated) and old (pre-existing normal) tissues were identified
for all Raman measures in all groups, with older tissue having significantly greater
mineral/matrix, carbonate/phosphate and matrix maturity ratio measures than newly
formed tissues (Figure 2.7a-c). Notably, when data was averaged based on cortical
location alone (ignoring calcein labels and averaging within mid-cortical and endocortical
sites), BAPN’s impact on cross-link maturity was masked (Table 2-3). As was the case
for bone, cell matrix 1660/1683 ratio was significantly increased by BAPN treatment
(Figure 2.7c). Unlike the trends observed for bone tissue (Figure 2.S2), in cell culture the
crosslink ratio’s individual sub-bands, normalized to phenylalanine, were significantly
decreased with BAPN treatment (Figure 2.S1).
DISCUSSION
The toughness of bone stems largely from the properties of its polymeric organic matrix.
Covalent collagen cross-links are responsible for stabilizing this fibrillar network. It has
long been understood that the inhibition of enzymatic cross-linking results in a reduction
in bone strength(1,6,32), but the degree to which cross-links are capable of directly
contributing to bone mechanics, particularly toughness, is unknown. To my knowledge,
this is the first report to measure the impact of collagen cross-linking on bone fracture
toughness. I found a reduction in directly measured bone fracture toughness as a result of
cross-link inhibition (Figure 2.4). Reduced fracture toughness was accompanied by a
significant reduction in tibia whole bone strength (ultimate load) and material level
properties (yield stress, ultimate stress and pre-yield toughness) for the intermediate
BAPN dose (Figure 2.5).
Ratios reflecting relative cross-link maturity were significant predictors of fracture
toughness, whereas quantities of mature pyridinoline cross-links were significant

25
predictors of tissue strength (Table 2-2). There was a stronger correlation between
pyridinoline content and strength and toughness than pyrrole content (Table 2-2). The
pyrrole colorimetric assay is a noisier measure than the HPLC quantification of
pyridinoline, and it is possible this variability reduced this study’s ability to detect
significance in pyrrole differences and regressions. The plentiful immature cross-links
failed to correlate with bone strength, whereas reductions in the smaller fraction of
mature cross-links resulted in measurable losses of tissue strength and fracture toughness.
These correlations strengthen the argument that trivalent cross-links play a greater role
than the divalent cross-links in stabilizing the organic matrix of bone.
BAPN treatment significantly reduced maximum load toughness but not instability
toughness (Figure 2.4). KC.Inst accounts both for crack initiation and stable crack growth
and its magnitude is expected to be larger than KC.Max. By the nature of how it is
calculated, there is less variance in the measurement of KC.Max and it is more likely to
statistically detect differences between groups. However, KC.Inst reflects a larger picture
of the material’s behavior during fracture and is thus more likely to be sensitive to
material quality differences. With this reasoning it makes sense that while this study was
unable to detect significant differences in KC.Inst from BAPN treatment, KC.Inst correlated
more strongly than KC.Max with cross-link profile and with measures of bone strength
determined from whole bone bending (Table 2-2).
I originally hypothesized that I would observe a decrease in collagen cross-linking with
concomitant decreases in mechanical properties as BAPN dose increased. However,
mechanical properties were reduced most significantly at the intermediate (350 mg/kg)
rather than highest (500 mg/kg) BAPN dose (Figures 2.4-2.5). Others have observed
similar discontinuities in BAPN dose effects in vascular tissues.(33) BAPN does not alter
existing cross-links. Thus, at the end of the experiment, each mouse is a hybrid of normal
and cross-link deficient tissues in proportions determined by the rates of tissue apposition
and removal. The dose-dependent reduction in weight gain and bone cortical area with
BAPN treatment (Table 2-1) support there being less new (BAPN-treated) cortical tissue
formed at the highest BAPN dose compared to the other groups. Thus, the lack of effect
26
on strength and toughness at the highest BAPN dose could be explained by a reduction or
change in distribution of the cross-link deficient tissue. The potential for a volume
averaging of preexisting and experimentally treated tissue to influence experimental
measurements is an often overlooked confounding factor with broad implications in
skeletal research.
The HPLC quantification of cross-links from bulk tissue, while allowing for specific
measurement of the full cross-link profile, reflects a volume averaging of preexisting and
normal tissue. To address this issue, Raman spectroscopy was used to explore the spatial
effect of BAPN treatment on matrix cross-linking and composition. Raman results
revealed a localized increase in the matrix maturity ratio (1660/1683 cm-1) with LOX
inhibition, as well as a strong effect of relative tissue age on both mineral and matrix
maturity measures (Figure 2.6). It is worth noting that the interpretation of the
~1660/1683 cm-1 ratio is still controversial.(34,35) Although the ratio was first reported to
correspond to the non-reducible/reducible cross-link ratio using FTIR(35) and has since
been widely employed in both the FTIR and Raman spectroscopy literature it is not a
direct measurement of cross-link content. Two component bands of Amide I near 1660
and 1683 cm-1 represent different secondary structures of collagen. Thus, the ratio can be
changed by factors other than aging, such as mechanical damage(36), ionizing
radiation(30,37), exercise(38), and dehydration of bone(39), all of which cause changes in
collagen secondary structure.
Because the ~1660/1683 cm-1 ratio is sensitive to tissue age, this sensitivity can
overshadow the effects from BAPN treatment if areas of new tissue formation are
assumed from cortical location alone. This is illustrated by a lack of significance when
tissue measures were averaged by cortical location rather than by calcein labeling (Table
2-3). Due to the magnitude of the increase in the ratio observed with increasing tissue
age (older pre-existing tissue compared to new control tissue, Figure 2.6c), it is possible
the increase in 1660/1683 cm-1 observed in newly formed BAPN-treated tissue may be
masked at time points later than were examined, following tissue maturation.
27
The Raman ~1660/1683 cm-1 ratio was increased both by BAPN treatment and with
relative tissue age, yet direct quantification by HPLC found significant reductions in
mature cross-links and relative cross-link maturity. An increase in the spectroscopic
matrix maturity ratio was similarly observed by FTIR following BAPN ingestion in rats,
but the increase was attributed to disproportionate decreases of HPLC measured non-
reducible and reducible cross-link concentrations in BAPN-treated specimens compared
to controls.(18) Combined, these results demonstrate that an increase in the 1660/1683cm-1
ratio does not directly indicate an increase in the number of mature cross-links,
highlighting the non-quantitative nature of this measure and the necessity for care in its
interpretation. While the ratio is not quantitative, the present results highlight an ability
of Raman spectroscopy to detect localized matrix differences due to cross-linking
deficiencies, if carefully controlling for treatment history and relative age of the tissue.
This model of BAPN treatment resulted in a significant reduction in mature enzymatic
cross-links, but with a greater reduction of LP than HP (Figure 2.2), in agreement with
others’ results.(18) However, I did not observe any change in immature cross-links with
this treatment, resulting in a reduced ratio of mature to immature cross-links. The reduced
ratio of mature to immature cross-links from BAPN treatment does not appear to reflect a
general perturbation of tissue maturation. Raman measurements showed mineralization in
the newly formed BAPN-treated tissue to be equivalent to controls, and BAPN actually
increased the ~1660/1683 cm-1 ratio in new bone, an observation typically associated
with an increase in matrix maturity (Figure 2.6).
The maturation of the divalent cross-links to the trivalent cross-link forms is dependent
on the presence of another (hydroxy)lysyl-aldehyde, created by LOX activity. It is
interesting to consider that this approach developed a mild lathyrism model capable of
just enough inhibition to limit the formation of trivalent cross-links while allowing fairly
normal levels of immature cross-link to develop. It is also possible that metabolism and
clearance of the inhibitor permits LOX activity, and thereby immature cross-linking, to
recover between the daily BAPN injections. A BAPN metabolism study using rats found
that ~30% of a BAPN dose administered by intraperitoneal injection was excreted in the
28
urine within 12 hours; cyanoacetic acid, the primary metabolite of BAPN which is
quickly excreted in the urine if injected directly, continued to be excreted 48 hours
following injection.(40) This suggests that the fraction of BAPN which is not immediately
filtered to the urine is sequestered in the body before it is metabolised and excreted.
However, it is unknown what fraction of the BAPN dose is sequestered in bone, what its
duration and concentration profile there are prior to its being metabolized, what fraction
of a BAPN dose is immediately excreted in the urine when other routes of administration
are used, and whether BAPN metabolism significantly differs in mice compared to rats.
My strategy in developing this lathyrism model was to balance the route and frequency of
administration with accuracy and animal well-being. Injection of BAPN rather than
administration in food or water allows for more precise dosing, especially in cases where
ingestion varies between individuals or groups due to size, treatment, gender or age
differences. However, to minimize stressful handling of the animals, I limited treatment
to once-daily administration. To maximize the duration of exposure and the fraction of
each dose to reach the bone I used subcutaneous injection, which has more sustained drug
absorption and less immediate hepatic filtering than occurs in intraparenteral injection.
This study’s results show correlations between cross-link profile and mechanical
properties, but alterations in cross-link profile may alter cell response, initiating a cell-
mediated cascade of changes to tissue quality. The inhibition of cross-linking may affect
bone composition and mechanical properties indirectly through these changes in addition
to a direct mechanical contribution to matrix stability. However, I did not detect any
matrix alterations outside of cross-link profile to explain the mechanical effects of BAPN
treatment (Figure 2.6). The effects of BAPN treatment on bone mineralization are
mixed.(18,19,21,41) TMD is typically expected to be a primary determinant of bone
stiffness, but mean TMD, like stiffness, was not significantly changed with cross-link
inhibition in this model. TMD was not a significant correlate of any mechanical property.
Cortical TMD at the tibia standard site was more variable with BAPN treatment (Figure
2.1), but the BAPN reduction of bone size and the differences in phosphate/matrix and
carbonate/phosphate observed with tissue age, but not BAPN treatment, suggest this
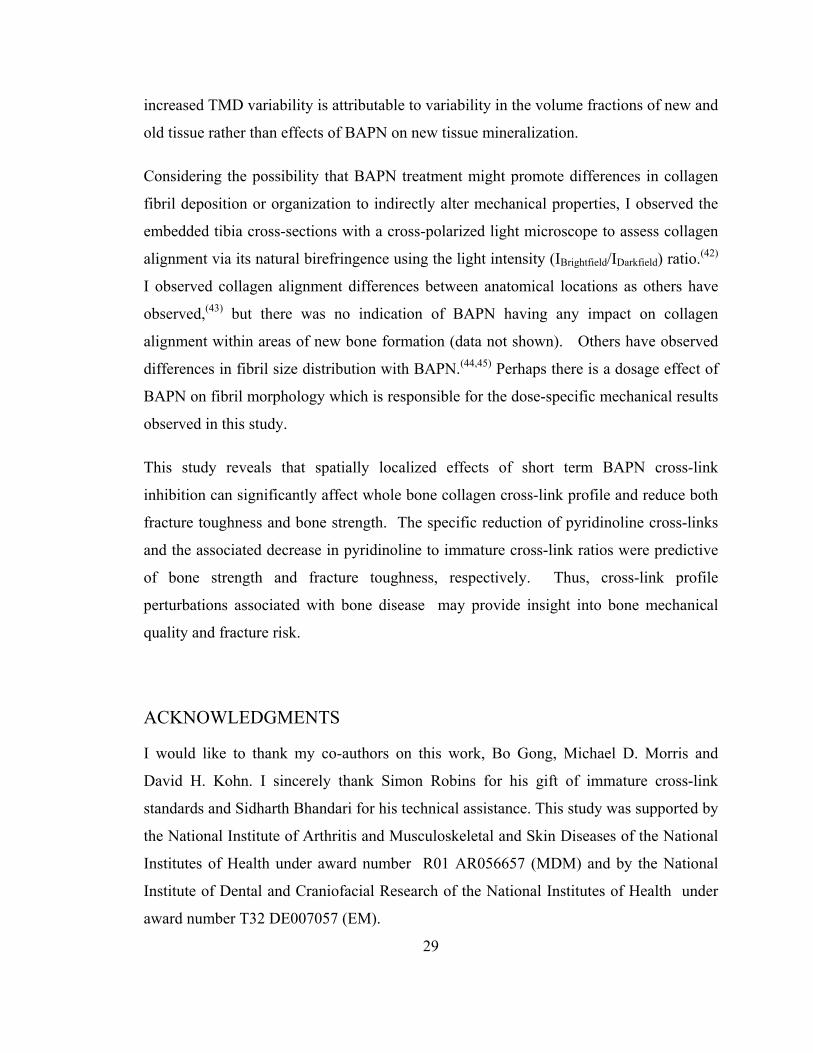
29
increased TMD variability is attributable to variability in the volume fractions of new and
old tissue rather than effects of BAPN on new tissue mineralization.
Considering the possibility that BAPN treatment might promote differences in collagen
fibril deposition or organization to indirectly alter mechanical properties, I observed the
embedded tibia cross-sections with a cross-polarized light microscope to assess collagen
alignment via its natural birefringence using the light intensity (IBrightfield/IDarkfield) ratio.(42)
I observed collagen alignment differences between anatomical locations as others have
observed,(43) but there was no indication of BAPN having any impact on collagen
alignment within areas of new bone formation (data not shown). Others have observed
differences in fibril size distribution with BAPN.(44,45) Perhaps there is a dosage effect of
BAPN on fibril morphology which is responsible for the dose-specific mechanical results
observed in this study.
This study reveals that spatially localized effects of short term BAPN cross-link
inhibition can significantly affect whole bone collagen cross-link profile and reduce both
fracture toughness and bone strength. The specific reduction of pyridinoline cross-links
and the associated decrease in pyridinoline to immature cross-link ratios were predictive
of bone strength and fracture toughness, respectively. Thus, cross-link profile
perturbations associated with bone disease may provide insight into bone mechanical
quality and fracture risk.
ACKNOWLEDGMENTS
I would like to thank my co-authors on this work, Bo Gong, Michael D. Morris and
David H. Kohn. I sincerely thank Simon Robins for his gift of immature cross-link
standards and Sidharth Bhandari for his technical assistance. This study was supported by
the National Institute of Arthritis and Musculoskeletal and Skin Diseases of the National
Institutes of Health under award number R01 AR056657 (MDM) and by the National
Institute of Dental and Craniofacial Research of the National Institutes of Health under
award number T32 DE007057 (EM).
30
Figure 2.1 – Group distributions of TMD measured at the standard site are presented in a statistical boxplot. Black horizontal bars indicate group median, box ends indicate the 25th and 75th percentiles of the data,box height is the interquartile range (IQR) of the data, and whisker lines indicate the maximum and minimum values that are not outliers. Outliers are shown as individual dots. TMD was not significantly altered by dose for either bone, but tibia TMD variability was significantly increased by BAPN treatment, illustrated by the increased IQR in BAPN treated groups (Levene’s test for homogeneity of variance, p = 0.026).
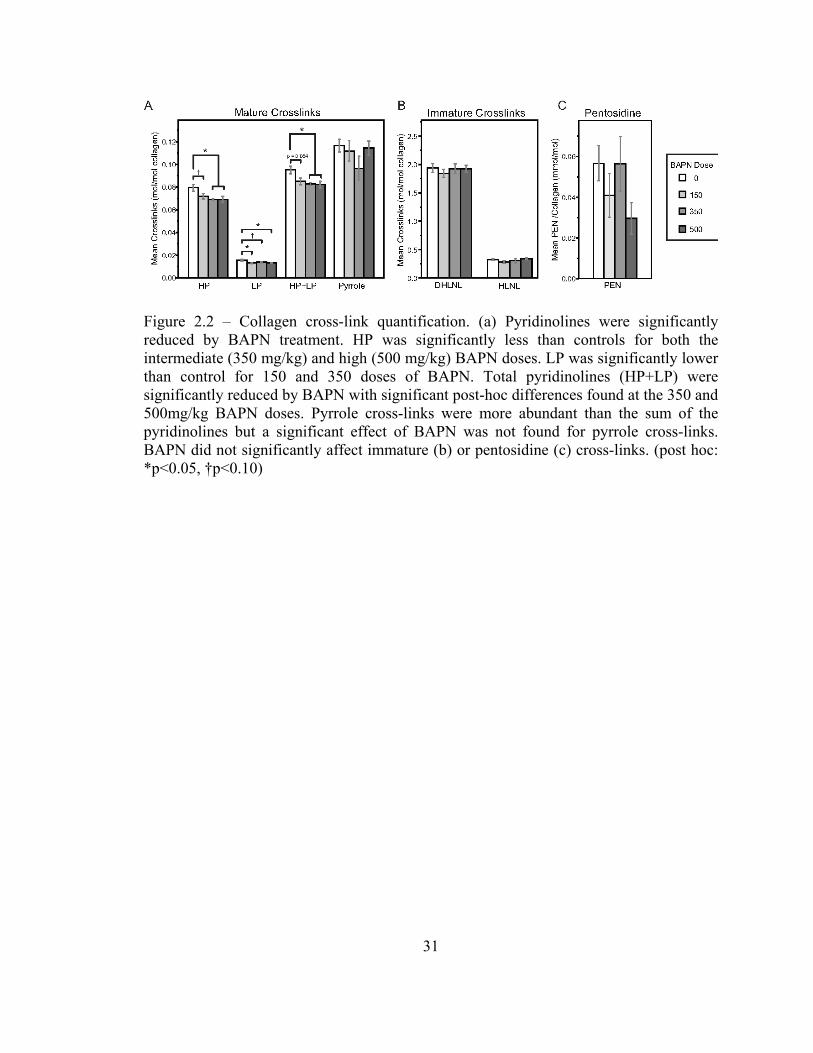
31
Figure 2.2 – Collagen cross-link quantification. (a) Pyridinolines were significantly reduced by BAPN treatment. HP was significantly less than controls for both the intermediate (350 mg/kg) and high (500 mg/kg) BAPN doses. LP was significantly lower than control for 150 and 350 doses of BAPN. Total pyridinolines (HP+LP) were significantly reduced by BAPN with significant post-hoc differences found at the 350 and 500mg/kg BAPN doses. Pyrrole cross-links were more abundant than the sum of the pyridinolines but a significant effect of BAPN was not found for pyrrole cross-links. BAPN did not significantly affect immature (b) or pentosidine (c) cross-links. (post hoc: *p<0.05, †p<0.10)

32
Figure 2.3 – Crosslink Ratios. (a) Relative cross-link maturity was significantly decreased with BAPN treatment when calculated using HP or (HP+LP) as the measure of mature cross-links, with 350 and 500 mg/kg dose groups significantly reduced compared to controls. (b) No significant differences were found for levels of hydroxylation (HP/LP, DHLNL/HLNL) or the ratio of pyrroles to pyridinolines. (*p<0.05)

33
Figure 2.4 – KC fracture toughness of the femur measured using a sharp-notched failure test. BAPN was a significant factor in maximum load toughness but not instability toughness. The greatest reductions in fracture toughness were seen at the intermediate (350mg/kg) BAPN dose. (*p<0.05)
34
Figure 2.5 – Whole bone (a-c) and tissue level (d-f) mechanical properties measured by 4 point bending of the tibia. Ultimate strength (b) was significantly reduced by BAPN with significant decreases detected for the 350 and 500 mg/kg groups. Yield strength (b) showed the same trend. Yield and ultimate stress were significantly reduced by BAPN. Specific group differences were found between the 0 and 350mg/kg doses. A marginally significant effect of BAPN on pre-yield toughness (f) was observed. No significant differences were detected for stiffness (a), pre-yield work (c), or modulus (d) . (*p<0.05, †p<0.10)
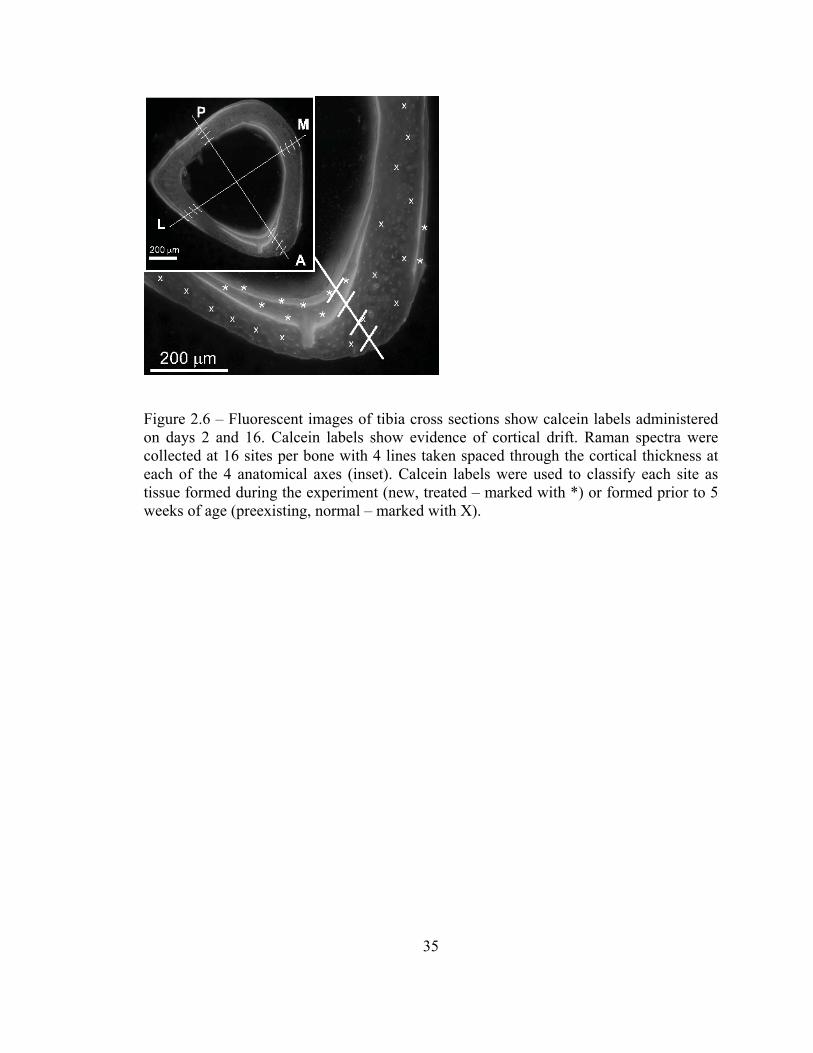
35
Figure 2.6 – Fluorescent images of tibia cross sections show calcein labels administered on days 2 and 16. Calcein labels show evidence of cortical drift. Raman spectra were collected at 16 sites per bone with 4 lines taken spaced through the cortical thickness at each of the 4 anatomical axes (inset). Calcein labels were used to classify each site as tissue formed during the experiment (new, treated – marked with *) or formed prior to 5 weeks of age (preexisting, normal – marked with X).

36
Figure 2.7 – Raman spectroscopy measures. New tissues had significantly lower mineral:matrix (a), carbonate:phosphate (b) and matrix maturity (1660/1683) ratio (c) compared to older, preexisting, tissues. Within new treated tissue, BAPN did not have significant effects on mineral measures but significantly increased the matrix maturity ratio (c). MC3T3-E1 cell culture matrix cultured with BAPN had increased 1660/1683 compared to control cultures (c). (* p<0.05)

37
Table 2-1 – Mouse Body Weight and Tibia Cortical Geometry Measures
BAPN Dose, mg/kg body weight
0 150 350 500 p* Body weight Day -2, g 15.4 (14.7-15.9) 15.4 (14.6-16.0) 15.3 (14.3-16.0) 15.2 (14.6-16.0) Day 18, g 20.4a (20.0-21.5) 20.8a (20.3-21.8) 20.6a (19.6-21.4) 19.1b (18.5-20.3) 0.028 Day 22, g 21.5a (20.1-22.2) 21.1a (19.9-22.1) 20.5 (19.4-21.2) 19.9b (18.9-20.9) 0.009 Tibia Length, mm 16.70 (16.56-16.79) 16.81 (16.58-16.88) 16.76 (16.45-16.90) 16.61 (16.42-16.81) TMC, µg HA 49.0a (47.7-52.1) 46.7a (44.9-51.1) 47.6 (45.5-49.7) 45.1b (44.0-47.4) 0.011 Ct.Area, mm2 0.543a (0.534-0.569) 0.532a (0.495-0.579) 0.529 (0.503-0.550) 0.503b (0.489-0.540) 0.013 Ct.Th, mm 0.163 (0.160-0.175) 0.161 (0.154-0.178) 0.163 (0.154-0.172) 0.157 (0.150-0.164) 0.052 IAP, mm4 0.051a (0.046-0.054) 0.049a (0.048-0.053) 0.046 (0.045-0.052) 0.044b (0.040-0.049) 0.007 IML, mm4 0.070a (0.065-0.081) 0.069 (0.059-0.078) 0.066 (0.057-0.077) 0.062b (0.051-0.067) 0.038 AP.W, mm 1.271 (1.219-1.351) 1.274 (1.193-1.343) 1.244 (1.194-1.317) 1.215 (1.154-1.267) 0.072 ML.W, mm 1.137 (1.104-1.157) 1.143 (1.119-1.157) 1.127 (1.104-1.140) 1.121 (1.084-1.147) 0.099 AP/ML ratio 1.108 (1.063-1.174) 1.113 (1.075-1.139) 1.115 (1.049-1.158) 1.095 (1.047-1.150) Data presented as Median (Interquartile range). *Effect of BAPN tested usingJonckheere-Terpstra non-parametric test; post hoc differences indicated as ‘b’ significantly different from ‘a’ (p < 0.05). TMC: tissue mineral content. HA: Hydroxyapatite. Ct.Area: cortical area. Ct.Th: cortical thickness. IAP: Moment of inertia about anterior-posterior axis. IML: Moment of inertia about medial-lateral axis. AP.W: Anterior-Posterior Width. ML.W: Medial-lateral Width.
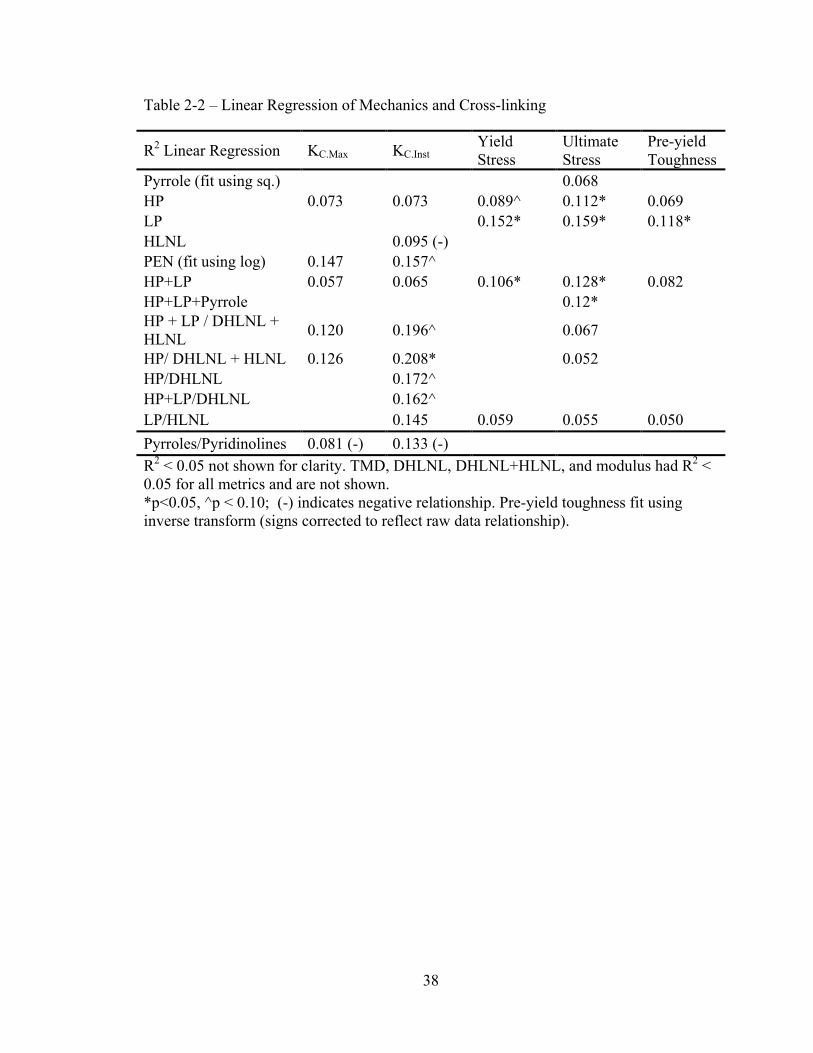
38
Table 2-2 – Linear Regression of Mechanics and Cross-linking
R2 Linear Regression KC.Max KC.Inst Yield Stress
Ultimate Stress
Pre-yield Toughness
Pyrrole (fit using sq.) 0.068 HP 0.073 0.073 0.089^ 0.112* 0.069 LP 0.152* 0.159* 0.118* HLNL 0.095 (-) PEN (fit using log) 0.147 0.157^ HP+LP 0.057 0.065 0.106* 0.128* 0.082 HP+LP+Pyrrole 0.12* HP + LP / DHLNL + HLNL 0.120 0.196^ 0.067 HP/ DHLNL + HLNL 0.126 0.208* 0.052 HP/DHLNL 0.172^ HP+LP/DHLNL 0.162^ LP/HLNL 0.145 0.059 0.055 0.050 Pyrroles/Pyridinolines 0.081 (-) 0.133 (-) R2 < 0.05 not shown for clarity. TMD, DHLNL, DHLNL+HLNL, and modulus had R2 < 0.05 for all metrics and are not shown. *p<0.05, ^p < 0.10; (-) indicates negative relationship. Pre-yield toughness fit using inverse transform (signs corrected to reflect raw data relationship).
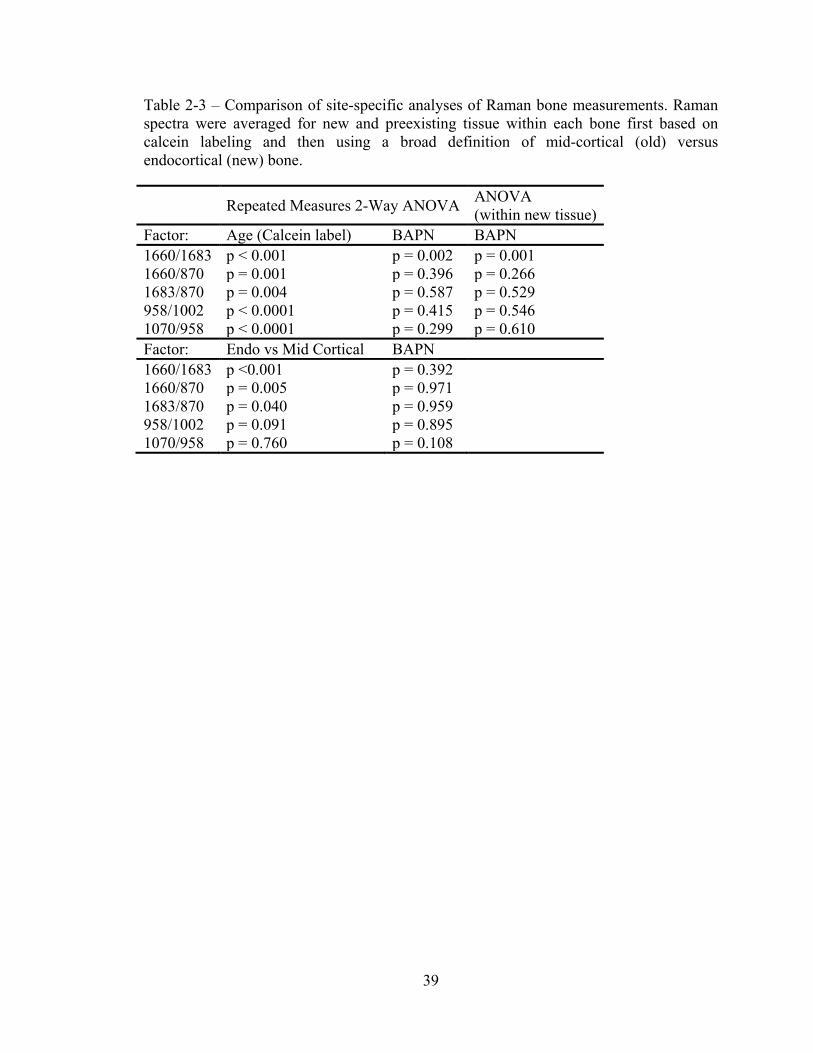
39
Table 2-3 – Comparison of site-specific analyses of Raman bone measurements. Raman spectra were averaged for new and preexisting tissue within each bone first based on calcein labeling and then using a broad definition of mid-cortical (old) versus endocortical (new) bone.
Repeated Measures 2-Way ANOVA ANOVA (within new tissue)
Factor: Age (Calcein label) BAPN BAPN 1660/1683 p < 0.001 p = 0.002 p = 0.001 1660/870 p = 0.001 p = 0.396 p = 0.266 1683/870 p = 0.004 p = 0.587 p = 0.529 958/1002 p < 0.0001 p = 0.415 p = 0.546 1070/958 p < 0.0001 p = 0.299 p = 0.610 Factor: Endo vs Mid Cortical BAPN 1660/1683 p <0.001 p = 0.392 1660/870 p = 0.005 p = 0.971 1683/870 p = 0.040 p = 0.959 958/1002 p = 0.091 p = 0.895 1070/958 p = 0.760 p = 0.108
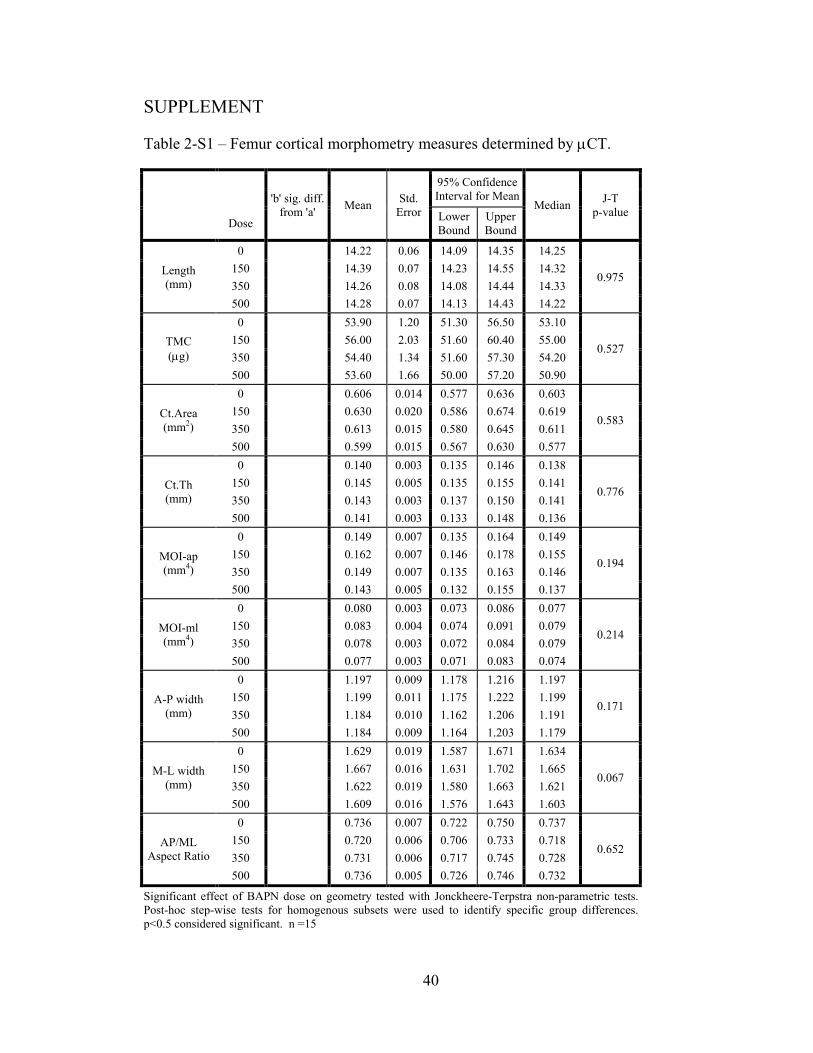
40
SUPPLEMENT
Table 2-S1 – Femur cortical morphometry measures determined by µCT.
'b' sig. diff.
from 'a' Mean Std. Error
95% Confidence Interval for Mean
Median J-T p-value
Dose Lower Bound
Upper Bound
Length (mm)
0 14.22 0.06 14.09 14.35 14.25
0.975 150 14.39 0.07 14.23 14.55 14.32 350 14.26 0.08 14.08 14.44 14.33 500 14.28 0.07 14.13 14.43 14.22
TMC (µg)
0 53.90 1.20 51.30 56.50 53.10
0.527 150 56.00 2.03 51.60 60.40 55.00 350 54.40 1.34 51.60 57.30 54.20 500 53.60 1.66 50.00 57.20 50.90
Ct.Area (mm2)
0 0.606 0.014 0.577 0.636 0.603
0.583 150 0.630 0.020 0.586 0.674 0.619 350 0.613 0.015 0.580 0.645 0.611 500 0.599 0.015 0.567 0.630 0.577
Ct.Th (mm)
0 0.140 0.003 0.135 0.146 0.138
0.776 150 0.145 0.005 0.135 0.155 0.141 350 0.143 0.003 0.137 0.150 0.141 500 0.141 0.003 0.133 0.148 0.136
MOI-ap (mm4)
0 0.149 0.007 0.135 0.164 0.149
0.194 150 0.162 0.007 0.146 0.178 0.155 350 0.149 0.007 0.135 0.163 0.146 500 0.143 0.005 0.132 0.155 0.137
MOI-ml (mm4)
0 0.080 0.003 0.073 0.086 0.077
0.214 150 0.083 0.004 0.074 0.091 0.079 350 0.078 0.003 0.072 0.084 0.079 500 0.077 0.003 0.071 0.083 0.074
A-P width (mm)
0 1.197 0.009 1.178 1.216 1.197
0.171 150 1.199 0.011 1.175 1.222 1.199 350 1.184 0.010 1.162 1.206 1.191 500 1.184 0.009 1.164 1.203 1.179
M-L width (mm)
0 1.629 0.019 1.587 1.671 1.634
0.067 150 1.667 0.016 1.631 1.702 1.665 350 1.622 0.019 1.580 1.663 1.621 500 1.609 0.016 1.576 1.643 1.603
AP/ML Aspect Ratio
0 0.736 0.007 0.722 0.750 0.737
0.652 150 0.720 0.006 0.706 0.733 0.718 350 0.731 0.006 0.717 0.745 0.728 500 0.736 0.005 0.726 0.746 0.732
Significant effect of BAPN dose on geometry tested with Jonckheere-Terpstra non-parametric tests. Post-hoc step-wise tests for homogenous subsets were used to identify specific group differences. p<0.5 considered significant. n =15
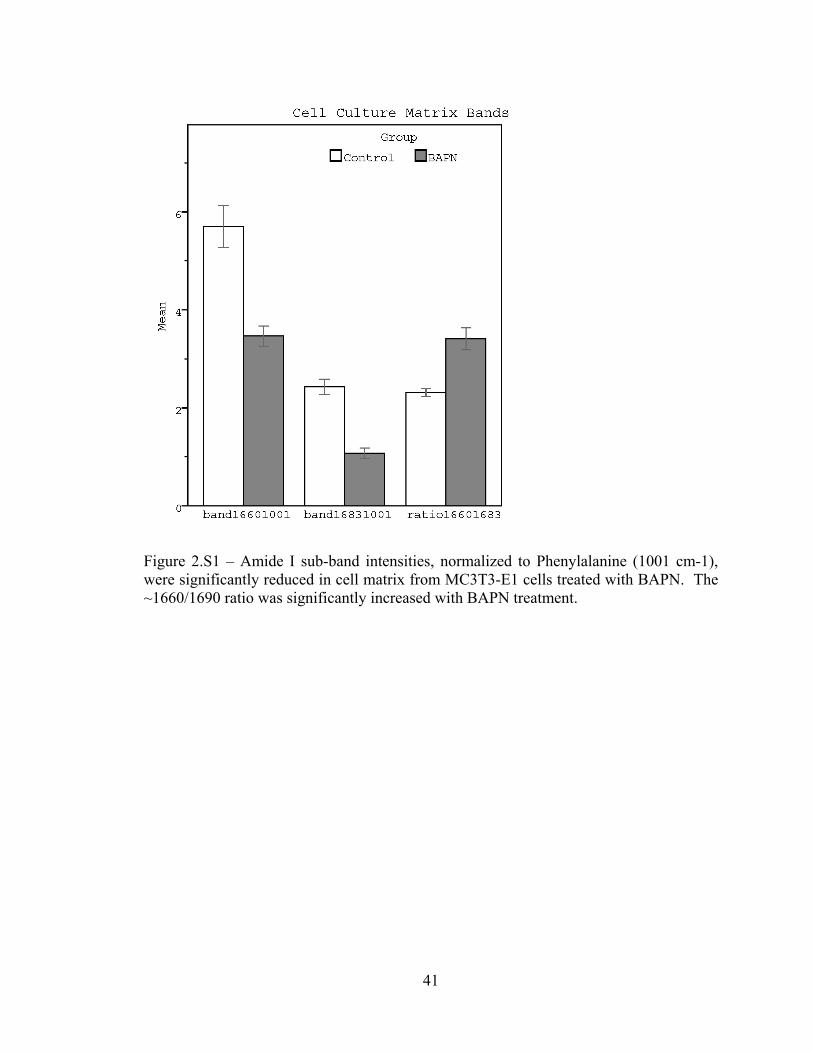
41
Figure 2.S1 – Amide I sub-band intensities, normalized to Phenylalanine (1001 cm-1), were significantly reduced in cell matrix from MC3T3-E1 cells treated with BAPN. The ~1660/1690 ratio was significantly increased with BAPN treatment.

42
Figure 2.S2 – Amide I sub-band intensities measured for embedded bone. ~1660 band was significantly reduced in younger tissue and showed trends of increasing with BAPN treatment. ~1690 was increased in new tissue and showed trends of increasing with BAPN treatment.

43
REFERENCES
1. Saito M, Marumo K. Collagen cross-links as a determinant of bone quality: a possible explanation for bone fragility in aging, osteoporosis, and diabetes mellitus. Osteoporos Int. 2010;21(2):195–214.
2. Donnelly E. Methods for Assessing Bone Quality: A Review. Clin Orthop Relat Res. 2010;469(8):2128–38.
3. Viguet-Carrin S, Garnero P, Delmas PD. The role of collagen in bone strength. Osteoporos Int. 2006;17(3):319–36.
4. Hanson DA, Eyre DR. Molecular Site Specificity of Pyridinoline and Pyrrole Cross-links in Type I Collagen of Human Bone. J Biol Chem. 1996;271(43):26508–16.
5. Eyre DR, Weis MA, Wu J-J. Advances in collagen cross-link analysis. Methods. 2008;45(1):65–74.
6. Knott L, Bailey AJ. Collagen cross-links in mineralizing tissues: a review of their chemistry, function, and clinical relevance. Bone. 1998;22(3):181–7.
7. Robins SP. The Separation of Cross-linking Components from Collagen. In: Hall DA, editor. The Methodology of Connective Tissue Research. Oxford: Joynson-Bruvvers; 1976. p. 37–52.
8. Bailey AJ, Sims TJ, Avery NC, Halligan EP. Non-enzymic glycation of fibrous collagen: reaction products of glucose and ribose. Biochem J. 1995;305 ( Pt 2:385–90.
9. Smith-Mungo LI, Kagan HM. Lysyl oxidase: properties, regulation and multiple functions in biology. Matrix Biol. 1998;16(7):387–98.
10. Paschalis EP, Shane E, Lyritis G, Skarantavos G, Mendelsohn R, Boskey AL. Bone fragility and collagen cross-links. J Bone Miner Res. 2004;19(12):2000–4.
11. Knott L, Whitehead CC, Fleming RH, Bailey AJ. Biochemical changes in the collagenous matrix of osteoporotic avian bone. Biochem J. 1995;310 ( Pt 3:1045–51.
12. Saito M, Fujii K, Mori Y, Marumo K. Role of collagen enzymatic and glycation induced cross-links as a determinant of bone quality in spontaneously diabetic WBN/Kob rats. Osteoporos Int. 2006;17(10):1514–23.
13. Burr DB. Bone material properties and mineral matrix contributions to fracture risk or age in women and men. J Musculoskelet Neuronal Interact. 2002;2(3):201–4.
44
14. Viguet-Carrin S, Roux JP, Arlot ME, et al. Contribution of the advanced glycation end product pentosidine and of maturation of type I collagen to compressive biomechanical properties of human lumbar vertebrae. Bone. 2006;39(5):1073–9.
15. Garnero P, Borel O, Gineyts E, et al. Extracellular post-translational modifications of collagen are major determinants of biomechanical properties of fetal bovine cortical bone. Bone. 2006;38(3):300–9.
16. Mccallum HM. Experimental Lathyrism in Mice. J Pathol Bacteriol. 1965;89:625–36.
17. Chvapil M, Misiorowski R, Eskelson C. On the mechanisms of beta-aminopropionitrile toxicity. J Surg Res. 1981;31(2):151–5.
18. Paschalis EP, Tatakis DN, Robins S, et al. Lathyrism-induced alterations in collagen cross-links influence the mechanical properties of bone material without affecting the mineral. Bone. Elsevier Inc.; 2011;49(6):1232–41.
19. Lees S, Eyre DR, Barnard SM. BAPN dose dependence of mature crosslinking in bone matrix collagen of rabbit compact bone: corresponding variation of sonic velocity and equatorial diffraction spacing. Connect Tissue Res. 1990;24(2):95–105.
20. Kohn RR, Leash AM. Long-term lathyrogen administration to rats, with special reference to aging. Exp Mol Pathol. 1967;7(3):354–61.
21. Di Cesare PE, Nimni ME, Yazdi M, Cheung DT. Effects of lathyritic drugs and lathyritic demineralized bone matrix on induced and sustained osteogenesis. J Orthop Res. 1994;12(3):395–402.
22. Lees S, Hanson D, Page E, Mook H. Comparison of dosage-dependent effects of beta-aminopropionitrile, sodium fluoride, and hydrocortisone on selected physical properties of cortical bone. J Bone Miner Res. 1994;9(9):1377–89.
23. Bouxsein ML, Boyd SK, Christiansen BA, Guldberg RE, Jepsen KJ, Müller R. Guidelines for assessment of bone microstructure in rodents using micro-computed tomography. J Bone Miner Res. 2010;25(7):1468–86.
24. Roberts HC, Knott L, Avery NC, Cox TM, Evans MJ, Hayman AR. Altered collagen in tartrate-resistant acid phosphatase (TRAP)-deficient mice: a role for TRAP in bone collagen metabolism. Calcif Tissue Int. 2007;80(6):400–10.
25. Brown S, Worsfold M, Sharp C. Microplate assay for the measurement of hydroxyproline in acid-hydrolyzed tissue samples. Biotechniques. 2001;30(1):38–40, 42.
26. Gineyts E, Borel O, Chapurlat R, Garnero P. Quantification of immature and mature collagen crosslinks by liquid chromatography-electrospray ionization
45
mass spectrometry in connective tissues. J Chromatogr B Analyt Technol Biomed Life Sci. 2010;878(19):1449–54.
27. Spacek P, Adam M. HPLC method for pentosidine determination in urine, serum, and tissues as a marker of glycation and oxidation loading of the organism. J Liq Chromatogr Relat Technol. 2002;25(12):1807–20.
28. Słowik-Zyłka D, Safranow K, Dziedziejko V, Bukowska H, Ciechanowski K, Chlubek D. A sensitive and specific HPLC method for the determination of total pentosidine concentration in plasma. J Biochem Biophys Methods. 2004;61(3):313–29.
29. Henle T, Schwarzenbolz U, Klostermeyer H. Detection and quantification of pentosidine in foods. Zeitschrift für Leb und -forsch A. 1997;204(2):95–8.
30. Gong B, Oest ME, Mann KA, Damron TA, Morris MD. Raman spectroscopy demonstrates prolonged alteration of bone chemical composition following extremity localized irradiation. Bone. Elsevier Inc.; 2013;57(1):252–8.
31. Fernandes H, Dechering K, Van Someren E, et al. The role of collagen crosslinking in differentiation of human mesenchymal stem cells and MC3T3-E1 cells. Tissue Eng Part A. 2009;15(12):3857–67.
32. Oxlund H, Barckman M, Ørtoft G, Andreassen T, Ortoft G. Reduced concentrations of collagen cross-links are associated with reduced strength of bone. Bone. 1995;17(4 Suppl):365S–371S.
33. Li J, Li H, Wang L, Zhang L, Jing Z. Comparison of beta-aminopropionitrile-induced aortic dissection model in rats by different administration and dosage. Vascular. 2013;21(5):287–92.
34. Farlay D, Duclos M-E, Gineyts E, et al. The ratio 1660/1690 cm(-1) measured by infrared microspectroscopy is not specific of enzymatic collagen cross-links in bone tissue. PLoS One. 2011;6(12):e28736.
35. Paschalis EP, Verdelis K, Doty SB, Boskey AL, Mendelsohn R, Yamauchi M. Spectroscopic characterization of collagen cross-links in bone. J Bone Miner Res. 2001;16(10):1821–8.
36. Carden A, Rajachar RM, Morris MD, Kohn DH. Ultrastructural changes accompanying the mechanical deformation of bone tissue: a Raman imaging study. Calcif Tissue Int. 2003;72(2):166–75.
37. Barth HD, Zimmermann EA, Schaible E, Tang SY, Alliston T, Ritchie RO. Characterization of the effects of x-ray irradiation on the hierarchical structure and mechanical properties of human cortical bone. Biomaterials. Elsevier Ltd; 2011;32(34):8892–904.

46
38. Kohn DH, Sahar ND, Wallace JM, Golcuk K, Morris MD. Exercise alters mineral and matrix composition in the absence of adding new bone. Cells Tissues Organs. 2009;189(1-4):33–7.
39. Zhu P, Xu J, Sahar N, Morris MD, Kohn DH, Ramamoorthy A. Time-resolved dehydration-induced structural changes in an intact bovine cortical bone revealed by solid-state NMR spectroscopy. J Am Chem Soc. 2009;131(47):17064–5.
40. Fleisher JH, Arem AJ, Chvapil M, Peacock EE. Metabolic disposition of beta-aminopropionitrile in the rat. Proc Soc Exp Biol Med. 1976;152(3):469–74.
41. Rosenquist J, Baylink D, Spengler D. The effect of beta-aminopropionitrile (BAPN) on bone mineralization. Proc Soc Exp Biol Med. 1977;154(2):310–3.
42. Martin RB, Ishida J. The relative effects of collagen fiber orientation, porosity, density, and mineralization on bone strength. J Biomech. 1989;22(5):419–26.
43. Ramasamy JG, Akkus O. Local variations in the micromechanical properties of mouse femur: the involvement of collagen fiber orientation and mineralization. J Biomech. 2007;40(4):910–8.
44. Hong H-H, Pischon N, Santana RB, et al. A role for lysyl oxidase regulation in the control of normal collagen deposition in differentiating osteoblast cultures. J Cell Physiol. 2004;200(1):53–62.
45. Gerstenfeld LC, Riva A, Hodgens K, Eyre DR, Landis WJ. Post-translational control of collagen fibrillogenesis in mineralizing cultures of chick osteoblasts. J Bone Miner Res. 1993;8(9):1031–43.
47
CHAPTER THREE: Interactive Effects of Cross-link Inhibition and Exercise
on Growing Bone
INTRODUCTION
The importance and control of the collagen cross-link profile of bone is an active area of
study, the consensus being that it is highly regulated to meet specific, but not fully
understood, functional purposes.(1–8) Recent advances in the characterization of collagen
cross-linking(9) and understanding of its enzymatic control(10–13) have reaffirmed that
cross-linking is a tightly controlled process, with specific patterns of hydroxylation,
location and quantity(14). Genetic alteration(1,6,10,15) or pharmaceutical inhibition(16,17) of
the cross-linking process is detrimental to bone quality. Shifts in cross-link profile also
occur with aging and many musculoskeletal pathologies(1,8,18–21), begging the question
whether the cross-link profile is simply a marker of the tissue dysfunction or a contributor
to corresponding increases in fracture risk(19,22–24).
Cross-link species and hydroxylation levels are carefully controlled, with human bone
collagen having a specific pattern of cross-links distributed at the N and C termini(9,25).
The types and quantities of cross-links formed are determined by lysyl hydroxlyase (LH)
and lysyl oxidase (LOX) enzyme activity, respectively. Three isoforms of LH are
known, LH1-3, with LH2 being a specific telopeptide hydroxylase that controls the
proportions of pyridinoline and pyrrole cross-links that form.(10,26–28) LOX also has
homologs, lysyl oxidase like proteins 1-4 (LOXL1-4), which may have tissue and/or
substrate specificity, but this possibility requires further study(13). LOX transforms
telopeptide lysine residues to reactive allysines, which are required precursors for cross-
link formation. Inhibition of LOX and LOXLs by β-aminopropionitrile (BAPN) reduces
cross-link formation(16,29–31), negatively impacting bone and soft connective tissue
mechanical integrity(32,33).
48
The importance of collagen cross-links to bone mechanical integrity is broadly
understood, but the importance of specific cross-link chemistries, degrees of
hydroxylation, maturities, and quantities is unknown. The careful regulation of these
subtleties implies a functional purpose. There is a general consensus that mature, trivalent
cross-links are greater contributors to bone strength than the less stable, divalent cross-
links(34). Yet, bone is unique in the persistence of large quantities of immature cross-link
species in mature tissues(14,35). Bone also is unique in its pyrrole cross-link content;
pyrroles are largely absent in cartilage(14). Pyrrole cross-links may be interfibrillar and
directly provide greater mechanical advantage(34,36). It is also possible that the balance of
pyrrole to pyridinoline cross-links, or their distribution at the N and C termini, is
important in the control of mineralization and mechanical properties of bone, as
suggested by decreases in mineralization observed with increased LH2 expression
causing increased pyridinoline levels (presumably accompanied by a decrease in
pyrroles)(1,37) and their molecular site specificities(25,38).
As tightly as cross-link profile is regulated, and with its association with bone quality, it
is plausible that cross-link profile has a role in bone’s adaptive responses to external cues
such as loading. The classic understanding of the effect of mechanical loading on bone is
that it promotes an anabolic bone formation response.(39) However, exercise can also
influence tissue quality, illustrated by improvements in mechanical properties and fatigue
resistance in the absence of significant new bone formation.(40,41) One indication that
quality was improved was that exercise protected against a fatigue-induced drop in the
Raman ~1660/1690 band area “cross-link” ratio. Further evidence that cross-link profile
is altered by changes in loading are that unloaded subchondral bone is cross-link deficient
compared to loaded bone,(42) and exercise has a positive influence on cross-link
production, with young rats showing increases in lysyl pyridinoline (LP) levels in
trabecular bone following 10 weeks of moderate running exercise.(43) However, little to
no data is available measuring bone collagen cross-link changes in response to loading in
which immature, pyridinoline and pyrrole cross-links as well as mechanical properties are
all evaluated, making it difficult to conclude whether the response to loading involves
changes in total cross-link quantity, maturation, hydroxylation, or perhaps all of these. I
hypothesized that modulation of specific aspects of bone cross-link profile (type,
49
hydroxylation and quantity) occurs in response to exercise, and, as a result of this
sensitivity, exercise has the potential to improve deleterious effects of cross-link
inhibition. In this study I explored: 1) whether the modulation of cross-link profile is a
part of bone’s response to exercise, 2) if changes to cross-link profile following exercise
or cross-link inhibition help explain changes in mechanical properties, and 3) whether
exercise can prevent reduced bone mechanical properties when superimposed on a
condition of cross-link deficiency.
METHODS
Animals
All animal procedures were approved by the University Committee on Use and Care of
Animals (UCUCA) at the University of Michigan. Male C57Bl6 mice (Charles River)
were weight matched at 5 weeks of age into five treatment groups: Baseline, PBS-
Sedentary, PBS-Exercise, BAPN-Sedentary and BAPN-Exercise (n=20, 100 animals
total). Baseline mice were sacrificed on experiment day 0 at 5 weeks of age. The
remaining groups received their assigned treatment for 3 weeks (experiment days 1-21).
PBS and BAPN treated mice received daily subcutaneous injections of PBS or 350mg
BAPN/kg (β-aminopropionitrile fumarate, Sigma Aldrich) in PBS, respectively. All
groups had access to normal cage activity; Exercise groups additionally ran 30 min/day
on a motorized treadmill (12m/min, 5 degree incline). Non-Baseline mice received
fluorochrome injections on experiment days 1 (alizarin complexone, 25mg/kg), 7
(calcein, 15mg/kg), 13 (xylenol orange, 90mg/kg) and 19 (tetracycline, 25mg/kg) and
were sacrificed by CO2 inhalation on day 22 at 8 weeks of age. Both tibiae were
immediately harvested, cleaned of soft tissue, and stored frozen in gauze soaked in
calcium buffered PBS.

50
Collagen Cross-link Quantification
Right tibia diaphyses were isolated, flushed of marrow, and used for quantification of
collagen cross-linking. Mature (HP, LP and pyrrole), reduced immature (DHLNL and
HLNL) and glycation (PEN) cross-links were all quantified from the same bone, and
normalized to collagen content, as described in Chapter 1 (n=12/group). In brief,
demineralized samples were reacted with sodium borohydride to reduce and stabilize the
immature cross-links. Reduced samples were digested with trypsin, and an aliquot of
digest was used for quantification of pyrrole cross-links by colorimetric assay in a 384
well plate. Remaining digest was acid hydrolyzed and used for hydroxyproline assay,
SPE column clean-up, and subsequent HPLC injection for quantification of HP, LP,
DHLNL, HLNL and PEN. PEN in these samples was at the detection limit and is not
presented.
µCT
Left tibiae (20/group) were embedded in 1% agarose, placed in a 19 mm diameter tube
and scanned by µCT over the entire length (µCT100 Scanco Medical, Bassersdorf,
Switzerland). Scan settings were: voxel size 12µm, 70kVp, 114µA, 0.5mm AL filter, and
integration time 500ms. Scans were reoriented using Scanco IPL to match the alignment
of each bone in silico with its eventual alignment during mechanical testing. A 19 slice
standard region of interest was taken from the mid diaphysis at the point 23% of the
distance from the tibia-fibula junction to the proximal end of the tibia. This site, located
near the center of the mechanical testing span, was used for quantification of bone
geometry and mineral density. Thus, the cortical site analyzed was reproducible across
samples and appropriate for calculating tissue level properties using classic beam theory.
Geometry, TMC and TMD were measured using a fixed threshold of 276 “per mille”
(equal to a linear attenuation coefficient of 2.21 [1/cm]).

51
4-Point Bending
Following µCT–scanning, left tibiae (n=20/group) were tested in 4 point bending on an
eXpert 450 Universal Testing Machine (Admet; Norwood, MA) as described.(44) Bones
were hydrated with Ca-buffered PBS at all times, oriented with the medial surface in
tension (bending about the anterior-posterior axis) and loaded at a displacement rate of
0.025mm/s (loading span: 3mm, support span: 9mm). Using beam theory and the
standard site cross-sectional geometry measured by µCT, recorded load and displacement
data were normalized to stress and strain. Both whole bone (load, displacement) and
tissue level (stress, strain) properties were quantified at the yield and ultimate points.
Yield was defined from the stress-strain curve using the 0.2% strain offset method.
Whole bone stiffness and tissue elastic modulus were calculated by linear regression
fitting of the linear-elastic pre-yield region. Pre-yield work and pre-yield toughness
(resilience) were calculated as the area under the load-displacement and stress-strain
curves, respectively, up to the previously defined yield point.
Embedding, Sectioning, and Imaging of Fluorochrome Labels
Following mechanical testing, left tibiae (n=6-8) from non-Baseline groups were
dehydrated in a graded ethanol series, cleared with Clear-Rite 3 (Thermo Scientific), and
infiltrated and embedded using Koldmount (SPI supplies). Sections ~150µm thick were
cut from the mid-diaphysis near the failure site using a low-speed sectioning saw (Model
650; South Bay Technology, San Clemente, CA) with a diamond wafering blade (Mager
Scientific). Sections were mounted on glass slides and hand ground and polished using
wet silicon carbide paper to a final thickness of 75-100µm. Fluorochrome labels were
imaged on a Nikon E800 fluorescence light microscope equipped with a FITC filter and
Photometrics coolsnap monochrome camera. Areas of new bone growth were
distinguished from pre-existing tissue by the location and order of fluorochrome labeling.
New and total bone areas were quantified using ImageJ software.

52
Statistics
Statistical analyses were performed using SigmaStat and SPSS software. The effects of
skeletal maturation during sham treatment on TMD, cross-link and mechanical measures
were tested by comparing PBS-Sedentary to Baseline with Student t-tests or with non-
parametric Mann-Whitney U tests. In the case of mouse and bone size parameters, where
it was of interest to confirm that all 8 week old groups grew significantly from Baseline,
one way ANOVA with Holm-Sidak post-hoc testing was used to compare each of the
four treatment groups to Baseline. Main factor and interaction effects of BAPN and
Exercise across the non-Baseline groups were tested by two-way ANOVA with Holm-
Sidak post-hoc testing between all groups. Relationships between mineral, cross-link and
tissue-level mechanical properties were tested using Pearson correlation and step-wise
multiple linear regression. Correlations were performed with and without the Baseline
group included. In all analyses, p<0.05 was considered significant, and p<0.1 was
considered marginally significant. The letters B and E noted on figures indicate ANOVA
main factor effects of BAPN and Exercise, respectively. Significant interactions are
noted as BxE.
RESULTS
Exercise and BAPN Reduce Mouse and Bone Growth
Mice in all groups sacrificed at 8 weeks of age significantly grew in bodyweight and tibia
size compared to Baseline (Table 3.1). Exercise and BAPN both significantly reduced
final mouse weight (Factors tested by 2-way ANOVA, p<0.001 and p=0.010
respectively), but only exercise had a statistically significant effect on tibia length,
cortical area, cortical thickness, and bending moment of inertia about the medial-lateral
axis (Table 3.1). The lack of significant effects of BAPN and Exercise on the bending
moment about the anterior-posterior axis, as well as the averaged traced cortical
morphometry (Figure 3.1), illustrate that the greatest differences in bone size are
attributable to differences in cortical expansion along the anterior-posterior axis. There

53
were no significant changes in the percentage of cortical tissue formed during BAPN
and/or exercise treatment (Table 3.1).
TMD was significantly increased from Baseline (Figure 3.2) with a marginally significant
interaction between BAPN and exercise treatments. PBS-Exercise had significantly
greater TMD than PBS-Sedentary, and BAPN-Sedentary had marginally increased TMD
compared to PBS-Sedentary controls.
Cross-link Maturity Increased from Baseline in Sedentary-PBS Controls
Total mature cross-links were increased in the 8-week old PBS-Sedentary mice compared
to 5-week old Baseline mice (Figure 3.3G), reflecting significant and partially significant
increases in pyrrole (F) and pyridinolines (C), respectively. In the absence of significant
changes in the immature cross-links (D, E, H), the ratio of mature to immature cross-links
was significantly increased (Figure 3.4A) from Baseline in PBS-Sedentary mice.
Exercise and BAPN have Interactive Effects on Mature Cross-linking
The effects of BAPN and Exercise on enzymatic cross-link content differed and included
significant interactions (Figure 3.3A-I). Overall, BAPN caused a reduction of cross-
linking with significant factor effects for LP (B), HLNL (E), Pyrrole (F), and total mature
cross-links (G). Exercise countered the negative effects of BAPN on pyridinoline content;
BAPN-Exercise mice had significantly increased HP, LP and total pyridinolines
compared to BAPN-Sedentary mice (A-C). Exercise did not alter total mature cross-links
in PBS treated mice but countered the negative effect of BAPN, with BAPN-Exercise
mice having significantly more mature cross-links than BAPN-Sedentary mice (G).
Exercise alone increased pyridinoline cross-links, with significant factor effects on HP
(A) and total pyridinoline (C). Exercise and BAPN both significantly reduced pyrrole as
separate treatments, but pyrrole content was not further decreased by BAPN in exercised
mice (F).
54
BAPN and Exercise Differentially Modulate Cross-link Maturity and Hydroxylation
Causing a greater reduction of mature than immature cross-links (Figure 3.3), BAPN
significantly reduced the ratio of mature to immature cross-links in sedentary mice
(Figure 3.4A). In addition, BAPN increased helical lysine hydroxylation of cross-links,
having significant factor effects on pyridinoline (Figure 3.4B) and immature (Figure
Figure 3.4D) cross-link hydroxylation. In contrast, exercise did not alter pyridinoline or
immature cross-link hydroxylation but increased the ratio of pyridinoline to pyrrole
cross-links (Figure 3.4C). A shift from pyrrole to pyridinoline formation reflects an
increase in telopeptide lysine hydroxylation.(25)
Exercise Counteracts BAPN-Induced Reductions of Modulus and Increases of Yield Strain
Whole bone mechanical properties (Figure 3.5) largely reflected differences in tissue
level properties (Figure 3.6). PBS-Sedentary bones gained both structural (Figure 3.5A-
C) and material (Figure 3.6A-C) stiffness and strength over Baseline. BAPN significantly
reduced bone stiffness (Figure 3.5A) and tissue modulus (Figure 3.6A). However, post
hoc tests revealed only significant differences in stiffness and modulus from BAPN
treatment in sedentary mice, showing a partial rescue effect by exercise superimposed on
BAPN treatment. BAPN also reduced yield strength at both the structural (Figure 3.5B)
and material (Figure 3.6B) levels. Exercise had negative effects on whole bone strength
(Figure 3.5C) and pre-yield work (Figure 3.6D), but, at the tissue level, exercise had only
a marginally significant effect on ultimate stress (Figure 3.6C). BAPN significantly
increased bone yield deformation (Figure 3.5E) and strain (Figure 3.6E), but only in
sedentary mice. In both PBS and BAPN-treated exercised mice, yield and ultimate
deformation (Figure 3.5E-F) and strain (Figure 3.6E-F) were not significantly different
from PBS-Sedentary.
Mature Cross-links Correlate with Modulus and Strength across Age Groups
Correlations between cross-links and mechanical properties (Table 3.2) were first run
with the Baseline group included in the analysis. With both age groups represented,
55
mature cross-links and relative cross-link maturity were associated with increased
modulus, increased strength and reduced strain. Specifically, pyrrole, LP, total mature
cross-links, and the ratio of mature to immature cross-links were significant positive
correlates of modulus. Significant positive correlates of yield stress included TMD, total
pyridinolines, HP, and the ratio of mature to immature cross-links; TMD also positively
correlated with ultimate stress and pre-yield toughness. TMD and HP/LP were significant
positive correlates of yield strain. In addition, immature cross-links, and quantities largely
dictated by them (e.g. Total Enyzmatic), were negative correlates of strength and
modulus. Specifically, DHLNL, HLNL, total immature, and total enzymatic cross-links
were negative correlates of yield stress, ultimate stress and pre-yield toughness, and
DHLNL and total immature cross-links were marginally significant negative correlates of
modulus.
Pyrrole Cross-links Significantly Predict Modulus and Strain in 8 Week-old Groups
Correlations (Table 3.2) were also run with the Baseline group excluded to examine the
relationships between cross-linking, TMD, and mechanical properties without the
confounding effect of tissue maturity. Within treatment groups sacrificed at 8 weeks of
age, TMD had no significant correlation with any mechanical property. In contrast,
pyrrole, total mature and HLNL were significant positive correlates of modulus. No
cross-links were significant correlates of tissue strength within the 8 week groups, but
yield strain was significantly negatively related to pyrrole, LP, total mature, and HLNL
cross-links. Total immature and total enzymatic cross-links were marginally significant
negative correlates of strain. Pyridinoline hydroxylation (HP/LP) was a marginally
significant positive correlate of yield strain and significant negative correlate of modulus.
Thus, within the 8 week old treatment groups, higher levels of the less hydroxylated
cross-links (pyrrole, LP and HLNL) were associated with tissues having a higher rigidity
and lower yield strain.
Stepwise linear regression was also tested for prediction of tissue level mechanical
properties. All cross-link measures, as well as TMD, were available for entry into the
model. However, in all cases, only pyrrole was included in the stepwise model (or no
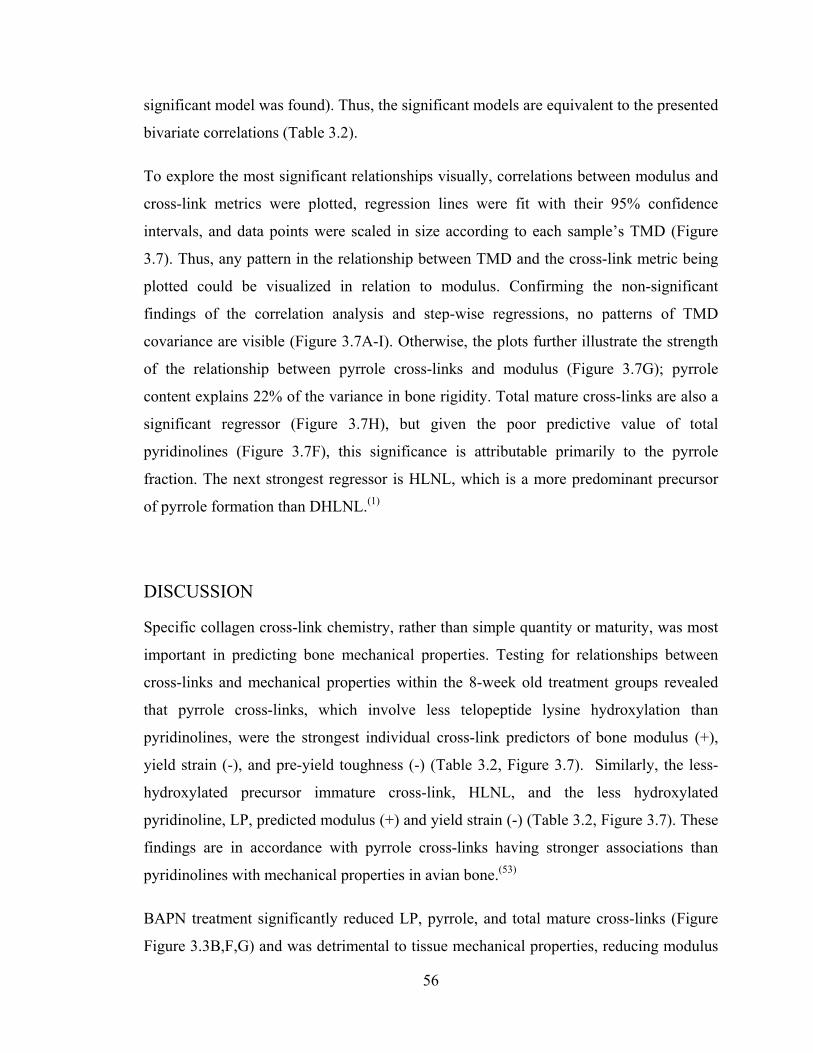
56
significant model was found). Thus, the significant models are equivalent to the presented
bivariate correlations (Table 3.2).
To explore the most significant relationships visually, correlations between modulus and
cross-link metrics were plotted, regression lines were fit with their 95% confidence
intervals, and data points were scaled in size according to each sample’s TMD (Figure
3.7). Thus, any pattern in the relationship between TMD and the cross-link metric being
plotted could be visualized in relation to modulus. Confirming the non-significant
findings of the correlation analysis and step-wise regressions, no patterns of TMD
covariance are visible (Figure 3.7A-I). Otherwise, the plots further illustrate the strength
of the relationship between pyrrole cross-links and modulus (Figure 3.7G); pyrrole
content explains 22% of the variance in bone rigidity. Total mature cross-links are also a
significant regressor (Figure 3.7H), but given the poor predictive value of total
pyridinolines (Figure 3.7F), this significance is attributable primarily to the pyrrole
fraction. The next strongest regressor is HLNL, which is a more predominant precursor
of pyrrole formation than DHLNL.(1)
DISCUSSION
Specific collagen cross-link chemistry, rather than simple quantity or maturity, was most
important in predicting bone mechanical properties. Testing for relationships between
cross-links and mechanical properties within the 8-week old treatment groups revealed
that pyrrole cross-links, which involve less telopeptide lysine hydroxylation than
pyridinolines, were the strongest individual cross-link predictors of bone modulus (+),
yield strain (-), and pre-yield toughness (-) (Table 3.2, Figure 3.7). Similarly, the less-
hydroxylated precursor immature cross-link, HLNL, and the less hydroxylated
pyridinoline, LP, predicted modulus (+) and yield strain (-) (Table 3.2, Figure 3.7). These
findings are in accordance with pyrrole cross-links having stronger associations than
pyridinolines with mechanical properties in avian bone.(53)
BAPN treatment significantly reduced LP, pyrrole, and total mature cross-links (Figure
Figure 3.3B,F,G) and was detrimental to tissue mechanical properties, reducing modulus
57
and increasing yield strain, despite marginally increased TMD (Figure 3.2). Exercise
superimposed on BAPN treatment counteracted these mechanical changes, improving the
decreased modulus (Figure 3.6A) and abolishing the increased yield strain (Figure 3.6E).
BAPN Exercise mice did not have increased TMD compared to BAPN Sedentary mice to
explain these improvements (Figure 3.2), but exercise did increase the number of HP, LP,
total pyridinoline, and total mature cross-links (Figure 3.3A-C,G), as well as relative
cross-link maturity (Figure 3.4A) in BAPN treated bones. Thus, although pyrrole cross-
links were the best predictor of tissue modulus and yield strain across all groups, the
ability of exercise to counter the mechanical effects of cross-link inhibition may be
attributable to an increase in total mature cross-links.
The dogma in explaining the mechanical properties of bone is that the mineral controls
pre-yield rigidity and strength, and the organic matrix provides bone its post-yield
properties and toughness. The results of this study challenge the blanket nature of this
concept. Tissue mineral density did not significantly correlate with any mechanical
property within 8-week old mice, whereas collagen cross-links were significant
predictors of tissue modulus, yield strain and pre-yield toughness.
I found differing relationships between cross-link measures and mechanical properties
when testing across ages (5 and 8 weeks) versus within treated 8 week old mice alone
(Table 3.2). Correlations including the Baseline group demonstrated effects of tissue
maturation rather than more subtle relationships of cross-links and mechanics. For
example, yield strength was positively correlated with TMD and mature cross-links, both
of which increased significantly with maturation, and was negatively related to immature
cross-links, which decreased from the 5 week baseline to 8 week endpoint for PBS-
Sedentary mice. It is unlikely that having more immature cross-links inherently makes
the bone less strong, rather they are a covariate of other measures, such as TMD, which
also scale with tissue maturation.
The results of this study related pyrrole and its precursor crosslinks to tissue modulus,
reduced strain and reduced pre-yield toughness; thus, increases in pyrrole predicted an
increase in rigidity with yield occurring at a fixed stress after less energy absorbtion. In
58
contrast, in Chapter 2, pyridinoline crosslinks were correlated with strength and, as part
of a maturity ratio, fracture instability toughness. Thus, pyridinolines predicted the stress
needed to initiate yield or crack propagation. Mice in both studies were ordered from
Charles River by age, but mice with different mean bodyweights were received. One
possibility is that the larger baseline mean body weight (17.9 ± 1.1g vs. 15.3 ± 1.0g) in
this study caused BAPN treatment to be imposed during a later phase of tissue
development and maturation, so that bone strength may have been more developed and
less dependent on cross-links to define tissue strength. On this point, the comparisons
between Baseline and PBS-Sedentary bones in this study highlight the rapidity with
which cross-link and mechanical properties are established in this young tissue. It is also
possible that differences in the findings of these studies stem from the differences in the
ranges of cross-links produced by the differing treatments.
I used young, growing mice in this study to ensure that sufficient amounts of new bone
would be formed during the course of BAPN treatment. One concern was that reduced
growth from BAPN or exercise treatment could skew the fractions of cross-link-inhibited
and normal tissue found in the final bone sample. However, the percent new cortical
tissue area, measured from images of embedded cross-sections using the injected
fluorescent labeling of mineralizing surfaces to identify new tissue areas,, was not
significantly different across groups, with the bones of all groups comprised of >25%
new tissue. A second concern was the order of treatment each day and whether effective
BAPN dose might be altered by exercise. The fact that immature and total enzymatic
crosslinks (HLNL, DHLNL, total immature and total enzymatic crosslinks) were equally
reduced in BAPN Sedentary and BAPN Exercise groups is supportive of successful and
similar BAPN dosing in these groups. Mice were injected with BAPN within 60 minutes
after the completion of exercise each day. I chose to perform injection after exercise to
minimize loss of BAPN by diuresis or increased agitation of the subcutaneous injection
site while exercising.
Without direct knowledge of the metabolism of BAPN in mice, how BAPN clearance
might change in an exercising mouse, and lysyl oxidase expression patterns in response
to exercise, I must speculate as to whether this model represents exercise having a
59
preventative or rescue effect of BAPN crosslink inhibition. BAPN reduces cross-linking
by covalently binding and inhibiting the LOX active site; exercise could potentially
counter this effect by promoting LOX expression to levels greater than the BAPN dose is
capable of inhibiting or by promoting the maturation of immature to mature cross-links in
order to offset the losses from BAPN treatment. Importantly, both the collagen cross-link
quantification and mechanical tests were performed on the same volume of tissue, using
the whole diaphyses of contralateral bones from the same mice. Thus, the significant and
specific correlations between cross-links and mechanical properties identified herein
maintain their significance whether or not they resulted from exactly the intended model
of cross-link inhibition and exercise interaction.
There were increases in relative pyridinoline and immature cross-link lysine
hydroxylation following BAPN treatment (Figure 3.4B,D). In PBS treated mice, exercise
alone did not alter total mature (Figure 3.3G) or immature (Figure 3.3H) cross-link
quantities but did increase the ratio of pyridinoline to pyrrole cross-links (Figure 3.4C).
Increases in LH1 and LH2 expression in response to BAPN and exercise treatment,
respectively, could explain these shifts. It is interesting to consider the possible role of
hypoxia-inducible factor 1 (HIF-1) in directing these observed cross-link changes. HIF-1
is upregulated by osteoblasts and osteocytes in response to fluid flow and down-regulates
the anabolic response of bone to loading.(45) In turn, both LH1 and LH2 expression are
upregulated by HIF-1 in fibroblasts,(46,47) and LOX is upregulated by HIF-1 at the mRNA
level.(48) Thus, it is possible that HIF-1 limits the quantity of new bone formed in
response to exercise while concurrently influencing the quality and quantity of collagen
cross-linking in this new bone.
In human bone, pyridinoline cross-links form approximately equally at the N and C-
termini, but greater levels of LP and pyrrole cross-links occur at the N terminus.(25) This
site specific distribution of cross-link species and levels of hydroxylation may play roles
in mineralization and could contribute differently to mechanical properties due to
differences in molecular packing and cross-link connectivity at these sites.(1,25,49,50) An
improved ability of pyrrole cross-links compared to pyridinolines to form interfibrillar

60
linkages could explain the positive relationship between pyrrole crosslinks and modulus
(Table 3.2, Figure 3.7G), since interfibrillar crosslinks would better resist fibril sliding,
increasing tissue rigidity. Alternatively, alterations in fibril diameter or packing are
means by which cross-linking profile could affect mechanical properties.(51) Increasing
LH2 expression in MC3T3 cells increased pyridinoline, delayed mineralization and
reduced collagen fibril diameter despite otherwise normal markers of differentiation.(27,37)
In contrast, BAPN treatment increased the median and broadened the distribution of
collagen fibril diameter in chick osteoblast cell culture.(52) The possibility that BAPN is
similarly increasing fibril diameter in vivo and exercise counteracts the mechanical
effects of BAPN by controlling fibril diameter through increased pyridinoline cross-
linking is deserving of further study.
In conclusion, this study demonstrates the dynamic nature of collagen cross-linking in
bone, with nearly all aspects of measured cross-link profile displaying sensitivity to both
exercise and cross-link inhibition. Continued efforts to understand the cellular
mechanisms underlying this responsiveness and to better define the parameter space that
defines the “desirable” cross-link profile for bone will provide potential strategies to
control and optimize cross-linking for improved bone quality.
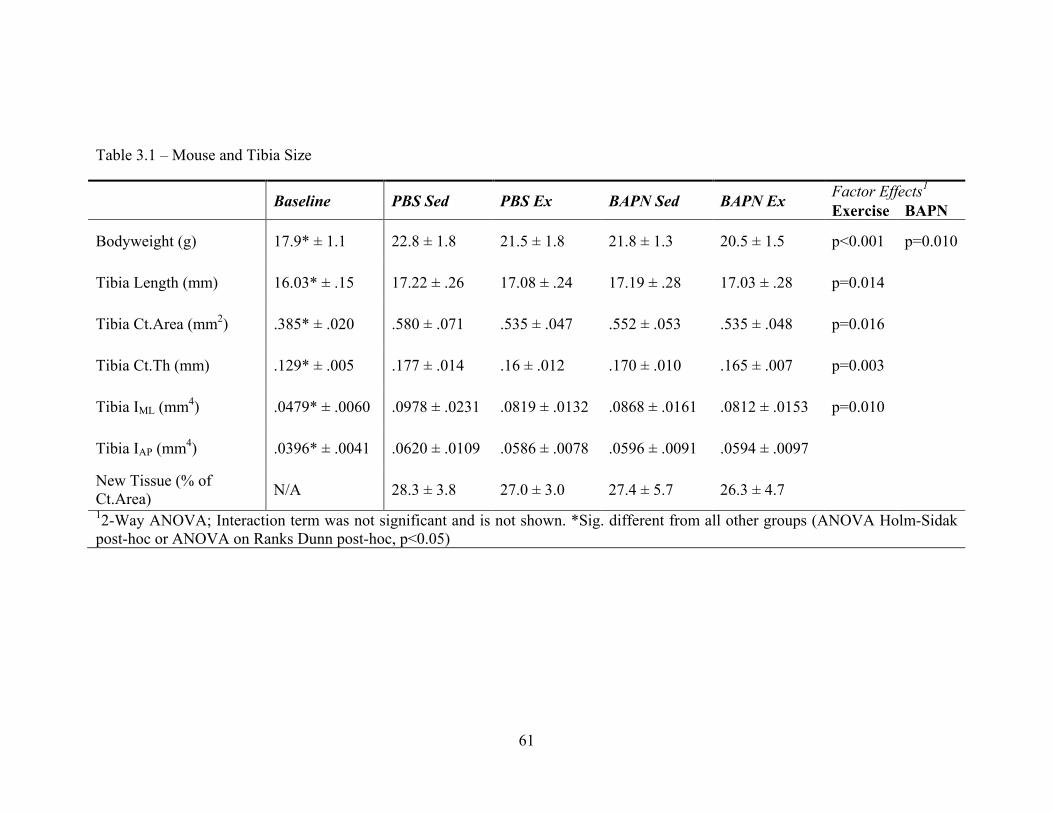
61
Table 3.1 – Mouse and Tibia Size
Baseline PBS Sed PBS Ex BAPN Sed BAPN Ex Factor Effects1 Exercise BAPN
Bodyweight (g) 17.9* ± 1.1 22.8 ± 1.8 21.5 ± 1.8 21.8 ± 1.3 20.5 ± 1.5 p<0.001 p=0.010
Tibia Length (mm) 16.03* ± .15 17.22 ± .26 17.08 ± .24 17.19 ± .28 17.03 ± .28 p=0.014
Tibia Ct.Area (mm2) .385* ± .020 .580 ± .071 .535 ± .047 .552 ± .053 .535 ± .048 p=0.016
Tibia Ct.Th (mm) .129* ± .005 .177 ± .014 .16 ± .012 .170 ± .010 .165 ± .007 p=0.003
Tibia IML (mm4) .0479* ± .0060 .0978 ± .0231 .0819 ± .0132 .0868 ± .0161 .0812 ± .0153 p=0.010
Tibia IAP (mm4) .0396* ± .0041 .0620 ± .0109 .0586 ± .0078 .0596 ± .0091 .0594 ± .0097
New Tissue (% of Ct.Area) N/A 28.3 ± 3.8 27.0 ± 3.0 27.4 ± 5.7 26.3 ± 4.7 12-Way ANOVA; Interaction term was not significant and is not shown. *Sig. different from all other groups (ANOVA Holm-Sidak post-hoc or ANOVA on Ranks Dunn post-hoc, p<0.05)
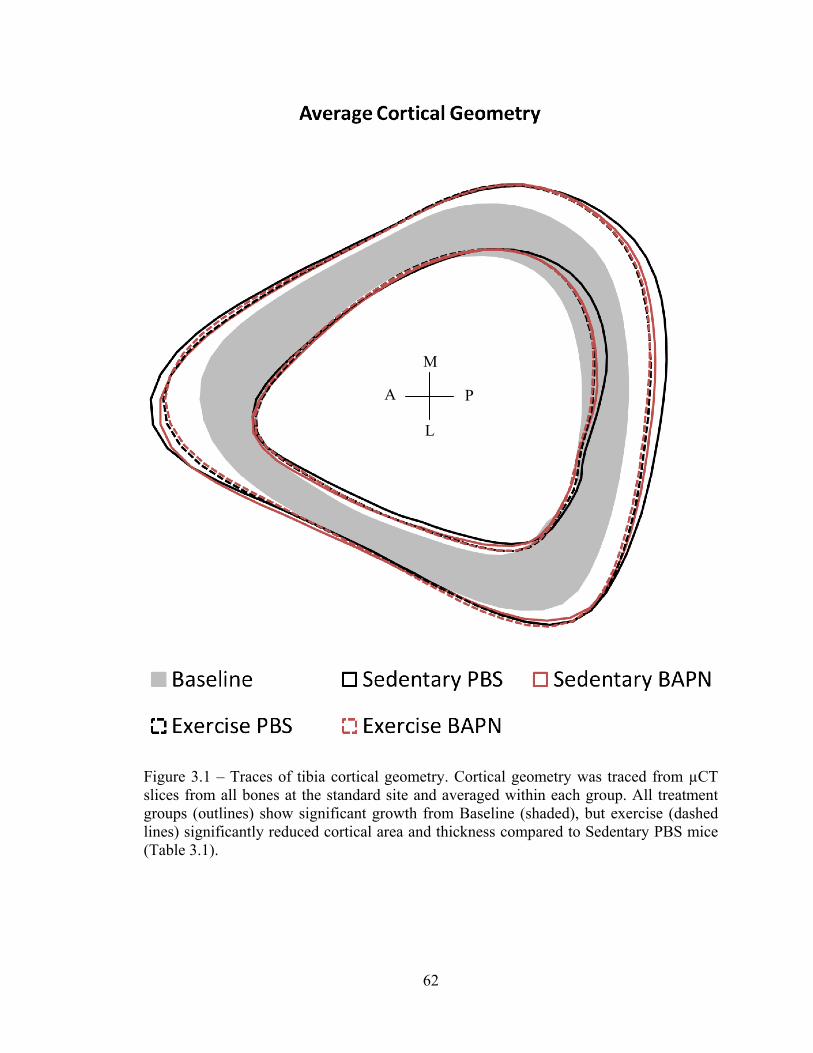
62
Figure 3.1 – Traces of tibia cortical geometry. Cortical geometry was traced from µCT slices from all bones at the standard site and averaged within each group. All treatment groups (outlines) show significant growth from Baseline (shaded), but exercise (dashed lines) significantly reduced cortical area and thickness compared to Sedentary PBS mice (Table 3.1).
A P
M
L
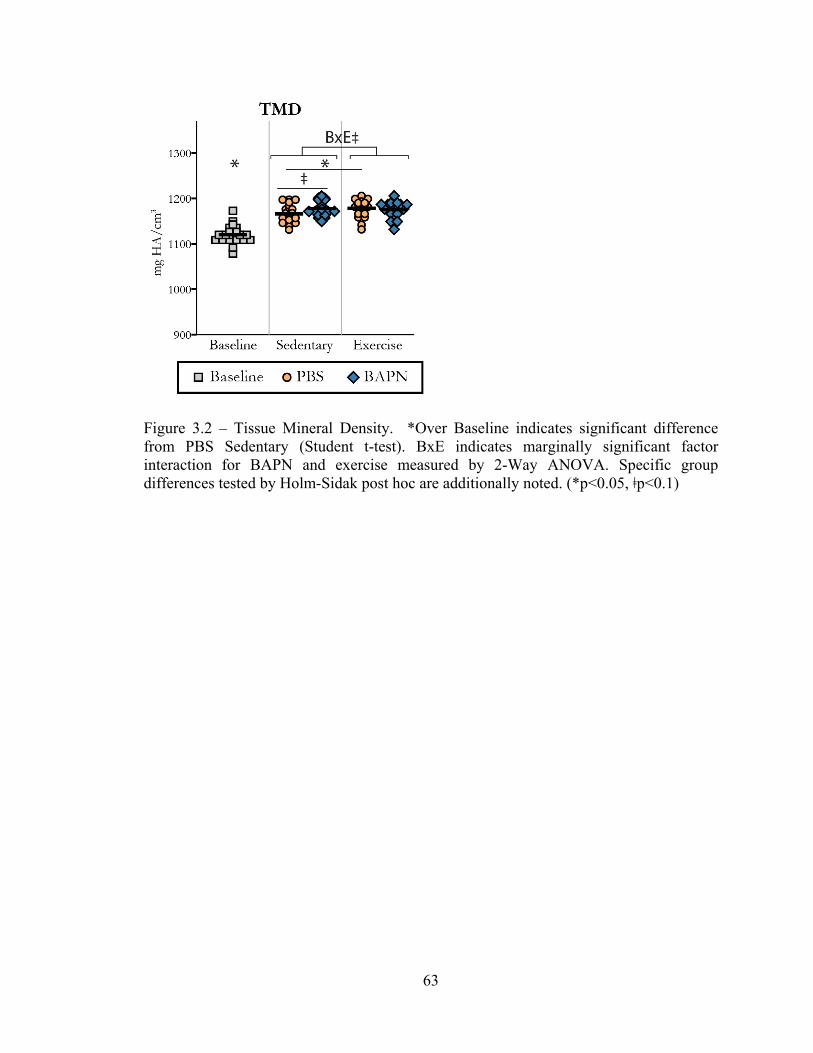
63
Figure 3.2 – Tissue Mineral Density. *Over Baseline indicates significant difference from PBS Sedentary (Student t-test). BxE indicates marginally significant factor interaction for BAPN and exercise measured by 2-Way ANOVA. Specific group differences tested by Holm-Sidak post hoc are additionally noted. (*p<0.05, ǂp<0.1)
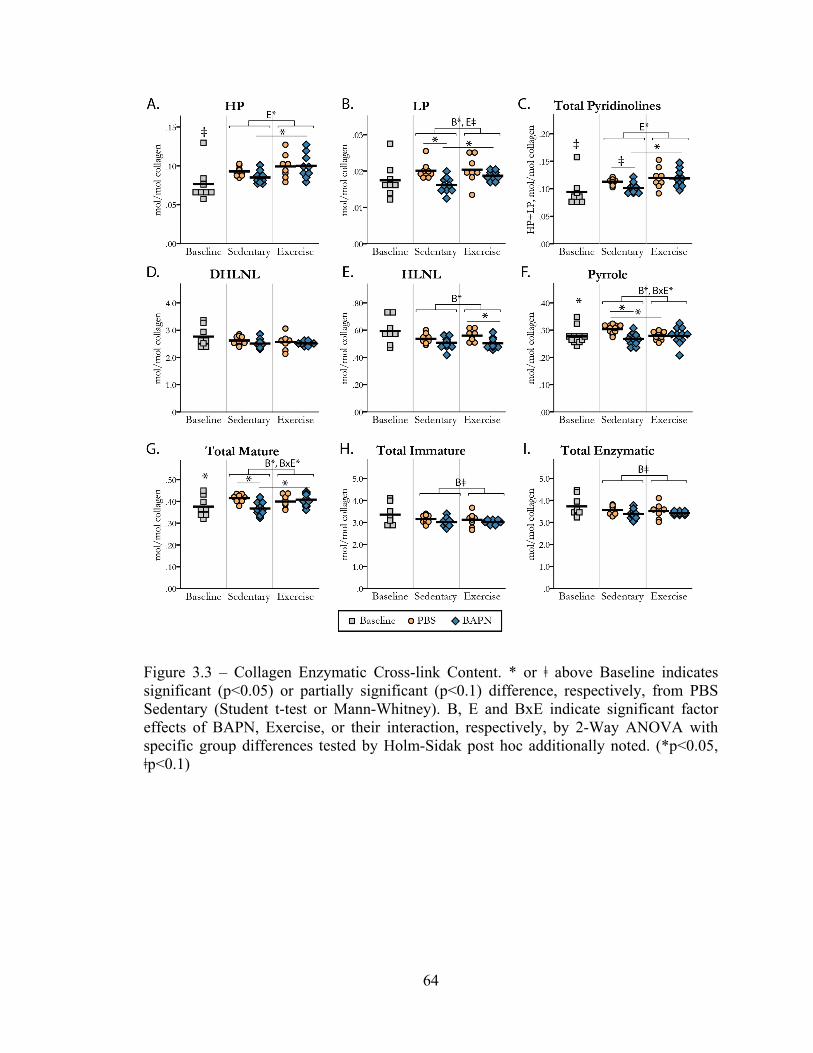
64
Figure 3.3 – Collagen Enzymatic Cross-link Content. * or ǂ above Baseline indicates significant (p<0.05) or partially significant (p<0.1) difference, respectively, from PBS Sedentary (Student t-test or Mann-Whitney). B, E and BxE indicate significant factor effects of BAPN, Exercise, or their interaction, respectively, by 2-Way ANOVA with specific group differences tested by Holm-Sidak post hoc additionally noted. (*p<0.05, ǂp<0.1)

65
Figure 3.4 – Cross-link Profile Ratios. * or ǂ above Baseline indicates significant (p<0.05) or partially significant (p<0.1) difference, respectively, from PBS Sedentary (Student t-test or Mann-Whitney). B, E and BxE indicate significant factor effects of BAPN, Exercise, or their interaction, respectively, by 2-Way ANOVA with specific group differences tested by Holm-Sidak post hoc additionally noted. (*p<0.05, ǂp<0.1)
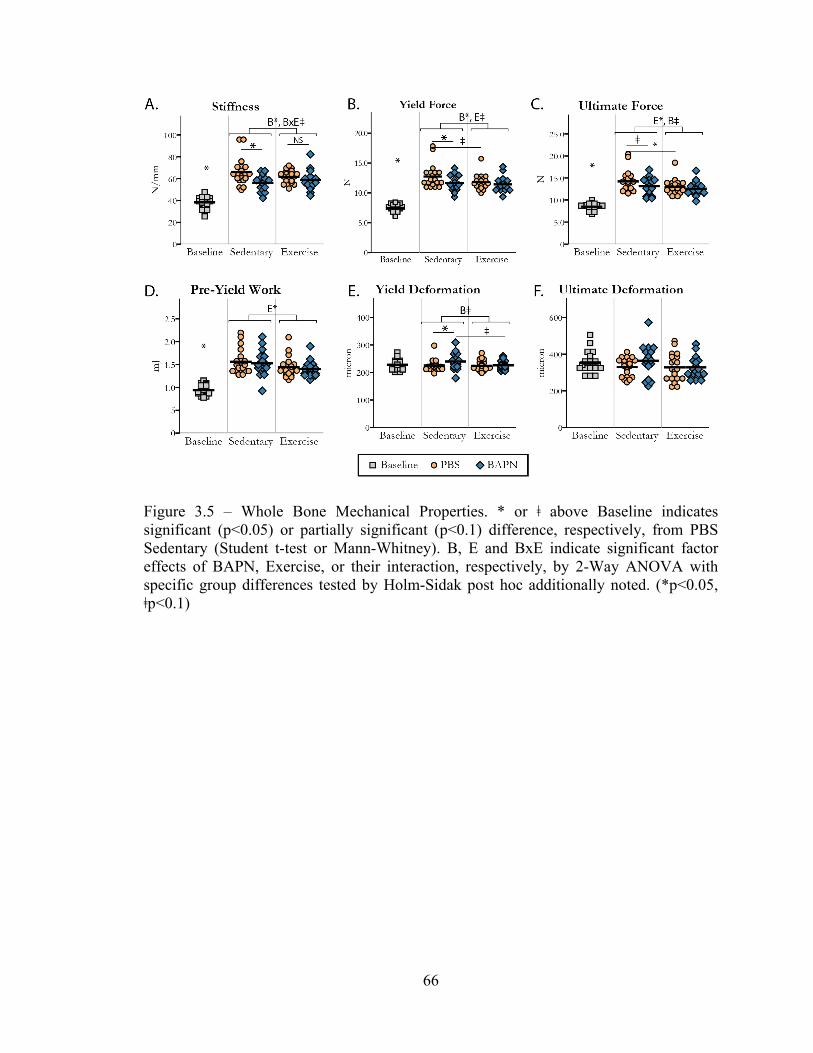
66
Figure 3.5 – Whole Bone Mechanical Properties. * or ǂ above Baseline indicates significant (p<0.05) or partially significant (p<0.1) difference, respectively, from PBS Sedentary (Student t-test or Mann-Whitney). B, E and BxE indicate significant factor effects of BAPN, Exercise, or their interaction, respectively, by 2-Way ANOVA with specific group differences tested by Holm-Sidak post hoc additionally noted. (*p<0.05, ǂp<0.1)

67
Figure 3.6 – Tissue Level Mechanical Properties. * or ǂ above Baseline indicates significant (p<0.05) or partially significant (p<0.1) difference, respectively, from PBS Sedentary (Student t-test or Mann-Whitney). B, E and BxE indicate significant factor effects of BAPN, Exercise, or their interaction, respectively, by 2-Way ANOVA with specific group differences tested by Holm-Sidak post hoc additionally noted. (*p<0.05, ǂp<0.1)
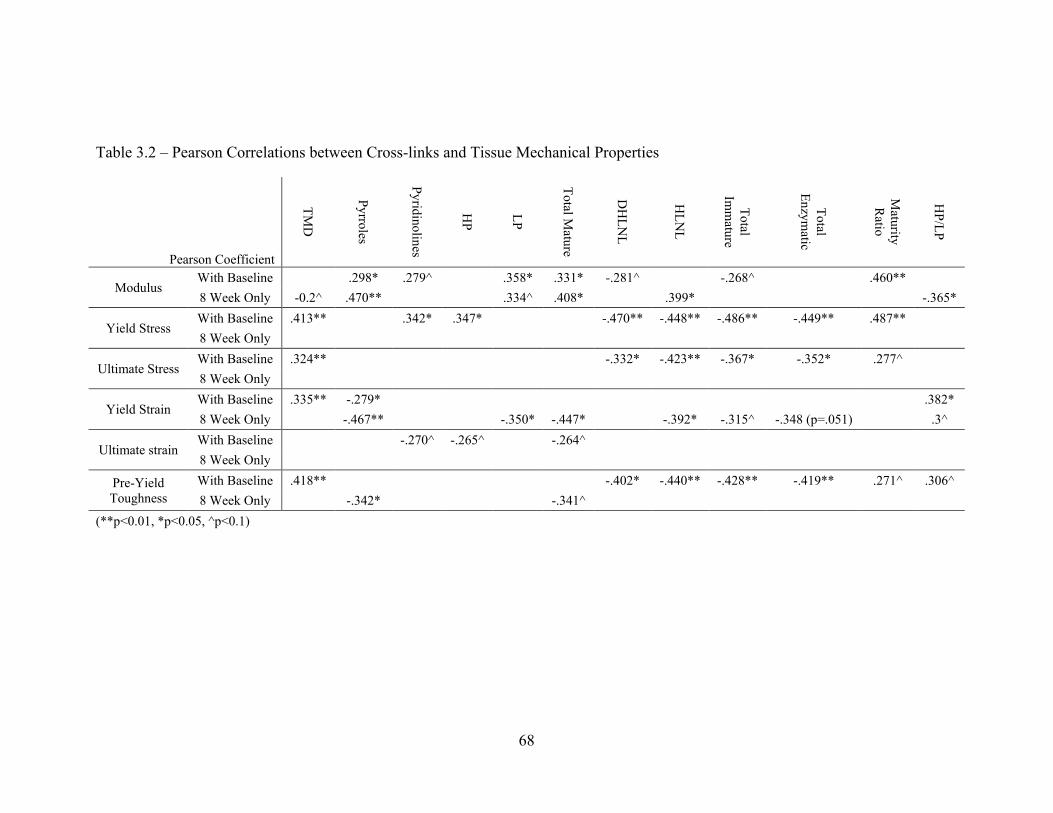
68
Table 3.2 – Pearson Correlations between Cross-links and Tissue Mechanical Properties
Pearson Coefficient
TMD
Pyrroles
Pyridinolines
HP
LP
Total Mature
DH
LNL
HLN
L
Total Im
mature
Total Enzym
atic
Maturity R
atio
HP/LP
Modulus With Baseline .298* .279^ .358* .331* -.281^ -.268^ .460** 8 Week Only -0.2^ .470** .334^ .408* .399* -.365*
Yield Stress With Baseline .413** .342* .347* -.470** -.448** -.486** -.449** .487** 8 Week Only
Ultimate Stress With Baseline .324** -.332* -.423** -.367* -.352* .277^ 8 Week Only
Yield Strain With Baseline .335** -.279* .382* 8 Week Only -.467** -.350* -.447* -.392* -.315^ -.348 (p=.051) .3^
Ultimate strain With Baseline -.270^ -.265^ -.264^ 8 Week Only
Pre-Yield Toughness
With Baseline .418** -.402* -.440** -.428** -.419** .271^ .306^ 8 Week Only -.342* -.341^
(**p<0.01, *p<0.05, ^p<0.1)
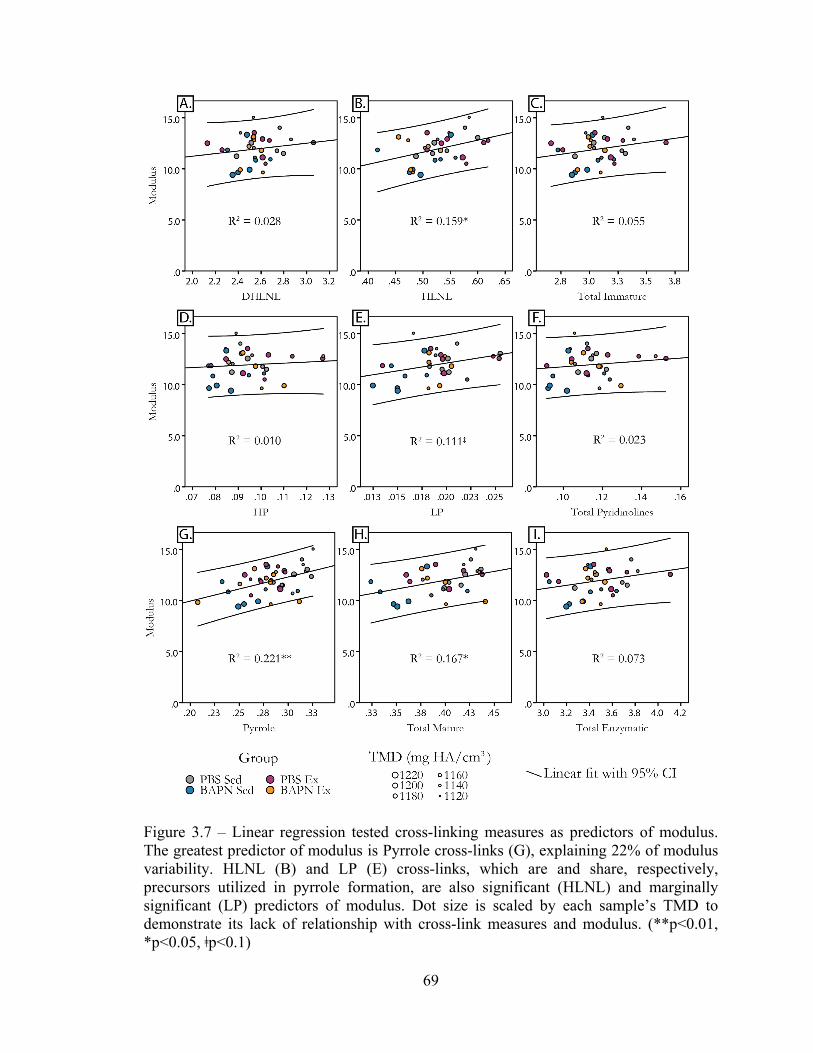
69
Figure 3.7 – Linear regression tested cross-linking measures as predictors of modulus. The greatest predictor of modulus is Pyrrole cross-links (G), explaining 22% of modulus variability. HLNL (B) and LP (E) cross-links, which are and share, respectively, precursors utilized in pyrrole formation, are also significant (HLNL) and marginally significant (LP) predictors of modulus. Dot size is scaled by each sample’s TMD to demonstrate its lack of relationship with cross-link measures and modulus. (**p<0.01, *p<0.05, ǂp<0.1)
70
REFERENCES
1. Eyre DR, Weis MA. Bone collagen: new clues to its mineralization mechanism from recessive osteogenesis imperfecta. Calcif Tissue Int. 2013;93(4):338–47.
2. Karim L, Tang S, Sroga G, Vashishth D. Differences in non-enzymatic glycation and collagen cross-links between human cortical and cancellous bone. Osteoporos Int. 2013;
3. Buehler MJ. Nanomechanics of collagen fibrils under varying cross-link densities: atomistic and continuum studies. J Mech Behav Biomed Mater. 2008;1(1):59–67.
4. Turecek C, Fratzl-Zelman N, Rumpler M, et al. Collagen cross-linking influences osteoblastic differentiation. Calcif Tissue Int. Springer New York; 2008;82(5):392–400.
5. Willems NMBK, Mulder L, Bank RA, et al. Determination of the relationship between collagen cross-links and the bone-tissue stiffness in the porcine mandibular condyle. J Biomech. 2011;44(6):1132–6.
6. Puig-Hervás MT, Temtamy S, Aglan M, et al. Mutations in PLOD2 cause autosomal-recessive connective tissue disorders within the Bruck syndrome--osteogenesis imperfecta phenotypic spectrum. Hum Mutat. 2012;33(10):1444–9.
7. Schwarze U, Cundy T, Pyott SM, et al. Mutations in FKBP10, which result in Bruck syndrome and recessive forms of osteogenesis imperfecta, inhibit the hydroxylation of telopeptide lysines in bone collagen. Hum Mol Genet. 2013;22(1):1–17.
8. Saito M, Marumo K. Collagen cross-links as a determinant of bone quality: a possible explanation for bone fragility in aging, osteoporosis, and diabetes mellitus. Osteoporos Int. 2010;21(2):195–214.
9. Eyre DR, Weis MA, Wu J-J. Advances in collagen cross-link analysis. Methods. 2008;45(1):65–74.
10. Van der Slot AJ, Zuurmond A-M, Bardoel AFJ, et al. Identification of PLOD2 as telopeptide lysyl hydroxylase, an important enzyme in fibrosis. J Biol Chem. 2003;278(42):40967–72.
11. Uzawa K, Grzesik WJ, Nishiura T, et al. Differential expression of human lysyl hydroxylase genes, lysine hydroxylation, and cross-linking of type I collagen during osteoblastic differentiation in vitro. J Bone Miner Res. 1999;14(8):1272–80.
12. Sricholpech M, Perdivara I, Nagaoka H, Yokoyama M, Tomer KB, Yamauchi M. Lysyl hydroxylase 3 glucosylates galactosylhydroxylysine residues in type I collagen in osteoblast culture. J Biol Chem. 2011;286(11):8846–56.
71
13. Lucero HA, Kagan HM. Lysyl oxidase: an oxidative enzyme and effector of cell function. Cell Mol life Sci. 2006;63(19-20):2304–16.
14. Robins SP, Brady JD. Collagen Cross-Linking and Metabolism. In: Bilezikian JP, Raisz LG, Martin TJ, editors. Principles of Bone Biology. 3rd ed. San Diego: Academic Press; 2008. p. 319–34.
15. Eyre D, Shao P, Weis MA, Steinmann B. The kyphoscoliotic type of Ehlers-Danlos syndrome (type VI): differential effects on the hydroxylation of lysine in collagens I and II revealed by analysis of cross-linked telopeptides from urine. Mol Genet Metab. 2002;76(3):211–6.
16. Barrow M V, Simpson CF, Miller EJ. Lathyrism: a review. Q Rev Biol. 1974;49(2):101–28.
17. Di Cesare PE, Nimni ME, Yazdi M, Cheung DT. Effects of lathyritic drugs and lathyritic demineralized bone matrix on induced and sustained osteogenesis. J Orthop Res. 1994;12(3):395–402.
18. Avery NC, Bailey a J. Enzymic and non-enzymic cross-linking mechanisms in relation to turnover of collagen: relevance to aging and exercise. Scand J Med Sci Sport. 2005;15(4):231–40.
19. Saito M, Fujii K, Mori Y, Marumo K. Role of collagen enzymatic and glycation induced cross-links as a determinant of bone quality in spontaneously diabetic WBN/Kob rats. Osteoporos Int. 2006;17(10):1514–23.
20. Remst DFG, Blaney Davidson EN, Vitters EL, et al. Osteoarthritis-related fibrosis is associated with both elevated pyridinoline cross-link formation and lysyl hydroxylase 2b expression. Osteoarthritis Cartilage. Elsevier Ltd; 2013;21(1):157–64.
21. Bank RA, Tekoppele JM, Janus GJ, et al. Pyridinium cross-links in bone of patients with osteogenesis imperfecta: evidence of a normal intrafibrillar collagen packing. J Bone Miner Res. 2000;15(7):1330–6.
22. Paschalis EP, Shane E, Lyritis G, Skarantavos G, Mendelsohn R, Boskey AL. Bone fragility and collagen cross-links. J Bone Miner Res. 2004;19(12):2000–4.
23. Saito M, Fujii K, Marumo K. Degree of mineralization-related collagen crosslinking in the femoral neck cancellous bone in cases of hip fracture and controls. Calcif Tissue Int. 2006;79(3):160–8.
24. Saito M, Fujii K, Soshi S, Tanaka T. Reductions in degree of mineralization and enzymatic collagen cross-links and increases in glycation-induced pentosidine in the femoral neck cortex in cases of femoral neck fracture. Osteoporos Int. 2006;17(7):986–95.
72
25. Hanson DA, Eyre DR. Molecular Site Specificity of Pyridinoline and Pyrrole Cross-links in Type I Collagen of Human Bone. J Biol Chem. 1996;271(43):26508–16.
26. Salo AM, Sipilä L, Sormunen R, Ruotsalainen H, Vainio S, Myllylä R. The lysyl hydroxylase isoforms are widely expressed during mouse embryogenesis, but obtain tissue- and cell-specific patterns in the adult. Matrix Biol. 2006;25(8):475–83.
27. Pornprasertsuk S, Duarte WR, Mochida Y, Yamauchi M. Lysyl hydroxylase-2b directs collagen cross-linking pathways in MC3T3-E1 cells. J Bone Miner Res. 2004;19(8):1349–55.
28. Yamauchi M, Sricholpech M. Lysine post-translational modifications of collagen. Essays Biochem. 2012;52:113–33.
29. Trackman PC. Diverse biological functions of extracellular collagen processing enzymes. J Cell Biochem. 2005;96(5):927–37.
30. Ito H, Akiyama H, Iguchi H, et al. Molecular cloning and biological activity of a novel lysyl oxidase-related gene expressed in cartilage. J Biol Chem. 2001;276(26):24023–9.
31. Borel A, Eichenberger D, Farjanel J, et al. Lysyl oxidase-like protein from bovine aorta. Isolation and maturation to an active form by bone morphogenetic protein-1. J Biol Chem. 2001;276(52):48944–9.
32. Oxlund H, Barckman M, Ørtoft G, Andreassen T, Ortoft G. Reduced concentrations of collagen cross-links are associated with reduced strength of bone. Bone. 1995;17(4 Suppl):365S–371S.
33. Brüel A, Ortoft G, Oxlund H. Inhibition of cross-links in collagen is associated with reduced stiffness of the aorta in young rats. Atherosclerosis. 1998;140(1):135–45.
34. Knott L, Bailey AJ. Collagen cross-links in mineralizing tissues: a review of their chemistry, function, and clinical relevance. Bone. 1998;22(3):181–7.
35. Gineyts E, Borel O, Chapurlat R, Garnero P. Quantification of immature and mature collagen crosslinks by liquid chromatography-electrospray ionization mass spectrometry in connective tissues. J Chromatogr B Analyt Technol Biomed Life Sci. 2010;878(19):1449–54.
36. Knott L, Bailey AJ. Collagen biochemistry of avian bone: comparison of bone type and skeletal site. Br Poult Sci. 1999;40(3):371–9.

73
37. Pornprasertsuk S, Duarte WR, Mochida Y, Yamauchi M. Overexpression of lysyl hydroxylase-2b leads to defective collagen fibrillogenesis and matrix mineralization. J Bone Miner Res. 2005;20(1):81–7.
38. Kuypers R, Tyler M, Kurth LB, Jenkins ID, Horgan DJ. Identification of the loci of the collagen-associated Ehrlich chromogen in type I collagen confirms its role as a trivalent cross-link. Biochem J. 1992;283 ( Pt 1(I 992):129–36.
39. Turner CH, Robling AG. Exercise as an anabolic stimulus for bone. Curr Pharm Des. 2004;10(21):2629–41.
40. Wallace JM, Ron MS, Kohn DH. Short-term exercise in mice increases tibial post-yield mechanical properties while two weeks of latency following exercise increases tissue-level strength. Calcif Tissue Int. 2009;84(4):297–304.
41. Kohn DH, Sahar ND, Wallace JM, Golcuk K, Morris MD. Exercise alters mineral and matrix composition in the absence of adding new bone. Cells Tissues Organs. 2009;189(1-4):33–7.
42. Brama PA, Bank RA, Tekoppele JM, Weeren P, Van Weeren PR. Training affects the collagen framework of subchondral bone in foals. Vet J. 2001;162(1):24–32.
43. Salem GJ, Zernicke RF, Martinez DA, Vailas AC. Adaptations of immature trabecular bone to moderate exercise: geometrical, biochemical, and biomechanical correlates. Bone. 1993;14(4):647–54.
44. Wallace JM, Golcuk K, Morris MD, Kohn DH. Inbred strain-specific response to biglycan deficiency in the cortical bone of C57BL6/129 and C3H/He mice. J Bone Miner Res. 2009;24(6):1002–12.
45. Riddle RC, Leslie JM, Gross TS, Clemens TL. Hypoxia-inducible Factor-1 Protein Negatively Regulates Load-induced Bone Formation. J Biol Chem. 2011;286(52):44449–56.
46. Hofbauer K-H, Gess B, Lohaus C, Meyer HE, Katschinski D, Kurtz A. Oxygen tension regulates the expression of a group of procollagen hydroxylases. Eur J Biochem. 2003;270(22):4515–22.
47. Gilkes DM, Bajpai S, Chaturvedi P, Wirtz D, Semenza GL. Hypoxia-inducible factor 1 (HIF-1) promotes extracellular matrix remodeling under hypoxic conditions by inducing P4HA1, P4HA2, and PLOD2 expression in fibroblasts. J Biol Chem. 2013;288(15):10819–29.
48. Erler JT, Bennewith KL, Nicolau M, et al. Lysyl oxidase is essential for hypoxia-induced metastasis. Nature. 2006;440(7088):1222–6.
74
49. Wassen MH, Lammens J, Tekoppele JM, et al. Collagen structure regulates fibril mineralization in osteogenesis as revealed by cross-link patterns in calcifying callus. J Bone Miner Res. 2000;15(9):1776–85.
50. Yamauchi M, Katz EP. The post-translational chemistry and molecular packing of mineralizing tendon collagens. Connect Tissue Res. 1993;29(2):81–98.
51. Christiansen DL, Huang EK, Silver FH. Assembly of type I collagen: fusion of fibril subunits and the influence of fibril diameter on mechanical properties. Matrix Biol. 2000;19(5):409–20.
52. Gerstenfeld LC, Riva A, Hodgens K, Eyre DR, Landis WJ. Post-translational control of collagen fibrillogenesis in mineralizing cultures of chick osteoblasts. J Bone Miner Res. 1993;8(9):1031–43.
53. Knott L, Whitehead CC, Fleming RH, Bailey AJ. Biochemical changes in the collagenous matrix of osteoporotic avian bone. Biochem J. 1995;310 ( Pt 3:1045–51.

75
CHAPTER FOUR: Conclusions and Future Work
RELATIONSHIP OF CROSS-LINKS TO BONE MECHANICAL PROPERTIES
The complexity of bone as a composite and living material makes it difficult to define
universally applicable rules for relationships between its composition and mechanical
properties. Despite this, the “rule of thumb” in explaining the mechanical properties of
bone is that the mineral controls pre-yield rigidity and strength, and the organic matrix
provides bone its post-yield properties and toughness. The results presented in Chapters 2
and 3 challenge the blanket nature of this concept. Notably, tissue mineral density did not
significantly correlate with any mechanical property within 8-week old mice in either
study. Instead, strength and rigidity were associated with pyridinoline (Chapter 2) and
pyrrole (Chapter 3) content, respectively. TMD did predict tissue strength when 5-week
old mice, with lower TMD than their older counterparts, were included in the analysis
(Chapter 3). Yet, even in this case, the relative cross-link maturity had a larger correlation
coefficient than TMD with yield stress. Overall, this demonstrates that, while TMD does
correlate to bone strength over a broader range of densities and tissue maturities, in
young growing tissues the maturation of the organic matrix, may be more important than
TMD alone in determining strength and rigidity. It is possible that in these young bones
that either the volume fraction of mineral is below a necessary threshold, or the organic
matrix is not rigid enough, for the stiff mineral to reinforce the matrix with precision.
Chapters 2 and 3 each presented significant relationships between features of cross-link
profile following a treatment and corresponding mechanical properties. Both experiments
studied mice of the same age, gender, and background strain. Both utilized inhibition of
collagen cross-linking administered in the same way. Yet, subtle differences in these
experiments produced significantly different relationships between specific cross-link

76
species and mechanical properties. In Chapter 2, BAPN inhibition of collagen cross-
linking in young growing male C57Bl6 mice revealed dose dependent reductions in tissue
strength and fracture toughness were correlated with lysylpyridinoline and relative
crosslink maturity, respectively. In contrast, Chapter 3 found associations between
pyrrole cross-link content and tissue rigidity within bones of the same age of mice treated
with combinations of BAPN and exercise. One possible explanation for the disparate
results is that the mice studied in Chapter 3 weighed slightly more at the start of the
experiment than the mice studied in Chapter 2 (17.9g vs. 15.3g). Mice grow rapidly at
this age (5-8 weeks), and significant tissue maturation occurs in this time as evidenced by
Raman spectroscopy comparisons of new and pre-existing tissue reported in Chapter 2. It
is possible that the exact timing at which BAPN is administered relative to bone growth
and maturation determines whether loss of cross-links is more detrimental to tissue
strength and fracture toughness (Chapter 2) or to tissue rigidity (Chapter 3). These
differences could stem from differences in the existing tissue at the start of the
experiment or in the amount of growth and resorption occurring during the 3 week
treatment window.
In both Chapters 2 and 3, relationships between cross-link profile and mechanical
properties demonstrated that specific types of cross-links, rather than sheer quantity, are
most important to tissue quality. Less hydroxylated forms of mature cross-links (and their
precursors) were the greatest predictors of mechanical properties. Whether this
distinction stems from differences in how these particular cross-links stabilize the matrix
(i.e. location, intra- vs. inter-fibrillar crosslinks) or from secondary influences on collagen
fibrillogenesis, matrix organization or mineralization is an important unsolved question.
Pyrrole and LP, the cross-links in question, both occur in greater proportions at the N
terminus than the C terminus of collagen.(1) Differing roles in control of fibril diameter,
control of packing, importance of stabilizing the N terminal overlap region, interaction
with non-collagenous proteins such as decorin or biglycan, or control of mineralization
are all potential ways pyrrole and LP cross-links could specifically affect mechanical
properties more than other trivalent and divalent cross-links.

77
Cross-links have been suggested to aid in the control of mineralization, and both cross-
link location and specific chemistry might determine which cross-links affect
mineralization the most. However, in my studies TMD did not correlate with resulting
mechanical changes, and Raman measures of phosphate:matrix and carbonate:phosphate
were not altered by BAPN treatment in Chapter 2. Thus it does not appear that mineral
quantity or composition are mediators of the mechanical losses stemming from cross-link
inhibition in these experiments. Although exercise had a small significant effect on
increasing TMD in Chapter 3, this increase also was not associated with an increase in
modulus.
CROSS-LINK CHANGES IN RESPONSE TO EXERCISE
The classic understanding of the effect of mechanical loading on bone is that it promotes
an anabolic bone formation response. However, our lab has demonstrated that exercise
can also influence tissue quality, illustrated by improvements in mechanical properties
and fatigue resistance in the absence of significant new bone formation.(2,3) One
indication that quality was improved was that exercise protected against a fatigue-
induced drop in the Raman ~1660/1690 band area ratio. The drop in ~1660/1690 was
interpreted as a rupture of collagen cross-links, which led to the question of whether
cross-link profile is altered by exercise.
Chapter 3 presents the results of a study evaluating the combined effects of BAPN
inhibition and exercise on the bones of young, growing mice. Although the exercise
regime was unchanged,(2,3) the use of younger mice qualifies this as a new, previously
uncharacterized exercise model. Exercise superimposed on this period of rapid mouse
growth reduced overall weight gain and bone size, suggesting that the metabolic demands
of exercise competed with animal and bone growth. Exercised bones had slightly
increased TMD and a relative shift in the cross-link profile from pyrrole to pyridinoline
mature cross-links. Because of their smaller size, exercised bones had reduced whole
bone strength and pre-yield work. However, these changes were not significant at the
tissue level, implying that exercise superimposed on rapid growth did not impair tissue
78
quality, only size, and increases in TMD and pyridinoline cross-linking did not improve
tissue mechanical properties above those of sedentary controls. The mechanism by which
exercise promotes pyridinoline over pyrrole cross-link formation is unknown and an
important topic for futher study. Increases in lysine hydroxylation leading to greater
quantities of pyridinoline cross-links are a common feature of fibrosis, where increased
pyridinolines increase the resistance of the matrix to remodeling.(4) This raises the
question of whether the shift to pyridinolines promotes resistance of the matrix to
resorption as a strategy to increase bone size, particularly in conditions unsupportive of
anabolic bone formation.
In Chapter 3, exercise rescued the reduced modulus and increased strain caused by cross-
link inhibition, with increases in pyridinoline crosslinks contributing to a recovery of
total mature crosslink levels and ratio of mature to immature crosslinks to levels closely
matching sedentary, PBS-treated mice. Unlike BAPN sedentary mice and as seen in PBS
exercised mice, BAPN exercised mice had an increased ratio of pyridinoline to pyrrole.
There was no increase in TMD caused by exercise in BAPN treated mice, suggesting that
the improvements in tissue rigidity and reduction of yield strain stemmed from the
increase of mature cross-links. Further, the recovery of modulus following exercise
occurred without any apparent increase of the BAPN-reduced immature cross-links. This
begs the question, by what mechanism were mature cross-links recovered? Either BAPN
inhibition was less effective due to metabolic changes (unlikely, since immature cross-
links were reduced to levels matching BAPN sedentary), BAPN treatment was overcome
by increased LOX expression sufficient only to increase mature, but not immature cross-
links, or exercise increased mature cross-linking by aiding the maturation of existing
immature cross-links.
DIRECT AND INDIRECT MEASURES OF COLLAGEN CROSS-LINKING
Chapter 2 characterized collagen cross-linking both directly by HPLC quantification of
cross-links and by Raman spectroscopy using the ~1660/1690 Amide I ratio originally
79
reported as correlating to mature/immature enzymatic cross-links. Data in Chapter 2
clearly demonstrated the ability of Raman spectroscopy to detect spatially localized
matrix alterations from cross-link inhibition and tissue maturation. However, it also
highlighted the non-quantitative nature of the ~1660/1690 ratio. In bones where direct
cross-link quantification confirmed reductions in overall cross-link maturity, the
~1660/1690 ratio increased, implying the opposite effect was true. The ratio is sensitive
to matrix maturity and, in normal tissues, could provide a useful tool for mapping relative
tissue age. However, caution must be used in the interpretation of this ratio.
FUTURE WORK
This thesis demonstrates that cross-links contribute to mechanical properties of bone and
are altered in response to exercise. Future studies should explore the mechanisms by
which cross-link changes impact bone quality and the mechanisms by which exercise or
other treatments control cross-link profile.
Tissue History and Volume Effects
One drawback of the methods used in this thesis is that effects of BAPN are localized to
areas of bone formed during the course of BAPN administration, but mechanical and
cross-link measurements were performed on the whole volume of cortical tissue. Slightly
more than 25% of the tibia cross-section was new tissue after treatment from 5-8 weeks
of age. Thus, interpretation of the results is muddled by the existence of normal tissue
contributing to both the mechanical and cross-link analyses.
One experiment to address this would be to produce a volume of tissue uniformly
affected by cross-link inhibition, either by treating an animal with BAPN for an extended
duration, or perhaps by the use of an ectopic bone model. Extended BAPN treatment
suffers from the limitation that BAPN cannot be given to very young animals without
cardiovascular complications, and bone growth slows considerably around 8 weeks of
age. A smaller bone, such as the fibula, may provide a uniform tissue in a shorter period,
80
but with the limitation of providing a very small volume of tissue for cross-link analysis
and mechanical testing. An ectopic model would provide a uniform volume of tissue in a
much shorter time, but a serious drawback is that it would be produced in an unloaded
environment.
A second approach would be to scale the mechanical and cross-link assays to localized
areas representative of BAPN treatment. Nanoindentation with the aid of a fluorescence
microscope to detect fluorochrome labels would allow direct comparison of BAPN
treated and normal tissues similar to the comparisons made in Chapter 2 using Raman
spectroscopy. It is more difficult to scale collagen cross-link quantification to this spatial
resolution. A potentially feasible, but technically arduous approach, would be to micro
machine areas of BAPN-treated tissue from a sample and quantify them on a specialized
ultra-performance liquid chromatography (UPLC) system.(5)
Mechanisms of Cross-Link Contributions to Mechanical Properties
Additional characterization performed at multiple lengths of scale could be used to
explore possible structural mechanisms by which BAPN and exercise-induced changes in
cross-link profile indirectly affect mechanical properties. High resolution methods
including solid state NMR, TEM and XRD could be used to explore the effect of cross-
link changes on mineral crystal structure, composition, and association with collagen.
AFM could provide useful information about possible changes in collagen spacing and
packing. Collagen fibril size, distributions, and organization could also be explored.
Cellular Responses to BAPN Inhibition and Exercise/Load
Bone and mouse growth were reduced by BAPN treatment and exercise in the young
mice studied in this thesis. Fluorochrome labels were used to confirm the existence of
new tissue, but future experiments could explore the effects of treatment on cellular
control bone turnover through histological quantification of osteoblasts/osteoclasts,
81
Cellular versus Physical-Chemical Control of Cross-link Maturation
A number of experiments could be performed to explore how exercise causes the
observed increases in hydroxylation and maturity of cross-links. In vivo, PCR, reporter-
mouse or in situ hybridization techniques could be used following exercise or BAPN
treatment to identify expression changes of LOX, LH1-3, and potential regulators of their
expression (such as HIF-1). In vitro, mechanical loading models such as substrate strain
(i.e. FlexCell) or fluid flow could be used, along with quantification of enzyme activity,
gene expression and/or cross-link quantification, to identify whether cross-link regulation
is a part of osteoblast or osteocyte response to loading. Finally, the possibility that
mechanical strain promotes cross-link maturation independent of cell activity could be
tested in vitro by culturing osteoblastic cells to establish a layer of ECM, removing the
cells leaving the matrix intact, and quantifying the collagen cross-link profile of the
matrix after a period of incubation with and without the introduction of cyclic substrate
strain.
82
REFERENCES
1. Hanson DA, Eyre DR. Molecular Site Specificity of Pyridinoline and Pyrrole
Cross-links in Type I Collagen of Human Bone. J Biol Chem. 1996;271(43):26508–16.
2. Wallace JM, Ron MS, Kohn DH. Short-term exercise in mice increases tibial post-yield mechanical properties while two weeks of latency following exercise increases tissue-level strength. Calcif Tissue Int. 2009;84(4):297–304.
3. Kohn DH, Sahar ND, Wallace JM, Golcuk K, Morris MD. Exercise alters mineral and matrix composition in the absence of adding new bone. Cells Tissues Organs. 2009;189(1-4):33–7.
4. Van der Slot AJ, van Dura E a, de Wit EC, et al. Elevated formation of pyridinoline cross-links by profibrotic cytokines is associated with enhanced lysyl hydroxylase 2b levels. Biochim Biophys Acta. 2005;1741(1-2):95–102.
5. Sroga G, Vashishth D. UPLC methodology for identification and quantitation of naturally fluorescent crosslinks in proteins: a study of bone collagen. J Chromatogr B. 2011; 879(5-6):379-385.
83
APPENDIX A: Protocols for the Quantification of Collagen Cross-links
INTRODUCTION
This appendix catalogs the protocols developed and used for the quantification of
collagen cross-links during the course of the completion of this thesis. All cross-links are
quantified from a single sample, requiring sample processing to occur in a specific order
to ensure the less stable immature and pyrrole cross-links are not destroyed prior to their
assay. If pyrrole cross-links are not to be measured, trypsin digest may be skipped in
favor of acid hydrolysis alone. If immature cross-links are not to be measured, the
sodium borohydride reaction may be skipped.
SAMPLE PREPARATION AND ORDER OF ASSAY
Adapted from (1)
Solutions
• 0.5M EDTA in Tris buffer, pH 8
• Phosphate Buffered Saline (for reduction reaction)
o 0.15M NaCl, 0.05M Na2HPO4
o pH to 7.4 with 1M HCl
o To make 500ml:
NaCl has 58.44 FW 4.383g
Na2HPO4 has 141.96 FW 3.549g
Dissolve in 400ml
Bring to pH 7.4 with 1M HCl
84
Bring to 500ml in volumetric flask
• 0.1M TAPSO Buffer (for 300ml) (259.28g/mol 0.1M buffer)
o Dissolve 7.78g of TAPSO in 250mL of ddH2O
o Adjust pH to 8.2 with 1M NaOH
o Bring volume to 300mL with ddH2O
• TPCK/TAPSO enzyme inactivator [Not necessary if using purchased TPCK
treated Trypsin]
o To dissolve TPCK for use, add ethanol at a concentration of 16mg
TPCK/mL ethanol. This solution is stable for several months when stored
at 4C.
o 100µl of the 16mg/mL TPCK in ethanol is brought to 5mL in TAPSO
buffer. (It may be turbid)
o Need 200µl for each sample 5ml makes enough for treating slightly
less than 25 samples
• TPCK-Trypsin (need 200µl /sample)
o Dissolve trypsin in TPCK/TAPSO solution (or TAPSO if using pre-treated
trypsin) at concentration of 1000U/200µl (5000U/ml).
o Allow to sit at room temperature for 25 minutes (if using TPCK)
• Chloroform:Methanol Solution
o 3:1 by volume mixture of chloroform and methanol
o Need 400µl per sample
To Prepare Samples:
1) Trim and Flush Bones:
a. Use sharp scissors or a razor blade to remove ends of mouse bones.
b. Use appropriately sized needle (fits snugly into marrow cavity) and
syringe to flush out marrow with ddH2O.
c. Dry bone surface (and marrow cavity) of water and record weight.
2) Demineralize Bones:
85
a. Place bones in tubes with 0.5M EDTA to demineralize at 4°C for 48-72
hours, changing solution daily. Tip: use Pasteur pipette and vacuum flask
to speed up solution changes. (10mg bone per mL EDTA)
b. Wash with 2 changes of ddH2O and 1 change of PBS.
3) Reduction of Immature Cross-links:
a. Use Kim Wipe to dry surface/cavity of demineralized bone and record
weight.
b. Dice bone with razor blade, transfer to fresh SCREW TOP or SAFETY
CLOSE 1.5ml tube, and add 150µl of PBS.
c. Calculate NaBH4 needed per sample: = 1% of demineralized bone weight
(step 3a)
d. Under fume hood:
i. Dissolve NaBH4 in ice cold 1mM NaOH (minimal volume)
ii. Add dissolved NaBH4 to samples and leave uncapped under hood
iii. React for 1 hour, checking on samples every 15 min
iv. Add acetic acid to pH of 3 to stop reaction (test with pH strip).
e. Wash samples 3x in ddH2O and add 400µl TAPSO buffer to each sample.
4) Trypsin Digestion
a. Shaking water bath should be equilibrated to 37°C ahead of time.
b. Place closed tubes containing samples in TAPSO on 110°C dry block for
35min to heat denature collagen
i. Meanwhile, weigh and dissolve trypsin in TAPSO buffer
(5000U/mL, 200µl per sample)
c. Transfer tubes to 37°C water bath and equilibrate for 15 minutes
d. Add 200µl of trypsin to each sample and leave in gently shaking 37°C
water bath for 18 hours.
5) Defatting Digest
a. Add 400µl of 3:1 Chloroform:Methanol solution to each tube
b. Vortex well until phases fully mixed.
c. Centrifuge for 10min X 10,000g to sediment particles and fat-containing
C:M phase
86
d. Carefully pipette off ~600µl aqueous sample and transfer to fresh tubes.
6) Divide digested sample for pyrrole assay and acid hydrolysis
a. Need at least 80µl X2 duplicates (sample) + 80µl (blank) for pyrrole assay
in 384 well plate
b. Remaining sample volume used for acid hydrolysis.
7) Acid hydrolyze remaining digest (See Hydrolysis section)
8) Remove aliquot of hydrolysate for hydroxyproline assay and run (may indicate
need to adjust quantity of hydrolysate applied to SPE column in next step). (See
Hydroxyproline Assay section.)
9) Spike aliquot with internal standard and clean on SPE just before HPLC injection
to quantify non-pyrrole cross-links. (See SPE Cleanup section)
PYRROLE ASSAY FROM TRYPSIN DIGEST
1) Weigh out DAB to have on hand in 15ml tube. 500mg makes 10ml. Protect from
light
2) Prepare standard curve in 384 well plate in triplicate x 2 (reagent + blank
triplicates)
Preparation of Standard Curve
o 1-methyl-pyrrole solution (Sigma Cat no M78801)
o 11.1µL is brought to 2.5mL in ethanol
o 20µl of this solution is diluted to 100mL in TAPSO/TPCK
To make std curve directly in 384 well plate:
Table A-1 - Pyrrole Assay Std Curve
µl 10uM stock 0 2 4 6 8 12 16 24 32 40 64 80
µl of TAPSO 80 78 76 74 72 68 64 56 48 40 16 0
[pyrrole] µmol/L 0 0.25 0.5 0.75 1 1.5 2 3 4 5 8 10
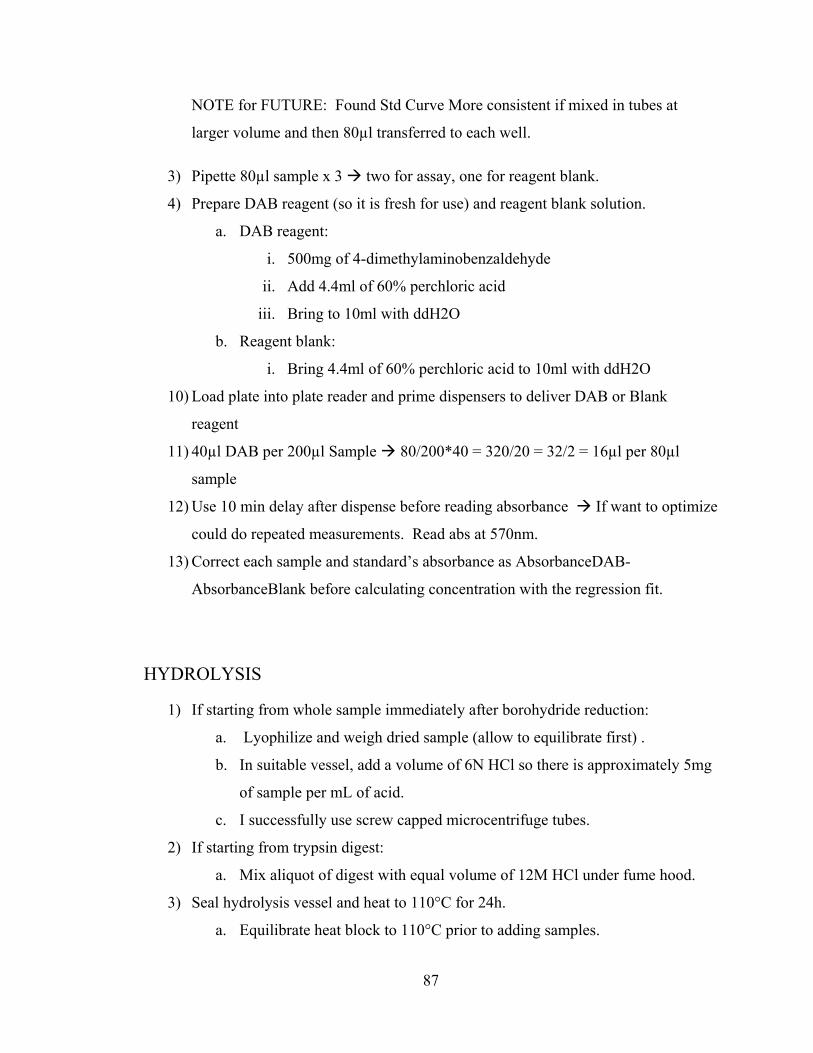
87
NOTE for FUTURE: Found Std Curve More consistent if mixed in tubes at
larger volume and then 80µl transferred to each well.
3) Pipette 80µl sample x 3 two for assay, one for reagent blank.
4) Prepare DAB reagent (so it is fresh for use) and reagent blank solution.
a. DAB reagent:
i. 500mg of 4-dimethylaminobenzaldehyde
ii. Add 4.4ml of 60% perchloric acid
iii. Bring to 10ml with ddH2O
b. Reagent blank:
i. Bring 4.4ml of 60% perchloric acid to 10ml with ddH2O
10) Load plate into plate reader and prime dispensers to deliver DAB or Blank
reagent
11) 40µl DAB per 200µl Sample 80/200*40 = 320/20 = 32/2 = 16µl per 80µl
sample
12) Use 10 min delay after dispense before reading absorbance If want to optimize
could do repeated measurements. Read abs at 570nm.
13) Correct each sample and standard’s absorbance as AbsorbanceDAB-
AbsorbanceBlank before calculating concentration with the regression fit.
HYDROLYSIS
1) If starting from whole sample immediately after borohydride reduction:
a. Lyophilize and weigh dried sample (allow to equilibrate first) .
b. In suitable vessel, add a volume of 6N HCl so there is approximately 5mg
of sample per mL of acid.
c. I successfully use screw capped microcentrifuge tubes.
2) If starting from trypsin digest:
a. Mix aliquot of digest with equal volume of 12M HCl under fume hood.
3) Seal hydrolysis vessel and heat to 110°C for 24h.
a. Equilibrate heat block to 110°C prior to adding samples.
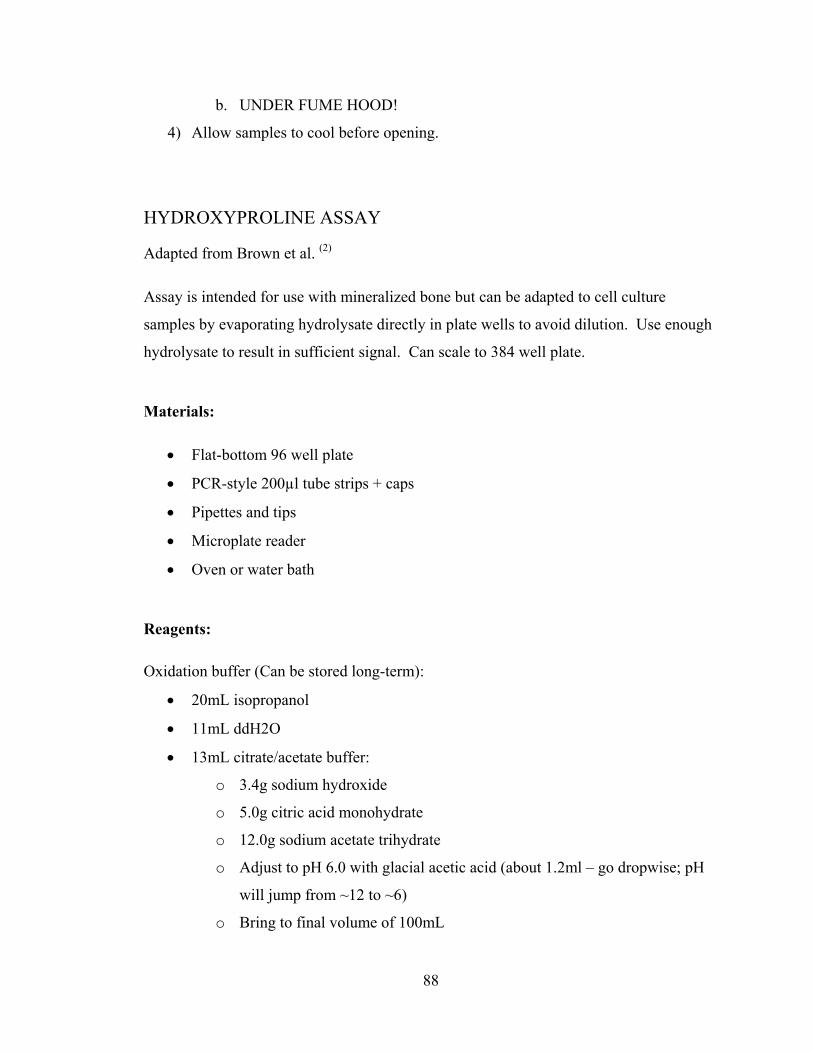
88
b. UNDER FUME HOOD!
4) Allow samples to cool before opening.
HYDROXYPROLINE ASSAY
Adapted from Brown et al. (2)
Assay is intended for use with mineralized bone but can be adapted to cell culture
samples by evaporating hydrolysate directly in plate wells to avoid dilution. Use enough
hydrolysate to result in sufficient signal. Can scale to 384 well plate.
Materials:
• Flat-bottom 96 well plate
• PCR-style 200µl tube strips + caps
• Pipettes and tips
• Microplate reader
• Oven or water bath
Reagents:
Oxidation buffer (Can be stored long-term):
• 20mL isopropanol
• 11mL ddH2O
• 13mL citrate/acetate buffer:
o 3.4g sodium hydroxide
o 5.0g citric acid monohydrate
o 12.0g sodium acetate trihydrate
o Adjust to pH 6.0 with glacial acetic acid (about 1.2ml – go dropwise; pH
will jump from ~12 to ~6)
o Bring to final volume of 100mL
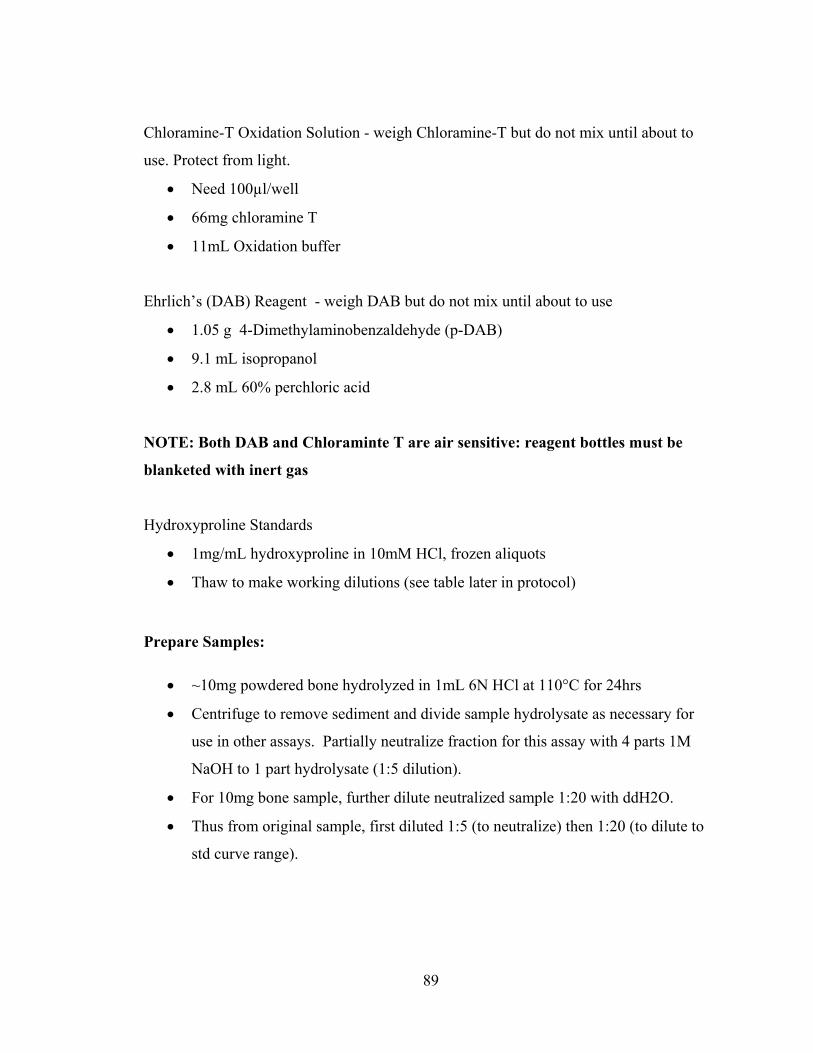
89
Chloramine-T Oxidation Solution - weigh Chloramine-T but do not mix until about to
use. Protect from light.
• Need 100µl/well
• 66mg chloramine T
• 11mL Oxidation buffer
Ehrlich’s (DAB) Reagent - weigh DAB but do not mix until about to use
• 1.05 g 4-Dimethylaminobenzaldehyde (p-DAB)
• 9.1 mL isopropanol
• 2.8 mL 60% perchloric acid
NOTE: Both DAB and Chloraminte T are air sensitive: reagent bottles must be
blanketed with inert gas
Hydroxyproline Standards
• 1mg/mL hydroxyproline in 10mM HCl, frozen aliquots
• Thaw to make working dilutions (see table later in protocol)
Prepare Samples:
• ~10mg powdered bone hydrolyzed in 1mL 6N HCl at 110°C for 24hrs
• Centrifuge to remove sediment and divide sample hydrolysate as necessary for
use in other assays. Partially neutralize fraction for this assay with 4 parts 1M
NaOH to 1 part hydrolysate (1:5 dilution).
• For 10mg bone sample, further dilute neutralized sample 1:20 with ddH2O.
• Thus from original sample, first diluted 1:5 (to neutralize) then 1:20 (to dilute to
std curve range).
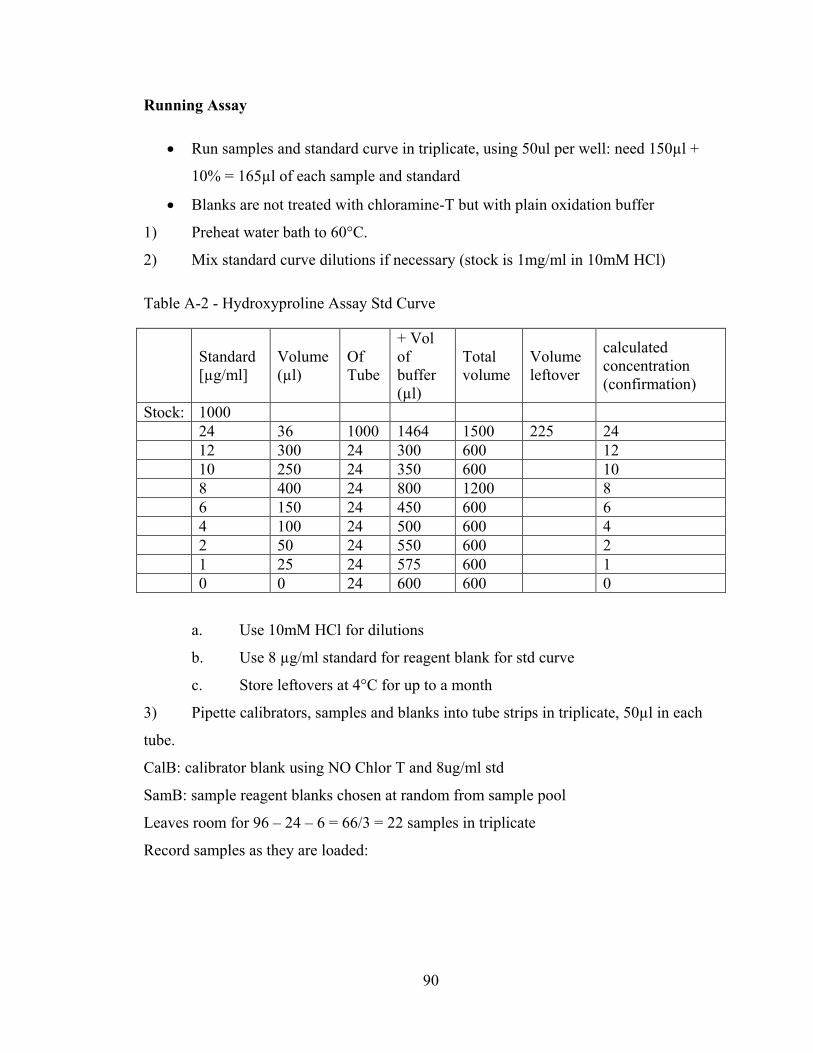
90
Running Assay
• Run samples and standard curve in triplicate, using 50ul per well: need 150µl +
10% = 165µl of each sample and standard
• Blanks are not treated with chloramine-T but with plain oxidation buffer
1) Preheat water bath to 60°C.
2) Mix standard curve dilutions if necessary (stock is 1mg/ml in 10mM HCl)
Table A-2 - Hydroxyproline Assay Std Curve
Standard [µg/ml]
Volume (µl)
Of Tube
+ Vol of buffer (µl)
Total volume
Volume leftover
calculated concentration (confirmation)
Stock: 1000 24 36 1000 1464 1500 225 24
12 300 24 300 600 12
10 250 24 350 600 10
8 400 24 800 1200 8
6 150 24 450 600 6
4 100 24 500 600 4
2 50 24 550 600 2
1 25 24 575 600 1
0 0 24 600 600 0
a. Use 10mM HCl for dilutions
b. Use 8 µg/ml standard for reagent blank for std curve
c. Store leftovers at 4°C for up to a month
3) Pipette calibrators, samples and blanks into tube strips in triplicate, 50µl in each
tube.
CalB: calibrator blank using NO Chlor T and 8ug/ml std
SamB: sample reagent blanks chosen at random from sample pool
Leaves room for 96 – 24 – 6 = 66/3 = 22 samples in triplicate
Record samples as they are loaded:
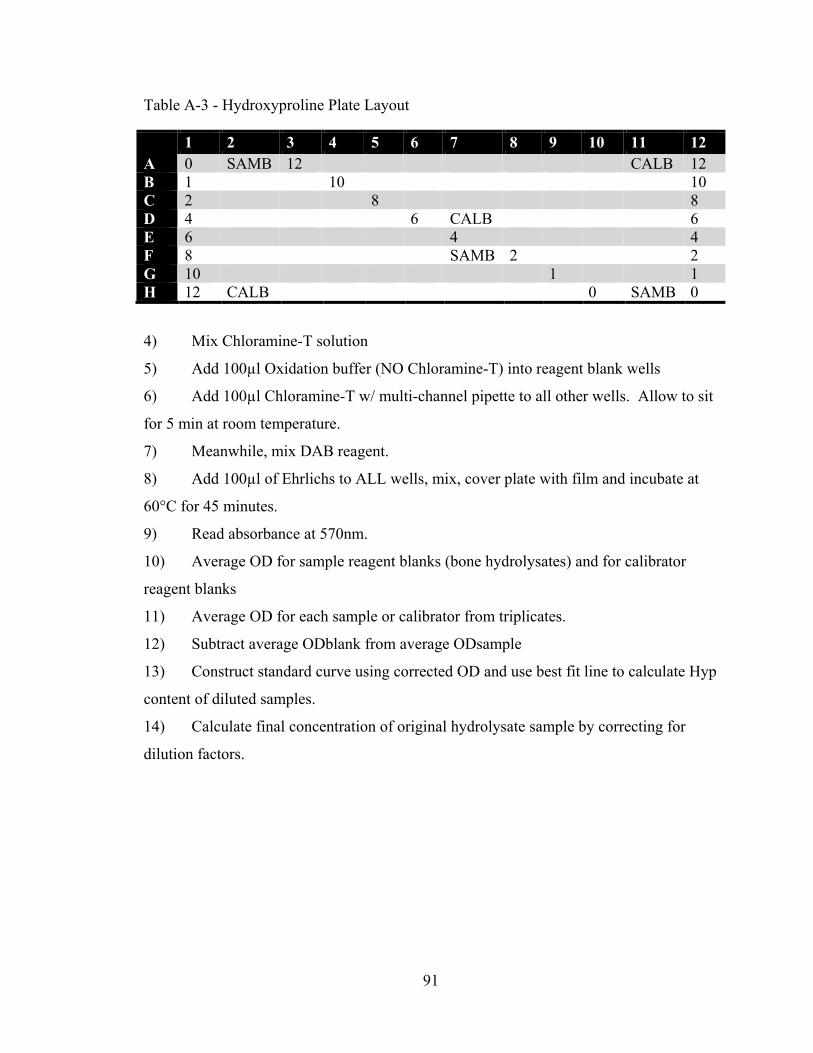
91
Table A-3 - Hydroxyproline Plate Layout
1 2 3 4 5 6 7 8 9 10 11 12 A 0 SAMB 12 CALB 12 B 1 10 10 C 2 8 8 D 4 6 CALB 6 E 6 4 4 F 8 SAMB 2 2 G 10 1 1 H 12 CALB 0 SAMB 0
4) Mix Chloramine-T solution
5) Add 100µl Oxidation buffer (NO Chloramine-T) into reagent blank wells
6) Add 100µl Chloramine-T w/ multi-channel pipette to all other wells. Allow to sit
for 5 min at room temperature.
7) Meanwhile, mix DAB reagent.
8) Add 100µl of Ehrlichs to ALL wells, mix, cover plate with film and incubate at
60°C for 45 minutes.
9) Read absorbance at 570nm.
10) Average OD for sample reagent blanks (bone hydrolysates) and for calibrator
reagent blanks
11) Average OD for each sample or calibrator from triplicates.
12) Subtract average ODblank from average ODsample
13) Construct standard curve using corrected OD and use best fit line to calculate Hyp
content of diluted samples.
14) Calculate final concentration of original hydrolysate sample by correcting for
dilution factors.
92
CLEANING HYDROLYZED CROSS-LINK SAMPLES ON SPE COLUMNS
Materials:
• CHROMABOND Cross-links 3ml SPE Columns (Macherey-Nagel)
• Acetonitrile
• Acetic Acid
• ddH2O
• 5-10ml Syringe with SPE column adapter
• Clamp stand
• Eppendorf tubes (to collect samples)
• 15ml tubes (to mix sample and/or collect flow-through if needed)
• Samples in 6M HCl after hydrolysis OR rehydrated sample (in H2O) following
evaporation of HCl
Solution A: 400µl of 3x Internal Standard in 90% Acetic Acid
Solution B: Mix 8 parts acetonitrile with 1 part acetic acid and 1 part ddH2O (8:1:1,
v/v/v). You will need 15ml per sample.
Method:
1. Mix 400µl of sample with 2.8ml of solution A (6:1 Acn/Acetic acid) in 15ml
tube
2. Place chromabond cross-links SPE column in clamp stand with clearance beneath
for collection tubes/rack.
93
3. Pipette 2.5ml of Solution B into the column. Using the empty syringe with the
column adapter, force the solution through the column (slowly, drip by drip) by
creating positive pressure at the top of the column. Collect the flow-through in a
waste container. Stop when the solution level reaches the top of the column bed
(do not dry column).
4. Apply the sample solution from step 1 to the column, collecting the flow-through
in a 15ml tube for safe-keeping in case it’s found the sample did not (fully) bind
to the column. Do not dry column.
5. Rinse the 15ml sample tube with 2.5ml of solution B and apply to the column.
6. Rinse the column with 2.5ml of solution B. Repeat 3 more times. Collect flow-
through in waste (or collect as fractions if testing effectiveness of protocol for a
new type/concentration of sample). After the final wash, fully empty the column
(apply air pressure until bubbling stops)
7. Apply 100µl of ddH20 to the column and fully empty column.
8. Add 600µl of ddH2O (or aqueous HPLC buffer such as 0.12% HFBA) to column
and fully empty column, collecting flow-through as final sample.

94
REFERENCES
1. Avery NC, Sims TJ, Bailey AJ. Quantitative Determination of Collagen Cross-links. In: Even-Ram S, Artym V, editors. Methods in Molecular Biology. Totowa, NJ: Humana Press; 2009. p. 103–21.
2. Brown S, Worsfold M, Sharp C. Microplate assay for the measurement of hydroxyproline in acid-hydrolyzed tissue samples. Biotechniques. 2001;30(1):38–40, 42.

95
APPENDIX B: Protocol for the Analysis and Quantification of Cortical Geometry from
Micro-Computed Tomography scans
Use the geometry of the mechanical tester, plus the anatomical landmarks used to align
the bone in the tester, to reorient the µCT scans to the same rotation and direction.
4-pt testing geometry: 9mm outer (bottom) span, 3mm inner (upper) span
Femur: Tested with the anterior side in tension (down), the 3rd trochanter centered
between the proximal outer and proximal inner loading points. Thus, on the µCT scan,
the center of the 3rd trochanter is used as the long-axis landmark to determine where
along the bone the loading points will touch (creating the boundaries of the testing span) .
The anterior surface at these points is used to decide rotation (so the direction the bone
will rest matches the µCT axis after reorientation is completed).
Remote connect to the scanco server.
1. Open the program uct_evaluation.
2. Inside the uct_evaluation program:
For each bone (these steps can be done for all bones in the scan before going to
IPL)
a. Use angle measurement tool to decide rotation angle
i. Choose consistent direction. Typically, we choose to orient the
anterior side to point “up” on screen.
ii. Zoom 4x around the bone of interest
iii. Draw an angle. One line should be parallel with the horizontal
axis, and the other line should go through the antero-posterior axis
of the bone. Trick: Place one side of the angle tool against the
96
edge of window to create a true vertical or horizontal reference
line.
iv. Record the angle of rotation needed to rotate the bone so the
anterior side is pointing up. Positive angle will rotate clockwise
around the z axis.
v. Repeat for all other bones in the scan.
b. Select a VOI to encompass the whole bone. Record VOI’s position and
dimensions for x, y and z.
i. Go to a slice slightly past the proximal end of the bone and draw a
small square where the bone is located. Do the same for the distal
end.
ii. Find slices that represent the extreme boundaries of the bone
(where it sticks out the farthest in each X/Y direction) and draw
additional bounding rectangles using the ROI tool.
iii. Open the 3d evaluation window and click Default VOI. A white
bounding box should surround your bone on all slices (from just
prox it just distal of the bone). This default VOI will encompass
all the ROIs you’ve drawn: its z dimension is decided by the boxes
on the most extreme slices (prox and distal), and the X and Y
dimensions are decided by the most extreme points included on
any ROI drawn.
iv. Check that the entire bone is included – i.e., the bone should not
extend past the box on any slices. If it does, draw an additional
ROI on the slice and re-click Default VOI in the evaluation
window. Repeat this procedure until the VOI surrounds your
whole bone. (It’s ok if pieces of other bones are inside the box.)
v. Write down the VOI start position (-1 from scanco output) and
dimensions from the evaluation window.
vi. Delete all contours. There is no need to save these contours –
they’re simply for reference for the next steps.
vii. Repeat for all other bones in the scan.
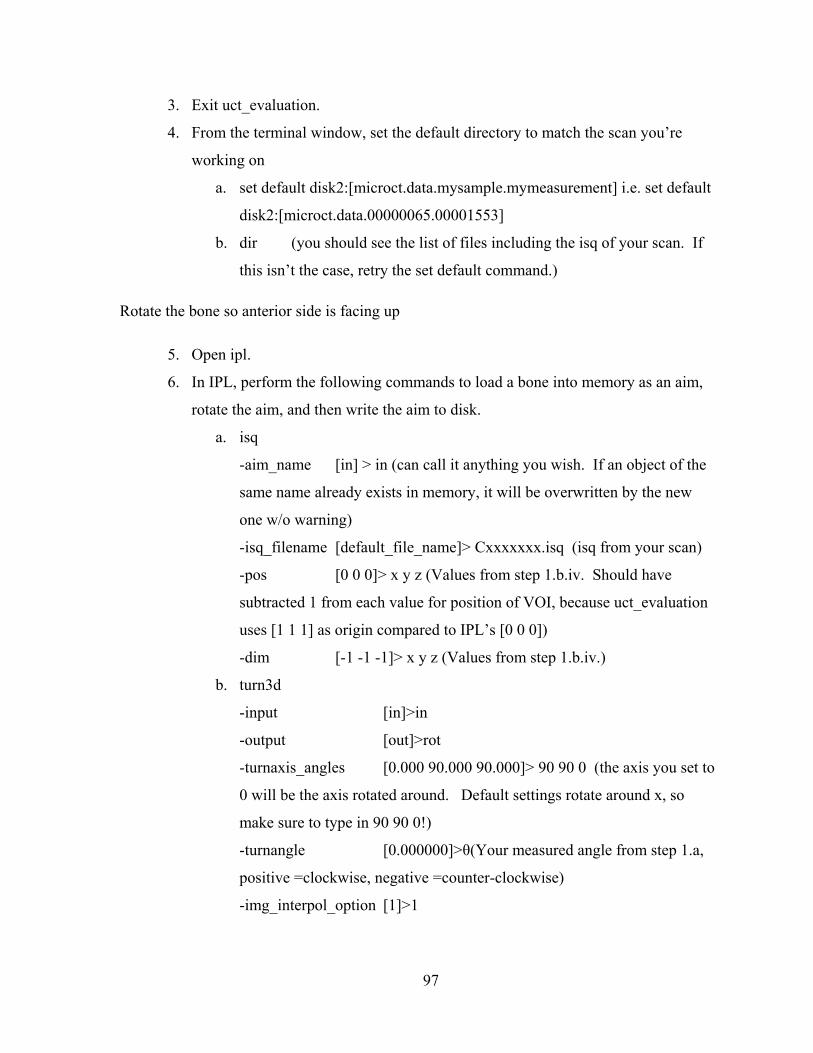
97
3. Exit uct_evaluation.
4. From the terminal window, set the default directory to match the scan you’re
working on
a. set default disk2:[microct.data.mysample.mymeasurement] i.e. set default
disk2:[microct.data.00000065.00001553]
b. dir (you should see the list of files including the isq of your scan. If
this isn’t the case, retry the set default command.)
Rotate the bone so anterior side is facing up
5. Open ipl.
6. In IPL, perform the following commands to load a bone into memory as an aim,
rotate the aim, and then write the aim to disk.
a. isq
-aim_name [in] > in (can call it anything you wish. If an object of the
same name already exists in memory, it will be overwritten by the new
one w/o warning)
-isq_filename [default_file_name]> Cxxxxxxx.isq (isq from your scan)
-pos [0 0 0]> x y z (Values from step 1.b.iv. Should have
subtracted 1 from each value for position of VOI, because uct_evaluation
uses [1 1 1] as origin compared to IPL’s [0 0 0])
-dim [-1 -1 -1]> x y z (Values from step 1.b.iv.)
b. turn3d
-input [in]>in
-output [out]>rot
-turnaxis_angles [0.000 90.000 90.000]> 90 90 0 (the axis you set to
0 will be the axis rotated around. Default settings rotate around x, so
make sure to type in 90 90 0!)
-turnangle [0.000000]>θ(Your measured angle from step 1.a,
positive =clockwise, negative =counter-clockwise)
-img_interpol_option [1]>1

98
c. write
-name [internal_name]> rot (or whatever you called your output in
step 3.b)
-filename [default_file_name]>d.aim (or whatever you want to call
the bone. )
-just use defaults (press enter) for all other options
d. Repeat for all other bones in the scan.
e. q (Quit ipl)
7. Open uct_evaluation.
a. Open your new aim file. You will have to change the view to “all” or
“aim” inside the select sample window in order for the file to show in the
list.
b. Confirm that the bone is rotated the way you wanted (i.e. anterior pointing
up). If it isn’t right, determine change to original angle and repeat earlier
steps. Also confirm that none of the bone is missing/cut off.
c. With the first slice selected, click Load, and wait. This will load all slices
into memory and make the next steps easier/faster.
d. Find the slice corresponding to the anatomical feature you’re using to
align the bone on the mechanical tester. (For the femur, this is likely the
middle of the third trochanter. For the tibia, this is likely the tib-fib
junction.) Using the 3D view option on the right panel will probably make
this easier. If you choose to change the view on the left panel, change
back to XY make sure the slice you record is for the XY plane.
e. Using the dimensions of the mechanical testing setup, the location of the
loading points in relation to this point, and the slice thickness (uCT
resolution or voxel size), calculate the slice numbers where the bottom
loading points will touch the bone.
f. Navigate to one of the two calculated slices. Using the point tool (µ
symbol), find the spot on the surface of the bone where it will rest on the
loading roller (medial side of tibia)and record the coordinates. Repeat for
the 2nd slice.
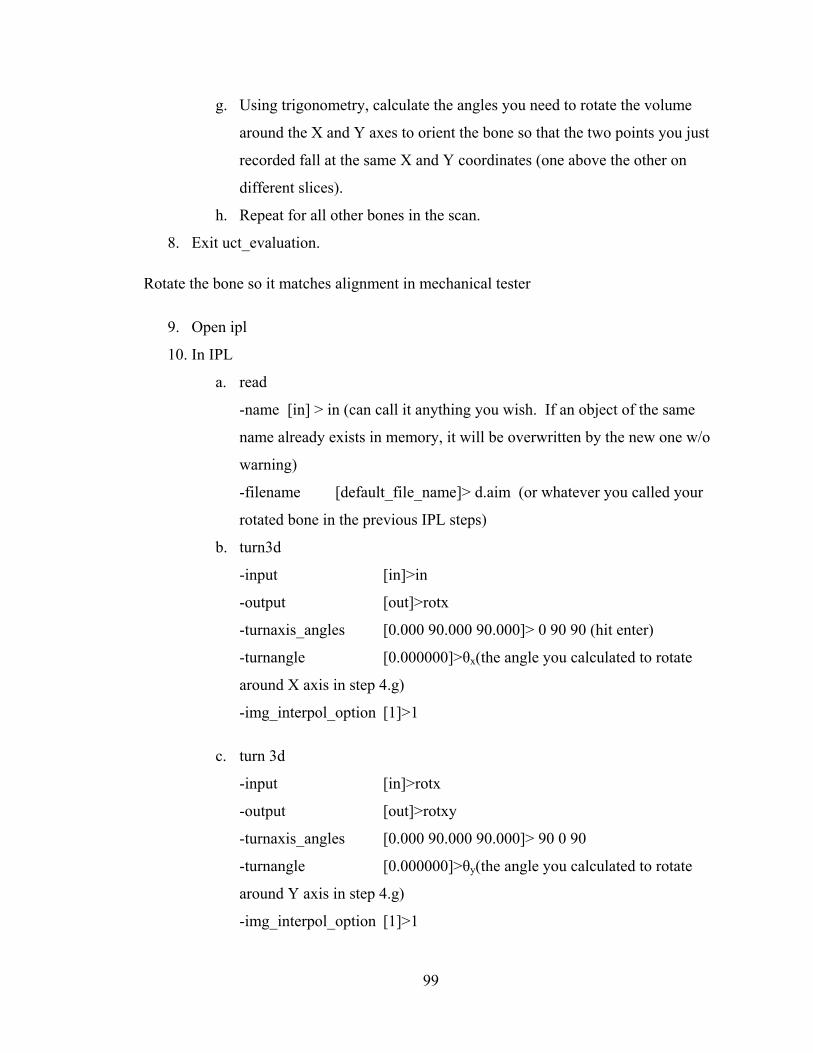
99
g. Using trigonometry, calculate the angles you need to rotate the volume
around the X and Y axes to orient the bone so that the two points you just
recorded fall at the same X and Y coordinates (one above the other on
different slices).
h. Repeat for all other bones in the scan.
8. Exit uct_evaluation.
Rotate the bone so it matches alignment in mechanical tester
9. Open ipl
10. In IPL
a. read
-name [in] > in (can call it anything you wish. If an object of the same
name already exists in memory, it will be overwritten by the new one w/o
warning)
-filename [default_file_name]> d.aim (or whatever you called your
rotated bone in the previous IPL steps)
b. turn3d
-input [in]>in
-output [out]>rotx
-turnaxis_angles [0.000 90.000 90.000]> 0 90 90 (hit enter)
-turnangle [0.000000]>θx(the angle you calculated to rotate
around X axis in step 4.g)
-img_interpol_option [1]>1
c. turn 3d
-input [in]>rotx
-output [out]>rotxy
-turnaxis_angles [0.000 90.000 90.000]> 90 0 90
-turnangle [0.000000]>θy(the angle you calculated to rotate
around Y axis in step 4.g)
-img_interpol_option [1]>1
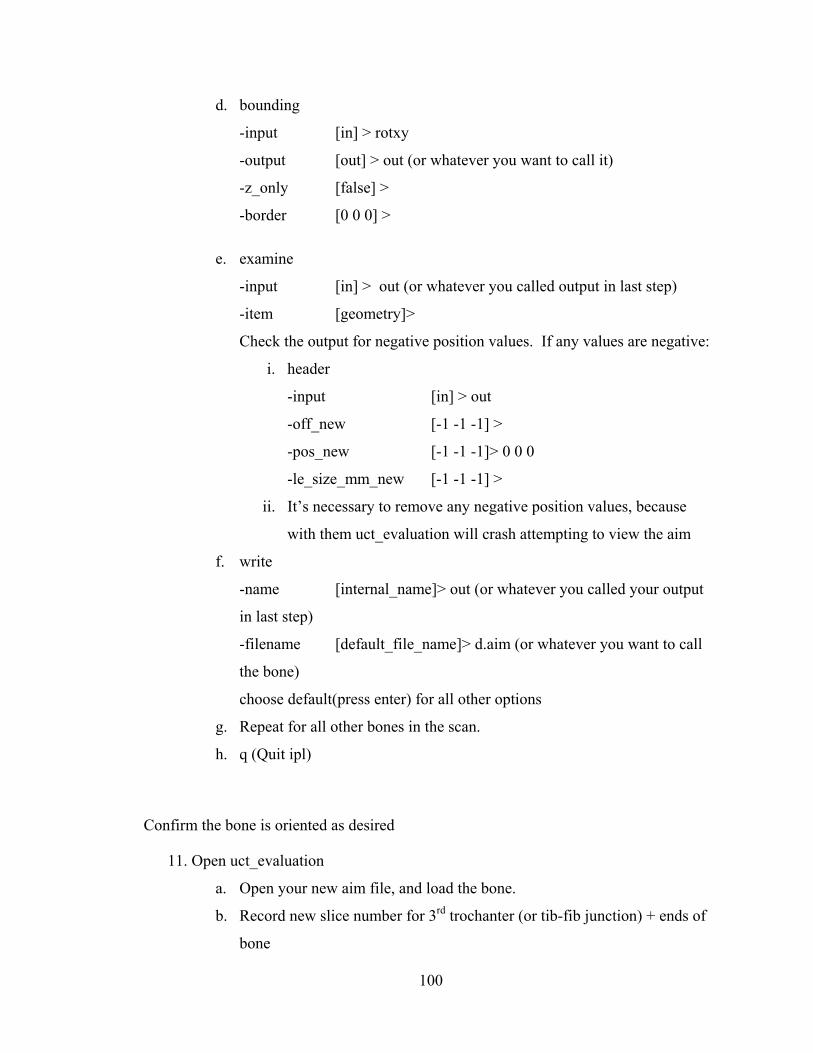
100
d. bounding
-input [in] > rotxy
-output [out] > out (or whatever you want to call it)
-z_only [false] >
-border [0 0 0] >
e. examine
-input [in] > out (or whatever you called output in last step)
-item [geometry]>
Check the output for negative position values. If any values are negative:
i. header
-input [in] > out
-off_new [-1 -1 -1] >
-pos_new [-1 -1 -1]> 0 0 0
-le_size_mm_new [-1 -1 -1] >
ii. It’s necessary to remove any negative position values, because
with them uct_evaluation will crash attempting to view the aim
f. write
-name [internal_name]> out (or whatever you called your output
in last step)
-filename [default_file_name]> d.aim (or whatever you want to call
the bone)
choose default(press enter) for all other options
g. Repeat for all other bones in the scan.
h. q (Quit ipl)
Confirm the bone is oriented as desired
11. Open uct_evaluation
a. Open your new aim file, and load the bone.
b. Record new slice number for 3rd trochanter (or tib-fib junction) + ends of
bone
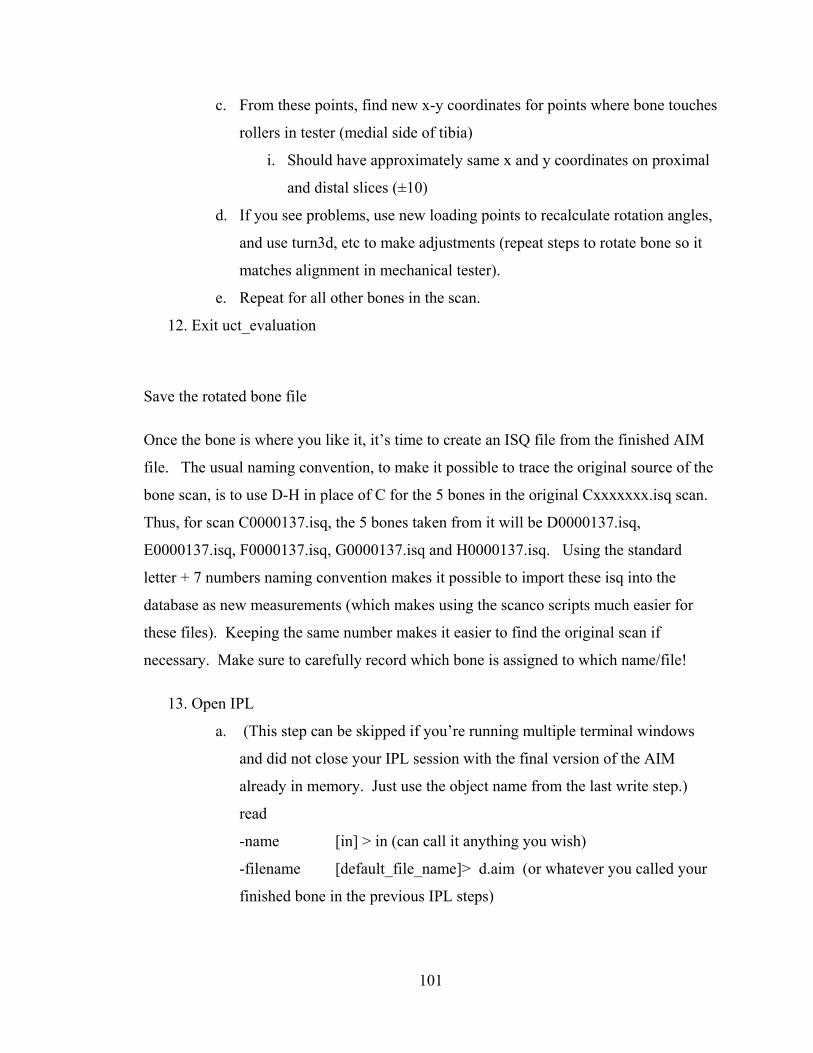
101
c. From these points, find new x-y coordinates for points where bone touches
rollers in tester (medial side of tibia)
i. Should have approximately same x and y coordinates on proximal
and distal slices (±10)
d. If you see problems, use new loading points to recalculate rotation angles,
and use turn3d, etc to make adjustments (repeat steps to rotate bone so it
matches alignment in mechanical tester).
e. Repeat for all other bones in the scan.
12. Exit uct_evaluation
Save the rotated bone file
Once the bone is where you like it, it’s time to create an ISQ file from the finished AIM
file. The usual naming convention, to make it possible to trace the original source of the
bone scan, is to use D-H in place of C for the 5 bones in the original Cxxxxxxx.isq scan.
Thus, for scan C0000137.isq, the 5 bones taken from it will be D0000137.isq,
E0000137.isq, F0000137.isq, G0000137.isq and H0000137.isq. Using the standard
letter + 7 numbers naming convention makes it possible to import these isq into the
database as new measurements (which makes using the scanco scripts much easier for
these files). Keeping the same number makes it easier to find the original scan if
necessary. Make sure to carefully record which bone is assigned to which name/file!
13. Open IPL
a. (This step can be skipped if you’re running multiple terminal windows
and did not close your IPL session with the final version of the AIM
already in memory. Just use the object name from the last write step.)
read
-name [in] > in (can call it anything you wish)
-filename [default_file_name]> d.aim (or whatever you called your
finished bone in the previous IPL steps)
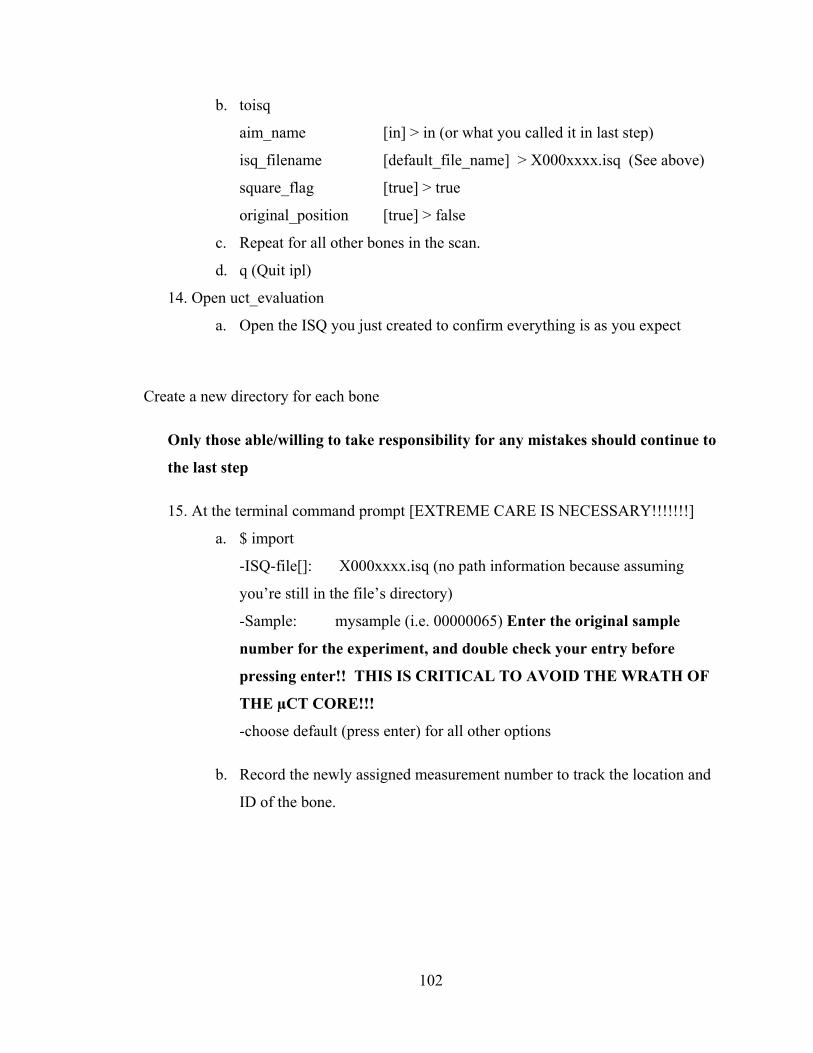
102
b. toisq
aim_name [in] > in (or what you called it in last step)
isq_filename [default_file_name] > X000xxxx.isq (See above)
square_flag [true] > true
original_position [true] > false
c. Repeat for all other bones in the scan.
d. q (Quit ipl)
14. Open uct_evaluation
a. Open the ISQ you just created to confirm everything is as you expect
Create a new directory for each bone
Only those able/willing to take responsibility for any mistakes should continue to
the last step
15. At the terminal command prompt [EXTREME CARE IS NECESSARY!!!!!!!]
a. $ import
-ISQ-file[]: X000xxxx.isq (no path information because assuming
you’re still in the file’s directory)
-Sample: mysample (i.e. 00000065) Enter the original sample
number for the experiment, and double check your entry before
pressing enter!! THIS IS CRITICAL TO AVOID THE WRATH OF
THE µCT CORE!!!
-choose default (press enter) for all other options
b. Record the newly assigned measurement number to track the location and
ID of the bone.
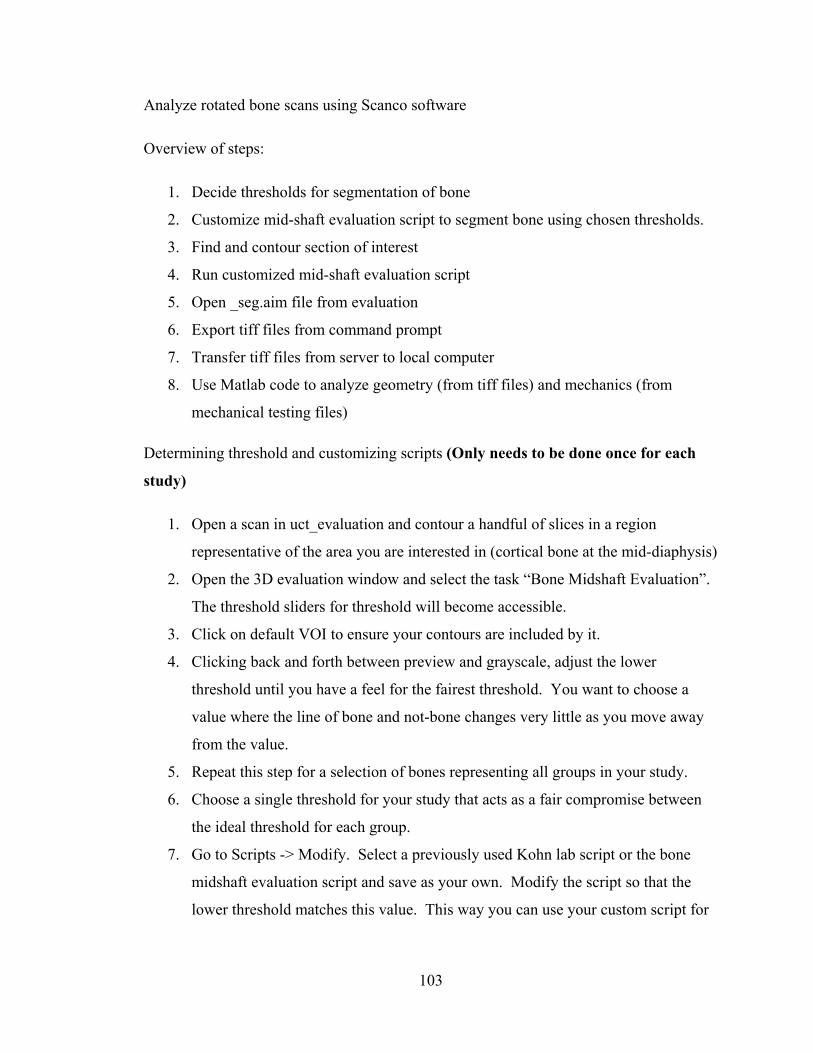
103
Analyze rotated bone scans using Scanco software
Overview of steps:
1. Decide thresholds for segmentation of bone
2. Customize mid-shaft evaluation script to segment bone using chosen thresholds.
3. Find and contour section of interest
4. Run customized mid-shaft evaluation script
5. Open _seg.aim file from evaluation
6. Export tiff files from command prompt
7. Transfer tiff files from server to local computer
8. Use Matlab code to analyze geometry (from tiff files) and mechanics (from
mechanical testing files)
Determining threshold and customizing scripts (Only needs to be done once for each
study)
1. Open a scan in uct_evaluation and contour a handful of slices in a region
representative of the area you are interested in (cortical bone at the mid-diaphysis)
2. Open the 3D evaluation window and select the task “Bone Midshaft Evaluation”.
The threshold sliders for threshold will become accessible.
3. Click on default VOI to ensure your contours are included by it.
4. Clicking back and forth between preview and grayscale, adjust the lower
threshold until you have a feel for the fairest threshold. You want to choose a
value where the line of bone and not-bone changes very little as you move away
from the value.
5. Repeat this step for a selection of bones representing all groups in your study.
6. Choose a single threshold for your study that acts as a fair compromise between
the ideal threshold for each group.
7. Go to Scripts -> Modify. Select a previously used Kohn lab script or the bone
midshaft evaluation script and save as your own. Modify the script so that the
lower threshold matches this value. This way you can use your custom script for

104
all samples in your study and minimize mistakes created by forgetting to adjust
the threshold slider to the same value for each and every sample.
8. You can save two copies of the script, each with the file naming changed to
include _std or _frac as appropriate for your study (_std and _frac if choosing
distinct standard and fracture sites of interest). i.e. the _std script will save a
_seg.aim and moi result files with _std in the file name, and the _frac script will
do the same with _frac in the file name.
9. All samples to be compared should be thresholded using the same value if at all
possible!!!
Contouring standard and fracture sites in uct_evaluation
1. Fracture site: After mechanical testing the distance from the distal end to the
initiation point of the fracture on the tensile surface should be measured with
calipers and entered into the excel sheet. Using the voxel size and landmarks
already recorded for the bone (slice number of ends, trochanter, etc), the excel
sheet calculates the slice number corresponding to the fracture site.
Standard site: A location for the standard site is decided upon in relation to the
other landmarks of the bone. i.e. 50% of the length of the bone, or some %
between the trochanter and distal end. Choose a site whose geometry will be
primarily cortical bone for all samples. The Using the excel sheet, voxel size and
landmarks, calculate the slice number corresponding to the center of the standard
site.
Mid-diaphysis scan: In this case we can’t identify the fracture or standard sites
accurately, so we just choose a subset of slices at the center of the scanned
section. i.e. if there are 150 slices, navigate to slice 75 to start.
2. Navigate to the slice given by the excel calculations for the standard or fracture
site of the bone, or to the center slice of a mid-diaphysis scan.
3. Draw a contour enclosing the cortical bone. If all of the bone should be included
(no trabecular bone present), the contour can be a simple box.
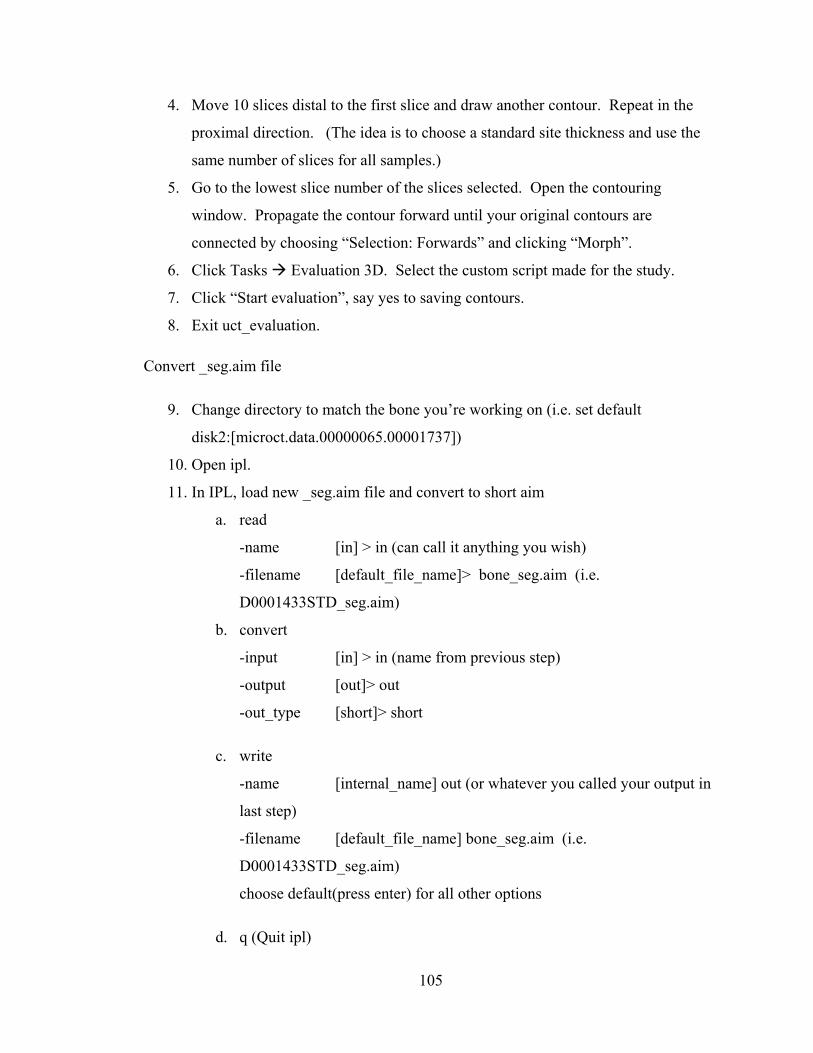
105
4. Move 10 slices distal to the first slice and draw another contour. Repeat in the
proximal direction. (The idea is to choose a standard site thickness and use the
same number of slices for all samples.)
5. Go to the lowest slice number of the slices selected. Open the contouring
window. Propagate the contour forward until your original contours are
connected by choosing “Selection: Forwards” and clicking “Morph”.
6. Click Tasks Evaluation 3D. Select the custom script made for the study.
7. Click “Start evaluation”, say yes to saving contours.
8. Exit uct_evaluation.
Convert _seg.aim file
9. Change directory to match the bone you’re working on (i.e. set default
disk2:[microct.data.00000065.00001737])
10. Open ipl.
11. In IPL, load new _seg.aim file and convert to short aim
a. read
-name [in] > in (can call it anything you wish)
-filename [default_file_name]> bone_seg.aim (i.e.
D0001433STD_seg.aim)
b. convert
-input [in] > in (name from previous step)
-output [out]> out
-out_type [short]> short
c. write
-name [internal_name] out (or whatever you called your output in
last step)
-filename [default_file_name] bone_seg.aim (i.e.
D0001433STD_seg.aim)
choose default(press enter) for all other options
d. q (Quit ipl)
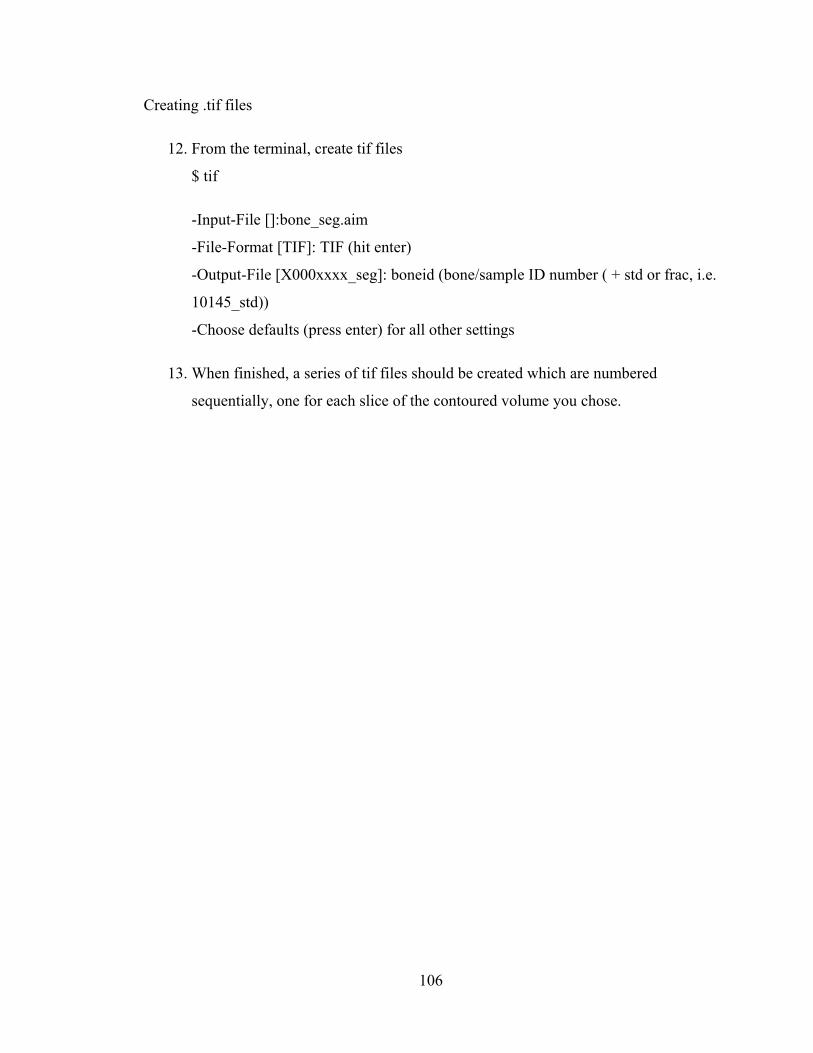
106
Creating .tif files
12. From the terminal, create tif files
$ tif
-Input-File []:bone_seg.aim
-File-Format [TIF]: TIF (hit enter)
-Output-File [X000xxxx_seg]: boneid (bone/sample ID number ( + std or frac, i.e.
10145_std))
-Choose defaults (press enter) for all other settings
13. When finished, a series of tif files should be created which are numbered
sequentially, one for each slice of the contoured volume you chose.