coelomic fluid protein profile in earthworms (lumbricus
TRANSCRIPT
APPROVED: Arthur J. Goven, Major Professor and Chair of
the Department of Biological Sciences Barney Venabels, Committee Member Lloyd Fitzpatrick, Committee Member Sandra L. Terrell, Dean of the Robert B.
Toulouse School of Graduate Studies
COELOMIC FLUID PROTEIN PROFILE IN EARTHWORMS (Lumbricus terrestris)
FOLLOWING BACTERIAL CHALLENGE
Geoffrey Lance Brooks, B.S.
Thesis Prepared for the Degree of
MASTER OF SCIENCE
UNIVERSITY OF NORTH TEXAS
December 2006

Brooks, Geoffrey Lance. Coelomic fluid protein profile in earthworms (Lumbricus
terrestris) following bacterial challenge. Master of Science (Biology), December 2006,
26 pp., 4 tables, 5 illustrations, reference list, 11 titles.
Proteomic techniques were used to evaluate the protein profile of the
earthworm, (Lumbricus terrestris), following a bacterial challenge. One control group
received no injection; a second control group received injections of phosphate buffer
solution (PBS). The experimental group received injections of PBS containing
(Aeromonas hydrophila). After incubation for 12 hours at 20°C, coelomic fluid was
collected from each group for analysis by 2-D electrophoresis.
There were significant differences in spot appearance and density between
control and experimental groups. Sixteen spots showed a two-fold increase in density
and 63 showed at least a two-fold decrease in density between samples from control
and bacteria-challenged earthworms, respectively, suggesting up- and down-modulation
of proteins potentially involved in the earthworm’s response to bacterial challenge.

ii
ACKNOWLEDGEMENTS
I would first like to express my appreciation to The Department of
Biological Sciences, University of North Texas, Bio-Rad Laboratories and NIH
HL0762-01 (MLB) for their support and funding of this project. There are also
several individuals who have made this research possible and have put up with
me for the last couple of years. I would like to thank Dr. Art Goven for serving as
my Major Professor and mentor. His relaxed demeanor and optimism has
created an environment where I can express my talents more fully. I also would
like to thank Dr. Venables and Dr. Fitzpatrick for serving as my minor professors
and taking an interest in my project.
I would also like to thank Todd Spigener for his tireless efforts in
experimentation, data collection and editing, without his help, none of this would
have been possible, and Adam Brooks, for technical support and laboratory
assistance. Special thanks to Debbie Brooks for her loving support and patience
during this first part of my graduate studies.
iii
TABLE OF CONTENTS
Page
ACKNOWLEDGEMENTS....................................................................................ii LIST OF TABLES ...............................................................................................iv LIST OF FIGURES ............................................................................................. v INTRODUCTION................................................................................................ 1 MATERIALS AND METHODS............................................................................ 7
Experimental Organisms.......................................................................... 7 Bacterial Cultures .................................................................................... 7 Bacterial Injections................................................................................... 7 Coelomic Fluid Collection ........................................................................ 8 Determination of Coelomic Fluid Proteins................................................ 8 Protein Isolation ....................................................................................... 9 Isoelectric Focusing ................................................................................. 9 2D SDS PAGE and Protein Staining...................................................... 10
RESULTS......................................................................................................... 12 DISCUSSION ................................................................................................... 22 REFERENCES................................................................................................. 25

iv
LIST OF TABLES
Page
1. Experion sample concentrations for each of the pooled replicates (WCFC, WCFST and WCFAT) including dilution calculations to achieve a 200 ug protein concentration for IEF.................................................................. 15
2. Qualitative and quantitative comparison of earthworm (Lumbricus terrestris) coelomic fluid protein profile obtained from unexposed earthworms, and earthworms exposed to A. hydrophila (3.5x10¹ organisms/mL/PBS)............................................................................... 19
3. Comparison of total numbers of earthworm (Lumbricus terrestris) coelomic fluid proteins from control organisms and organisms following intercoelomic injections of A. hydrophila (3.5x10¹ organisms/mL/PBS) ............................................................................................................... 19
4. Protein modulation profile of earthworm (Lumbricus terrestris) coelomic fluid in control and experimental groups following intercoelomic injections of A. hydrophila (3.5x10¹ organisms/mL/PBS). Data demonstrates the number of proteins and the degree to which they were either up- or down- regulated................................................................................................ 20

v
LIST OF FIGURES
Page
1. Cyber-gel created by the Experion system for (worm coelomic fluid). The Ladder in this system has its maximum set at 250 kDa and a minimum of 1.2 kDa, upper and lower end points of the ladder respectively............. 14
2. SDS-PAGE gel showing the protein expression profile of coelomic fluid from untreated, control earthworms (Lumbricus terrestris) .................... 16
3. SDS-PAGE gel showing the protein expression profile of coelomic fluid from control earthworms (Lumbricus terrestris) following intercoelomic injections of PBS. The expression profiles of these and the untreated controls (fig 1) were identical with 268 proteins identified (Table 2)....... 17
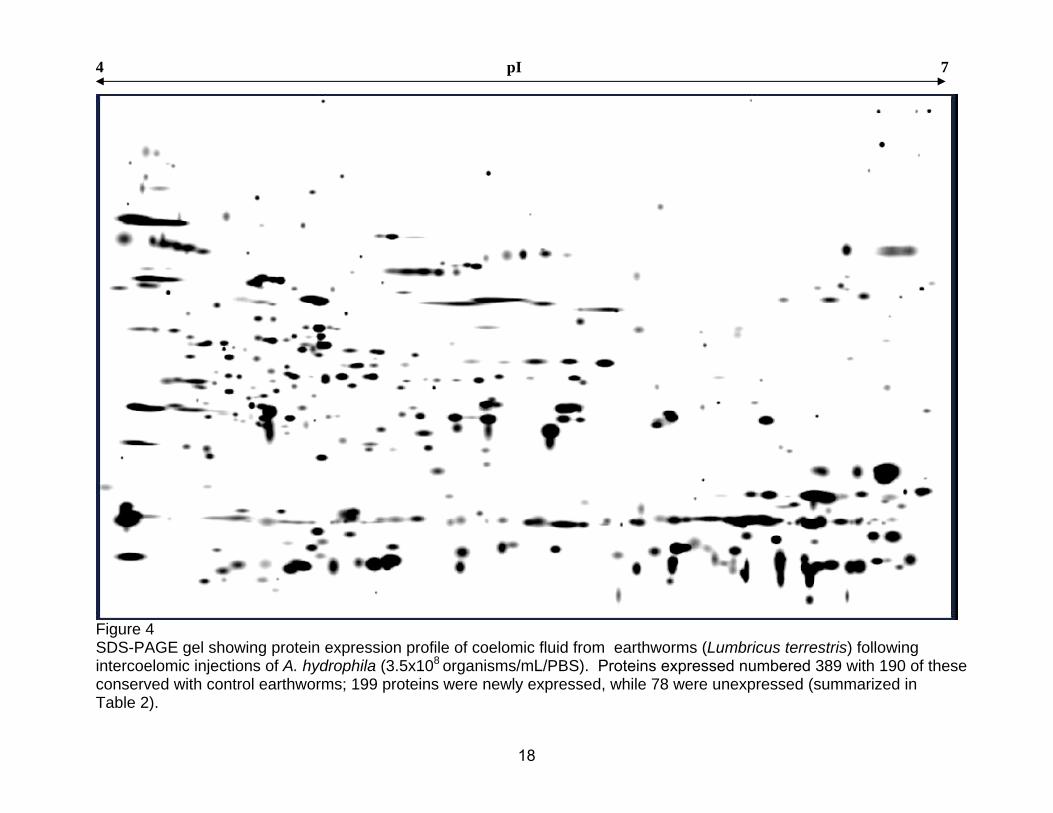
4. SDS-PAGE gel showing protein expression profile of coelomic fluid from earthworms (Lumbricus terrestris) following inercoelomic injections of A. hydrophila (3.5x10¹ organisms/mL/PBS). Expressed proteins numbered 389 with 190 of these conserved with control earthworms; 199 proteins were newly expressed, while 78 were unexpressed (summarized in Table 2) ........................................................................................................... 18
5. Summary graph showing both up and down modulation of coelomic fluid proteins in control (n = 10) and treated, earthworms (Lumbricus terrestris) following intercoelomic injections of A. hydrophila (3.5x10¹ organisms/mL/ PBS). (n = 10) (Table 3)......................................................................... 21

INTRODUCTION
Understanding toxic potential and mechanisms of action of environmental
chemicals is fundamental for assaying risk to public and environmental health.
This is especially important in light of increasing public awareness associated
with imprecise information on potential hazards of environmental chemicals.
Although numerous methods have been developed for screening chemicals and
studying their modes of action on a variety of acute toxic endpoints and
subchronic-chronic processes, only relatively recently have scientists become
aware of the broad spectrum of chemicals that alter immune function and of the
toxicity of exposure to chemicals (Dean et al. 1986). Because there is
considerable information on the innate, nonspecific, specific and molecular
components of the immune system, immune responses are especially well suited
for comparative analysis that emphasize mechanisms of chemical toxicity.
Additionally, because immune responses are important host defense
mechanisms, their modulation may result in increased incidence of infections that
could influence the survival of the individuals and their populations.
Although complexity of the immune system has increased during the
course of animal evolution, certain aspects of immunity have been conserved
phylogenetically, and immunocytes in one form or another can be found in all
phyla above Porifera. Additionally, there is sufficient basic and comparative
information on the immune systems of several invertebrate taxa to support using
1
their immune function to study sublethal toxicity of chemicals. For these reasons
invertebrates are amenable for developing panspecific biomarkers useful in
assessing environmentally relevant chemicals on immune defense systems.
Furthermore, invertebrates are fundamental components of all ecosystems,
dominating animal biomass and pathways of energy flow and nutrient recycling.
Evaluation of chemically induced alteration in their immune function offers the
potential for development of biomarkers that are not only quite sensitive to
sublethal exposure, but which also are ecologically realistic representations of
the bioavailability of toxicants in the environment. Thus, Invertebrates have great
potential as nonmammalian surrogates for use in: (1) assessing sublethal risk to
public and environmental health and hazardous waste sites: (2) preliminary
screening of neat chemicals: and (3) evaluating the toxicity of neat chemicals or
complex mixtures.
Development of an invertebrate immunobased system of biomarkers is
also based on a need for rapid, sensitive, cost-effective, and socially non
controversial, non vertebrate surrogate immunoassay protocols that could be
used as an adjunct or complement to existing protocols with mammals. A prime
candidate model organism is the earthworm, (Lumbricus terrestris). Rational for
use of earthworms (Lumbricus terrestris) in immunotoxicological studies includes:
• Existence of extensive literature on the basic biology and ecology of
earthworms.
2

• Earthworms have been used in laboratory and in situ acute toxicity
and/or bioaccumulation studies.
• Standard laboratory exposure protocols have been developed for
earthworms.
• Earthworms are important components of natural agriculture
ecosystems, functioning in the process of large quantities of organic
materials, and comprise key links in food chains.
• They are cost-effective and socially no controversial research
organisms.
• They are relatively easy to conduct laboratory and field research with
and to maintain and transport to and from hazardous waste sites.
• Their morphology and behavior enable direct exposure in the
laboratory or in situ to complex mixtures of contaminants and matrices
found in or near hazardous waste sites.
• Their high surface area/volume ratio, feeding, and behavior facilitates
uptake of contaminants.
• Ability to collect immunocytes allows for in vitro exposure of immune
cells to toxicants.
• Their tissue are readily compartmentalized and easily isolated for
chemical characterization by conventional analytical techniques,
enabling determination of actual tissue-level dose and biological
response profiles.
3

• They are sufficiently complex for use as surrogates in immunotoxicity-
based research aimed at assessing the immunotoxic potential of
chemicals in higher animals, because their immunoactive cells exhibit
functions analogous or homologous to those of vertebrates.
Additionally, the use of earthworms and a panel of immunologically based
biomarkers fulfill requirements for good measurement endpoints, because
earthworms are essential to the health of ecosystems and reduction in their
populations would be a logical assessment endpoint for pollutants. Earthworms
having been extensively used as a model organism for many environmental
lethal and non-lethal assays to measure the general impacts of inorganic,
organic, and mixtures of pollutants in soil (Bunn et al., 1996). Sub-lethal assays
focusing on immunotoxicity measurements have proven to be especially
valuable.
Proteomic analysis is the direct measurement of proteins based on their
relative presence and abundance (Wilkins et al. 1996). Proteomics has
established itself as a credible approach to understanding the biology of the
whole organism (Pennington and Dunn, 2001) allowing a better comprehension
of many biological processes. The global aim of any proteomic study is to begin
the process of characterizing the complex network of cellular regulation (Bio-Rad
Bulletin #2651, 2003) and metabolism in an organism. Examining nucleic acids
does not yield a complete picture of an organism’s overall state, which can be
altered by nutritional and environmental condition, and pathogen introduction. To
4

that end, proteomic analysis is key to understanding protein expression in an
organism and allows one to determine whether a protein is conditionally
expressed, how strongly it is expressed and evaluation of any posttranslational
modifications.
Subcellular , cellular, and organismal immunological indicators of either
exposure or effects of chemicals, especially those that can be demonstrated at
exposure levels shown to be nontoxic by traditional toxicity evaluation, can be
assayed using a proteomic approach using improved methods and current 2D
differential analysis software, thus the proteomic profile expressed in earthworm
coelomic fluid, a component of the earthworm’s immune system should prove to
be worthwhile in advancing immunotoxicity biomarker based assays. No current
literature describes the protein profile of earthworm coelomic fluid using 2-D
PAGE as part of the protocol to look at qualitative protein expression. This study
defines the protein profile of earthworm coelomic fluid before and after exposure
to bacterial challenge with (Aeromonas hydrophila).
This project involves the analysis of earthworm coelomic fluid with the
following objectives: Define the normal earthworm coelomic fluid protein profile,
and assess changes to the normal protein profile , resulting from exposure to an
external agent, in this case, interacoelomic injection of the bacterium (A.
hydrophila).
Once the background protein profile has been established for normal and
bacterial challenged earthworms, future research will investigate the influence of
5
an in-organic heavy metal, copper (Cu), and an organic compound,
polychlorinated biphenyls (PCB’s), have on proteins involved in the immune
response to infection, including identification of relevant bacteriaicidal proteins
using mass spectrometry. These results should provide important information
about the effects of inorganic and organic toxicity, and expand the potential use
of this experimental animal as a biomarker model organism.
6
MATERIALS AND METHODS
Experimental Organisms
Earthworms, purchased from a commercial supplier, (C&J Bait, Purcell, OK
73080) were cultured in commercial peat moss, placed in plastic containers and
incubated in an environmental chamber at 15°C. Earthworms were provided a diet
of Gerber baby cereal 3 times a week for nourishment. All animals were housed for
14 days prior to experimentation.
Bacterial Cultures
Aeromonas hydrophila was cultured in Miller Luria-Bertani broth at pH 7.0
and 32°C overnight. Cell concentration was determined spectrophotometrically
(Ausubel et al. 1992) and adjusted to 3.5x10⁸ organisms/ml in PBS.
Bacterial Injections
For experiments, earthworms were divided into three groups. Group I
consisted of three untreated replicates, Group II consisted of three replicates
injected with PBS (pH 7.4), and Group III consisted of three replicates of ten
worms that received injections of A. hydrophila. For injections, earthworms were
immobilized by wrapping them lengthwise on a sheet of plastic cling wrap. Worms
were injected post-clitellum with 400ul of PBS or 400ul of PBS containing a
suspension of A. hydrophila at 3.5x10⁸ organisms/ml. Injections were made into the
7

coelomic cavity along the length of the worm until the suspension was spent. Ten
worms were used in each replicate to reduce the organism-to-organism variability
and to retrieve enough coelomic fluid sample for assay. Following treatment,
worms were placed in Tupperware containers containing moist paper towels. The
containers were incubated at room temperature for 12 hours.
Coelomic Fluid Collection
Following incubation, worms were removed, placed on a dissection tray, cut
into segments post-clitellum, and the segments placed in 15-ml centrifuge tubes.
Samples were centrifuged for ten minutes at 13 x g and the supernatant removed
and re-centrifuged for ten minutes at 13 x g to remove any remaining particulates
contaminating the coelomic fluid. A final five-minute centrifugation at 16 x g was
performed to ensure samples contained no solid matter. Samples were placed on
ice if assayed immediately, or stored at –20° C if examined at a later date.
Determination of Coelomic Protein Concentration
Total crude coelomic fluid protein concentration for samples collected from
control and experimental organisms was determined using the Experion
Automated Electrophoresis System (Bio-Rad Labs, Hercules, CA).
8

Protein Isolation
Following crude protein determination proteins were isolated from the crude
coelomic fluid sample by acetone precipitation. Specifically, each coelomic fluid
sample was placed in a 5ml polypropylene tube and four times the sample volume
of cold (-20°C) acetone was added. Tubes were vortexed for ten seconds and then
incubated for sixty minutes at -20°C. Following incubation the samples were
centrifuged for ten minutes at 14 x g, the supernatant decanted and the tubes
incubated at room temperature for fifteen minutes to allow for acetone evaporation.
Isoelectric Focusing
For isoelectric focusing, precipitated protein was rehydrated by adding 185ul
of re-hydration buffer (8M urea, 2% CHAPS, 40mM DTT, .2% 4-7 Bio-Lyte
ampholytes, .0002% bromophenol blue and water) to each of the protein pellets
and vortexing until the pellet was dissolved. The final protein concentration for
each sample equaled 200ug of protein. The samples were pipetted into a twelve-
well re-hydration tray and an IPG (immobilized pH gradient) strip (Bio-Rad 3 – 10
pH) was placed gel side down into each well and allowed to incubate for 12 hours
to allow the sample absorption. The IPG strips were placed into a twelve-well IEF
(Isoelectric focusing) focusing tray and the IEF cell programmed at 250V for 20
min, 8000V for 2 hours, and 8000V for 40,000vh (volt hours) to accomplish first-
dimension separation. IPG strips were removed after isoelectric focusing and
placed gel side up in a re-hydration tray.
9

Following first-dimension separation, strips were equilibrated in a two-step
process. To reduce sulfhydryl groups, a DTT equilibration buffer (6M urea, 2%
SDS, .05mM Tris/HCl pH 8.8, 20% glycerol, 2% DTT and water) was added to
each strip in the re-hydration tray and allowed to incubate for fifteen minutes after
which the buffer was decanted. The second step, performed to reduce alkylates
sulfhydryl groups, was accomplished by adding iodoacetamide equilibration buffer
(6M urea, 2% SDS, .05mM Tris/HCl pH 8.8, 20% glycerol, 2.5% iodocetamide and
water) to each strip in the re-hydration tray and allowed to incubate for fifteen
minutes after which the buffer was decanted. The strips were rinsed in a 1x
Tris/Glycine/SDS (25mM Tris, 192mM glycine, 0.1% w/v SDS) running buffer and
placed on a Tris/HCL (14-20%) gel, the strip was covered with a molten cover
agarose (1.0% agarose, SDS running buffer, and .0002% Bromophenol blue) and
allowed to cool.
2D SDS PAGE and Protein Staining
The second-dimension separation was accomplished using Criterion 14-
20% SDS gels(Bio-Rad Labs, Hercules, CA) run at 200V for 55 min. Following this
secondary separation, gels were removed from the plate carrier and placed in a
plastic tray and fixed for 30 minutes in a 40% methanol, 10% acetic acid solution.
The fixing solution was decanted and 50ml of SYPRO Ruby (Molecular Probes,
inc.) was added to the gels for overnight staining. The SYPRO Ruby was decanted
and 100ml of de-stain (40% methanol, 10% acetic acid solution) was added to
10
each gel tray and allowed to incubate for one hour. The destain was decanted and
the gels were washed with DI water to remove any remaining de-stain solution.
Gels were scanned on the FX Molecular Imager (Bio-Rad Labs, Hercules, CA) and
images analyzed with PDQuest 2-D differential analysis software. All gels were
placed in plastic bags, covered with a 1% acetic acid solution, sealed, and stored
for further analysis.
11

RESULTS
The Experion Automated Electrophoresis System (Bio-Rad Labs, Hercules,
CA) was used to determin total protein concentration of crude coelomic fluid to
allow samples to be adjusted to 200ug protein for analysis. Figure 1 represents a
cyber gel created by the Experion System. Lane L reflects results obtained for a
standardized molecular weight ladder with an upper marker of 260kDa and a lower
marker of 1.2kDa, lanes marked 1 through 3 are results obtained from samples of
coelomic fluid collected from controls, lanes 4 through 6 are results obtained from
coelomic fluid collected from saline treated organisms, lanes 7 through 9 are
results obtained from coelomic fluid from A. hydrophila challenged organisms and
lane 10 represents results for A. hydrophila (3.5x10³ organisms/ml) in PBS. Table
1 shows the specific protein concentration for each sample determined in Figure 1
and the dilutions made to obtain a 200ug sample for analysis.
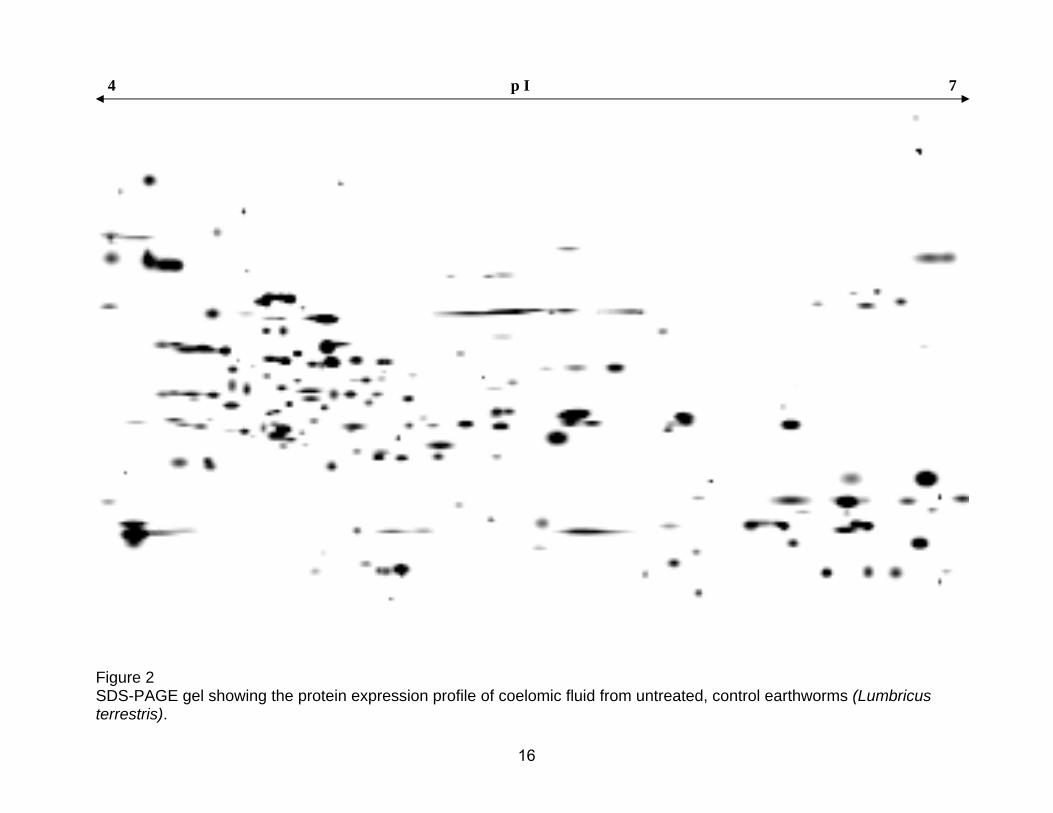
The protein profile of coelomic fluid collected from control groups is
presented in figs 2 and 3. Organisms in fig 2 were not treated (Worm Coelomic
Fluid Control - WCFC), while organisms in fig 3, (Worm Coelomic Fluid Saline
Treated - WCFST) were injected with PBS to determine if the carrier initiated a
response compared to non-injected earthworm. No protein profile differences were
seen between the two control groups. A total of 268 protein spots were identified in
the coelomic fluid of the control and PBS injected groups.
Fig 4 is a representative gel of coelomic fluid harvested from A.
hydrophial- challenged earthworms, (Worm Coelomic Fluid Aeromonas Treated -
12

WCFAT). A total of 389 protein spots were identified in the coelomic fluid of the
bacterial challenged organisms. A differential comparison of the controls and
experimental gels demonstrated that 190 proteins were conserved. Of these
conserved proteins, 16 demonstrated an increase of greater than 2-fold in
density while 63 proteins demonstrated a decrease of greater than 2-fold when
compared to the control groups. Results also suggest that the experimental
group expressed 199 new proteins while 78 were absent when compaired to
results obtained from control organisms.
Tables 1 and 2 quantitatively and qualitatively express earthworm
coelomic fluid protein modification resulting from the A. hydrophila bacterial
challenge, while fig 4 and table 3 describe the changes in concentration of
proteins that are up-and down-regulated following bacterial challenge. Data was
analyzed using PDQuest software (Bio-Rad Labs, Hercules, CA).
13

1.2
10.0
20.0
37.050.0
75.0100.0
150.0
260.0
L 1 2 3 4 5 6 7 8 9 10
Figure 1. Cyber gel created by the Experion system, L lane is the ladder with an upper marker of 260kDa and a lower marker of 1.2kDa, lanes marked 1 through 3 are samples WCFC (worm coelomic fluid controls), lanes 4 through 6 are WCFST (worm coelomic fluid saline treated), lanes 7 through 9 are WSFAT (worm coelomic fluid A. hydrophial- challenged) and lane 10 is representative of the A. hydrophial at 3.5x10³ organisms/mL in PBS.
14
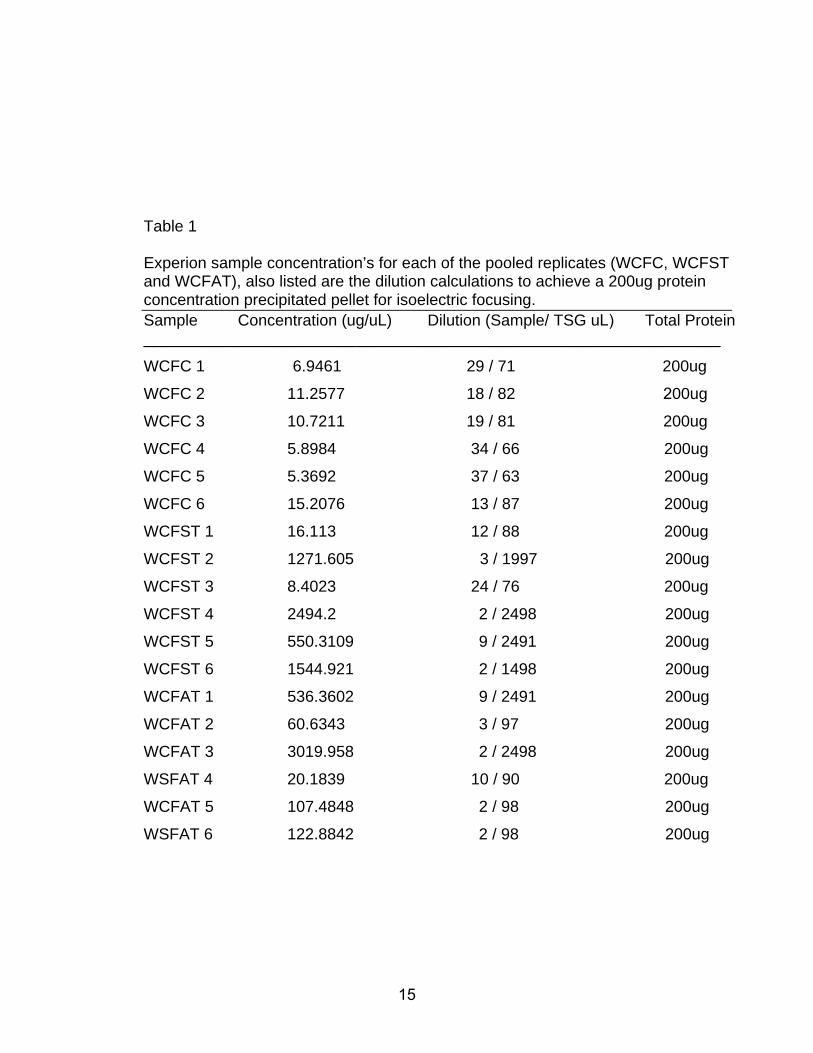
Table 1
Experion sample concentration’s for each of the pooled replicates (WCFC, WCFST and WCFAT), also listed are the dilution calculations to achieve a 200ug protein concentration precipitated pellet for isoelectric focusing. Sample Concentration (ug/uL) Dilution (Sample/ TSG uL) Total Protein _________________________________________________________________
WCFC 1 6.9461 29 / 71 200ug
WCFC 2 11.2577 18 / 82 200ug
WCFC 3 10.7211 19 / 81 200ug
WCFC 4 5.8984 34 / 66 200ug
WCFC 5 5.3692 37 / 63 200ug
WCFC 6 15.2076 13 / 87 200ug
WCFST 1 16.113 12 / 88 200ug
WCFST 2 1271.605 3 / 1997 200ug
WCFST 3 8.4023 24 / 76 200ug
WCFST 4 2494.2 2 / 2498 200ug
WCFST 5 550.3109 9 / 2491 200ug
WCFST 6 1544.921 2 / 1498 200ug
WCFAT 1 536.3602 9 / 2491 200ug
WCFAT 2 60.6343 3 / 97 200ug
WCFAT 3 3019.958 2 / 2498 200ug
WSFAT 4 20.1839 10 / 90 200ug
WCFAT 5 107.4848 2 / 98 200ug
WSFAT 6 122.8842 2 / 98 200ug
15
4 p I 7
Figure 2 SDS-PAGE gel showing the protein expression profile of coelomic fluid from untreated, control earthworms (Lumbricus terrestris). 16

4 pI 7
Figure 3 SDS-PAGE gel showing the protein expression profile of coelomic fluid from control earthworms (Lumbricus terrestris) following intercoelomic injections of PBS. The expression profiles of these and the untreated controls (fig 1) were identical with 268 proteins identified (Table 2).
17
4 pI 7
Figure 4 SDS-PAGE gel showing protein expression profile of coelomic fluid from earthworms (Lumbricus terrestris) following intercoelomic injections of A. hydrophila (3.5x10⁸ organisms/mL/PBS). Proteins expressed numbered 389 with 190 of these conserved with control earthworms; 199 proteins were newly expressed, while 78 were unexpressed (summarized in Table 2).
18

Table 2 Qualitative and quantitative comparison of earthworm (Lumbricus terrestris) coelomic fluid protein profile obtained from unexposed earthworms, and earthworms exposed to A. hydrophila (3.5x10⁸ organisms/mL/PBS). (Worm Coelomic Fluid Saline Treated – WCFST, Worm Coelomic Fluid Aeromonas Treated – WCFAT). Analysis Set Description Type Count Spots on WCFAT not WCFST Proteins expressed on treatment group Qualitative 199
Spots on WCFST not WCFAT Proteins not expressed on treatment group Qualitative 78
Spots with 2+ fold increase on WCFAT Up-modulated Proteins on treatment group Quantitative 16
Spots with 2+ fold decrease on WCFAT Down-modulated proteins on treatment group Quantitative 63
Table 3 Comparason of total numbers of earthworm (Lumbricus terrestris) coelomic fluid proteins from control organisms and organisims following intercoelomic injections of A. hydrophila (3.5x10⁸ organisms/mL/PBS). Control Group Aeromonas hydrophila Treated Group Total Newly Expressed Unexpressed Conserved Total 268 199 78 190 389
19

Table 4 Protein modulation profile of earthworm (Lumbricus terrestris) coelomic fluid in control and experimental groups following intercoelomic injections of A. hydrophila (3.5x10⁸ organisms/mL/PBS). Data demonstrates the number of proteins and the degree to which they were either up- or down-regulated. Modulation Change Number of proteins Control Group 268
Conserved Proteins 79
10-Fold Down-Regulated 9
9-Fold Down-Regulated 3
7-Fold Down-Regulated 4
6-Fold Down-Regulated 5
5-Fold Down-Regulated 8
4-Fold Down-Regulated 13
3-Fold Down-Regulated 7
2-Fold Down-Regulated 14
10-Fold Up-Regulated 2
9-Fold Up-Regulated 2
3-Fold Up-Regulated 3
2-Fold Up-Regulated 9
20

5
10
15
0
5
10
C-2-3-4-5-6-7-8-9-10
Change in Protein Concentration (X fold)
up-regulation
down-regulation
2 3 4 5 6 7 8 9 10
Num
ber o
f Pro
tein
s
Figure 5 Summary graph showing both up and down modulation of coelomic fluid proteins in control (n = 10) and treated, earthworms (Lumbricus terrestris) following intercoelomic injections of A. hydrophila (3.5x10⁸ organisms/mL/PBS). (n = 10) (Table 3).
21
DISCUSSION
The purpose of this study was to develop a baseline earthworm coelomic
fluid profile for future use in immunotoxicity studies. Previous studies have used
various parameters such as mortality, growth rate, gross protein concentration
and immune function to assay the effects of toxins and infections using the
earthworm as an experimental model (Goven et al., 2005). While these
approaches have yielded much useful information, emerging technologies that
allow complete protein profiles provide a powerful tool to study the innate
immune response in earthworms.
Current innovations in two-dimensional electrophoresis, imaging
technology and 2D analysis software provide the necessary advancements and
provide the capability to characterize proteins involved in physiological processes
such as the immune response (Levy et al., 2004) in the earthworm model.
Recent literature shows that these updated technologies have been used
successfully when investigating up- or down- regulation and modification of
proteins involved in response to a bacterial challenge in Drosophila melanogaster
(Levy et al., 2004). Additionally proteins involved in calcium-regulated signaling,
mRNA processing and nuclear transport in D. melanogaster (Loseva and
Engstrom, 2004) and stress response proteins in the same organism (Vierstraete
et al., 2004) have been examined. This technology has also been used to
provide new data on the innate immune response of the medicinal leech, Hirudo
medicinalis (Vergote et al., 2006).
22
Data based on 2D differential analysis using PDQuest software (Bio-Rad
Labs, Hercules CA) suggest that a bacterial challenge produces a significant
modification in the protein profile of earthworm coelomic fluid. Thus, as the
bacterial challenge demonstrates, the protein profile of earthworm coelomic fluid
can be used to assay the proteomic response following exposure to external
agents. This protein profile approach, in conjunction with the identification of the
gel locations and function of relevant proteins, has the possibility of expanding
use of the earthworm model in scientific research and toxicological studies.
Using this methodology, one can conceivably measure the effect of sub-lethal
exposures to inorganic and organic toxicants in the normal coelomic fluid protein
profiles and, more importantly, the ability of the earthworm to respond to bacterial
challenge as demonstrated in this study under chemical exposure. Ultimately, the
characterization and identification of coelomic fluid proteins responsible for the
earthworm’s immunological profile could be used to identify chemicals capable of
inducing immunomodulation.
A background protein profile has now been established for normal and
bacterial challenged earthworms, future research will investigate the influence of
in-organic copper (Cu) and organic polychlorinated biphenyls (PCB’s) chemicals
have on proteins involved in the response to infection, and should include
identification of relevant proteins using mass spectrometry. These results will
provide important information about the effects of inorganic and organic toxicity,
23

and expand the potential use of this experimental animal as a biomarker model
organism.
24

REFERENCES
Ausubel F.M., Brent R., Kingston R.E., Moore D.D., Seidman J.C., Smith J.A., Struhl K., 1992. Short Protocols in Molecular Biology. Greene and John Wiley and Sons Punlishing, New York, USA. Bio-Rad Bulletin #2651 2003, 2-D Electrophoresis for Proteomics/a Methods and Product Manual. Life Sciences Group. Bulletin #2651 22-23pp.
Bunn, K.E., Thompson, H.M., Tarrant, K.A., 1996. Effects of agrochemicals on the immune system of earthworms. Bull. Environ. Contam. Toxicol. 57, 632-639
Dean JH, Murray MJ, Ward EC 1986. Toxic response of the immune system. In:Klaassen CD, Amdur MO, Doull J (eds) Casarett and Doull’s Toxicology. McMillan, New York pp 245-286.
Goven A.J., Venables B.J., Fitzpatrick L., 2005. Earthworms as Ecosentinels for Chemical-Induced Immunotoxicity. In: Tryphonas, H., Fournier, M., Blakley, B.R., Smits, J.E.G., Brousseau, P. (Eds.) Investigative Immunotoxicology, Chapter 7. Taylor and Francis, Boca Raton, pp. 91- 102. Levy, F., Bulet, P., Ehret-Sabatier, L., 2004. Proteomic analysis of the systemic immune response of Drosophila. Molecular and Cellular Proteomics. 3, 156-166. Loseva, O., Engstrom, Y., 2004. Analysis of signal-dependent changes in the proteome of Drosophila blood cells during an immune response. Molecular and Cellular Proteomics 3, 796-808. Pennington S.R., Dunn M.J., 2001. Proteomics from protein sequence to function. BIOS Scientific Publishing, Oxford, UK.
Vergote, D., Macagno, E.R., Salzet, M., Sautiere, P.-E., 2006. Proteome modifications of the medicinal leech nervous system under bacterial challenge. Proteomics. 6, 4817-4825.
Vierstraete, E., Verleyen, P., Baggerman, G., D’Hertog, W., Van den Bergh, G., Arckens, L., De Loof, A., Schoofs, L., 2004. A proteomic approach for the analysis of instantly released wound and immune proteins in Drosophila melanogaster hemolymph. PNAS, 1 (2), 470-475.
25

Wilkins M.R., Sanchez J.C., Gooley J.J., Appel R.D., Humphery-Smith, I., Hochstrasser D.F., Williams K.L., 1990. Progress with proteome projects: Why all proteins expressed by a genome should be identified and how to do it. Biotechnol. Genet. Eng. Rev. 13, 19-50.
26