bacterial challenge in lumbricus terrestris : a
TRANSCRIPT
APPROVED: Barney J. Venables, Major Professor Lloyd C. Fitzpatrick, Committee Member Arthur Goven, Committee Member and Chair
of the Department of Biological Sciences
Sandra L. Terrell, Dean of the Robert B. Toulouse School of Graduate Studies
BACTERIAL CHALLENGE IN Lumbricus terrestris: A TERRESTRIAL
INVERTEBRATE IMMUNOTOXICITY MODEL
Jennifer C. McDonald, B.S.
Thesis Prepared for the Degree of
MASTER OF SCIENCE
UNIVERSITY OF NORTH TEXAS
May 2007
McDonald, Jennifer C. Bacterial challenge in Lumbricus terrestris: A terrestrial
invertebrate immunotoxicity model. Master of Science (Biology), May 2007, 70 pp., 7
tables, 17 figures, references, 33 titles.
A bacterial challenge assay was developed utilizing the earthworm, Lumbricus
terrestris, in order to assess potential immunotoxic effects from exposure to specific
polychlorinated biphenyl congeners. Earthworms were inoculated with Aeromonous
hydrophila, establishing a 10-day LD50. In vitro assays for effects of PCBs on
phagocytosis agreed with mammalian studies, demonstrating potent suppression of
phagocytosis by the non-coplanar PCB congener 138 and no suppression by the
coplanar congener 126. However, when the effects of the two PCB congeners were
evaluated for suppression of resistance to a whole animal infection challenge assay,
coplanar PCB 126 decreased the ability of L. terrestris to withstand infection while non-
coplanar PCB 138 did not.
Results of the study suggest that in vitro assays may not successfully predict the
relative potency of immunotoxic chemicals as indicated by more ecologically relevant,
whole animal in vivo bacterial challenge assays.
ii
Copyright 2007
by
Jennifer C. McDonald
iii
ACKNOWLEDGEMENTS
I wish to thank my dissertation committee members for their patience and
assistance during this dissertation’s long travels. There were many others at North
Texas State University whose assistance was invaluable.
The loving support of my family was ever present during the hours, days, and
years spent on this effort.
Central Texas College’s assistance cannot be overstated. The efforts of many
contributed to the completion of the study.
iv
TABLE OF CONTENTS
Page
LIST OF TABLES ...................................................................................................vi LIST OF FIGURES ................................................................................................ vii Chapter
I. INTRODUCTION................................................................................ 1 II. LITERATURE REVIEW........................................................................ 5
Earthworm Ecotoxicity
Invertebrates and Immunity
PCBs and Phagocytosis
The TEF Concept and the ArH Receptor
PCB Structure and Immunotoxic Effects III. MATERIALS AND METHODS..............................................................16
1. Bacterial Challenge Assay
L.terrestris Supply
Preparation for Initial Bacterial Challenge Assay
Aeromonas Hydrophila Culture Preparation
Injection of Worms with Bacterial Culture
Duration of Assay, Data Collection and Activity Scales
Sham Injection Assay: Culture Treatment and Experimental Groups
2. Cellular Assays
Establishing the In Vitro Assay
In Vitro PCB Exposure Phagocytosis Assays
In Vivo, Five-day Filter Exposure to PCB 138 Followed by In Vitro Phagocytosis Assay
3. Comparative Bacterial Challenge Assays
Bacterial Challenge Assay for PCB 138
Comparative Bacterial Challenge Assays
v
Determining Optical Density Curve for Estimating Viable Cell Counts
Statistical Analyses IV. RESULTS .........................................................................................29
1. Bacterial Challenge Assay
Sham Injection Assay
2. Cellular Assays
3. Comparative Bacterial Challenge Assays
Pre-Exposure to PCB 138 Pilot Assay
Comparative PCB 126 and PCB 138 Pre-Exposure Assay
Determining Optical Density Curve for Estimating Viable Cell Counts
V. DISCUSSION ...................................................................................56
Bacterial Challenge Assay
Cellular Assays
Comparative Bacterial Challenge Assay APPENDIX: TABULAR PRESENTATION OF ALL CELLULAR EXPOSURE ASSAYS...........66 REFERENCES.......................................................................................................68
vi
LIST OF TABLES
Page
1. TEF factors for specific PCB congeners ........................................................11
2. Relative potency of PCB congeners on protein kinase C translocation in rat cerebellar granule cells...............................................................................14
3. Initial bacterial challenge assay: experimental groups and CFU injected. ........19
4. Bacterial challenge assay for PCB 138: experimental groups and CFU injected ................................................................................................................25
5. Descriptive statistics of experimental groups in initial bacterial challenge assay ................................................................................................................38
6. Phagocytic activity of L. terrestris Coelomocytes on stained yeast cells under control conditions ......................................................................................43
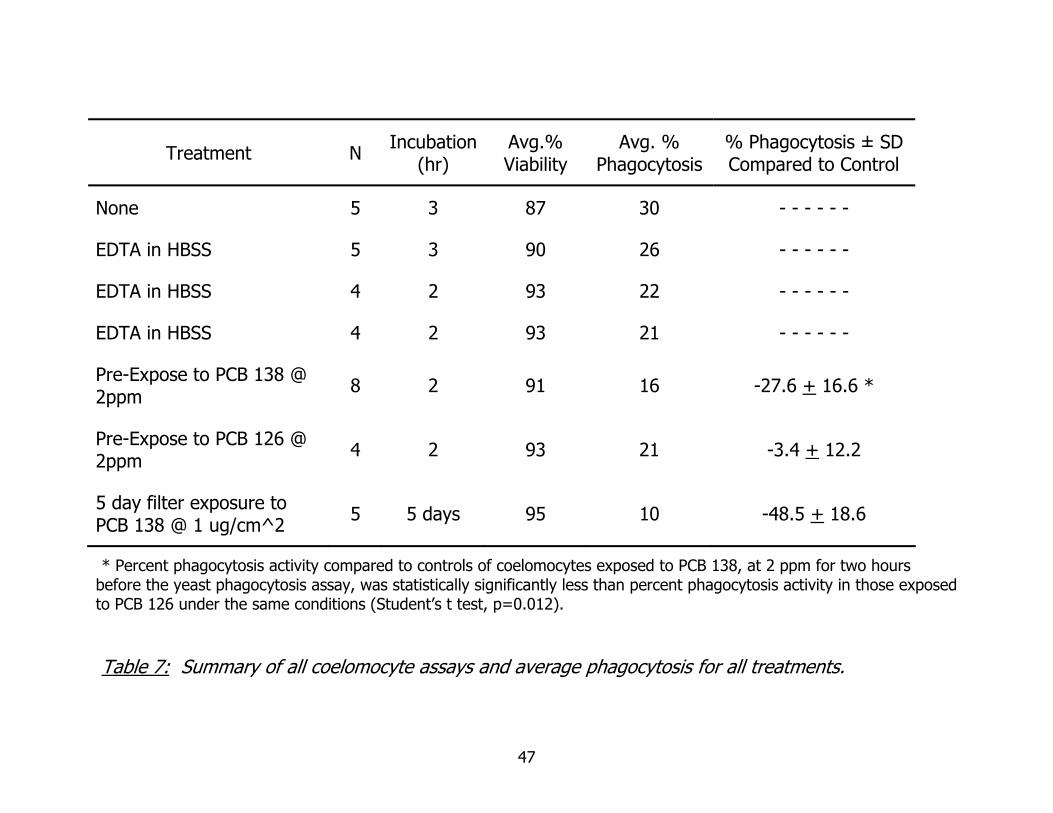
7. Summary of all cellular assays ....................................................................47
vii
LIST OF FIGURES
Page
1. Co-planar and non-coplanar PCB structure ...................................................12
2. Bacterial injection sites ...............................................................................19
3. Initial bacterial challenge assay: weight change for experimental groups ........39
4. (a) Initial bacterial challenge assay: percent mortality and autotomy for experimental groups ..................................................................................40
(b) Calculated LD50 and confidence limits....................................................40
5. Activity scores for experimental groups in initial bacterial challenge assay.......41
6. Sham injection assay: mortality and autotomy for experimental groups ..........42
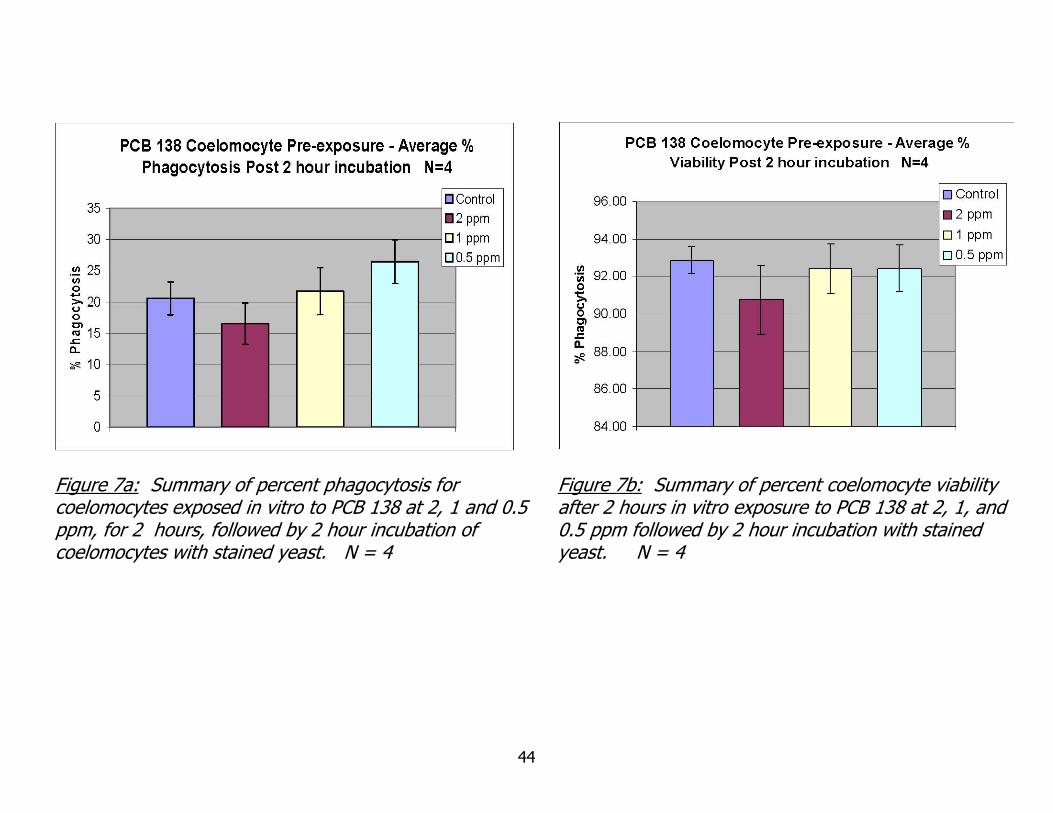
7. (a) Comparative cell exposure assay: percent phagocytosis for cells exposed to 0.5, 1.0 and 2.0 ppm PCB 138 in vitro .........................................................44
(b) Comparative cell exposure assay: percent viability for cells exposed to 0.5, 1.0 and 2.0 ppm PCB 138 in vitro................................................................44
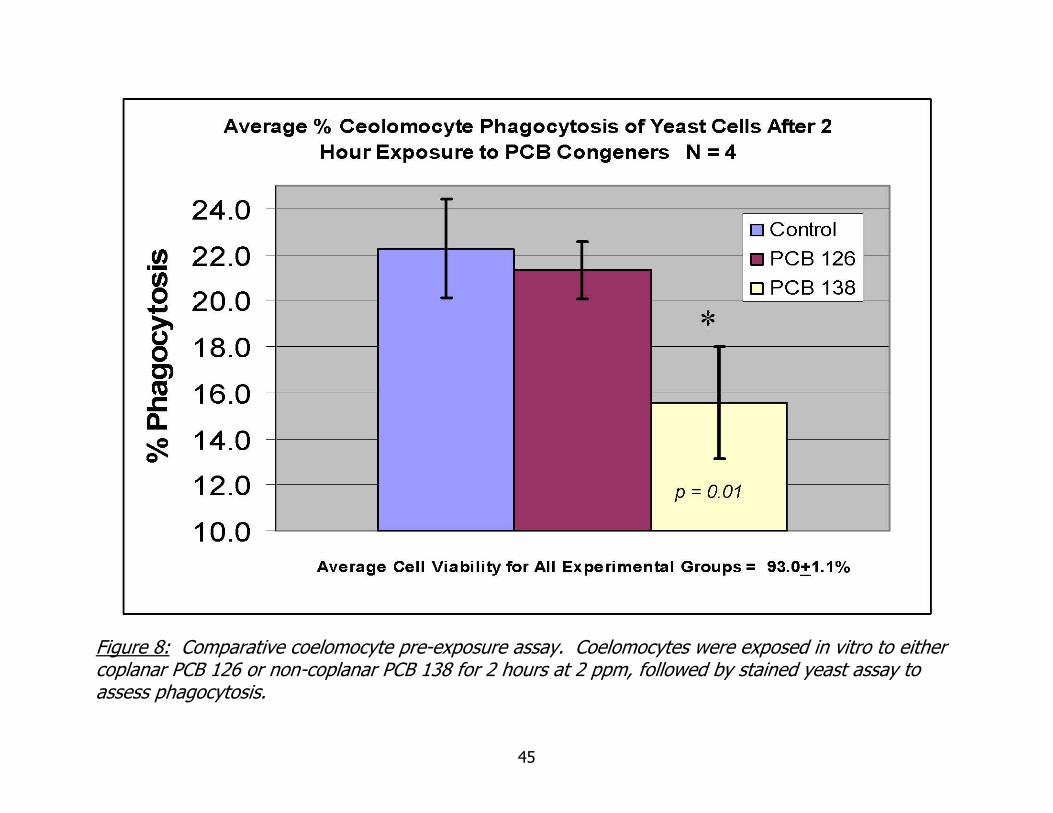
8. Comparative ceolomocyte pre-exposure assay coelomocytes exposed to co-planar PCB 126 and PCB 138 at 2 ppm in vitro .............................................45
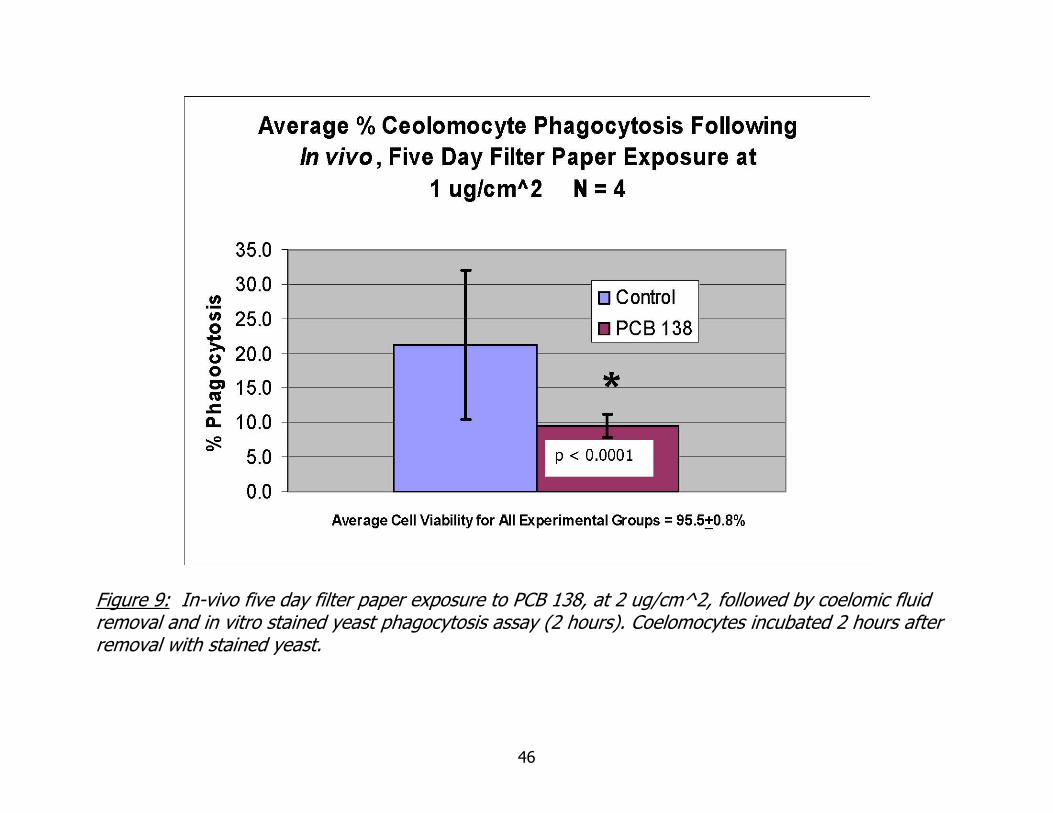
9. In vivo five day filter paper exposure to PCB 138 at 2 ug/cm2 followed by in vitro phagocytosis assay ....................................................................................46
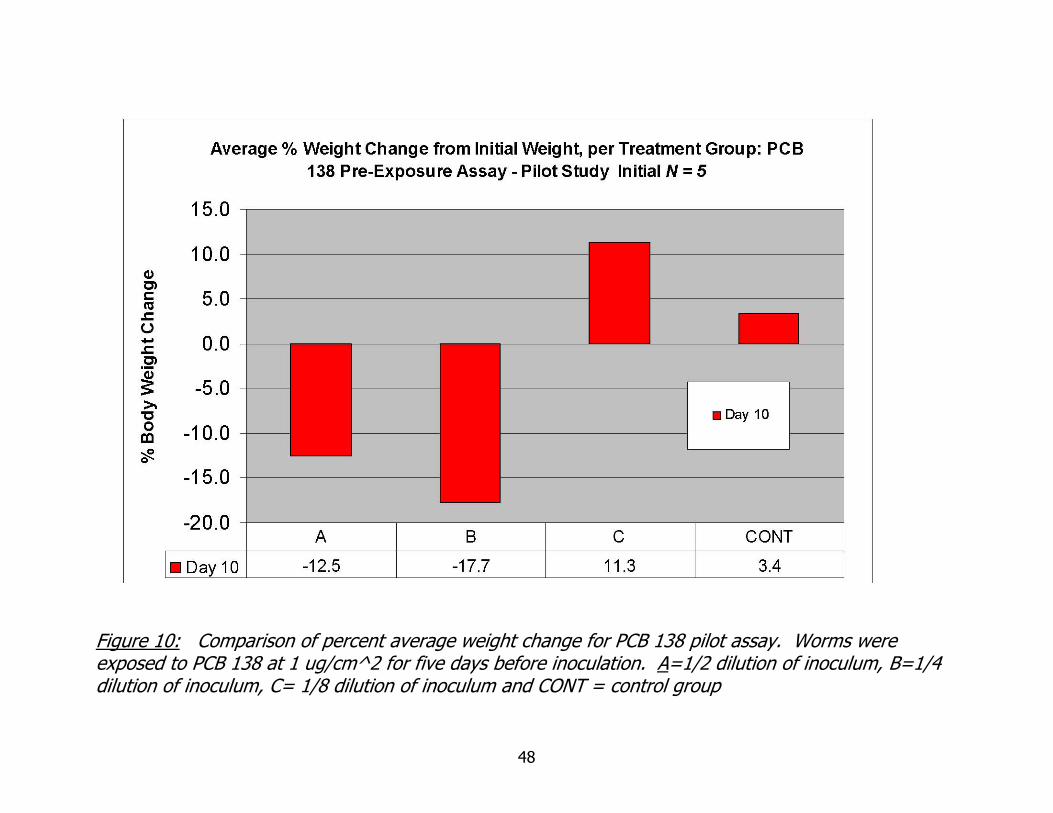
10. PCB 138 pilot assay: percent average weight change for experimental groups ................................................................................................................48
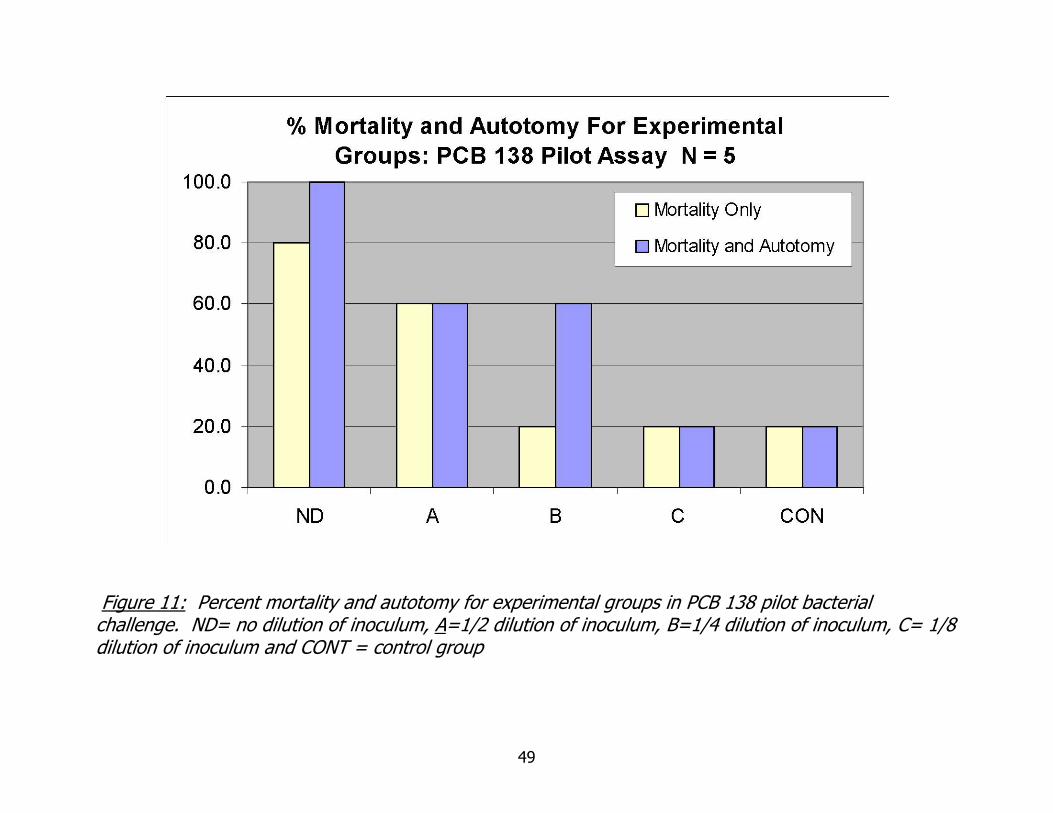
11. PCB 138 pilot assay: percent autotomy and mortality for experimental groups ................................................................................................................49
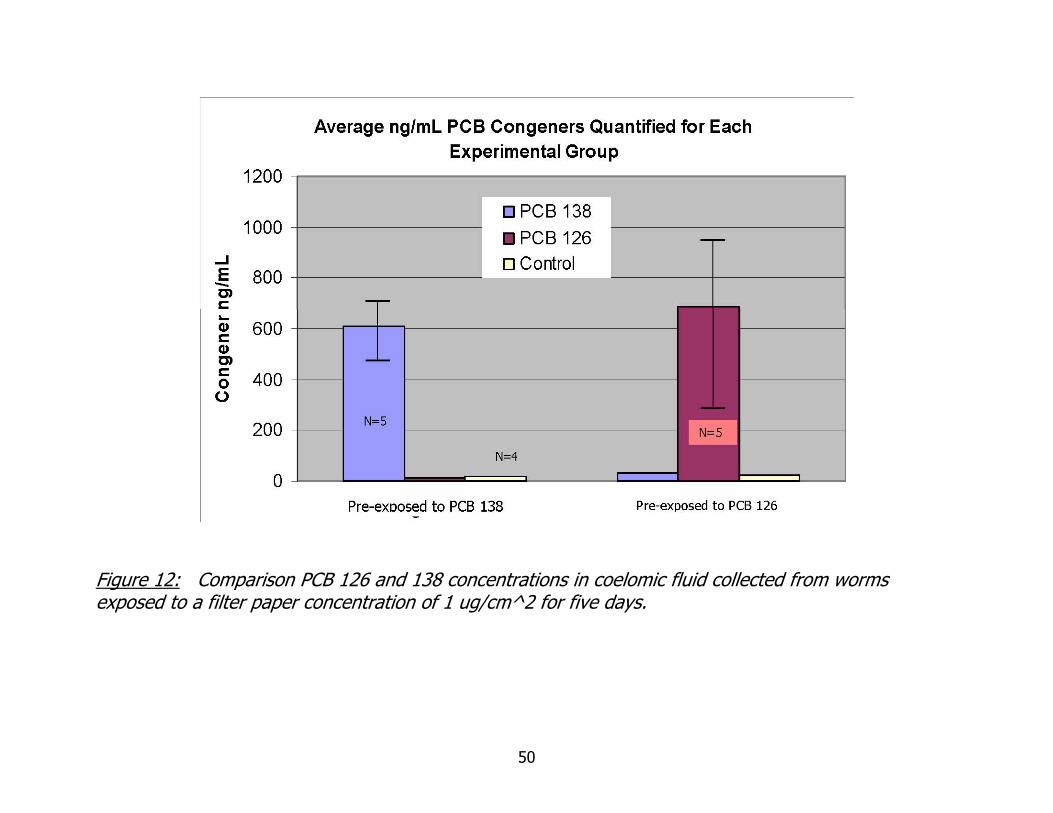
12. Quantification of PCB 126 and 138 in coelomic fluid......................................50
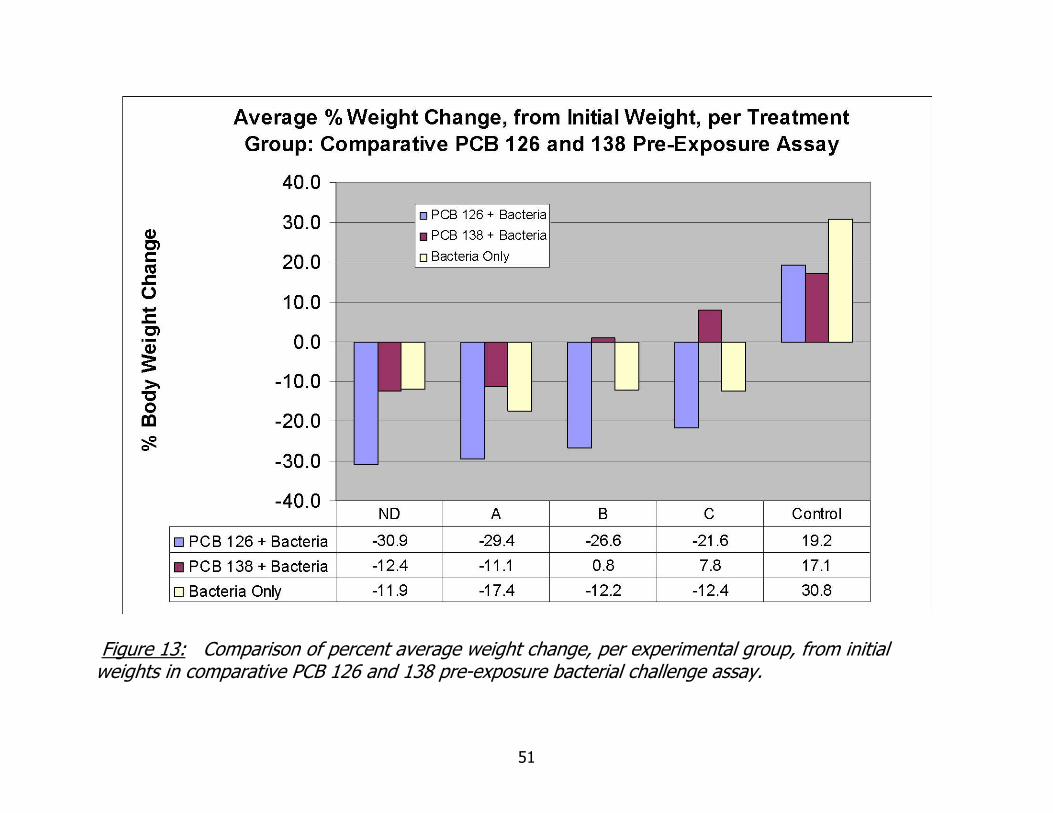
13. Comparative PCB 126 and 138 bacterial challenge assay: percent weight change for experimental groups .............................................................................51
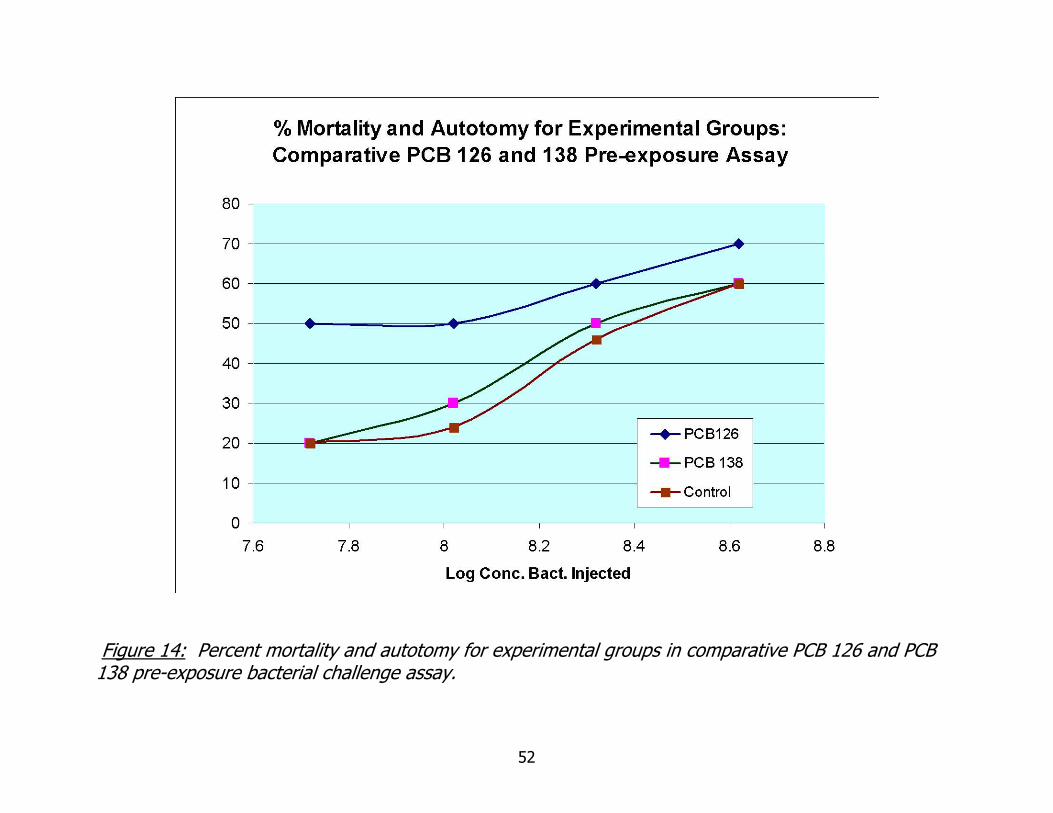
14. Comparative PCB 126 and 138 bacterial challenge assay: percent mortality and autotomy for experimental groups...............................................................52
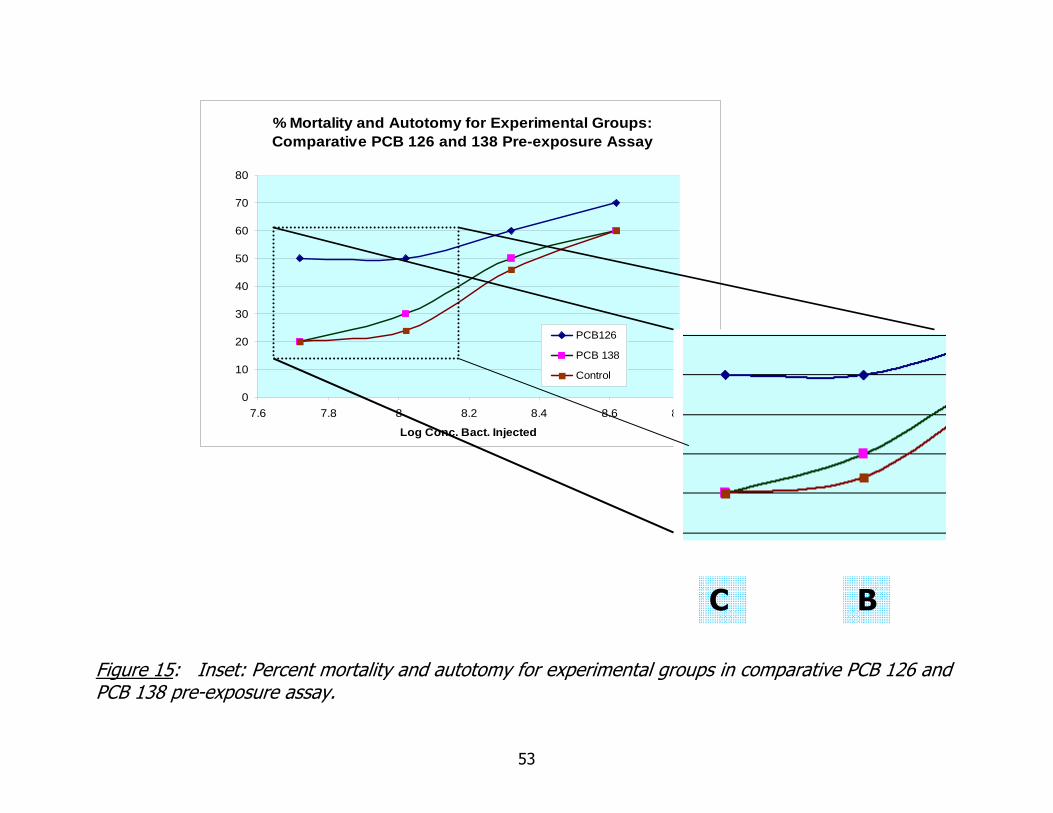
15. Comparative PCB 126 and 138 bacterial challenge assay: inset emphasizing results in experimental groups B and C ........................................................53
viii
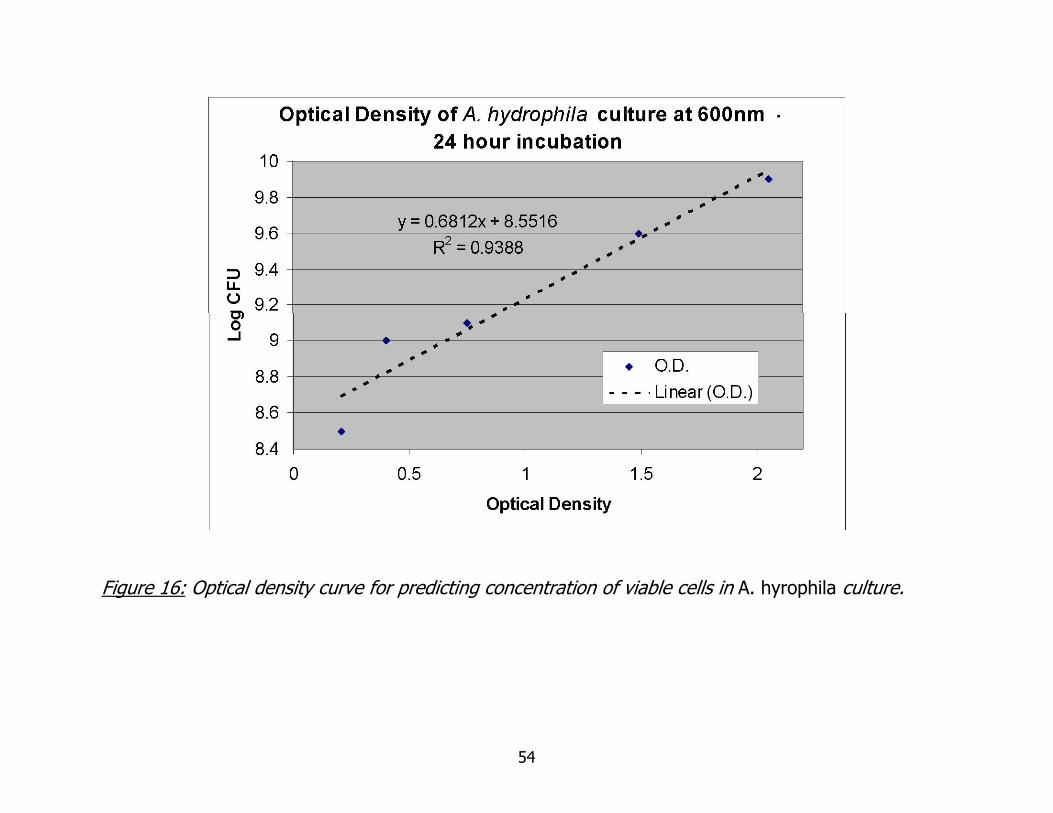
16. Optical density curve for predicting concentration of viable cells in A. hydrophila culture ......................................................................................................54
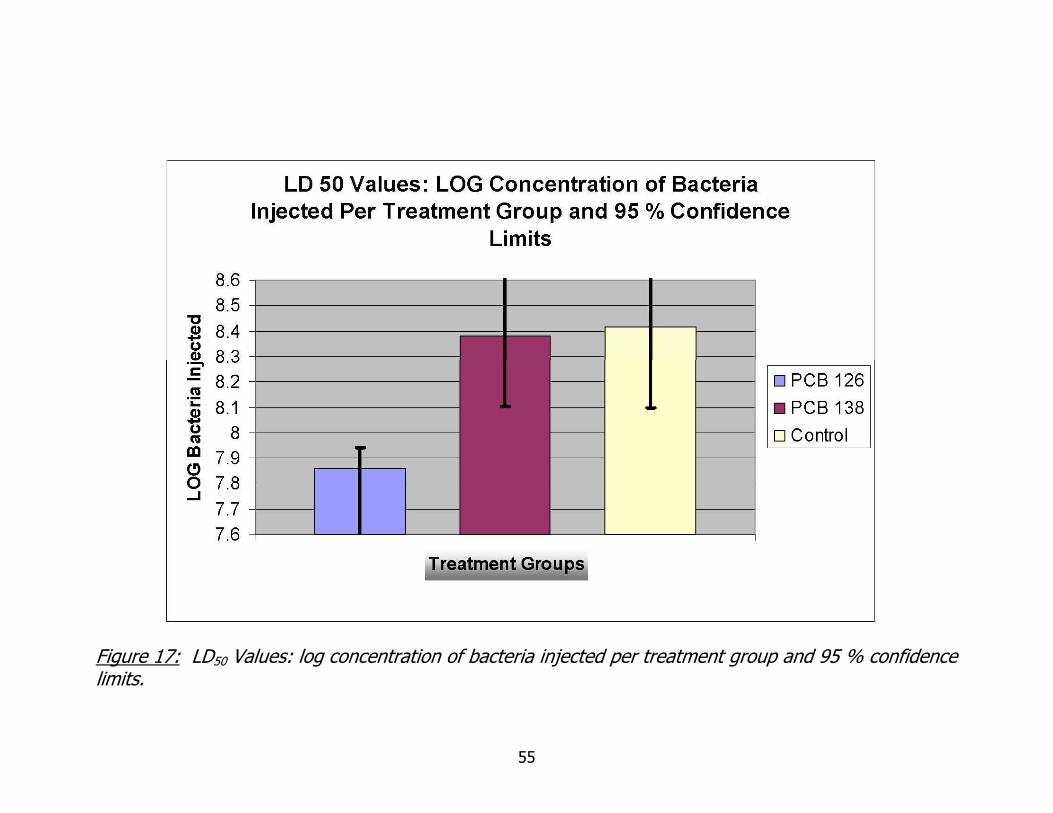
17. Log concentration of bacteria injected per treatment group and 95% confidence limits ........................................................................................................55
CHAPTER 1
INTRODUCITON
Earthworms, including Lumbricus terrestris, have been utilized to develop
immunotoxicity models. These models have examined a variety of biological processes
to assess suppression or inhibition after exposure to known immunotoxicants. Assays
utilizing coelomocytes harvested from L. terrestris and exposed to Aroclor 1254, a
mixture of polychlorinated biphenyls (PCBs), suggest that PCBs suppress a natural
killing like reaction (Suzuki, Cooper et al. 1995). Exposure to Aroclor 1254 also
appeared to significantly diminish phagocytic activity in L. terrestris coelomocytes,
reducing phagocytic activity from 79.53+1.44% in unexposed worms, to 28.86+1.83%
in exposed worms (Ville, Roch et al. 1995). Exposure to chlordane, a chlorinated
organic chemical, significantly suppressed wound healing in exposed earthworms
(Cikutovic, Fitzpatrick et al. 1999).
Bacterial inoculation assays utilizing Eisenia foetida, another species of
earthworm, are numerous and address several aspects of immune response, including
production of lysozymes, fetidins and other novel antimicrobial constituents (Pan, Liu et
al. 2003). Bacterial challenges in E. foetida have utilized the injection of live Escherichia
coli K12, Bacillus subtilis W23 and Aeromonas hydrophila cultures (Kohlerova, Beschin
et al. 2004). However, these assays have primarily examined the production of cellular
- 1
products after inoculation and did not establish lethal dose values. Research utilizing a
complete bacterial challenge assay is lacking.
Bacterial assays utilizing L. terrestris are not as abundant as those utilizing E.
foetida, and the majority of these also examine antimicrobial factor production. A
single experiment involving L. terrestris inoculated with A.hyrophila, following exposure
to Aroclor 1254, was found during the course of my research. The results from this
experiment suggested to researchers that A. hydrophila was not pathogenic to L.
terrestris and that exposure to Aroclor 1254 reduced phagocytic activity in those
exposed (Ville, Roch et al. 1995). Specific details lacking in this experiment, examined
more thoroughly in the Discussion section of the thesis, paired with the paucity of
research utilizing a complete bacterial challenge in L. terrestris inspired me to
reexamine this topic.
In addition, the research mentioned previously utilized a technical mixture of
PCBs known as Aroclor 1254. The effects noted due to exposure to this technical mix
could not be attributed to any single PCB contained in the mixture. Recent information
regarding the immunotoxic effects of specific PCB congeners suggests that the
mechanisms of toxicity for specific PCBs may be different, based on their chemical
structure, and that the traditional method for assessing PCB toxicity is inadequate.
Studies examining single PCB congeners and their effects on immune function are
needed to link structure and effect as directly as possible.
In summary, L. terrestris have been utilized to examine a variety of immunotoxic
substances but not in the framework of a bacterial challenge assay. Earthworms are
- 2 -
abundant and are in intimate contact with soil and have been shown to bioaccumulate
contaminants (such as PCBs) contained in their environment. Field studies investigating
the bioavailability and bioaccumulation of polycyclic aromatic hydrocarbons in
earthworms exposed to contaminated soil confirm the uptake and impact (inactivity,
swelling and weight loss) of these contaminants on the ecological fitness of earthworms
(Jager, Van Der Wal et al. 2005; Parrish, White et al. 2006). This recent work is among
the few studies demonstrating ecologically significant effects in the field.
In addition, the relevance of developing an invertebrate immunotoxicity model is
well founded in the fact that the innate immune functions of invertebrates are
comparable to those of vertebrates. What impairs the function of invertebrate species
would predictably impair vertebrate species as well.
The objective for my thesis research was to develop a bacterial challenge model,
utilizing L. terrestris, which would link exposure to selected PCB congeners to
immunotoxic effects. This would provide a relevant model for the investigation of
immunotoxic effects of xenobiotics in terrestrial ecosystems.
The research was separated into 3 stages, with the completion of each stage
allowing for advancement to the next. Those stages were:
1. Determination of lethal and sublethal endpoint inoculation doses of A. hydrophila in
L. terrestris.
1. A. Determination of an inoculation dose at which fifty percent of the treated
worms die within 10 days post-inoculation (10-day LD50) with A. hydrophila.
- 3 -
1. B. Measurement and observation of weight loss and decreased activity, post-
inoculation, to establish effect concentrations (EC’s) for these sub-lethal endpoints.
LD and EC concentrations, (concentrations at which a given proportion of test
organisms manifest a given end-point response), may vary depending on endpoints
measured and therefore exhibit different levels of sensitivity to exposure
2. Assess the importance of co-planar structure of immunosuppressive PCBs in L.
terrestris.
2. A. Determine if PCB congener-specific differences seen in in-vitro mammalian
phagocytosis assays can be duplicated using L. terrestris coelomocytes.
2. B. Determine if PCB congener-specific differences in immunosuppression
indicated by in-vitro assays with L. terrestris are predictive of in vivo
immunosuppression, as indicated by increased whole-animal susceptibility to the
pathogen-challenge assay developed in Objective 1.
3. Based on the results of stages 1 and 2, evaluate the L. terrestris/ A. hydrophila host/
pathogen assay as a model for the investigation of immunotoxic effects of xenobiotics
in terrestrial ecosystems.
- 4 -
CHAPTER II
LITERATURE REVIEW
Earthworm Ecotoxicology
The acute earthworm toxicity test established in 1983 for use in chemical risk
assessments, was an important milestone in the development of earthworm
ecotoxicology testing. The use of E. fetida in this test established the earthworm as
model organism for toxicity testing. Since that time, numerous recommendations and
criteria for the standardization of laboratory testing methods have been established.
Recommendations and criteria developed during International Workshops on
Earthworm Ecotoxicology (IWEE), the most recent held in 2001, focus on the
advancement of earthworm assays beyond acute toxicity to incorporate
ecophysiological effects, establish biomarker techniques and validate these advances by
establishing mechanisms of toxicity through their use (Spurgeon, Weeks et al. 2003).
Cellular based biomarker assays, one of the four general categories of biomarkers
established by IWEE, range from assessment of coelomocyte membrane stability to
cellular immune functions and even assessment of earthworm sperm counts (Cikutovic,
Fitzpatrick et al. 1993).
Despite the existence of such a coordinated, focused research community,
invertebrate phyla are underutilized in ecotoxicological studies and of those species
studied, there is an apparent bias. Millions of invertebrate species, compared to only
- 5 -
45,000 vertebrate, function on the relatively simplistic mechanisms of innate immunity,
yet the majority of ecological immunology research is conducted utilizing vertebrates
(Rolff and Siva-Jothy 2003). Of the research which utilizes invertebrate species, an
abundance of information exists concerning marine invertebrates, specifically the
phylum Mollusca, due to the fact that they are edible and susceptibility to disease
directly impacts marine food resources (Galloway and Depledge 2001). The selection of
species utilized in research has not been driven by ecological relevance but by
anthropogenically driven considerations.
Invertebrates and Immunity Investigation of the immune functions and processes in invertebrates forms the
very basis of cellular immunology. When a starfish larva was pierced with a rose thorn,
in December of 1882 by Russian zoologist Elie Metchnikoff, the phagocytosis observed
became the basis of realization of the broader role this mechanism plays throughout the
entire animal kingdom (Beck and Habicht 1996). Metchnikoff’s work with the starfish
would eventually form the basis of support for the concept that host defense
mechanisms of all “modern animals” have their humble beginnings in the mechanisms
of “lowly” invertebrates. Comparisons between invertebrates and vertebrates then gave
rise to the discipline of comparative immunology. Interest in the innate immune
functions of invertebrates, such as phagocytosis, is not a recent phenomenon
developed as an alternative to vertebrate assays.
- 6 -
The links between immunosuppresion in earthworms to that of vertebrate
species are firmly supported by research in invertebrate immunology. There are two
lines of immune defense, innate and acquired. Innate immunity functions via a
multitude of effector-driven mechanisms that are non-specific and generate a variety of
responses. Innate immunity is comprised of humoral and cell mediated responses that
are not enhanced by repeated encounters with the same pathogen or foreign agent.
Invertebrates posses only innate immunity, with the first immune defenses being cell
mediated phagocytosis and encapsulation, presumably driven by pattern recognition
proteins (Nappi and Ottaviani 2000). Vertebrates have both innate and acquired
immune responses at their disposal, with the added capacity to express antigen-specific
receptors and antibodies that result in enhanced responses to repeated antigen
exposure with lasting immunological memory.
Even with such evolutionary advancements, the innate immune response of
vertebrates parallels that of invertebrates, attesting to the common ancestry evident in
both despite the phylogenetic distance. This conservation of basic immune function is
the basis of support for the development of invertebrate surrogate models to assess
sub-lethal toxicity and immune suppression mechanisms in terrestrial ecosystems.
The coelomic cavity of the earthworm is teeming with bacterial, protozoan and
fungal populations. The concentration of bacteria naturally inherent to the coelomic
cavity of Eisenia foetida is approximately 6 x 10 ^5/ mL of coelomic fluid (Dales and
Kalac 1992). These organisms are thought to enter the coelomic cavity primarily
through the dorsal pores from the surrounding environment. The presence of these
- 7 -
populations is not pathogenic to the earthworm due to the fact that the number of
phagocytic cells, called coelomocytes, present in the earthworm’s coelomic fluid is ten
times greater (Kohlerova, Beschin et al. 2004), the excess being sufficient to prevent an
overwhelming proliferation of any pathogen populations.
All coelomocyte types in L. terrestris have the capacity to produce pseudopodia
and phagocytize non-self materials, with the exception of chloragogen cells (Dhainaut
and Scaps 2001). Elimination of foreign microbes is achieved by phagocytosis in
conjunction with humoral immune factors, such as agglutinins and lysosomal enzymes,
that result in lysis (Engelmann, Molnar et al. 2004). In addition, the septa which
separate the segments of the earthworm regulate the passage of coelomic fluid and
cells from one segment to the next, functioning as a kind of compartmentalization
mechanism.
Phagocytosis is of extreme importance in limiting the various microbial
populations within the coelomic cavity and any inhibition of this function is a direct
threat to the organism’s ability to survive. Exposure to chemicals (specific examples
identified and discussed in depth below) that reduce phagocytic capacity, or total
number of coelomocytes, weakens immune function. Failure to maintain homeostasis,
or an introduction of bacterial numbers beyond the phagocytic capacity of
coelomocytes, can result in septicemia and ultimately death. In the specific case of A.
hydrophila, the pathogenic effects of this microorganism in E. foetida were additionally
attributed to the production of exotoxins (Dales 1991). With respect to L. terrestris, A.
- 8 -
hydrophila was previously assumed to be nonpathogenic (Ville, Roch et al. 1995) but
results during the course of my research have indicated otherwise.
In summary, the innate immune response is common and of vital
importance to maintaining homeostasis in both vertebrates and invertebrates.
Mechanisms of innate immunity, such as phagocytosis, that are compromised in the
earthworm as a function of exposure to certain chemicals may have potential as
biomarkers for predicting immunotoxicity to a wide range of invertebrate and vertebrate
innate immune responses.
PCBs and Phagocytosis
Environmental organochlorine contaminants, such as polychlorinated biphenyls
(PCBs), are distributed throughout our environment and bioaccumulate in tissues and
induce well documented immunosuppressive effects in laboratory animals and wildlife
(Levin, Morsey et al. 2005). Effects of PCB exposure (technical mix Aroclor 1254) on
immune functions in L. terrestris include suppression of secretory rosette formation
(Fitzpatrick, Sassani et al. 1992), suppression of phagocytosis (Burch, Fitzpatrick et al.
1999) , reduction in cell viability (Goven, Fitzpatrick et al. 1994), reduction in wound
healing capacity (Ville, Roch et al. 1995), (Cikutovic, Fitzpatrick et al. 1999) and
suppression of a natural killing-like response in coelomocytes (Suzuki, Cooper et al.
1995).
PCBs are persistent environmental pollutants and known immunotoxicants. Until
recently, their toxicity has been assessed utilizing the concept of the toxicity
- 9 -
equivalency factor (TEF). However, current research indicates that this concept is not
sufficient to predict the toxicity of individual PCB congeners.
TEF Concept and the ArH Receptor
The toxicity of PCBs has traditionally been assessed using the TEF concept,
which is based on the structural similarity of PCB congeners to 2,3,7,8-
Tetrachlorodibenzo-p-dioxin (TCDD). The application of this concept ranked coplanar
PCBs more toxic than non-coplanar congeners. The toxicity equivalency factor (TEF)
approach is based on the affinity of various polychlorinated dibenzo-p-dioxins,
dibenzofurans and various biphenyls to bind to the cytosolic aryl hydrocarbon (Ah)
receptor protein (Safe 1998). Binding results in the induction of a wide range of Ah
receptor-mediated toxic responses, including phase I cytochrome P450-dependent
monooxygenases and multiple additional phase I and phase II drug metabolizing
enzymes. TEFs are based on the high acute toxicity of TCDD (2,3,7,8-
Tetrachlorodibenzo-p-dioxin), whose major cellular target is the Ah receptor. Extensive
research indicates that there is a rank order correlation for structure-Ah receptor
binding activity among different structural classes of the above mentioned chemicals.
TEFs were initially derived from enzyme induction potency ratios using 2,3,7,8-TCDD as
the reference toxin. Major assumptions underlie the use of TEFs as toxicity indicators:
1) toxic effects of each halogenated aromatic hydrocarbon in a mixture are basically
additive; 2) all have a common mode of action based on binding to the Ah receptor and
initiation of biochemical and toxic responses. Only lipophilic and environmentally
- 10 -
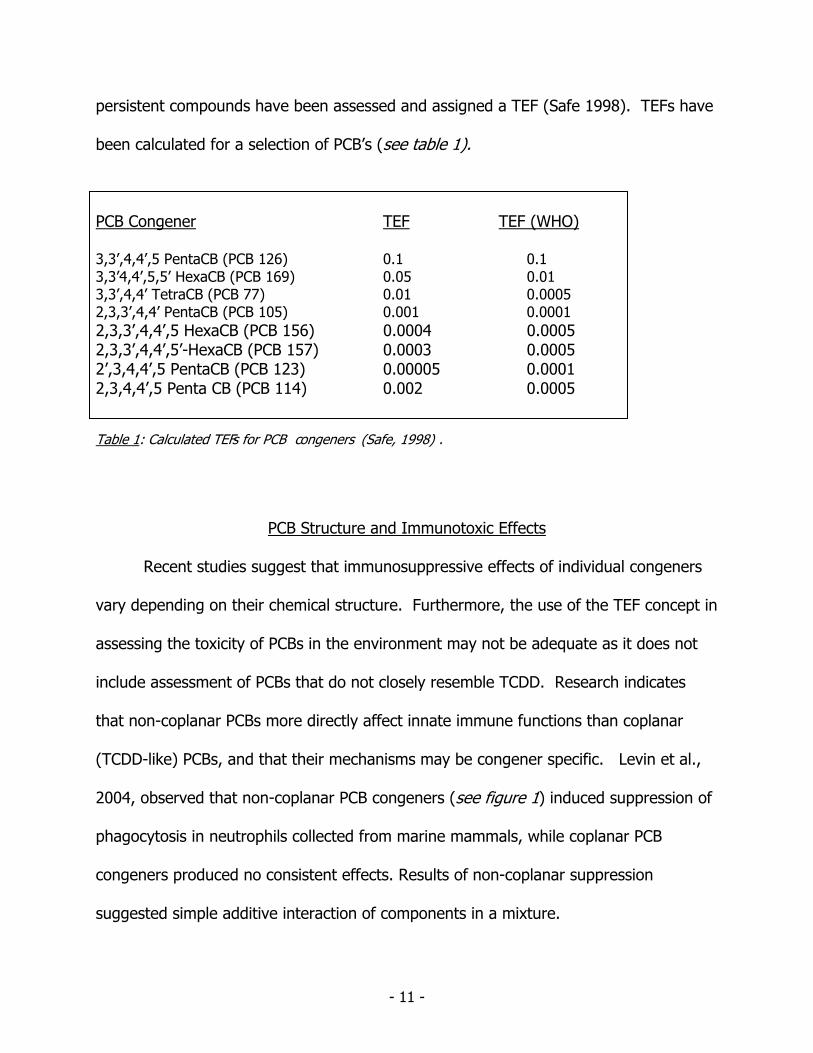
persistent compounds have been assessed and assigned a TEF (Safe 1998). TEFs have
been calculated for a selection of PCB’s (see table 1).
PCB Congener TEF TEF (WHO)
3,3’,4,4’,5 PentaCB (PCB 126) 0.1 0.1 3,3’4,4’,5,5’ HexaCB (PCB 169) 0.05 0.01 3,3’,4,4’ TetraCB (PCB 77) 0.01 0.0005 2,3,3’,4,4’ PentaCB (PCB 105) 0.001 0.0001 2,3,3’,4,4’,5 HexaCB (PCB 156) 0.0004 0.0005 2,3,3’,4,4’,5’-HexaCB (PCB 157) 0.0003 0.0005 2’,3,4,4’,5 PentaCB (PCB 123) 0.00005 0.0001 2,3,4,4’,5 Penta CB (PCB 114) 0.002 0.0005
Table 1: Calculated TEFs for PCB congeners (Safe, 1998) .
PCB Structure and Immunotoxic Effects
Recent studies suggest that immunosuppressive effects of individual congeners
vary depending on their chemical structure. Furthermore, the use of the TEF concept in
assessing the toxicity of PCBs in the environment may not be adequate as it does not
include assessment of PCBs that do not closely resemble TCDD. Research indicates
that non-coplanar PCBs more directly affect innate immune functions than coplanar
(TCDD-like) PCBs, and that their mechanisms may be congener specific. Levin et al.,
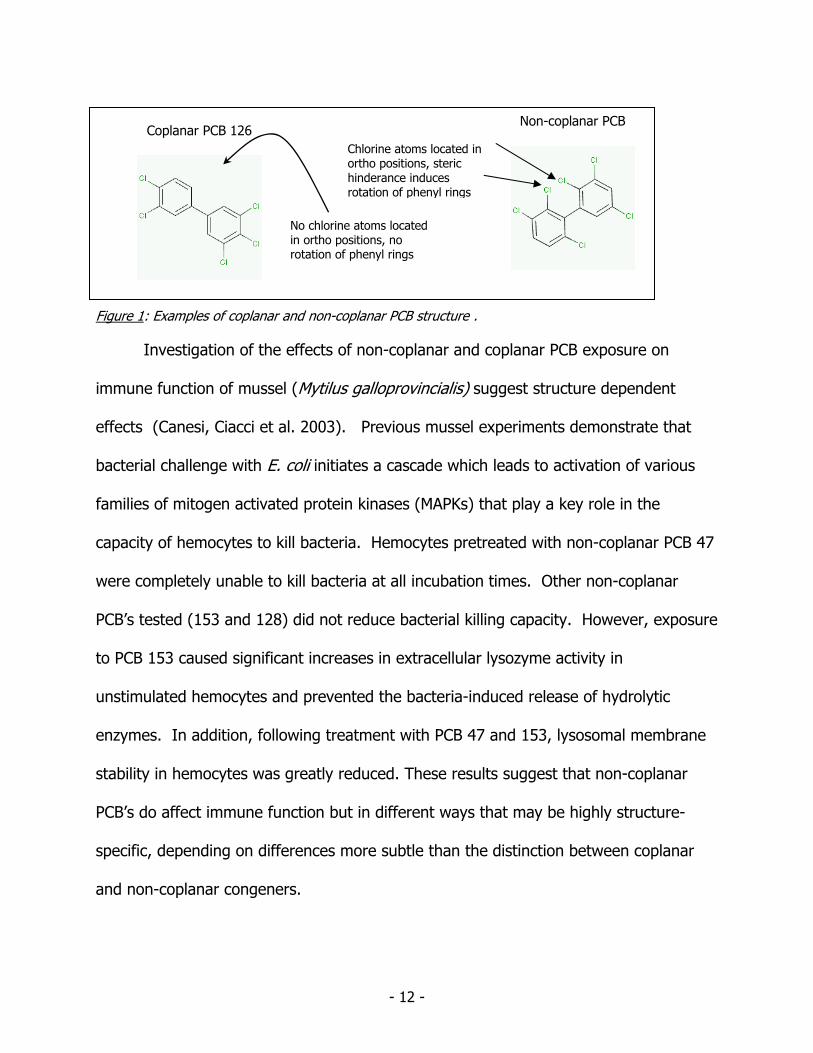
2004, observed that non-coplanar PCB congeners (see figure 1) induced suppression of
phagocytosis in neutrophils collected from marine mammals, while coplanar PCB
congeners produced no consistent effects. Results of non-coplanar suppression
suggested simple additive interaction of components in a mixture.
- 11 -
Coplanar PCB 126
n
Non-coplanar PCB
Chlorine atoms located iortho positions, steric hinderance induces rotation of phenyl rings
No chlorine atoms located in ortho positions, no rotation of phenyl rings
Figure 1: Examples of coplanar and non-coplanar PCB structure .
Investigation of the effects of non-coplanar and coplanar PCB exposure on
immune function of mussel (Mytilus galloprovincialis) suggest structure dependent
effects (Canesi, Ciacci et al. 2003). Previous mussel experiments demonstrate that
bacterial challenge with E. coli initiates a cascade which leads to activation of various
families of mitogen activated protein kinases (MAPKs) that play a key role in the
capacity of hemocytes to kill bacteria. Hemocytes pretreated with non-coplanar PCB 47
were completely unable to kill bacteria at all incubation times. Other non-coplanar
PCB’s tested (153 and 128) did not reduce bacterial killing capacity. However, exposure
to PCB 153 caused significant increases in extracellular lysozyme activity in
unstimulated hemocytes and prevented the bacteria-induced release of hydrolytic
enzymes. In addition, following treatment with PCB 47 and 153, lysosomal membrane
stability in hemocytes was greatly reduced. These results suggest that non-coplanar
PCB’s do affect immune function but in different ways that may be highly structure-
specific, depending on differences more subtle than the distinction between coplanar
and non-coplanar congeners.
- 12 -
Degranulation and superoxide production in rat neutrophils occurred following
exposure to non-coplanar PCB 47(Brown and Ganey 1995). Superoxide production
following exposure was dependent on the presence of extracellular calcium. These
results suggest that non-coplanar PCBs may alter neutrophil function by initiating signal
transduction pathways that result in superoxide production and degranulation.
Coplanar PCB 77, which has a high affinity for the Ah receptor, failed to affect
superoxide production or degranulation.
Non-coplanar PCBs 52, 47, 28 and 8 all caused loss of membrane integrity in rat
cerebellar granule cells (Tan, Song et al. 2004). These PCBs also caused an increase in
intracellular calcium levels that suggest an alteration in cellular calcium signaling
mechanisms after exposure. Three coplanar PCB’s (77, 80 and 81) did not reduce
membrane integrity at the same concentrations over the same period of time and
effects in intracellular calcium levels were not different from DMSO treated controls.
Examination of the position and number of chlorine substitutions in non-coplanar
PCBs suggests that specific substitution positions are more active than others.
Structure –activity relationships (SAR) studies concerning non-coplanar PCBs reveal a
hierarchy of potency with respect to increasing protein kinase C (PKC) translocation in a
dose dependent manner (Fischer, Seegal et al. 1998). The PKC family of kinases are
fundamental in cellular signaling transduction. The most potent congeners are those
with only ortho-substitution, such as PCB 4, or ortho-lateral substitutions ( PCBs 52,
94). Congeners with only para substitution or high meta and para substitution in the
- 13 -
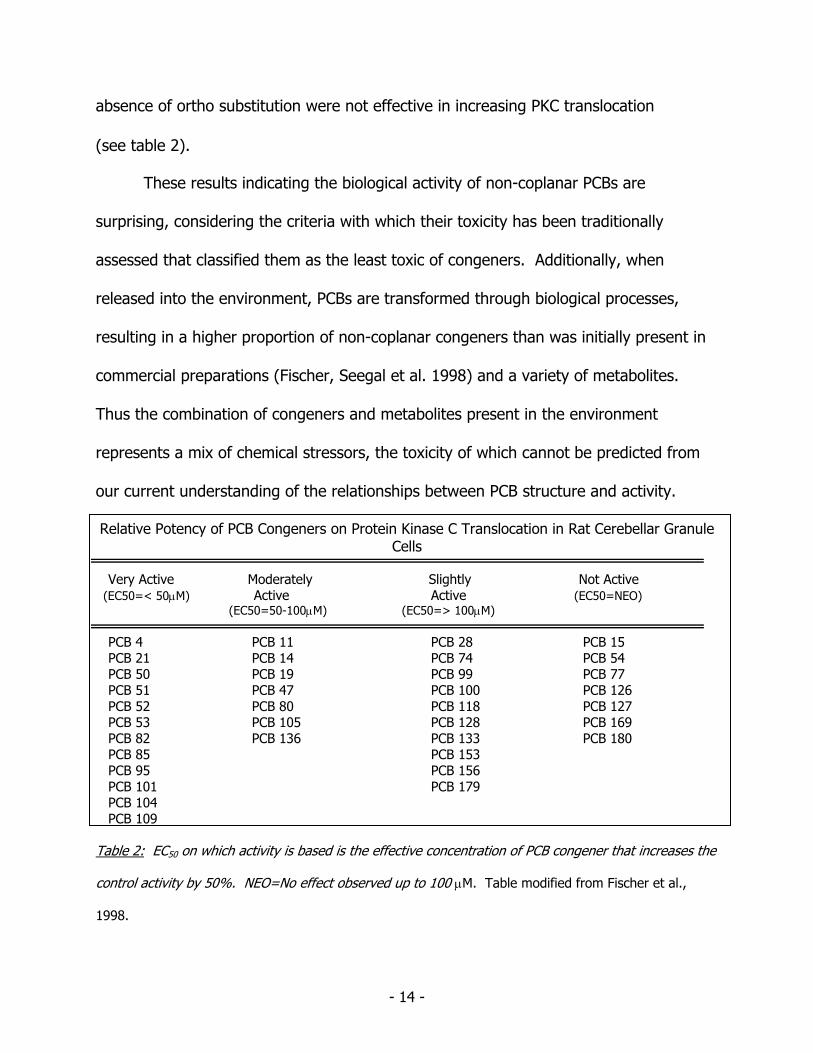
absence of ortho substitution were not effective in increasing PKC translocation (see table 2).
These results indicating the biological activity of non-coplanar PCBs are
surprising, considering the criteria with which their toxicity has been traditionally
assessed that classified them as the least toxic of congeners. Additionally, when
released into the environment, PCBs are transformed through biological processes,
resulting in a higher proportion of non-coplanar congeners than was initially present in
commercial preparations (Fischer, Seegal et al. 1998) and a variety of metabolites.
Thus the combination of congeners and metabolites present in the environment
represents a mix of chemical stressors, the toxicity of which cannot be predicted from
our current understanding of the relationships between PCB structure and activity.
Relative Potency of PCB Congeners on Protein Kinase C Translocation in Rat Cerebellar Granule Cells
Very Active Moderately Slightly Not Active (EC50=< 50μM) Active Active (EC50=NEO) (EC50=50-100μM) (EC50=> 100μM) PCB 4 PCB 11 PCB 28 PCB 15 PCB 21 PCB 14 PCB 74 PCB 54 PCB 50 PCB 19 PCB 99 PCB 77 PCB 51 PCB 47 PCB 100 PCB 126 PCB 52 PCB 80 PCB 118 PCB 127 PCB 53 PCB 105 PCB 128 PCB 169 PCB 82 PCB 136 PCB 133 PCB 180 PCB 85 PCB 153 PCB 95 PCB 156 PCB 101 PCB 179 PCB 104 PCB 109 Table 2: EC50 on which activity is based is the effective concentration of PCB congener that increases the
control activity by 50%. NEO=No effect observed up to 100 μM. Table modified from Fischer et al.,
1998.
- 14 -
The review of literature traces the exploration of cellular impacts as a function
of PCB structure, chlorine substitution number and position, beyond the single yardstick
of similarity of a conger to 2,3,7,8-TCDD. The current picture of the impacts these
environmentally ubiquitous chemicals have on all the biological systems exposed to
them is incomplete. Cellular research that is congener specific can compare and
contrast individual effects on cellular mechanisms. However, environmental exposures
are not limited to one or two congeners and the effects of exposure on complex, whole
animal systems cannot be directly inferred from the results of cellular studies.
The most direct path to address terrestrial exposure and its effect on
immunological function is to use an animal that is in consistent, intimate contact with its
environment and possess an immune response mechanism that is sufficiently “simple”
and well studied. Earthworms meet all these criteria. An in vivo pathogen challenge
assay, conducted using earthworms exposed to specific PCB congeners, provides a
clear, straight-forward ecologically realistic evaluation of exposure.
- 15 -
CHAPTER III
MATERIALS AND METHODS
The goal of my experimental design was a series of experiments that would
build one upon the other, forming a complete picture linking PCB exposure to whole
animal fitness/impairment. The first step was to develop the bacterial challenge assay.
A. hydrophila was selected as the pathogen and worms were inoculated with serial
dilutions of bacterial culture. This assay established an LD50 for A. hydrophila,
characterizing mortality that was due solely to pathogen exposure. The second step
was to determine if exposing coelomocytes to select PCB congeners would affect in
vitro phagocytosis in a similar manner as that observed in in vitro mammalian studies.
The third step was to perform an in vivo experiment, using the bacterial challenge
assay combined with a pre-exposure period to select PCB congeners. The goal of this
final step was to demonstrate the use of an ecologically significant, whole animal
endpoint (pathogen susceptibility as indicated by mortality) with PCB congener
specificity. Increased mortality at the same, or lower pathogen inoculation doses, would
indicate an inhibition of phagocytosis and decreased ability to resist infection.
- 16 -
Section 1: Bacterial Challenge Assay
L. terrestris Supply
I bought earthworms at The Sportsman in Sanger, Texas. These worms were
chosen for use because they appear generally healthier and more robust than worms
used for previous research purchased from scientific biological supply vendors. After
purchase and before bacterial inoculation, worms were examined and sickly (limp,
lethargic, discolored, wounded, etc.) worms were removed. Worms for this assay were
purchased the day before they were inoculated and not held under the same conditions
as subsequent assays.
Preparation for Initial Bacterial Challenge Assay
I purchased 60 extra small Zip-loc™ food storage containers to house worms
individually during the course of the assay. I punched holes in the sides of the
containers to allow air-flow. I used Glad Press-N-Seal Wrap™ to secure the worms for
bacterial injection. Additional worm soil was prepared before the assay so that each
worm could feed after injection for the entire assay duration of 10 days.
Aeromonas hydrophila Culture Preparation
Dr. Dan Kunz, professor of microbiology at the University of North Texas,
prepared a culture of A. hydrophila for my use. Dr. Kunz inoculated the culture the day
before I intended to inject and incubated at 37°C in an orbital shaker for 24 hours. The
incubated culture was plated and number of cell forming units estimated by Dr. Kunz.
- 17 -
This plate count was used to calculate the number of bacteria injected into the worms
(see table 2). Sterile culture media was used to make serial dilutions of the initial
culture.
Injection of Worms with Bacterial Culture
Serial dilutions of bacterial culture were made using sterile media: ND = no
dilution, A = ½ dilution, B= ¼ dilution, C= 1/8 dilution and D= 1/16 dilution. Controls
(Contr.) were injected with only sterile media (see table 2). I weighed each worm
before injection and selected worms between the weights of 3.5 to 4.5 g for all groups
except group D. Unfortunately, I ran out of worms in the desired weight range for
group D and had to use worms below my target range.
I injected control animals first, and then the lowest dilution group followed by
the next lowest dilution group. This was done to ensure that the injection syringe did
not become contaminated with greater numbers of bacteria than intended for a dilution
group. Injection needles were changed after each group was inoculated. Worms were
rinsed with D.I. water, their waste gently expressed and were then blotted with a paper
towel before being placed on a sheet of Press-N-Seal Wrap™. I pressed the wrap
tightly around the worms with my fingers, nudging them so they would contract and be
more compact.
- 18 -
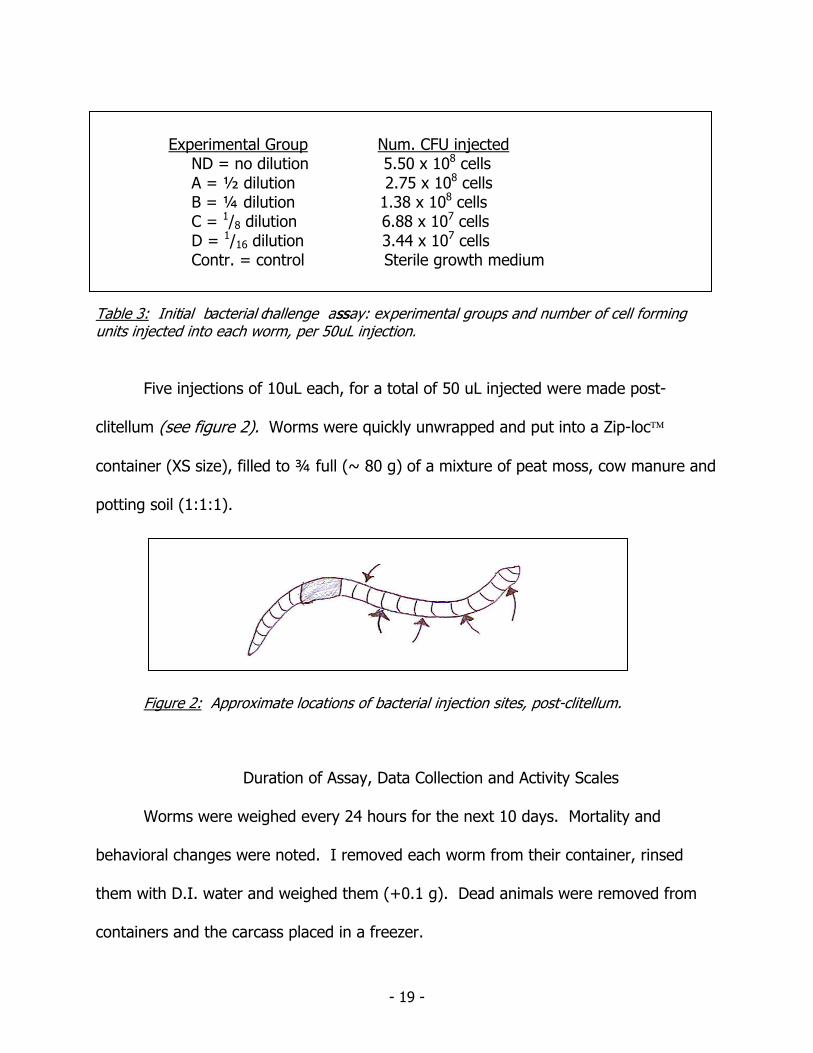
Experimental Group Num. CFU injected ND = no dilution 5.50 x 10⁸ cells A = ½ dilution 2.75 x 10⁸ cells B = ¼ dilution 1.38 x 10⁸ cells C = 1/8 dilution 6.88 x 10⁷ cells D = 1/16 dilution 3.44 x 10⁷ cells Contr. = control Sterile growth medium
Table 3: Initial bacterial challenge assssay: experimental groups and number of cell forming units injected into each worm, per 50uL injection.
Five injections of 10uL each, for a total of 50 uL injected were made post-
clitellum (see figure 2). Worms were quickly unwrapped and put into a Zip-loc™
container (XS size), filled to ¾ full (~ 80 g) of a mixture of peat moss, cow manure and
potting soil (1:1:1).
Figure 2: Approximate locations of bacterial injection sites, post-clitellum.
Duration of Assay, Data Collection and Activity Scales
Worms were weighed every 24 hours for the next 10 days. Mortality and
behavioral changes were noted. I removed each worm from their container, rinsed
them with D.I. water and weighed them (+0.1 g). Dead animals were removed from
containers and the carcass placed in a freezer.
- 19 -
In an attempt to assess general worm health, activity scales were developed.
Five concentric circles, spaced one inch apart and centered on a piece of blank paper
(8.5’’ x 11’’) were drawn and copies made. Worms were placed in the center of the
paper and their movement observed for 10 seconds. The distance moved from the
center circle, over the time period, determined the activity score of the worm. Worms
that did not move from the center after 10 seconds received an activity score of zero.
Activity was measured before the worm as weighed, every day for 10 days. The range
of activity scores was 0 – 5, based on the distance or furthest circle perimeter crossed
in the allotted time.
Sham Injection Assay: Culture Treatment and Experimental Groups
Three different preparations of A. hydrophila culture were made to determine if
effects observed in the bacterial challenge assay were due to only the live bacteria and
not metabolic by-products. The three preparations were heat-killed bacteria, filter-
sterilized culture and untreated culture. The viable cell count of the initial culture used
to prepare all of the treatments was 2.93 x 10^9 cfu/mL. The heat-killed culture was
placed in a water bath at 50 °C for 10 minutes. This temperature was the lowest
temperature investigated at which bacteria were killed without changing the viscosity
and appearance of the culture. The filter-sterilized culture was centrifuged for 20
minutes at 1000 rpm, the supernatant removed and passed through a 0.22 µm Millipore
filter. Control worms were injected with the media used to culture the bacteria.
- 20 -
Ten worms were used in each experimental group and injected with 50 uL
of the respective preparation. Treated worms were kept as described previously, at a
controlled temperature at 15° C for a period of 10 days. Worms were checked at two
day intervals and mortality and autotomy data were collected. Weights were not
recorded.
Section 2: Cellular Assays
Having determined an LD50 for A. hydrophila, the next step was to expose
coelomocytes to PCB congeners in vitro. However, before conducting exposures, I had
to establish cell collection, incubation and counting procedures that did not negatively
impact cell viability and result in aggregation of coelomocytes. Cells were collected
from live worms by puncturing the coelomic cavity with a hypodermic needle attached
to a length of tubing. Coelomic fluid was drawn into the tube via capillary action.
When no more fluid could be collected from the worm, the fluid was delivered into a
micro-centrifuge tube. Cell concentrations were adjusted and counts performed, exact
procedures described in the following sections. PCB congener exposure concentrations
and times were based on mammalian leukocyte research (Levin, Morsey et al. 2004).
Establishing the In Vitro Assay
Dried yeast cells were stained using Congo Red and concentration of dyed yeast
cells adjusted to 2 x 10⁷ cells/mL in Hanks Balanced Salt Solution (HBSS) as described
by Burch et. al. (1999). Coelomic fluid was removed from each of five worms and
- 21 -
placed in separate microfuge tubes, on ice. Coelomic fluid volumes ranged from 100 uL
to 450 uL. Coelomocytes were suspended in 1 mL of HBSS, centrifuged, supernatant
removed and re-suspended in 1 mL adjusted dyed yeast solution. After three hours of
incubation with stained yeast at 15°C, cell viability and percent phagocytosis were
assessed. Cell viability was determined first, using the Trypan Blue cell exclusion assay.
Chloragagon cells were not included in phagocytosis counts. Phagocytosis counts were
determined on counts of greater than 100 phagocytic coelomocyte cells. The
calculation of cell concentration was based on hemocytometer counts:
[ ] cells/mL = X x 10^4 x Y where X = total cells counted in 25 squares Y = dilution factor
An additional assay was performed to assess the effect of adding EDTA, to
reduce cell clumping, to HBSS at a concentration of 0.02% w/v. EDTA was used in
HBSS for the rest of the cell assays, based on these results.
In Vitro PCB Exposure Phagocytosis Assays
The first exposure assay was a range-finding assay to determine the in- vitro
exposure concentration of PCB 138, a non-coplanar congener, that did not drastically
reduce cell viability (< 85%). No previous data existed that indicated what the impacts
of exposure to a non-coplanar PCB on worm coelomocyte functions would be and
exposure concentrations were selected based on mammalian leukocyte exposures
(Levin, Morsey et al. 2004). Concentrations of PCB 138 at 2, 1 and 0.5 ppm were
prepared. Coelomic fluid was collected from a worm, coelomocyte number adjusted to
1.0 x 10⁷ cells/mL using HBSS, centrifuged and re-suspended in the appropriate
- 22 -
concentration of spiked PCB 138 HBSS/EDTA at <0.4% DMSO. Experimental groups
were controls, no PCB 138, and the three exposure concentrations of four replicates
each. The target PCB exposure time was 2 hours, followed by a second 2 hour
phagocytosis incubation with stained yeast. Cell incubations were performed at 15°C
on a shaker table. However, incubation times for third and fourth replicates were 30
and 45 minutes longer respectively, because of the time required to count cells. Percent
phagocytosis was calculated as a percentage of control phagocytosis.
The next assay was a comparative exposure assay in which cells were exposed
to either PCB 126, PCB 138 or HBSS/EDTA and <0.4% DMSO (controls). Cells were
exposed to concentrations of these PCBs at 2 ppm for 2 hours before introduction of
stained yeast. To add stained yeast to the exposed cells without diluting the exposure
concentration, 1 mL of adjusted stained yeast solution was spun in a micro-centrifuge
tube for 5 min @ 1000 rpm. The supernatant was removed, leaving only the stained
yeast at the bottom of the tube. The entire volume of exposed coelomocytes was then
very carefully transferred to this tube, gently vortexed and then incubated for 2 hours
at 15°C on a shaker table.
In Vivo, Five-Day Filter Exposure to PCB 138 Followed by In Vitro Phagocytosis
Assay
Five worms were exposed to PCB 138 on filter paper, at a concentration of
1ug/cm2, for a period of five days at 15°C. Five control worms were placed on filter
paper treated with solvent for five days. At the end of the five-day exposure, coelomic
- 23 -
fluid was removed from each animal, cell numbers adjusted and stained yeast cells
introduced as described above. Coelomocytes and stained yeast were then incubated
for 2 hours at 15°C on a shaker table. At the end of the incubation period, viability and
% phagocytosis were determined.
Section 3: Comparative Bacterial Challenge Assays
Bacterial Challenge Assay for PCB 138
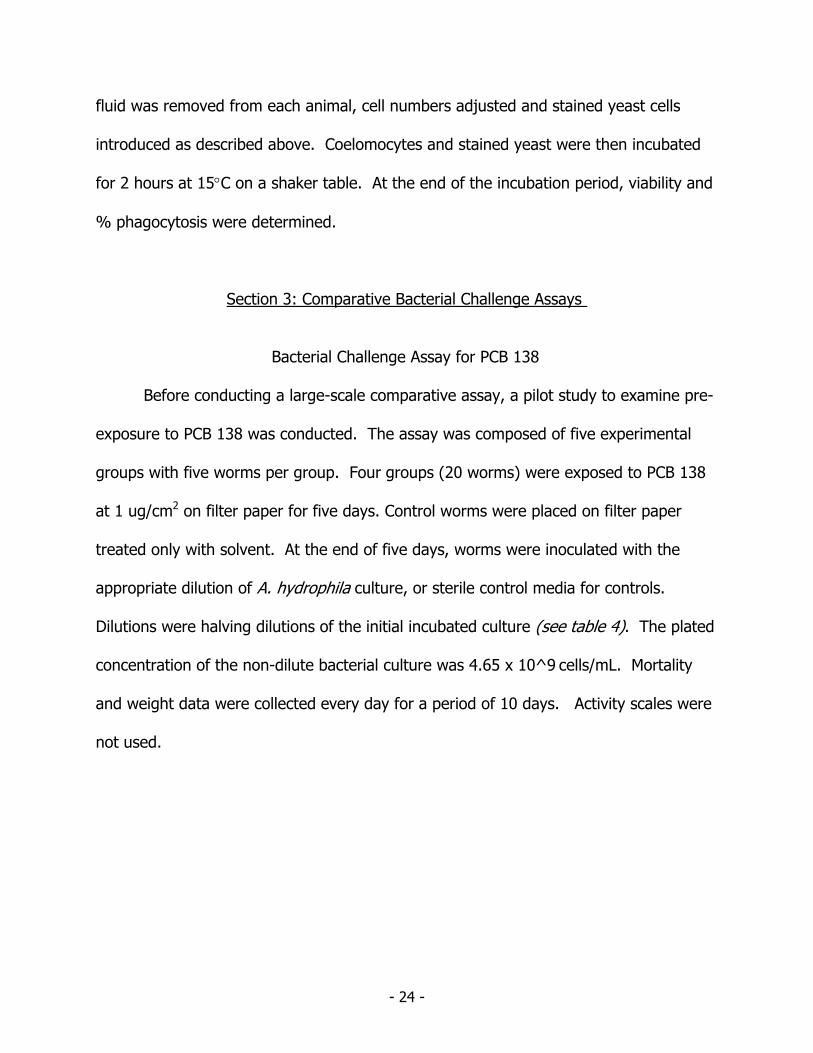
Before conducting a large-scale comparative assay, a pilot study to examine pre-
exposure to PCB 138 was conducted. The assay was composed of five experimental
groups with five worms per group. Four groups (20 worms) were exposed to PCB 138
at 1 ug/cm2 on filter paper for five days. Control worms were placed on filter paper
treated only with solvent. At the end of five days, worms were inoculated with the
appropriate dilution of A. hydrophila culture, or sterile control media for controls.
Dilutions were halving dilutions of the initial incubated culture (see table 4). The plated
concentration of the non-dilute bacterial culture was 4.65 x 10^9 cells/mL. Mortality
and weight data were collected every day for a period of 10 days. Activity scales were
not used.
- 24 -
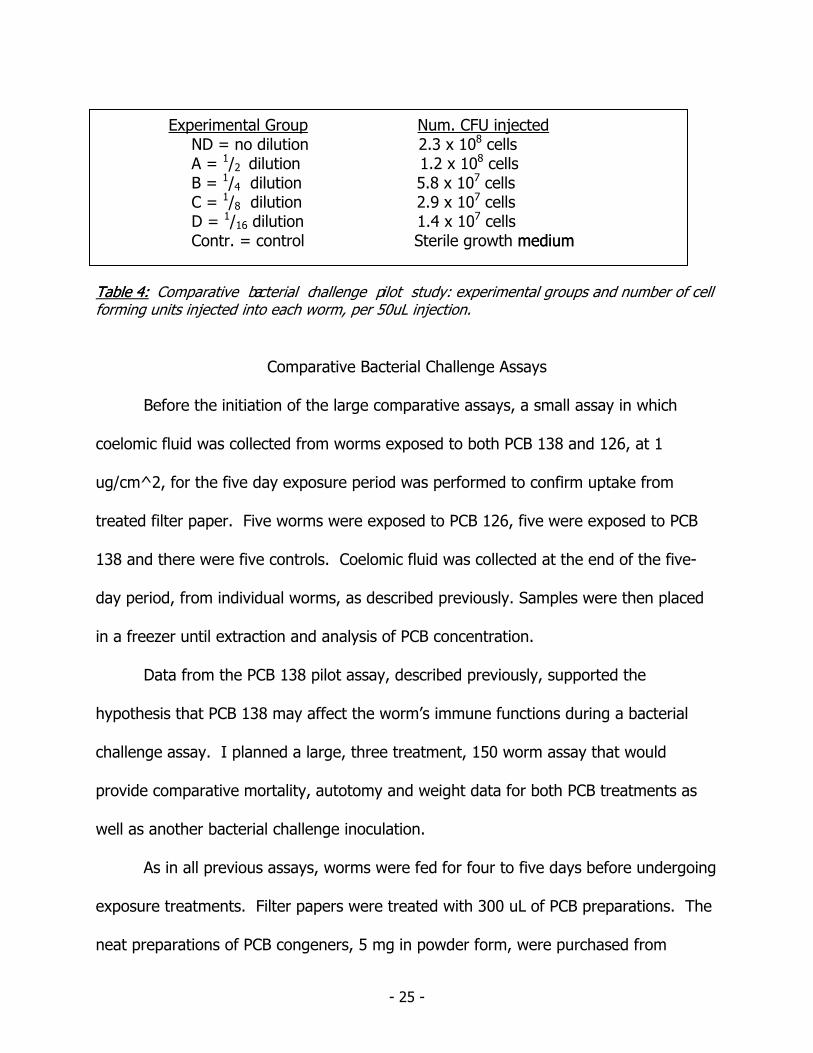
Experimental Group Num. CFU injected
ND = no dilution 2.3 x 10⁸ cells A = 1/2 dilution 1.2 x 10⁸ cells B = 1/4 dilution 5.8 x 10⁷ cells C = 1/8 dilution 2.9 x 10⁷ cells D = 1/16 dilution 1.4 x 10⁷ cells Contr. = control Sterile growth medium medium
Table 4:Table 4: Comparative bacterial challenge pilot study: experimental groups and number of cellforming units injected into each worm, per 50uL injection.
Comparative Bacterial Challenge Assays
Before the initiation of the large comparative assays, a small assay in which
coelomic fluid was collected from worms exposed to both PCB 138 and 126, at 1
ug/cm^2, for the five day exposure period was performed to confirm uptake from
treated filter paper. Five worms were exposed to PCB 126, five were exposed to PCB
138 and there were five controls. Coelomic fluid was collected at the end of the five-
day period, from individual worms, as described previously. Samples were then placed
in a freezer until extraction and analysis of PCB concentration.
Data from the PCB 138 pilot assay, described previously, supported the
hypothesis that PCB 138 may affect the worm’s immune functions during a bacterial
challenge assay. I planned a large, three treatment, 150 worm assay that would
provide comparative mortality, autotomy and weight data for both PCB treatments as
well as another bacterial challenge inoculation.
As in all previous assays, worms were fed for four to five days before undergoing
exposure treatments. Filter papers were treated with 300 uL of PCB preparations. The
neat preparations of PCB congeners, 5 mg in powder form, were purchased from
- 25 -
ChemService. The 5 mg amounts of both PCB 126 and 138 were solublized in 5 mL of
1:1 methylene chloride and hexanes, resulting in a 1 µg/µL stock.
The exposure concentration was 0.5 ug of PCB per cm^2 of filter paper. To
determine the dilution of stock needed to apply the correct mass of PCB to each 7.5 cm
diameter filter paper, the following calculations were used:
Area of Filter Paper = πr2 = π(3.75) 2 = 44.18cm2
Mass Applied = 44.18 x 0.5 = 22.09 or 22.1 ug
Conc. of Stock X Vol. Stock = Mass Applied x Vol. Per filter x Number of Filters 300 uL 1ug/uL X V1 = 22.1 ug x 300 uL x 50 (number of treated filters per experimental group) 300uL
V1 = 1,105 uL or 1.1 ml of PCB stock diluted with 13.9 mL of 1:1 methylene chloride
and hexanes
Preparations were applied, under a hood, to each filter paper. The filter papers
were left under the hood until all the solvent had evaporated. Each treated filter paper
was placed into a Zip-loc™ container (1 cup size), clearly marked with the PCB used
and a number to identify individual worms. One worm was placed in each container
and then placed in a cooler at 15° C. The worms were checked daily and a light
misting of deionized water applied if the paper appeared dried or the worm slightly
desiccated.
One hundred and fifty worms, fifty worms per treatment group and three
treatment groups, were used in this assay. Fifty worms were exposed to PCB 138 on
filter paper for five days at a concentration of 0.5 ug/cm^2. Another fifty worms were
- 26 -
exposed to PCB 126 on filter paper for five days at 0.5 ug/cm^2. The remaining fifty
worms were placed on solvent treated filter paper for the five day exposure period.
After the five-day exposure period, worms were inoculated with bacteria at the
appropriate dilution for their experimental group and then placed back into the Zip-loc™
containers after removing the treated filter paper. The containers were half-full of the
feeding mixture. Weight and mortality data were taken every day for the next 10
days. Worms were removed from their containers, rinsed in de-ionized water, blotted
dry and then weighed on a digital scale (+0.01 g). Autotomy, the loss of whole
sections of the body post-clitellum, was noted. Worms losing 30% or greater total body
weight after inoculation were identified as having undergone autotomy. Worms were
removed for weighing and examination in groups of ten to reduce the amount of time
spent out of the incubator. After all the data were collected for each group, containers
were promptly returned to the incubator. Activity scales were not utilized.
Determining Optical Density Curve for Estimating Viable Cell Counts
To facilitate preparation of a more standardized inoculum of repeatable bacterial
density in future studies, I prepared a standard curve for A. hydrophila based on optical
density. I prepared a series of dilutions from a culture of A. hydrophila, incubated
under the same conditions as all previous cultures and determined the optical density of
each dilution at 600 nm. The A. hydrophila culture dilutions were made with sterile
growth media and growth media was used in the reference cell. Non-dilute culture and
- 27 -
a series of dilutions, ½, 1/5, 1/10 and 1/20 were prepared. The cell size of the
spectrometer was 1 cm and the curve generated was linear.
Statistical Analyses
Statistical analyses were performed using either SAS© (Students t test) or
Microsoft Excel© (Chi Square Goodness of Fit Analysis) statistical functions. All
statistically significant data and comparisons state the analysis used and the statistical
probability generated by the analysis.
Development of the skills required for portions of the research are reflected in
one data set. The first percent phagocytosis value given in the initial cellular yeast
phagocytosis assay is definitely greater than any subsequent values and probably
reflects the standardization of my counting and cell recognition skills.
- 28 -
CHAPTER IV
RESULTS
Section 1: Bacterial Challenge Assay The bacterial challenge assay established an LD50 of A. hydrophila and trends in
weight change after inoculation. The results defined the point of departure and
comparison for subsequent whole-animal assays incorporating exposure to PCB. The
assay also established clearly defined inoculation doses and weight ranges for each
inoculation group. In contrast, frequently cited research involving A. hydrophila
inoculation in L. terrestris failed to define these parameters yet concluded that A.
hydrophila was not pathogenic to L. terrestris (Roch and Cooper 1991). This article is
discussed more fully in the following section.
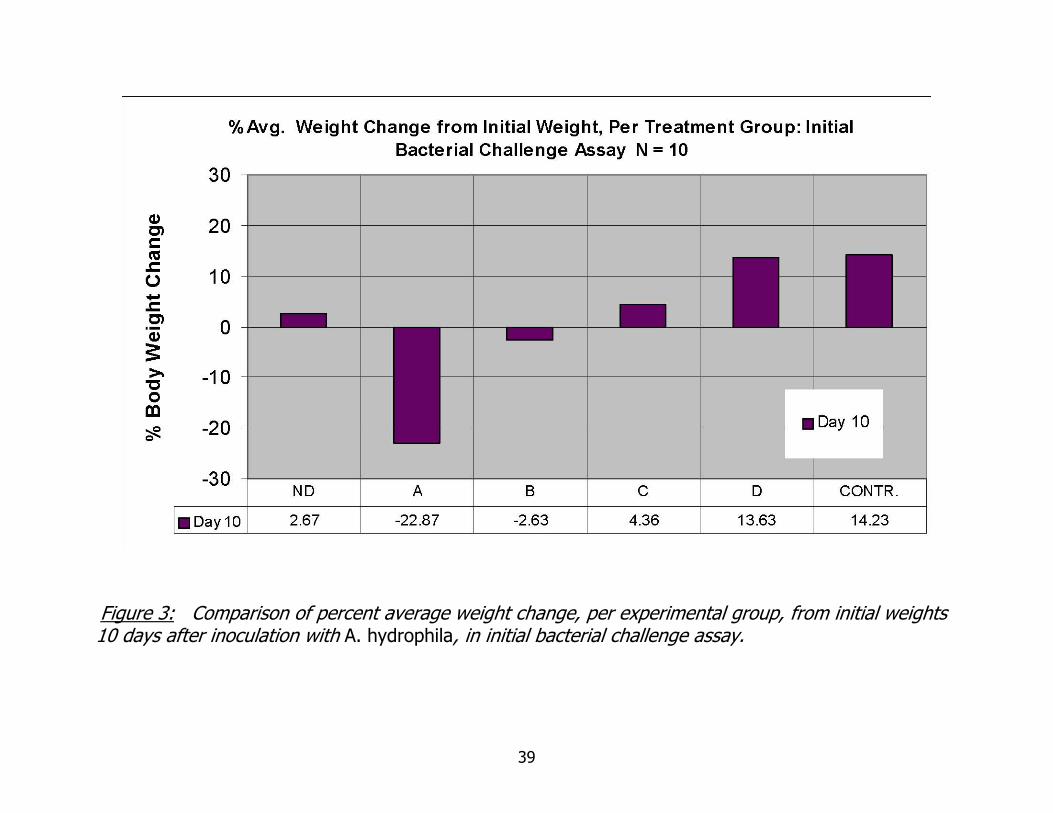
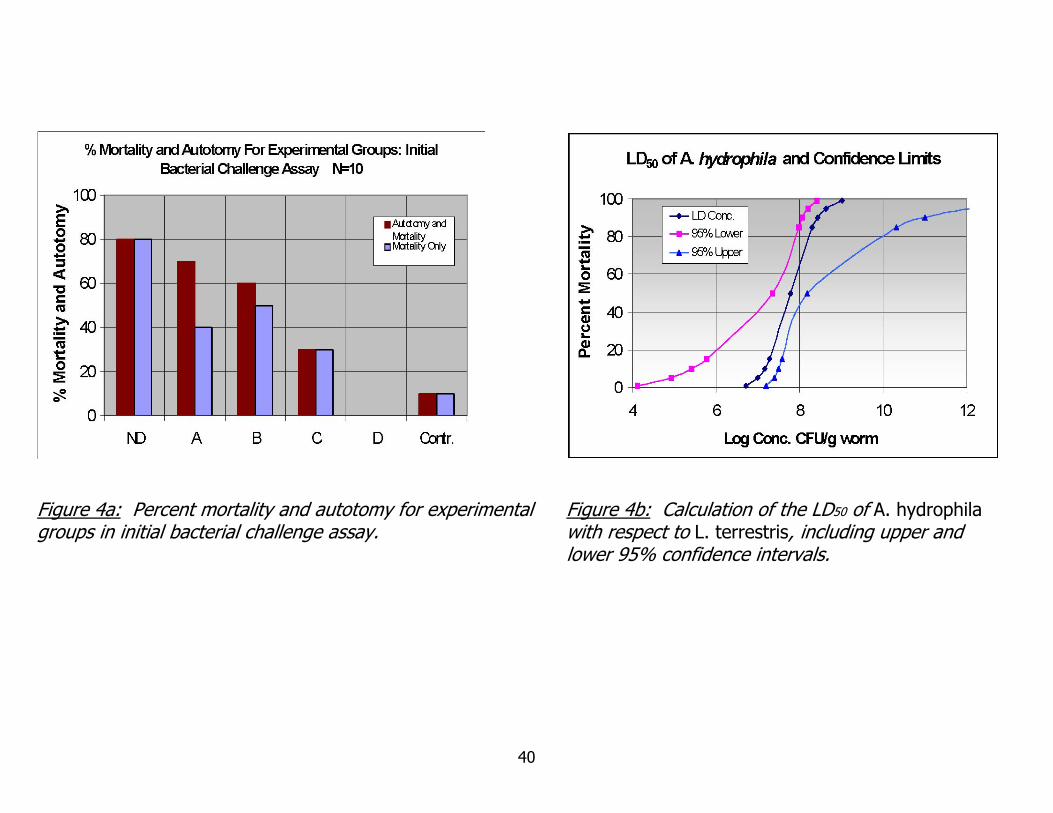
Weight, mortality and autotomy information are summarized in Figures 3 and 4a.
A clear trend in weight data is seen, with weight loss prevalent at higher inoculation
doses and weight gain occurring in lower inoculation doses and control groups. The
exception to this trend is the weight change in the highest inoculation dose group. This
percentage is based on the weights of only two worms and should be considered along
with the 80% mortality observed in the group.
Autotomy is defined as the constriction and loss of body segments resulting in
the reduction body weight and length. Autotomy is described in a wide variety of
- 29 -
invertebrate species, from loss of leg segments in crab species and spiders to starfish
and tentacles aquatic organisms. Autotomy can occur as a response to tactile stimuli
such as grabbing or pinching, with segment loss occurring only in the post-clitellum
region (Tsai and Tsai 2001). In the aquatic oligochaete Sparganophilus pearsei, the
occurrence of autotomy in individuals exposed to mercury is described as a form of
detoxification, whereby contaminants accumulated in tail segments are jettisoned
resulting in initial body weight losses up to a third of total body weight (Vidal and Horne
2003). EC50 values for autotomy have been described for tubificid sludgeworms
exposed to lindane, hexachlorobenzene and copper sulfate and were over five times
lower than LD50 values (Meller, Egeler et al. 1998). The occurrence of autotomy in
response to inoculation in my experiments is not entirely surprising, considering the
preceding information.
Autotomy in my experiments resulted in total body weight losses of 30% or
greater, reducing the length of the worm’s post clitellum segments by at least half. The
reduction of body weight and size to this degree rendered these animals “ecologically
dead”, unable to recover, regenerate lost body segments or reproduce. In Figure 4a,
combining mortality and autotomy resulted in a clear, step-wise reduction in mortality
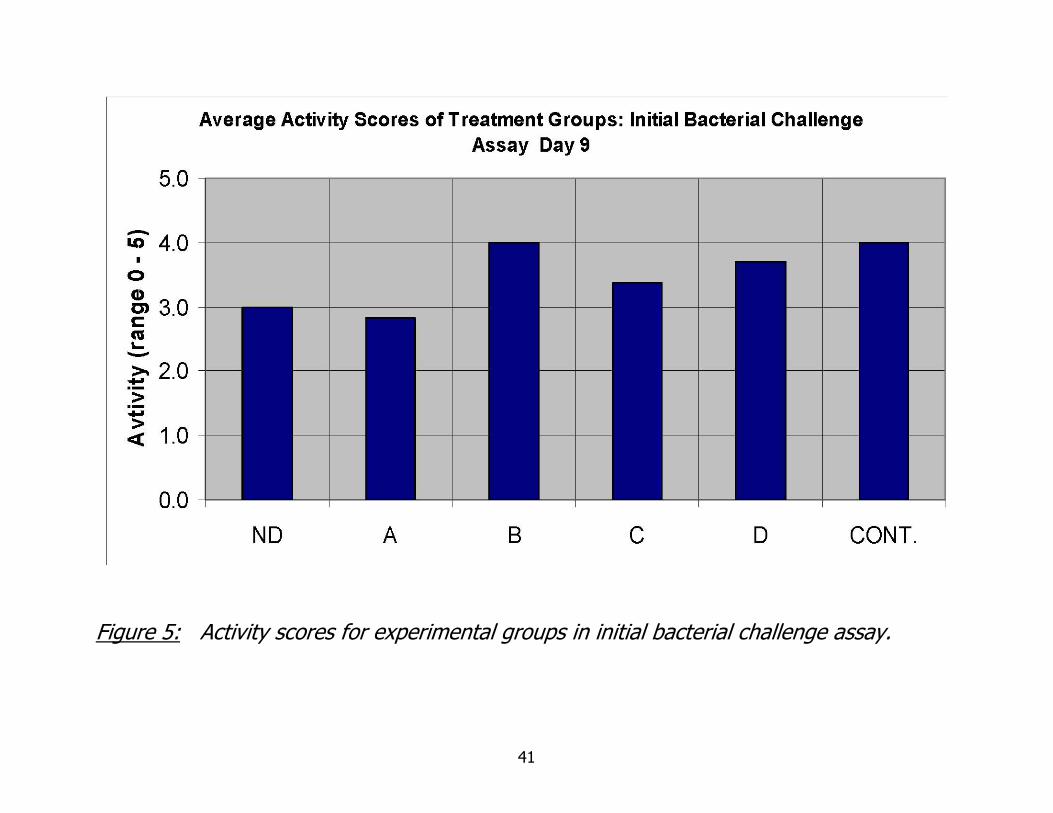
with a decrease in inoculation dose. Activity scores are given in Figure 5. Activity score
categories and results did not allow for significant differences between inoculation
groups to be determined.
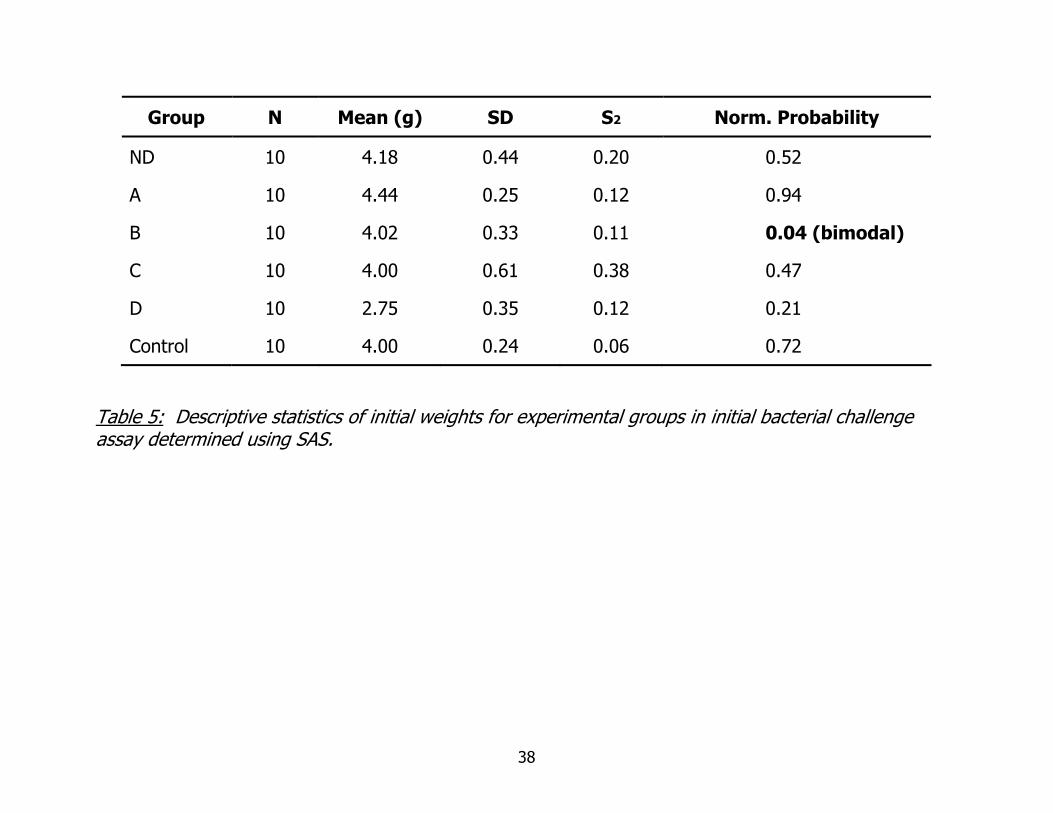
A summary of weights for experimental groups is shown in Table 5. The data
describe the general uniformity of experimental groups. EPA Probit Analysis determined
- 30 -
the 10-day LD50 of A. hydrophila to be 6.0 X 10^7 cfu/g worm, or 1.2 X 10^7 cfu
injected into each animal. The lower 95% confidence interval of the LD50 was 4.4 x
10^6 cfu injected and the upper 95% confidence interval was 3.0 x 10^7 cfu injected,
as shown in figure 4b. Examination of the behavior of upper and lower confidence
limits demonstrates the predictive confidence of the model, with constriction of upper
and lower limits as they near the calculated LD50.
Completion of this assay and examination of the resulting data answered several
key questions: (1). A. hydrophila is pathogenic to L. terrestris (2). mortality is dose-
dependent and (3). percent weight change and occurrence of autotomy are also dose-
dependent.
Sham Injection Assay
Do live bacteria alone cause the autotomy and mortality observed in worms
inoculated with A. hydrophila culture, or is this due to some bacterial metabolic by-
product and tissue damage at the injection sites? This question was raised during the
course of my research. In order to answer it, a sham injection assay was designed to
examine the bacterial culture. If effects observed were due to live bacteria only, then
only a live culture injected would produce the same results, repeatedly. Should
autotomy or mortality be due to a metabolic by-product and not live bacteria directly,
then culture media with live bacteria filtered out would produce the same results. To
examine all of these variables, several preparations were made and injected as
previously described for all of the bacterial challenge experiments.
- 31 -
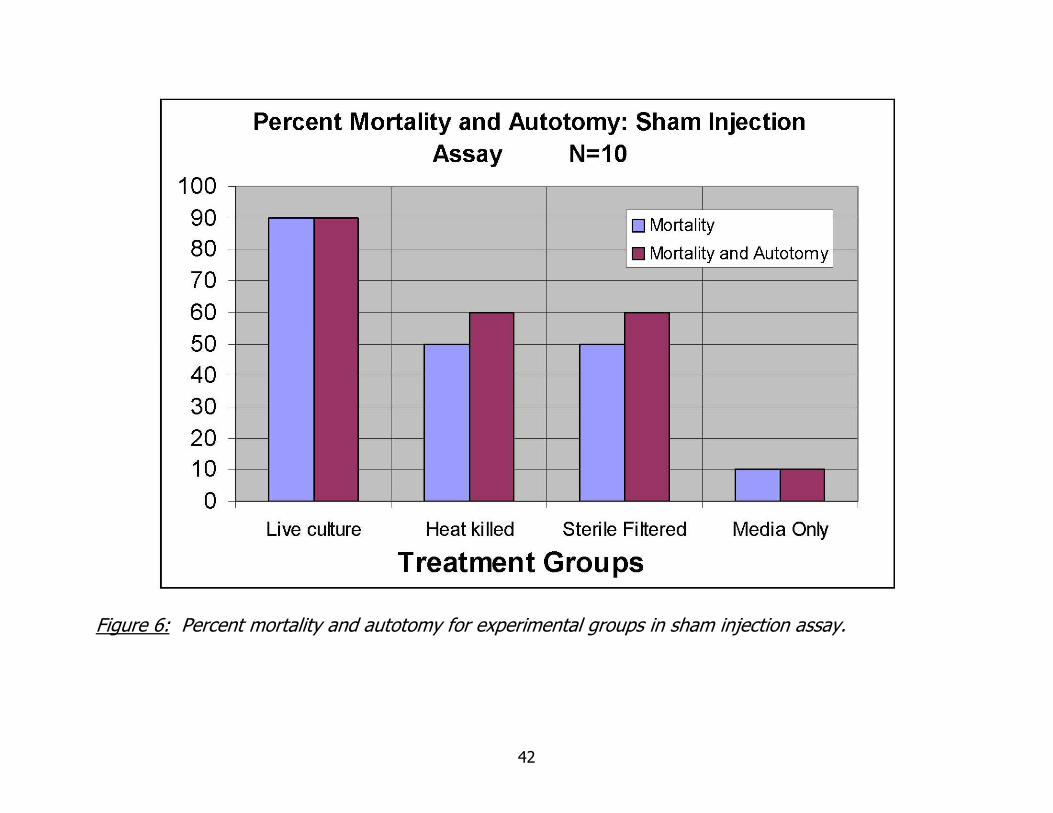
Four treatment groups (live culture, heat killed culture, sterile filtered culture and
growth media) of 10 worms were injected with 50 uL of their respective treatment.
Mortality and autotomy data are given in figure 10. As seen in Figure 6, the greatest
percentage of mortality occurred in worms injected with live culture. Percent mortality
and autotomy for both the heat killed, and sterile filtered cultures, was 60%. These
data suggest that there is some component of the culture, attributable to the processes
of live bacteria but able to withstand heating to 50 °C for 10 minutes with out breaking
down. The plated CFU of A. hydrophila for this experiment was 2.83 x 10^9 cfu/mL or
1.42 x 10^8 cfu injected per worm.
Section 2: Cellular Assays
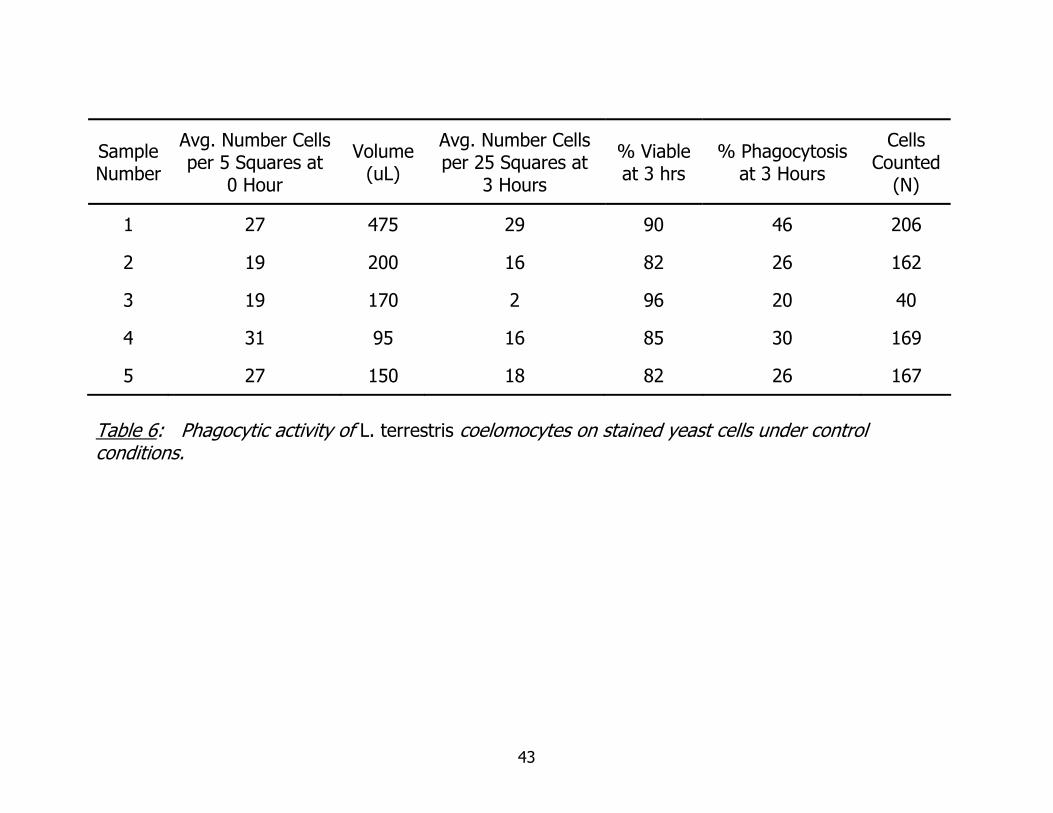
Data from the initial yeast phagocytosis assay are found in Table 6. The purpose
of this assay was for me to familiarize myself with observing phagocytosis and
establishing ranges of expected phagocytic activity while developing the skills needed to
transfer cells carefully, to preserve cell viability as much as possible. Data in Table 6
track the progression of my counting skills.
Figures 7a and b summarize in vitro range finding data concerning pre-exposure
to PCB 138 on coelomocyte phagocytosis activity. In Figure 7a, some reduction in
phagocytic activity, when compared to controls, is seen at an exposure concentration of
2 ppm. Conversely, and a bit surprising, there appears to be an increase in phagocytic
activity at the lowest exposure concentration of 0.5 ppm. These results are examined
more thoroughly in the following discussion section. Figure 7 b clearly shows that none
- 32 -
of the exposure concentrations reduced coelomocyte viability below 90%, after two
hours of incubation. This result suggests that higher concentrations of PCB could be
used in exposure studies, if desired, without drastic reductions in cell viability.
Comparison of pre-exposure to co-planar PCB 126 and non-coplanar 138 at 2
ppm on coelomocyte phagocytosis is found in Figure 8. Coelomic fluid was collected, as
described previously, from individual worms and suspended in HBSS with EDTA 0.02%
w/v with a 2ppm concentration of the appropriate PCB congener. After 2 hours of
incubation, coelomocytes were introduced to stained yeast cells and incubated for an
additional 2 hours. The figure clearly shows the decrease in phagocytic activity in
coelomocytes exposed to non-coplanar PCB 138, which was statistically significantly less
than that of controls (X2 Goodness of fit, p = 0.01). Phagocytic activity of coelomocytes
exposed to co-planar PCB 126 was not statistically significantly different than that of
controls (X2 Goodness of fit, p=0.76).
Data regarding the in vivo, filter paper exposure to PCB 138, followed by
coelomic fluid removal and stained yeast assay are given in figure 9. This experiment
was a melding of in vitro and in vivo techniques. The in vivo exposure concentration of
non-coplanar PCB 138 was 1 ug/cm^2. Average in vitro phagocytic activity of
coelomocytes collected from worms exposed to PCB 138 at 1 ug/cm^2 was statistically
significantly less than that of control worms (X2 Goodness of fit, p < 0.0001).
Table 7 summarizes all cell phagocytosis assays. Direct statistical analyses of
phagocytic activity between experimental groups are given above. Another expression
of phagocytic activity may be expressed as a percentage difference of control
- 33 -
phagocytosis. The difference of the measured experimental phagocytic activity of an
exposed sample is divided by the phagocytic activity of the control for that
experiment/replicate. This comparison directly relates the degree of increase or
decrease, relative to controls. Percent phagocytosis activity compared to controls of
coelomocytes exposed to non-coplanar PCB 138, at 2 ppm for two hours before the
yeast phagocytosis assay, was statistically significantly less than percent phagocytosis
activity in those exposed to coplanar PCB 126 under the same conditions (Student’s t
test, p=0.012). These percentages are expressed as a function of percent control
phagocytosis, the comparison being between PCB exposure groups only.
Section 3: Comparative Bacterial Challenge Assays
Pre-Exposure to PCB 138 Pilot Assay
I conducted a small, pilot bacterial challenge assay, with a 5-day filter paper
exposure to PCB 138 followed by a bacterial challenge. Weight data are summarized in
Figure 10. Only four of the five experimental groups are represented in this graph as
the weight data do not include reduction due to autotomy. Only one worm survived in
the highest inoculation group (ND) and lost in excess of one third total body weight due
to autotomy. These results are unlike previous trends in weight data which could be
described as dose dependent, with greater weight loss at higher inoculation doses. The
greatest average weight loss occurred in the second lowest dilution group and the
- 34 -
greatest weight gain occurred in the lowest dilution group, rather than in control
worms.
Mortality and autotomy data for this assay do follow trends seen previously, as
seen in Figure 11. The highest mortality and autotomy occur at the highest dilution
groups and decrease, or stay static, as inoculation dose decreases. In three cases, the
data clearly show that all autotomy did not occur in certain groups as the counts are
the same for both mortality and autotomy combined. The impact of dose with respect
to percent autotomy is explored further in the discussion section.
Comparative PCB 126 and 138 Pre-Exposure Assay
The amount of PCB 138 and 126 quantified in coelomic fluid removed from
worms exposed for five days on filter paper at a concentration of 1 ug/cm^2 is found in
Figure 12. PCB 138 quantified in coelomic fluid removed from worms exposed to PCB
138 was 608 + 81 ng/mL, approximately 0.6 ppm. PCB 126 quantified in exposed
worms was 688 + 342 ng/mL, or approximately 0.7 ppm. PCB 138 and 126
concentrations in unexposed control worms were <0.03 ppm. The dosed
concentrations measured are far below the sub-lethal tissue residues (~ 60 ppm)
determined for the oligochaete, Lumbriculus variegates (Fisher, Chordas III et al.
1998). The coelomic fluid concentrations quantified were 2.8 and 3.3 times less than
that used in the in vitro exposure studies for non-coplanar PCB 138 and coplanar PCB
126. The 2 hour coelomocyte exposure concentration was 2 ppm for both PCB
- 35 -
congeners and this was less than the 5 ppm exposure concentration used in the
mammalian leukocyte studies on which my in vitro work was modeled.
Weight data for the 150 animal comparative assay are summarized in Figure 13.
The greatest reduction in percent body occurred in worms pre-exposed to coplanar PCB
126 in all inoculation groups. This was surprising, considering the results of the cell
exposure studies, which suggested that exposure to non-coplanar PCB 138 inhibited
coelomocyte phagocytosis to a greater degree than exposure to coplanar PCB 126.
Even more confounding, the non-coplanar PCB 138 exposed worms maintained and
even gained body weight when the other two treatment groups had an average loss.
Examination of the graph for inoculation groups B and C illustrate this point. The
percent weight loss of worms pre-exposed to PCB 126 was statistically significantly less
than percent weight loss of worms pre-exposed to PCB 138 for both dilution groups B
and C ( Students T test, p=0.03 and p=0.001 for both treatment groups respectively).
Weights used in percent weight loss calculations do not include worms that lost weight
due to autotomy.
Mortality and autotomy data are presented in Figure 14. Percent mortality and
autotomy for treatment groups in the no-dilution (ND) and ½ dilution (A) inoculation
groups differed by only 10%. Percent mortality and autotomy for PCB 126 pre-exposed
worms was 70%, while both PCB 138 pre-exposed worms and unexposed worms were
60%. In the lower dilution groups of ¼ (B) and 1/8 (C), percent mortality and
autotomy diverge, the difference between treatment groups increasing to 20 and then
30%. Percent mortality and autotomy did not decrease as sharply with decreased
- 36 -
- 37 -
bacterial load for worms pre-exposed to PCB 126 as it did for unexposed and pre-
exposed to PCB 138. At these lower inoculation dilutions, the sub-lethal endpoint of %
weight loss was examined.
Examination of Figure 15, with inset, clearly shows a divergence in mortality
and autotomy percentages in the lowest inoculation group (C). Worms pre-exposed to
coplanar PCB 126 suffered an average 30 % higher mortality and autotomy than those
pre-exposed to non-coplanar PCB 138 and those not exposed to any PCB congener.
This increased mortality in the coplanar PCB 126 pre-exposed worms continues for the
next inoculation dilution (B) but at higher inoculation doses, mortality and autotomy
data for all exposure and treatment groups increase similarly. The loss of this
distinction may be explained by the increasing dose of bacterial inoculation over-
shadowing the more subtle effects of inhibition of resistance to bacterial infection.
Figure 17 displays the calculated LD values for each of the treatment groups and
the 95% confidence limits of those values. The worms pre-exposed to coplanar PCB
126 had lower calculated LD 50 than the other two groups and the 95% confidence
limits are not overlapping.
Determining Optical Density Curve for Estimating Viable Cell Counts
The plot of the optical densities for each of the five preparations is given in
figure 16, with the corresponding Log CFU/mL for each dilution. The equation given by
the trendline may now be used to estimate the concentration of CFU in a culture before
inoculation.
38
Group N Mean (g) SD S2 Norm. Probability
ND 10 4.18 0.44 0.20 0.52
A 10 4.44 0.25 0.12 0.94
B 10 4.02 0.33 0.11 0.04 (bimodal)
C 10 4.00 0.61 0.38 0.47
D 10 2.75 0.35 0.12 0.21
Control 10 4.00 0.24 0.06 0.72
Table 5: Descriptive statistics of initial weights for experimental groups in initial bacterial challenge assay determined using SAS.
39
Figure 3: Comparison of percent average weight change, per experimental group, from initial weights 10 days after inoculation with A. hydrophila, in initial bacterial challenge assay.
40
Figure 4a: Percent mortality and autotomy for experimental groups in initial bacterial challenge assay.
Figure 4b: Calculation of the LD50 of A. hydrophila with respect to L. terrestris, including upper and lower 95% confidence intervals.
41
Figure 5: Activity scores for experimental groups in initial bacterial challenge assay.
42
Figure 6: Percent mortality and autotomy for experimental groups in sham injection assay.
43
Sample Number
Avg. Number Cells per 5 Squares at
0 Hour
Volume (uL)
Avg. Number Cells per 25 Squares at
3 Hours
% Viable at 3 hrs
% Phagocytosis at 3 Hours
Cells Counted
(N)
1 27 475 29 90 46 206
2 19 200 16 82 26 162
3 19 170 2 96 20 40
4 31 95 16 85 30 169
5 27 150 18 82 26 167
Table 6: Phagocytic activity of L. terrestris coelomocytes on stained yeast cells under control conditions.
44
Figure 7a: Summary of percent phagocytosis for coelomocytes exposed in vitro to PCB 138 at 2, 1 and 0.5 ppm, for 2 hours, followed by 2 hour incubation of coelomocytes with stained yeast. N = 4
Figure 7b: Summary of percent coelomocyte viability after 2 hours in vitro exposure to PCB 138 at 2, 1, and 0.5 ppm followed by 2 hour incubation with stained yeast. N = 4
45
Figure 8: Comparative coelomocyte pre-exposure assay. Coelomocytes were exposed in vitro to either coplanar PCB 126 or non-coplanar PCB 138 for 2 hours at 2 ppm, followed by stained yeast assay to assess phagocytosis.
46
Figure 9: In-vivo five day filter paper exposure to PCB 138, at 2 ug/cm^2, followed by coelomic fluid removal and in vitro stained yeast phagocytosis assay (2 hours). Coelomocytes incubated 2 hours after removal with stained yeast.
47
Treatment N Incubation (hr)
Avg.% Viability
Avg. % Phagocytosis
% Phagocytosis ± SD Compared to Control
None 5 3 87 30 - - - - - -
EDTA in HBSS 5 3 90 26 - - - - - -
EDTA in HBSS 4 2 93 22 - - - - - -
EDTA in HBSS 4 2 93 21 - - - - - -
Pre-Expose to PCB 138 @ 2ppm 8 2 91 16 -27.6 + 16.6 *
Pre-Expose to PCB 126 @ 2ppm 4 2 93 21 -3.4 + 12.2
5 day filter exposure to PCB 138 @ 1 ug/cm^2 5 5 days 95 10 -48.5 + 18.6
* Percent phagocytosis activity compared to controls of coelomocytes exposed to PCB 138, at 2 ppm for two hours before the yeast phagocytosis assay, was statistically significantly less than percent phagocytosis activity in those exposed to PCB 126 under the same conditions (Student’s t test, p=0.012). Table 7: Summary of all coelomocyte assays and average phagocytosis for all treatments.
48
Figure 10: Comparison of percent average weight change for PCB 138 pilot assay. Worms were exposed to PCB 138 at 1 ug/cm^2 for five days before inoculation. A=1/2 dilution of inoculum, B=1/4 dilution of inoculum, C= 1/8 dilution of inoculum and CONT = control group
49
Figure 11: Percent mortality and autotomy for experimental groups in PCB 138 pilot bacterial challenge. ND= no dilution of inoculum, A=1/2 dilution of inoculum, B=1/4 dilution of inoculum, C= 1/8 dilution of inoculum and CONT = control group
50
Figure 12: Comparison PCB 126 and 138 concentrations in coelomic fluid collected from worms exposed to a filter paper concentration of 1 ug/cm^2 for five days.
51
Figure 13: Comparison of percent average weight change, per experimental group, from initial weights in comparative PCB 126 and 138 pre-exposure bacterial challenge assay.
52
Figure 14: Percent mortality and autotomy for experimental groups in comparative PCB 126 and PCB 138 pre-exposure bacterial challenge assay.
53
Figure 15: Inset: Percent mortality and autotomy for experimental groups in comparative PCB 126 and PCB 138 pre-exposure assay.
% Mortality and Autotomy for Experimental Groups: Comparative PCB 126 and 138 Pre-exposure Assay
0
10
20
30
40
50
60
70
80
7.6 7.8 8 8.2 8.4 8.6 8.8
Log Conc. Bact. Injected
PCB126
PCB 138
Control
C B
54
Figure 16: Optical density curve for predicting concentration of viable cells in A. hyrophila culture.
55
Figure 17: LD50 Values: log concentration of bacteria injected per treatment group and 95 % confidence limits.
CHAPTER V
DISCUSSION
As mentioned previously, the specific use of earthworm species as
models for terrestrial toxicity and the development of standardized laboratory
assay methods form a solid foundation for the use of these organisms in
investigating terrestrial toxicity. Before discussing the results of my research, I
would like to restate the main objective: to develop a bacterial challenge model,
utilizing L. terrestris, which would link exposure to selected PCB congeners and
immunotoxic effects. Achieving this objective would provide a relevant model for
the investigation of immunotoxic effects of xenobiotics in terrestrial ecosystems.
Bacterial Challenge Assay
The mortality resulting from inoculation of earthworms with A. hydrophila
culture was the starting-point for all subsequent comparative assays. The
determination of a 10-day LD50 (1.2 x 10^7 cfu injected) was the basis for
evaluation of immunotoxic effects of exposure to specific PCB congeners. All
subsequent assays incorporated a control group, unexposed to immunotoxicants
but inoculated with the same concentration of bacteria, to define mortality and
autotomy due to inoculation with bacteria only. Handling before this assay was
different from that of all other assays in that worms were not fed for a period of
five days before inoculation. The need for pre-feeding became apparent only
- 56
when worms died during range finding experiments for pre-exposure limits,
which was attributed to storage stress and starvation.
As alluded to briefly in the results section, it had been generally accepted
that A. hydrophila was not pathogenic to L. terrestris. This conclusion was based
on research in which L. terrestris was exposed to Aroclor 1254 for a period of
five days before being inoculated with A. hydrophila culture (Roch and Cooper
1991). The research and its conclusion are referenced in subsequent work (Ville,
Roch et al. 1995). The researchers state that the “extremely high” LD50 of 2 x
10^7 that they observed in unexposed L. terrestris suggests A. hydrophila were
not pathogenic. Beyond the declaration that 2 x 10^7 is extremely high,
important information is lacking concerning the worms and the bacterial dose
they received.
Weight values for the injected worms are not given. The weight range for
a given amount of purchased worms has ranged, in my experience, from 2.6g to
as high as 6.8g. The same volume of culture injected into worms of such
disparate body size would result in different dosing altogether. Small worms
would succumb to a dose that could be survived in an individual greater than 2
times their size. Mortality is expressed as a percentage in the experiment but
the total number of worms injected is not stated. Worms were injected with
increasing concentrations of bacteria beginning with 100 and increasing by
orders of magnitude to a high concentration of 10^7. Mortality information for
all treatment groups, including controls, is not given. No mention of autotomy is
57
made. The single injection of 100 uL post-clitellum does not seem feasible to
me. I feel that the lack of these details, which are clearly defined in my
experiments, makes it difficult to properly interpret these results and reach
definitive statements concerning the pathogenicity of A. hydrophila in L.
terrestris, regardless of pre-exposure.
The sham injection experiment was performed to further support my
assertion that A. hydrophila are pathogenic. By examining the impacts of
different components present in live culture, we were able to determine several
things. First, live culture injection resulted in the highest mortality of 90%.
Second, the same experimental mortalities (50%) for heat killed and filter-
sterilized media suggest that some soluble metabolic by-product or cellular
component is released by the bacteria that is not denatured at 50°C nor
removed by filtration, and is pathogenic in the absence of live cells. Control
worm mortality of 10% demonstrated that the sterile media used to culture the
bacteria is not significantly contributing to mortality due to some characteristic of
its own. Only live culture or culture which had contained live A. hydrophila
produced significant mortality.
The sub-lethal endpoint of weight change, and the occurrence of
autotomy, provide clearly measured and observed effects to interpret the subtler
impacts of exposure. Weight change became the criterion by which we selected
the 10-day assay time. The stabilization of weights in the lowest inoculation
group and controls suggested equilibrium had been reached. The relatively
58
consistent dose-response behavior of weight change through-out all of the
bacterial challenge assays provided a consistent measure of general worm
health. Autotomy offers another easily measured endpoint. Worms do not
always lose large segments in a single autotomy event. An overall loss of 30%
or more body weight sometimes occurred after several smaller segments were
dropped from the posterior end. In my experiments, segment losses in the
highest two dilution groups were generally large, single events that left the worm
with only one third of the digestive tract remaining. These animals were deemed
ecologically dead, unlikely to recover and replace missing segments or
reproduce. Smaller, multiple autotomy events occurred in the lower dilution
groups. The percent body mass lost, and number/degree of autotomy events
provide additional measures of potential fitness impairment.
The protocol for measurement of activity as an indication of fitness and
health did not adequately separate treatment groups according to the scale
used. Activity measurements would be useful and could provide statistically
significant separations if the scale were expanded. Five designations were not
sufficient. Worms were visibly more active and responsive at lower inoculation
doses. The difficulty lies in adequately describing and defining enough activity
classifications so that average scores for a group accurately represent the degree
of difference observed. Expanding the scale, or modifying how activity is
measured, so that it can communicate these differences numerically would
59
rectify the problem. Worm activity differences were real and observable. This
information should not be over-looked or lost.
Ideally, a combination assessment for sub-lethal impacts would
incorporate weight loss, autotomy and activity data. The correlations that may
exist between these data across exposure and inoculation ranges could
potentially produce an index of fitness impact that is much more sensitive for
understanding and interpreting sub-leathal effects than any single measure in
isolation.
Cellular Assays
The framework for my coelomocyte assays was based on experiments
investigating the effects of copper and Aroclor 1254 exposure on L. terrestris
coelomocyte phagocytosis (Burch, Fitzpatrick et al. 1999). Methods were the
same in the use of stained yeast, HBSS w/ 0.02% w/v EDTA, Trypan Blue
exclusion for viability assessment, coelomocyte concentration adjustments and
incubation temperatures. Methods differed in coelomocyte collection, duration of
incubation and numbers of cells counted. I feel that my method of coelomocyte
collection is less disruptive, as it does not involve electro-stimulation or result in
the production of mucous. I transferred coelomocytes directly from the worm
and into a micro-centrifuge tube with out the addition of mucoltytic agents. My
exposure times were far shorter (2 hrs vs. 24 hrs) to more closely resemble
studies performed using mammalian cells (Levin, Morsey et al. 2004). Lastly, I
60
tried to count greater than 100 cells, 200 maximum, whenever possible to
increase the relative “sample population” on which phagocytosis data were
based.
Comparisons of percent coelomocyte phagocytosis and viability may
reflect these differences in method. Ranges of coelomocyte phagocytosis were
similar. Relative phagocytosis in control coelomocytes reported by Burch was
19.9 + 0.47% compared to my control phagocytosis of 23.0 + 2.64%. However,
overall control coelomocyte viability was far greater in my assays, 92.0 + 1.73%,
compared to 67.8 + 1.90%. I think this reflects the impact of exposure period
and maintenance of cells in vitro on cell viability.
The results of my cellular assays are comparable to those of (Levin,
Morsey et al. 2004), the mammalian research which greatly influenced my assay
design. Reductions of percent phagocytosis compared to unexposed controls
were 37 and 30% for dolphin and beluga whale neutrophils exposed to non-
coplanar PCB 138, in vitro, at 5 ppm for 3 hours. Cell viability was greatest at
the 5 ppm exposure concentration (98%) and fell to 84% at 10 ppm and 60 –
75% at 15 ppm. Considering this information, I conducted a range finding in
vitro assay to determine the exposure concentration that would be as
comparable to (Levin, Morsey et al. 2004) as possible and at which coelomocyte
viability was impacted the least. Percent reduction of coelomocyte
phagocytosis, with respect to unexposed controls, was 27.6 for cells exposed to
non-coplanar PCB 138 for 2 hours at a concentration of 2 ppm, and 3.4 for cells
61
exposed to coplanar PCB 126 for the same time period and concentration. As
observed in the mammalian assay, the non-coplanar PCB reduced phagocyte
activity by approximately one-third of non-exposed control activity, at an
exposure concentration of 2 ppm. The percent phagocytosis activity, compared
to controls, of coelomocytes exposed to non-coplanar PCB 138 at 2 ppm was
statistically significantly less than percent phagocytosis activity in those exposed
to coplanar PCB 126 at the same concentration (Student’s t test, p=0.012).
For the other exposure concentrations of non-coplanar PCB 138
investigated, percent average coelomocyte phagocytic activity was reduced
12.7% at 1 ppm and increased by 21.2 % at 0.5 ppm. This reversal at 0.5 ppm
was interesting as this level of exposure concentration appeared to be increasing
phagocytic activity rather than reducing it. This reversal of activity is not as
surprising, however, when viewed in context of other experiments investigating
the timing and concentration of immunotoxicant dose. Immune responsiveness
(phagocytosis) in bivalve mollusks may be increased following low-level, short
term exposures to metals whereas higher exposure concentrations of the same
metals may be inhibitory (Galloway and Depledge 2001). This “hormesis-like”
effect will be discussed again, in relation to the comparative bacterial challenge
assays.
In-vivo exposure of worms to non-coplanar PCB 138 at 1ug/cm^2 for a
period of five days, before collection of coelomic fluid and subsequent yeast
phagocytosis assay, resulted in a reduction of phagocytic activity of 55.3%.
62
Based on extraction and analysis via GC/MS, the concentration of non-coplanar
PCB 138 in coelomic fluid was approximately 0.6 ppm and 0.7 ppm for coplanar
PCB 126. This concentration is about 1/3 the 2 ppm concentration used for in
vitro exposures. However, exposure times and contact kinetics with respect to
coelomocytes were very different. In vitro exposures put coelomocytes in direct
contact with known concentrations of PCB congener for a period of 2 hours,
resulting in reductions of phagocytosis of 27.6 + 16.6% and 3.4 + 12.2% for
PCB congeners 138 and 126, respectively. Results produced by cellular studies
are not always predictive of results generated by investigating whole organisms.
In vivo exposure more closely modeled environmental exposure with contact
time far in excess of 2 hours. Results were similar to in vitro exposure in that
large reductions in phagocytosis were attributable to exposure to non-coplanar
PCB 138.
Comparative Bacterial Challenge Assay
Complications due to questionable animal health resulted in a change in
exposure concentration before the comparative bacterial challenge assay. High
mortality (30-50% of PCB 126 and 138 treated worms) during the filter exposure
period prompted the reduction of the filter paper exposure from 1.0 to 0.5
ug/cm^2. High mortalities were not observed at this new exposure
concentration but it is unclear if this resulted from the lower toxicant dose or
healthier worms provided by another supplier.
63
There are at least three important factors to consider when
examining the results of my research: dose, potential for activation of the ArH-
receptor and the inherent complexity of organisms. The whole animal bacterial
challenge assay appears to indicate that exposure to PCB 126 inhibits immune
function in earthworms and that PCB 138 exposure does not. These results
seem to contradict the results of the cellular assays. However, the dose at which
each of the assays was conducted becomes key when interpreting these results.
The reduction of the filter paper exposure from 1.0 to 0.5 ug/cm^2 may have
created the “hormesis-like” result seen in the cell assays at lower exposure
concentrations. To determine if this response is dose dependent, the assay
should be performed again, at an exposure concentration of 1.0 ug/cm^2 for
both PCB’s, and weight loss/gain data examined in the lower dilution groups.
These results could also be interpreted as support for the hypothesis that
earthworms possess an ArH-like receptor. As discussed previously, toxicity of
dioxin-like compounds is thought to be mediated primarily by the ArH-receptor.
Homologues for this receptor have been identified in nematodes, flies and
bivalves. Although an ArH receptor homolog was not specifically identified,
proteins found in Eisenia fetida tissue extracts and coelomocyte lysates did bind
to an anti-ArH antibody in western blot analysis (Wiesner, Hahn et al. 2003). If
earthworms do have such a receptor, then the toxic effects of coplanar PCB 126
by binding to this receptor would appear to supersede non-Ah-R-mediated
64
effects on other immunosuppressive effects attributable to non-coplanar PCB 138
when effects are evaluated in our whole animal assay.
The significance of the discrepancy between in vitro exposure results and
those of the whole animal challenge lies in the complexity of whole animal
systems versus cellular level mechanisms. Cellular assays focus on the
mechanisms and reactions governing the building blocks of all organisms.
However, as we move upward from cells to tissues and the organs formed by
those tissues, interactions become increasingly complex. Organs are coordinated
parts of even larger systems that function to serve the whole, a living organism.
Each step introduces new realms of interaction and variability. The only way to
understand the total effects of a toxicant on an entire organism is to expose the
entire organism. Whole animal assays are more ecologically relevant than
cellular assays performed in the controlled settings of the laboratory. If we want
to examine interactions and impacts of toxicants on organisms in the
environment, our experimental procedures should be directed at whole
organisms exposed in environmentally relevant pathways.
65
APPENDIX
TABULAR PRESENTATION OF ALL CELLULAR EXPOSURE
ASSAYS
66
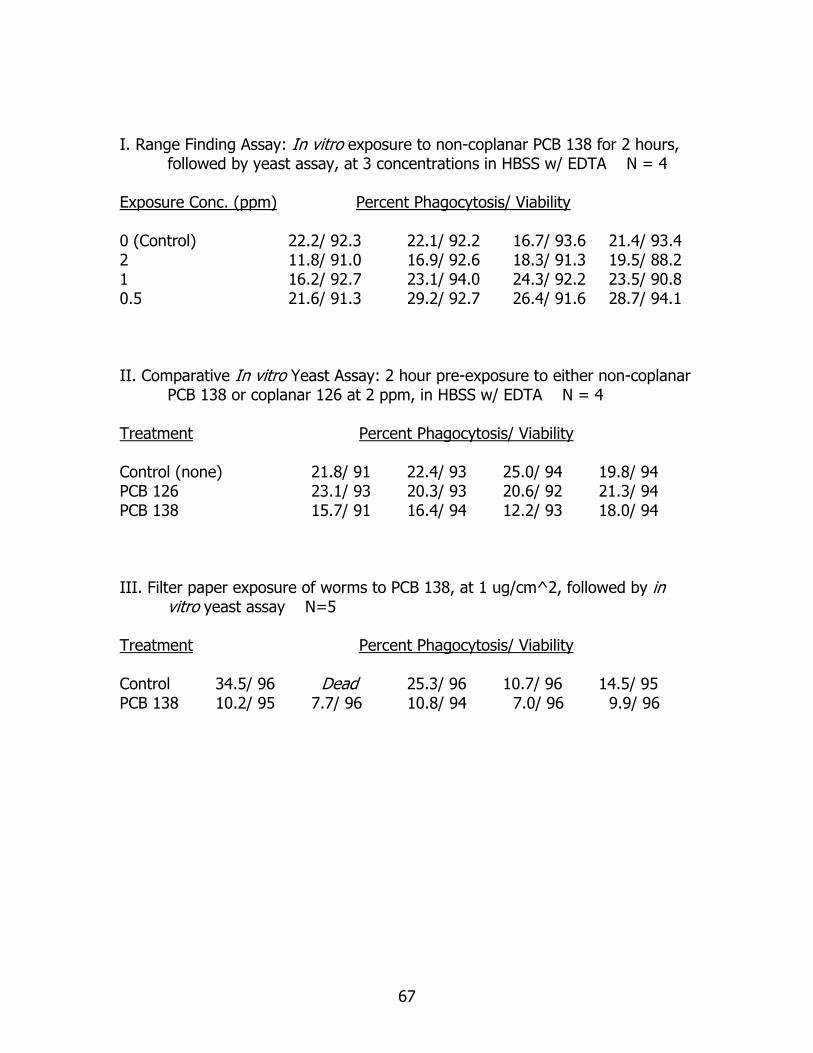
I. Range Finding Assay: In vitro exposure to non-coplanar PCB 138 for 2 hours, followed by yeast assay, at 3 concentrations in HBSS w/ EDTA N = 4
Exposure Conc. (ppm) Percent Phagocytosis/ Viability 0 (Control) 22.2/ 92.3 22.1/ 92.2 16.7/ 93.6 21.4/ 93.4 2 11.8/ 91.0 16.9/ 92.6 18.3/ 91.3 19.5/ 88.2 1 16.2/ 92.7 23.1/ 94.0 24.3/ 92.2 23.5/ 90.8 0.5 21.6/ 91.3 29.2/ 92.7 26.4/ 91.6 28.7/ 94.1 II. Comparative In vitro Yeast Assay: 2 hour pre-exposure to either non-coplanar
PCB 138 or coplanar 126 at 2 ppm, in HBSS w/ EDTA N = 4 Treatment Percent Phagocytosis/ Viability Control (none) 21.8/ 91 22.4/ 93 25.0/ 94 19.8/ 94 PCB 126 23.1/ 93 20.3/ 93 20.6/ 92 21.3/ 94 PCB 138 15.7/ 91 16.4/ 94 12.2/ 93 18.0/ 94 III. Filter paper exposure of worms to PCB 138, at 1 ug/cm^2, followed by in
vitro yeast assay N=5 Treatment Percent Phagocytosis/ Viability Control 34.5/ 96 Dead 25.3/ 96 10.7/ 96 14.5/ 95 PCB 138 10.2/ 95 7.7/ 96 10.8/ 94 7.0/ 96 9.9/ 96
67
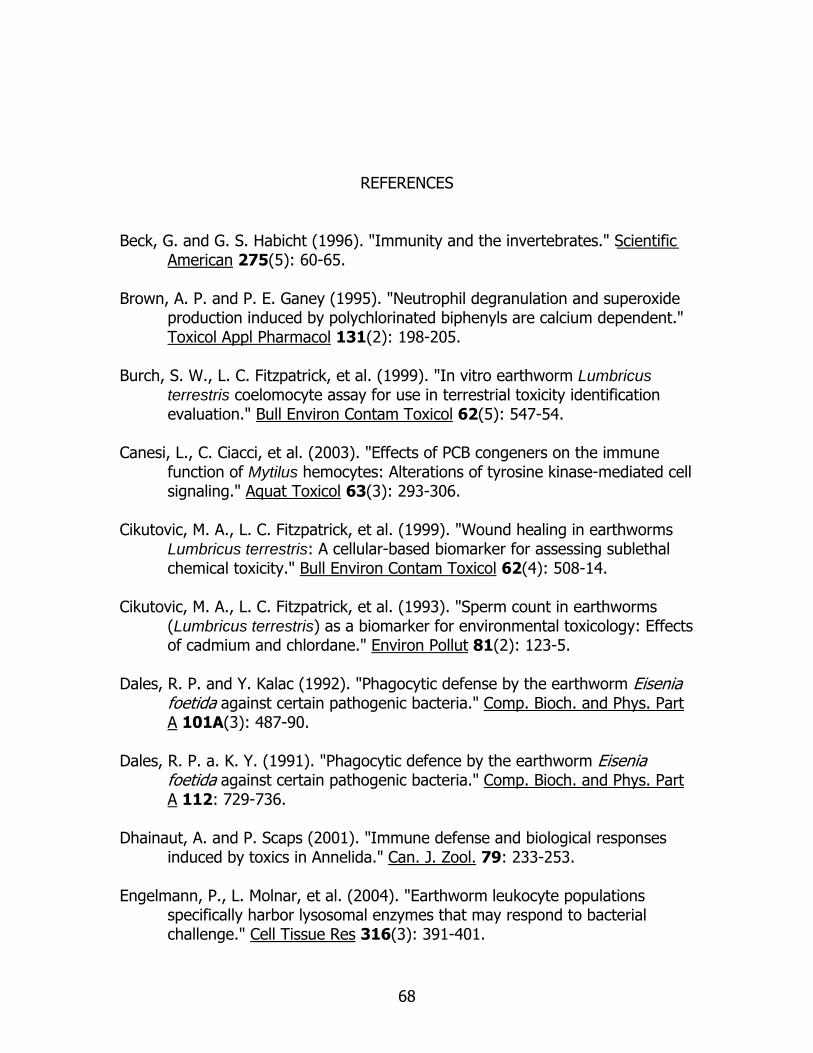
REFERENCES Beck, G. and G. S. Habicht (1996). "Immunity and the invertebrates." Scientific
American 275(5): 60-65. Brown, A. P. and P. E. Ganey (1995). "Neutrophil degranulation and superoxide
production induced by polychlorinated biphenyls are calcium dependent." Toxicol Appl Pharmacol 131(2): 198-205.
Burch, S. W., L. C. Fitzpatrick, et al. (1999). "In vitro earthworm Lumbricus
terrestris coelomocyte assay for use in terrestrial toxicity identification evaluation." Bull Environ Contam Toxicol 62(5): 547-54.
Canesi, L., C. Ciacci, et al. (2003). "Effects of PCB congeners on the immune
function of Mytilus hemocytes: Alterations of tyrosine kinase-mediated cell signaling." Aquat Toxicol 63(3): 293-306.
Cikutovic, M. A., L. C. Fitzpatrick, et al. (1999). "Wound healing in earthworms
Lumbricus terrestris: A cellular-based biomarker for assessing sublethal chemical toxicity." Bull Environ Contam Toxicol 62(4): 508-14.
Cikutovic, M. A., L. C. Fitzpatrick, et al. (1993). "Sperm count in earthworms
(Lumbricus terrestris) as a biomarker for environmental toxicology: Effects of cadmium and chlordane." Environ Pollut 81(2): 123-5.
Dales, R. P. and Y. Kalac (1992). "Phagocytic defense by the earthworm Eisenia
foetida against certain pathogenic bacteria." Comp. Bioch. and Phys. Part A 101A(3): 487-90.
Dales, R. P. a. K. Y. (1991). "Phagocytic defence by the earthworm Eisenia
foetida against certain pathogenic bacteria." Comp. Bioch. and Phys. Part A 112: 729-736.
Dhainaut, A. and P. Scaps (2001). "Immune defense and biological responses
induced by toxics in Annelida." Can. J. Zool. 79: 233-253. Engelmann, P., L. Molnar, et al. (2004). "Earthworm leukocyte populations
specifically harbor lysosomal enzymes that may respond to bacterial challenge." Cell Tissue Res 316(3): 391-401.
68
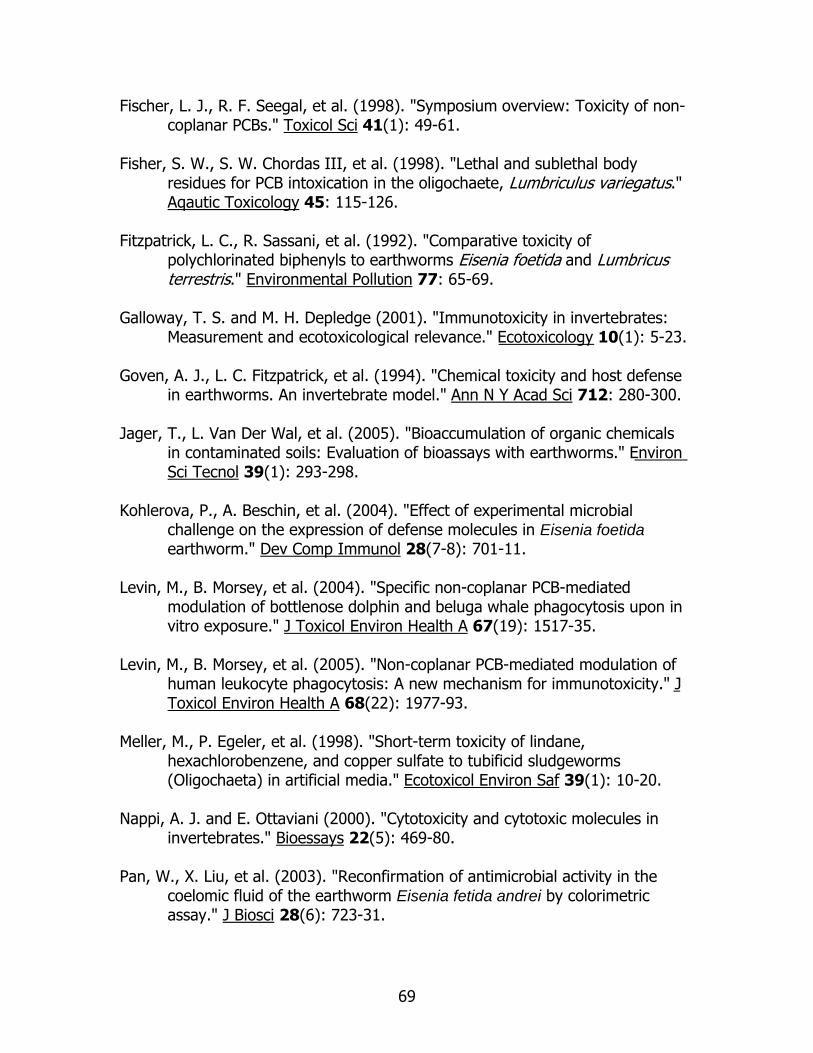
Fischer, L. J., R. F. Seegal, et al. (1998). "Symposium overview: Toxicity of non-coplanar PCBs." Toxicol Sci 41(1): 49-61.
Fisher, S. W., S. W. Chordas III, et al. (1998). "Lethal and sublethal body
residues for PCB intoxication in the oligochaete, Lumbriculus variegatus." Aqautic Toxicology 45: 115-126.
Fitzpatrick, L. C., R. Sassani, et al. (1992). "Comparative toxicity of
polychlorinated biphenyls to earthworms Eisenia foetida and Lumbricus terrestris." Environmental Pollution 77: 65-69.
Galloway, T. S. and M. H. Depledge (2001). "Immunotoxicity in invertebrates:
Measurement and ecotoxicological relevance." Ecotoxicology 10(1): 5-23. Goven, A. J., L. C. Fitzpatrick, et al. (1994). "Chemical toxicity and host defense
in earthworms. An invertebrate model." Ann N Y Acad Sci 712: 280-300. Jager, T., L. Van Der Wal, et al. (2005). "Bioaccumulation of organic chemicals
in contaminated soils: Evaluation of bioassays with earthworms." Environ Sci Tecnol 39(1): 293-298.
Kohlerova, P., A. Beschin, et al. (2004). "Effect of experimental microbial
challenge on the expression of defense molecules in Eisenia foetida earthworm." Dev Comp Immunol 28(7-8): 701-11.
Levin, M., B. Morsey, et al. (2004). "Specific non-coplanar PCB-mediated
modulation of bottlenose dolphin and beluga whale phagocytosis upon in vitro exposure." J Toxicol Environ Health A 67(19): 1517-35.
Levin, M., B. Morsey, et al. (2005). "Non-coplanar PCB-mediated modulation of
human leukocyte phagocytosis: A new mechanism for immunotoxicity." J Toxicol Environ Health A 68(22): 1977-93.
Meller, M., P. Egeler, et al. (1998). "Short-term toxicity of lindane,
hexachlorobenzene, and copper sulfate to tubificid sludgeworms (Oligochaeta) in artificial media." Ecotoxicol Environ Saf 39(1): 10-20.
Nappi, A. J. and E. Ottaviani (2000). "Cytotoxicity and cytotoxic molecules in
invertebrates." Bioessays 22(5): 469-80. Pan, W., X. Liu, et al. (2003). "Reconfirmation of antimicrobial activity in the
coelomic fluid of the earthworm Eisenia fetida andrei by colorimetric assay." J Biosci 28(6): 723-31.
69
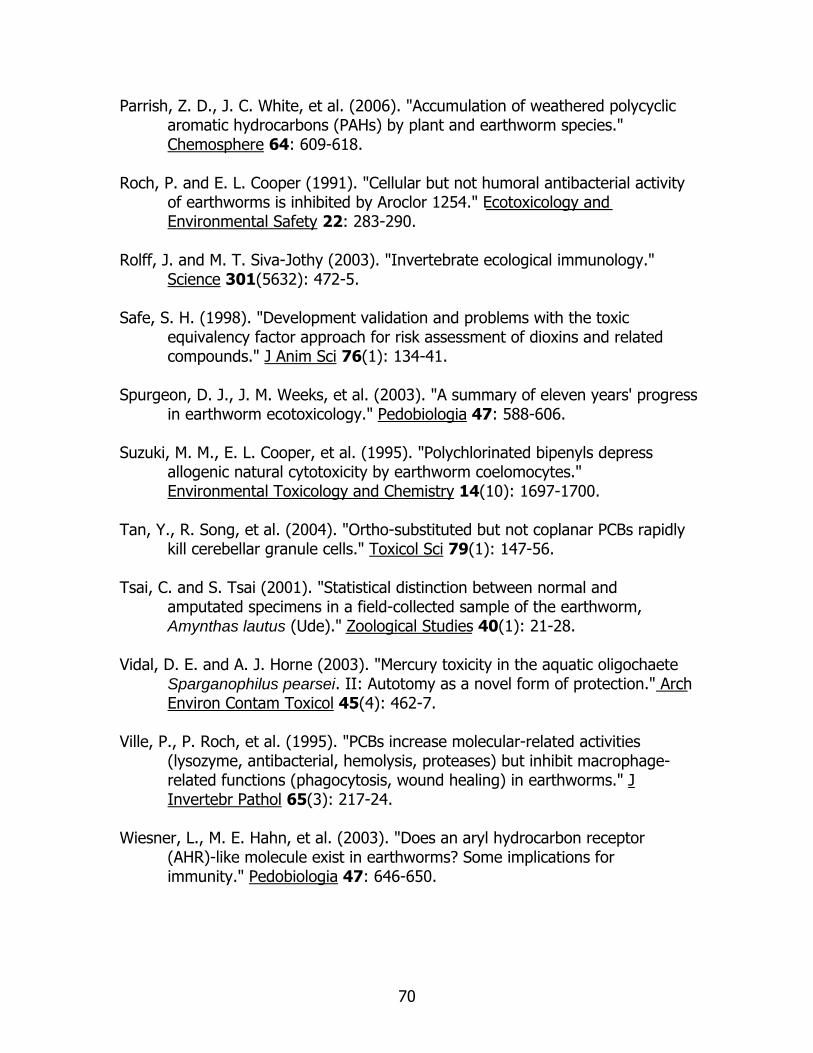
Parrish, Z. D., J. C. White, et al. (2006). "Accumulation of weathered polycyclic aromatic hydrocarbons (PAHs) by plant and earthworm species." Chemosphere 64: 609-618.
Roch, P. and E. L. Cooper (1991). "Cellular but not humoral antibacterial activity
of earthworms is inhibited by Aroclor 1254." Ecotoxicology and Environmental Safety 22: 283-290.
Rolff, J. and M. T. Siva-Jothy (2003). "Invertebrate ecological immunology."
Science 301(5632): 472-5. Safe, S. H. (1998). "Development validation and problems with the toxic
equivalency factor approach for risk assessment of dioxins and related compounds." J Anim Sci 76(1): 134-41.
Spurgeon, D. J., J. M. Weeks, et al. (2003). "A summary of eleven years' progress
in earthworm ecotoxicology." Pedobiologia 47: 588-606. Suzuki, M. M., E. L. Cooper, et al. (1995). "Polychlorinated bipenyls depress
allogenic natural cytotoxicity by earthworm coelomocytes." Environmental Toxicology and Chemistry 14(10): 1697-1700.
Tan, Y., R. Song, et al. (2004). "Ortho-substituted but not coplanar PCBs rapidly
kill cerebellar granule cells." Toxicol Sci 79(1): 147-56. Tsai, C. and S. Tsai (2001). "Statistical distinction between normal and
amputated specimens in a field-collected sample of the earthworm, Amynthas lautus (Ude)." Zoological Studies 40(1): 21-28.
Vidal, D. E. and A. J. Horne (2003). "Mercury toxicity in the aquatic oligochaete
Sparganophilus pearsei. II: Autotomy as a novel form of protection." Arch Environ Contam Toxicol 45(4): 462-7.
Ville, P., P. Roch, et al. (1995). "PCBs increase molecular-related activities
(lysozyme, antibacterial, hemolysis, proteases) but inhibit macrophage-related functions (phagocytosis, wound healing) in earthworms." J Invertebr Pathol 65(3): 217-24.
Wiesner, L., M. E. Hahn, et al. (2003). "Does an aryl hydrocarbon receptor
(AHR)-like molecule exist in earthworms? Some implications for immunity." Pedobiologia 47: 646-650.
70