clare county council marine development at doolin … county council marine development at doolin...
TRANSCRIPT

Clare County Council
Marine Development At Doolin
Wave Modelling
December 2010 Document Number: 13536/6005 Rev C

Clare County Council Marine Development at Doolin Wave Modelling Report Rev C
December 2010 Malachy Walsh and Partners
Clare County Council Marine Development At Doolin Wave Modelling Report December 2010 Document Number: 13536/6005 Rev C
Rev Date Prepared by Approved By
Status
9th November
2010 Modelling: J Murphy HMRC Report: P Parle MWP
Jack O’Leary Comment
A 10th
November 2010
Modelling: J Murphy HMRC Report: P Parle MWP
Jack O’Leary Comment
B 3rd
December 2010
Modelling: J Murphy HMRC Report: P Parle MWP
Jack O’Leary Final
C 22nd
December 2010
Modelling: J Murphy HMRC Report: P Parle MWP
Jack O’Leary For revised planning application relating to Layout H.

Clare County Council Marine Development at Doolin Wave Modelling Report Rev C
December 2010 Malachy Walsh and Partners
TABLE OF CONTENTS 1 Introduction
2 Description of Modelling
3 Assessment of Modelling Results
4 Summary
Table 1 Modelling Runs
Table 2 Summary Assessment of Wave Driven Currents
Drawing No 13536-5007, showing original proposal and Layout H.
Significant Wave Height Plots
Wave Current Plots
Wave Surface Elevation Plots
APPENDIX 1 Wave Modelling Interim Report Rev A

Clare County Council Marine Development at Doolin Wave Modelling Report Rev C
December 2010 1 Malachy Walsh and Partners
1 INTRODUCTION A marine development has been proposed at Doolin by Clare County Council. The proposed development consists of a new pier, revetment and dredging in the vicinity of the existing pier at Doolin. Concerns have been expressed by the surfing community as part of the planning process regarding the potential impacts of the proposed development on surfing waves in the vicinity of Crab Island and Ballaghaline Point (known locally as Doolin Point or The Point) at Doolin. A meeting was held in Clare County Council’s offices on the 2
nd September 2010 with representatives of the surfing
community following which Clare County Council agreed to undertake numerical wave modelling to assess the potential impacts of the proposed structure on wave action. Wave modelling of a number of wave conditions, development locations and development sizes was then undertaken by UCC’s Hydraulic and Maritime Research Centre. The interim results of the modelling were outlined in an interim report, revision A of this document, see Appendix 1. A copy of the interim report was given to the surfing community representatives and discussed with them during a meeting on the 11
th November 2010.
Further modelling was undertaken following this meeting. This report details the further modelling and conclusions drawn with regard to potential impacts on surf waves. 2 DESCRIPTION OF MODELLING 2.1 General The modelling of the interim report indicated that by moving the pier away from the original planning proposal and by shortening the pier length tends on average to reduce the potential impact on surf waves. Following from this it was decided to revise the original proposal by moving its location landwards some 25m and shortening the pier length by some 15m, Layout H. In addition to this, layout H is to be fronted by a revetment with a front slope of 1 vertical to 3 horizontal, see comment below on wave reflection coefficients. In order to enhance wave shelter at the pier, Layout H also involves rotation of the original proposal to make it parallel to the existing pier. This report gives a more detailed assessment of wave conditions using Layout H. The 2002 report discusses future development and stated that a potential future development at Doolin might need a navigational channel width of 76m. Layout H would be the closest that the new pier could be to the existing while allowing for such a future development. The bathymetry used in the modelling for this report is that obtained for the 2002 study supplemented with data obtained in 2010. The 2010 data has been surveyed during the modelling for the preliminary runs contained in the interim report and was not used in that modelling output. The 2010 data covers for the most part an area south east of The Point. There are gaps in the bathymetry immediately off Crab Island and The Point because of wave conditions in these areas during the survey period. Calm conditions in these areas are an infrequent occurrence. Levels in these areas were obtained by interpolation, and while the modelling in these areas might be less accurate as a result, it is changes in wave characteristics rather than absolute values that inform the assessment. That is to say the assessment concentrates on an evaluation of changes in Hs, wave driven currents and surface elevations. In addition the assessment covers a much wider sea area than the areas where there are data gaps and it is therefore possible to infer potential changes in these relatively limited areas. A reflection coefficient of approximately 40% was used in the modelling. This would mean that the slope of the front of the revetment would be in the order of 1 vertical to 3 horizontal. This has implications for the type of concrete armour unit that can be used. Some units depend for their stability on a steep front revetment slope. Such units (Accropode) should not be used in the development at Doolin as the resulting steep front slope will cause higher wave reflections. 2.2 Model Runs and Output The further modelling consisted of two strands:

Clare County Council Marine Development at Doolin Wave Modelling Report Rev C
December 2010 2 Malachy Walsh and Partners
The modelling of wave propagation from offshore to south west of Doolin. This was undertaken using MIKE21 Spectral Wave Module.
The modelling of wave propagation from just south west of Doolin to the shore. This was undertaken using MIKE21 Boussinesq Wave Module.
The two stage approach was adopted because during the meeting of the 11
th November the view was
expressed by the surfing representatives that the model seemed to be predicting the largest nearshore waves west of where they actually occur on the approaches to Crab Island and The Point. In addition a site visit was undertaken on the 17
th November to Doolin to visually assess conditions on
site. The initial modelling was based on a wave with a SW direction immediately off Doolin. Further preliminary runs indicated that slight (10˚) changes in the wave approach angle could move the location of the breaking wave towards the correct line of approach to Crab Island. The MIKE21 SW modelling indicated that offshore waves from the SW would change direction slightly as the waves approach the west coast of Clare. The nearshore wave angles for 12 to 18s period offshore waves with a SW direction were found to be closer to WSW than SW. A revised wave approach angle was then used in the final MIKE21 Boussinesq modelling based on this finding. The modelling has been undertaken using regular waves with an offshore height of 1m and periods of 12, 15, and 18s. Waves with a significant height of 1m offshore result in significant wave heights in the vicinity of the surfing areas of up to and greater than 4m. Regular waves were used in the modelling in order to better model the swell waves of interest. Model runs have been undertaken for:
The existing situation. (Existing)
The proposed development that has been presented to Clare County Council for planning approval, (New1). This pier has a berthing face some 100m from the existing pier, and is angled away from the existing pier.
A potential development at approximately 73m from the existing pier, Layout H of the interim modelling report (NewH). This development is similar to the original proposal but approximately 15m shorter and the orientation of the pier has been changed to make it parallel to the existing pier.
Modelling output is given below at MLWS, MWL and MHWS water levels. The output from the model runs are plans showing:
Mean significant wave height Hs
Mean wave driven current velocities
Surface elevation: This is a snapshot of the waves at a particular point in the model run. Modelling output given below is given first for Significant Wave Height, then for Wave Driven Current Velocities and then Surface Elevation. Model runs and output are listed in Table 1 below. 2.3 Models Used
The wave models used are the Danish Hydraulics Institute Boussinesq Wave Model (MIKE21 BW), and the Wave Spectral Module (MIKE21 SW). MIKE21 BW is a very advanced wave modelling package and is suitable for determining wave disturbance in small areas. It includes such influences as shoaling, refraction, diffraction, directional spreading, frequency spreading, reflections and back scattering, wave-wave interaction, bottom friction and wave-ship interaction. It is a model that includes wave breaking processes as the waves approach the shore. Contoured plots of waves are

Clare County Council Marine Development at Doolin Wave Modelling Report Rev C
December 2010 3 Malachy Walsh and Partners
shown on the Surface Elevation plots of this report. In these plots thin crest levels are indicative of breaking. MIKE21 SW models amongst other things, wave refraction effects. It is these effects that change the direction of waves as they propagate from deep into shallow water when the wave direction is at an angle to the seabed contours.

Clare County Council Marine Development at Doolin Wave Modelling Report Rev C
December 2010 4 Malachy Walsh and Partners
Table 1 Marine Development at Doolin Wave Model Runs
Run
Number Layout Orientation Location
Nominal Berthing
Length
m
Offshore Wave Conditions
Water
Level
Model Output
Wave Height
H m
Wave Period
T s Wave Direction
Mean Wave Height
Mean Wave
Current Surface
Elevation
1 Exist N/A N/A N/A 1 12 SW MHWS Y Y Y
2 Exist N/A N/A N/A 1 12 SW MLWS Y Y Y
3 Exist N/A N/A N/A 1 12 SW MWL Y Y Y
4 Exist N/A N/A N/A 1 15 SW MHWS Y Y Y
5 Exist N/A N/A N/A 1 15 SW MLWS Y Y Y
6 Exist N/A N/A N/A 1 15 SW MWL Y Y Y
7 Exist N/A N/A N/A 1 18 SW MHWS Y Y Y
8 Exist N/A N/A N/A 1 18 SW MLWS Y Y Y
9 Exist N/A N/A N/A 1 18 SW MWL Y Y Y
10 New1 Not Parallel 100 101 1 12 SW MHWS Y Y Y
11 New1 Not Parallel 100 101 1 15 SW MHWS Y Y Y
12 New1 Not Parallel 100 101 1 18 SW MHWS Y Y Y
13 NewH Parallel 73 85 1 12 SW MHWS Y Y Y
14 NewH Parallel 73 85 1 12 SW MLWS Y Y Y
15 NewH Parallel 73 85 1 12 SW MWL Y Y Y
16 NewH Parallel 73 85 1 15 SW MHWS Y Y Y
17 NewH Parallel 73 85 1 15 SW MLWS Y Y Y
18 NewH Parallel 73 85 1 15 SW MWL Y Y Y
19 NewH Parallel 73 85 1 18 SW MHWS Y Y Y
20 NewH Parallel 73 85 1 18 SW MLWS Y Y Y
21 NewH Parallel 73 85 1 18 SW MWL Y Y Y Note an offshore wave direction of SW gives a nearshore wave direction between WSW and SW just off Doolin.

Clare County Council Marine Development at Doolin Wave Modelling Report Rev C
December 2010 4 Malachy Walsh and Partners
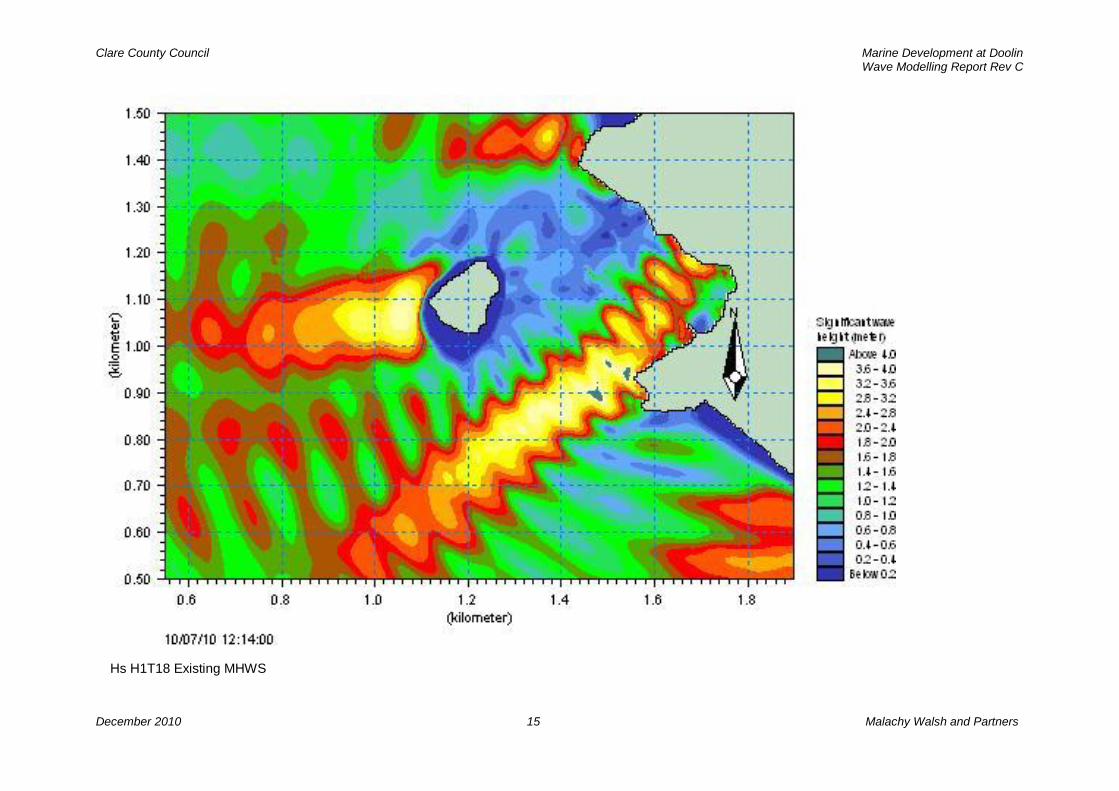
3 ASSESSMENT OF MODEL OUTPUT The assessment concentrates on Hs and current output. Hs measures mean wave height at a location and shows potential changes better than the surface elevation plots. 3.1 Significant Wave Height Plots
An assessment of the significant wave height plots of the modelling undertaken for this report indicates that:
There is considerable reflection occurring in the existing situation at Doolin. This has implications in terms of the significance of potential reflection from the proposed development. The amount of reflection increases with water level, there being little reflection at MLWS and considerable reflection at MWL and MHWS. The amount of reflection also increases with wave period. The assessment therefore examines changes in Hs at different water levels, and within each water level set, at different wave periods
At Mean Low Water Spring tide the proposed development at Layout H has little if any impact on waves approaching Crab Island, The Point or the area in between. This was indicated by the plots for waves with periods, 12, 15 and 18s.
At Mean Water Level (approximately mid tide level) some changes were noted. These included:
For the 12s wave
There is a noticeable area of change with increases in Hs to the East of Crab Island;
There is some change noticeable on the wave approach to the Point;
There is a very slight change on the wave approach to Crab Island;
For the 15s wave
The most noticeable area of change is to the East of Crab Island and in the wave approach to the area between Crab Island and the Point.
There is a localised slight increase in the wave approach to Crab Island
Slight changes in the wave approach to the Point
For the 18s wave
There are changes in Hs in the area north of the wave approach to Crab Island;
There are slight changes to the wave approach to the Point;
There are slight changes in the wave approach between the Crab Island and the Point.
At Mean High Water Spring Tide the following were noted
For the 12s wave
The most noticeable change is on the east side of Crab Island and on the approach between Crab Island and the Point;
Changes on the wave approaches to Crab Island and the Point are slight;

Clare County Council Marine Development at Doolin Wave Modelling Report Rev C
December 2010 5 Malachy Walsh and Partners
For the 15s wave
The largest changes are on the east and north east side of Crab Island;
Changes on approaches to Crab Island, the Point and the area in between are similar.
For the 18s wave
There are potentially significant changes on the wave approach to the Point; Changes on the wave approach to Crab Island are noticeable but slight;
There are also changes to the north of the wave approach to Crab Island.
The impacts on the 18s waves at MHWS are larger than for the shorter wave periods
at this water level and are greater than impacts at lower water levels. In summary the impact of the proposed structure (Layout H) on waves is slight to none on water levels below mean tide level. Above this level impacts increase but are only locally potentially significant at the highest water levels for longer swell waves. Longer swell waves are likely to be significantly impacted upon as they approach the Point at higher stages of the tide. 3.2 Wave Current Plots
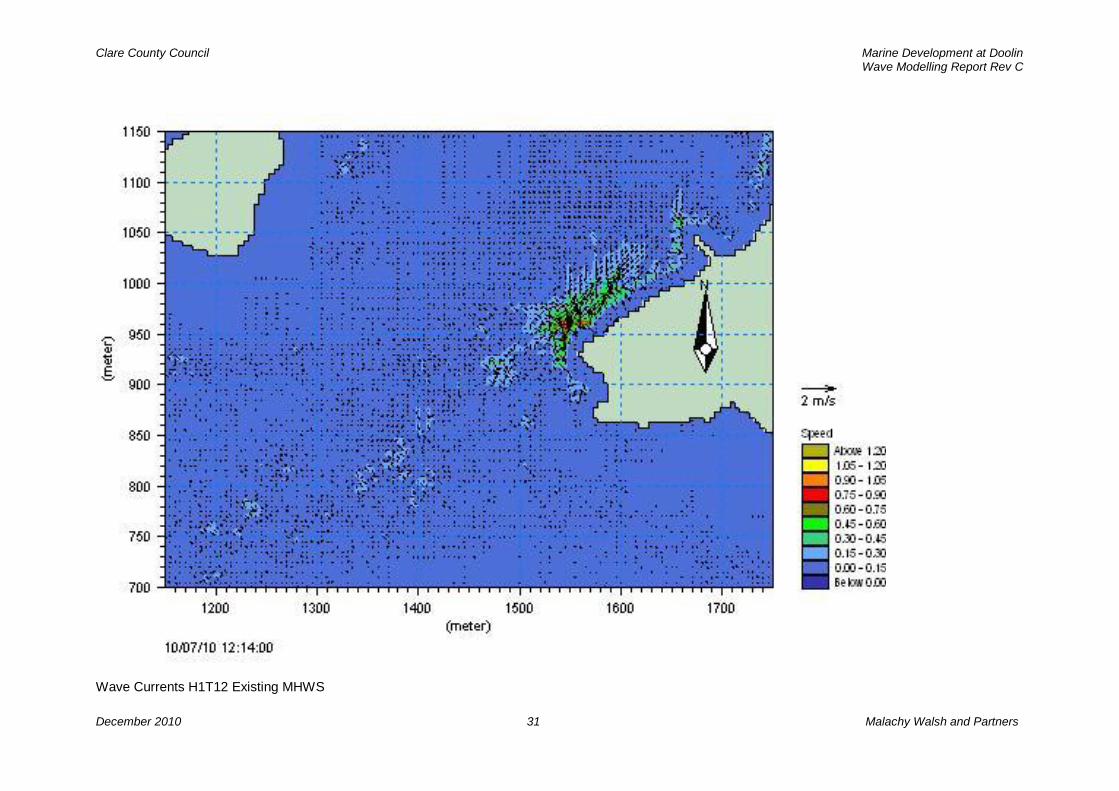
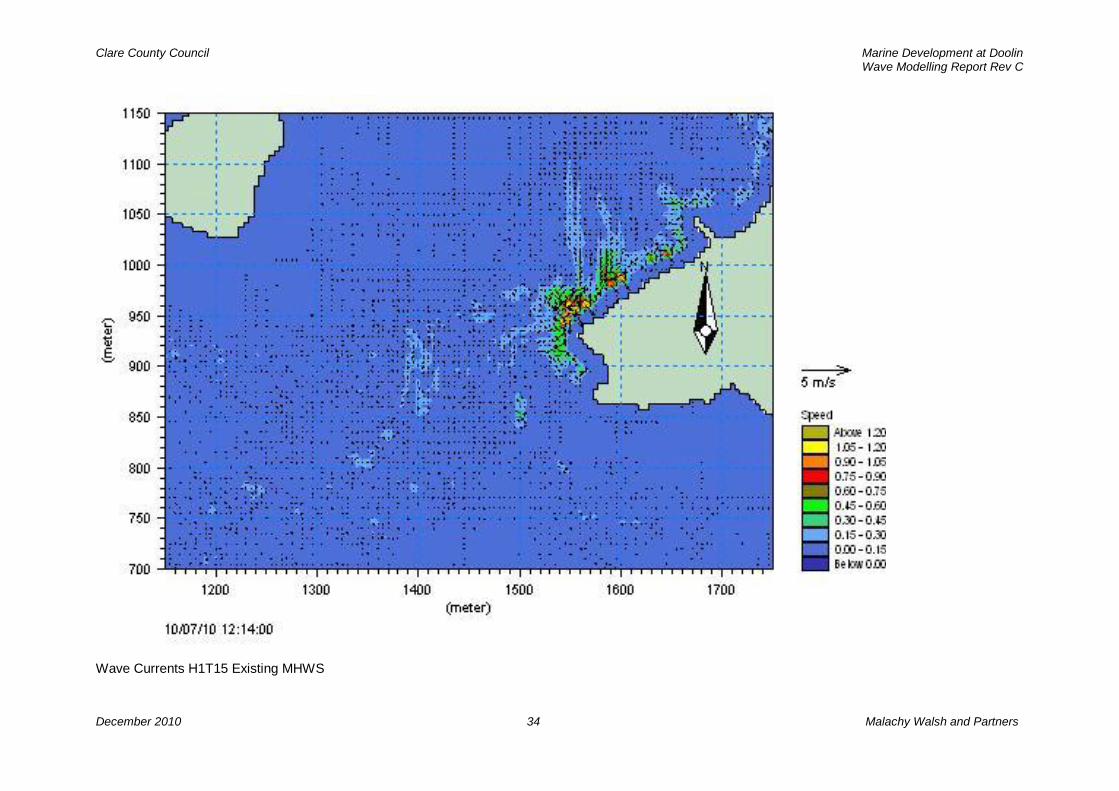
Rip currents generated by wave action at Doolin can be much greater than those generated by tides. The mean value of these currents has been estimated from the modelling. Table 2 below gives an indication of changes in rip currents due to the proposed option, layout H. The assessment concentrates in the area presently used to access the water between the existing pier and The Point. Table 2 Summary Assessment of Wave Driven Currents
Wave Period s Tide Level Layout
Existing New H
12 MHWS 0.45 to 0.6s Up to 1.05 locally, 0.6 in the wider area
12 MLWS 0.15 to 0.3 0.15 to 0.3
12 MWL 0.45 to 0.6, very narrow band
0.45 to 0.6,
15 MHWS Up to 1.05 Up to 1.05 locally. Less than 0.6m/s generally
15 MLWS 0.3 to 0.45 0.15 to 0.3
15 MWL 0.45 to 0.6 Up to 1.05 locally, Up to 0.6m/s generally
18 MHWS 0.45 to >1.05 >1.05 to 0.6 locally
18 MLWS 0.15 to 0.3 0.15 to 0.3
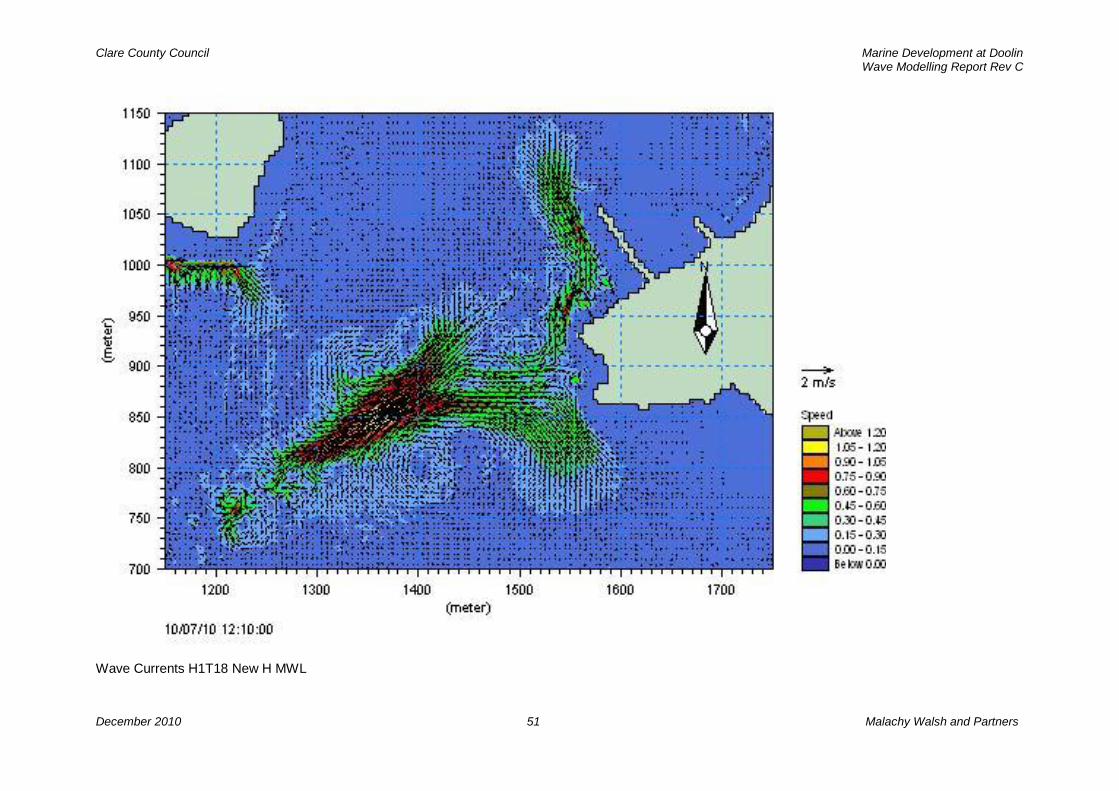
18 MWL 0.3 to 0.6 0.4 to 0.6, maintained to head of pier
The modelling indicated that while the proposed development increased rip currents the biggest increases are localised and occur on the seaward side of the proposed pier. In a wider area the rip currents appeared to be similar to the existing values. Modelling indicates that the proposed development causes currents to deflect along the new structure towards its head. However, in most cases these currents quickly die off as the head of the pier is approached.

Clare County Council Marine Development at Doolin Wave Modelling Report Rev C
December 2010 6 Malachy Walsh and Partners
In general at MLWS high wave currents (>1.05m/s) occur seawards of the Point. They are relatively low in the access area. This holds true both for the existing situation and the proposed Layout H. At MHWS wave currents are higher in the access area than further seawards and while the proposed pier causes an increase in these currents the increase is localised and the high currents die off quickly away from the high values. At MWL the currents in the access area increase, and, as for the other water levels, the increases are for the most part local and die away to values similar to the existing situation. However, at this water level, the longer period swell, such as the 18s period waves, gives rise to a relatively broad area of increased current (up to 0.6m/s) which sweeps up to and past the head of the pier before dying off. The current does die off away from the pier. Overall, the wave driven currents will increase locally in the access area for higher stages of the tide. The increase is only likely to be significant near mid tide for long period swell. Near low tide, wave driven currents in the access area are low and remain low with the proposed layout H. Near high tide increases are localised. 3.3 Surface Elevation Plots
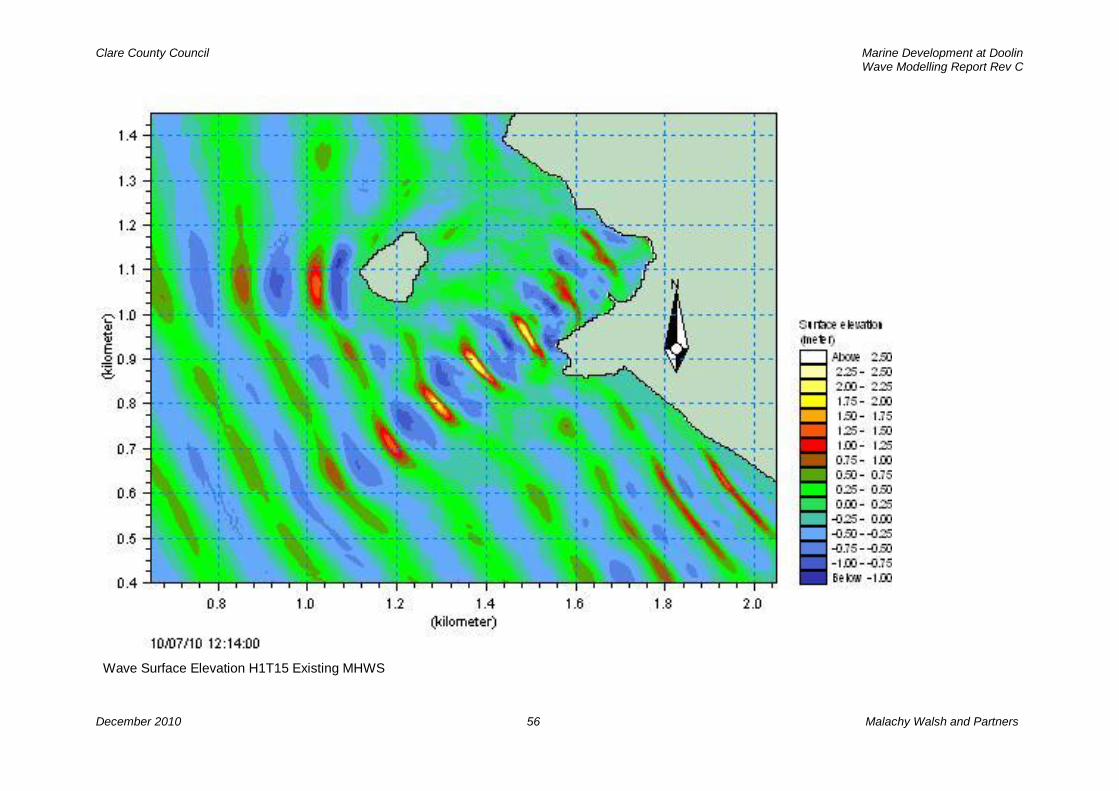
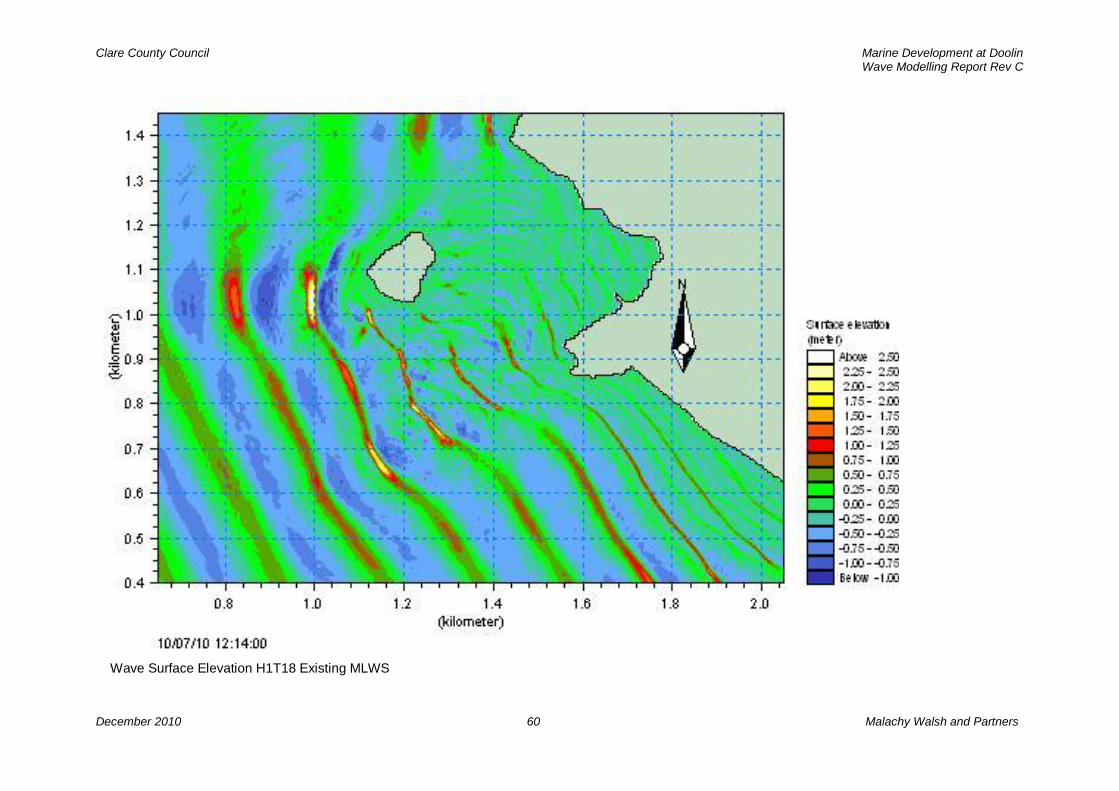
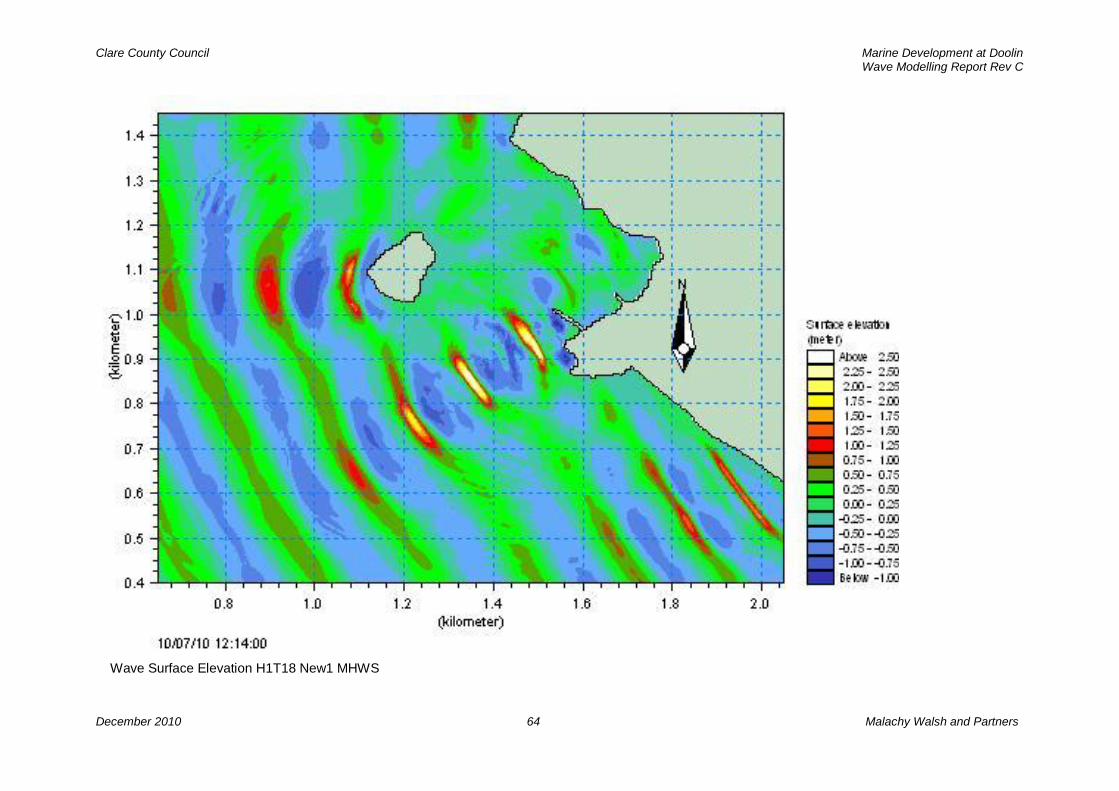
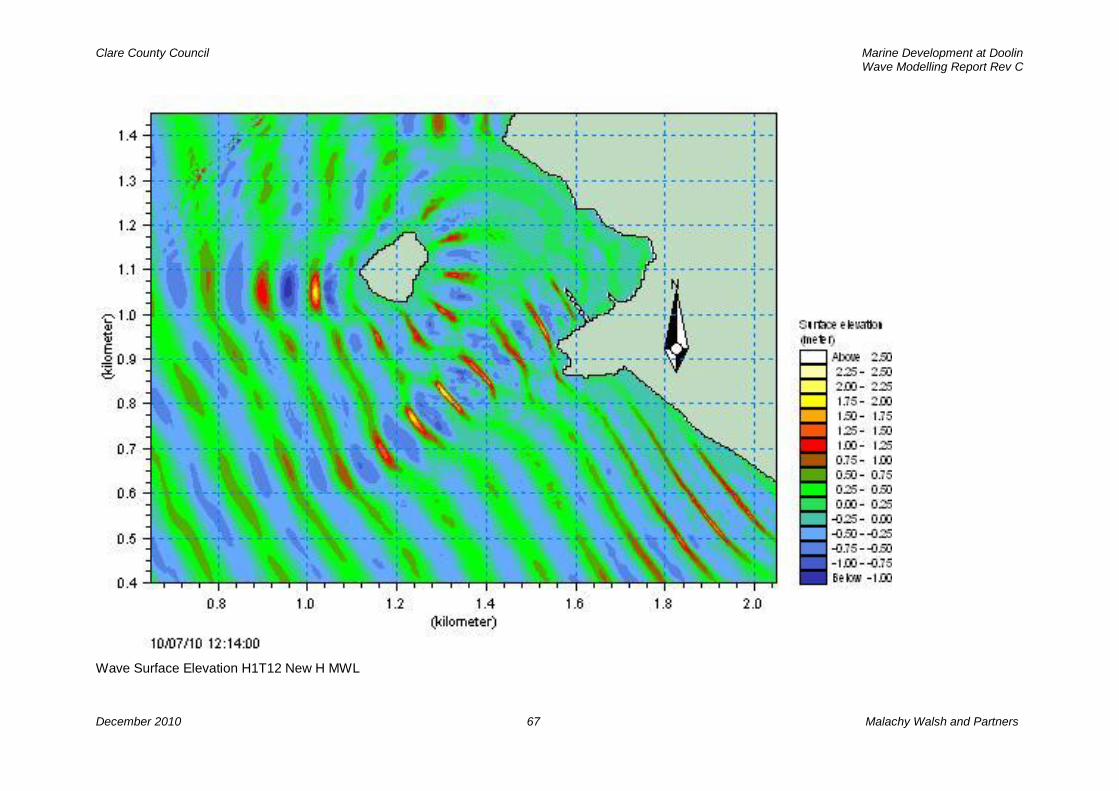
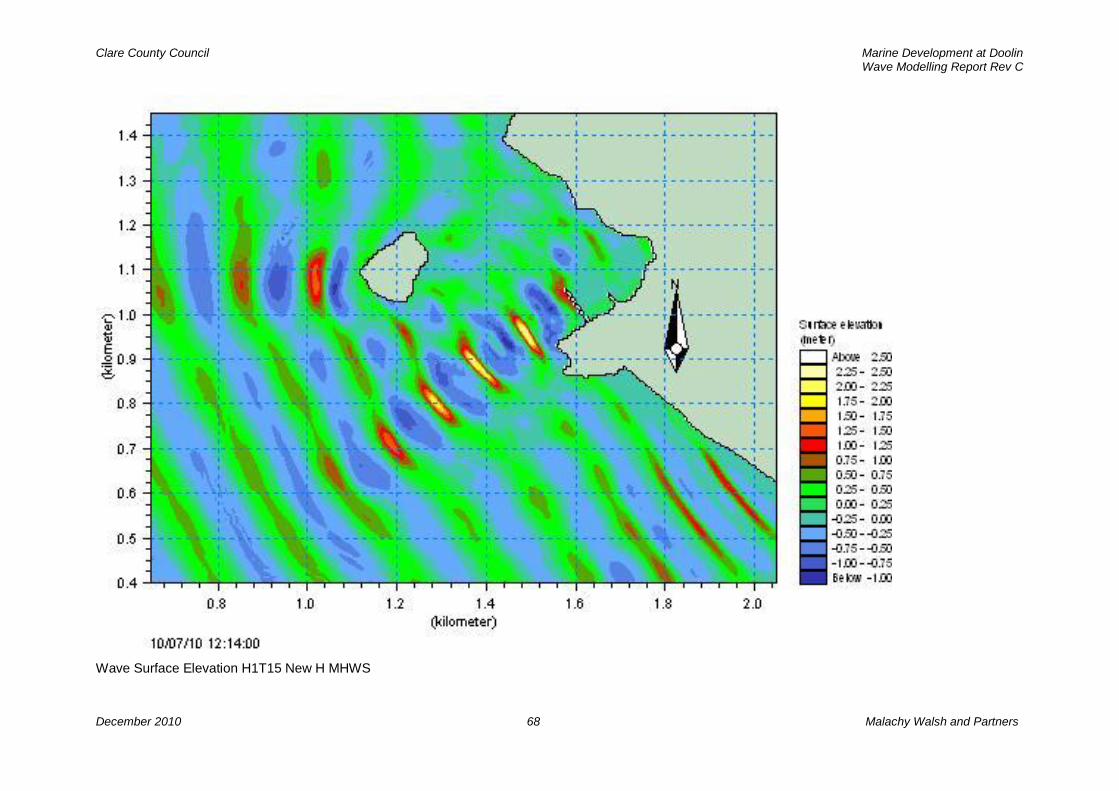
Surface elevation plots were output for the model runs. They represent a contoured plan snapshot of the water surface elevation at a point in time. It is difficult to see any changes in wave conditions from these plots. Unless the snapshot is taken at a specific time such plots do not highlight changes. The plots have been included in this report for information as they indicate modelling predictions of locations of wave shoaling, wave directions and wave heights.

Clare County Council Marine Development at Doolin Wave Modelling Report Rev C
December 2010 7 Malachy Walsh and Partners
4 SUMMARY
The modelling of the interim report (see Appendix 1) indicated that by moving the pier away from the location of the original planning proposal and by shortening the pier length tends on average to reduce the potential impact on surf waves. Following from this it was decided to revise the original proposal by moving its location landwards some 25m and shortening the pier length by some 15m. In addition, this new layout, layout H is to be fronted by a revetment with a front slope of 1 vertical to 3 horizontal to minimise wave reflections. In order to enhance shelter it was also decided to make the new pier (Layout H) parallel to the existing pier. The modelling undertaken for this report included bathymetric data surveyed in 2010 during the preparation of the interim report. This data covers for the most part an area south east of The Point. There are gaps in the bathymetry immediately off Crab Island and The Point because of wave conditions in these areas during the survey period. Wave conditions in these areas are seldom calm. Levels in these areas were obtained by interpolation and while the modelling in these areas might be less accurate as a result it was changes in wave characteristics rather than absolute values that informed the assessment. That is to say the assessment concentrates on an evaluation of changes in Hs, wave driven currents and surface elevations. In addition the assessment covers a much wider sea area than the areas where there are data gaps and it is therefore possible to infer potential changes in these relatively limited areas. The significant wave height and wave driven current plots were used to inform the assessment. These plots indicate changes in wave characteristics better than the surface elevation plots. The significant wave height plots indicate that there is very little impact on surf waves at MLWS. At higher water levels (MWL and MHWS) changes were noted. However, for the most part, changes are slight particularly in the areas of greatest interest, such as on the wave approaches to Crab Island and The Point. Changes are greatest for the longest wave period examined, 18s, at MHWS. For this case there may be a significant impact on surf waves on the approach to The Point. For the other cases examined and at the lower water levels while changes were evident they are unlikely to be significant. Overall the greatest changes appear to occur to the east and north east of Crab Island (which are outside the general surfing areas) and to a lesser extent in the approach between the Island and The Point. In conclusion we would recommend the movement of the proposed development to that of Layout H as a reasoned response to concerns regarding potential impacts on surfing activities.

Clare County Council Marine Development at Doolin Wave Modelling Report Rev C
December 2010 8 Malachy Walsh and Partners
Blank Page

Clare County Council Marine Development at Doolin Wave Modelling Report Rev C
December 2010 9 Malachy Walsh and Partners
Insert 13536-5007 .

Clare County Council Marine Development at Doolin Wave Modelling Report Rev C
December 2010 10 Malachy Walsh and Partners

Clare County Council Marine Development at Doolin Wave Modelling Report Rev C
December 2010 8 Malachy Walsh and Partners
Wave Modelling Output
Significant Wave Height

Clare County Council Marine Development at Doolin Wave Modelling Report Rev C
December 2010 9 Malachy Walsh and Partners
Hs H1T12 Existing MHWS

Clare County Council Marine Development at Doolin Wave Modelling Report Rev C
December 2010 10 Malachy Walsh and Partners
Hs H1T12 Existing MLWS

Clare County Council Marine Development at Doolin Wave Modelling Report Rev C
December 2010 11 Malachy Walsh and Partners
Hs H1T12 Existing MWL

Clare County Council Marine Development at Doolin Wave Modelling Report Rev C
December 2010 12 Malachy Walsh and Partners
Hs H1T15 Existing MHWS

Clare County Council Marine Development at Doolin Wave Modelling Report Rev C
December 2010 13 Malachy Walsh and Partners
Hs H1T15 Existing MLWS

Clare County Council Marine Development at Doolin Wave Modelling Report Rev C
December 2010 14 Malachy Walsh and Partners
Hs H1T15 Existing MWL
Clare County Council Marine Development at Doolin Wave Modelling Report Rev C
December 2010 15 Malachy Walsh and Partners
Hs H1T18 Existing MHWS

Clare County Council Marine Development at Doolin Wave Modelling Report Rev C
December 2010 16 Malachy Walsh and Partners
Hs H1T18 Existing MLWS

Clare County Council Marine Development at Doolin Wave Modelling Report Rev C
December 2010 17 Malachy Walsh and Partners
Hs H1T18 Existing MWL

Clare County Council Marine Development at Doolin Wave Modelling Report Rev C
December 2010 18 Malachy Walsh and Partners
Hs H1T12 New1 MHWS

Clare County Council Marine Development at Doolin Wave Modelling Report Rev C
December 2010 19 Malachy Walsh and Partners
Hs H1T15 New1 MHWS

Clare County Council Marine Development at Doolin Wave Modelling Report Rev C
December 2010 20 Malachy Walsh and Partners
Hs H1T18 New1 MHWS

Clare County Council Marine Development at Doolin Wave Modelling Report Rev C
December 2010 21 Malachy Walsh and Partners
Hs H1T12 New H MHWS

Clare County Council Marine Development at Doolin Wave Modelling Report Rev C
December 2010 22 Malachy Walsh and Partners
Hs H1T12 New H MLWS

Clare County Council Marine Development at Doolin Wave Modelling Report Rev C
December 2010 23 Malachy Walsh and Partners
Hs H1T12 New H MWL.

Clare County Council Marine Development at Doolin Wave Modelling Report Rev C
December 2010 24 Malachy Walsh and Partners
Hs H1T15 New H MHWS

Clare County Council Marine Development at Doolin Wave Modelling Report Rev C
December 2010 25 Malachy Walsh and Partners
Hs H1T15 New H MLWS

Clare County Council Marine Development at Doolin Wave Modelling Report Rev C
December 2010 26 Malachy Walsh and Partners
Hs H1T15 New H MWL

Clare County Council Marine Development at Doolin Wave Modelling Report Rev C
December 2010 27 Malachy Walsh and Partners
Hs H1T18 New H MHWS

Clare County Council Marine Development at Doolin Wave Modelling Report Rev C
December 2010 28 Malachy Walsh and Partners
Hs H1T18 New H MLWS

Clare County Council Marine Development at Doolin Wave Modelling Report Rev C
December 2010 29 Malachy Walsh and Partners
Hs H1T18 New H MWL

Clare County Council Marine Development at Doolin Wave Modelling Report Rev C
December 2010 30 Malachy Walsh and Partners
Wave Modelling Output
Wave Driven Current Velocities
Clare County Council Marine Development at Doolin Wave Modelling Report Rev C
December 2010 31 Malachy Walsh and Partners
Wave Currents H1T12 Existing MHWS

Clare County Council Marine Development at Doolin Wave Modelling Report Rev C
December 2010 32 Malachy Walsh and Partners
Wave Currents H1T12 Existing MLWS

Clare County Council Marine Development at Doolin Wave Modelling Report Rev C
December 2010 33 Malachy Walsh and Partners
Wave Currents H1T12 Existing MWL
Clare County Council Marine Development at Doolin Wave Modelling Report Rev C
December 2010 34 Malachy Walsh and Partners
Wave Currents H1T15 Existing MHWS

Clare County Council Marine Development at Doolin Wave Modelling Report Rev C
December 2010 35 Malachy Walsh and Partners
Wave Currents H1T15 Existing MLWS

Clare County Council Marine Development at Doolin Wave Modelling Report Rev C
December 2010 36 Malachy Walsh and Partners
Wave Currents H1T15 Existing MWL

Clare County Council Marine Development at Doolin Wave Modelling Report Rev C
December 2010 37 Malachy Walsh and Partners
Wave Currents H1T18 Existing MHWS

Clare County Council Marine Development at Doolin Wave Modelling Report Rev C
December 2010 38 Malachy Walsh and Partners
Wave Currents H1T18 Existing MLWS

Clare County Council Marine Development at Doolin Wave Modelling Report Rev C
December 2010 39 Malachy Walsh and Partners
Wave Currents H1T18 Existing MWL

Clare County Council Marine Development at Doolin Wave Modelling Report Rev C
December 2010 40 Malachy Walsh and Partners
Wave Currents H1T12 New1 MHWS

Clare County Council Marine Development at Doolin Wave Modelling Report Rev C
December 2010 41 Malachy Walsh and Partners
Wave Currents H1T15 New1 MHWS

Clare County Council Marine Development at Doolin Wave Modelling Report Rev C
December 2010 42 Malachy Walsh and Partners
Wave Currents H1T18 New1 MHWS

Clare County Council Marine Development at Doolin Wave Modelling Report Rev C
December 2010 43 Malachy Walsh and Partners
Wave Currents H1T12 New H MHWS

Clare County Council Marine Development at Doolin Wave Modelling Report Rev C
December 2010 44 Malachy Walsh and Partners
Wave Currents H1T12 New H MLWS

Clare County Council Marine Development at Doolin Wave Modelling Report Rev C
December 2010 45 Malachy Walsh and Partners
Wave Currents H1T12 New H MWL

Clare County Council Marine Development at Doolin Wave Modelling Report Rev C
December 2010 46 Malachy Walsh and Partners
Wave Currents H1T15 New H MHWS

Clare County Council Marine Development at Doolin Wave Modelling Report Rev C
December 2010 47 Malachy Walsh and Partners
Wave Currents H1T15 New H MLWS

Clare County Council Marine Development at Doolin Wave Modelling Report Rev C
December 2010 48 Malachy Walsh and Partners
Wave Currents H1T15 New H MWL

Clare County Council Marine Development at Doolin Wave Modelling Report Rev C
December 2010 49 Malachy Walsh and Partners
Wave Currents H1T18 New H MHWS

Clare County Council Marine Development at Doolin Wave Modelling Report Rev C
December 2010 50 Malachy Walsh and Partners
Wave Currents H1T18 New H MLWS
Clare County Council Marine Development at Doolin Wave Modelling Report Rev C
December 2010 51 Malachy Walsh and Partners
Wave Currents H1T18 New H MWL
Clare County Council Marine Development at Doolin Wave Modelling Report Rev C
December 2010 52 Malachy Walsh and Partners
Wave Modelling Output
Wave Surface Elevation

Clare County Council Marine Development at Doolin Wave Modelling Report Rev C
December 2010 53 Malachy Walsh and Partners
Wave Surface Elevation H1T12 Existing MHWS

Clare County Council Marine Development at Doolin Wave Modelling Report Rev C
December 2010 54 Malachy Walsh and Partners
Wave Surface Elevation H1T12 Existing MLWS

Clare County Council Marine Development at Doolin Wave Modelling Report Rev C
December 2010 55 Malachy Walsh and Partners
Wave Surface Elevation H1T12 Existing MWL
Clare County Council Marine Development at Doolin Wave Modelling Report Rev C
December 2010 56 Malachy Walsh and Partners
Wave Surface Elevation H1T15 Existing MHWS

Clare County Council Marine Development at Doolin Wave Modelling Report Rev C
December 2010 57 Malachy Walsh and Partners
Wave Surface Elevation H1T15 Existing MLWS

Clare County Council Marine Development at Doolin Wave Modelling Report Rev C
December 2010 58 Malachy Walsh and Partners
Wave Surface Elevation H1T15 Existing MWL

Clare County Council Marine Development at Doolin Wave Modelling Report Rev C
December 2010 59 Malachy Walsh and Partners
Wave Surface Elevation H1T18 Existing MHWS
Clare County Council Marine Development at Doolin Wave Modelling Report Rev C
December 2010 60 Malachy Walsh and Partners
Wave Surface Elevation H1T18 Existing MLWS

Clare County Council Marine Development at Doolin Wave Modelling Report Rev C
December 2010 61 Malachy Walsh and Partners
Wave Surface Elevation H1T18 Existing MWL

Clare County Council Marine Development at Doolin Wave Modelling Report Rev C
December 2010 62 Malachy Walsh and Partners
Wave Surface Elevation H1T12 New1 MHWS

Clare County Council Marine Development at Doolin Wave Modelling Report Rev C
December 2010 63 Malachy Walsh and Partners
Wave Surface Elevation H1T15 New1 MHWS
Clare County Council Marine Development at Doolin Wave Modelling Report Rev C
December 2010 64 Malachy Walsh and Partners
Wave Surface Elevation H1T18 New1 MHWS

Clare County Council Marine Development at Doolin Wave Modelling Report Rev C
December 2010 65 Malachy Walsh and Partners
Wave Surface Elevation H1T12 New H MHWS

Clare County Council Marine Development at Doolin Wave Modelling Report Rev C
December 2010 66 Malachy Walsh and Partners
Wave Surface Elevation H1T12 New H MLWS
Clare County Council Marine Development at Doolin Wave Modelling Report Rev C
December 2010 67 Malachy Walsh and Partners
Wave Surface Elevation H1T12 New H MWL
Clare County Council Marine Development at Doolin Wave Modelling Report Rev C
December 2010 68 Malachy Walsh and Partners
Wave Surface Elevation H1T15 New H MHWS

Clare County Council Marine Development at Doolin Wave Modelling Report Rev C
December 2010 69 Malachy Walsh and Partners
Wave Surface Elevation H1T15 New H MLWS

Clare County Council Marine Development at Doolin Wave Modelling Report Rev C
December 2010 70 Malachy Walsh and Partners
Wave Surface Elevation H1T15 New H MWL

Clare County Council Marine Development at Doolin Wave Modelling Report Rev C
December 2010 71 Malachy Walsh and Partners
Wave Surface Elevation H1T18 New H MHWS

Clare County Council Marine Development at Doolin Wave Modelling Report Rev C
December 2010 72 Malachy Walsh and Partners
Wave Surface Elevation H1T18 New H MLWS

Clare County Council Marine Development at Doolin Wave Modelling Report Rev C
December 2010 73 Malachy Walsh and Partners
Wave Surface Elevation H1T18 New H MWL

Clare County Council Marine Development at Doolin Wave Modelling Report Rev C
December 2010 74 Malachy Walsh and Partners
APPENDIX 1 Wave Modelling Interim Report Rev A