cive 416 report(final)
TRANSCRIPT
CIVE 416
Geotechnical Engineering
Design Exercise
Jaieun Han 260360482
Monique Ming 260375411
March 10, 2014
Table of Contents1.0 INTRODUCTION.....................................................................................................................................2
2.0 SITE AND PROJECT DESCRIPTION...........................................................................................................2
2.1 Site Description..................................................................................................................................2
2.2 Building Description...........................................................................................................................2
3.0 SHALLOW FOUNDATION........................................................................................................................2
3.1 Footing Size........................................................................................................................................2
3.2 Stress Distribution.............................................................................................................................2
3.3 Settlement2
4.0 RECOMMENDATION..............................................................................................................................2
5.0 LIMITATIONS..........................................................................................................................................2
APPENDIX....................................................................................................................................................2
Appendix I Soil Properties..................................................................................................................2
Appendix II Shallow Foundation.........................................................................................................2
Appendix III Slope Stability................................................................................................................14
1
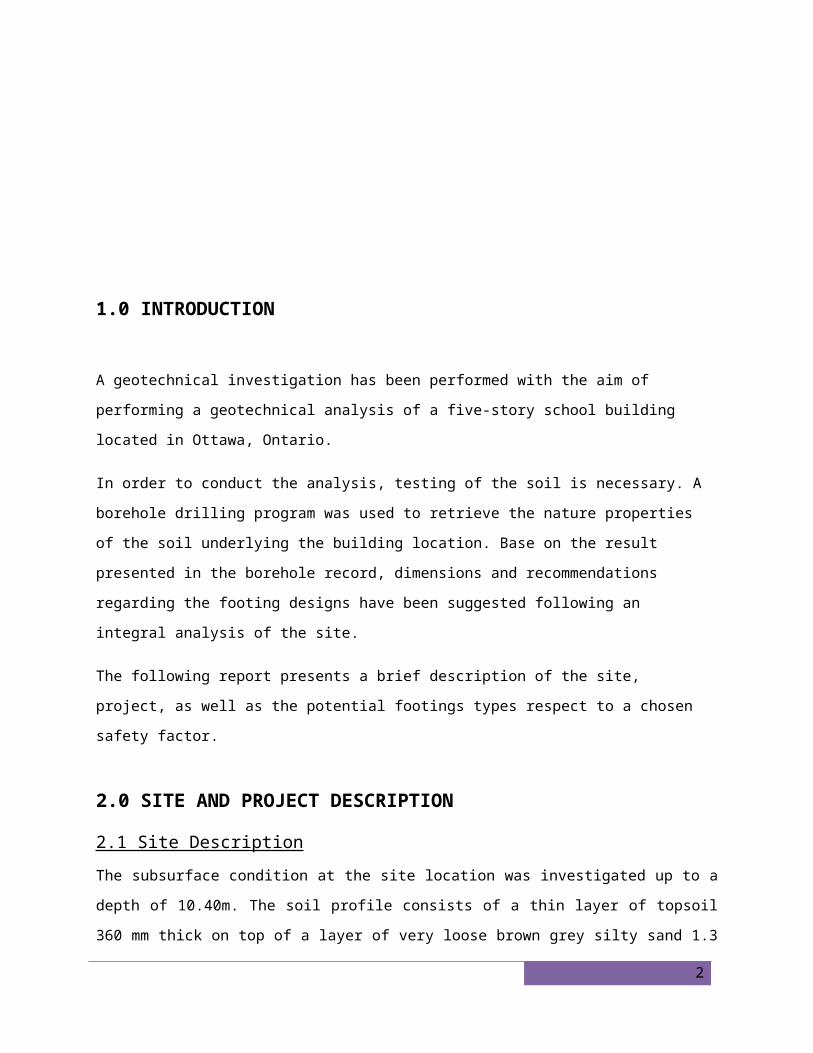
1.0 INTRODUCTION
A geotechnical investigation has been performed with the aim of performing a geotechnical analysis of a
five-story school building located in Ottawa, Ontario.
In order to conduct the analysis, testing of the soil is necessary. A borehole drilling program was used to
retrieve the nature properties of the soil underlying the building location. Base on the result presented in
the borehole record, dimensions and recommendations regarding the footing designs have been suggested
following an integral analysis of the site.
The following report presents a brief description of the site, project, as well as the potential footings types
respect to a chosen safety factor.
2.0 SITE AND PROJECT DESCRIPTION
2.1 Site DescriptionThe subsurface condition at the site location was investigated up to a depth of 10.40m. The soil profile
consists of a thin layer of topsoil 360 mm thick on top of a layer of very loose brown grey silty sand 1.3
m thick and following by firm grey clayey silt 8.7 m. Borehole drilling record ended in bedrock 10.4 m
below the ground surface. After 10.4 m borehole drilling, core drilling revealed bedrock with RQD of
65% at a depth that ranges from 10.5 to 12 m below the ground surface.
Topsoil is assumed to have same soil properties as silty sand since no specific data was given and the
thickness was only 360 mm which does not have significant effect on calculating shear strength. Layer of
silty sand and topsoil is calculated using Mohr-Coulomb failure criterion.
τ=c '+σ ' tan (ϕ )
Since the silty sand layer is very loose, the cohesive strength of the layer is assumed to be negligible and
the friction angle is taken as 30˚ from Table 1.12 in Geotechnical Design Textbook. (Das, 2011) The firm
clayey silt layer was completely submerged which indicates that the silt layer is in undrained condition.
Therefore, Field Vane Test (FVT) was directly used for determining undrained shear strength (c u),
because SPT did not provide adequate results.
2
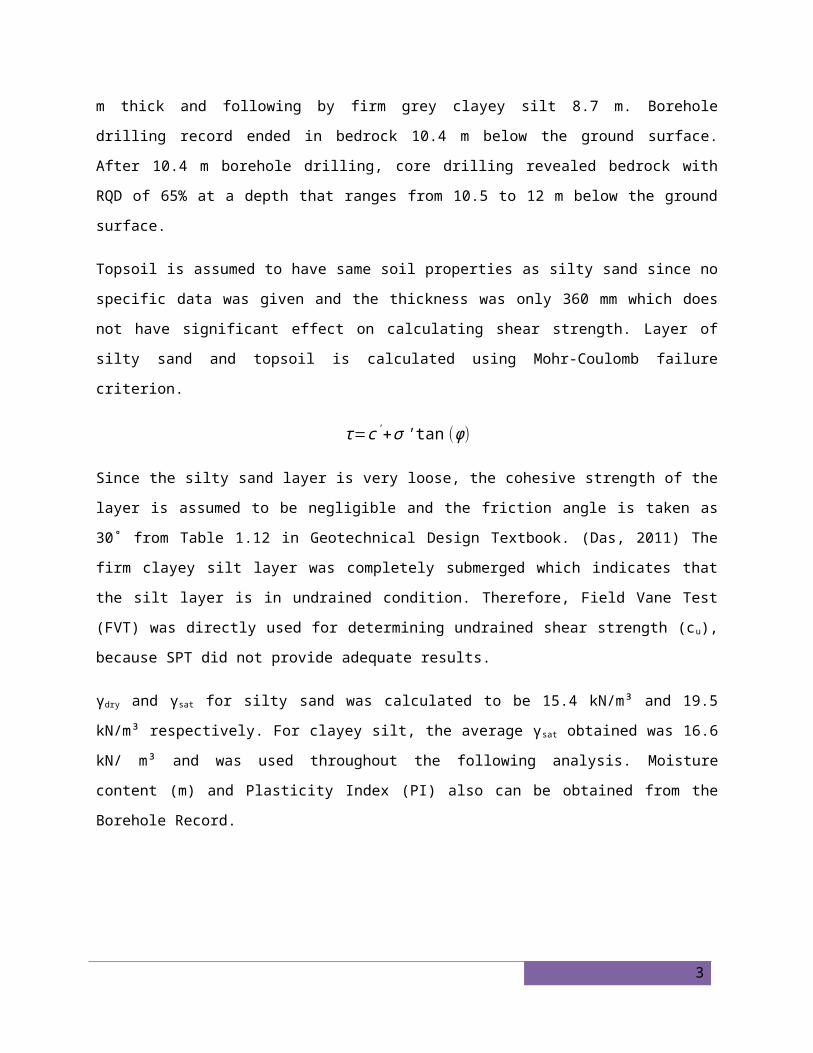
γdry and γsat for silty sand was calculated to be 15.4 kN/m³ and 19.5 kN/m³ respectively. For clayey silt, the
average γsat obtained was 16.6 kN/ m³ and was used throughout the following analysis. Moisture content
(m) and Plasticity Index (PI) also can be obtained from the Borehole Record.
0.00 5.00 10.00 15.00 20.00 25.00 30.00 35.00 40.000
2
4
6
8
10
12
Shear Strength (kPa)
Dept
h (m
)
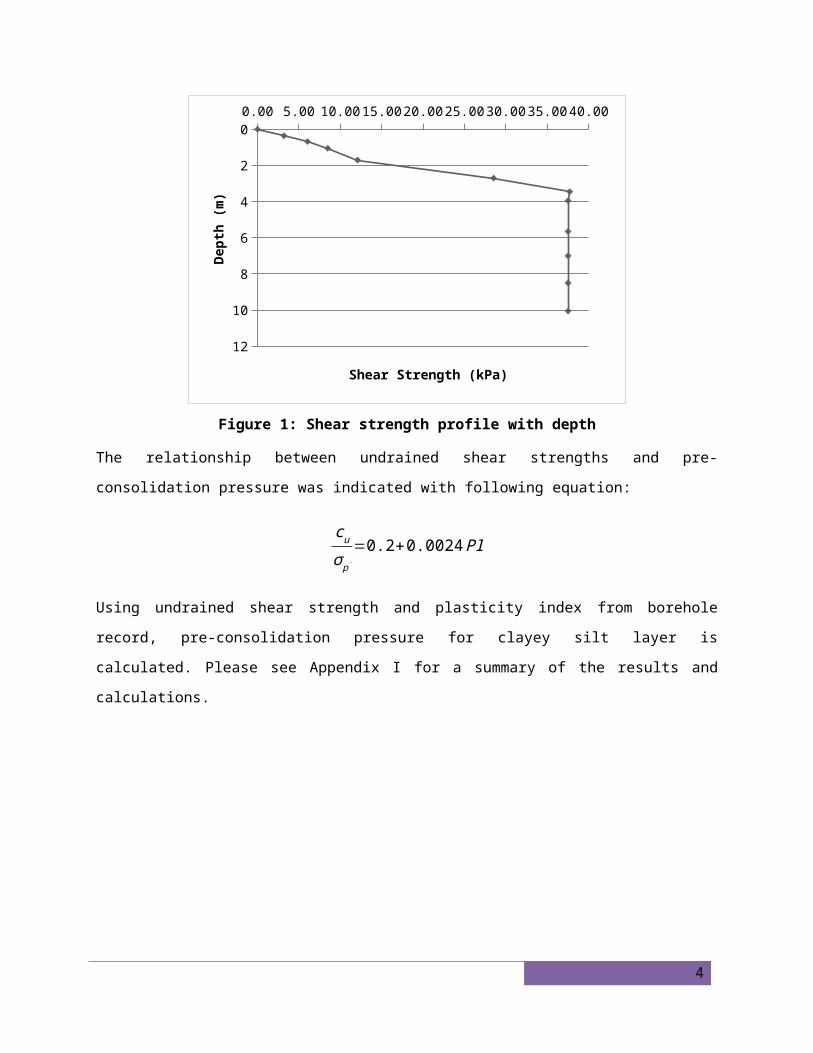
Figure 1: Shear strength profile with depth
The relationship between undrained shear strengths and pre-consolidation pressure was indicated with
following equation:
cu
σ p'
=0.2+0.0024 PI
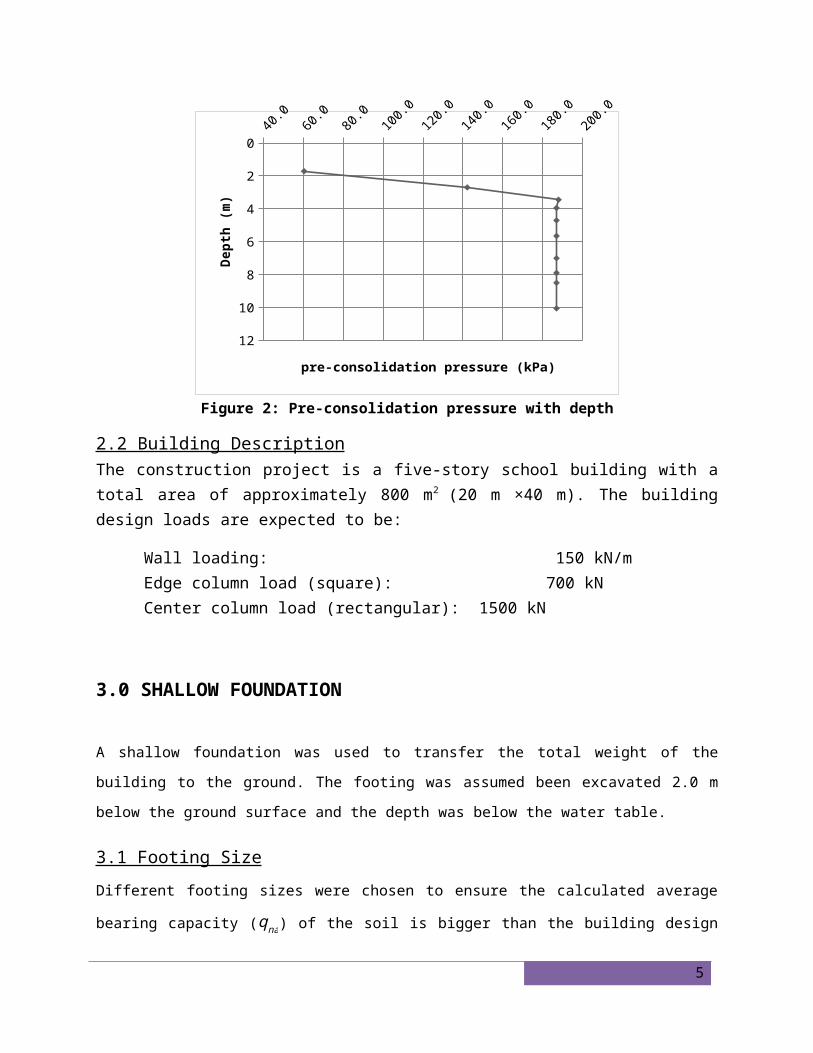
Using undrained shear strength and plasticity index from borehole record, pre-consolidation pressure for
clayey silt layer is calculated. Please see Appendix I for a summary of the results and calculations.
3
40.0 60.0 80.0 100.0 120.0 140.0 160.0 180.0 200.00
2
4
6
8
10
12
pre-consolidation pressure (kPa)
Dept
h (m
)
Figure 2: Pre-consolidation pressure with depth
2.2 Building DescriptionThe construction project is a five-story school building with a total area of approximately 800 m2
(20 m ×40 m). The building design loads are expected to be:
Wall loading: 150 kN/mEdge column load (square): 700 kNCenter column load (rectangular): 1500 kN
3.0 SHALLOW FOUNDATION
A shallow foundation was used to transfer the total weight of the building to the ground. The footing was
assumed been excavated 2.0 m below the ground surface and the depth was below the water table.
3.1 Footing Size
Different footing sizes were chosen to ensure the calculated average bearing capacity (qna) of the soil is
bigger than the building design loads. Three distinct types of footings were designed as shown in the table
1 below: 5.5m wide strip footing supporting a wall loading of 150kN/m, 4 m× 4 m square footings
supporting 700 kN edge column load and 5.5 m× 5.5 m rectangular (for the convenience of calculation we
used the same length and width here) supporting 1500 kN center column loading. The net allowable
bearing capacities of the 3 types of footings were calculated to be 250.30 Kn/m, 970.23 kN and 1661.80
4
kN. Since all the qna values are higher than the design loads given, the footings are able to support the
actual applied loadings.
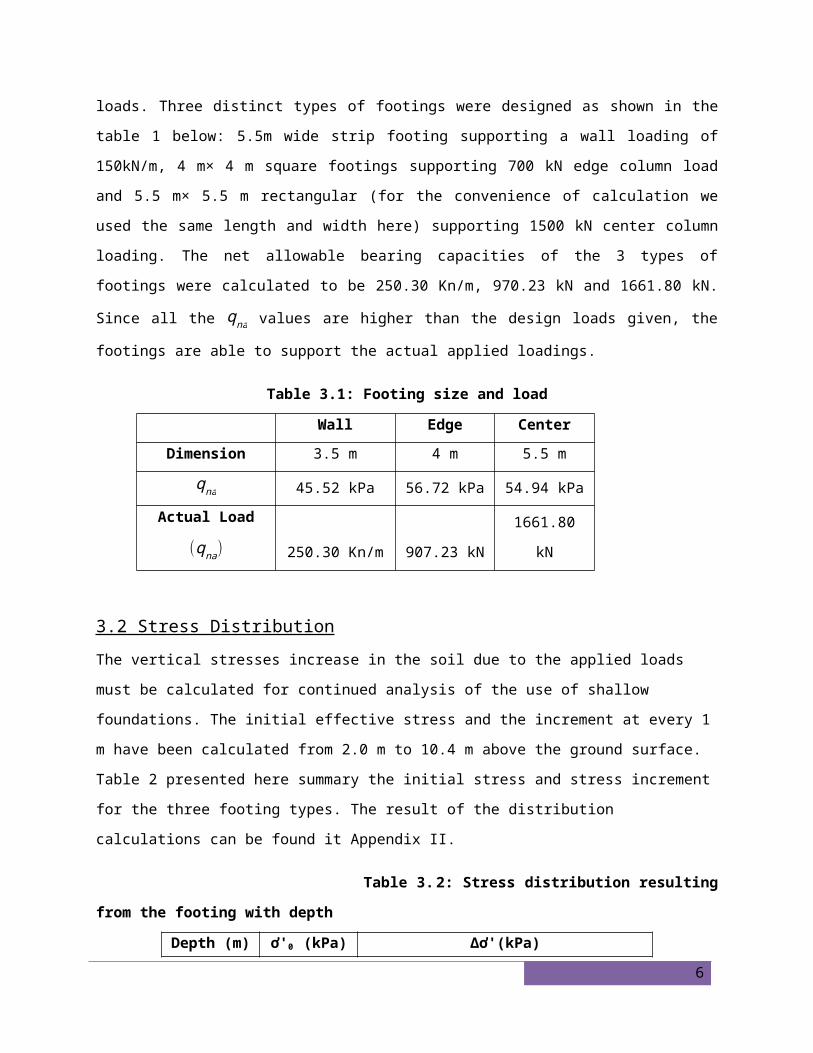
Table 3.1: Footing size and load
Wall Edge Center
Dimension 3.5 m 4 m 5.5 m
qna 45.52 kPa 56.72 kPa 54.94 kPa
Actual Load(qna) 250.30 Kn/m 907.23 kN 1661.80 kN
3.2 Stress DistributionThe vertical stresses increase in the soil due to the applied loads must be calculated for continued analysis
of the use of shallow foundations. The initial effective stress and the increment at every 1 m have been
calculated from 2.0 m to 10.4 m above the ground surface. Table 2 presented here summary the initial
stress and stress increment for the three footing types. The result of the distribution calculations can be
found it Appendix II.
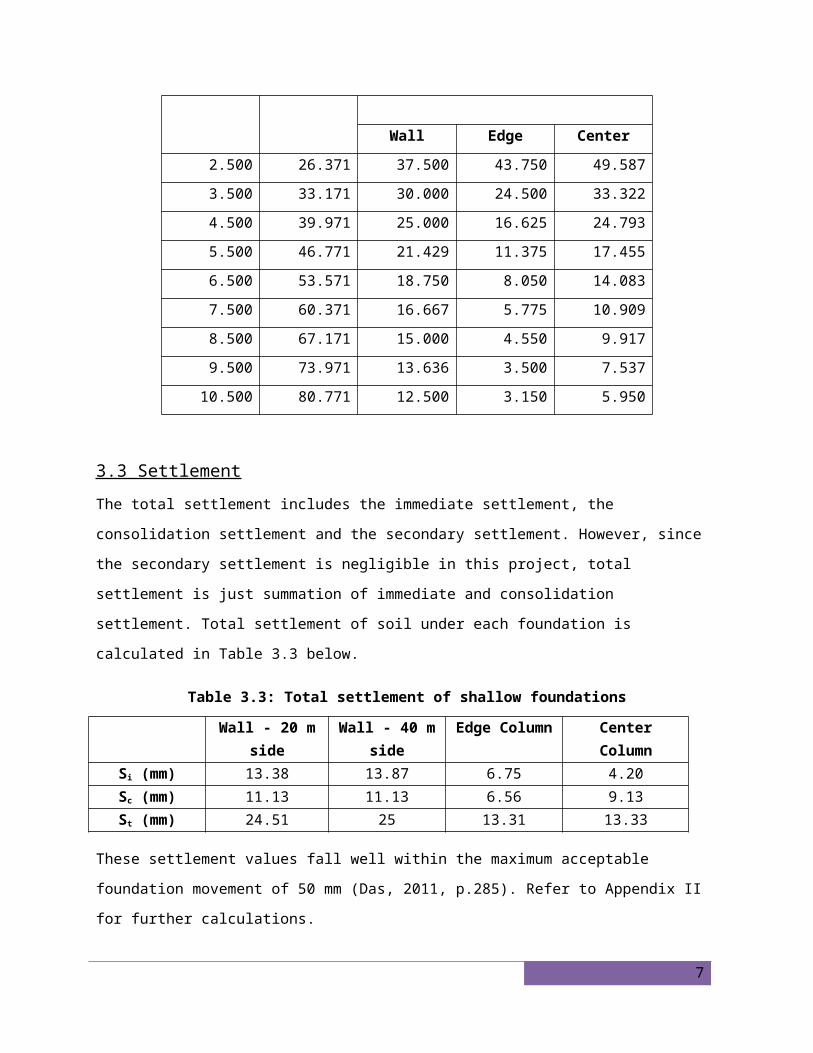
Table 3.2: Stress distribution resulting from the footing with depth
Depth (m) ơ'0 (kPa)
∆ơ'(kPa)
Wall Edge Center
2.500 26.371 37.500 43.750 49.587
3.500 33.171 30.000 24.500 33.322
4.500 39.971 25.000 16.625 24.793
5.500 46.771 21.429 11.375 17.455
6.500 53.571 18.750 8.050 14.083
7.500 60.371 16.667 5.775 10.909
8.500 67.171 15.000 4.550 9.917
9.500 73.971 13.636 3.500 7.537
10.500 80.771 12.500 3.150 5.950
3.3 SettlementThe total settlement includes the immediate settlement, the consolidation settlement and the secondary
settlement. However, since the secondary settlement is negligible in this project, total settlement is just
5
summation of immediate and consolidation settlement. Total settlement of soil under each foundation is
calculated in Table 3.3 below.
Table 3.3: Total settlement of shallow foundations
Wall - 20 m side Wall - 40 m side Edge Column Center ColumnSi (mm) 13.38 13.87 6.75 4.20Sc (mm) 11.13 11.13 6.56 9.13St (mm) 24.51 25 13.31 13.33
These settlement values fall well within the maximum acceptable foundation movement of 50 mm (Das,
2011, p.285). Refer to Appendix II for further calculations.
4.0 RECOMMENDATION
The proposed structure is located close to a 4-meter-deep slope with the horizontal slope of 20˚. As
shown in the figure below, the soil is assumed to be excavated. The safe distance from the top of the slope
is determined using computer software called Slide CAD. For simplification, the total load generated by
the building is assumed to be 300 kN/m2 and the factor of safety against failure is 1.5. It is recommended
to construct the structure with distance of 10.5 meters between the edge of the building and the top of the
slope since the calculated factor of safety is 1.581. If the building must be constructed closer than the
proposed limit, retaining structures have to be installed.
5.0 LIMITATIONS
The analysis contains several limitations which must be considered when implementing in real structural
practices. Firstly, although assumptions made during the analysis are reasonable with small variances, the
results may be significant.
6
APPENDIX
Appendix I Soil Properties
In determination of soil properties along the soil profile, several assumptions have been made.
Topsoil is assumed to have same soil properties as silty sand since no specific data was given and the
thickness was only 360 mm which does not have significant effect on calculating shear strength. The
equation of shear strength of silty sand layer:
τ=σ ' tan (30)
The bulk unit weight of silty sand has been calculated using equation:
γ=(Gs+Se )γw
(1+e )
Where void ratio, e is calculated using:
S∗e=Gs∗m
However, since the water table is in the middle of the sand layer, two γ values are calculated with
saturation to be 0 and 1. Specific of the silty sand (Gs) is assumed to be 2.65. Water content is taken from
the Borhole record.
7
For clayey silt layer, the specific gravity of the soil is assumed to be 2.75 and undrained shear strength is
taken directly from FVT results in Borhole record.
Table A.1.1: Calculation of Effective Stress
Depth(m)
γ (kN/m3) Normal stress(kN/m2)
Pore pressure(kN/m2)
Effective stress(kN/m2)
0 0 0 0 00.36 15.38 5.54 0.00 5.540.68 15.38 10.46 0.00 10.461.05 19.39 4.85 2.45 2.401.70 19.39 17.45 8.83 8.632.70 16.61 46.37 18.64 27.733.45 16.61 58.83 26.00 32.833.95 16.61 67.13 30.90 36.235.65 16.61 95.37 47.58 47.797.00 16.61 117.79 60.82 56.978.50 16.61 142.71 75.54 67.1710.05 16.61 168.45 90.74 77.71
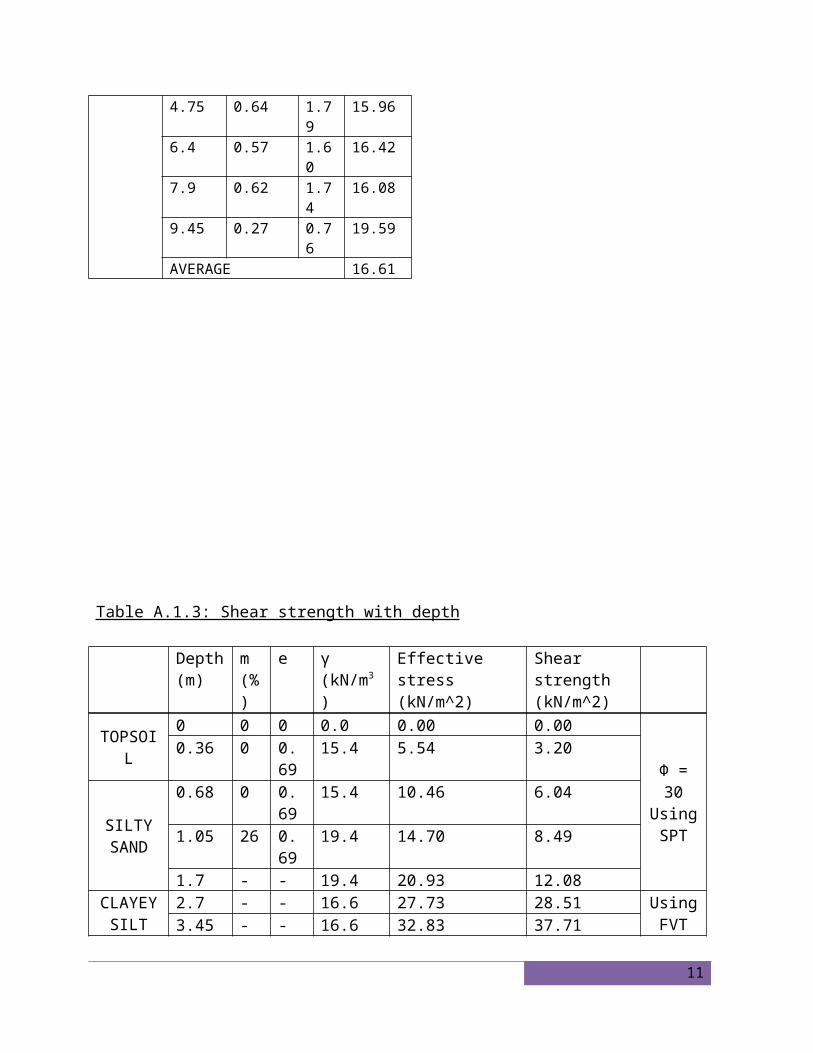
Table A.1.2: The bulk unit weight of the clayey silt layer
Depth(m)
m e γ (kN/m3)
CLAYEY SILT
1.95 0.63 1.76 16.022.7 0.68 1.90 15.723.45 0.56 1.57 16.504.75 0.64 1.79 15.966.4 0.57 1.60 16.427.9 0.62 1.74 16.089.45 0.27 0.76 19.59AVERAGE 16.61
8
Table A.1.3: Shear strength with depth
Depth(m)
m(%)
e γ (kN/m3)
Effective stress(kN/m^2)
Shear strength(kN/m^2)
TOPSOIL
0 0 0 0.0 0.00 0.00Φ = 30 Using SPT
0.36 0 0.69 15.4 5.54 3.20
SILTY SAND
0.68 0 0.69 15.4 10.46 6.041.05 26 0.69 19.4 14.70 8.491.7 - - 19.4 20.93 12.08
CLAYEY SILT
2.7 - - 16.6 27.73 28.51
Using FVT
3.45 - - 16.6 32.83 37.713.95 - - 16.6 36.23 37.505.65 - - 16.6 47.79 37.507 - - 16.6 56.97 37.508.5 - - 16.6 67.17 37.5010.05 - - 16.6 77.71 37.50
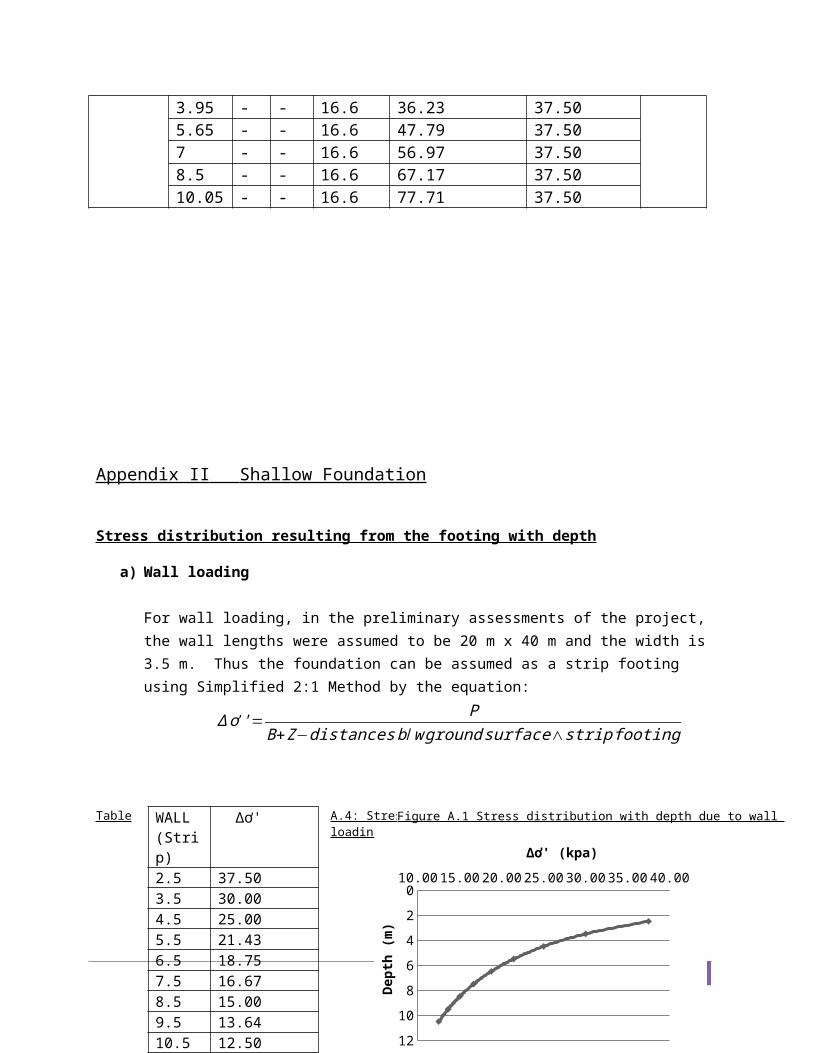
Appendix II Shallow Foundation
Stress distribution resulting from the footing with depth
a) Wall loading
For wall loading, in the preliminary assessments of the project, the wall lengths were assumed to be 20 m x 40 m and the width is 3.5 m. Thus the foundation can be assumed as a strip footing using Simplified 2:1 Method by the equation:
∆ ơ '= PB+Z−distancesb /w ground surface∧strip footing
9
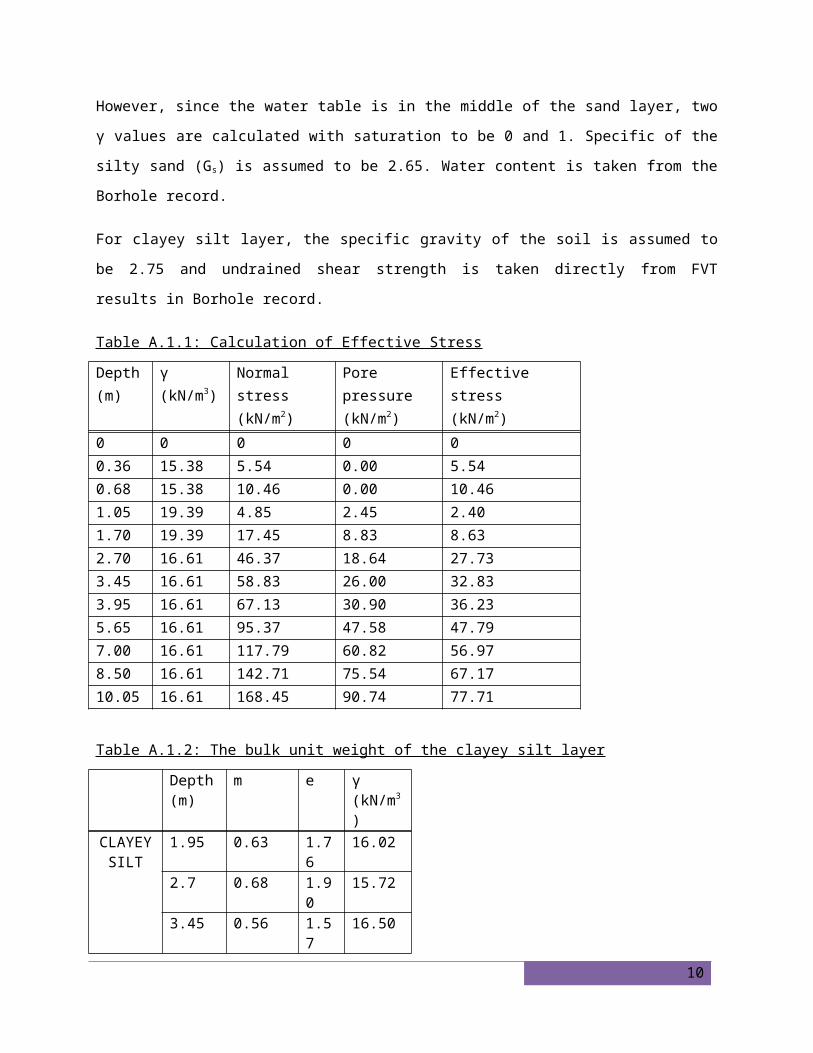
Table A.4: Stress distribution with depth due to wall loading
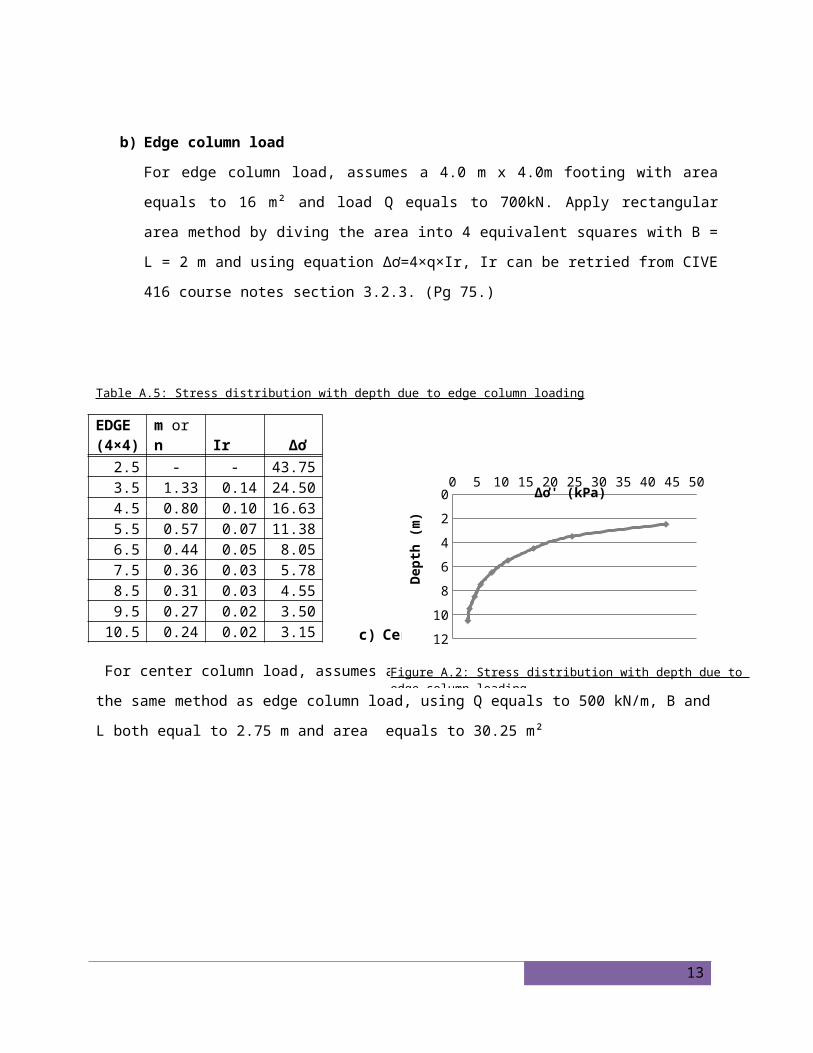
b) Edge column load
For edge column load, assumes a 4.0 m x 4.0m footing with area equals to 16 m² and load Q
equals to 700kN. Apply rectangular area method by diving the area into 4 equivalent squares with
B = L = 2 m and using equation ∆ơ=4×q×Ir, Ir can be retried from CIVE 416 course notes section
3.2.3. (Pg 75.)
Table A.5: Stress distribution with depth due to edge column loading
10
10.00 15.00 20.00 25.00 30.00 35.00 40.000
2
4
6
8
10
12
∆ơ' (kpa)
Dept
h (m
)
Figure A.1 Stress distribution with depth due to wall loading:
WALL (Strip)
∆ơ'
2.5 37.503.5 30.004.5 25.005.5 21.436.5 18.757.5 16.678.5 15.009.5 13.6410.5 12.50
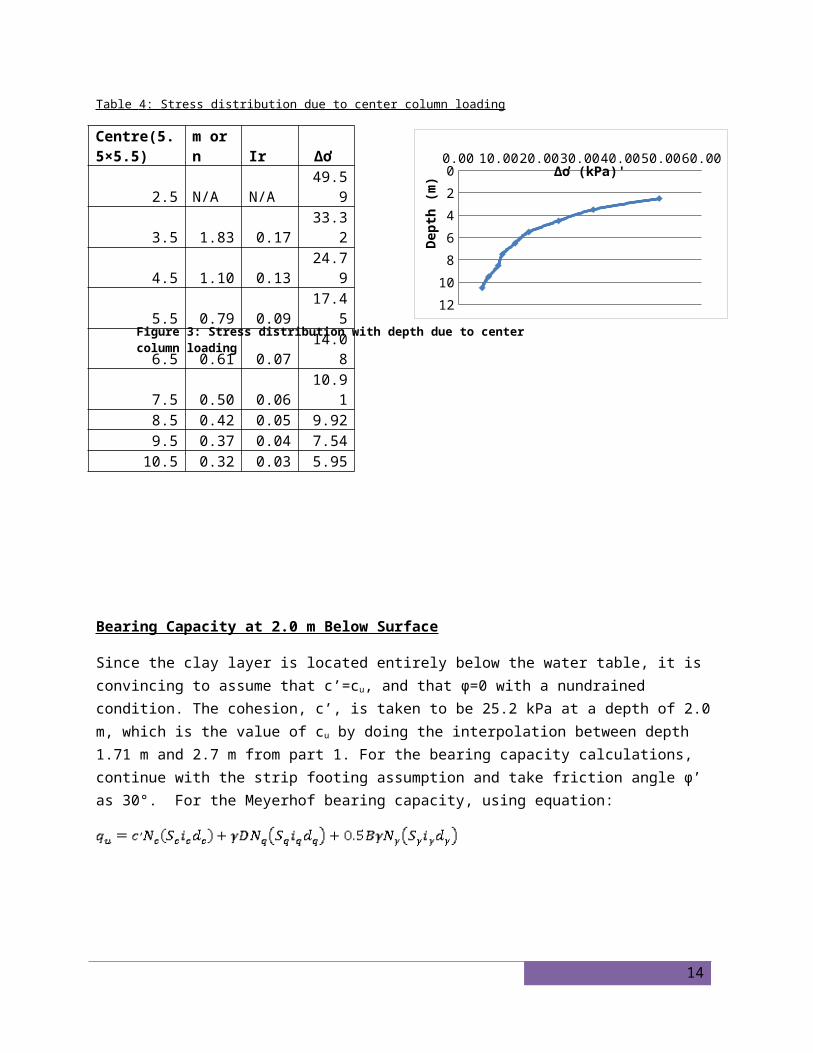
c) Center column load
For center column load, assumes a 5.5 m x 5.5 m footing and applies the same method as edge column
load, using Q equals to 500 kN/m, B and L both equal to 2.75 m and area equals to 30.25 m²
Table 4 : Stress distribution due to center column loading
11
0 5 10 15 20 25 30 35 40 45 500
2
4
6
8
10
12
∆ơ' (kPa)
Dept
h (m
)
Figure A.2: Stress distribution with depth due to edge column loading
0.00 10.00 20.00 30.00 40.00 50.00 60.000
2
4
6
8
10
12
∆ơ (kPa)'
Dept
h (m
)
Figure 3: Stress distribution with depth due to center column loading
EDGE (4×4) m or n Ir ∆ơ
2.5 - - 43.753.5 1.33 0.14 24.504.5 0.80 0.10 16.63
5.5 0.57 0.07 11.38 6.5 0.44 0.05 8.057.5 0.36 0.03 5.788.5 0.31 0.03 4.559.5 0.27 0.02 3.50
10.5 0.24 0.02 3.15
Centre(5.5×5.5) m or n Ir ∆ơ
2.5 N/A N/A 49.593.5 1.83 0.17 33.324.5 1.10 0.13 24.795.5 0.79 0.09 17.456.5 0.61 0.07 14.087.5 0.50 0.06 10.918.5 0.42 0.05 9.929.5 0.37 0.04 7.54
10.5 0.32 0.03 5.95
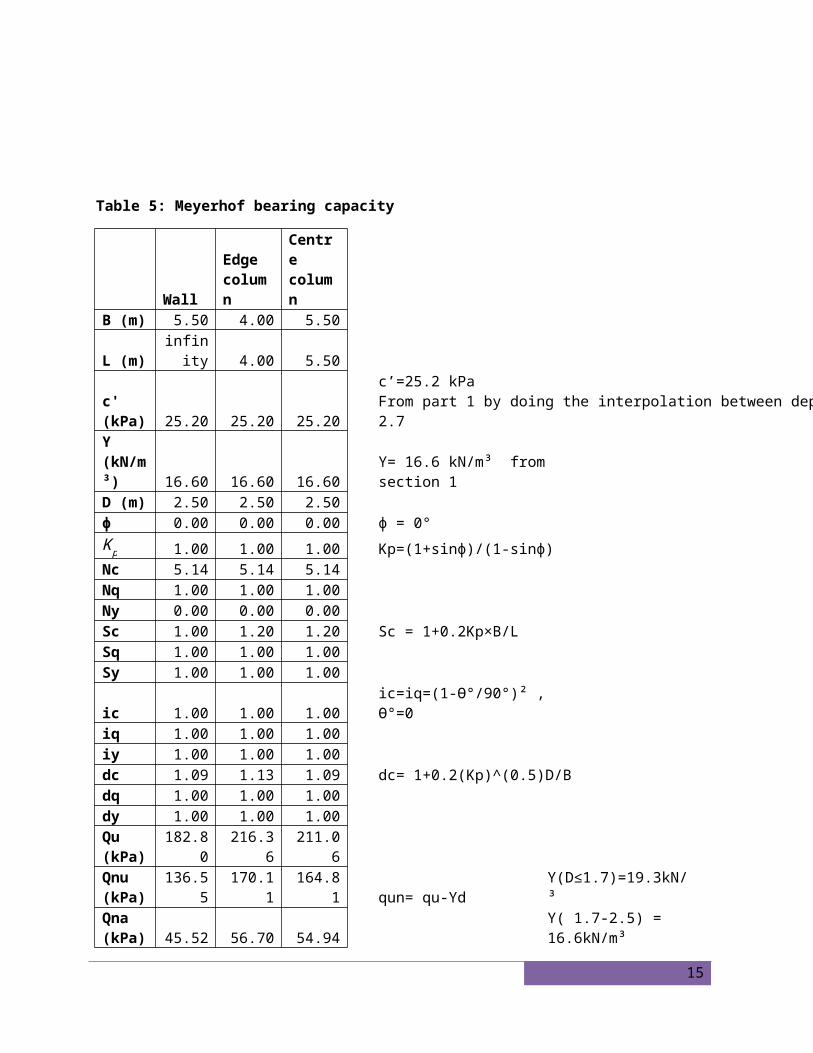
Bearing Capacity at 2.0 m Below Surface
Since the clay layer is located entirely below the water table, it is convincing to assume that c’=cu, and that φ=0 with a nundrained condition. The cohesion, c’, is taken to be 25.2 kPa at a depth of 2.0 m, which is the value of cu by doing the interpolation between depth 1.71 m and 2.7 m from part 1. For the bearing capacity calculations, continue with the strip footing assumption and take friction angle φ’ as 30°. For the Meyerhof bearing capacity, using equation:
Table 5: Meyerhof bearing capacity
WallEdge column
Centre column
B (m) 5.50 4.00 5.50
L (m) infinity 4.00 5.50c' (kPa) 25.20 25.20 25.20
c’=25.2 kPaFrom part 1 by doing the interpolation between depth 1.71 and 2.7
ϒ (kN/m³) 16.60 16.60 16.60 ϒ= 16.6 kN/m³ from section 1D (m) 2.50 2.50 2.50ф 0.00 0.00 0.00 ф = 0°K p 1.00 1.00 1.00 Kp=(1+sinф)/(1-sinф)Nc 5.14 5.14 5.14Nq 1.00 1.00 1.00Ny 0.00 0.00 0.00Sc 1.00 1.20 1.20 Sc = 1+0.2Kp×B/LSq 1.00 1.00 1.00Sy 1.00 1.00 1.00ic 1.00 1.00 1.00 ic=iq=(1-Ɵ°/90°)² , Ɵ°=0iq 1.00 1.00 1.00iy 1.00 1.00 1.00dc 1.09 1.13 1.09 dc= 1+0.2(Kp)^(0.5)D/Bdq 1.00 1.00 1.00dy 1.00 1.00 1.00Qu (kPa) 182.80 216.36 211.06Qnu 136.55 170.11 164.81 qun= qu-ϒd ϒ(D≤1.7)=19.3kN/³
12
(kPa)Qna (kPa) 45.52 56.70 54.94 ϒ( 1.7-2.5) = 16.6kN/m³Actual Load
250.33 kN/m
907.23 kN
1661.80 kN qna=qun/FS , FS=3.00
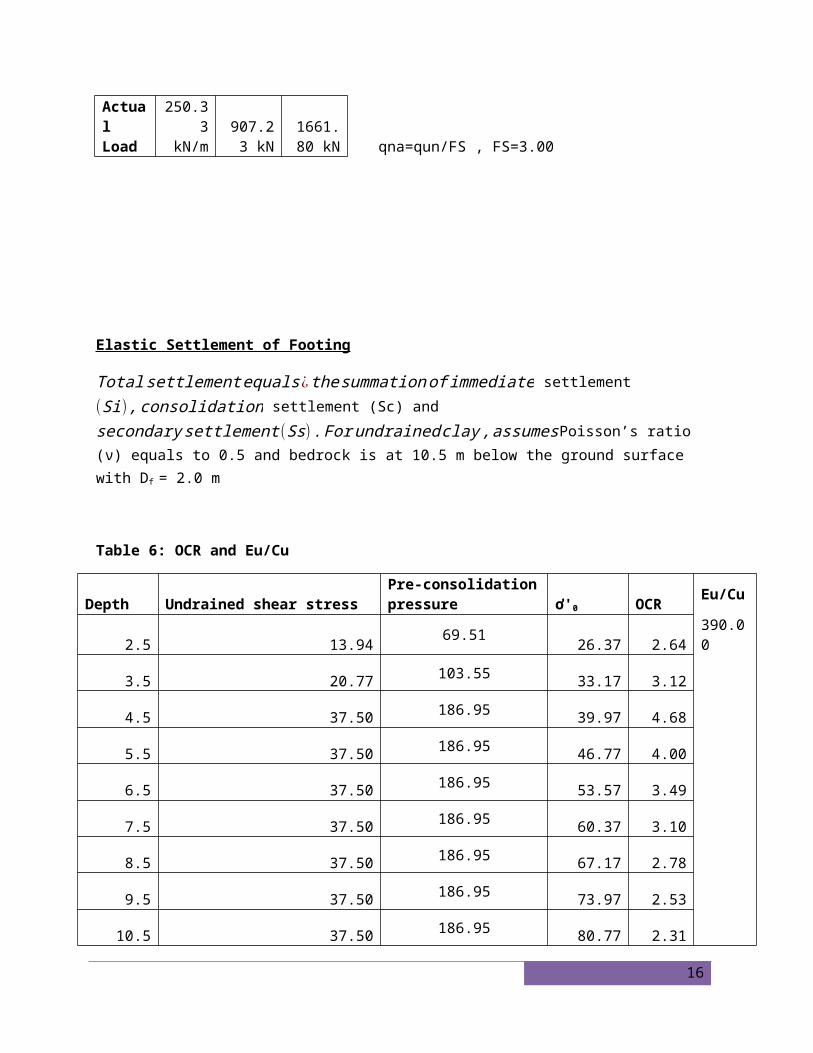
Elastic Settlement of Footing
Total settlement equals¿ the summationof immediate settlement (Si) , consolidation settlement (Sc) and secondary settlement (Ss) .For undrained clay ,assumesPoisson’s ratio (ν) equals to 0.5 and bedrock is at 10.5 m below the ground surface with Df = 2.0 m
Table 6: OCR and Eu/Cu
Depth Undrained shear stressPre-consolidation pressure ơ'0 OCR Eu/Cu
2.5 13.94 69.51 26.37 2.64 390.00
3.5 20.77 103.55 33.17 3.12
4.5 37.50 186.95 39.97 4.68
5.5 37.50 186.95 46.77 4.00
6.5 37.50 186.95 53.57 3.49
7.5 37.50 186.95 60.37 3.10
8.5 37.50 186.95 67.17 2.78
9.5 37.50 186.95 73.97 2.53
10.5 37.50 186.95 80.77 2.31
Avg OCR= 3.18Table7:Eu
13
Depth Cu EU
2.7 28.51 11119.13
3.45 37.71 14704.98
3.95 37.50 14625.00
5.65 37.50 14625.00
7 37.50 14625.00
8.5 37.50 14625.00
10.05 37.50 14625.00
Avg Eu = 14135.59
Table 8:Si
Wall
20 m sideWall
40 m Side Edge CenterL 20.00 40.00 4.00 5.50
B 3.50 3.50 4.00 5.50 q0=P/Aqo 42.86 42.86 43.75 23.14 4 m×4 m edge footing, loading = 700 kNα 4.00 4.00 4.00 4.00 5.5 m ×5.5 m center footing, load = 1500 kNβ' 2.75 2.75 2.00 2.50 wide B=3.5 m, wall loading = 150 kN/mv 0.50 0.50 0.50 0.50
Eu (kPa) 14135.59 14135.5914135.5
9 14135.59 m'=L/B, n'=H/(B/2) for center loadm' 5.71 11.43 1.00 1.00 Assume footing reaches bedrock at depth=12 m n' 5.43 5.43 4.75 3.45 H= 9.5F1 0.57 0.55 0.43 0.38 F1,F2 doing interpolations using Table 5.4F2 0.11 0.14 0.03 0.04 Is=F1+F2*(1-2v)/(1-v)IS 0.57 0.55 0.43 0.38
14
L/B 5.71 11.43 1.00 1.00 Df= 2.0 mDf/B 0.57 0.57 0.50 0.36 Table 5.5, Poisson's Ratio=0.5,using interpolationsIf 0.94 1.00 0.85 0.91 Si= q0 ×(αβ')×(1-v2)×Ic×If /ESi(mm) 13.38 13.87 6.75 4.20 Si (rigid) =0.93*Si (flexible center)Si(rigid) 12.44 12.90 6.27 3.91
Consolidation Settlement
For calculation of consolidation settlement of clayey silt layer under each foundation, the silt layer is
divided into three sub layers with thickness of 1m, 3m, and 4.5m. Since the layer is over-consolidated,
two equations can be applied:
Sc=C s H1+e0
log( σ '0+∆ σ '
σ '0
) if OCR>1∧σ 'p>σ '
0+∆ σ '
Sc=C s H1+e0
log( σ 'p
σ '0)C e H
1+e0log( σ '
0+∆ σ '
σ '0
) if OCR>1∧σ 'p<σ '
0+∆ σ '
Table ___ illustrates the calculation of consolidation settlement. Since pre-consolidation stress is greater
than the stress after construction, the swell index is calculated using expression by Nagaraj and Murty.
(Principles of Geotechnical Engineering 7th edition, Das)
C s=0.0463 (Liquid Limit100 )Gs=0.028
Table A.2.8: Consolidation Settlement
Wall 20 Edge CenterDepth (m) 3 6 10.5 3 6 10.5 3 6 10.5Soil Thickness (m) 1 3 4.5 1 3 4.5 1 3 4.5Average depth (m) 2.5 4.5 8.25 2.5 4.5 8.25 2.5 4.5 8.25σ'p (kPa) 121.3 187.0 187.0 121.3 187.0 187.0 121.3 187.0 187.0σ'0 (kPa) 36.57 50.17 80.77 36.57 50.17 80.77 36.57 50.17 80.77
15
OCR 3.32 3.73 2.31 3.32 3.73 2.31 3.32 3.73 2.31∆σ' (kPa) 33.75 20.09 12.5 34.13 9.71 3.15 41.45 15.77 5.95σ'0 + ∆σ' (kPa) 70.32 70.26 93.27 70.7 59.88 83.92 78.02 65.94 86.72σ'p > σ'0 + ∆σ' (kPa) Yes Yes Yes Yes Yes Yes Yes Yes YesSc (mm) 3.15 4.86 3.12 3.17 2.56 0.83 3.65 3.95 1.54Total Sc (mm) 11.13 6.56 9.13
Appendix III Slope Stability Slide CAD software is used to prevent instability of the slope close to the structure. The soil profile is
simplified into two layers with a silty sand layer and a clayey silt layer because the topsoil has similar
properties as sand. Since the slope is created due to excavation, the downside soil is composed of only
saturated silt layer.
Figure 3: Soil profile of the location of the structure
The factor of safety of the structure is 1.581 if it is constructed 10.5m away from the top of the slope.
16
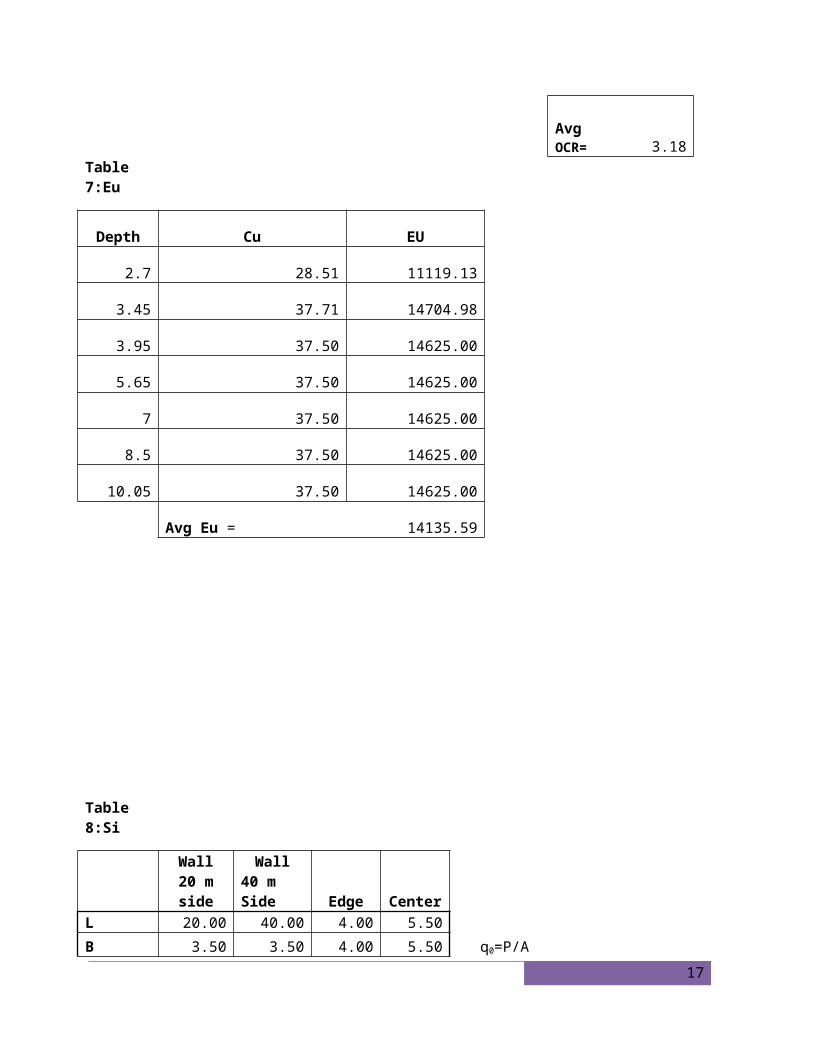
Figure 4: Slope Stability Analysis
17