cive.5370 experimental soil mechanics soil permeability...
TRANSCRIPT
Slide 1Revised 03/2014
CIVE.5370 EXPERIMENTAL SOIL MECHANICSSoil Permeability
FUNDAMENTALS OF CONSOLIDATION
CLAY
SAND
SAND
DEPTH
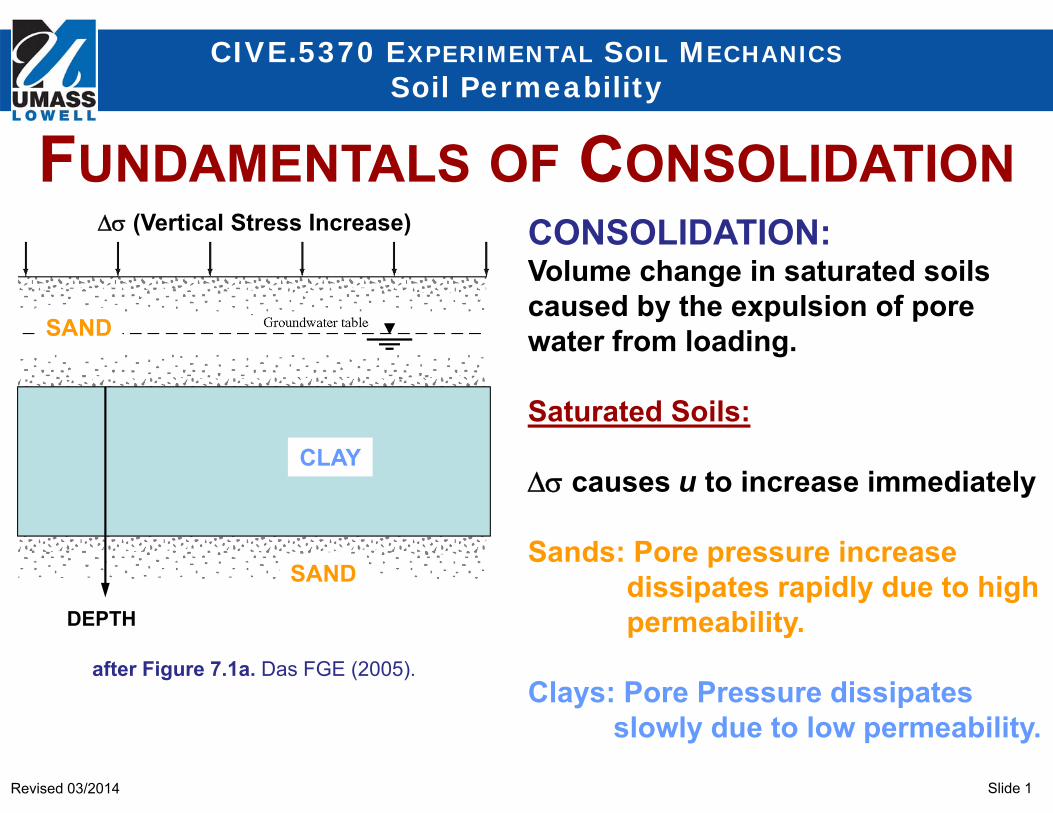
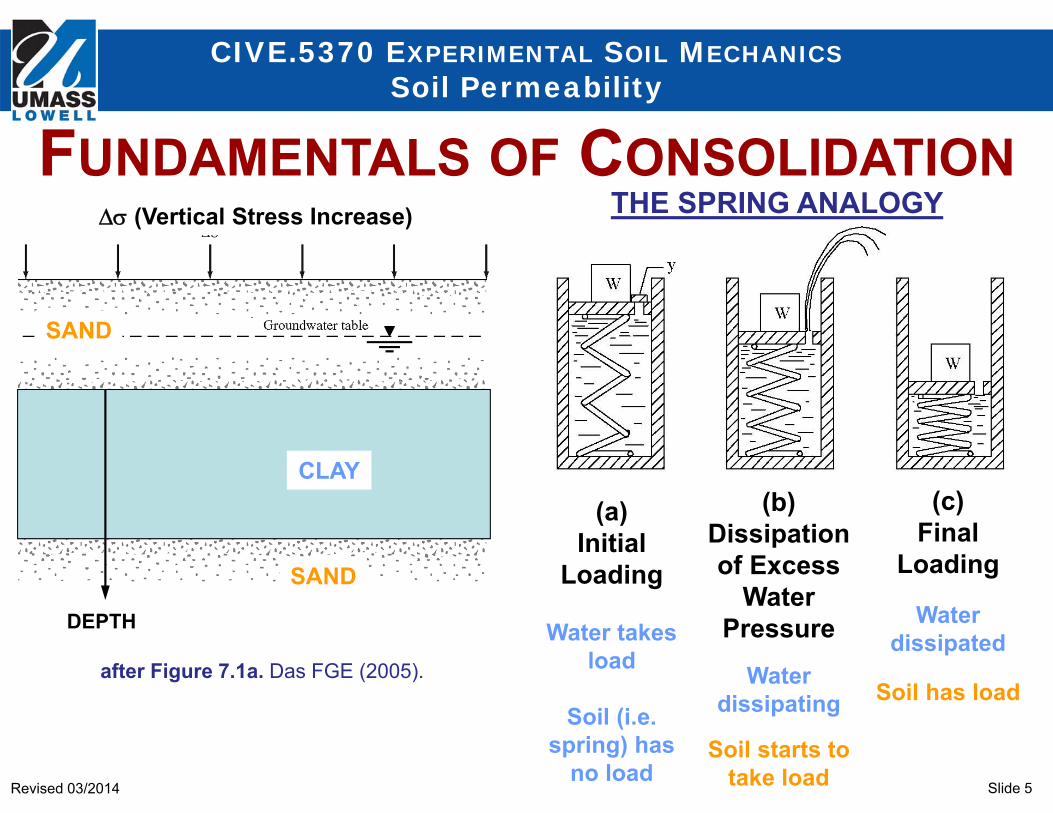
(Vertical Stress Increase) CONSOLIDATION:Volume change in saturated soils caused by the expulsion of pore water from loading.
Saturated Soils:
causes u to increase immediately
Sands: Pore pressure increase dissipates rapidly due to high permeability.
Clays: Pore Pressure dissipates slowly due to low permeability.
after Figure 7.1a. Das FGE (2005).
Slide 2Revised 03/2014
CIVE.5370 EXPERIMENTAL SOIL MECHANICSSoil Permeability
CLAY
SAND
SAND
DEPTH
(Vertical Stress Increase)
after Figure 7.1a. Das FGE (2005).
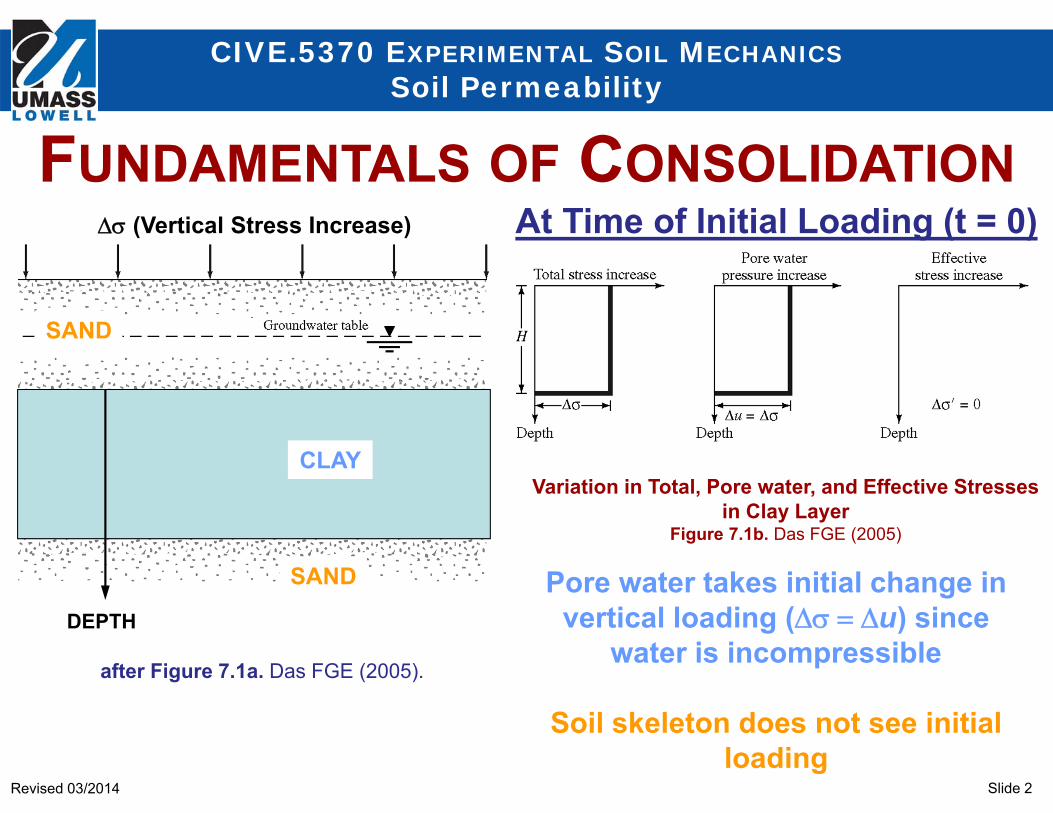
At Time of Initial Loading (t = 0)
Pore water takes initial change in vertical loading (u) since
water is incompressible
Soil skeleton does not see initial loading
Variation in Total, Pore water, and Effective Stresses in Clay Layer
Figure 7.1b. Das FGE (2005)
FUNDAMENTALS OF CONSOLIDATION
Slide 3Revised 03/2014
CIVE.5370 EXPERIMENTAL SOIL MECHANICSSoil Permeability
CLAY
SAND
SAND
DEPTH
(Vertical Stress Increase)
after Figure 7.1a. Das FGE (2005).
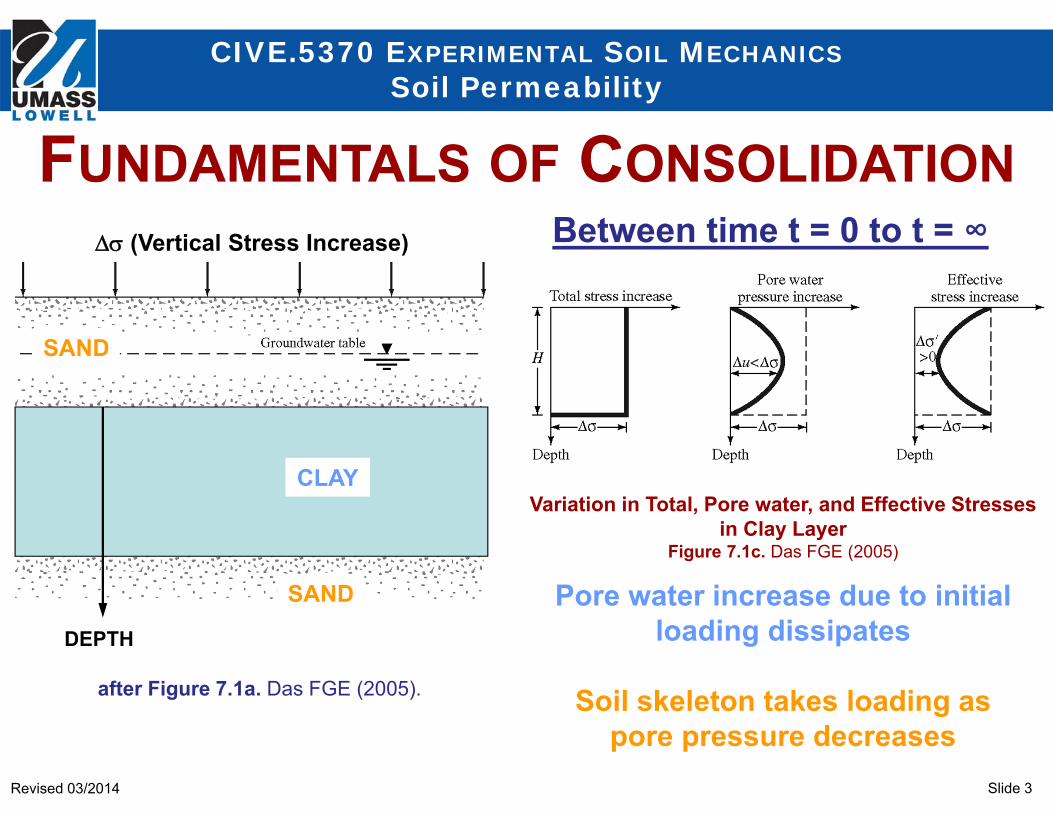
Between time t = 0 to t = ∞
Pore water increase due to initial loading dissipates
Soil skeleton takes loading as pore pressure decreases
Variation in Total, Pore water, and Effective Stresses in Clay Layer
Figure 7.1c. Das FGE (2005)
FUNDAMENTALS OF CONSOLIDATION
Slide 4Revised 03/2014
CIVE.5370 EXPERIMENTAL SOIL MECHANICSSoil Permeability
CLAY
SAND
SAND
DEPTH
(Vertical Stress Increase)
after Figure 7.1a. Das FGE (2005).
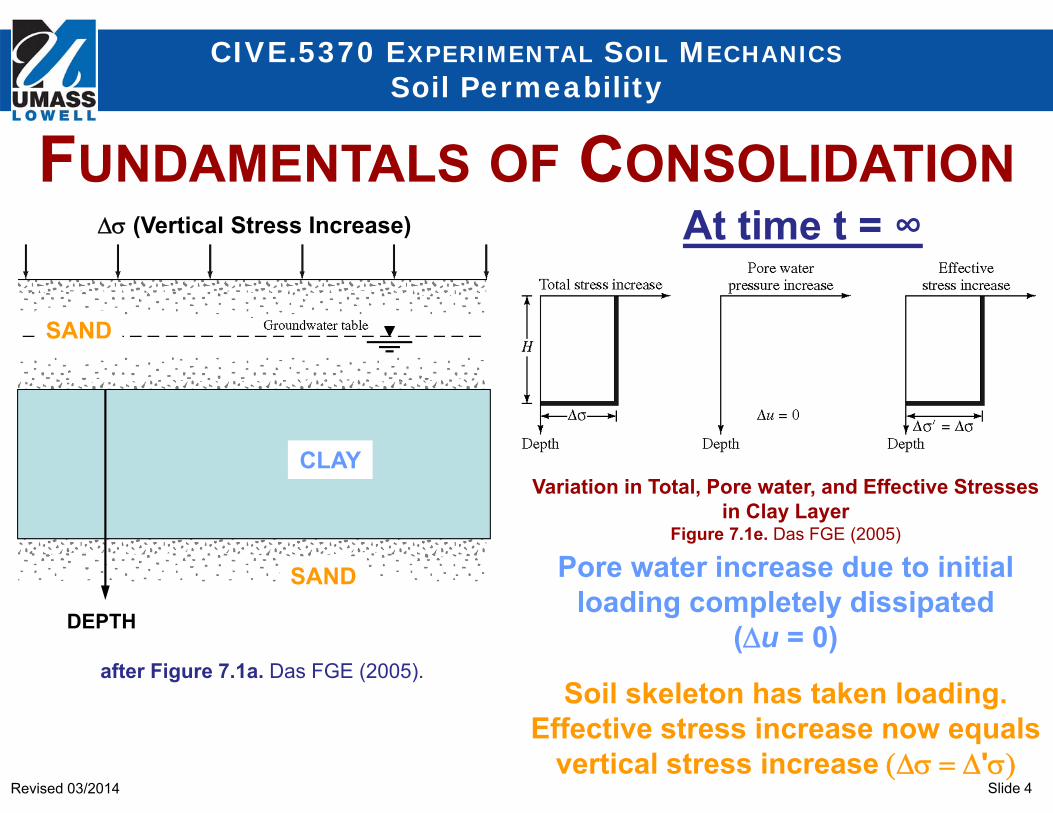
At time t = ∞
Pore water increase due to initial loading completely dissipated
(u = 0)
Soil skeleton has taken loading. Effective stress increase now equals
vertical stress increase '
Variation in Total, Pore water, and Effective Stresses in Clay Layer
Figure 7.1e. Das FGE (2005)
FUNDAMENTALS OF CONSOLIDATION
Slide 5Revised 03/2014
CIVE.5370 EXPERIMENTAL SOIL MECHANICSSoil Permeability
CLAY
SAND
SAND
DEPTH
(Vertical Stress Increase)
after Figure 7.1a. Das FGE (2005).
THE SPRING ANALOGY
(a)Initial
Loading
Water takes load
Soil (i.e. spring) has
no load
(b)Dissipationof Excess
Water Pressure
Water dissipating
Soil starts to take load
(c)Final
Loading
Water dissipated
Soil has load
FUNDAMENTALS OF CONSOLIDATION
Slide 6Revised 03/2014
CIVE.5370 EXPERIMENTAL SOIL MECHANICSSoil Permeability
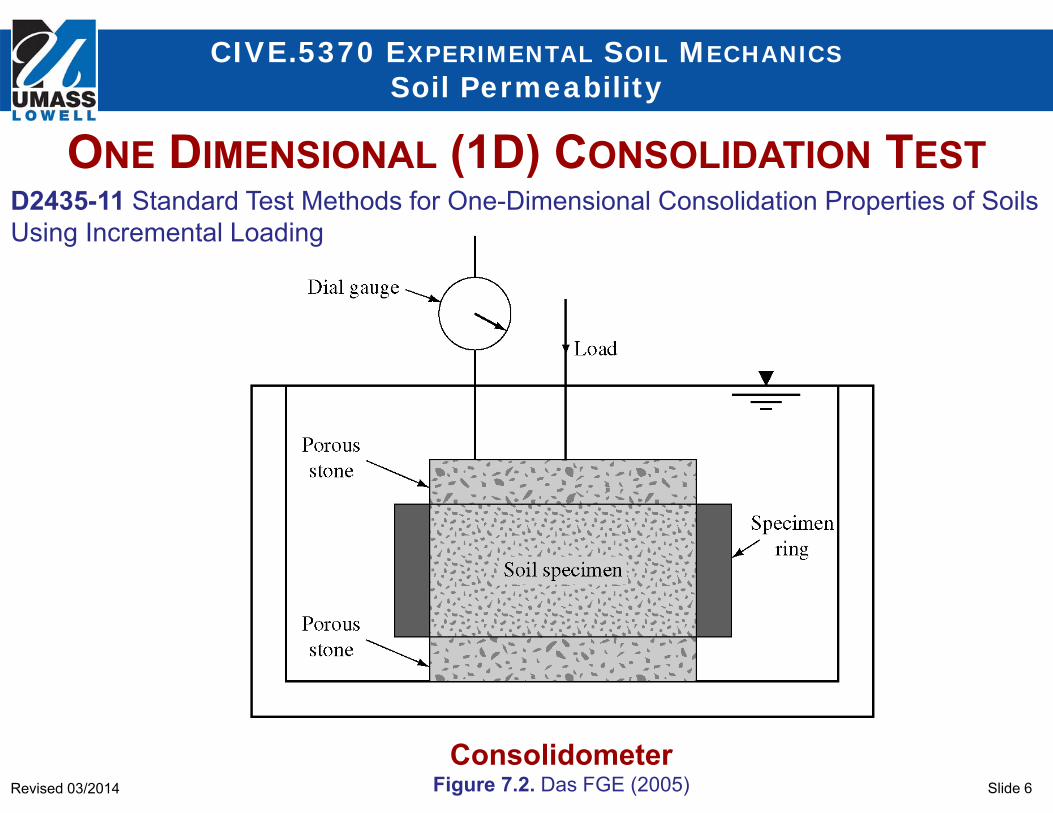
ConsolidometerFigure 7.2. Das FGE (2005)
D2435-11 Standard Test Methods for One-Dimensional Consolidation Properties of Soils Using Incremental Loading
ONE DIMENSIONAL (1D) CONSOLIDATION TEST
Slide 7Revised 03/2014
CIVE.5370 EXPERIMENTAL SOIL MECHANICSSoil Permeability
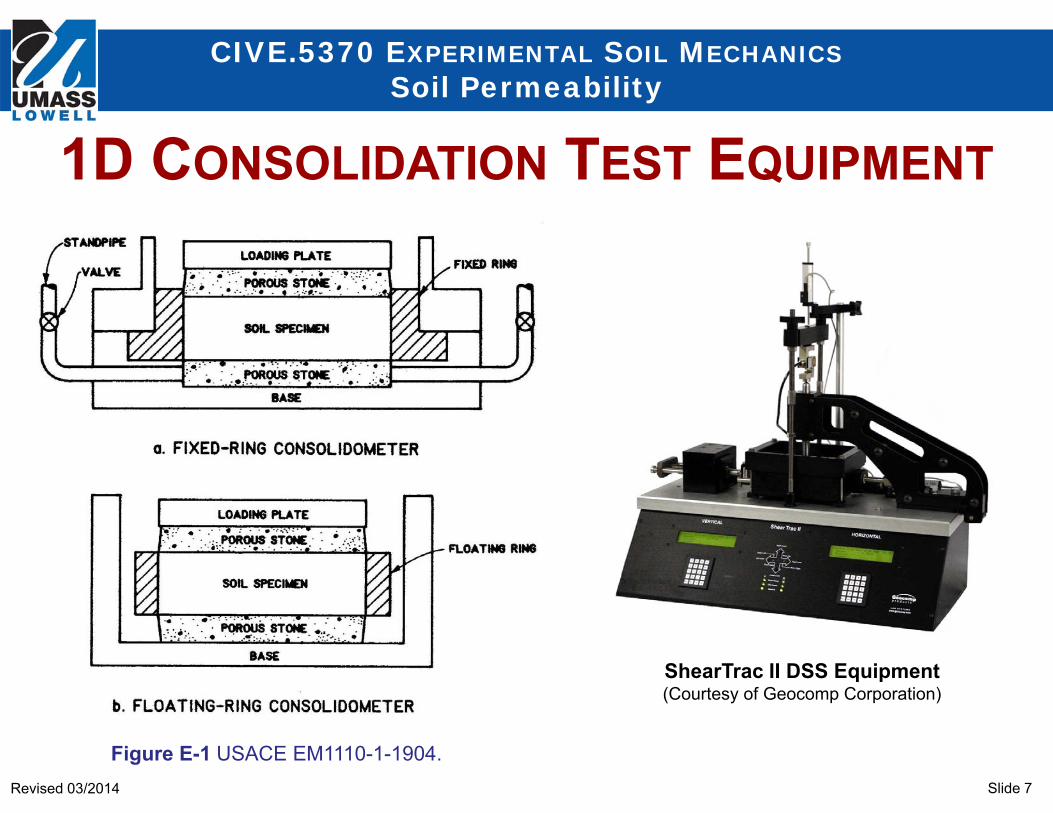
Figure E-1 USACE EM1110-1-1904.
ShearTrac II DSS Equipment(Courtesy of Geocomp Corporation)
1D CONSOLIDATION TEST EQUIPMENT
Slide 8Revised 03/2014
CIVE.5370 EXPERIMENTAL SOIL MECHANICSSoil Permeability
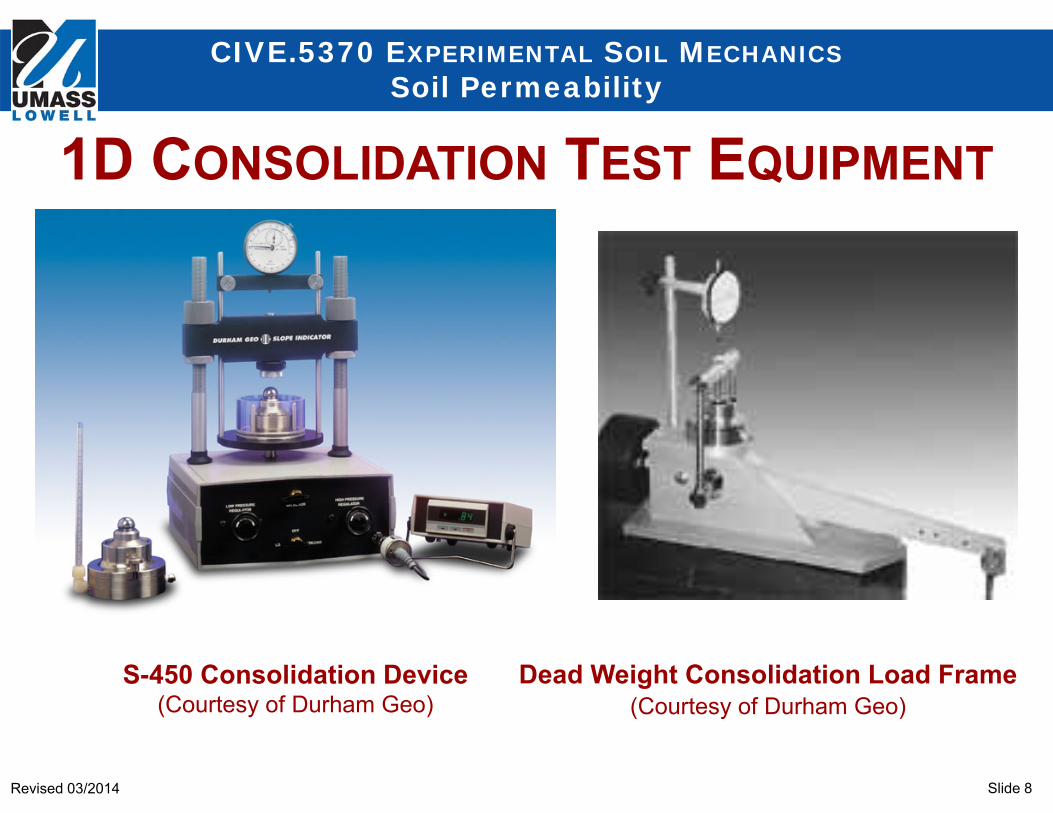
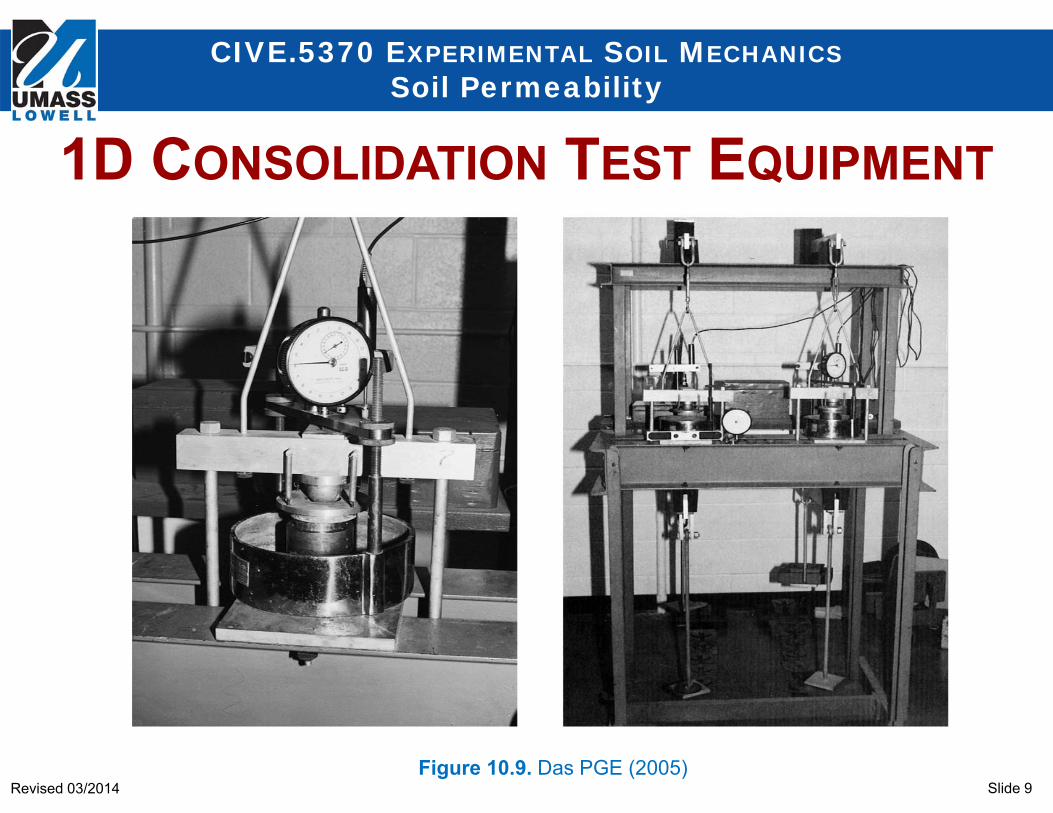
S-450 Consolidation Device(Courtesy of Durham Geo)
Dead Weight Consolidation Load Frame(Courtesy of Durham Geo)
1D CONSOLIDATION TEST EQUIPMENT
Slide 9Revised 03/2014
CIVE.5370 EXPERIMENTAL SOIL MECHANICSSoil Permeability
Figure 10.9. Das PGE (2005)
1D CONSOLIDATION TEST EQUIPMENT
Slide 10Revised 03/2014
CIVE.5370 EXPERIMENTAL SOIL MECHANICSSoil Permeability
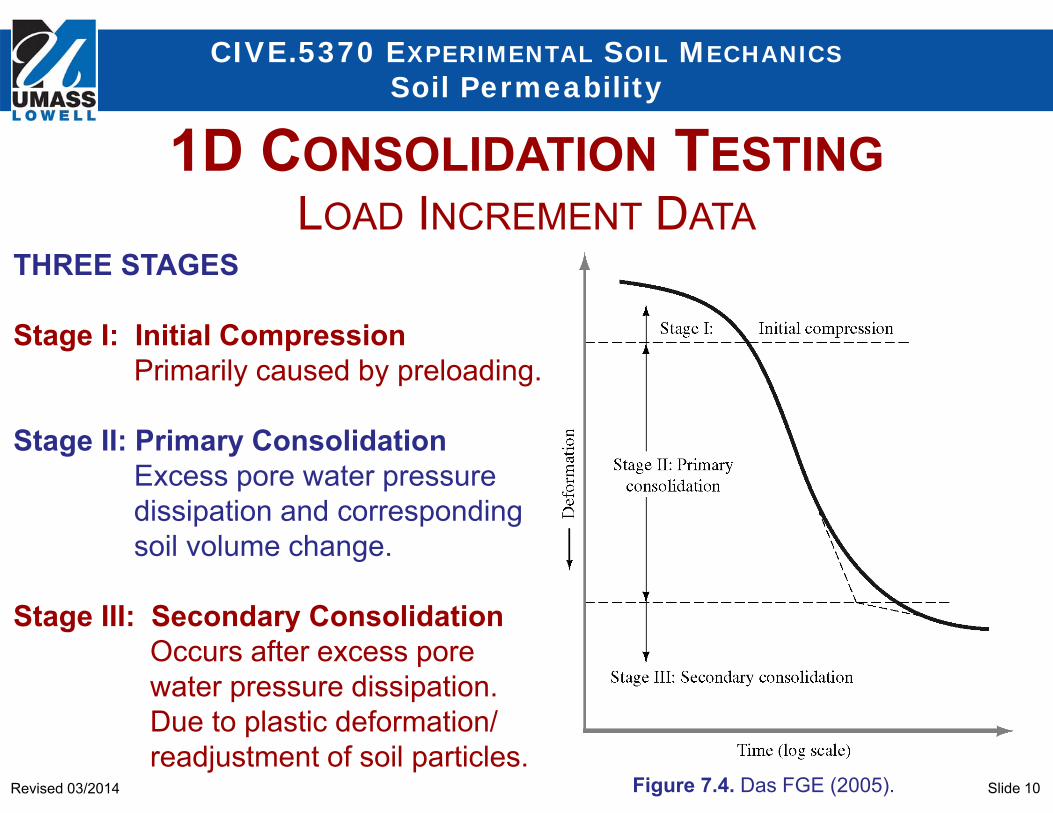
Figure 7.4. Das FGE (2005).
1D CONSOLIDATION TESTINGLOAD INCREMENT DATA
THREE STAGES
Stage I: Initial CompressionPrimarily caused by preloading.
Stage II: Primary ConsolidationExcess pore water pressuredissipation and correspondingsoil volume change.
Stage III: Secondary ConsolidationOccurs after excess porewater pressure dissipation.Due to plastic deformation/readjustment of soil particles.
Slide 11Revised 03/2014
CIVE.5370 EXPERIMENTAL SOIL MECHANICSSoil Permeability
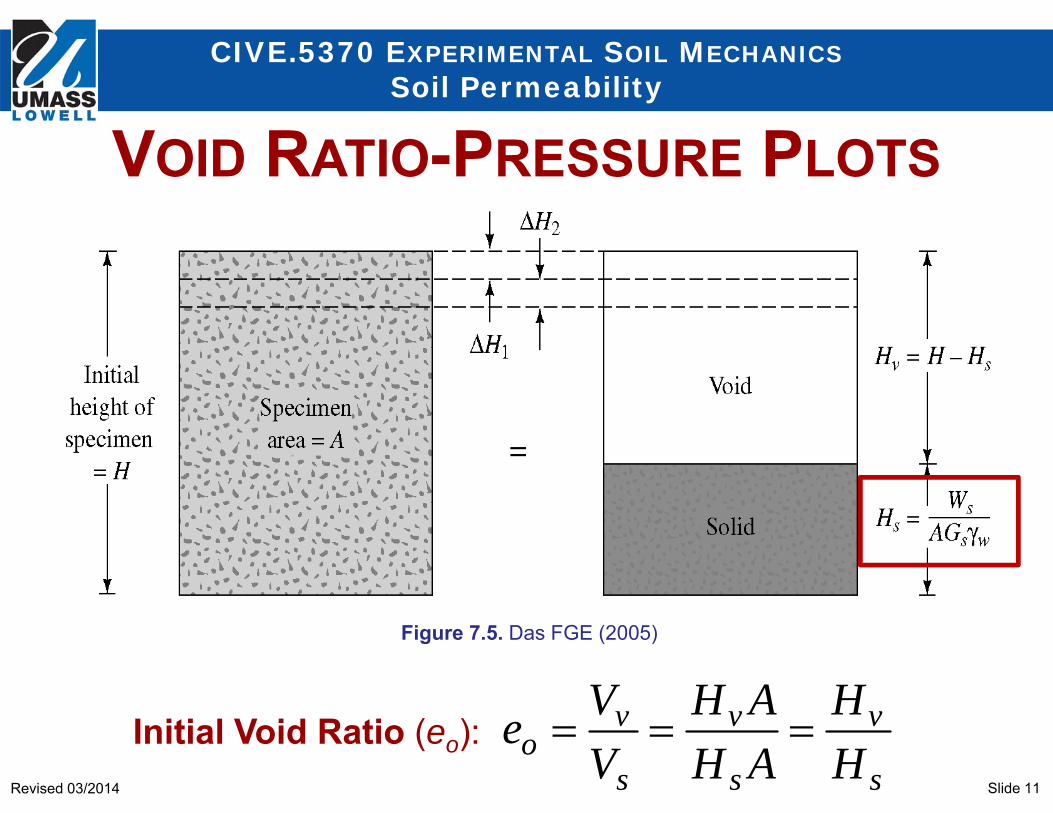
VOID RATIO-PRESSURE PLOTS
Figure 7.5. Das FGE (2005)
s
v
s
v
s
vo H
HAHAH
VVe Initial Void Ratio (eo):
Slide 12Revised 03/2014
CIVE.5370 EXPERIMENTAL SOIL MECHANICSSoil Permeability
sHHe 1
1
11
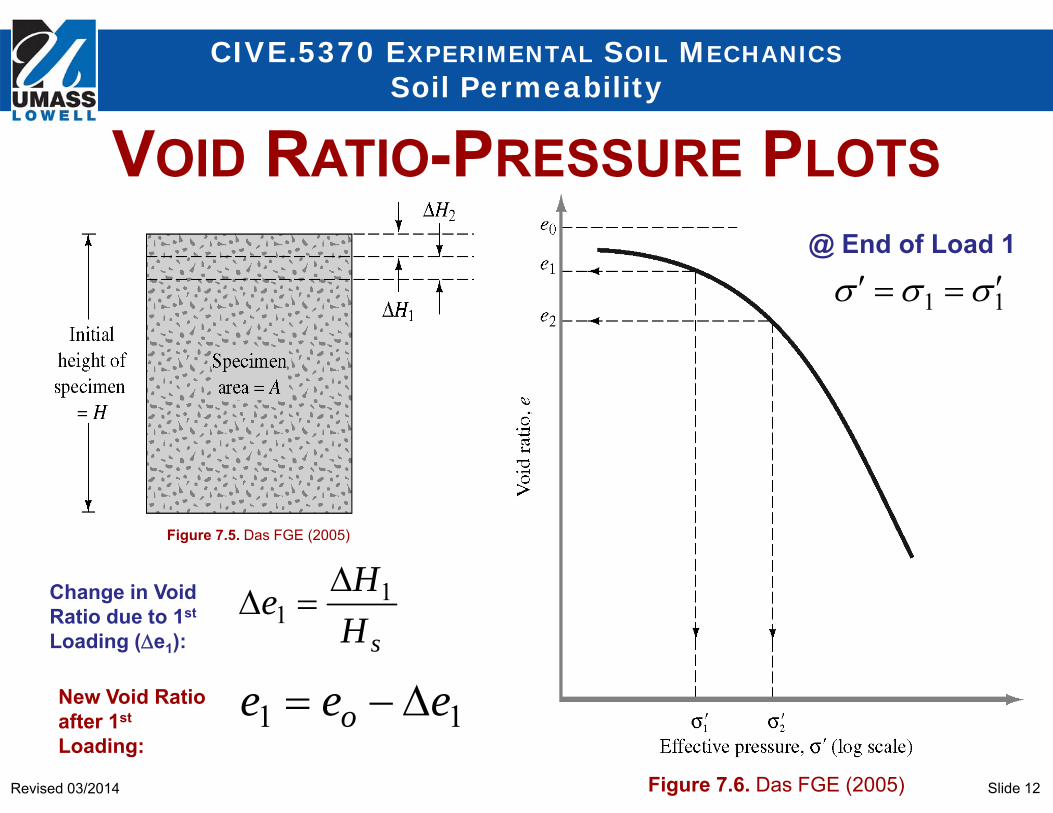
Figure 7.6. Das FGE (2005)
Figure 7.5. Das FGE (2005)
Change in Void Ratio due to 1st
Loading (e1):
New Void Ratio after 1st
Loading:11 eee o
@ End of Load 1
VOID RATIO-PRESSURE PLOTS
Slide 13Revised 03/2014
CIVE.5370 EXPERIMENTAL SOIL MECHANICSSoil Permeability
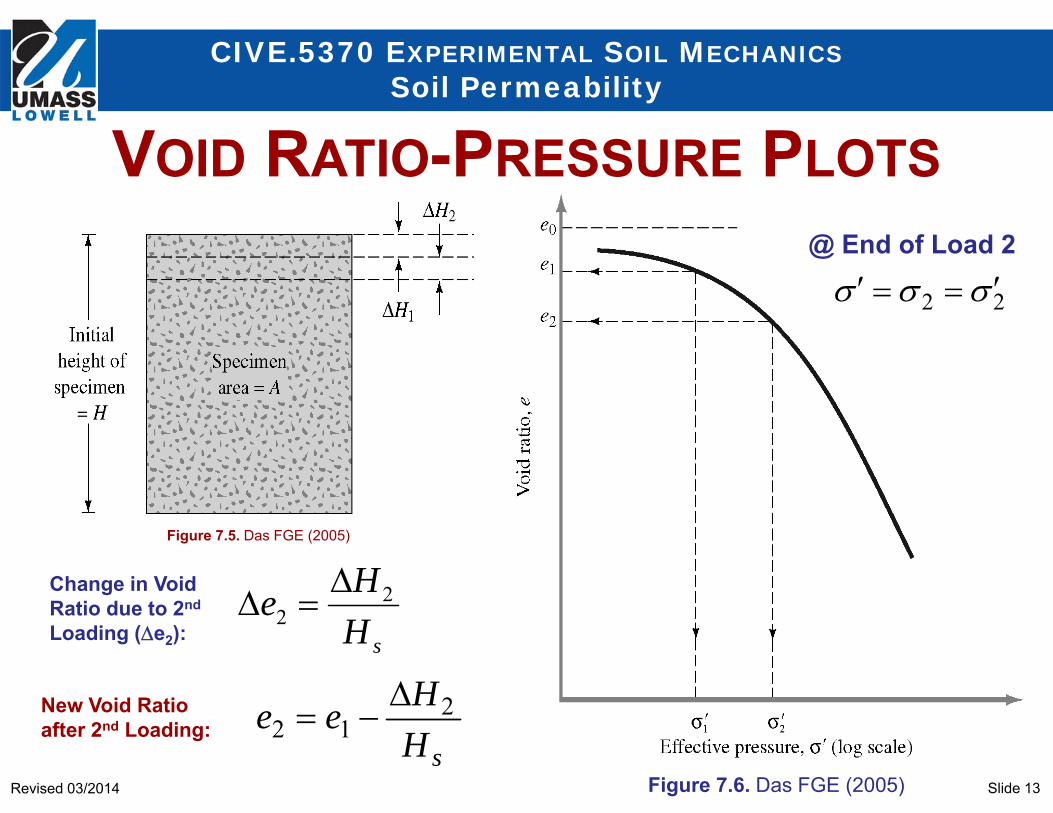
sHHe 2
2
22
Figure 7.6. Das FGE (2005)
Figure 7.5. Das FGE (2005)
Change in Void Ratio due to 2nd
Loading (e2):
New Void Ratio after 2nd Loading:
sHHee 2
12
@ End of Load 2
VOID RATIO-PRESSURE PLOTS
Slide 14Revised 03/2014
CIVE.5370 EXPERIMENTAL SOIL MECHANICSSoil Permeability
Figure 7.7. Das FGE (2005).
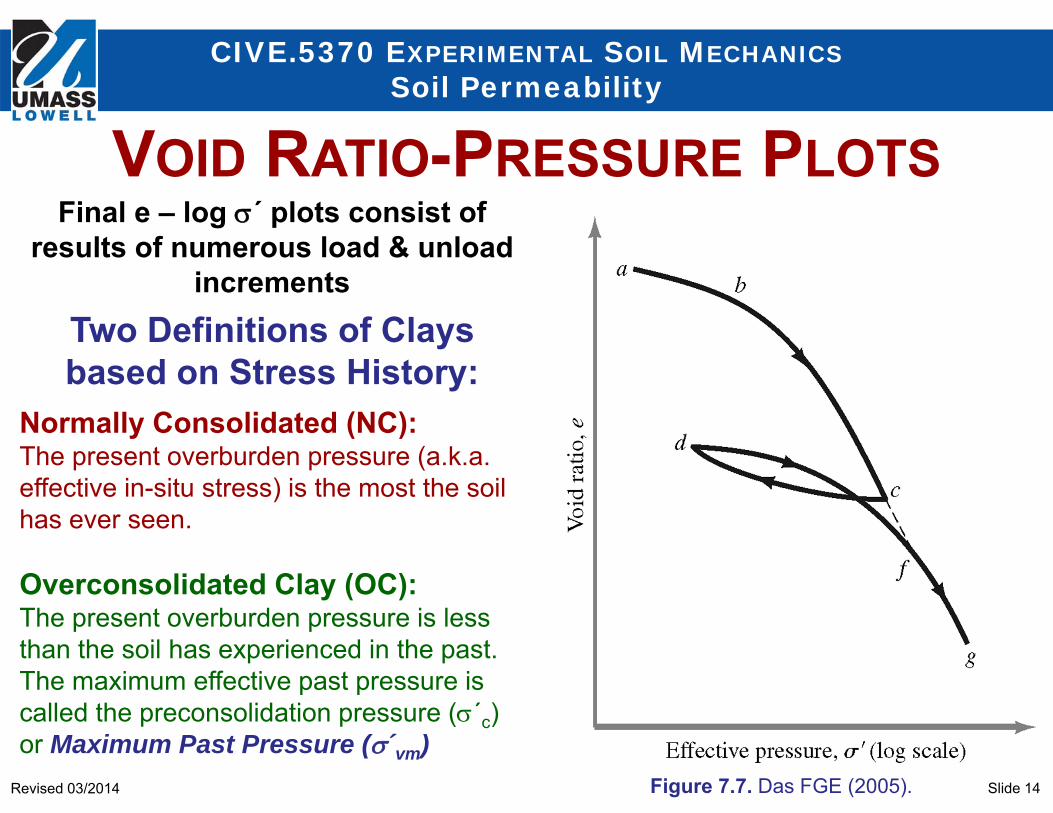
Final e – log ´ plots consist of results of numerous load & unload
incrementsTwo Definitions of Clays based on Stress History:
Normally Consolidated (NC):The present overburden pressure (a.k.a. effective in-situ stress) is the most the soil has ever seen.
Overconsolidated Clay (OC):The present overburden pressure is less than the soil has experienced in the past. The maximum effective past pressure is called the preconsolidation pressure (´c) or Maximum Past Pressure (´vm)
VOID RATIO-PRESSURE PLOTS
Slide 15Revised 03/2014
CIVE.5370 EXPERIMENTAL SOIL MECHANICSSoil Permeability
DETERMINATION OF MAXIMUM PAST PRESSURE(´c or ´vm)
Figure 7.8. Das FGE (2005).
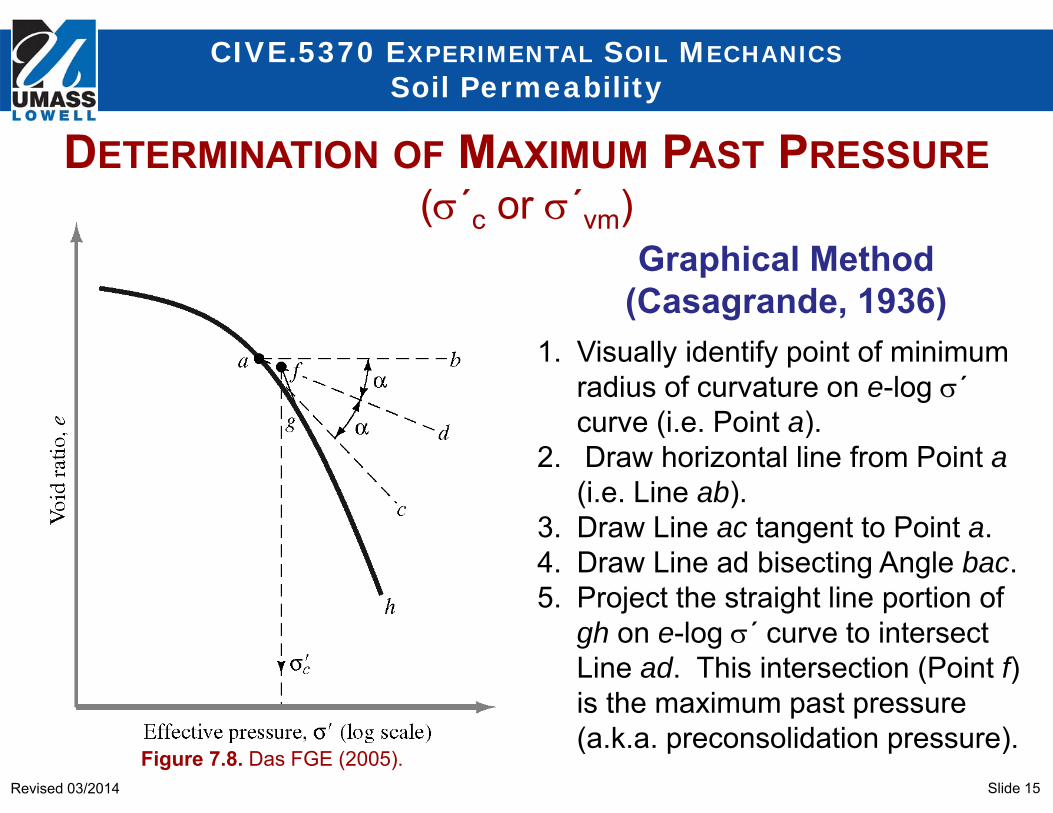
Graphical Method(Casagrande, 1936)
1. Visually identify point of minimum radius of curvature on e-log ´curve (i.e. Point a).
2. Draw horizontal line from Point a(i.e. Line ab).
3. Draw Line ac tangent to Point a.4. Draw Line ad bisecting Angle bac.5. Project the straight line portion of
gh on e-log ´ curve to intersect Line ad. This intersection (Point f) is the maximum past pressure (a.k.a. preconsolidation pressure).
Slide 16Revised 03/2014
CIVE.5370 EXPERIMENTAL SOIL MECHANICSSoil Permeability
OVERCONSOLIDATION RATIO (OCR)
Figure 7.8. Das FGE (2005).
(´c or ´vm)
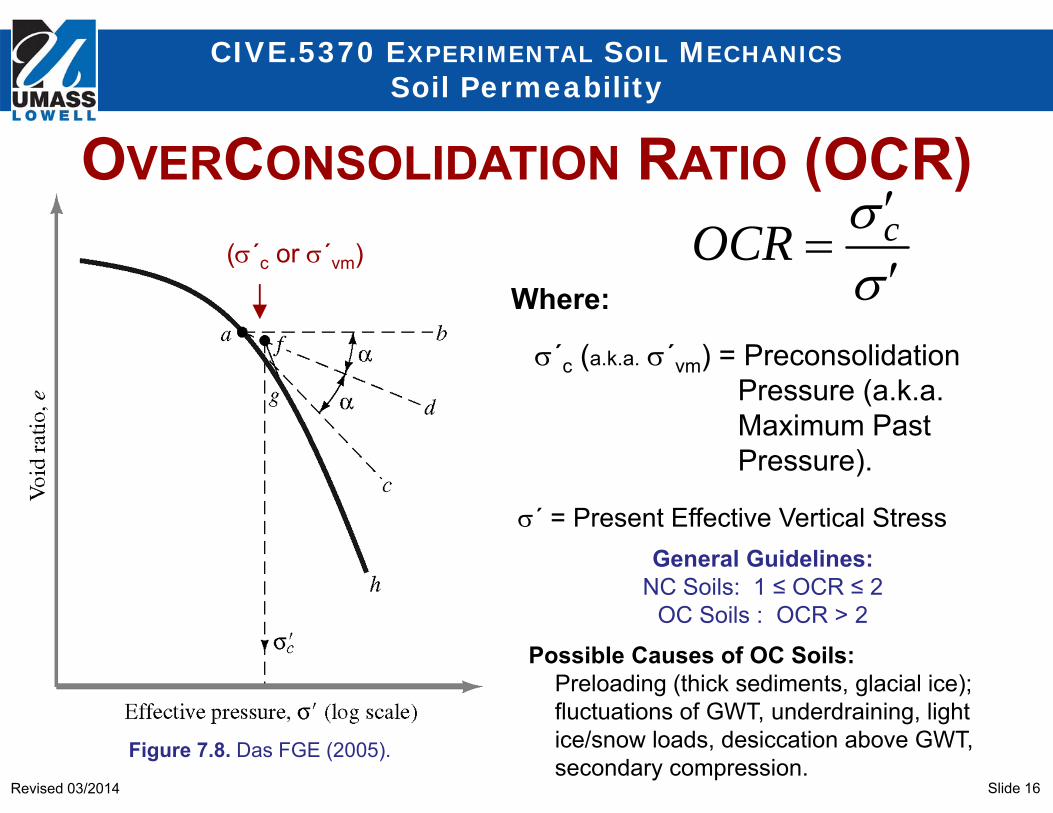
cOCRWhere:
´c (a.k.a. ´vm) = PreconsolidationPressure (a.k.a.Maximum Past Pressure).
´ = Present Effective Vertical StressGeneral Guidelines:
NC Soils: 1 ≤ OCR ≤ 2OC Soils : OCR > 2
Possible Causes of OC Soils:Preloading (thick sediments, glacial ice); fluctuations of GWT, underdraining, lightice/snow loads, desiccation above GWT,secondary compression.
Slide 17Revised 03/2014
CIVE.5370 EXPERIMENTAL SOIL MECHANICSSoil Permeability
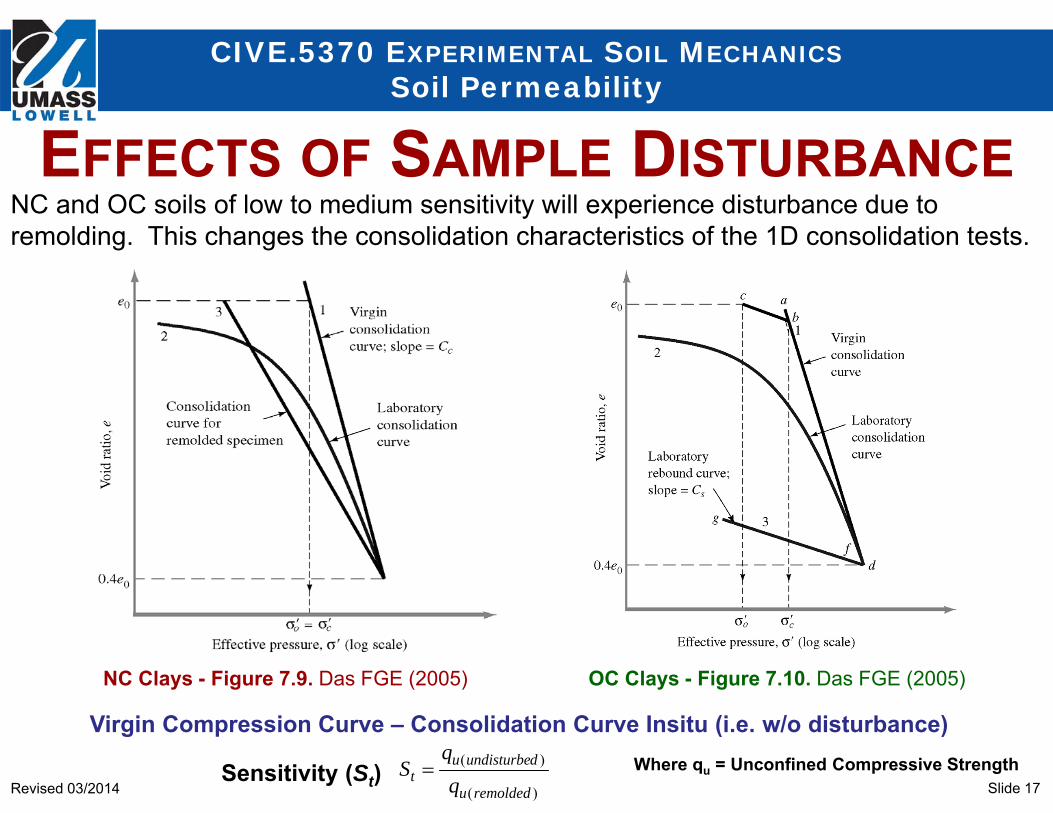
EFFECTS OF SAMPLE DISTURBANCE
OC Clays - Figure 7.10. Das FGE (2005)
NC and OC soils of low to medium sensitivity will experience disturbance due to remolding. This changes the consolidation characteristics of the 1D consolidation tests.
)(
)(
remoldedu
dundisturbeut q
qS Sensitivity (St) Where qu = Unconfined Compressive Strength
NC Clays - Figure 7.9. Das FGE (2005)
Virgin Compression Curve – Consolidation Curve Insitu (i.e. w/o disturbance)
Slide 18Revised 03/2014
CIVE.5370 EXPERIMENTAL SOIL MECHANICSSoil Permeability
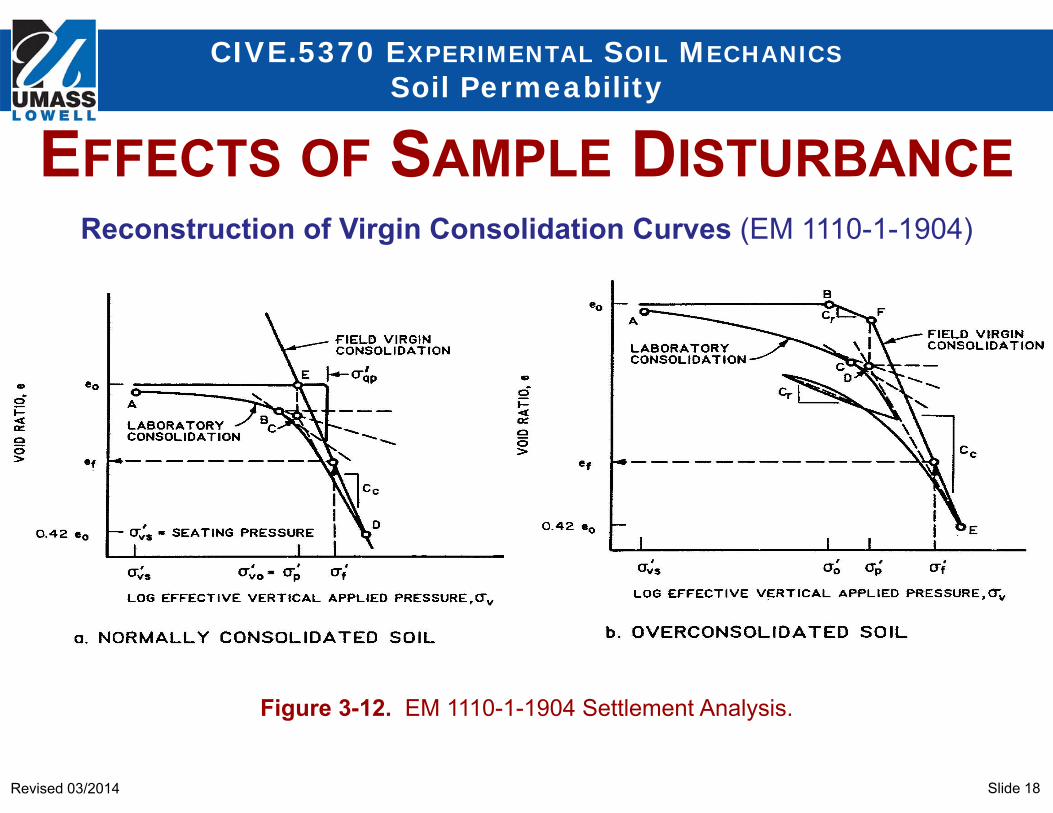
Reconstruction of Virgin Consolidation Curves (EM 1110-1-1904)
Figure 3-12. EM 1110-1-1904 Settlement Analysis.
EFFECTS OF SAMPLE DISTURBANCE
Slide 19Revised 03/2014
CIVE.5370 EXPERIMENTAL SOIL MECHANICSSoil Permeability
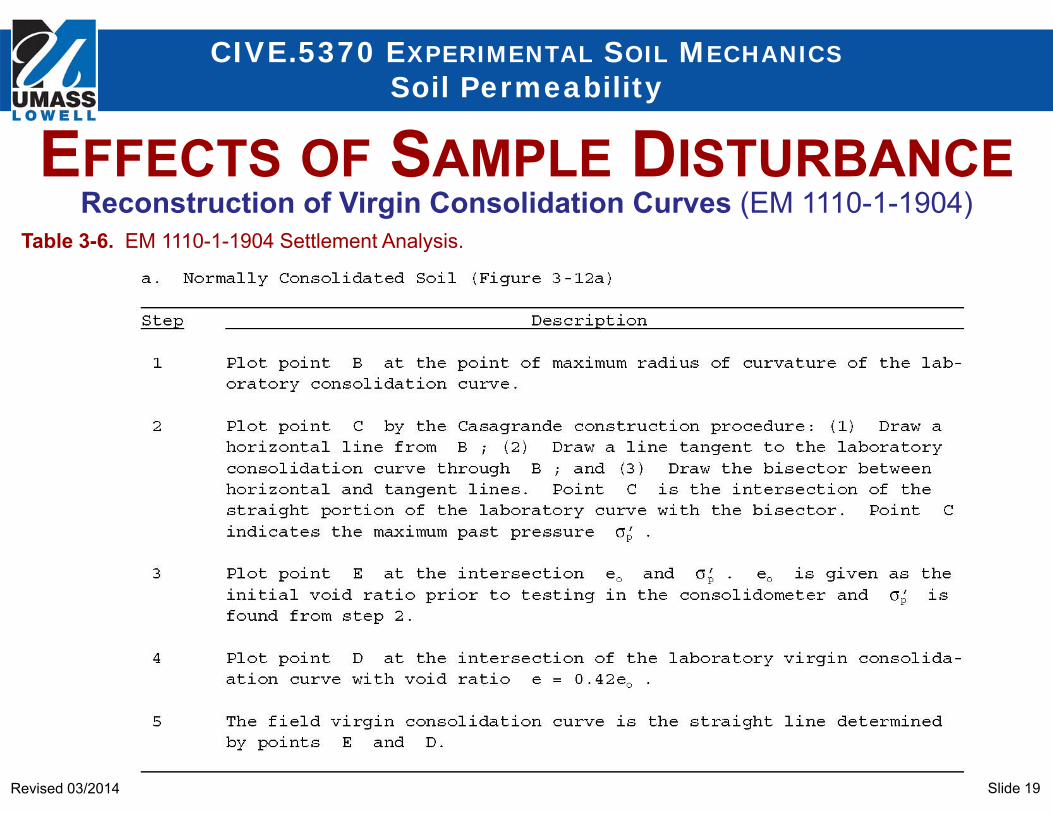
Reconstruction of Virgin Consolidation Curves (EM 1110-1-1904)Table 3-6. EM 1110-1-1904 Settlement Analysis.
EFFECTS OF SAMPLE DISTURBANCE
Slide 20Revised 03/2014
CIVE.5370 EXPERIMENTAL SOIL MECHANICSSoil Permeability
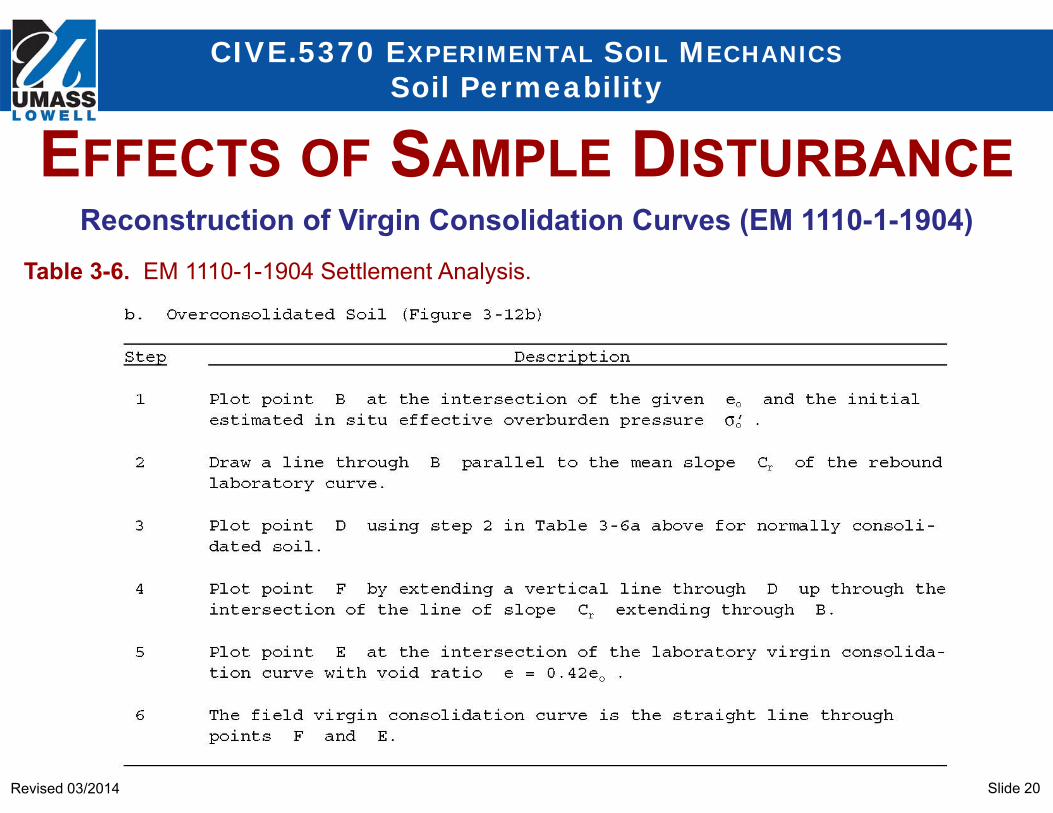
Reconstruction of Virgin Consolidation Curves (EM 1110-1-1904)Table 3-6. EM 1110-1-1904 Settlement Analysis.
EFFECTS OF SAMPLE DISTURBANCE
Slide 21Revised 03/2014
CIVE.5370 EXPERIMENTAL SOIL MECHANICSSoil Permeability
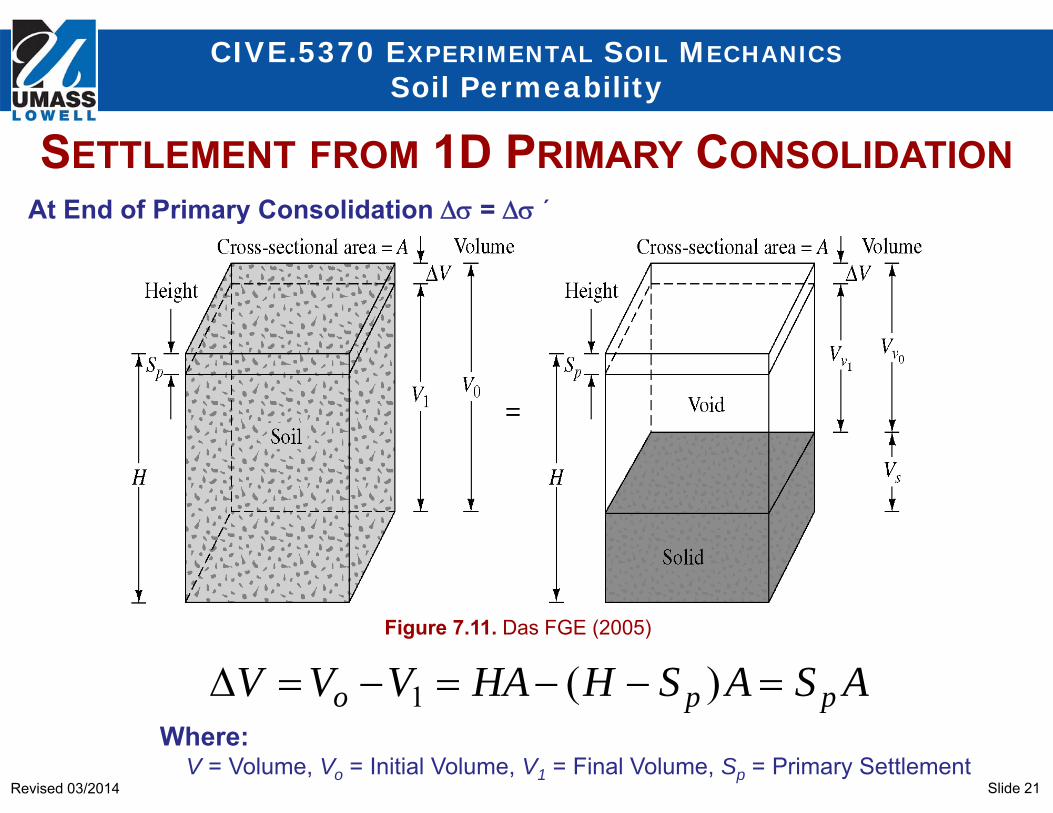
SETTLEMENT FROM 1D PRIMARY CONSOLIDATION
Figure 7.11. Das FGE (2005)
ASASHHAVVV ppo )(1Where:
V = Volume, Vo = Initial Volume, V1 = Final Volume, Sp = Primary Settlement
At End of Primary Consolidation = ´
Slide 22Revised 03/2014
CIVE.5370 EXPERIMENTAL SOIL MECHANICSSoil Permeability
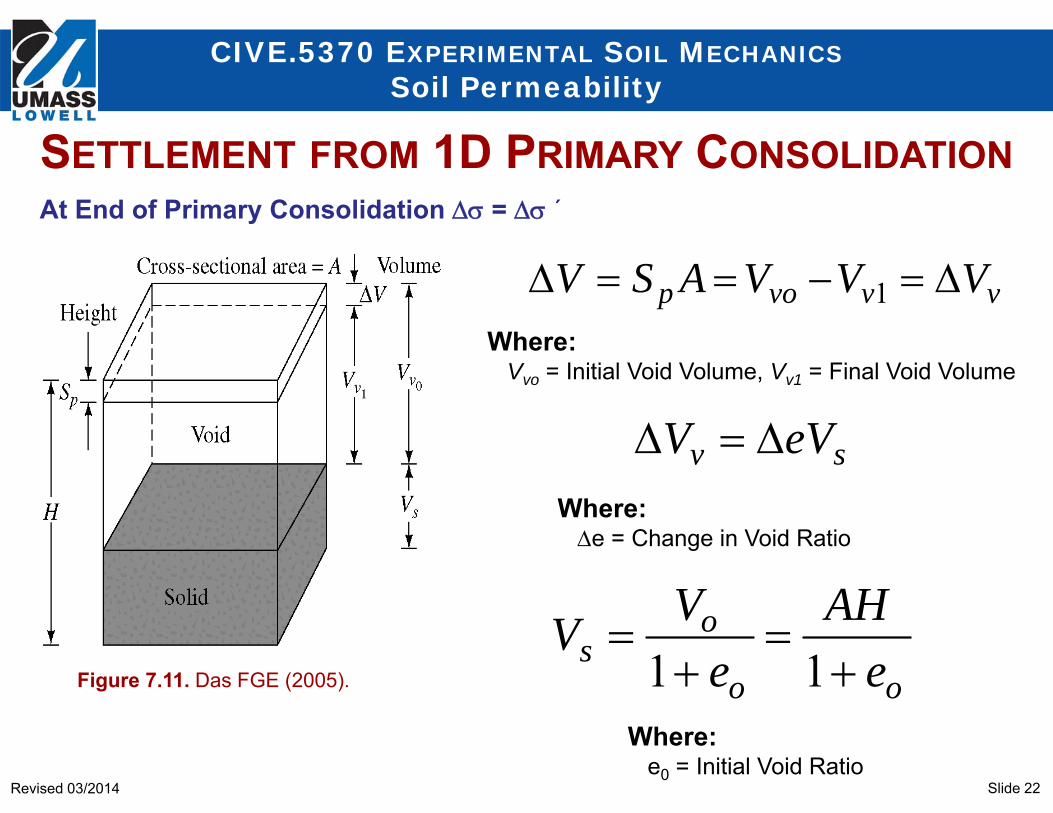
vvvop VVVASV 1
oo
os e
AHe
VV
11Figure 7.11. Das FGE (2005).
Where:Vvo = Initial Void Volume, Vv1 = Final Void Volume
At End of Primary Consolidation = ´
Where:e = Change in Void Ratio
sv eVV
Where:e0 = Initial Void Ratio
SETTLEMENT FROM 1D PRIMARY CONSOLIDATION
Slide 23Revised 03/2014
CIVE.5370 EXPERIMENTAL SOIL MECHANICSSoil Permeability
ee
AHeVASVo
sp
1
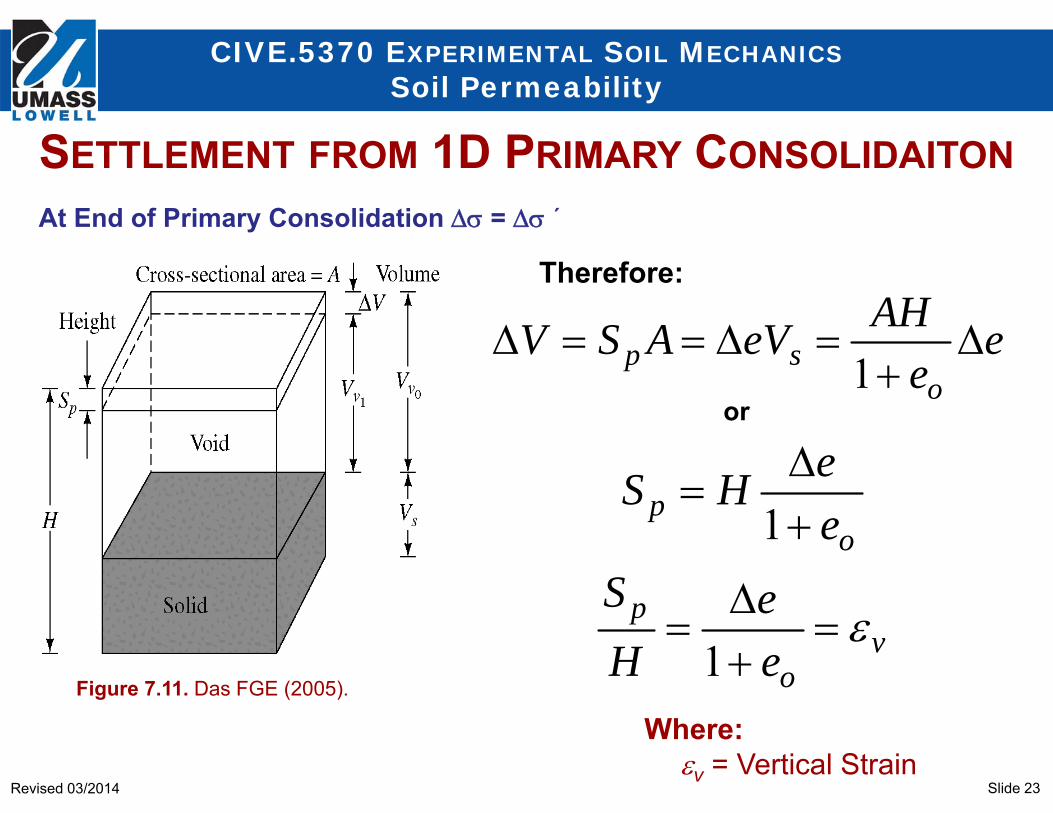
Figure 7.11. Das FGE (2005).
At End of Primary Consolidation = ´
or
vo
p
op
ee
HS
eeHS
1
1
Therefore:
Where:v = Vertical Strain
SETTLEMENT FROM 1D PRIMARY CONSOLIDAITON
Slide 24Revised 03/2014
CIVE.5370 EXPERIMENTAL SOIL MECHANICSSoil Permeability
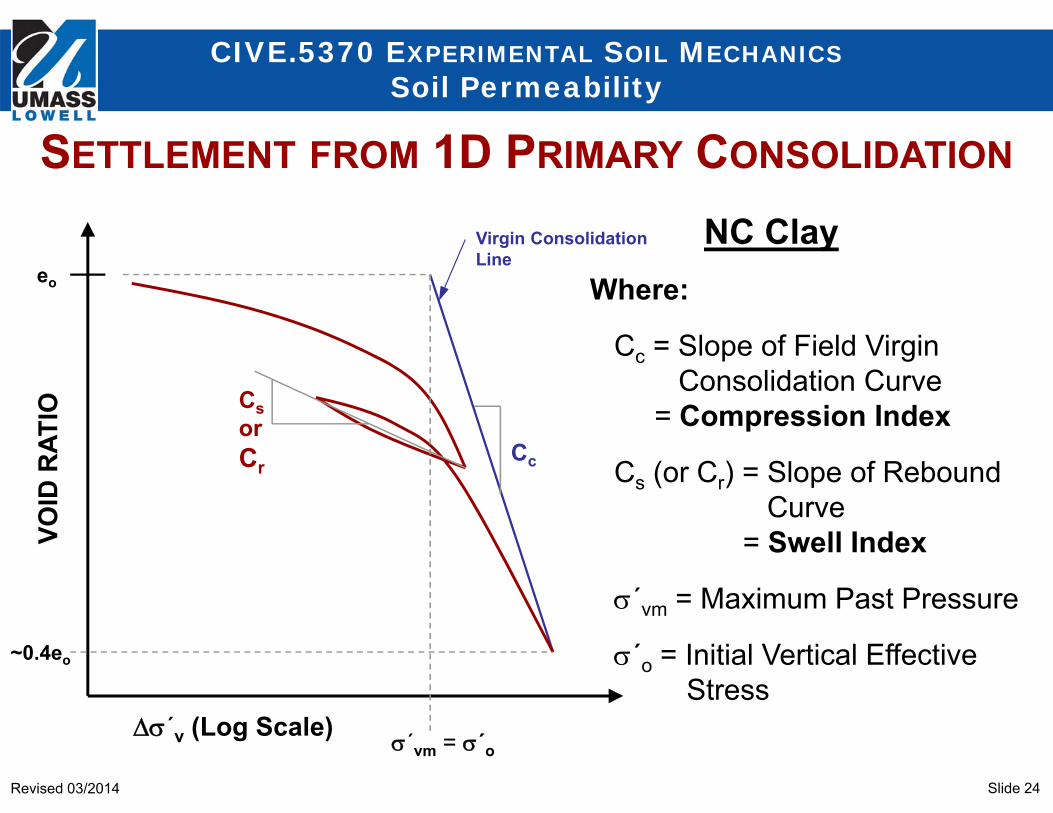
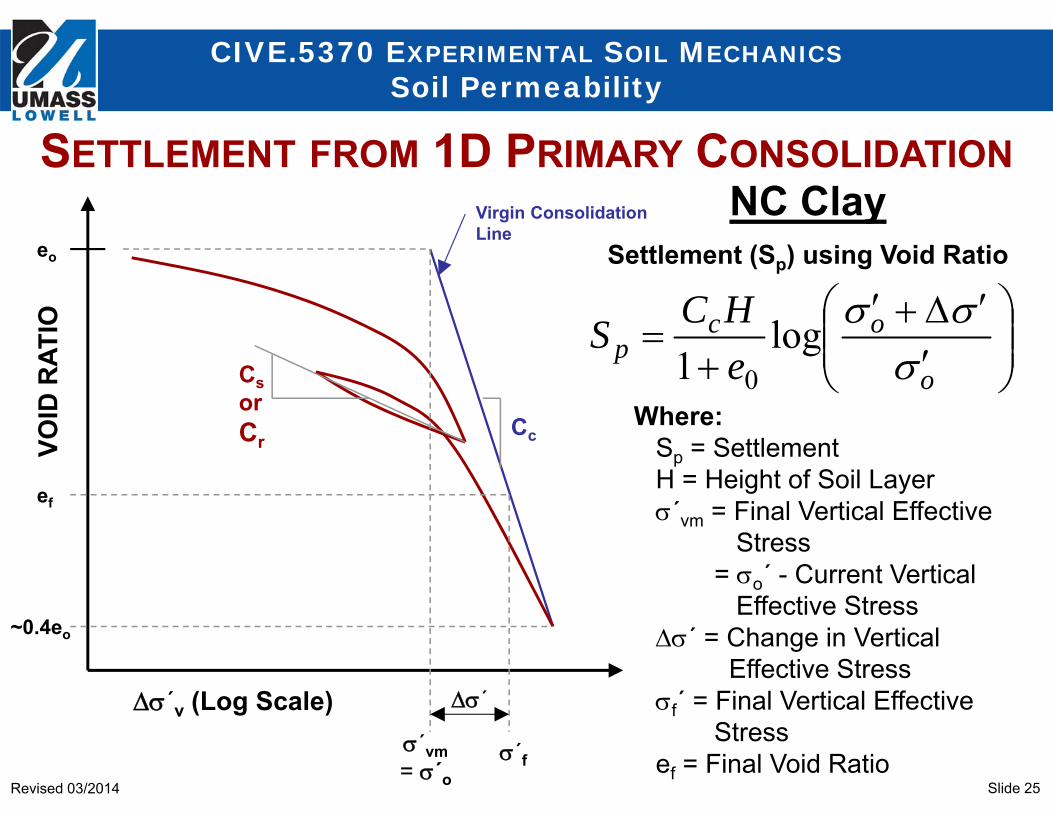
Where:
Cc = Slope of Field VirginConsolidation Curve
= Compression Index
Cs (or Cr) = Slope of ReboundCurve
= Swell Index
´vm = Maximum Past Pressure
´o = Initial Vertical EffectiveStress
VOID
RAT
IO
´v (Log Scale)
Cc
CsorCr
eo
~0.4eo
Virgin ConsolidationLine
´vm = ´o
NC Clay
SETTLEMENT FROM 1D PRIMARY CONSOLIDATION
Slide 25Revised 03/2014
CIVE.5370 EXPERIMENTAL SOIL MECHANICSSoil Permeability
VOID
RAT
IO
´v (Log Scale)
Cc
CsorCr
eo
~0.4eo
´vm= ´o
NC Clay
o
ocp e
HCS
log1 0
Settlement (Sp) using Void Ratio
´
Virgin ConsolidationLine
ef
Where:Sp = SettlementH = Height of Soil Layer´vm = Final Vertical Effective
Stress= o´ - Current Vertical
Effective Stress´ = Change in Vertical
Effective Stressf´ = Final Vertical Effective
Stressef = Final Void Ratio´f
SETTLEMENT FROM 1D PRIMARY CONSOLIDATION
Slide 26Revised 03/2014
CIVE.5370 EXPERIMENTAL SOIL MECHANICSSoil Permeability
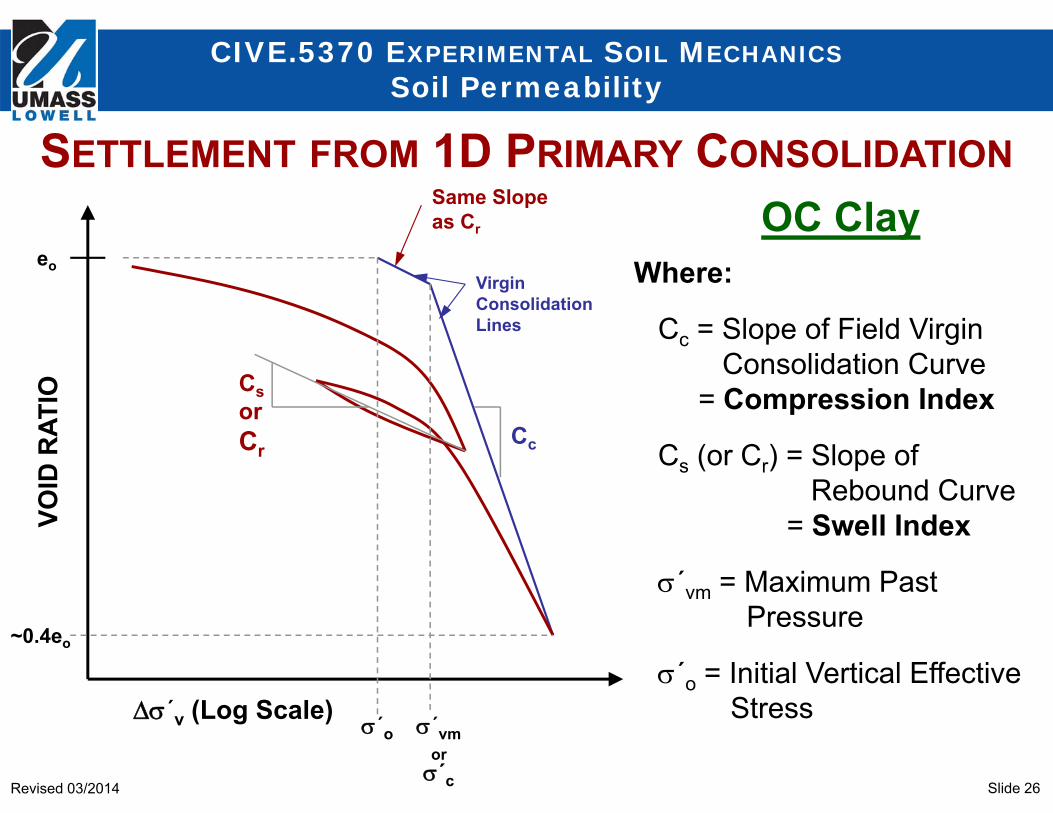
Where:
Cc = Slope of Field VirginConsolidation Curve
= Compression Index
Cs (or Cr) = Slope ofRebound Curve
= Swell Index
´vm = Maximum PastPressure
´o = Initial Vertical EffectiveStress
VOID
RAT
IO
´v (Log Scale)
Cc
CsorCr
eo
´o
~0.4eo
Same Slope as Cr
´vmor´c
OC ClayVirginConsolidationLines
SETTLEMENT FROM 1D PRIMARY CONSOLIDATION
Slide 27Revised 03/2014
CIVE.5370 EXPERIMENTAL SOIL MECHANICSSoil Permeability
VOID
RAT
IO
´v (Log Scale)
Cc
CsorCr
eo
´vmor´c
´o
~0.4eo
Same Slope as Cr
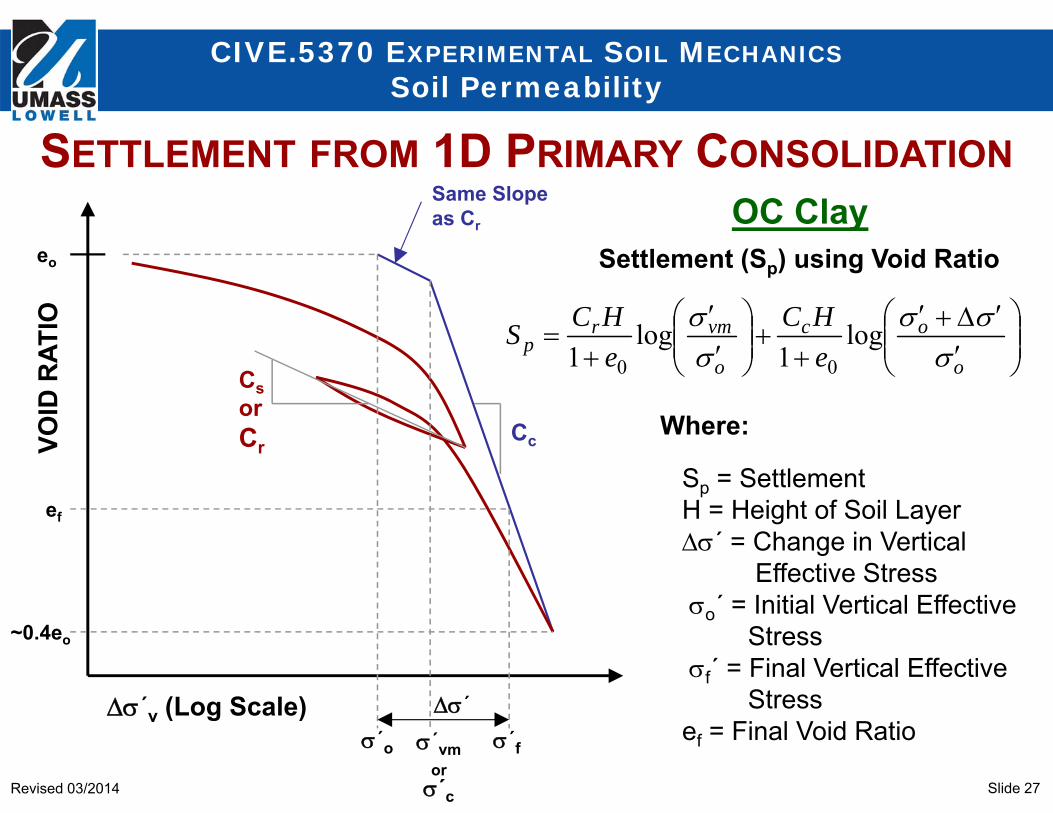
o
oc
o
vmrp e
HCeHCS
log
1log
1 00
Settlement (Sp) using Void Ratio
Where:
Sp = SettlementH = Height of Soil Layer´ = Change in Vertical
Effective Stresso´ = Initial Vertical Effective
Stressf´ = Final Vertical Effective
Stressef = Final Void Ratio
´
ef
´f
OC ClaySETTLEMENT FROM 1D PRIMARY CONSOLIDATION
Slide 28Revised 03/2014
CIVE.5370 EXPERIMENTAL SOIL MECHANICSSoil Permeability
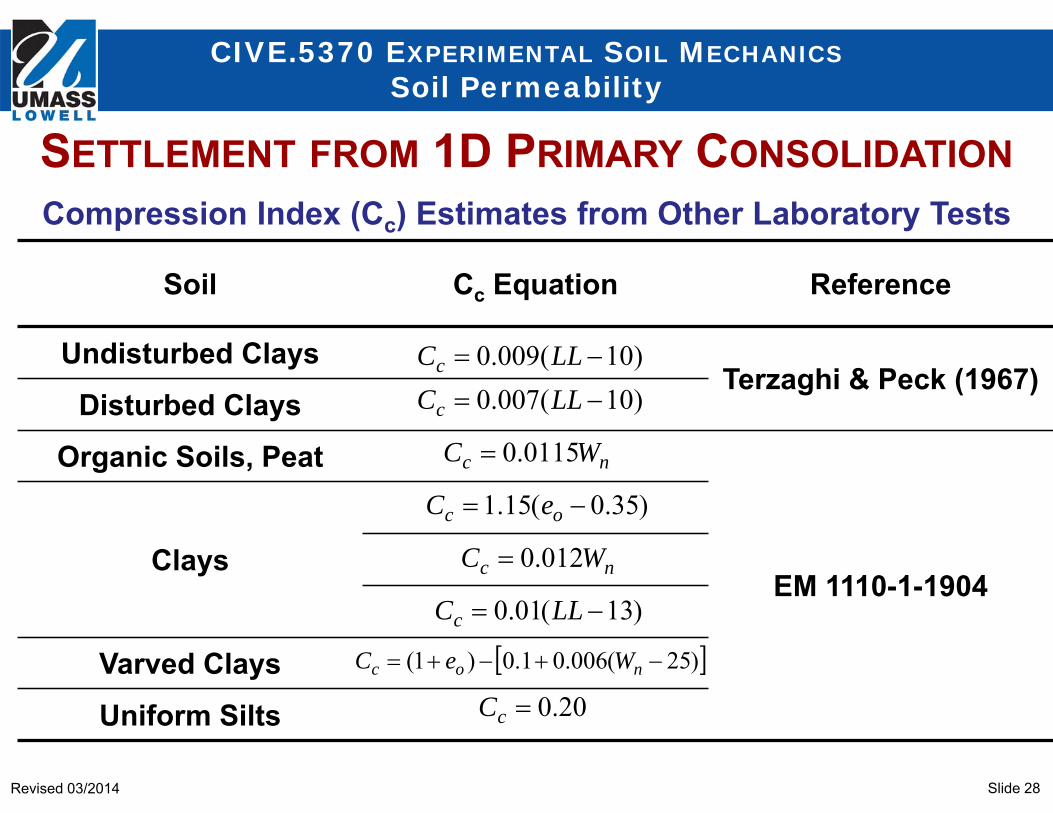
nc WC 0115.0
Compression Index (Cc) Estimates from Other Laboratory Tests
)25(006.01.0)1( noc WeC
)10(007.0 LLCc
)10(009.0 LLCc
Soil Cc Equation Reference
Undisturbed ClaysTerzaghi & Peck (1967)
Disturbed ClaysOrganic Soils, Peat
EM 1110-1-1904Clays
Varved ClaysUniform Silts 20.0cC
)13(01.0 LLCc
nc WC 012.0
)35.0(15.1 oc eC
SETTLEMENT FROM 1D PRIMARY CONSOLIDATION
Slide 29Revised 03/2014
CIVE.5370 EXPERIMENTAL SOIL MECHANICSSoil Permeability
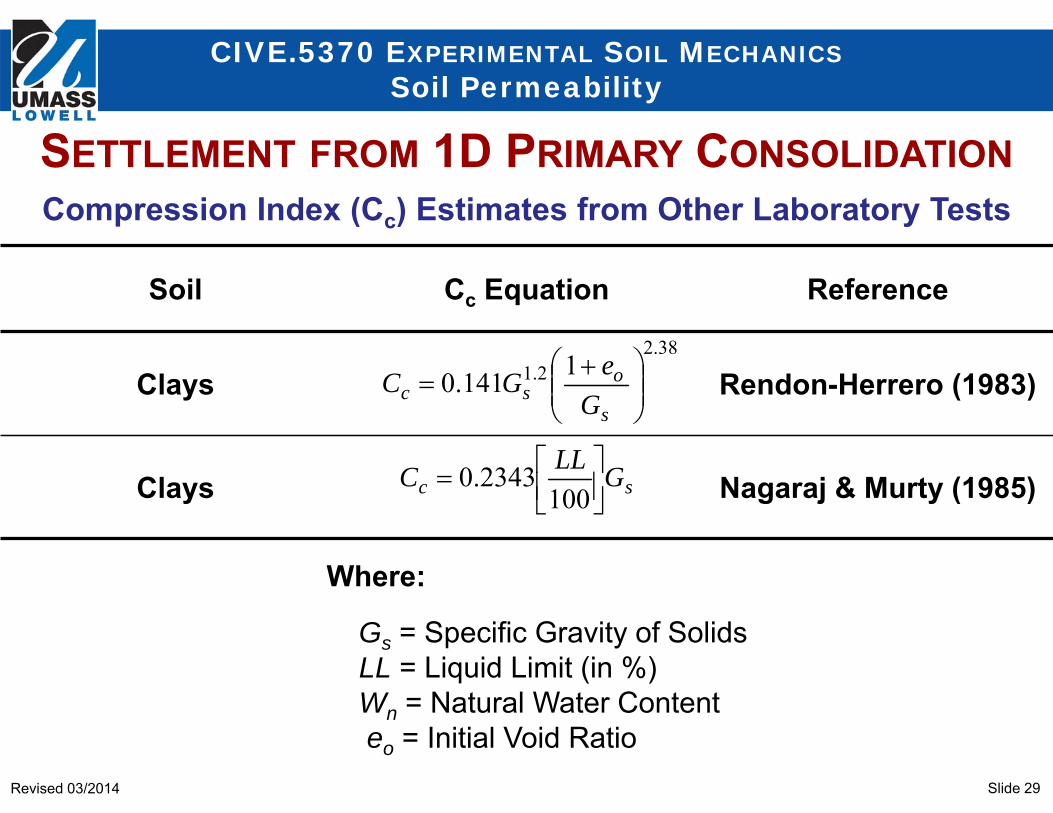
Compression Index (Cc) Estimates from Other Laboratory Tests
sc GLLC
100
2343.0
Soil Cc Equation Reference
Clays Rendon-Herrero (1983)
Clays Nagaraj & Murty (1985)
38.22.1 1141.0
s
osc G
eGC
Where:
Gs = Specific Gravity of SolidsLL = Liquid Limit (in %)Wn = Natural Water Contenteo = Initial Void Ratio
SETTLEMENT FROM 1D PRIMARY CONSOLIDATION
Slide 30Revised 03/2014
CIVE.5370 EXPERIMENTAL SOIL MECHANICSSoil Permeability
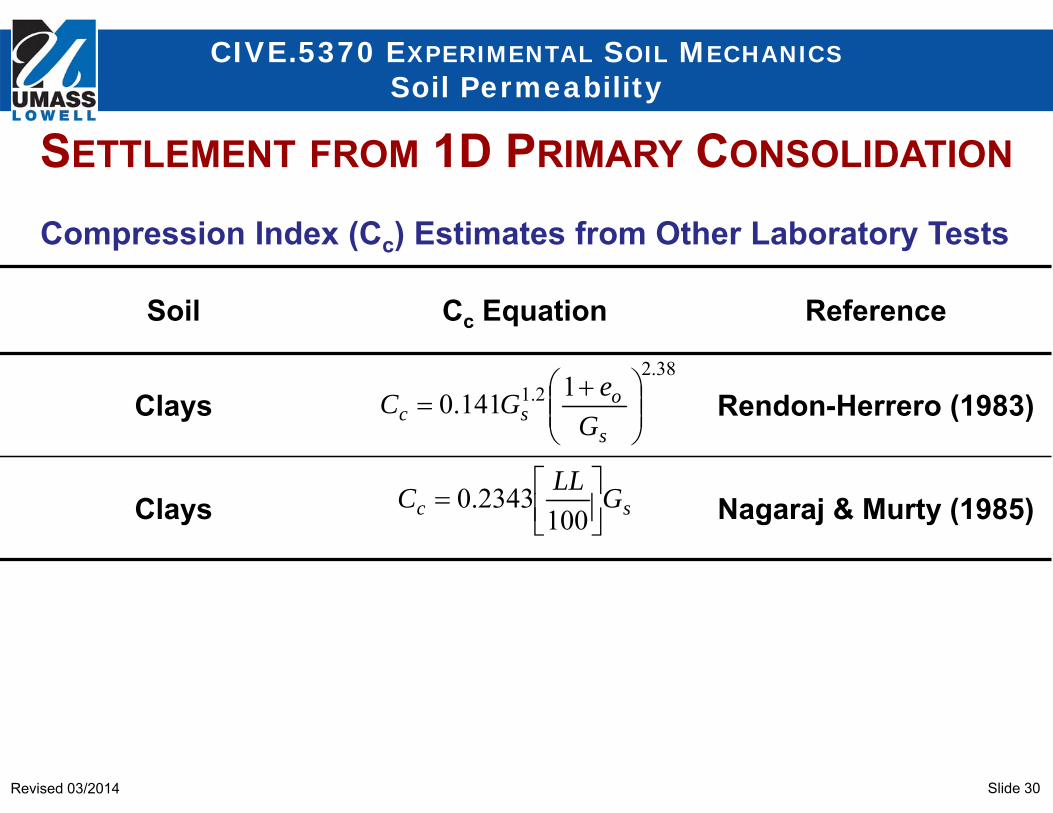
Compression Index (Cc) Estimates from Other Laboratory Tests
sc GLLC
100
2343.0
Soil Cc Equation Reference
Clays Rendon-Herrero (1983)
Clays Nagaraj & Murty (1985)
38.22.1 1141.0
s
osc G
eGC
SETTLEMENT FROM 1D PRIMARY CONSOLIDATION
Slide 31Revised 03/2014
CIVE.5370 EXPERIMENTAL SOIL MECHANICSSoil Permeability
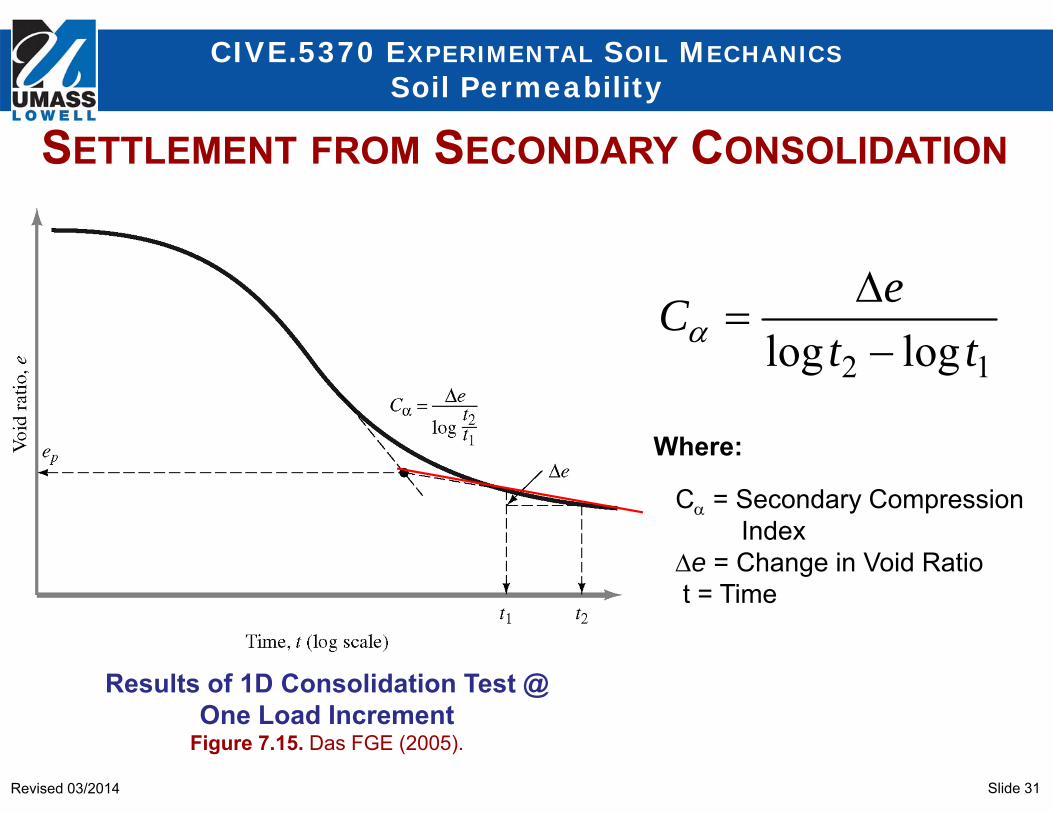
12 loglog tteC
SETTLEMENT FROM SECONDARY CONSOLIDATION
Where:
C = Secondary CompressionIndex
e = Change in Void Ratiot = Time
Results of 1D Consolidation Test @ One Load Increment
Figure 7.15. Das FGE (2005).
Slide 32Revised 03/2014
CIVE.5370 EXPERIMENTAL SOIL MECHANICSSoil Permeability
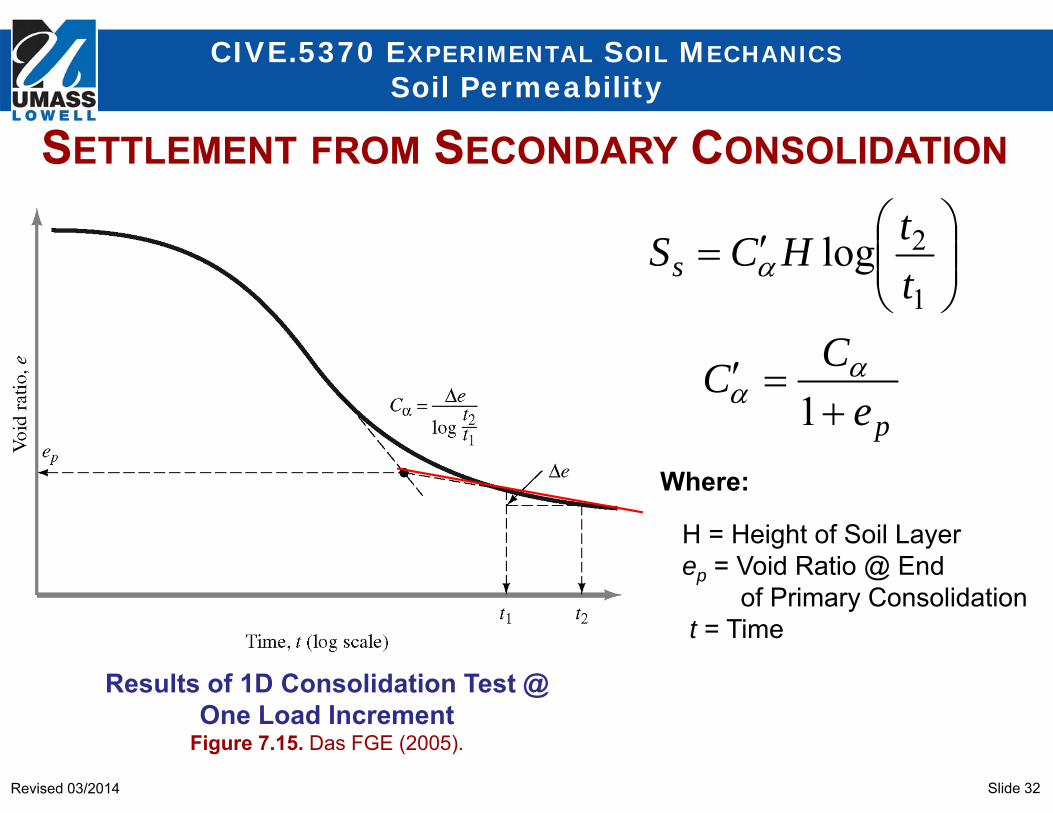
Where:
H = Height of Soil Layerep = Void Ratio @ End
of Primary Consolidationt = Time
p
s
eCC
ttHCS
1
log1
2
SETTLEMENT FROM SECONDARY CONSOLIDATION
Results of 1D Consolidation Test @ One Load Increment
Figure 7.15. Das FGE (2005).
Slide 33Revised 03/2014
CIVE.5370 EXPERIMENTAL SOIL MECHANICSSoil Permeability
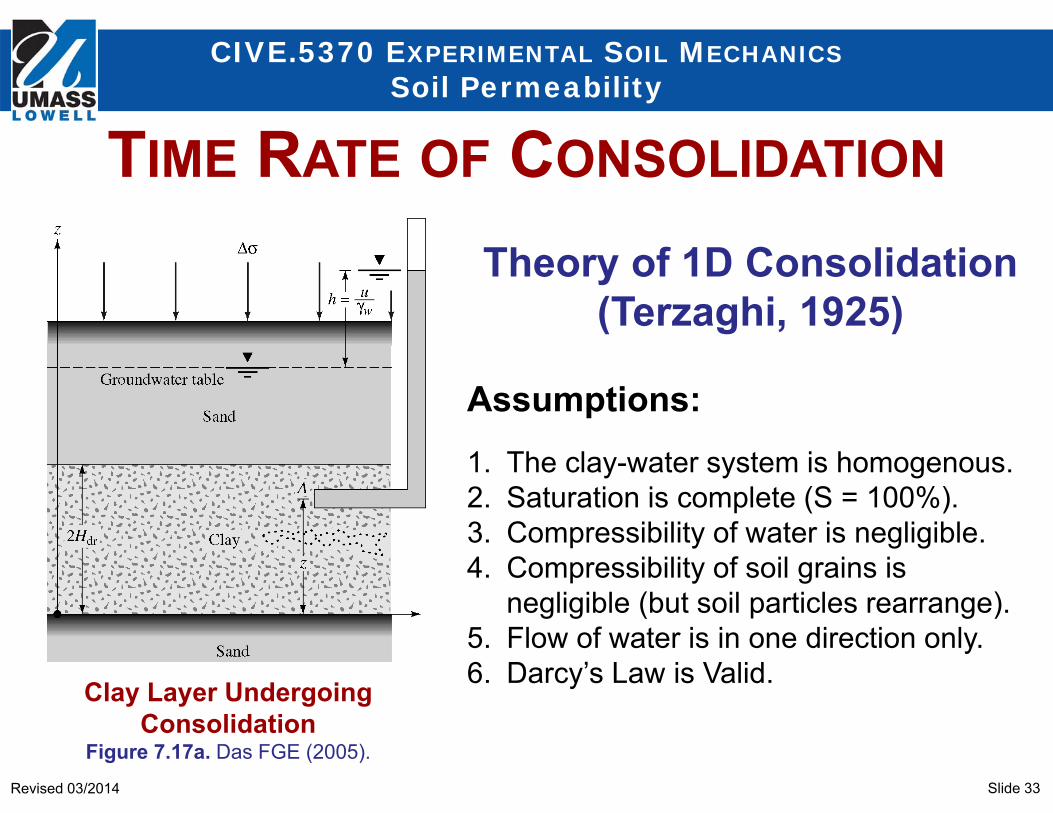
TIME RATE OF CONSOLIDATION
Clay Layer Undergoing Consolidation
Figure 7.17a. Das FGE (2005).
Theory of 1D Consolidation(Terzaghi, 1925)
Assumptions:1. The clay-water system is homogenous.2. Saturation is complete (S = 100%).3. Compressibility of water is negligible.4. Compressibility of soil grains is
negligible (but soil particles rearrange).5. Flow of water is in one direction only.6. Darcy’s Law is Valid.
Slide 34Revised 03/2014
CIVE.5370 EXPERIMENTAL SOIL MECHANICSSoil Permeability
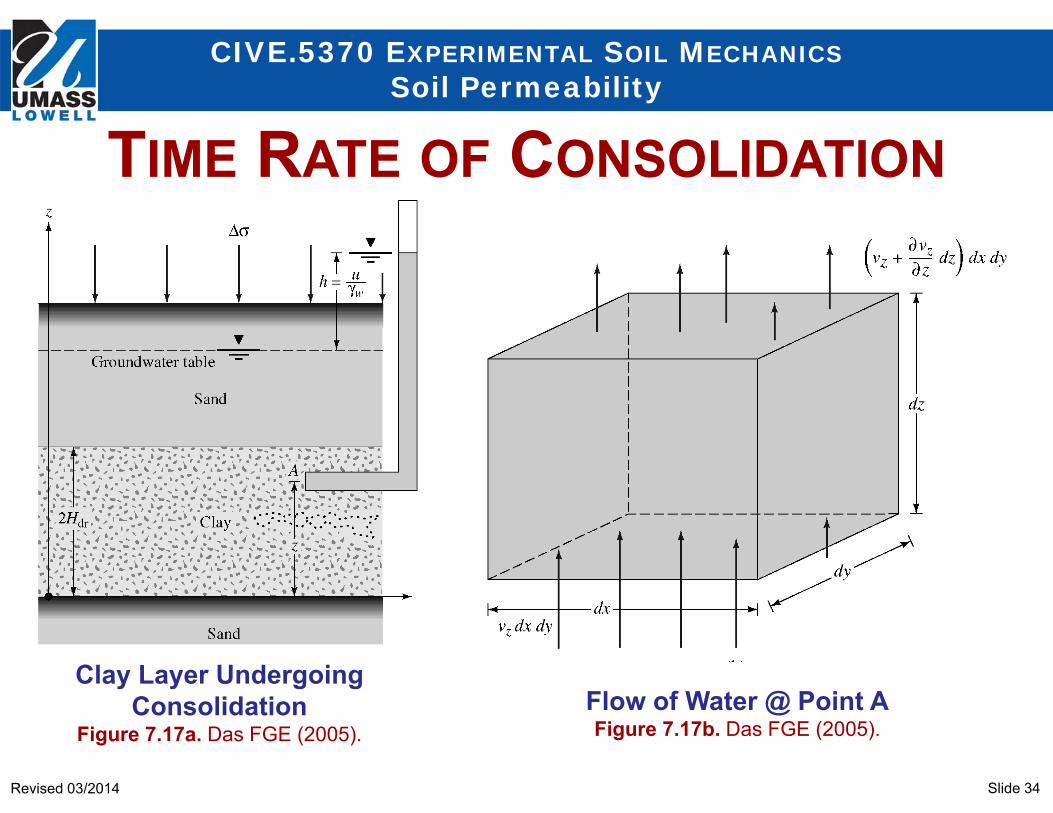
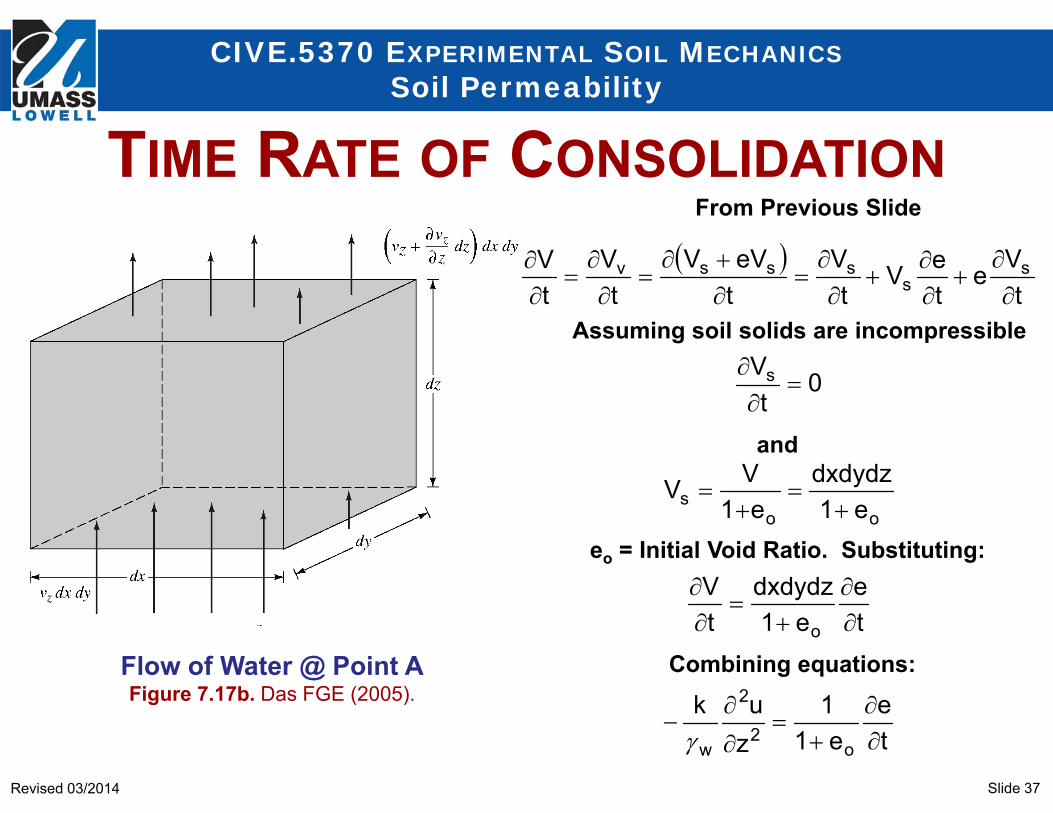
Flow of Water @ Point AFigure 7.17b. Das FGE (2005).
Clay Layer Undergoing Consolidation
Figure 7.17a. Das FGE (2005).
TIME RATE OF CONSOLIDATION
Slide 35Revised 03/2014
CIVE.5370 EXPERIMENTAL SOIL MECHANICSSoil Permeability
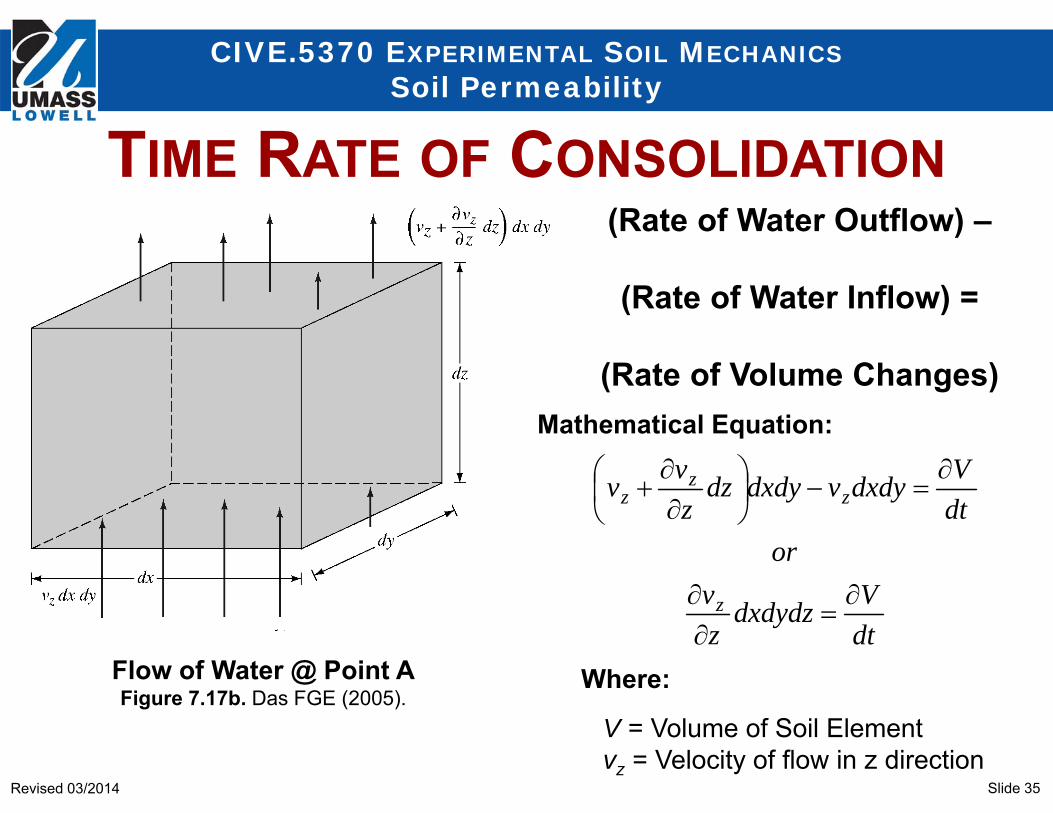
Flow of Water @ Point AFigure 7.17b. Das FGE (2005).
dtVdxdydz
zv
ordtVdxdyvdxdydz
zvv
z
zz
z
(Rate of Water Outflow) –
(Rate of Water Inflow) =
(Rate of Volume Changes)Mathematical Equation:
Where:
V = Volume of Soil Elementvz = Velocity of flow in z direction
TIME RATE OF CONSOLIDATION
Slide 36Revised 03/2014
CIVE.5370 EXPERIMENTAL SOIL MECHANICSSoil Permeability
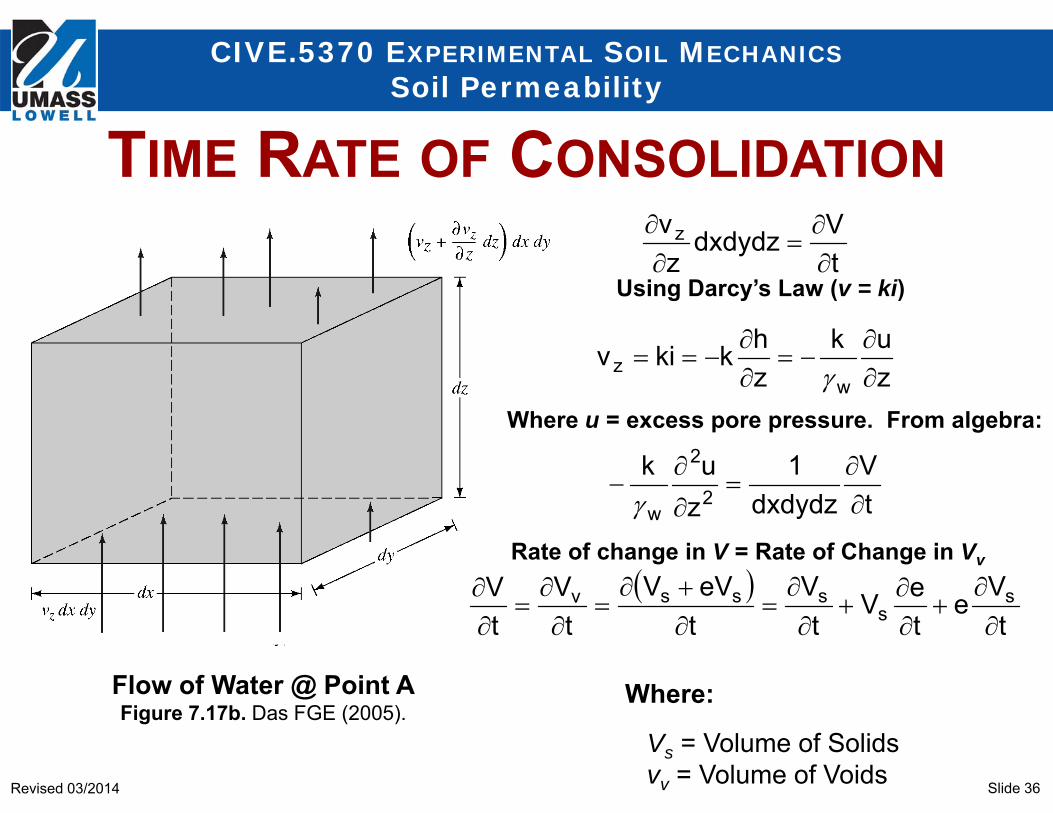
Flow of Water @ Point AFigure 7.17b. Das FGE (2005).
Where:
Vs = Volume of Solidsvv = Volume of Voids
t
VeteV
tV
teVV
tV
tV
tV
dxdydz1
zuk
zuk
zhkkiv
tVdxdydz
zv
ss
sssv
2
2
w
wz
z
Using Darcy’s Law (v = ki)
Where u = excess pore pressure. From algebra:
Rate of change in V = Rate of Change in Vv
TIME RATE OF CONSOLIDATION
Slide 37Revised 03/2014
CIVE.5370 EXPERIMENTAL SOIL MECHANICSSoil Permeability
Flow of Water @ Point AFigure 7.17b. Das FGE (2005).
te
e11
zuk
te
e1dxdydz
tV
e1dxdydz
e1VV
0t
V
tVe
teV
tV
teVV
tV
tV
o2
2
w
o
oos
s
ss
sssv
From Previous Slide
Assuming soil solids are incompressible
and
eo = Initial Void Ratio. Substituting:
Combining equations:
TIME RATE OF CONSOLIDATION
Slide 38Revised 03/2014
CIVE.5370 EXPERIMENTAL SOIL MECHANICSSoil Permeability
o
vv
vo
v
w
vv
ow
eam
tum
tu
ea
zuk
uaae
te
ezuk
1
1
11
2
2
2
2
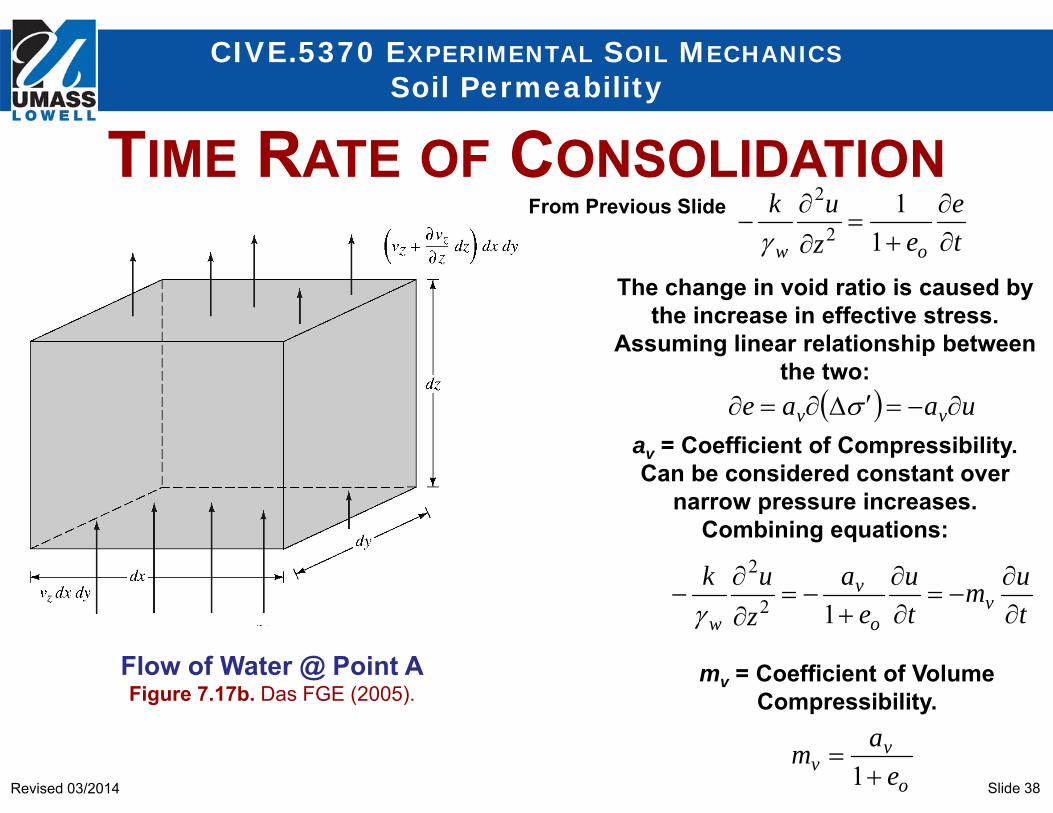
From Previous Slide
The change in void ratio is caused by the increase in effective stress.
Assuming linear relationship between the two:
av = Coefficient of Compressibility. Can be considered constant over
narrow pressure increases. Combining equations:
mv = Coefficient of Volume Compressibility.
TIME RATE OF CONSOLIDATION
Flow of Water @ Point AFigure 7.17b. Das FGE (2005).
Slide 39Revised 03/2014
CIVE.5370 EXPERIMENTAL SOIL MECHANICSSoil Permeability
vwv
v
o
vv
vo
v
w
mkc
zuc
tu
eam
tum
tu
ea
zuk
2
2
2
2
1
1
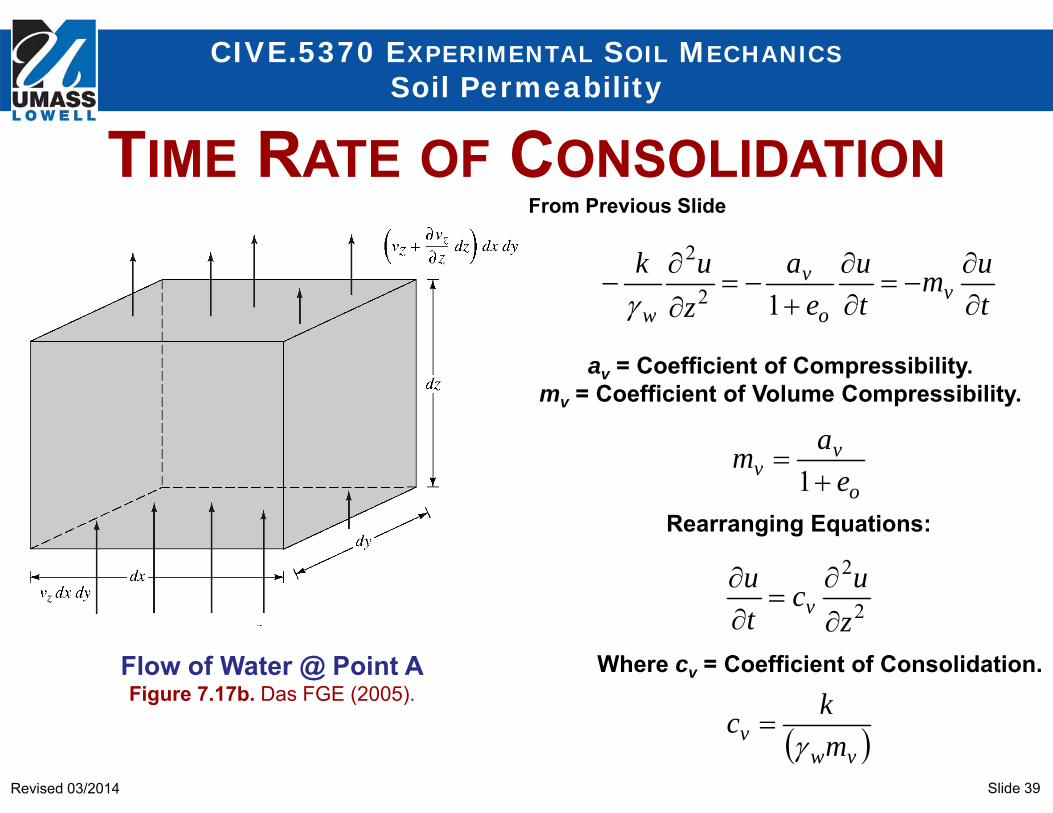
From Previous Slide
Rearranging Equations:
av = Coefficient of Compressibility.mv = Coefficient of Volume Compressibility.
Where cv = Coefficient of Consolidation.
TIME RATE OF CONSOLIDATION
Flow of Water @ Point AFigure 7.17b. Das FGE (2005).
Slide 40Revised 03/2014
CIVE.5370 EXPERIMENTAL SOIL MECHANICSSoil Permeability
0,00,2
0,0
uutuHz
uz
dr
2
2
zuc
tu
v
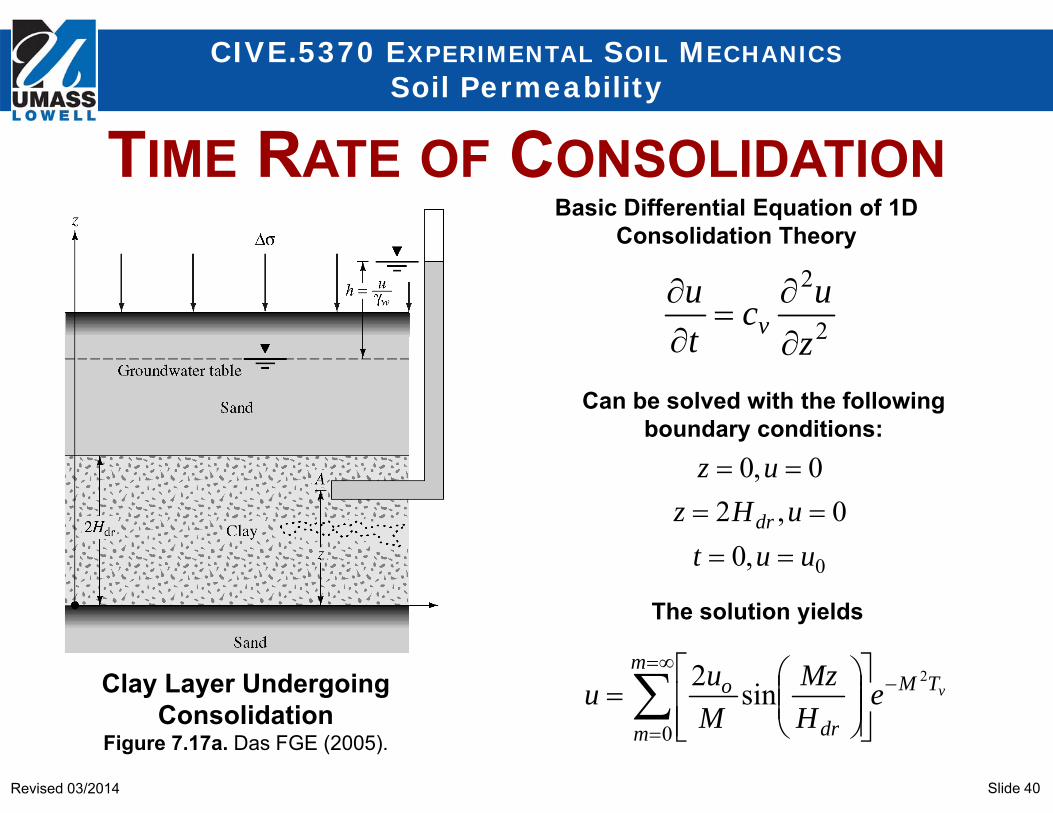
Can be solved with the following boundary conditions:
Basic Differential Equation of 1DConsolidation Theory
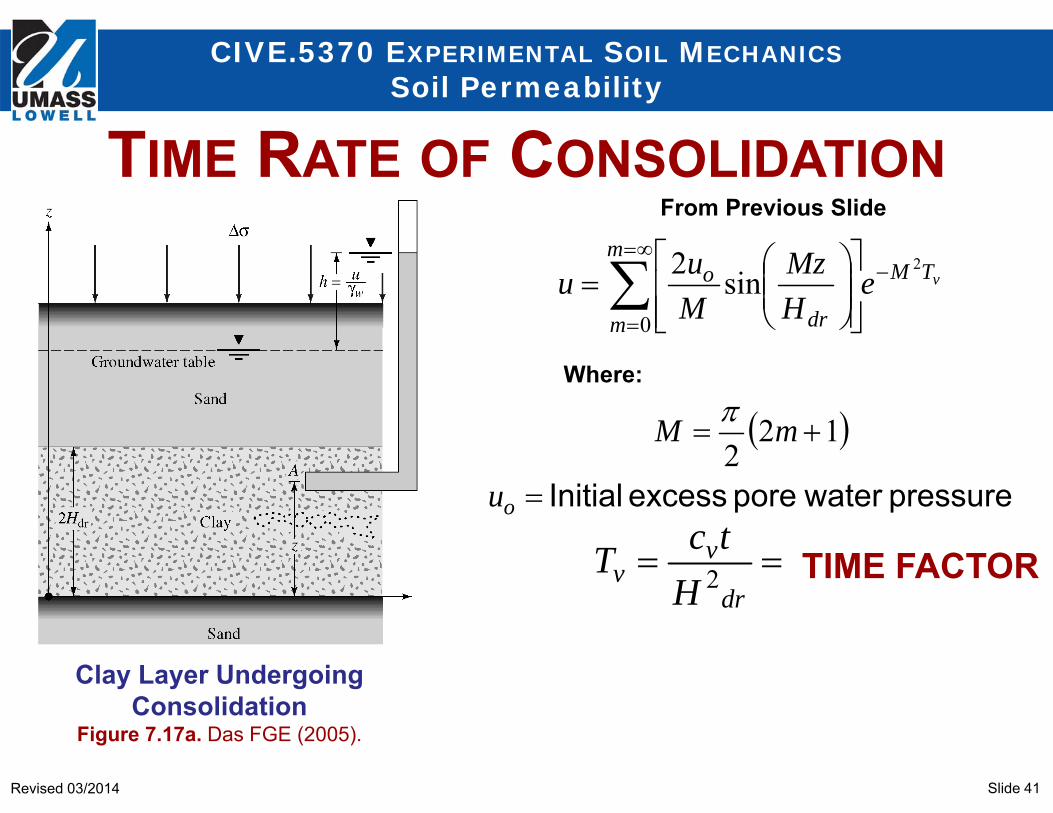
The solution yields
vTMm
m dr
o eHMz
Muu
2
0
sin2
Clay Layer Undergoing
ConsolidationFigure 7.17a. Das FGE (2005).
TIME RATE OF CONSOLIDATION
Slide 41Revised 03/2014
CIVE.5370 EXPERIMENTAL SOIL MECHANICSSoil Permeability
From Previous Slide
dr
vv H
tcT 2
pressure waterpore excess Initial
o
TMm
m dr
o
u
mM
eHMz
Muu v
122
sin2 2
0
Clay Layer Undergoing Consolidation
Figure 7.17a. Das FGE (2005).
Where:
TIME FACTOR
TIME RATE OF CONSOLIDATION
Slide 42Revised 03/2014
CIVE.5370 EXPERIMENTAL SOIL MECHANICSSoil Permeability
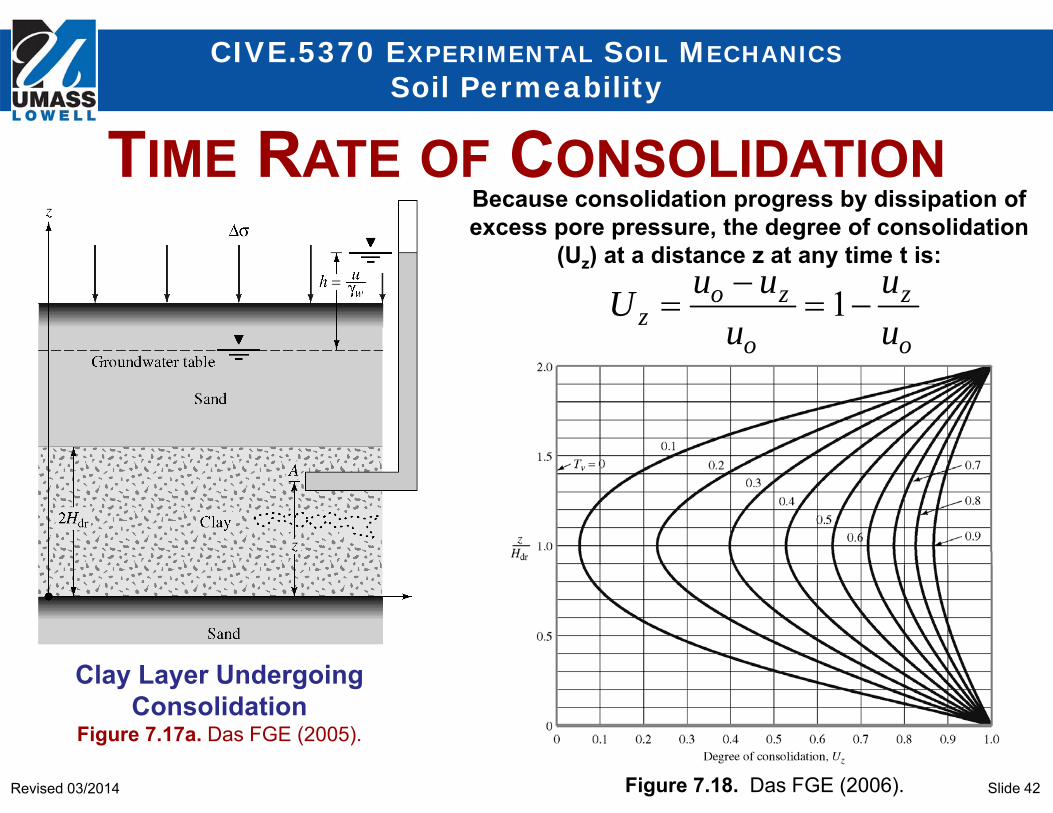
o
z
o
zoz u
uu
uuU
1
Because consolidation progress by dissipation of excess pore pressure, the degree of consolidation
(Uz) at a distance z at any time t is:
Figure 7.18. Das FGE (2006).
TIME RATE OF CONSOLIDATION
Clay Layer Undergoing Consolidation
Figure 7.17a. Das FGE (2005).
Slide 43Revised 03/2014
CIVE.5370 EXPERIMENTAL SOIL MECHANICSSoil Permeability
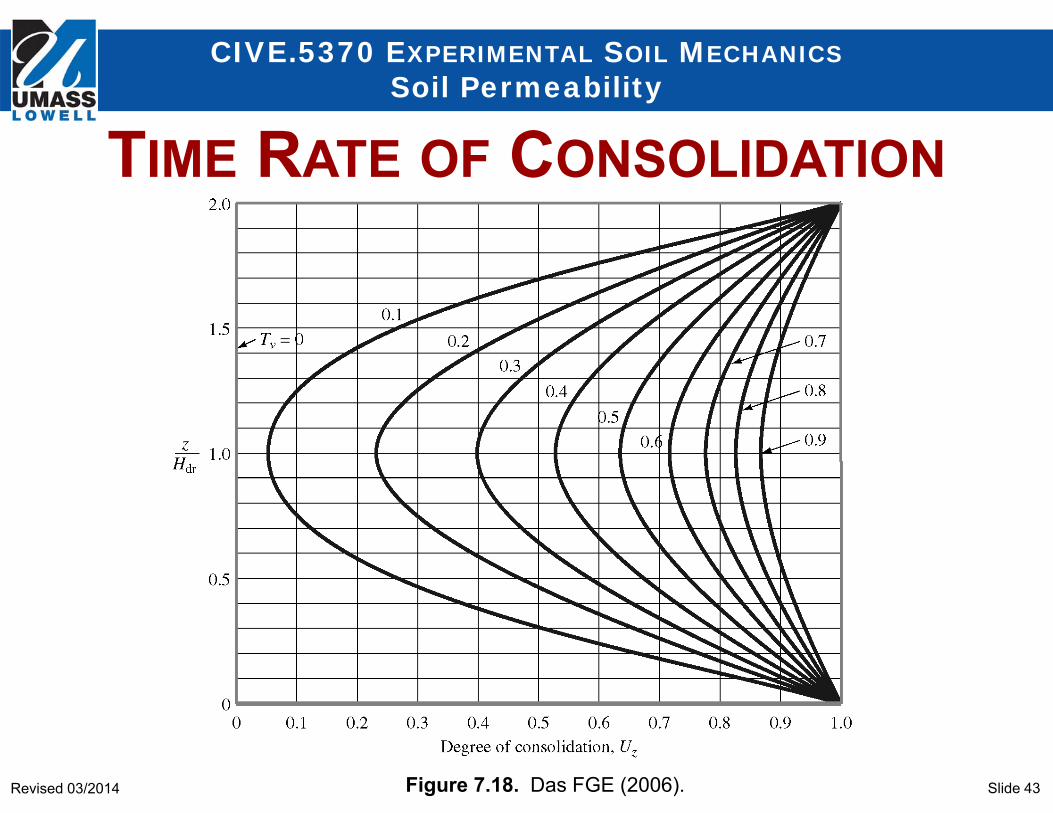
Figure 7.18. Das FGE (2006).
TIME RATE OF CONSOLIDATION
Slide 44Revised 03/2014
CIVE.5370 EXPERIMENTAL SOIL MECHANICSSoil Permeability
vTMm
m
eM
U2
0221
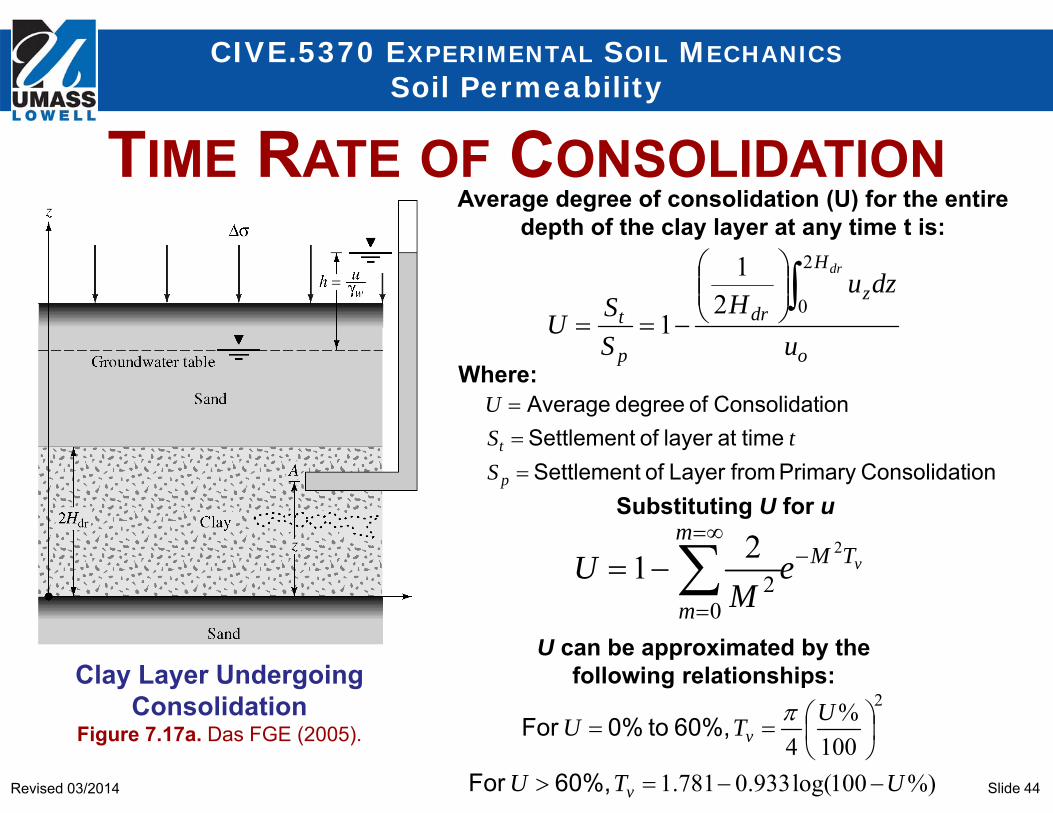
ionConsolidat Primary from Layer of Settlement time at layer of Settlement
ionConsolidat of degree Average
p
t
StS
U
o
Hz
dr
p
t
u
dzuH
SSU
dr
2
021
1
Average degree of consolidation (U) for the entire depth of the clay layer at any time t is:
Where:
Substituting U for u
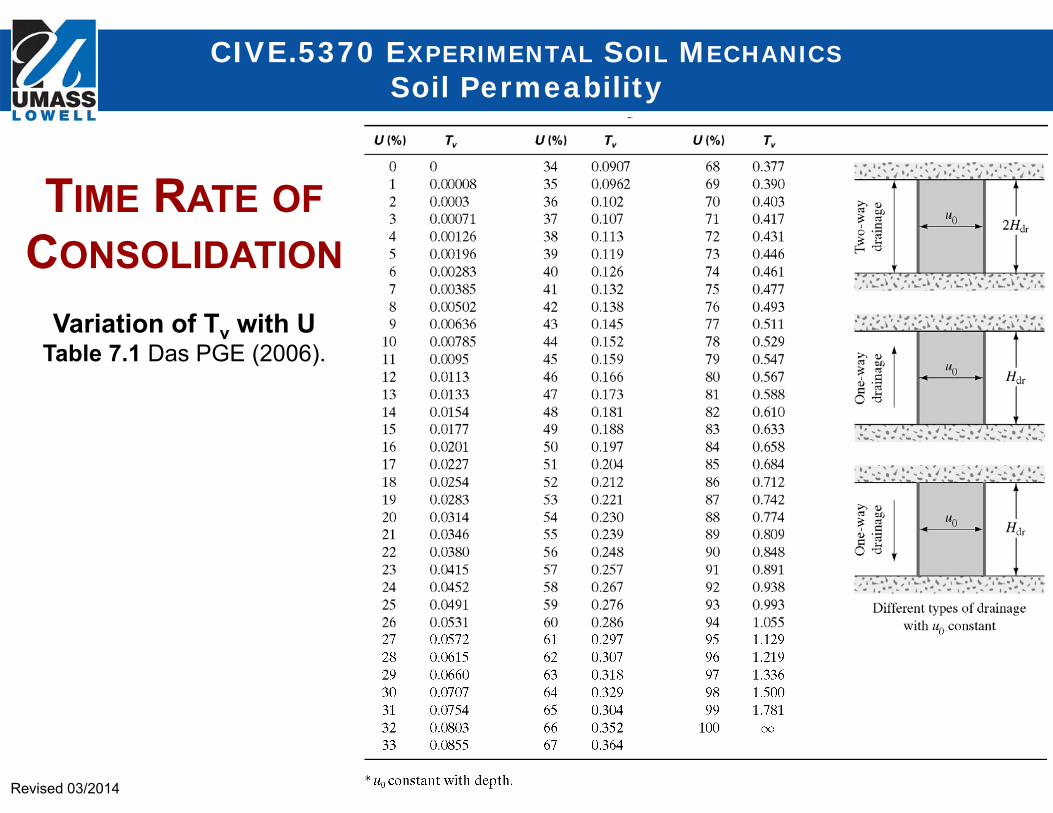
%)100log(933.0781.1100%
4
2
UTU
UTU
v
v
60%, For
60%, to 0% For
U can be approximated by thefollowing relationships:
TIME RATE OF CONSOLIDATION
Clay Layer Undergoing Consolidation
Figure 7.17a. Das FGE (2005).
Slide 45Revised 03/2014
CIVE.5370 EXPERIMENTAL SOIL MECHANICSSoil Permeability
Variation of Tv with UTable 7.1 Das PGE (2006).
TIME RATE OFCONSOLIDATION
Slide 46Revised 03/2014
CIVE.5370 EXPERIMENTAL SOIL MECHANICSSoil Permeability
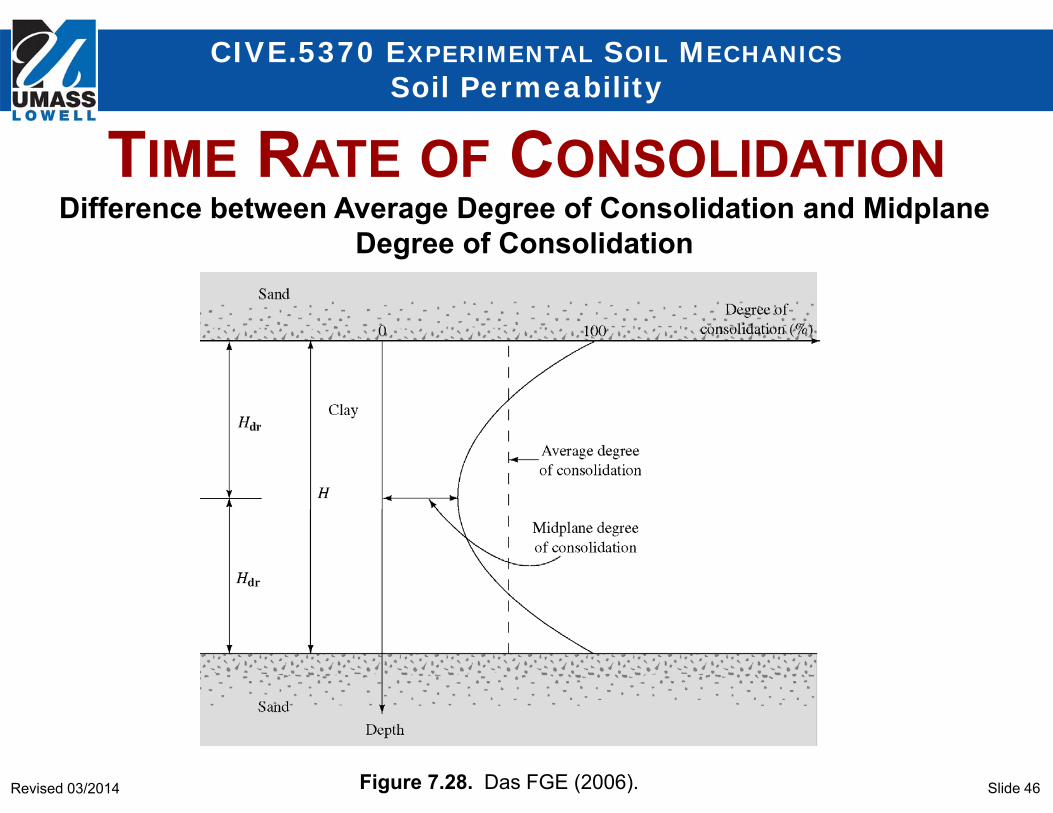
Difference between Average Degree of Consolidation and MidplaneDegree of Consolidation
Figure 7.28. Das FGE (2006).
TIME RATE OF CONSOLIDATION
Slide 47Revised 03/2014
CIVE.5370 EXPERIMENTAL SOIL MECHANICSSoil Permeability
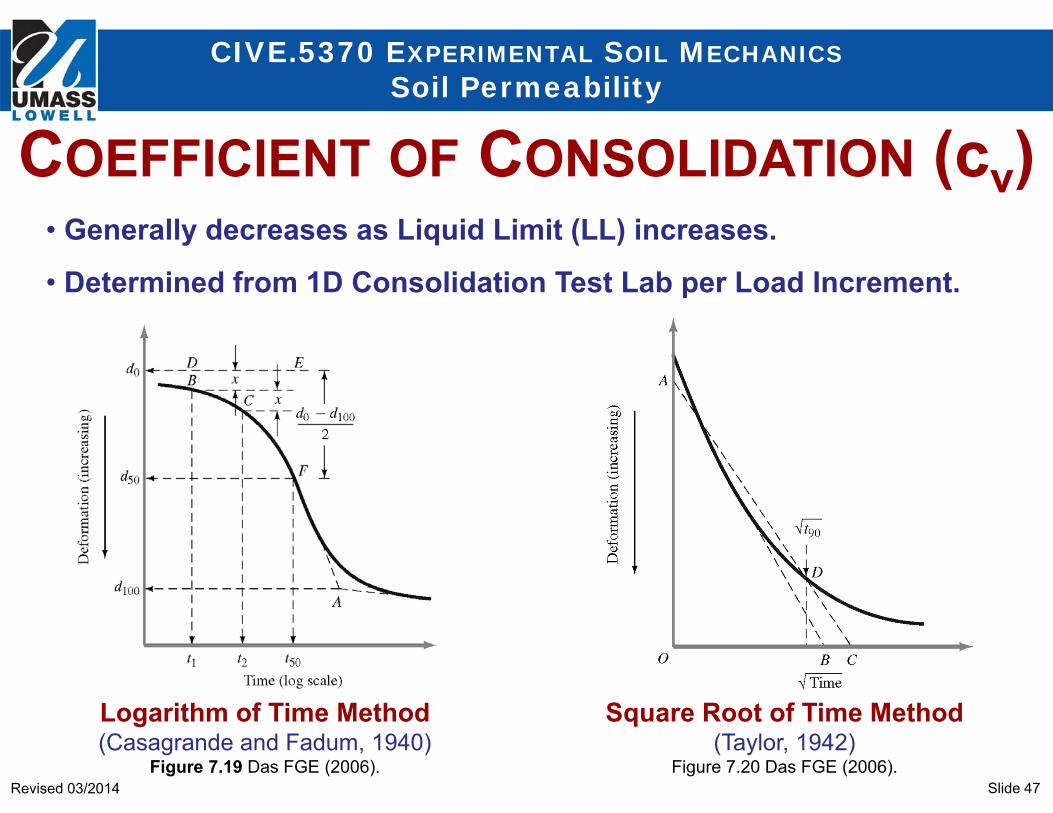
COEFFICIENT OF CONSOLIDATION (cv)• Generally decreases as Liquid Limit (LL) increases.
• Determined from 1D Consolidation Test Lab per Load Increment.
Logarithm of Time Method(Casagrande and Fadum, 1940)
Figure 7.19 Das FGE (2006).
Square Root of Time Method(Taylor, 1942)
Figure 7.20 Das FGE (2006).
Slide 48Revised 03/2014
CIVE.5370 EXPERIMENTAL SOIL MECHANICSSoil Permeability
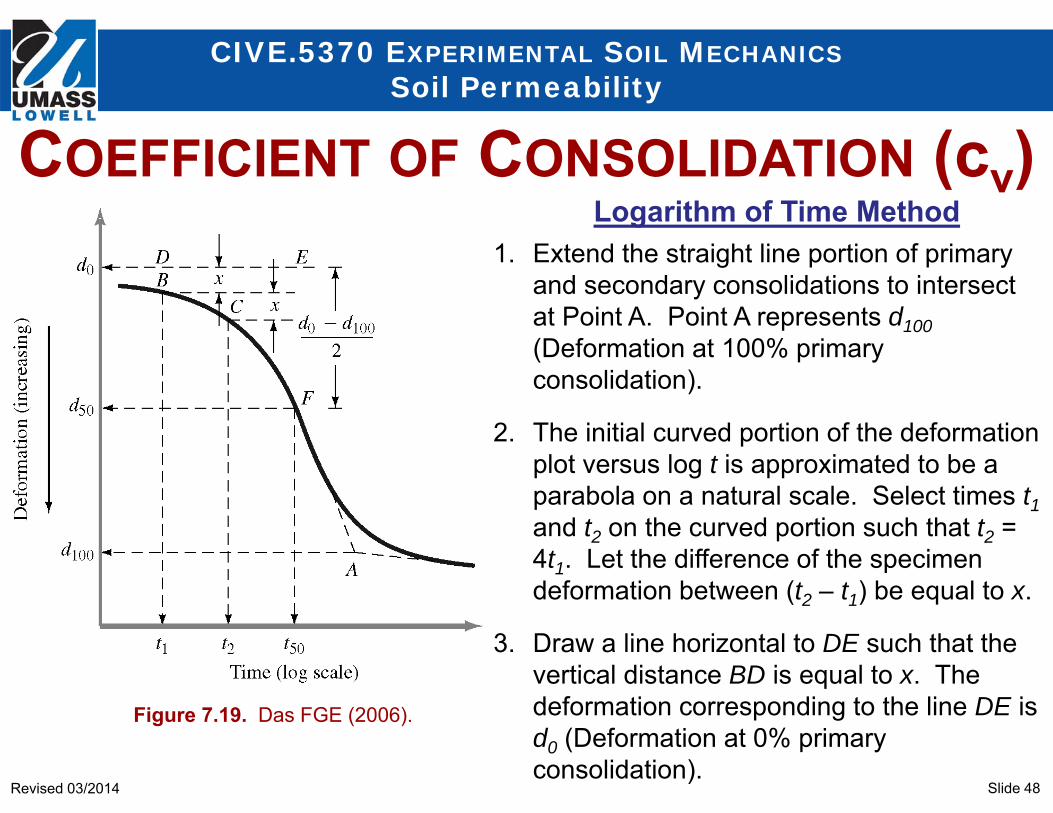
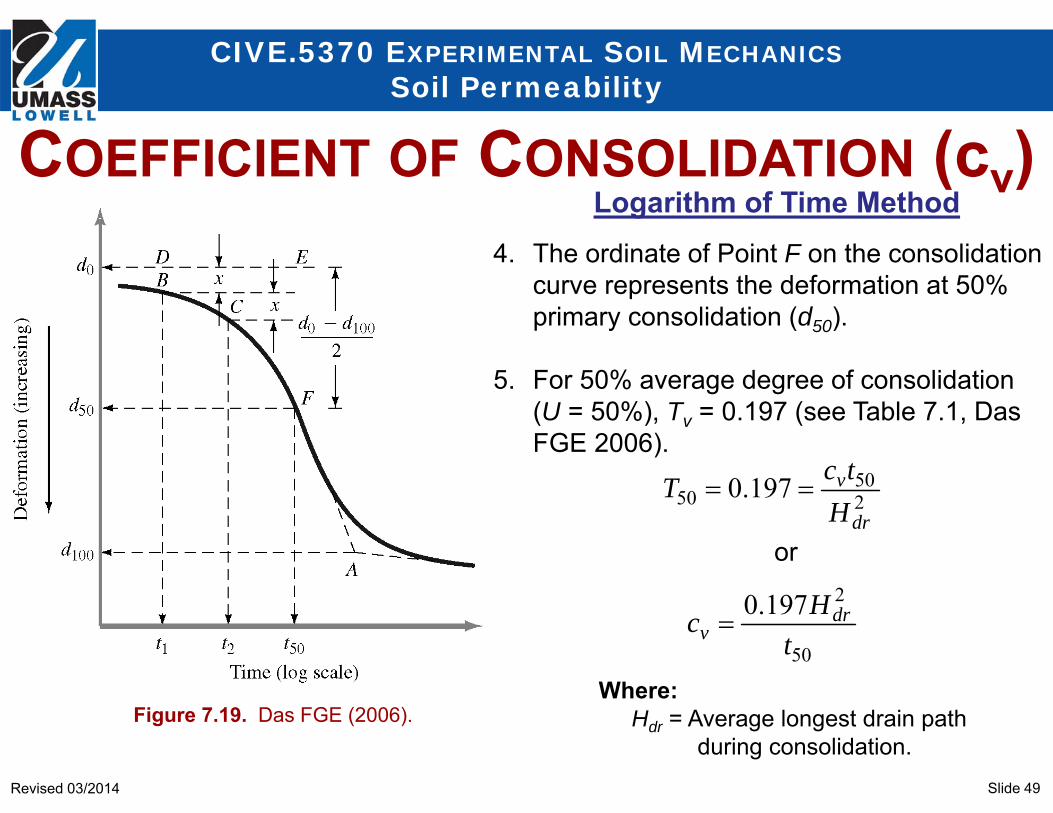
Figure 7.19. Das FGE (2006).
Logarithm of Time Method1. Extend the straight line portion of primary
and secondary consolidations to intersect at Point A. Point A represents d100(Deformation at 100% primary consolidation).
2. The initial curved portion of the deformation plot versus log t is approximated to be a parabola on a natural scale. Select times t1and t2 on the curved portion such that t2 = 4t1. Let the difference of the specimen deformation between (t2 – t1) be equal to x.
3. Draw a line horizontal to DE such that the vertical distance BD is equal to x. The deformation corresponding to the line DE is d0 (Deformation at 0% primary consolidation).
COEFFICIENT OF CONSOLIDATION (cv)
Slide 49Revised 03/2014
CIVE.5370 EXPERIMENTAL SOIL MECHANICSSoil Permeability
Logarithm of Time Method
50
2
250
50
197.0
197.0
tHc
HtcT
drv
dr
v
4. The ordinate of Point F on the consolidation curve represents the deformation at 50% primary consolidation (d50).
5. For 50% average degree of consolidation (U = 50%), Tv = 0.197 (see Table 7.1, Das FGE 2006).
or
Where:Hdr = Average longest drain path
during consolidation.Figure 7.19. Das FGE (2006).
COEFFICIENT OF CONSOLIDATION (cv)
Slide 50Revised 03/2014
CIVE.5370 EXPERIMENTAL SOIL MECHANICSSoil Permeability
0.01 0.1 1 10 100 1000 10000Time (min)
200
175
150
125
100
75
50
25
0
Dia
l Rea
ding
(x 0
.000
1 in
ch)
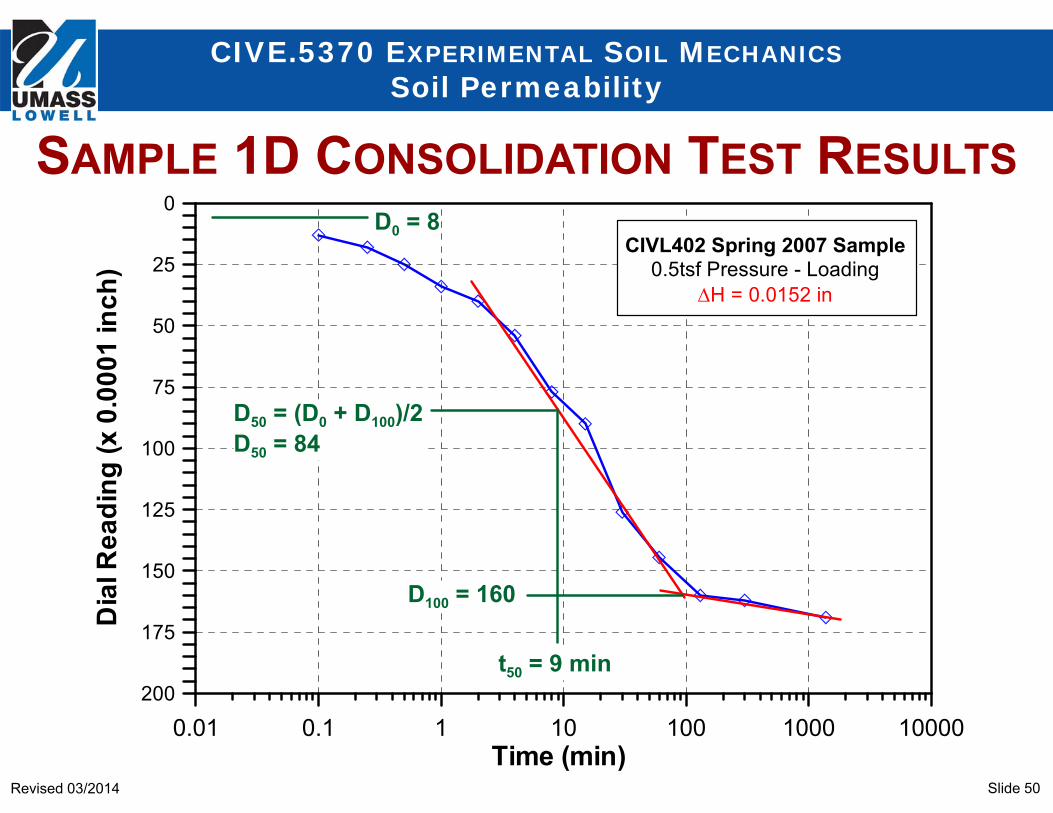
D0 = 8
D100 = 160
D50 = (D0 + D100)/2D50 = 84
t50 = 9 min
CIVL402 Spring 2007 Sample0.5tsf Pressure - Loading
H = 0.0152 in
SAMPLE 1D CONSOLIDATION TEST RESULTS
Slide 51Revised 03/2014
CIVE.5370 EXPERIMENTAL SOIL MECHANICSSoil Permeability
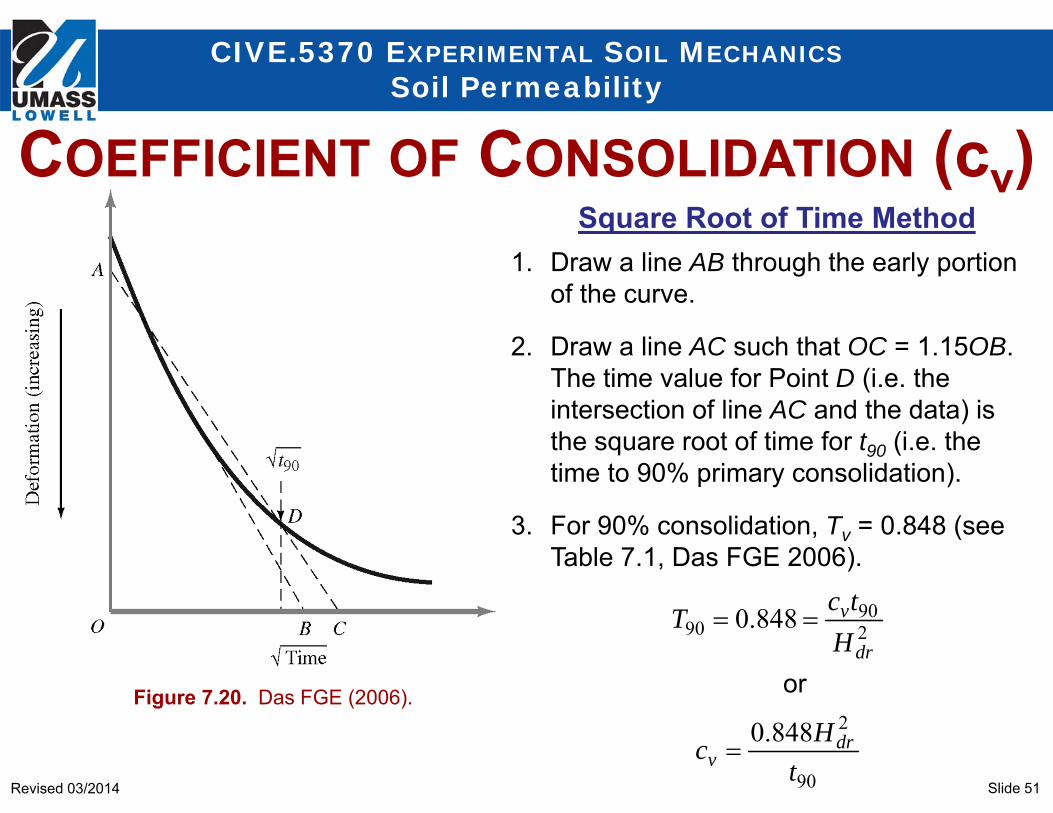
Figure 7.20. Das FGE (2006).
Square Root of Time Method1. Draw a line AB through the early portion
of the curve.
2. Draw a line AC such that OC = 1.15OB. The time value for Point D (i.e. the intersection of line AC and the data) is the square root of time for t90 (i.e. the time to 90% primary consolidation).
3. For 90% consolidation, Tv = 0.848 (see Table 7.1, Das FGE 2006).
90
2
290
90
848.0
848.0
tHc
HtcT
drv
dr
v
or
COEFFICIENT OF CONSOLIDATION (cv)