city of mesa transportation department- bicycle and
TRANSCRIPT
2015 City of Mesa Transportation Department- Bicycle and Pedestrian Program Customer Satisfaction Survey
1
City of Mesa Transportation Department- Bicycle and Pedestrian Program Customer Satisfaction Survey 2015
Intentionally Left Blank
2
City of Mesa Transportation Department- Bicycle and Pedestrian Program Customer Satisfaction Survey 2015
City of Mesa Transportation Department- Bicycle and Pedestrian Program Customer Satisfaction Survey A Report Based on Results of the Annual Bicycle and Pedestrian Program Survey Conducted During Bike Month 2015
Staff:
Lenny Hulme - Transportation Department Director Erik Guderian - Deputy Transportation Director Al Zubi - Transportation Planning Supervisor/Senior Transportation Engineer Mark Venti - Senior Transportation Engineer Jim Hash - Senior Planner (SA)/Bicycle and Pedestrian Program Coordinator Ashley Barinka - Marketing and Communications Specialist I
June 2015
3
City of Mesa Transportation Department- Bicycle and Pedestrian Program Customer Satisfaction Survey 2015
Table of Contents
Summary of Findings: ..................................................................................................... 4
Introduction ..................................................................................................................... 5
General Information......................................................................................................... 6
The Mesa Bike Map ........................................................................................................ 9
Bicycle Facilities and Improvements ............................................................................. 11
Bike Parking .................................................................................................................. 13
Commuting .................................................................................................................... 14
Walking ......................................................................................................................... 20
Appendices ................................................................................................................... 27
City of Mesa Transportation Department- Bicycle and Pedestrian Program Customer Satisfaction Survey........................................................................................................ 28
Individual Reponses ...................................................................................................... 40
4
City of Mesa Transportation Department- Bicycle and Pedestrian Program Customer Satisfaction Survey 2015
Summary of Findings:
1. Most cyclists ride for recreation.
2. Most cyclists wear a helmet.
3. Most cyclists are not aware of the Mesa Bike Map.
4. Most cyclists are unaware of Mesa’s education programs.
5. When riding on the street, the majority of riders prefer streets with bike lanes that are separated from automobile traffic.
6. Cyclists rank bike lanes with buffers and greenways as the most important designs to be implemented.
7. Majority of cyclists want more bike parking racks.
8. The most common reason that non-commuting cyclists do not commute by bike is because of driver behavior.
9. The most common reason commuter cyclists do commute by bike is because it is healthy/good exercise and because it is good for the environment.
10. Bicycle commuters in Mesa have been commuting by bike for 1-5 years.
11. Commuting cyclists most often encounter problems with vehicles not sharing the roadway and conflicts with right turning vehicles.
12. The majority of commuters ride round trip three or more times per week.
13. Few bicycle commuters connect with other modes of transportation to
reach their destination.
14. Majority of people that walk do so for exercise/leisure and health.
15. Majority of people feel safe while walking in Mesa.
16. Sixty nine percent of people would like to see more lighting along routes and better connectivity.
5
City of Mesa Transportation Department- Bicycle and Pedestrian Program Customer Satisfaction Survey 2015
Introduction The City of Mesa Transportation Department - Bicycle and Pedestrian Program created and implemented the program’s Customer Satisfaction Survey for Valley Bike Month 2015. This report presents major findings of the online survey and their implications for the bicycle and pedestrian program in the City. The survey, an annual sampling of residents in Mesa, is twofold: to promote bicycling and walking as a viable, healthy, and affordable form of transportation in Mesa; and to collect data and public feedback from Mesa residents about bicycle and pedestrian infrastructure and programs. The City of Mesa Transportation Department - Bicycle and Pedestrian Program Customer Satisfaction Survey builds on previous research and data collected during the writing of the 2012 City of Mesa Bicycle Master Plan. The 2012 City of Mesa Bicycle Master Plan was a comprehensive and collaborative effort that was designed to evaluate what was currently in place and working well, as well as what improvements were needed to propel Mesa towards Bicycle Friendly Community Platinum status with the League of American Bicyclists. The Customer Satisfaction Survey was posted online starting April 1, 2015. The survey was active for the entire month of April. A total of 178 people took the survey. The survey was designed to ask a wide array of questions in order to gather information from cyclists and walkers about their age, gender, confidence level, reasons for or for not riding or walking, preference to the type of facility that was preferred, commutation patterns, etc. (The complete survey is available in the appendix.) The responses were compiled and analyzed and are presented graphically in this document with descriptive analysis. The survey was not intended to be a rigorous mathematical or scientifically correct study, but simply a tool suggesting trends and an overall profile of the cycling and walking community, as well as key issues for future planning.
6
City of Mesa Transportation Department- Bicycle and Pedestrian Program Customer Satisfaction Survey 2015
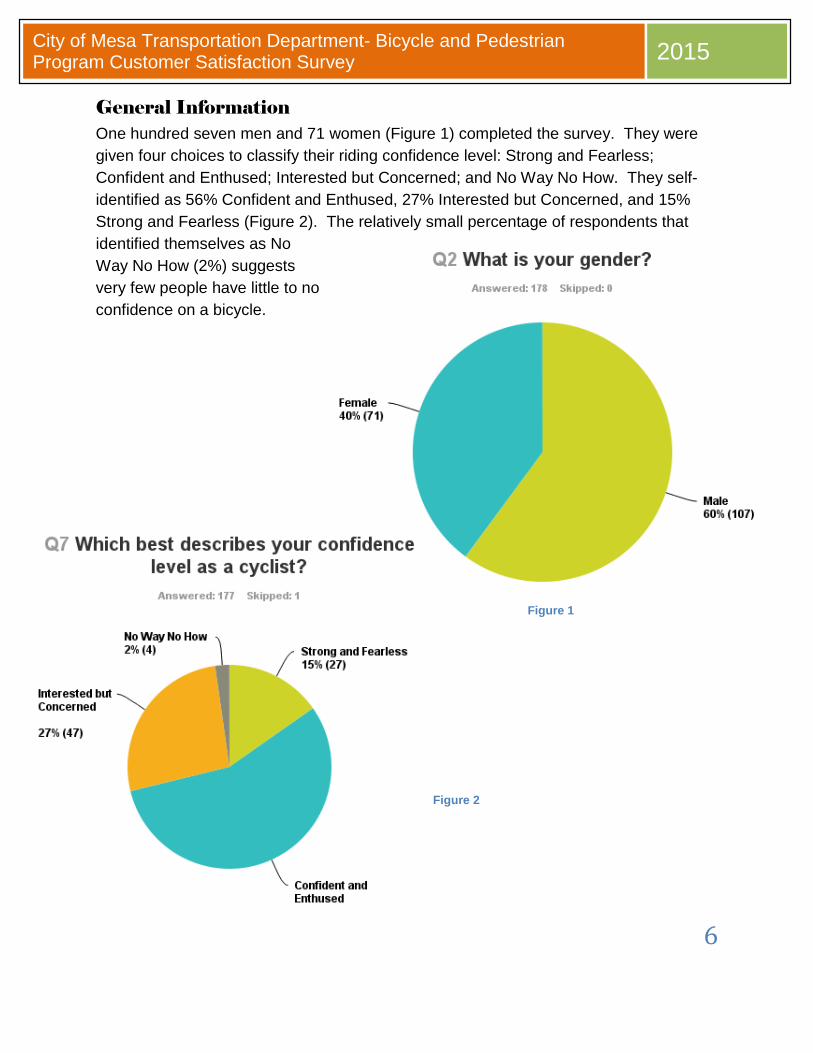
General Information One hundred seven men and 71 women (Figure 1) completed the survey. They were given four choices to classify their riding confidence level: Strong and Fearless; Confident and Enthused; Interested but Concerned; and No Way No How. They self-identified as 56% Confident and Enthused, 27% Interested but Concerned, and 15% Strong and Fearless (Figure 2). The relatively small percentage of respondents that identified themselves as No Way No How (2%) suggests very few people have little to no confidence on a bicycle.
Figure 1
Figure 2
7
City of Mesa Transportation Department- Bicycle and Pedestrian Program Customer Satisfaction Survey 2015
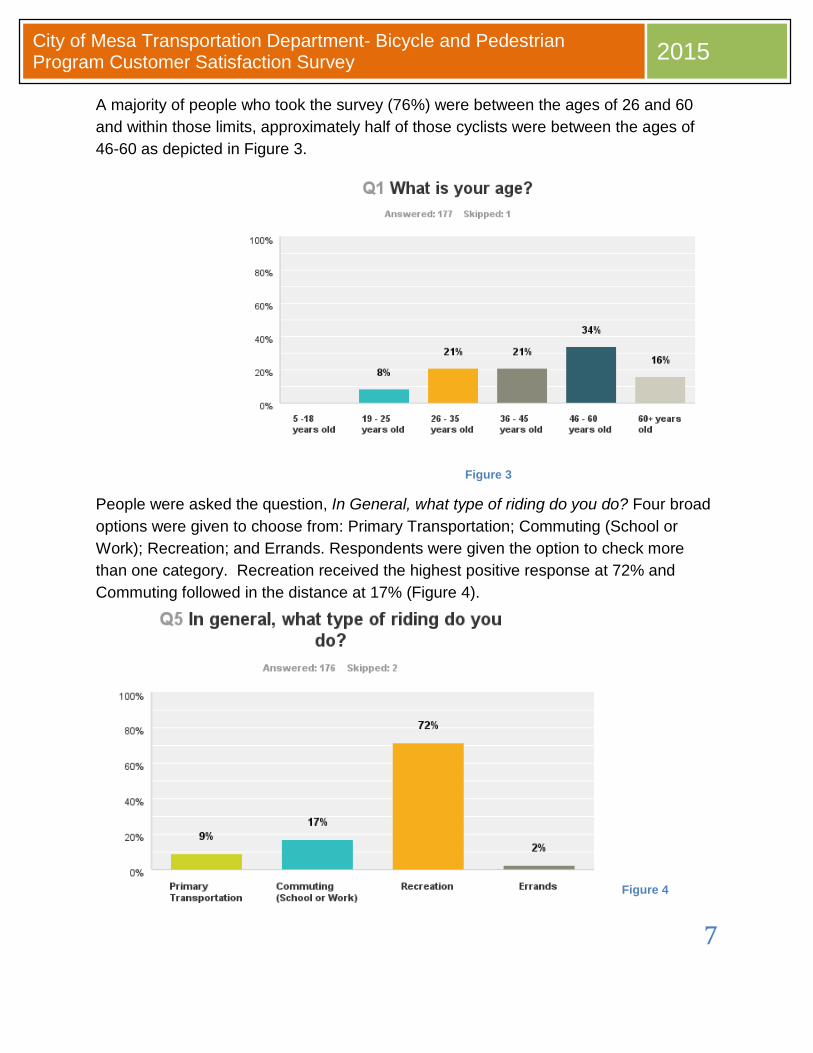
A majority of people who took the survey (76%) were between the ages of 26 and 60 and within those limits, approximately half of those cyclists were between the ages of 46-60 as depicted in Figure 3.
Figure 3
People were asked the question, In General, what type of riding do you do? Four broad options were given to choose from: Primary Transportation; Commuting (School or Work); Recreation; and Errands. Respondents were given the option to check more than one category. Recreation received the highest positive response at 72% and Commuting followed in the distance at 17% (Figure 4).
Figure 4
8
City of Mesa Transportation Department- Bicycle and Pedestrian Program Customer Satisfaction Survey 2015
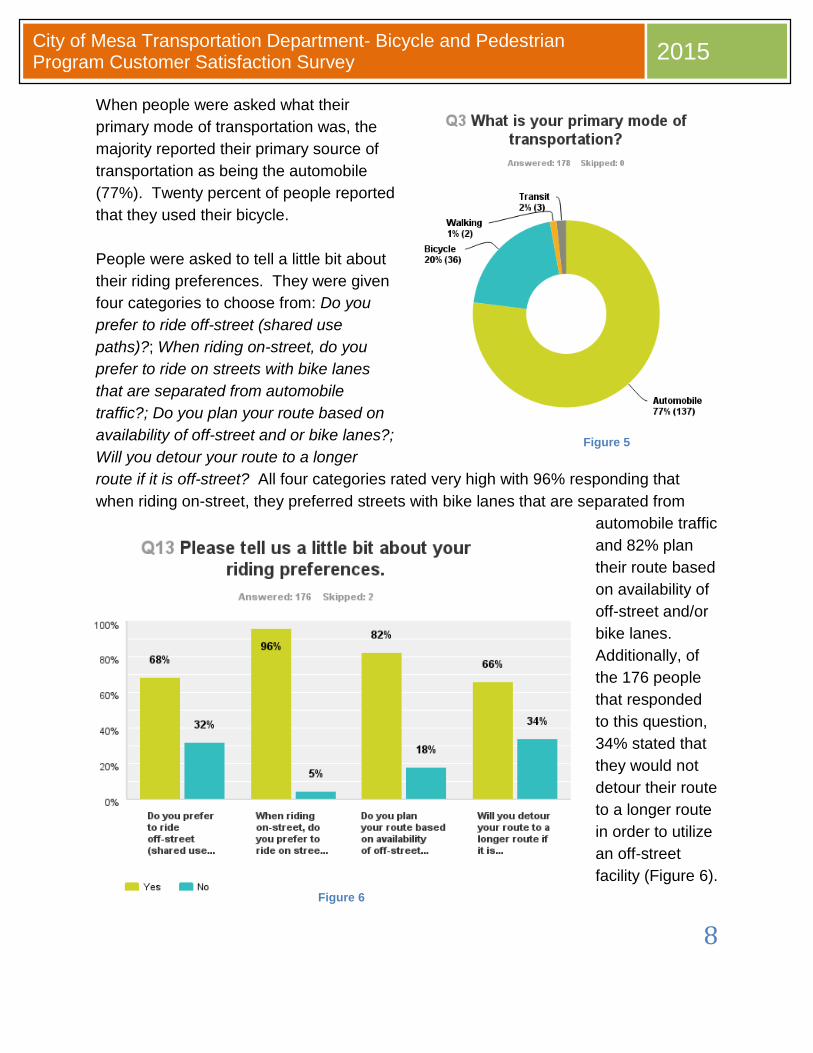
When people were asked what their primary mode of transportation was, the majority reported their primary source of transportation as being the automobile (77%). Twenty percent of people reported that they used their bicycle. People were asked to tell a little bit about their riding preferences. They were given four categories to choose from: Do you prefer to ride off-street (shared use paths)?; When riding on-street, do you prefer to ride on streets with bike lanes that are separated from automobile traffic?; Do you plan your route based on availability of off-street and or bike lanes?; Will you detour your route to a longer route if it is off-street? All four categories rated very high with 96% responding that when riding on-street, they preferred streets with bike lanes that are separated from
automobile traffic and 82% plan their route based on availability of off-street and/or bike lanes. Additionally, of the 176 people that responded to this question, 34% stated that they would not detour their route to a longer route in order to utilize an off-street facility (Figure 6).
Figure 5
Figure 6
9
City of Mesa Transportation Department- Bicycle and Pedestrian Program Customer Satisfaction Survey 2015
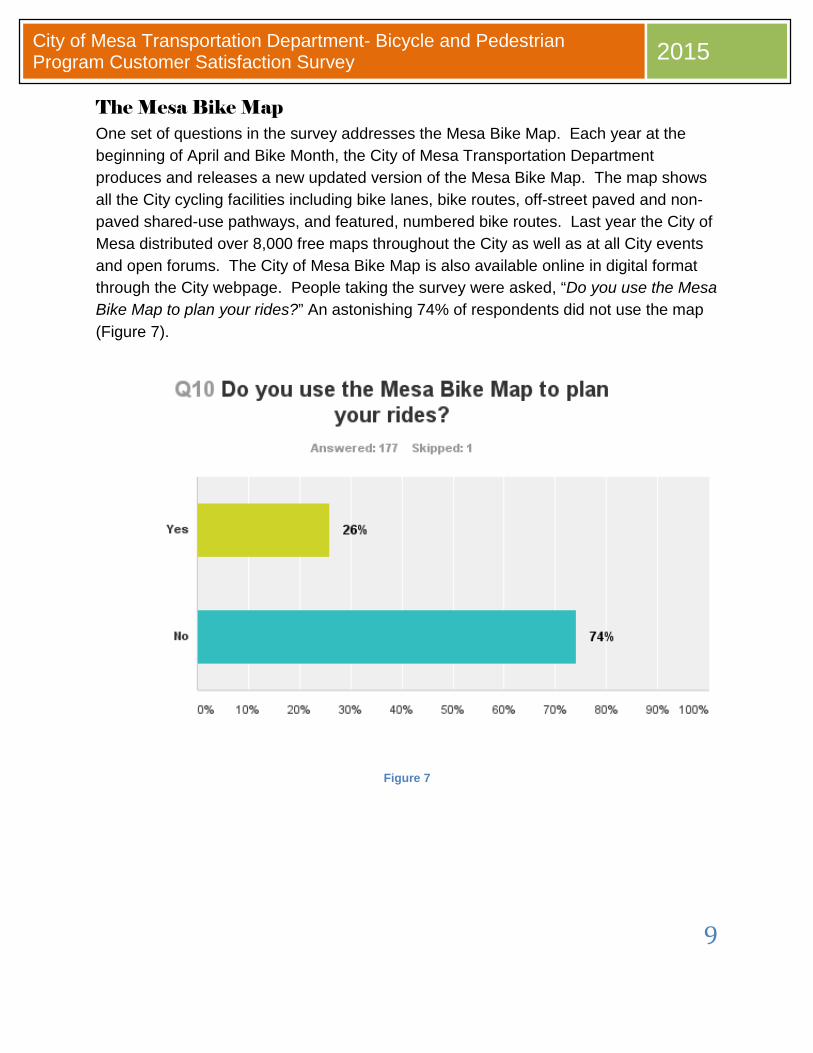
The Mesa Bike Map One set of questions in the survey addresses the Mesa Bike Map. Each year at the beginning of April and Bike Month, the City of Mesa Transportation Department produces and releases a new updated version of the Mesa Bike Map. The map shows all the City cycling facilities including bike lanes, bike routes, off-street paved and non-paved shared-use pathways, and featured, numbered bike routes. Last year the City of Mesa distributed over 8,000 free maps throughout the City as well as at all City events and open forums. The City of Mesa Bike Map is also available online in digital format through the City webpage. People taking the survey were asked, “Do you use the Mesa Bike Map to plan your rides?” An astonishing 74% of respondents did not use the map (Figure 7).
Figure 7
10
City of Mesa Transportation Department- Bicycle and Pedestrian Program Customer Satisfaction Survey 2015
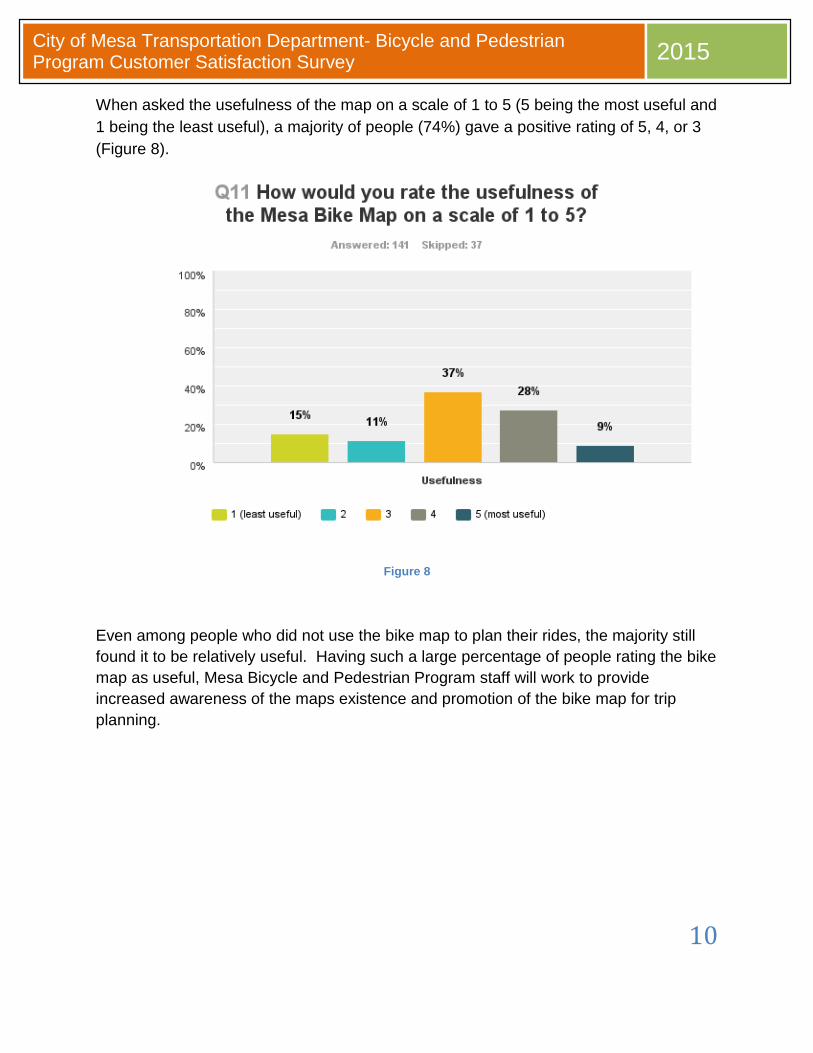
When asked the usefulness of the map on a scale of 1 to 5 (5 being the most useful and 1 being the least useful), a majority of people (74%) gave a positive rating of 5, 4, or 3 (Figure 8).
Figure 8
Even among people who did not use the bike map to plan their rides, the majority still found it to be relatively useful. Having such a large percentage of people rating the bike map as useful, Mesa Bicycle and Pedestrian Program staff will work to provide increased awareness of the maps existence and promotion of the bike map for trip planning.
11
City of Mesa Transportation Department- Bicycle and Pedestrian Program Customer Satisfaction Survey 2015
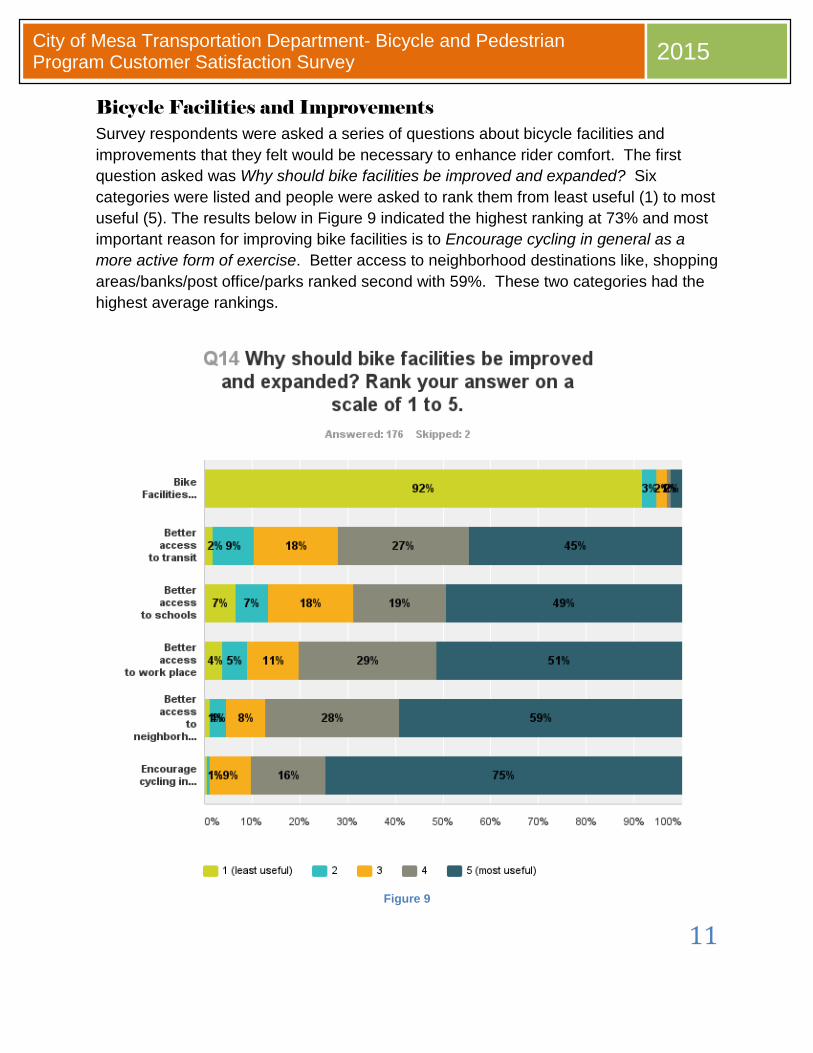
Bicycle Facilities and Improvements Survey respondents were asked a series of questions about bicycle facilities and improvements that they felt would be necessary to enhance rider comfort. The first question asked was Why should bike facilities be improved and expanded? Six categories were listed and people were asked to rank them from least useful (1) to most useful (5). The results below in Figure 9 indicated the highest ranking at 73% and most important reason for improving bike facilities is to Encourage cycling in general as a more active form of exercise. Better access to neighborhood destinations like, shopping areas/banks/post office/parks ranked second with 59%. These two categories had the highest average rankings.
Figure 9
12
City of Mesa Transportation Department- Bicycle and Pedestrian Program Customer Satisfaction Survey 2015
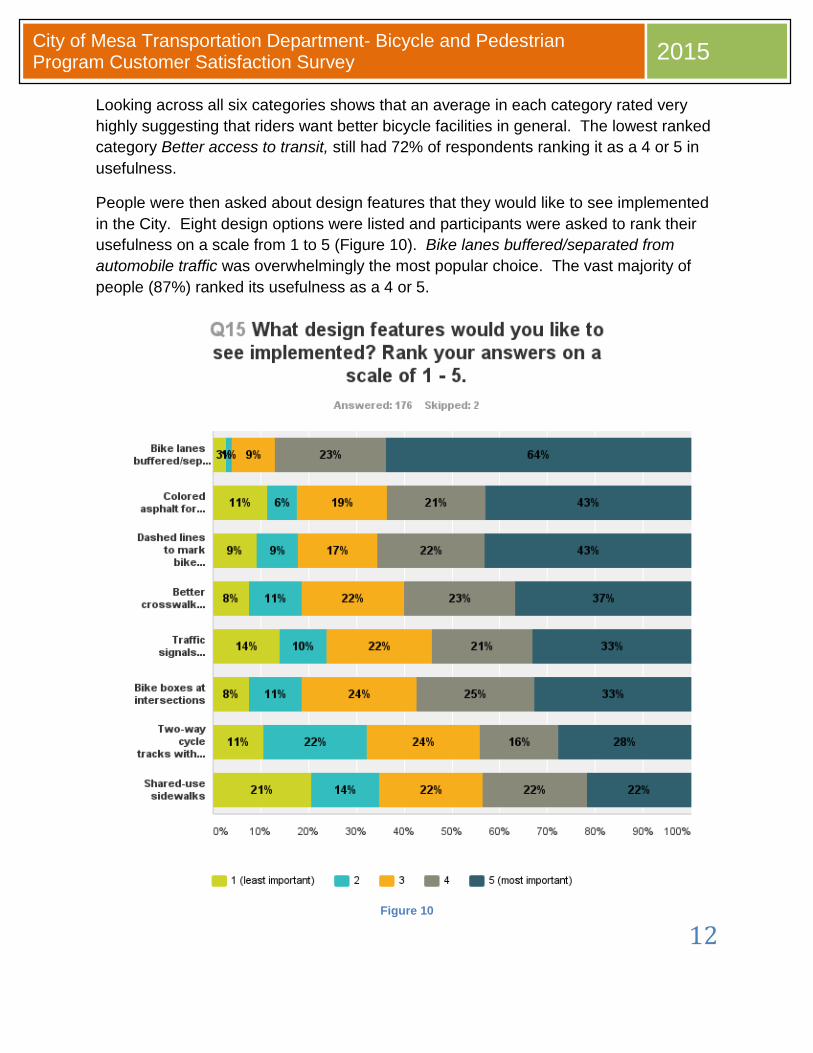
Looking across all six categories shows that an average in each category rated very highly suggesting that riders want better bicycle facilities in general. The lowest ranked category Better access to transit, still had 72% of respondents ranking it as a 4 or 5 in usefulness.
People were then asked about design features that they would like to see implemented in the City. Eight design options were listed and participants were asked to rank their usefulness on a scale from 1 to 5 (Figure 10). Bike lanes buffered/separated from automobile traffic was overwhelmingly the most popular choice. The vast majority of people (87%) ranked its usefulness as a 4 or 5.
Figure 10
13
City of Mesa Transportation Department- Bicycle and Pedestrian Program Customer Satisfaction Survey 2015
A combined 65% gave Dashed lines to mark bike lanes through intersections a usefulness of 4 or 5, and 64% gave Colored asphalt for designated bike lanes a usefulness ranking of 4 or 5. Taken together, the very high ranking of all of these features suggests that Mesa’s bicycling residents are decidedly interested in demarcation, differentiated, or otherwise dedicated bike lanes along roadways. Being that all of the categories listed in Figure 10 scored well is a strong indicator that there is a general need for all of these types of bicycle facilities.
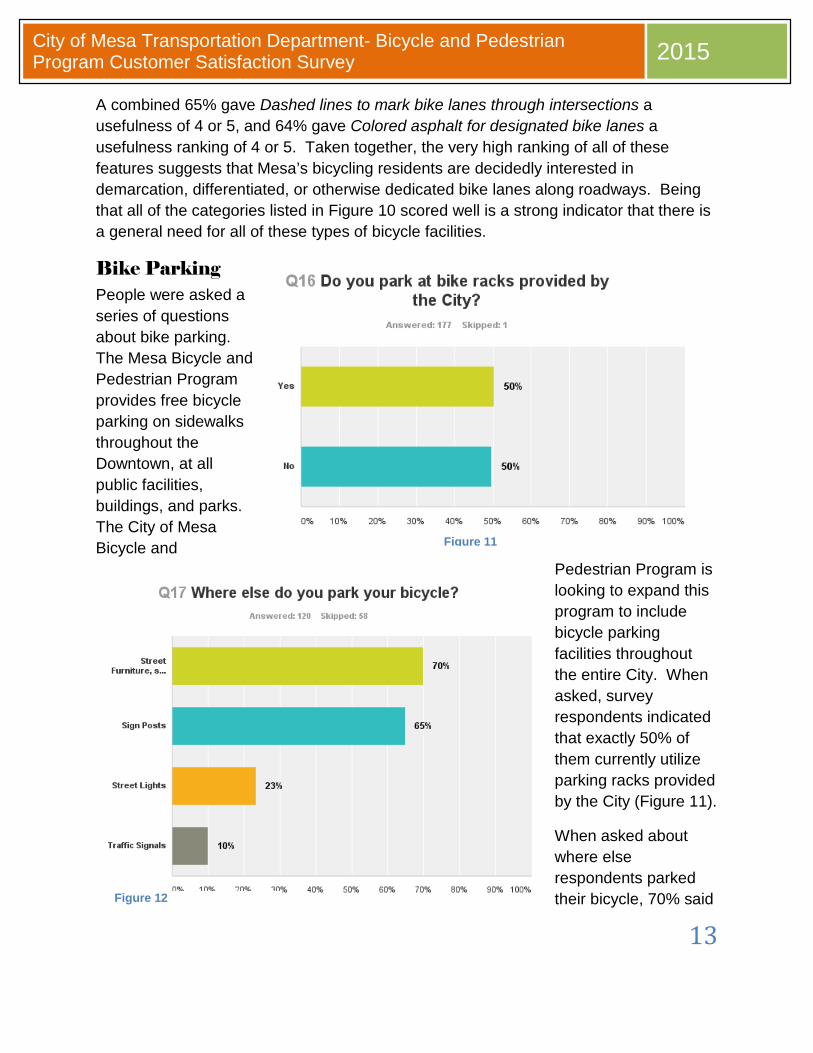
Bike Parking People were asked a series of questions about bike parking. The Mesa Bicycle and Pedestrian Program provides free bicycle parking on sidewalks throughout the Downtown, at all public facilities, buildings, and parks. The City of Mesa Bicycle and
Pedestrian Program is looking to expand this program to include bicycle parking facilities throughout the entire City. When asked, survey respondents indicated that exactly 50% of them currently utilize parking racks provided by the City (Figure 11).
When asked about where else respondents parked their bicycle, 70% said
Figure 11
Figure 12
14
City of Mesa Transportation Department- Bicycle and Pedestrian Program Customer Satisfaction Survey 2015
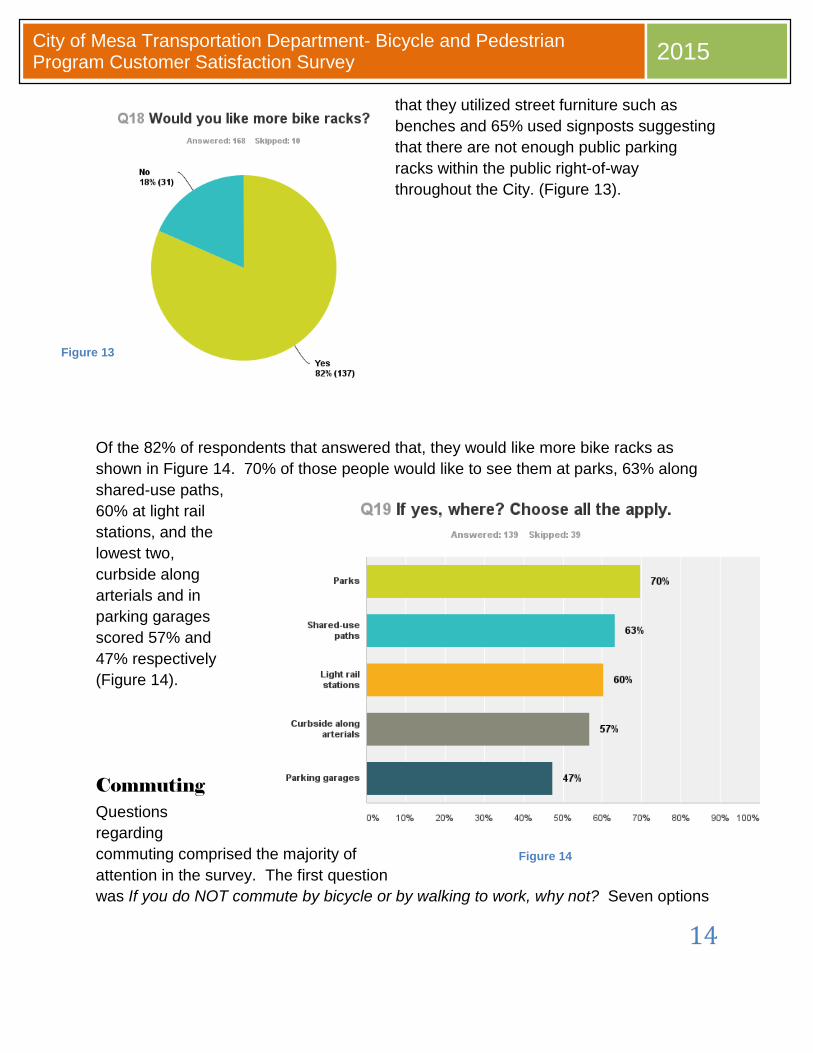
that they utilized street furniture such as benches and 65% used signposts suggesting that there are not enough public parking racks within the public right-of-way throughout the City. (Figure 13).
Of the 82% of respondents that answered that, they would like more bike racks as shown in Figure 14. 70% of those people would like to see them at parks, 63% along shared-use paths, 60% at light rail stations, and the lowest two, curbside along arterials and in parking garages scored 57% and 47% respectively (Figure 14).
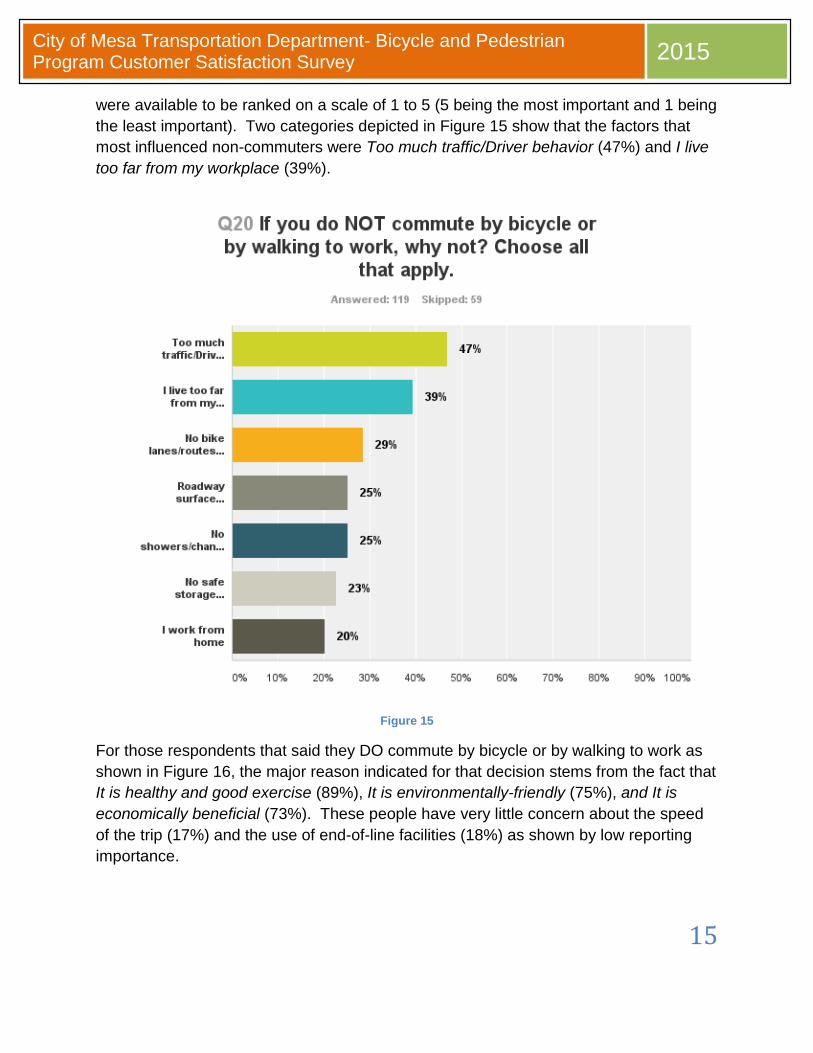
Commuting Questions regarding commuting comprised the majority of attention in the survey. The first question was If you do NOT commute by bicycle or by walking to work, why not? Seven options
Figure 13
Figure 14
15
City of Mesa Transportation Department- Bicycle and Pedestrian Program Customer Satisfaction Survey 2015
were available to be ranked on a scale of 1 to 5 (5 being the most important and 1 being the least important). Two categories depicted in Figure 15 show that the factors that most influenced non-commuters were Too much traffic/Driver behavior (47%) and I live too far from my workplace (39%).
Figure 15
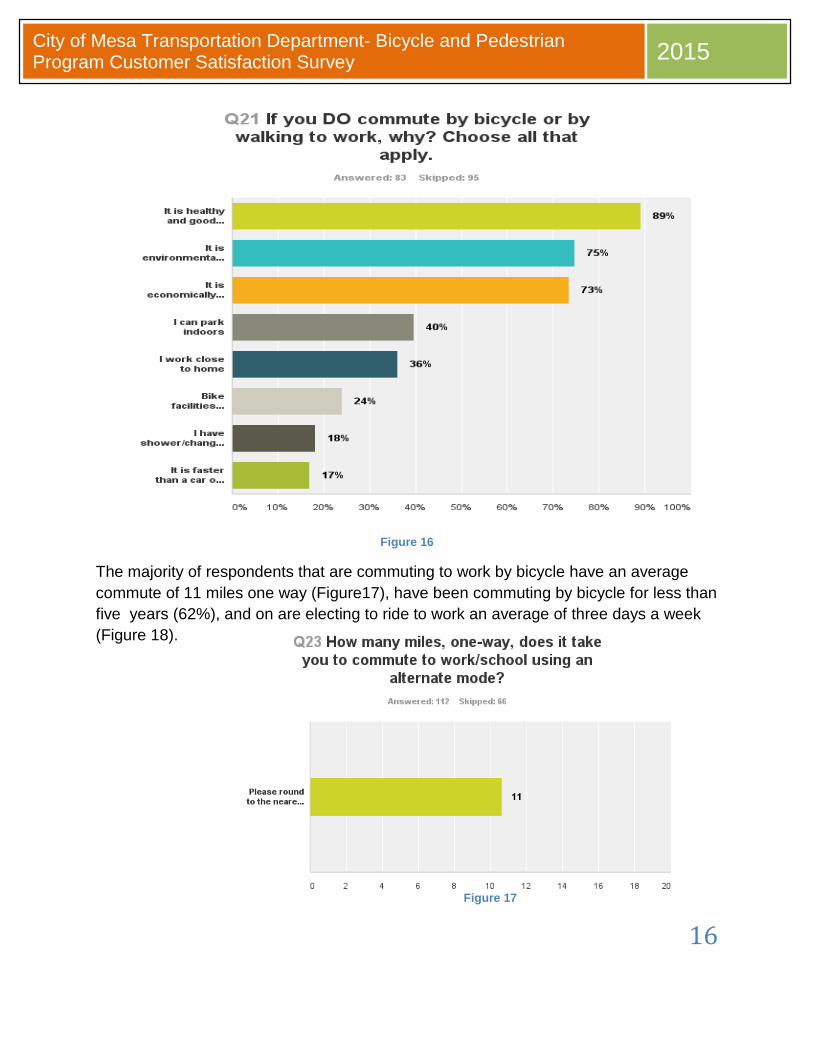
For those respondents that said they DO commute by bicycle or by walking to work as shown in Figure 16, the major reason indicated for that decision stems from the fact that It is healthy and good exercise (89%), It is environmentally-friendly (75%), and It is economically beneficial (73%). These people have very little concern about the speed of the trip (17%) and the use of end-of-line facilities (18%) as shown by low reporting importance.
16
City of Mesa Transportation Department- Bicycle and Pedestrian Program Customer Satisfaction Survey 2015
Figure 16
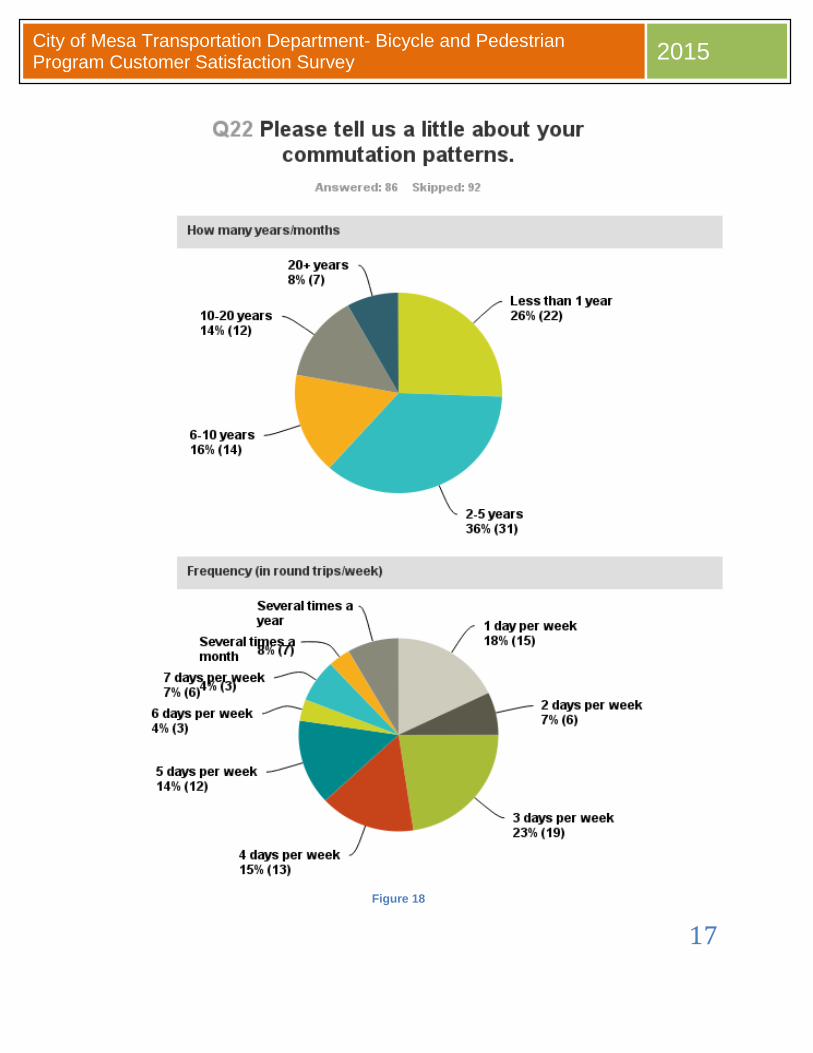
The majority of respondents that are commuting to work by bicycle have an average commute of 11 miles one way (Figure17), have been commuting by bicycle for less than five years (62%), and on are electing to ride to work an average of three days a week (Figure 18).
Figure 17
17
City of Mesa Transportation Department- Bicycle and Pedestrian Program Customer Satisfaction Survey 2015
Figure 18
18
City of Mesa Transportation Department- Bicycle and Pedestrian Program Customer Satisfaction Survey 2015
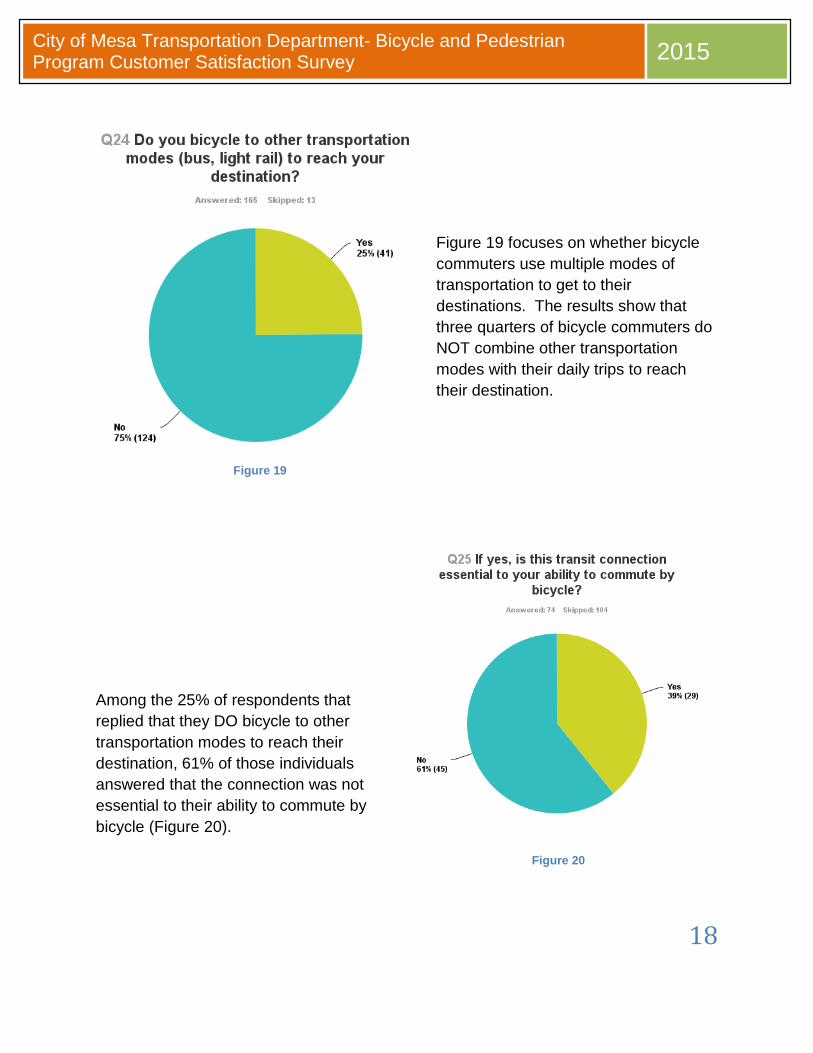
Figure 19 focuses on whether bicycle commuters use multiple modes of transportation to get to their destinations. The results show that three quarters of bicycle commuters do NOT combine other transportation modes with their daily trips to reach their destination.
Among the 25% of respondents that replied that they DO bicycle to other transportation modes to reach their destination, 61% of those individuals answered that the connection was not essential to their ability to commute by bicycle (Figure 20).
Figure 19
Figure 20
19
City of Mesa Transportation Department- Bicycle and Pedestrian Program Customer Satisfaction Survey 2015
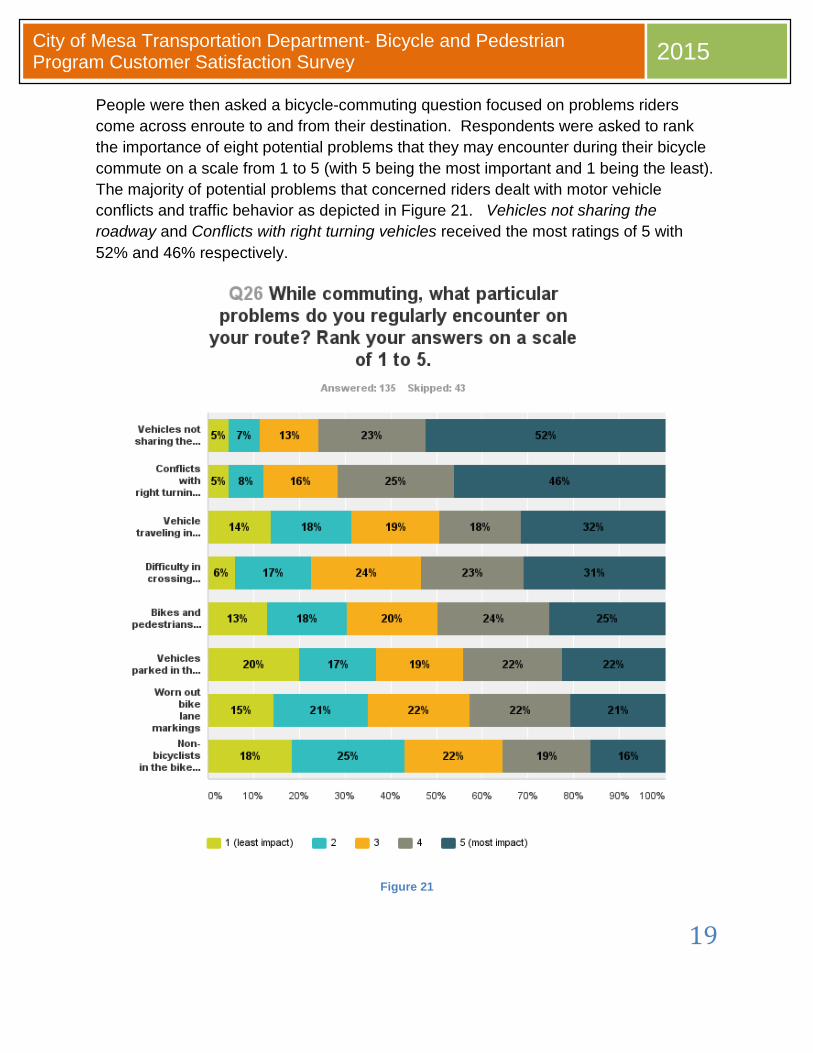
People were then asked a bicycle-commuting question focused on problems riders come across enroute to and from their destination. Respondents were asked to rank the importance of eight potential problems that they may encounter during their bicycle commute on a scale from 1 to 5 (with 5 being the most important and 1 being the least). The majority of potential problems that concerned riders dealt with motor vehicle conflicts and traffic behavior as depicted in Figure 21. Vehicles not sharing the roadway and Conflicts with right turning vehicles received the most ratings of 5 with 52% and 46% respectively.
Figure 21
20
City of Mesa Transportation Department- Bicycle and Pedestrian Program Customer Satisfaction Survey 2015
Vehicles traveling in the bike lane and Difficulty in crossing intersections, both of which are automobile-related issues were next with 32% and 31%.
These findings are consistent with data presented in Figure 15 regarding the reason why respondents do not commute. Figure 15 shows that the category with the highest response percentage at 47% was: Too much traffic/Driver behavior. For both the commuter cyclists and cyclists that choose not to commute by bike, cooperation and coordination with motor vehicle drivers and the roadway system is vital to encouraging increased biking.
Walking Respondents were asked about their walking behavior and consistency. The walking resident in Mesa is essentially to the roadway network what the canary is to the coalmine. Pedestrians are a fragile species and require four main components to favor a walk over another mode of transportation. For a walk to be favored over another mode of transportation it must be: Useful, Safe, Comfortable, and Interesting.
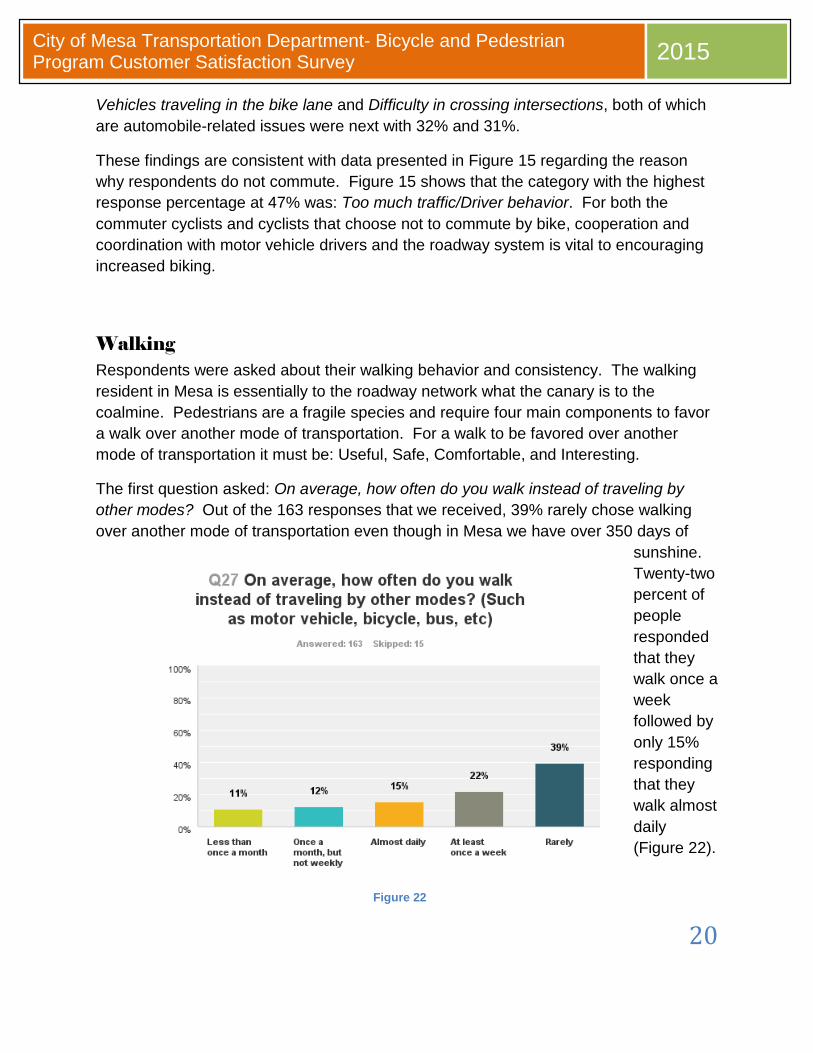
The first question asked: On average, how often do you walk instead of traveling by other modes? Out of the 163 responses that we received, 39% rarely chose walking over another mode of transportation even though in Mesa we have over 350 days of
sunshine. Twenty-two percent of people responded that they walk once a week followed by only 15% responding that they walk almost daily (Figure 22).
Figure 22
21
City of Mesa Transportation Department- Bicycle and Pedestrian Program Customer Satisfaction Survey 2015
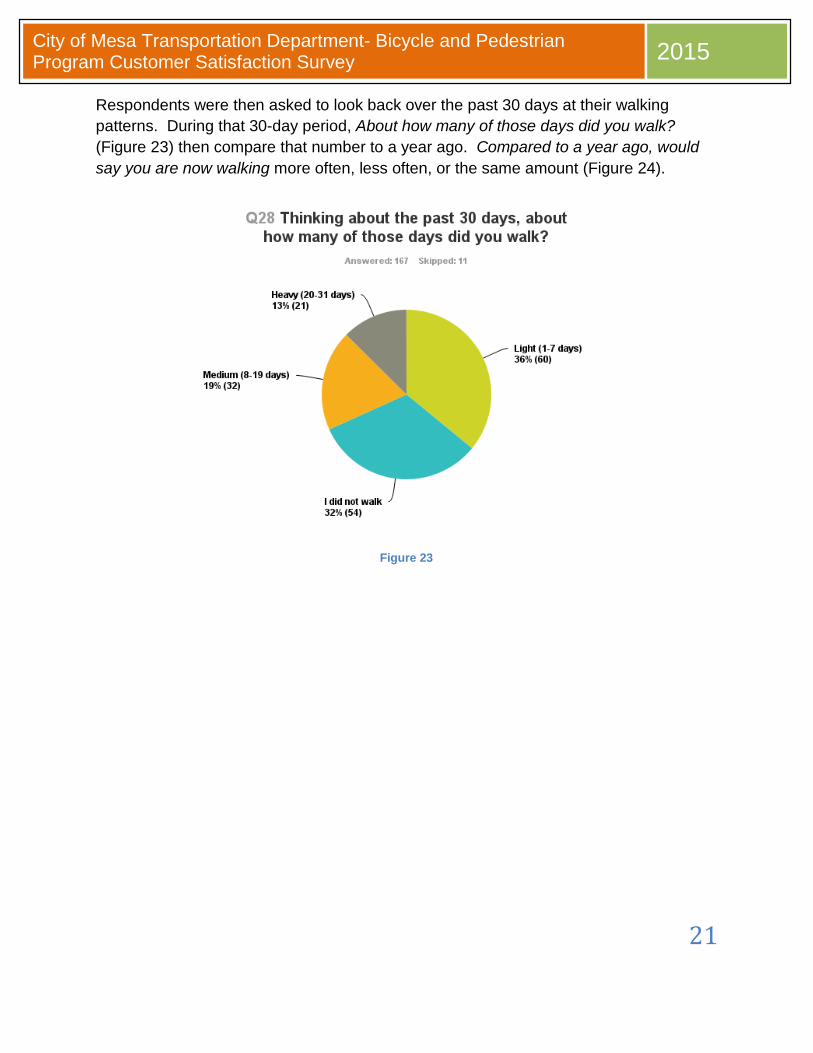
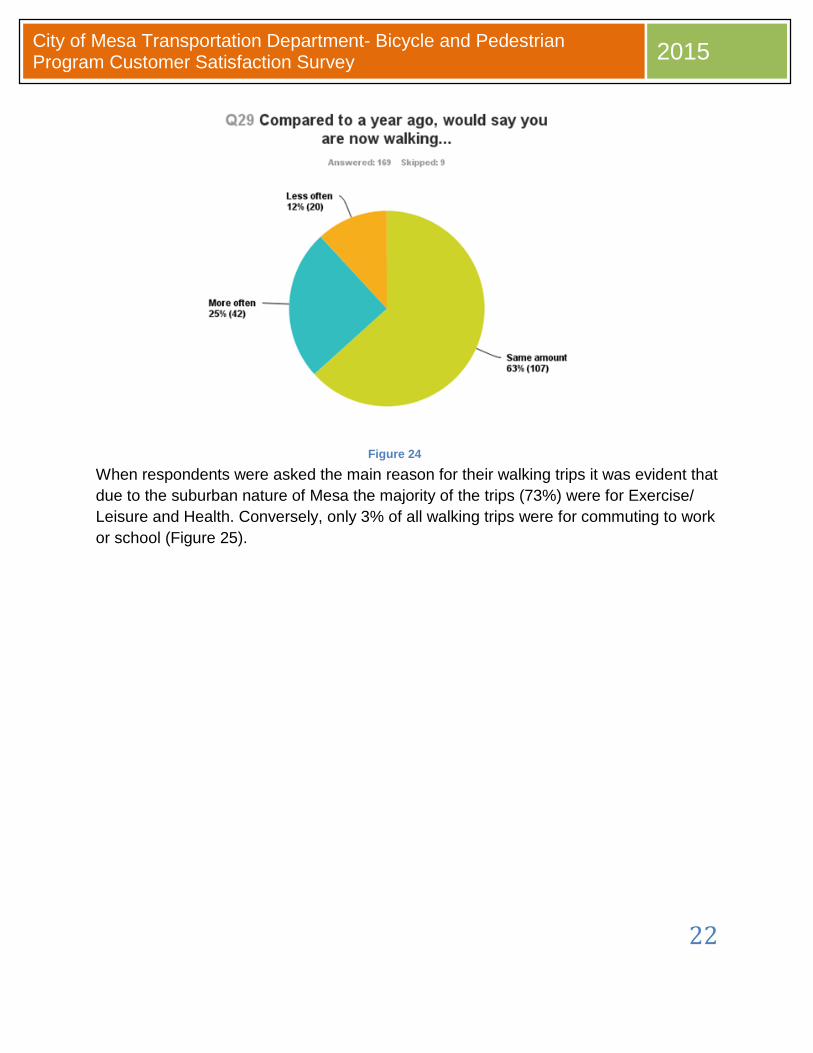
Respondents were then asked to look back over the past 30 days at their walking patterns. During that 30-day period, About how many of those days did you walk? (Figure 23) then compare that number to a year ago. Compared to a year ago, would say you are now walking more often, less often, or the same amount (Figure 24).
Figure 23
22
City of Mesa Transportation Department- Bicycle and Pedestrian Program Customer Satisfaction Survey 2015
Figure 24
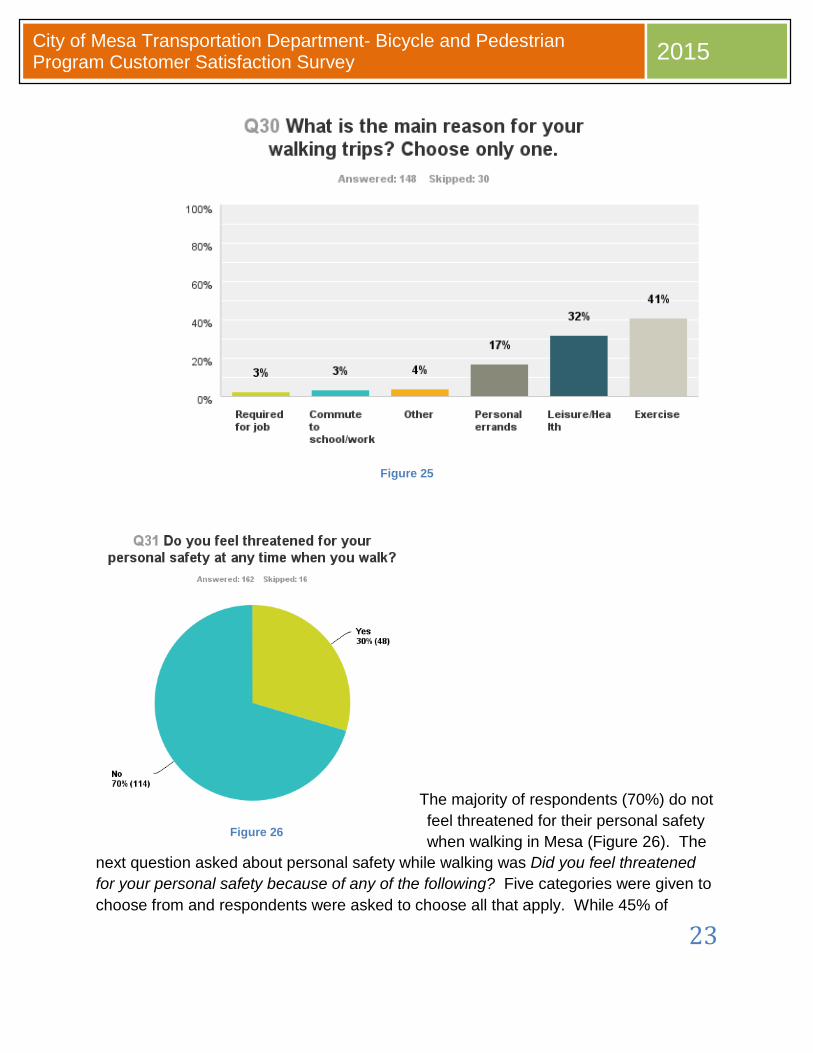
When respondents were asked the main reason for their walking trips it was evident that due to the suburban nature of Mesa the majority of the trips (73%) were for Exercise/ Leisure and Health. Conversely, only 3% of all walking trips were for commuting to work or school (Figure 25).
23
City of Mesa Transportation Department- Bicycle and Pedestrian Program Customer Satisfaction Survey 2015
Figure 25
The majority of respondents (70%) do not feel threatened for their personal safety when walking in Mesa (Figure 26). The
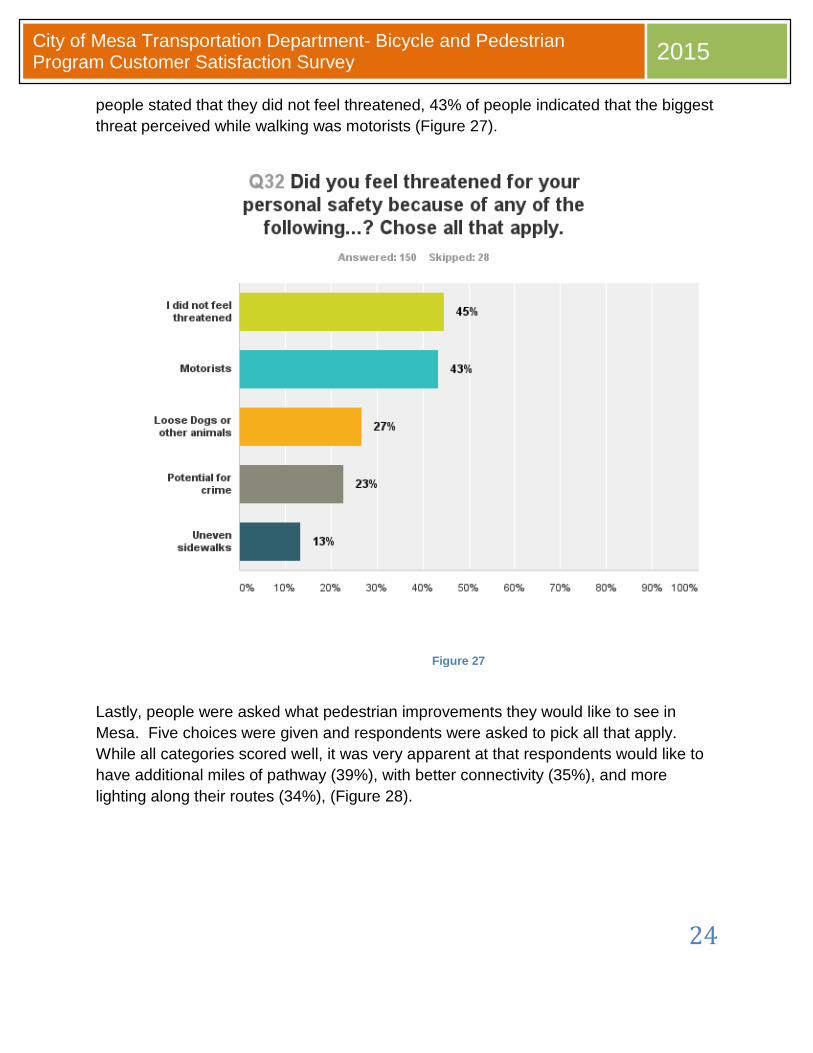
next question asked about personal safety while walking was Did you feel threatened for your personal safety because of any of the following? Five categories were given to choose from and respondents were asked to choose all that apply. While 45% of
Figure 26
24
City of Mesa Transportation Department- Bicycle and Pedestrian Program Customer Satisfaction Survey 2015
people stated that they did not feel threatened, 43% of people indicated that the biggest threat perceived while walking was motorists (Figure 27).
Figure 27
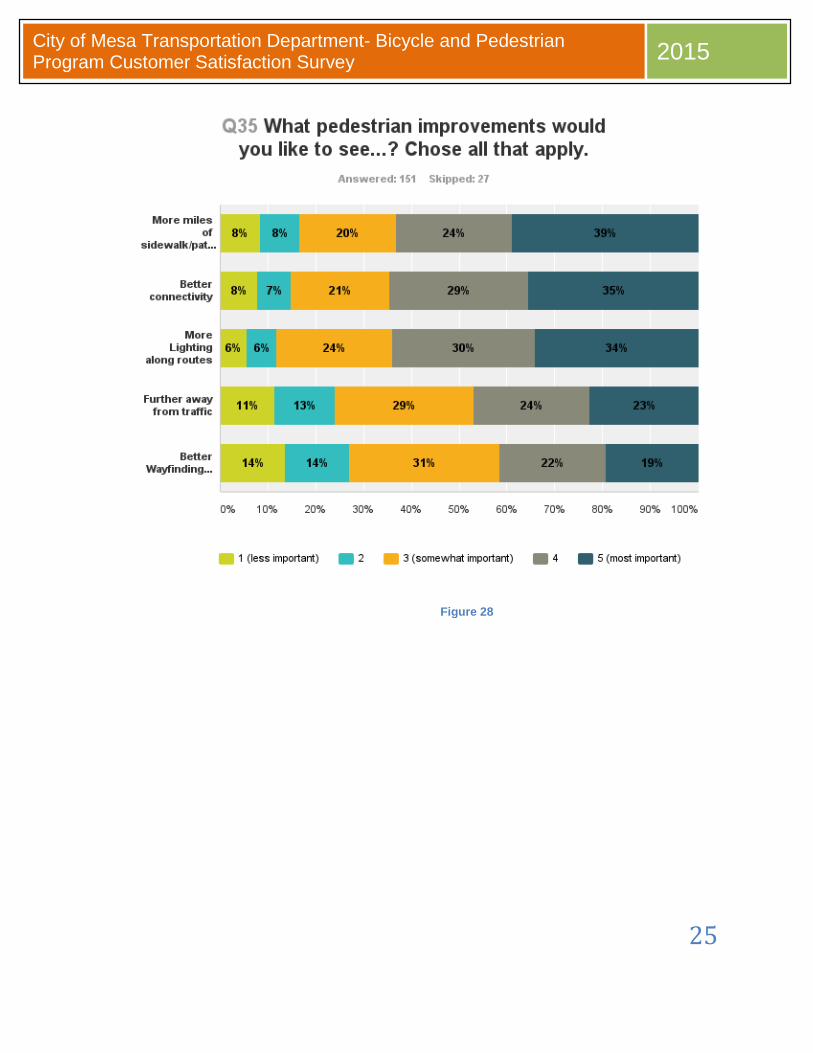
Lastly, people were asked what pedestrian improvements they would like to see in Mesa. Five choices were given and respondents were asked to pick all that apply. While all categories scored well, it was very apparent at that respondents would like to have additional miles of pathway (39%), with better connectivity (35%), and more lighting along their routes (34%), (Figure 28).
25
City of Mesa Transportation Department- Bicycle and Pedestrian Program Customer Satisfaction Survey 2015
Figure 28
26
City of Mesa Transportation Department- Bicycle and Pedestrian Program Customer Satisfaction Survey 2015
Intentionally Left Blank

27
City of Mesa Transportation Department- Bicycle and Pedestrian Program Customer Satisfaction Survey 2015
Appendices
28
City of Mesa Transportation Department- Bicycle and Pedestrian Program Customer Satisfaction Survey 2015
City of Mesa Transportation Department- Bicycle and Pedestrian Program Customer Satisfaction Survey
1. What is your age?
5 -18 years old
19 - 25 years old
26 - 35 years old
36 - 45 years old
46 - 60 years old
60+ years old
2. What is your gender?
Male
Female
3. What is your primary mode of transportation?
Automobile
Bicycle
Walking
Transit
4. Do you often ride a bicycle in Mesa?
Yes
No
5. In general, what type of riding do you do?
Primary Transportation
Commuting (School or Work)
Recreation
Errands
29
City of Mesa Transportation Department- Bicycle and Pedestrian Program Customer Satisfaction Survey 2015
6. Do you wear a bicycle helmet when riding a bicycle?
Yes
No
Sometimes
7. Which best describes your confidence level as a cyclist?
Strong and Fearless
Confident and Enthused
Interested but Concerned
No Way No How
8. How do you rate your level of knowledge of the services, activities and information
provided by the City of Mesa Transportation Department- Bike and Pedestrian program?
1 (not knowledgeable) 2 3 4
5 (very knowledgeable)
1 (not knowledgeable) 2 3 4 5 (very
knowledgeable)
9. Are you aware of or ever utilized our website (http://www.mesaaz.gov/transportation/)
and/or Facebook page (https://www.facebook.com/TheGreatArizonaBicycleFestival)?
Yes
No
10. Do you use the Mesa Bike Map to plan your rides?
Yes
No
11. How would you rate the usefulness of the Mesa Bike Map on a scale of 1 to 5?
1 (least useful) 2 3 4 5 (most useful)
1 (least useful) 2 3 4 5 (most
useful)
30
City of Mesa Transportation Department- Bicycle and Pedestrian Program Customer Satisfaction Survey 2015
12. Have you attended any free bicycle education classes offered by the City of Mesa?
Yes
No
13. Please tell us a little bit about your riding preferences.
Yes No
Do you prefer to ride off-street (shared use pathways)?
Do you prefer to ride off-street (shared use pathways)? Yes
Do you prefer to ride off-street (shared use pathways)? No
When riding on-street, do you prefer to ride on streets with bike lanes that are separated from automobile traffic?
When riding on-street, do you prefer to ride on streets with bike lanes that are separated from automobile traffic? Yes
When riding on-street, do you prefer to ride on streets with bike lanes that are separated from automobile traffic? No
Do you plan your route based on availability of off-street and or bike lanes?
Do you plan your route based on availability of off-street and or bike lanes? Yes
Do you plan your route based on availability of off-street and or bike lanes? No
Will you detour your route to a longer route if it is off-street?
Will you detour your route to a longer route if it is off-street? Yes
Will you detour your route to a longer route if it is off-street? No
14. Why should bike facilities be improved and expanded? Rank your answer on a scale of
1 to 5.
1 (least useful) 2 3 4
5 (most useful) N/A
Better access to work place
Better access to work place
Better access to
Better access to
Better access to
Better access to work place
Better access to
31
City of Mesa Transportation Department- Bicycle and Pedestrian Program Customer Satisfaction Survey 2015
1 (least useful) 2 3 4
5 (most useful) N/A
1 (least useful)
work place 2
work place 3
work place 4
5 (most useful)
work place N/A
Better access to neighborhood destinations like, shopping areas/banks/post office/parks
Better access to neighborhood destinations like, shopping areas/banks/post office/parks 1 (least useful)
Better access to neighborhood destinations like, shopping areas/banks/post office/parks 2
Better access to neighborhood destinations like, shopping areas/banks/post office/parks 3
Better access to neighborhood destinations like, shopping areas/banks/post office/parks 4
Better access to neighborhood destinations like, shopping areas/banks/post office/parks 5 (most useful)
Better access to neighborhood destinations like, shopping areas/banks/post office/parks N/A
Better access to transit
Better access to transit 1 (least useful)
Better access to transit 2
Better access to transit 3
Better access to transit 4
Better access to transit 5 (most useful)
Better access to transit N/A
Better access to schools
Better access to schools 1 (least useful)
Better access to schools 2
Better access to schools 3
Better access to schools 4
Better access to schools 5 (most useful)
Better access to schools N/A
Encourage cycling in general as a more active form of exercise
Encourage cycling in general as a more active form of exercise 1 (least useful)
Encourage cycling in general as a more active form of exercise 2
Encourage cycling in general as a more active form of exercise 3
Encourage cycling in general as a more active form of exercise 4
Encourage cycling in general as a more active form of exercise 5 (most useful)
Encourage cycling in general as a more active form of exercise N/A
Bike Facilities should NOT be improved
Bike Facilities should NOT be improved
Bike Facilities should NOT be improved 2
Bike Facilities should NOT be improved 3
Bike Facilities should NOT be improved 4
Bike Facilities should NOT be improved
Bike Facilities should NOT be improved N/A
32
City of Mesa Transportation Department- Bicycle and Pedestrian Program Customer Satisfaction Survey 2015
1 (least useful) 2 3 4
5 (most useful) N/A
1 (least useful)
5 (most useful)
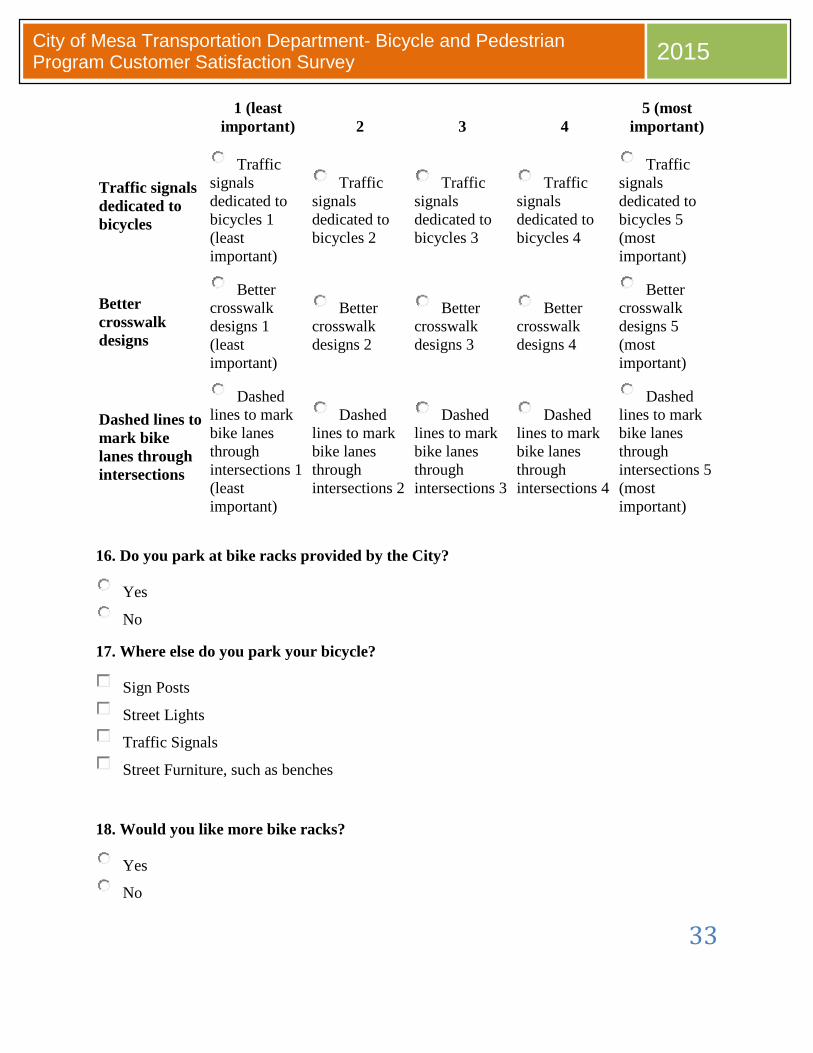
15. What design features would you like to see implemented? Rank your answers on a scale
of 1 - 5.
1 (least
important) 2 3 4 5 (most
important)
Bike lanes buffered/separated from automobile traffic
Bike lanes buffered/separated from automobile traffic 1 (least important)
Bike lanes buffered/separated from automobile traffic 2
Bike lanes buffered/separated from automobile traffic 3
Bike lanes buffered/separated from automobile traffic 4
Bike lanes buffered/separated from automobile traffic 5 (most important)
Colored asphalt for designated bike lanes
Colored asphalt for designated bike lanes 1 (least important)
Colored asphalt for designated bike lanes 2
Colored asphalt for designated bike lanes 3
Colored asphalt for designated bike lanes 4
Colored asphalt for designated bike lanes 5 (most important)
Two-way cycle tracks with barriers
Two-way cycle tracks with barriers 1 (least important)
Two-way cycle tracks with barriers 2
Two-way cycle tracks with barriers 3
Two-way cycle tracks with barriers 4
Two-way cycle tracks with barriers 5 (most important)
Shared-use sidewalks
Shared-use sidewalks 1 (least important)
Shared-use sidewalks 2
Shared-use sidewalks 3
Shared-use sidewalks 4
Shared-use sidewalks 5 (most important)
Bike boxes at intersections
Bike boxes at intersections 1 (least important)
Bike boxes at intersections 2
Bike boxes at intersections 3
Bike boxes at intersections 4
Bike boxes at intersections 5 (most important)
33
City of Mesa Transportation Department- Bicycle and Pedestrian Program Customer Satisfaction Survey 2015
1 (least
important) 2 3 4 5 (most
important)
Traffic signals dedicated to bicycles
Traffic signals dedicated to bicycles 1 (least important)
Traffic signals dedicated to bicycles 2
Traffic signals dedicated to bicycles 3
Traffic signals dedicated to bicycles 4
Traffic signals dedicated to bicycles 5 (most important)
Better crosswalk designs
Better crosswalk designs 1 (least important)
Better crosswalk designs 2
Better crosswalk designs 3
Better crosswalk designs 4
Better crosswalk designs 5 (most important)
Dashed lines to mark bike lanes through intersections
Dashed lines to mark bike lanes through intersections 1 (least important)
Dashed lines to mark bike lanes through intersections 2
Dashed lines to mark bike lanes through intersections 3
Dashed lines to mark bike lanes through intersections 4
Dashed lines to mark bike lanes through intersections 5 (most important)
16. Do you park at bike racks provided by the City?
Yes
No
17. Where else do you park your bicycle?
Sign Posts
Street Lights
Traffic Signals
Street Furniture, such as benches
18. Would you like more bike racks?
Yes
No

34
City of Mesa Transportation Department- Bicycle and Pedestrian Program Customer Satisfaction Survey 2015
19. If yes, where? Choose all the apply.
Curbside along arterials
Light rail stations
Parking garages
Parks
Shared-use paths
20. If you do NOT commute by bicycle or by walking to work, why not? Choose all that
apply.
I work from home
Roadway surface conditions are poor
No safe storage facility for my bicycle
Too much traffic/Driver behavior
No showers/changing facility at work
No bike lanes/routes/shared-use paths near my home connecting to my workplace
I live too far from my workplace
21. If you DO commute by bicycle or by walking to work, why? Choose all that apply.
I work close to home
It is healthy and good exercise
It is environmentally-friendly
It is faster than a car or transit
I have shower/changing facilities at work
I can park indoors
Bike facilities provide direct routes between work/home
It is economically beneficial
35
City of Mesa Transportation Department- Bicycle and Pedestrian Program Customer Satisfaction Survey 2015
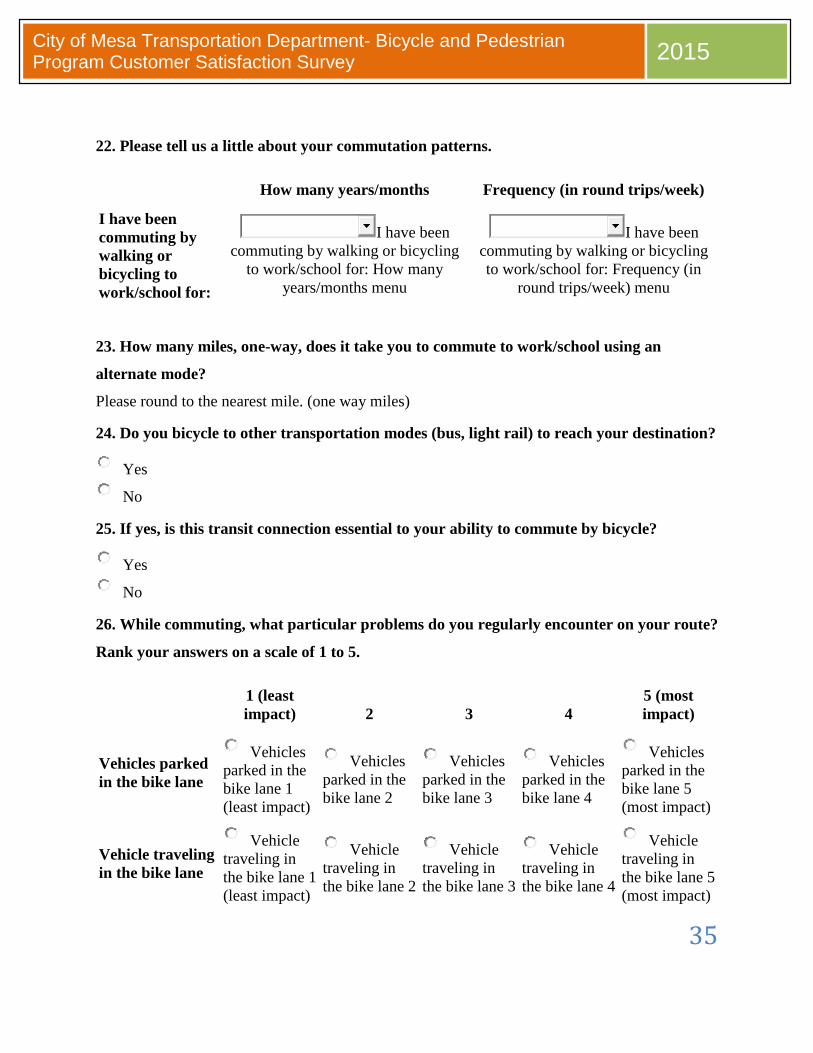
22. Please tell us a little about your commutation patterns.
How many years/months Frequency (in round trips/week)
I have been commuting by walking or bicycling to work/school for:
I have been commuting by walking or bicycling
to work/school for: How many years/months menu
I have been commuting by walking or bicycling to work/school for: Frequency (in
round trips/week) menu
23. How many miles, one-way, does it take you to commute to work/school using an
alternate mode?
Please round to the nearest mile. (one way miles)
24. Do you bicycle to other transportation modes (bus, light rail) to reach your destination?
Yes
No
25. If yes, is this transit connection essential to your ability to commute by bicycle?
Yes
No
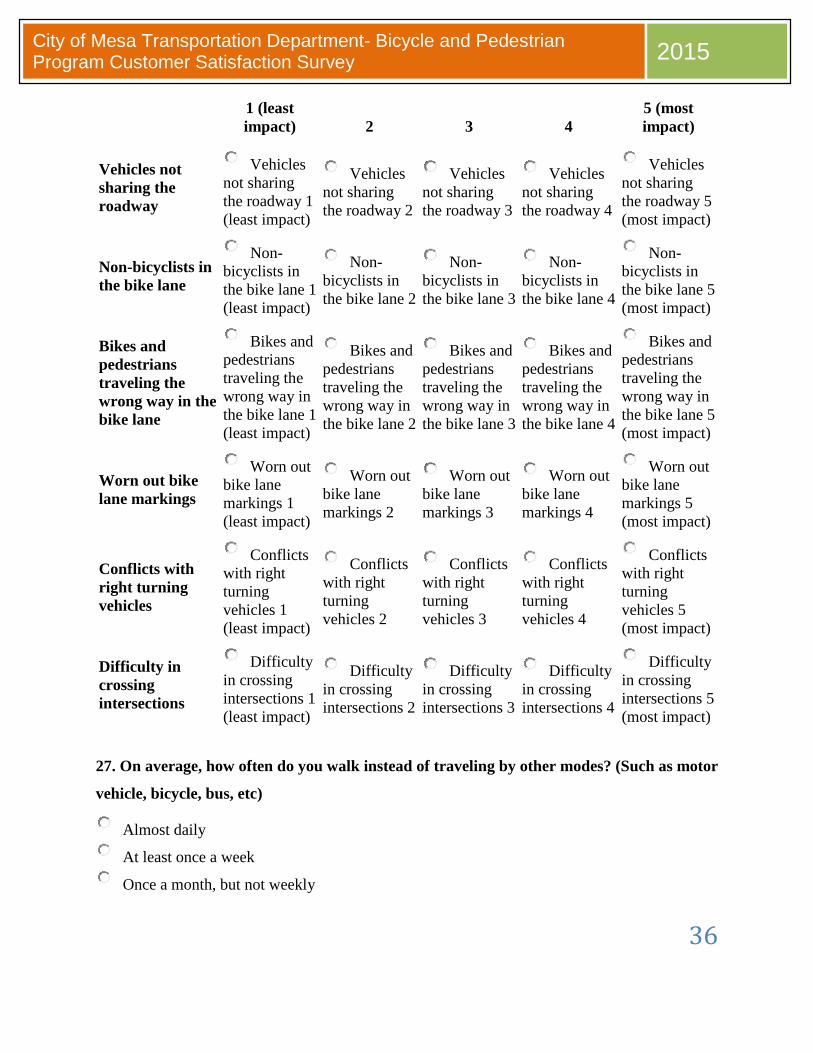
26. While commuting, what particular problems do you regularly encounter on your route?
Rank your answers on a scale of 1 to 5.
1 (least impact) 2 3 4
5 (most impact)
Vehicles parked in the bike lane
Vehicles parked in the bike lane 1 (least impact)
Vehicles parked in the bike lane 2
Vehicles parked in the bike lane 3
Vehicles parked in the bike lane 4
Vehicles parked in the bike lane 5 (most impact)
Vehicle traveling in the bike lane
Vehicle traveling in the bike lane 1 (least impact)
Vehicle traveling in the bike lane 2
Vehicle traveling in the bike lane 3
Vehicle traveling in the bike lane 4
Vehicle traveling in the bike lane 5 (most impact)
36
City of Mesa Transportation Department- Bicycle and Pedestrian Program Customer Satisfaction Survey 2015
1 (least impact) 2 3 4
5 (most impact)
Vehicles not sharing the roadway
Vehicles not sharing the roadway 1 (least impact)
Vehicles not sharing the roadway 2
Vehicles not sharing the roadway 3
Vehicles not sharing the roadway 4
Vehicles not sharing the roadway 5 (most impact)
Non-bicyclists in the bike lane
Non-bicyclists in the bike lane 1 (least impact)
Non-bicyclists in the bike lane 2
Non-bicyclists in the bike lane 3
Non-bicyclists in the bike lane 4
Non-bicyclists in the bike lane 5 (most impact)
Bikes and pedestrians traveling the wrong way in the bike lane
Bikes and pedestrians traveling the wrong way in the bike lane 1 (least impact)
Bikes and pedestrians traveling the wrong way in the bike lane 2
Bikes and pedestrians traveling the wrong way in the bike lane 3
Bikes and pedestrians traveling the wrong way in the bike lane 4
Bikes and pedestrians traveling the wrong way in the bike lane 5 (most impact)
Worn out bike lane markings
Worn out bike lane markings 1 (least impact)
Worn out bike lane markings 2
Worn out bike lane markings 3
Worn out bike lane markings 4
Worn out bike lane markings 5 (most impact)
Conflicts with right turning vehicles
Conflicts with right turning vehicles 1 (least impact)
Conflicts with right turning vehicles 2
Conflicts with right turning vehicles 3
Conflicts with right turning vehicles 4
Conflicts with right turning vehicles 5 (most impact)
Difficulty in crossing intersections
Difficulty in crossing intersections 1 (least impact)
Difficulty in crossing intersections 2
Difficulty in crossing intersections 3
Difficulty in crossing intersections 4
Difficulty in crossing intersections 5 (most impact)
27. On average, how often do you walk instead of traveling by other modes? (Such as motor
vehicle, bicycle, bus, etc)
Almost daily
At least once a week
Once a month, but not weekly
37
City of Mesa Transportation Department- Bicycle and Pedestrian Program Customer Satisfaction Survey 2015
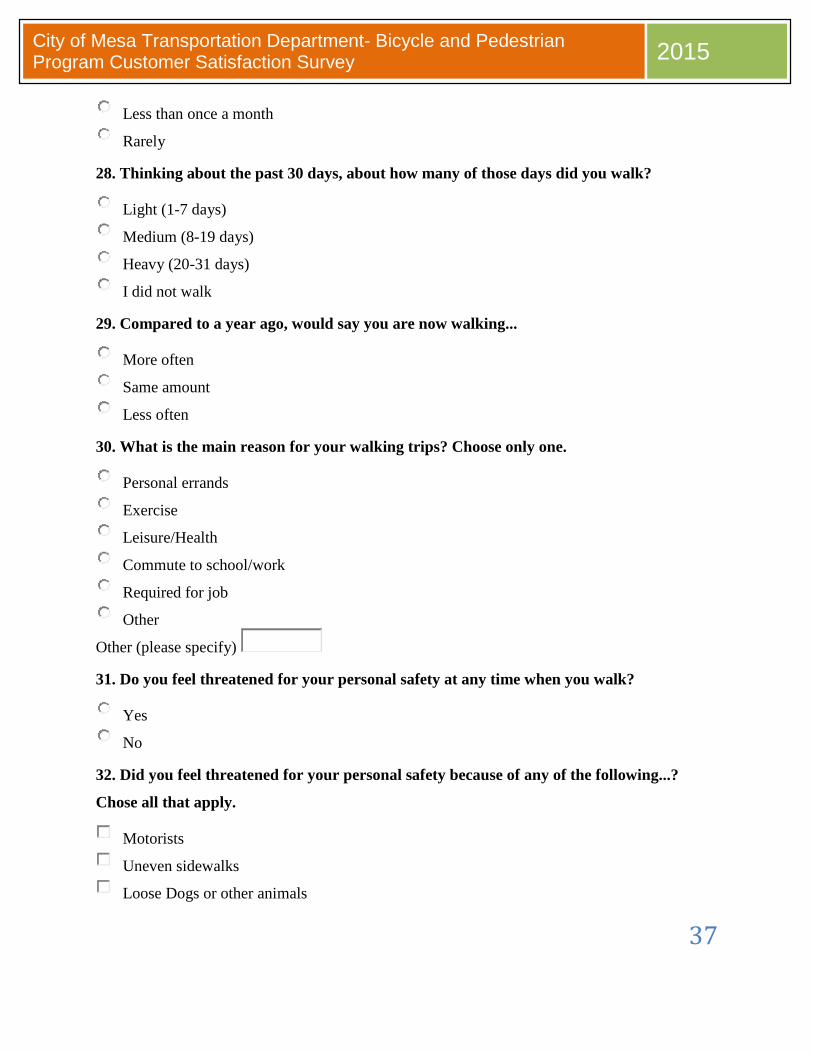
Less than once a month
Rarely
28. Thinking about the past 30 days, about how many of those days did you walk?
Light (1-7 days)
Medium (8-19 days)
Heavy (20-31 days)
I did not walk
29. Compared to a year ago, would say you are now walking...
More often
Same amount
Less often
30. What is the main reason for your walking trips? Choose only one.
Personal errands
Exercise
Leisure/Health
Commute to school/work
Required for job
Other
Other (please specify)
31. Do you feel threatened for your personal safety at any time when you walk?
Yes
No
32. Did you feel threatened for your personal safety because of any of the following...?
Chose all that apply.
Motorists
Uneven sidewalks
Loose Dogs or other animals
38
City of Mesa Transportation Department- Bicycle and Pedestrian Program Customer Satisfaction Survey 2015
Potential for crime
I did not feel threatened
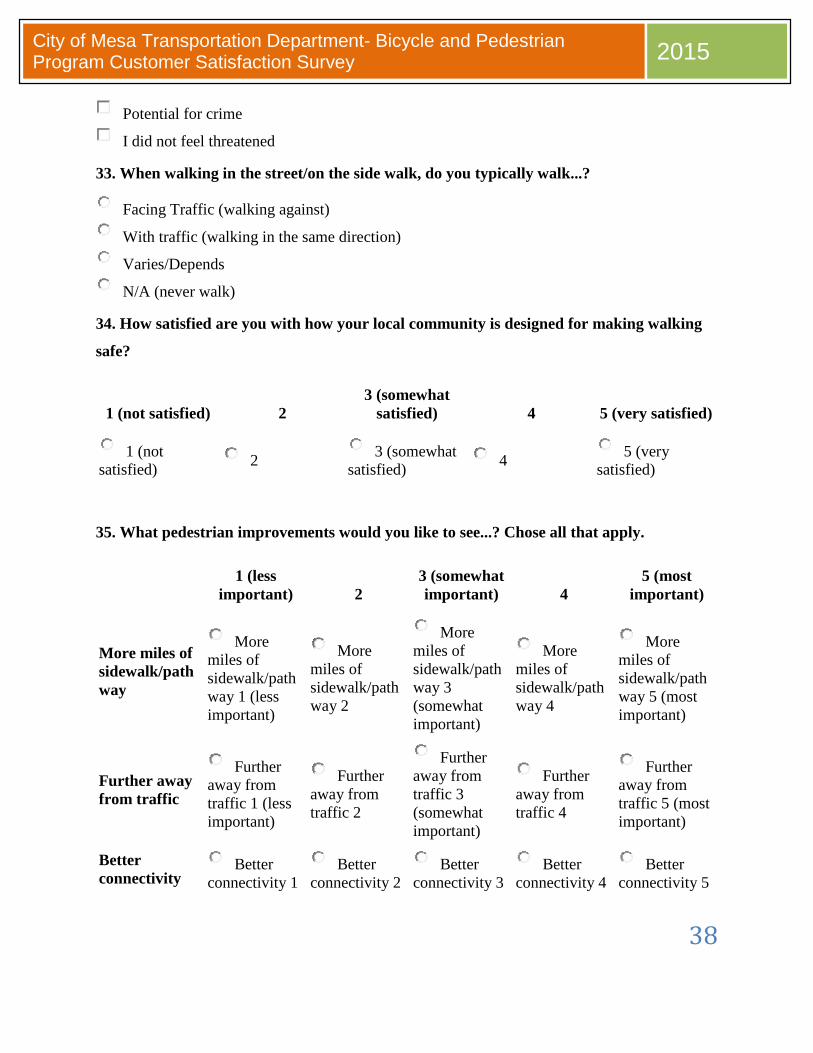
33. When walking in the street/on the side walk, do you typically walk...?
Facing Traffic (walking against)
With traffic (walking in the same direction)
Varies/Depends
N/A (never walk)
34. How satisfied are you with how your local community is designed for making walking
safe?
1 (not satisfied) 2 3 (somewhat
satisfied) 4 5 (very satisfied)
1 (not satisfied) 2 3 (somewhat
satisfied) 4 5 (very satisfied)
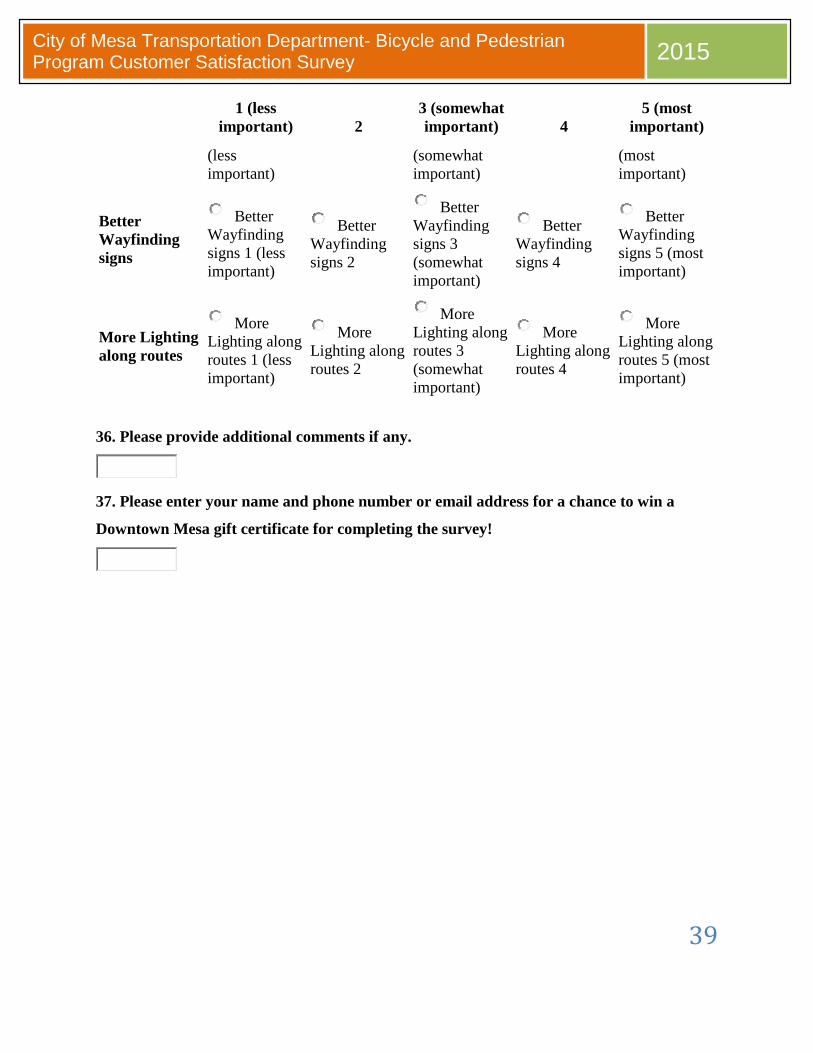
35. What pedestrian improvements would you like to see...? Chose all that apply.
1 (less
important) 2 3 (somewhat important) 4
5 (most important)
More miles of sidewalk/pathway
More miles of sidewalk/pathway 1 (less important)
More miles of sidewalk/pathway 2
More miles of sidewalk/pathway 3 (somewhat important)
More miles of sidewalk/pathway 4
More miles of sidewalk/pathway 5 (most important)
Further away from traffic
Further away from traffic 1 (less important)
Further away from traffic 2
Further away from traffic 3 (somewhat important)
Further away from traffic 4
Further away from traffic 5 (most important)
Better connectivity
Better connectivity 1
Better connectivity 2
Better connectivity 3
Better connectivity 4
Better connectivity 5
39
City of Mesa Transportation Department- Bicycle and Pedestrian Program Customer Satisfaction Survey 2015
1 (less
important) 2 3 (somewhat important) 4
5 (most important)
(less important)
(somewhat important)
(most important)
Better Wayfinding signs
Better Wayfinding signs 1 (less important)
Better Wayfinding signs 2
Better Wayfinding signs 3 (somewhat important)
Better Wayfinding signs 4
Better Wayfinding signs 5 (most important)
More Lighting along routes
More Lighting along routes 1 (less important)
More Lighting along routes 2
More Lighting along routes 3 (somewhat important)
More Lighting along routes 4
More Lighting along routes 5 (most important)
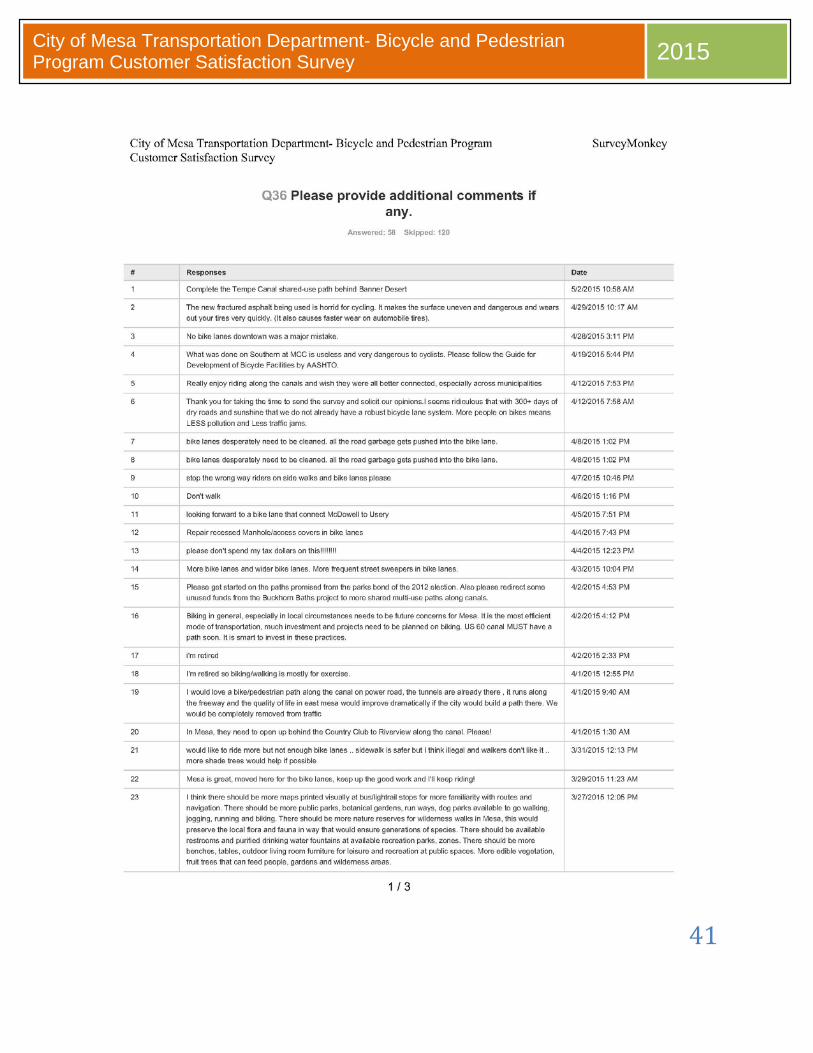
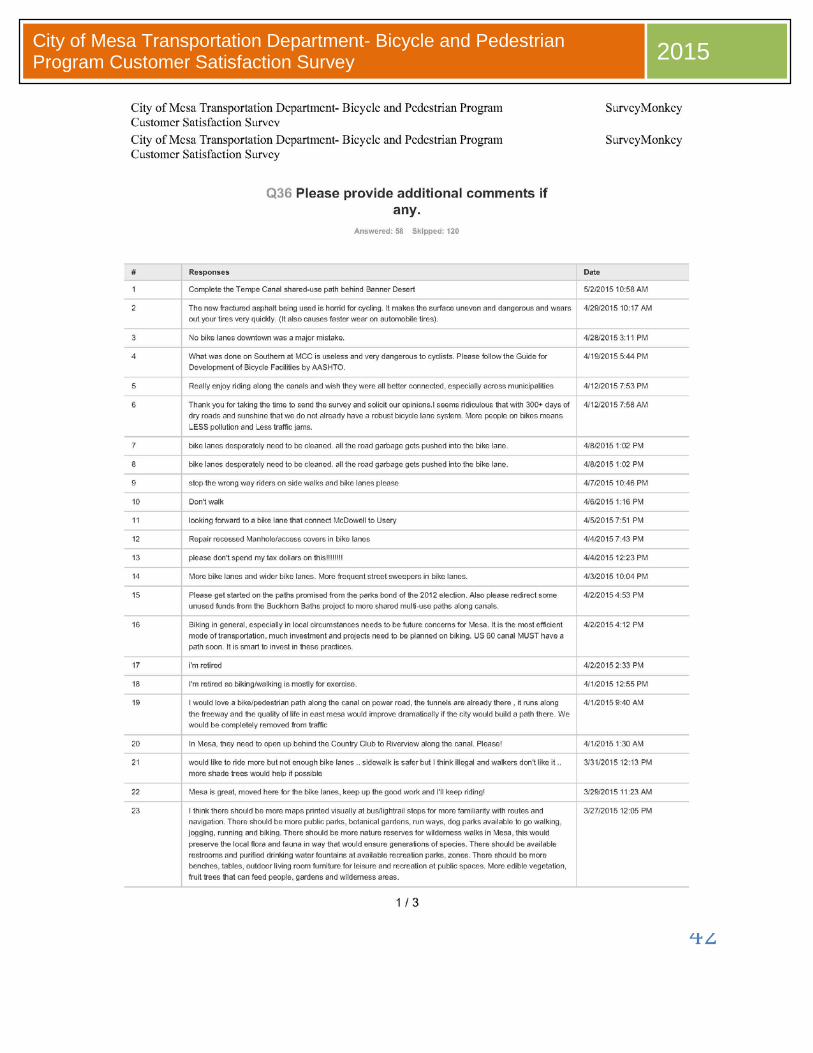
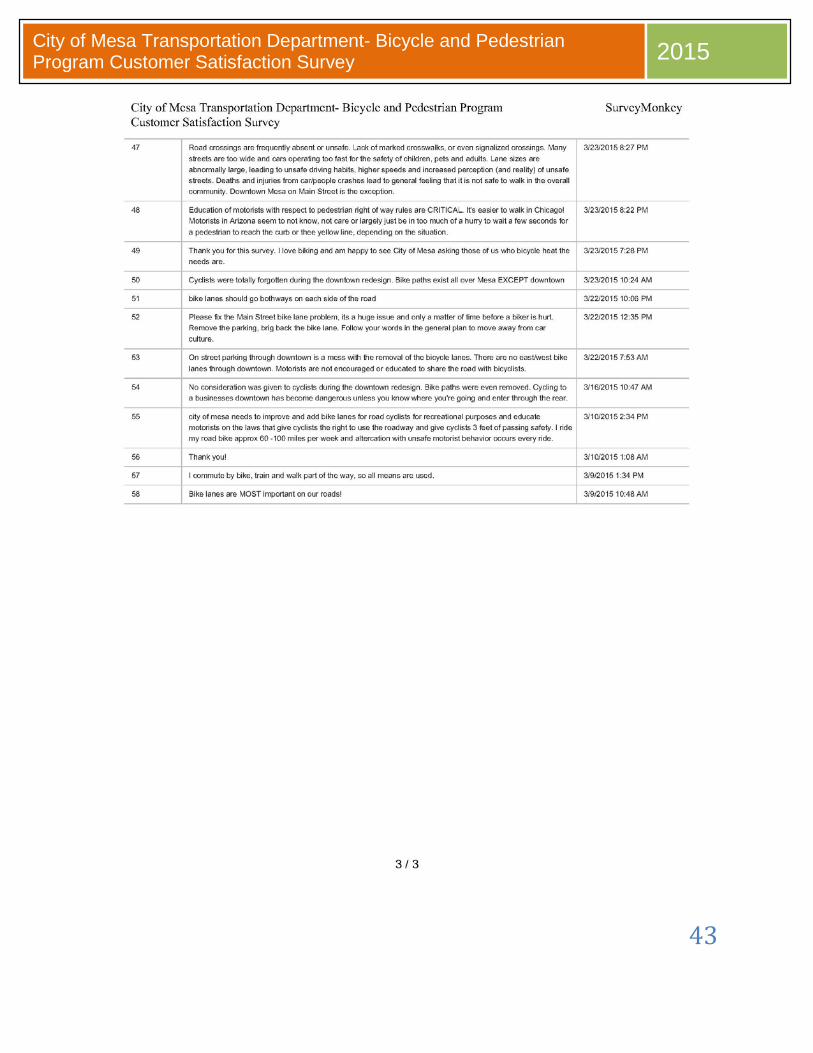
36. Please provide additional comments if any.
37. Please enter your name and phone number or email address for a chance to win a
Downtown Mesa gift certificate for completing the survey!
40
City of Mesa Transportation Department- Bicycle and Pedestrian Program Customer Satisfaction Survey 2015
Individual Reponses
41
City of Mesa Transportation Department- Bicycle and Pedestrian Program Customer Satisfaction Survey 2015
42
City of Mesa Transportation Department- Bicycle and Pedestrian Program Customer Satisfaction Survey 2015
43
City of Mesa Transportation Department- Bicycle and Pedestrian Program Customer Satisfaction Survey 2015