cities of the 21st century - united states …us smart cities area, based upon the results of the us...
TRANSCRIPT

January 2017
2016 Smart Cities Survey
Cities of the 21st Century
THE UNITED STATES CONFERENCE OF MAYORS
Prepared by:
Technology and Innovation Task Force
Council on Metro Economies and the New American City

THE UNITED STATES CONFERENCE OF MAYORS
Mick CornettMayor of Oklahoma CityPresident
Mitchell J. LandrieuMayor of New OrleansVice President
Stephen K. BenjaminMayor of Columbia, SCSecond Vice President
Edwin M. LeeMayor of San FranciscoChair, Technology and Innovation Task Force
Greg FischerMayor of LouisvilleChair, Council on Metro Economies and the New American City
Tom CochranCEO and Executive Director
Printed on Recycled Paper.
do your part ! please recycle !

Contents1.0 Introduction ........................................................................................................................... 1
2.0 Executive summary ............................................................................................................... 2
3.0 Definitions used in this report ............................................................................................... 3
4.0 US smart city development ................................................................................................... 4
5.0 Smart city project drivers and challenges ............................................................................. 8
6.0 Smart city funding, business models and implementation .................................................. 11
7.0 Smart city investment ......................................................................................................... 14
8.0 Conclusion .......................................................................................................................... 16
Appendix – City Case Studies ...................................................................................................... 19
1.0 Boston, Massachusetts ........................................................................................................ 19
1.1 Overview ......................................................................................................................... 19
1.2 Smart city projects .......................................................................................................... 19
2.0 Chicago, Illinois .................................................................................................................. 21
2.1 Overview ......................................................................................................................... 21
2.2 Smart city projects .......................................................................................................... 22
3.0 Columbus, Ohio .................................................................................................................. 23
3.1 Overview ......................................................................................................................... 23
3.2 Smart city projects .......................................................................................................... 23
4.0 Ketchum, Idaho ................................................................................................................... 25
4.1 Overview ......................................................................................................................... 25
4.2 Smart city projects .......................................................................................................... 25
5.0 Louisville, Kentucky ........................................................................................................... 27
5.1 Overview ......................................................................................................................... 27
5.2 Smart city projects .......................................................................................................... 27
6.0 NYC, New York ................................................................................................................. 29
6.1 Overview ......................................................................................................................... 29
6.2 Smart city projects .......................................................................................................... 29


1
1.0 INTRODUCTION As the focal points of economic activity, cities and metropolitan areas are vital to national economic development. The concentration of people and business in cities creates unique economic conditions that give rise to new industries, speed the diffusion of knowledge, spur technological innovation, increase productivity, and promote growth. Urban metropolitan areas drove the US economy in 2015. They were home to 85.7% of the nation’s population, 87.7% of total employment, 87.9% of total real income, 91.3% of wage income, and 90.8% of real gross domestic product. Their share of economic growth in 2015 was even greater – metros contributed 96.5% (2.6 million, the most since 2000) of new jobs and 98.9% ($578 billion) of the increase in GDP. Despite their importance, cities are under increasing pressure on a number of fronts. Rapid growth in urban population is leading to strained infrastructure and resources. For example, more densely populated cities cause traffic congestion, which in turn causes air pollution and health difficulties. Other issues facing cities include public safety and the challenges of an aging society. Cities need to tackle these issues in order to remain economically successful and attractive to citizens. To do this, many cities are investing in smart city projects – projects using integrated information and communications technology (ICT) systems to improve efficiency, manage complexity, and enhance citizen quality of life. This report provides detailed analysis of the US smart cities area, based upon the results of the US City Decision Maker Survey – a collaborative project run by IHS Markit and the US Conference of Mayors. The survey was launched in February 2016 and ran until the end of June 2016. A total of 54 cities participated and provided detailed information on smart city projects that they have implemented or are currently planning. The survey was designed to find out how the US smart cities area is developing by asking questions about projects that are being implemented or planned between 2015 and 2017. Participants were asked to answer a detailed series of questions about specific smart city projects; which covered topics including project goals, difficulties experienced when implementing smart city projects, and what type of funding and business models are most commonly used. This analysis will help other cities that are implementing smart city projects to understand what their peers are doing and learn from their experience. In addition to the survey data, this report includes an appendix with five case studies of specific smart city projects. The most successful smart city projects around the world are those that deliver tangible improvements for citizens; just as every city is unique, each smart city project must be carefully planned to suit that city’s individual needs. The case studies in the appendix of this report feature a selection of cities that are adopting smart city technology to combat serious issues affecting them today. Examples include projects to collect better data about asthma and allergy triggers in order to influence city policy; to provide better transport for new mothers to receive necessary medical care; and to reduce energy costs by

2
installing street lights that conserve energy by being automatically dimmed when the streets aren’t occupied. This survey will be repeated on an annual basis; IHS Markit plans to repeat the process in other regions as well as the United States, to develop a detailed body of data on the smart cities area from the point of view of city decision makers.
2.0 EXECUTIVE SUMMARY In 2016, IHS Markit and the US Conference of Mayors (USCM) conducted a survey to investigate the smart city development in the United States. A total of 54 cities participated in the survey, from 28 different states, including six cities with populations of over 1 million, 25 cities with populations between 150 thousand and 1 million, and 23 cities with populations of less than 150 thousand. The global smart cities area is at an early stage, but activity has increased in recent years, as several national governments including the United States, United Kingdom, China, and Singapore have launched initiatives to encourage smart city development. Some of these initiatives, such as the recently awarded US Department of Transport’s (DOT) ‘Smart Cities Challenge’ grant, focus on one particular type of smart city project – in this case, mobility and transport. Because securing funding for smart city projects is challenging, government funding packages are influencing the type of projects that get developed. However, creating sustainable business models is crucial for smart city projects to move beyond trials to full-city roll-outs. Technology vendors and cities are working together to try to achieve this. For example, some smart city projects, such as the LinkNYC project, are creating revenue streams through advertising. Smart city development in the United States is not limited to large cities. The survey results show that many small and mid-sized US cities are implementing and planning smart city projects. Most US smart city projects fall within the functional areas of mobility and transport, governance, and physical infrastructure. The goal of a smart city project is not to just implement new technology – according to the survey, the most common reason for investing in smart city projects is ‘increasing citizen satisfaction’. Although this goal may seem ambiguous, citizen satisfaction is very important for city economic growth and stability, as cities with large, socially engaged populations attract more business and investment. This result indicates that cities see that investing in smart city technology can help them achieve a broad range of goals.

3
3.0 DEFINITIONS USED IN THIS REPORT The term ‘smart city project’ can be ambiguous. IHS Markit defines a smart city project as one that uses an integrated information and communications technology (ICT) system to improve efficiency, manage complexity, and enhance citizen quality of life; leading to sustainable improvement in city operations. This can be thought of as the implementation of the “Internet of Things” (IoT) in the city context. IHS Markit collects data on over 480 smart city projects worldwide, dividing them into the following functional areas:
Mobility and transport (includes but is not limited to: smart ticketing, smart parking, and intelligent transport systems)
Energy and resource efficiency (includes but is not limited to: smart grid, environmental sensors, and irrigation management)
Physical infrastructure (includes but is not limited to: smart street lighting, smart buildings, and waste management)
Governance (includes but is not limited to: consolidated services platforms and mobile reporting apps)
Safety and security (includes but is not limited to: integrated video surveillance and predictive analytics)
Healthcare (includes but is not limited to: telehealth and remote patient monitoring) Other definitions used in this report include: Implemented projects – Budget has been allocated in the current fiscal year, vendor(s) has/have been selected, a request for proposal (RFP) has been issued, and deployment of either hardware or software has begun. Planned projects – The project proposal is developed, funds may or may not be identified/allocated, vendor selection is still pending, and no RFP has been issued. Large city – A city with a population of over 1 million Mid-sized city – A city with a population of between 150,000 and 1 million Small city – A city with a population of fewer than 150,000 Build-operate-transfer (BOT) – Under this business model, the municipality or city planners work closely with an external private partner, which develops the services and deploys the necessary infrastructure to enable the smart city project. In addition, the third party is also responsible for the operation and continued management of the infrastructure and services until such time that it is transferred back to the municipality. Build-operate-comply (BOC) – Under this model, the governing authorities provide a platform for smart city development, regulations that the third parties must adhere to, and an initial source of funding. The private partners are responsible for the development of the

4
services and the deployment of infrastructure. Essentially, the municipality provides a platform for private enterprise and individuals to test their smart city applications and services. Municipal-owned-deployment (MOD) – In this model, the municipality or city planners take full responsibility for the development of the services and deployment of necessary infrastructure as it relates to their smart city project and goals. Subsequently, the public entity is also responsible for the operation of the system.
4.0 US SMART CITY DEVELOPMENT US smart cities development, similar to global development, is at an early stage. Most projects are trials rather than commercial implementations, and there is uncertainty about how to make projects financially sustainable. Despite this, in recent years there has been a significant increase in the number of smart city projects being announced around the world, thanks to several national governments, including those of China, Singapore, the United Kingdom, and the United States, announcing funding schemes and initiatives to encourage smart city development. The US smart cities initiative, announced in September 2015, includes a number of grants and funding packages, as well as hosting events to encourage collaboration and knowledge sharing between cities, private sector companies, and universities that are involved in smart city development across the country. The initiative includes:
More than $35 million in new grants and $10 million in proposed investments to build a research infrastructure for smart city development by the National Science Foundation and National Institute of Standards and Technology.
Almost $70 million in new spending and more than $45 million in proposed investments to develop new smart city solutions by the Department of Homeland Security, Department of Transportation, Department of Energy, Department of Commerce, and the Environmental Protection Agency.
The results of the IHS Markit-USCM survey show that in the 54 cities that responded there were 335 smart city projects being implemented and 459 smart city projects being planned between 2015 and 2017. Figure 4.1 shows which US cities participated in the IHS Markit-USCM survey. The size of the red circles indicates the size of their population. A total of 54 cities participated in the survey, from 28 different states. Six cities have populations of over 1 million, 25 cities have populations between 150 thousand and 1 million, and 23 cities have populations of fewer than 150 thousand. Some of the cities that responded, such as Boston, Chicago, and New York, are already well known for their investment in smart city projects on the global stage. In addition, there are

5
many other cities that are not so well-known for their smart city efforts that have responded to the survey. A selection of case studies focusing on smart city projects taking place in five different cities can be found in the appendix at the end of this report, illustrating the different ways that cities are implementing them.
Figure 4.2 shows that, of the 335 implemented projects, 69 are taking place in large cities, 168 in mid-sized cities and 98 in small cities; of the 459 planned projects, 103 are in large cities, 225 in mid-sized cities and 131 in small cities. It is interesting to reflect that there are more projects being planned in mid-sized and small cities than in large ones; many people would assume the opposite to be true. Although we must recognize that there are fewer large cities included in the survey sample than any other city category, which may have skewed the results, there are some other important influencing factors to consider. First, implementing projects in mid-sized and small cities allows new technology to be tested in a smaller and more manageable environment before being introduced to complex, large cities. Secondly, mid-sized and small cities that are looking for economic growth will be keen to attract investment by agreeing to become test-beds for new technology; so could be more likely to implement smart city projects than their larger counterparts. In fact, some funding packages, such as the recently awarded US Department

6
of Transport’s (DOT) ‘Smart Cities Challenge’ grant of $40 million, are available only for mid-sized cities. The fact that most smart city projects are taking place in mid-sized and small cities is, in turn, influencing the evolution of the smart cities area. These cities are likely to invest only in one or two specific areas: for example, implementing smart street lighting or an intelligent transport system, rather than developing a centralized operations system for the entire city. Technology providers are responding to this by developing solutions that can be introduced to the city gradually, for example, a smart city software solution that has different modules for managing transport, energy, and safety and security. Cities don’t have to install everything at once; they can build their smart city solution gradually. This modular approach is attractive to cities with budget limitations, or those that are not comfortable making a large one-time investment.
Figure 4.3 shows that the top three functional areas by number of implemented projects are: governance (86), mobility and transport (74), and physical infrastructure (59). The top three functional areas by number of planned projects are: mobility and transport (104), governance (90), and physical infrastructure (90). These results are interesting when compared to global smart cities’ data, where mobility and transport, physical infrastructure, and energy and resource efficiency are the most common types of projects. Mobility and transport projects feature highly in global smart cities data because mobility and transport issues can damage many different aspects of city sustainability. For example, traffic
0
50
100
150
200
250
Implemented projects(2015-2017)
Planned projects(2015-2017)
Less than 150K
150k - 1M
Over 1M
Figure 4.2 - Number of planned and implemented smart city projects (2015-2017), by city population size
Source: IHS Markit, July 2016 © 2016 IHS
Nu
mb
ero
f sm
art
city
pro
ject
s City population:

7
congestion not only causes health problems because of increased pollution, but can also prevent emergency vehicles from reaching accident sites in time, in addition to having an economic impact on businesses that rely on deliveries and freight. A system that improved traffic flow could help negate these problems, and as a result make the city more attractive for citizens and businesses. In addition to the importance of a well-run mobility and transport system to city life, the fact that the US DOT’s Smart Cities Challenge – a competition for one city to win a $40 million grant to invest in smart city projects to improve mobility and transport – was running at the same time the US City Decision Makers’ Survey was in the field could have influenced results. However, because mobility and transport is such a key issue for cities globally, IHS Markit does not think that this has significantly altered the results. According to the survey data, most functional areas have between 50 and 100 projects, both planned and implemented, with the exception of mobility and transport (104 planned) and healthcare (25 planned and 14 implemented). There are fewer healthcare projects – both planned and implemented – than any other functional area. This reflects global smart city trends, where there are fewer healthcare projects than any other category. However, one exception is Singapore which has made smart healthcare – for example remote patient monitoring to reduce pressure on hospital facilities – a key priority for its smart city development plan. Singapore is focusing on healthcare projects to help meet the demands of its aging population; other countries are expected to follow Singapore’s example.
In addition to being asked to state the number of planned and implemented projects in their city, participants were asked to rate the importance of developing smart city projects by the
0 50 100 150
Healthcare
Safety and Security
Governance
Physical Infrastructure
Energy and Resource Efficiency
Mobility and Transport
Implemented
Planned
Figure 4.3 - Number of planned and implemented projects by functional area
Source: IHS Markit, July 2016 © 2016 IHSNumber of projects
8
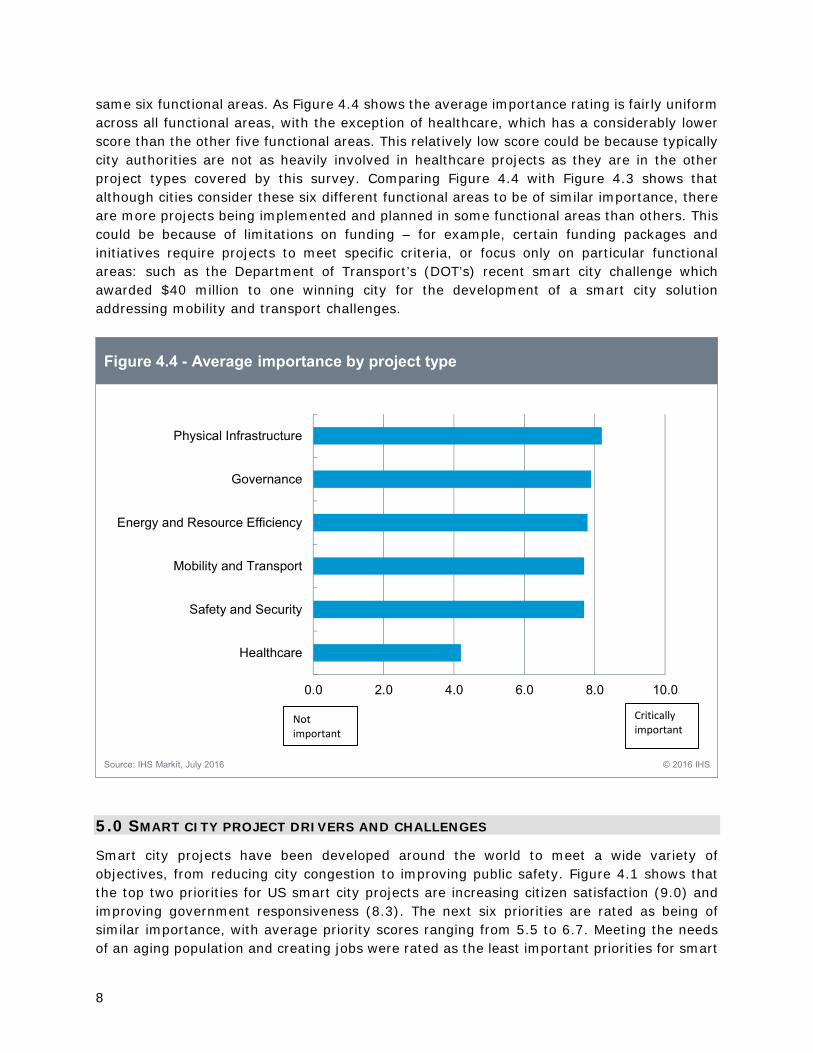
same six functional areas. As Figure 4.4 shows the average importance rating is fairly uniform across all functional areas, with the exception of healthcare, which has a considerably lower score than the other five functional areas. This relatively low score could be because typically city authorities are not as heavily involved in healthcare projects as they are in the other project types covered by this survey. Comparing Figure 4.4 with Figure 4.3 shows that although cities consider these six different functional areas to be of similar importance, there are more projects being implemented and planned in some functional areas than others. This could be because of limitations on funding – for example, certain funding packages and initiatives require projects to meet specific criteria, or focus only on particular functional areas: such as the Department of Transport’s (DOT’s) recent smart city challenge which awarded $40 million to one winning city for the development of a smart city solution addressing mobility and transport challenges.
5.0 SMART CITY PROJECT DRIVERS AND CHALLENGES
Smart city projects have been developed around the world to meet a wide variety of objectives, from reducing city congestion to improving public safety. Figure 4.1 shows that the top two priorities for US smart city projects are increasing citizen satisfaction (9.0) and improving government responsiveness (8.3). The next six priorities are rated as being of similar importance, with average priority scores ranging from 5.5 to 6.7. Meeting the needs of an aging population and creating jobs were rated as the least important priorities for smart
0.0 2.0 4.0 6.0 8.0 10.0
Healthcare
Safety and Security
Mobility and Transport
Energy and Resource Efficiency
Governance
Physical Infrastructure
Figure 4.4 - Average importance by project type
Source: IHS Markit, July 2016 © 2016 IHS
Not important
Criticallyimportant

9
city project development. Survey participants were given the option to mention other priorities that weren’t included on the list; several cities highlighted improving public safety, and other priorities mentioned include bridging the digital divide, improving citizens’ health, and managing strained infrastructure. As the case studies in the appendix of this report demonstrate, many projects aim to meet several objectives. For example, Columbus Ohio is planning to improve mobility and transport for citizens, and as part of that goal seeks to improve access to city facilities and jobs for citizens living in lower income neighborhoods.
Although there are many reasons why cities are interested in developing smart city projects, there are also challenges to development that are affecting the evolution of the smart cities area. Participants were asked to rate eight different challenges according to how much difficulty they caused a specific project that the participant had been involved in. The eight challenges were based on IHS Markit’s research of the global smart cities market.
0 2 4 6 8 10
Creating jobs
Meeting the needs of an aging population
Managing resource scarcity (e.g. water, energy)
Attracting private investment
Improving energy efficiency/reducing carbon emissions
Coping with city population growth
Reducing city operation costs
Increasing collaboration across city departments
Improving government responsiveness
Increasing citizen satisfaction
Figure 5.1 - Average priority level by project objective
Source: IHS Markit, July 2016 © 2016 IHS
Not important
Critically important

10
Interestingly, the highest average difficulty rating for any challenge is only 4.5, indicating that the challenges facing smart city development are considered by city decision makers as only being moderately difficult. The top three challenges facing smart city development according to average difficulty rating are ‘ensuring the city will have the financial resources to sustain the project over time’ (4.5), ‘securing sufficient funding to start the project’ (4.5), and ‘aligning multiple city departments and stakeholders’ (4.2). These results correspond with IHS Markit’s understanding of the global smart cities market, where funding and working with multiple stakeholders are also seen as the greatest challenges facing smart city development.
The challenges with the lowest average difficulty rating are getting support from city leadership (1.4) and getting support from regional or national leadership (2.0). This indicates that there is strong support from government leadership at the local, regional and national level, but that securing financial support for long-term projects remains a challenge. Developing financially sustainable, long-term smart city projects is fundamental to enabling the global smart cities market to mature, and much work is being done to address this by industry organizations and government bodies. One interesting example of a project addressing this issue is LinkNYC in New York, which receives revenue from the advertising space that it has incorporated into Wi-Fi kiosks distributed around the city. The kiosks provide a range of services including community information and the ability to contact emergency services. Further details of this project can be found in the appendix of this report.
0 2 4 6 8 10
Getting support from city leadership
Getting support from regional or national leadership
Overcoming citizen and business concerns over privacy
Developing necessary relationships with appropriateprivate sector solution providers
Finding appropriate ICT solutions
Aligning mulitple city departments and stakeholders
Securing sufficient funding to start the project
Ensuring city will have financial resources to sustain theproject over time
Figure 5.2 - Average difficulty by project challenge
Source: IHS Markit, July 2016 © 2016 IHS
Not difficult
Very difficult

11
6.0 SMART CITY FUNDING, BUSINESS MODELS AND IMPLEMENTATION There are currently no clearly defined, universally accepted standards or business models for smart city projects. This is partly because the smart cities area is at an early stage in its evolution, and also because each city is looking to smart city technology to solve different problems according to its own unique circumstances. This situation will change as the area develops and smart city projects move beyond trials to full-city, commercial roll-outs; something that IHS Markit predicts will happen in the next five years. This survey asked a series of questions about funding and business models to ascertain which approaches are currently most prevalent in the US smart cities area. As highlighted in Section 5.0, securing funding for smart city projects – both to sustain the project over time and to initiate work on the project – is a difficulty that needs to be solved. Figure 6.1 shows the different funding types being used in a sample of 82 projects (including both planned and implemented projects). In this sample, public funding was much more common than either public-private partnerships or private funding.
0 20 40 60 80
Private
Public-Private Partnership
Public
Figure 6.1 - Number of projects by funding type
Source: IHS Markit, July 2016 © 2016 IHS

12
Figure 6.2 shows which business models are most commonly used in a sample size of 82 projects (including implemented and planned projects). The municipal owned deployment (MOD) business model is the most common, accounting for 31 projects, closely followed by the build-operate-transfer (BOT) business model, accounting for 28 projects. Participants were given the option to list other business models that they are using and these included modified versions of the business models included in the survey, for example a “combination of BOT and MOD” or “MOD with a twist - the county will work with the town to deploy the project and then the county will operate the system once deployed.” In some cases participants indicated that they were still assessing different business models for planned projects.
All smart city projects require an ICT network to control devices and collect data across the city. In some cases, smart city projects will require new networks to be deployed; this creates questions about who will own and control the network and data that is transmitted. Figure 6.3 shows the number of projects by ICT network type. In this sample of 82 projects, a private network operated and maintained exclusively by the city is the most commonly used network, accounting for 24 projects. This is twice as many as the other three named network types (public network operated and maintained by a private company, public network operated and maintained by the city, and hybrid public and private network operated and maintained by the city) which account for 12 projects each.
0 10 20 30 40
Other
Build-operate-comply (BOC)
Build-operate-transfer (BOT)
Municipal-owned-deployment (MOD)
Figure 6.2 - Number of projects by business model
Source: IHS Markit, July 2016 © 2016 IHS

13
Survey participants were also asked about who advises them on smart city projects, and whether they seek external counsel or have a dedicated internal team. As Figure 6.4 shows, the overwhelming majority of participants – 36 out of 48 who answered the question – seek advice from external counsel. Eight participants stated that they used internal counsel, and four said that they did not seek counsel at all. As more and more cities start planning and implementing smart city projects, they will need advice from external providers – and other cities – about projects that have already been implemented. There are some cases around the world, such as in Boston, Chicago, and Dubai, where cities have designated smart city departments or task forces. IHS Markit notes that cities which have strong commitment to smart city development from their leadership are able to implement smart city projects more easily than those that do not.
0 5 10 15 20 25 30
Other
No plans to implement
Hybrid public (allows limited commerical and/orresidential use) and private network operated and
maintained by the city
Public network operated and maintained by the city
Public network operated and maintained by a privatecompany
Private network operated and maintained exclusively bythe city
Figure 6.3 - Number of projects by ICT network type
Source: IHS Markit, July 2016 © 2016 IHS

14
7.0 SMART CITY INVESTMENT Although many of the current smart city projects around the world are being funded by government initiatives, this is not a sustainable strategy for smart city development. Cities that want to implement large-scale smart city projects that deliver tangible long-term benefits to citizens will need to find additional ways of funding projects. To understand how much US cities are currently investing in smart city projects, participants were asked to estimate their city’s annual spend on smart city projects as a percentage of their total budget, and their city’s estimated cumulative capital expenditure on smart city projects from 2015 to 2017. Figure 7.1 shows that out of a sample of 47 cities, 18 estimate they spend between 1 and 5% of annual budget on smart city projects, 11 that they spend between 0 and 1%, four that they spend between 5 and 10%; 14 answered that they did not know the proportion of annual budget spent on smart city projects.
0 10 20 30 40
Do not seek counsel
Seek advice from Internal Counsel
Seek advice from External Counsel
Figure 6.4 Use of counsel
Source: IHS, 2016 © 2016 IHS

15
34 cities out of the 54 that participated in the survey gave an estimate of how much cumulative capital investment their city would make from 2015 to 2017. As Figure 7.2 shows, 12 of the 34 cities that answered this question estimated spending between $1 million and $5 million. Of the 12 cities in this category, seven are mid-sized, three are small, and one is a large city. Eight cities estimated spending less than $1 million, comprising five small cities and three mid-sized cities. Another eight cities estimated spending between $6 million and $25 million; this group included four mid-sized cities, three small cities, and one large city. A total of three cities – all mid-sized – estimated spending between $26 million and $75 million; and a further three cities – two mid-sized and one large – estimated spending more than $75 million.
0
2
4
6
8
10
12
14
16
18
20
Do not know 0-1% 1-5% 5-10%
Figure 7.1 - Annual city budget spent on smart city projects(% of total budget)
Source: IHS Markit, July 2016 © 2016 IHS

16
It is unsurprising to see most small cities featuring at the lower end of the scale, as these cities will have comparably limited financial resources to invest in smart city projects. Only three large cities answered the question, and each falls into a different CapEx category – $1 million to $5 million, $6 million to $25 million, and more than $75 million. It is surprising that there are no large cities in the second-highest capex category - $26 million to $75 million – however, this could be because of the small sample size of large cities. If more had answered this question, there would likely be some in this category as well. Mid-sized cities feature in each category, with most mid-sized cities estimating cumulative CapEx between $1 million and $5 million dollars; it is interesting to see mid-sized cities featuring in the higher CapEx categories. This could be because mid-sized cities want to use these smart city projects to attract more citizens and bolster economic development, or they might be expecting large population growth and want to prepare for that; another reason that mid-sized cities are sometimes more active in developing smart city projects than large cities is because they are able to deploy projects more easily because they are smaller.
8.0 CONCLUSION Although the US smart cities market is at an early stage, it is poised to grow quickly as many cities are currently planning and implementing projects. These projects will not be limited to large cities, but will take place in small and mid-sized cities as well. However, funding remains a challenge which needs to overcome in order for smart city projects to develop beyond trials and bring positive improvements to cities across the United States.
0
2
4
6
8
10
12
14
Less than 1M $1-5M $6-25M $26-75M More than$75M
Over 1M
150K-1M
Less than 150K
Figure 7.2 - Estimated cumulative capex in smart city projects from 2015 to 2017
Source: IHS Markit, July 2016 © 2016 IHS
Nu
mb
ero
f ci
ties
City population:

17
Although government initiatives are helping encourage growth in the sector, they are not a sustainable source of funding for long-term projects. The majority of cities surveyed estimated a cumulative CapEx investment of between $1 million and $5 million – this is quite a modest sum, and indicates that for the near future the majority of US smart city projects will remain small in scale. Once some of the challenges of funding are met, IHS Markit predicts that larger projects will become more common. The US smart cities area is at an interesting stage, where there is a lot of activity and many planned projects across the country, focusing on a wide range of city challenges. The progress of projects in the United States will be watched closely by cities around the world looking for ways to meet similar challenges.

18
19
Appendix–CityCaseStudies
1.0 BOSTON, MASSACHUSETTS
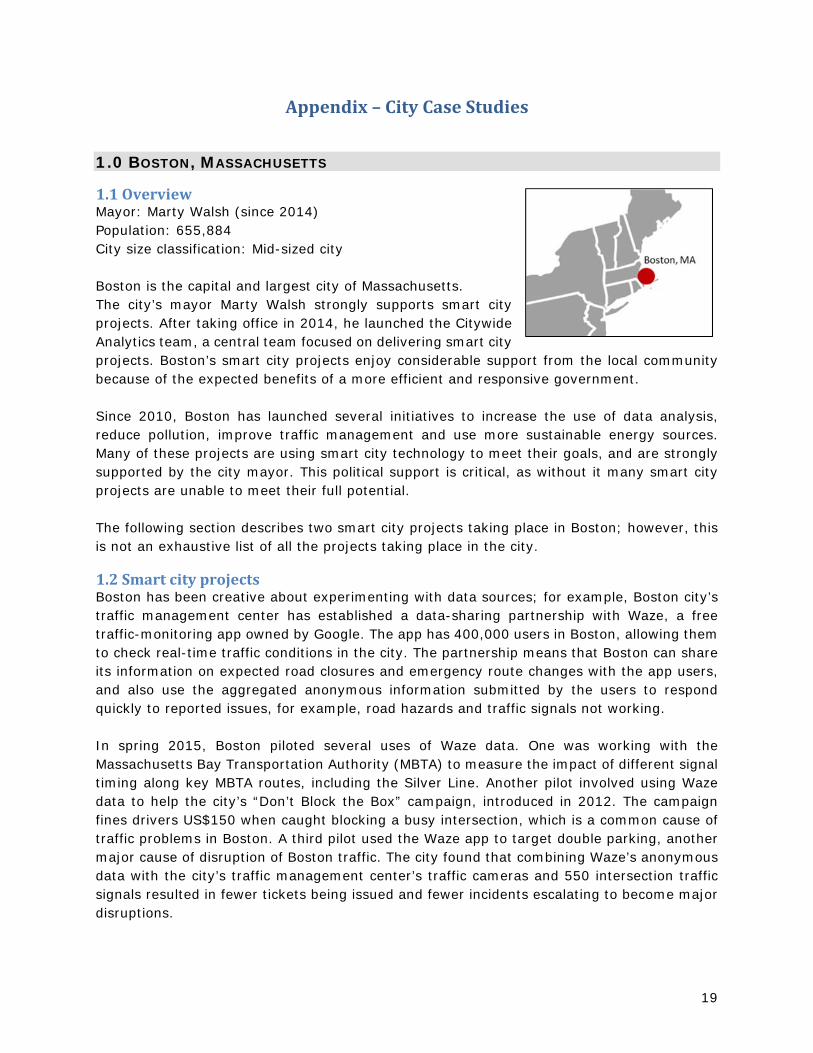
1.1OverviewMayor: Marty Walsh (since 2014) Population: 655,884 City size classification: Mid-sized city Boston is the capital and largest city of Massachusetts. The city’s mayor Marty Walsh strongly supports smart city projects. After taking office in 2014, he launched the Citywide Analytics team, a central team focused on delivering smart city projects. Boston’s smart city projects enjoy considerable support from the local community because of the expected benefits of a more efficient and responsive government. Since 2010, Boston has launched several initiatives to increase the use of data analysis, reduce pollution, improve traffic management and use more sustainable energy sources. Many of these projects are using smart city technology to meet their goals, and are strongly supported by the city mayor. This political support is critical, as without it many smart city projects are unable to meet their full potential. The following section describes two smart city projects taking place in Boston; however, this is not an exhaustive list of all the projects taking place in the city.
1.2SmartcityprojectsBoston has been creative about experimenting with data sources; for example, Boston city’s traffic management center has established a data-sharing partnership with Waze, a free traffic-monitoring app owned by Google. The app has 400,000 users in Boston, allowing them to check real-time traffic conditions in the city. The partnership means that Boston can share its information on expected road closures and emergency route changes with the app users, and also use the aggregated anonymous information submitted by the users to respond quickly to reported issues, for example, road hazards and traffic signals not working. In spring 2015, Boston piloted several uses of Waze data. One was working with the Massachusetts Bay Transportation Authority (MBTA) to measure the impact of different signal timing along key MBTA routes, including the Silver Line. Another pilot involved using Waze data to help the city’s “Don’t Block the Box” campaign, introduced in 2012. The campaign fines drivers US$150 when caught blocking a busy intersection, which is a common cause of traffic problems in Boston. A third pilot used the Waze app to target double parking, another major cause of disruption of Boston traffic. The city found that combining Waze’s anonymous data with the city’s traffic management center’s traffic cameras and 550 intersection traffic signals resulted in fewer tickets being issued and fewer incidents escalating to become major disruptions.

20
Another interesting smart city project taking place in Boston is its ‘CityScore’, a new initiative launched in January 2016. The project looks at near-real-time data on 24 metrics to assess how well the city is performing in areas including public safety, education, health and human services, and transportation. The metrics are combined into a single number that represents the city’s overall performance. A score of 1 means that the city is on target, less than 1 means that the city is not meeting its target and a score of more than 1 means the city is exceeding its target. The data can be broken down by day, week, month and quarter, allowing Boston to identify trends over time. Every department has a data dashboard, as does the Boston Mayor, and all data is also available online for all citizens. A low score can prompt a direct response for improvements. The platform was developed by Boston’s Citywide Analytics Team, created by Boston city mayor Marty Walsh in 2014 as part of his strategy to modernize the city’s technology assets. The Citywide Analytics team serves as a central point for the city to gather information and work across traditional departmental divisions, drive new public-private partnerships for data projects, engage colleges and tech companies, and identify outside funding to help expand the project’s impact throughout the city.

21
2.0 CHICAGO, ILLINOIS
2.1OverviewMayor: Rahm Emanuel (since 2011) Population: 2.7 million City size classification: Large city Chicago, Illinois, is one of six large cities that completed the survey and is the third most populous city in the United States. Chicago is a global leader in smart city development, and City Mayor Rahm Emanuel has committed to use modern infrastructure, smart communities and innovations in technology to make Chicago the most data-driven city in the world. In September 2013, the City of Chicago published its Technology Plan, detailing five strategies split out into 28 initiatives to use technology to fuel opportunity, inclusion, engagement, and innovation within the city. Several smart city projects are included in the plan. The five strategies of the Chicago Tech Plan are:
Next-generation Infrastructure: establishing next-generation infrastructure to enable residents and businesses to become more digitally engaged. The three main initiatives involve: increasing speed and availability of broadband in Chicago, enabling a “digital public way”, and implementing policies and infrastructure for urban technology experiments.
Every Community a Smart Community: ensuring full participation of all residents
and businesses in the digital economy through training and engagement programs and making technology relevant, useful and productive for all. Nine initiatives involved, including establishing a smart community benchmark and toolkit for broadband access and use; scaling up smart communities; making free Wi-Fi available; and increasing options for low-cost broadband.
Efficient, Effective, and Open Government: leveraging data and new technology
to make government more efficient, effective, and open. Six initiatives are involved, including using data to drive efficiency and effectiveness, increasing and improving city data, and leveraging technology to improve communications.
Civic Innovation: working with civic technology innovators to develop creative
solutions to city challenges. The two main initiatives involve using data analytics to help explore and solve municipal problems, and bolstering transparency as well as supporting civic hackers.
Technology Sector Growth: encouraging growth in Chicago’s technology sector by
attracting and retaining STEM (Science, Technology, Engineering, and Math) professionals and supporting the creation and expansion of technology companies. The main initiatives within this strategy involve: increasing the number of physical

22
incubators, collaborative spaces, and networks to connect entrepreneurs with customers, venture capital and mentorship opportunities; encouraging technology firms to promote their ties to Chicago; and strengthening connections with world-renowned academic research institutions.
2.2SmartcityprojectsOne of Chicago’s major smart city projects is City Digital, renamed in September 2015 from CityWorks. The project involves a consortium of Microsoft, Accenture, ComEd, Siemens and UI (universities and industries) Labs and the City of Chicago to focus on urban infrastructure innovation and investigate how technology can help design and operate more efficient cities. Chicago will be used as a giant laboratory to gather data and develop new technologies. The City Digital Project will fund six to eight demonstration projects in four areas: energy management, physical infrastructure, water and sanitation, and transportation. Across all these areas, pilot projects will be deployed to expand, improve and apply the use of sensing technologies, real‐time data collection, geographic information systems, analytics and insight, and predictive algorithms. In mid-September 2015, the first live pilot projects were revealed, including a project to map Chicago’s underground infrastructure. This planned project will apply LIDAR (Light Detection and Ranging) surveying technology and analytics technology to create a digital inventory of Chicago's underground assets, including water, sewage and utility pipes. This application will enhance the coordination between several City departments, utilities and infrastructure partners, reduce redundant digging operations, increase accuracy of utility information and improve underground design coordination. The pilot includes a commercialization plan, so if successful it can be quickly rolled out across Chicago and in other cities.

23
3.0 COLUMBUS, OHIO
3.1OverviewMayor: Andrew Ginther (since 2016) Population: 850,106 City size classification: Mid-sized city Columbus is the capital and largest city of the state of Ohio, with a population of 850,106, according to 2015 US Census Bureau estimates, which also rank Columbus as the 15th largest city in the United States. In a report published in 2014, Columbus was named as one of the top 15 cities by numerical population growth, gaining 12,421 new citizens between 2013 and 2014. The city’s population has grown from 790,694 in 2010 to 850,106 in 2015, an increase of almost 60,000. Columbus is an interesting case study for smart city development, not only because it recently won the US Department of Transport’s (US DOT) Smart Cities Challenge, a grant for $40 million, but also because of its fast growth and development potential. In addition, Columbus is often described as “America’s test market”, because many retailers choose the city to test new products before introducing them nationwide. Retailers choose Columbus for several reasons: first, the city’s demographics and purchasing preferences are highly representative of the American average; and secondly, the city has a large student population of young consumers who will be setting tomorrow’s trends and are more likely to adopt new products and technology.
3.2SmartcityprojectsOn June 23, 2016 it was announced that Columbus had won the US DOT’s Smart Cities Challenge. In addition to a $40 million grant from the DOT, the city will receive $10 million from Vulcan Inc. (a company founded in 1986 by investor and philanthropist Paul Allen), and $90 million in local contributions. A total of 78 cities entered the challenge and Columbus had to compete against six other finalist cities to win the grant. Commenting on the choice of Columbus as the competition winner, Secretary of Transportation Anthony Foxx said that, “Columbus was chosen because it put forward an impressive holistic vision for how all its residents can move better and access opportunity.” What is interesting about the plans for smart city development in Columbus is that they harness new technology to try and solve important city problems, rather than just being focused on investing in new technology for its own sake. For example, Columbus’ infant-mortality rate is four times the national average, and as part of its smart city proposal, Columbus included plans to address this by developing a mobility app to connect mothers, transportation providers, and medical offices. The project also includes plans to provide better mobility and transport for low income neighborhoods, such as Linden, in order to increase citizens’ access to jobs and city facilities.

24
In addition, the city is planning to develop a new bus-rapid-transit system and install street-side mobility kiosks, smart street lighting, and traffic signals that communicate with vehicles and adjust their signals in real-time to the demands of traffic.

25
4.0 KETCHUM, IDAHO
4.1OverviewMayor: Nina Jonas (since 2013) Population: 2,728 City size classification: Small city Ketchum is a small city in Blaine County, Idaho with a population of 2,728, according to 2015 US Census Bureau estimates. In addition to these permanent residents, a further 2,700 people work in the city. Ketchum is adjacent to Sun Valley and the communities share many resources; both sit in the same valley beneath Bald Mountain, a famous ski resort. Interestingly, despite being one of the smallest cities to complete the survey, Ketchum has implemented and is planning several smart city projects. This is a trend that IHS Markit sees across the globe, especially in Europe as well as the United States, indicating that smart city development will not be limited to very large cities as was once thought. However, it may be the case that smaller cities need to collaborate with neighboring cities in the same county to share resources and investment costs.
4.2SmartcityprojectsOne of the projects that Ketchum has already started implementing is the ‘Walkable Ketchum Project’ which is designed to make the city more pedestrian-friendly. This project is being led by the Ketchum Community Development Corporation (KCDC) and aims to improve signage, infrastructure, and public policies in order to make the city easier to walk around. The initial phase, now fully implemented, includes directional and locational signage for pedestrians, cyclists and vehicles, as well as nine solar streetlights in the downtown area. These new street lights will not only improve pedestrian safety, but because they are equipped with sensors and able to dim automatically, in addition to being solar-powered, they will help the city to reduce energy costs and energy consumption. The Ketchum Urban Renewal Authority (KURA) invested $111,500 in the first phase of the project which covered the development and installation of wayfinding signage and solar streetlights throughout the city. Regarding planned projects, Ketchum is planning a smart irrigation project that will involve replacing existing irrigation systems with weather and soil activated sensing equipment that can be managed and monitored remotely. In June 2016, the city received a $10,000 grant from the Idaho Water Resource Board to conserve groundwater from city wells by upgrading irrigation systems in four city parks, namely the Ketchum Bike Park, Guy Coles Skate Park, Edelweiss Park, and Forest Service Park. The upgraded irrigation systems are designed to reduce water use by 20 to 60 percent, which will save more than 1 million gallons of water per year. In addition to the $10,000 grant from the Idaho Water Resource Board the city will provide funds of $20,000. Technology upgrades will include installation of “smart clocks,” plus new pipes and sprinkler heads where they are needed to maintain consistent water pressure.

26
These two projects reflect another interesting trend; smaller cities tend to focus on smart city projects that deliver a clear, tangible return on investment, such as smart street lighting or resource management, rather than more experimental projects, which are more commonly seen in large cities.

27
5.0 LOUISVILLE, KENTUCKY
5.1OverviewMayor: Greg Fischer (since 2011) Population: 615,366 City size classification: Mid-sized city Louisville, Kentucky, is a mid-sized city with a population of 615,366, according to 2015 US Census Bureau estimates. Like many other mid-sized cities that are investing in smart city projects, Louisville is focusing on using this new technology to solve a specific problem – in this case improving the quality of life for asthmatics and allergy sufferers.
5.2SmartcityprojectsThe city of Louisville is a challenging environment for asthma and allergy sufferers. For example, in 2014, the Asthma and Allergy Foundation of America named it as one of the top 20 most difficult US cities to live in with asthma, and the number one “Spring Allergy Capital”. In 2012, the city partnered with Propeller Health to launch a project called AirLouisville, which was designed to help asthma sufferers enjoy a better quality of life through smart technology. Propeller Health runs a digital platform for respiratory health management, and provides users with a connected sensor that can be attached to their normal inhaler. The sensor is compatible with most inhaler types, and the data that it collects is available to users via a mobile app and internet platform. This data can help users identify which situations trigger their asthma, so they can manage their lifestyle to avoid triggers that they are sensitive to. The system can also be used to remind users to take medication, or to send messages to caregivers about how often the medication is being used. After a successful first stage of the project in 2012, when 300 residents were given a Propeller sensor to attach to their inhaler, the project has been expanded to two thousand Louisville/Jefferson County residents with asthma. The data from the inhaler is not only being used to help individuals to manage their asthma better, but is being used by the city to create a near real-time map which shows how asthma users are being affected by the city’s environment. This data will help city leaders make policy decisions that help reduce air pollution, and therefore improve the quality of life of citizens with asthma. The AirLouisville project is a collaborative project involving public, private and philanthropic organizations to use digital health technology to improve the asthma situation. Propeller Health and the Institute for Healthy Air, Water and Soil are leading the program with support from the City of Louisville, the Mayor's office and the Louisville Metro Department of Public Health and Wellness. In addition to local Louisville residents, a coalition of seven employers, three healthcare providers, a health plan and three advocacy groups have committed to enrolling patients,

28
members, dependents, and employees. The program includes local employers, Metro Louisville employees, the University of Louisville Pediatrics, and healthcare providers including Family Allergy & Asthma, JenCare, and Passport Health Plan. The American Lung Association of the Midland States, the Asthma and Allergy Foundation of America, and the Kentucky chapter of The Nature Conservancy are also supporting the program.

29
6.0 NYC, NEW YORK
6.1OverviewMayor: Bill de Blasio (since 2014) Population: 8.6 million City size classification: Large city New York is the most populous city in the United States, with an estimated population of 8.6 million in 2015. It is located at the southern tip of the state of New York, and is the center of the New York metropolitan area, one of the most populous urban agglomerations in the world. The city consists of five boroughs – Brooklyn, Queens, Manhattan, The Bronx, and Staten Island – each of which is a separate county of New York State. New York is a leading global city in many arenas, including business and finance as well as fashion and culture. Because of the city’s global standing, any smart city projects taking place in New York will receive international attention and could influence global smart city trends. In 2014, the City of New York launched ‘One New York: The plan for a strong and just city.’ Also known as ‘OneNYC’, this initiative has created a roadmap for city development which focuses on improving economic growth, sustainability, resilience, and making New York an equitable city. Smart city projects using internet-connected devices will play an important part in meeting these goals. For example, the Mayor's Office of Technology and Innovation (MOTI) is spearheading New York’s ‘Smart City, Equitable City’ strategy for technology and innovation. This strategy intends to improve the lives of all New Yorkers and communities across the five boroughs by:
Establishing principles and strategic frameworks to guide connected device and Internet of Things (IoT) implementation,
Serving as the coordinating entity for new technology and IoT deployments across all City agencies,
Collaborating with academia and the private sector on innovative pilot projects, and Partnering with municipal governments and organizations around the world to share
best practices and leverage the impact of technological advancements. The section below focuses on one specific project taking place in New York, the LinkNYC project.
6.2Smartcityprojects In 2014 the City of New York launched the LinkNYC project, a municipal initiative that provides a fast, free Wi-Fi network to New Yorkers. The project has repurposed the city’s disused payphone infrastructure with kiosks that provide high speed Wi-Fi, free phone calls to anywhere in the United States and access to 911, 311, and 411 services. The project is being

30
run by CityBridge, a consortium including Intersection (which is owned by Alphabet’s Google), Qualcomm, and CIVIQ Smartscapes. LinkNYC started its beta phase in January 2016, and the city plans to install at least 7,500 kiosks across all five New York boroughs in the next eight years. The kiosks will be installed in low- and medium-income neighborhoods as well as affluent ones as part of the city’s effort to bridge the digital divide and bring the benefits of better connectivity to all its citizens. Each kiosk is powered by an all-new purpose-built fiber optic network that delivers speeds up to 100 times faster than average public Wi-Fi and features an Android tablet to allow people to use the internet for free, access city services, and look up local maps and directions. There are several things that make LinkNYC a really exciting smart city project. First, the project is funded through advertising which makes it commercially sustainable – something that is highlighted as a challenge for smart city projects. Each kiosk has large, digital advertising screens, and the revenues from them pays for the free Wi-Fi and other services provided. Secondly, this project will facilitate future smart projects by providing key infrastructure. As in smart street-lighting systems, the positioning of the kiosks throughout the city will create a connectivity network which can be used to facilitate other smart city projects in the future. In fact, LinkNYC is planning to provide additional apps and services through its kiosks on an in-going basis over the next few years. Thirdly, the project is designed to deliver tangible benefits to citizens and city visitors now and in the future. In addition to providing local information and access to emergency and city services, the kiosks include opt-in location services through Bluetooth beacon technology. These beacons send one-way signals from the kiosks to mobile devices of people who have chosen to receive them, and the improved accuracy they provide could allow new services to be developed, such as location-specific information, or more accurate navigation services for people with mobility issues. Kiosks also have USB charging ports and allow free internet browsing on their integral tablets, which not only create convenience for citizens, but will also help bridge the digital divide in New York, where more than 25% of citizens do not have access to high speed broadband at home. Because the kiosks provide immediate, tangible benefits, they will be adopted more quickly by citizens than other projects which take longer to provide them.


The United States Conference of Mayors
1620 Eye Street, NWWashington, DC 20006Tel: 202.293.7330Fax: 202.293.2352usmayors.org
The Council on Metro Economies and the New American City
1620 Eye Street, NWWashington, DC 20006Tel: 202.861.6712Fax: 202.293.2352newamericancity.org