chapter two: the economics of homelessnessb.3cdn.net/naeh/ef467ab505e3e4748e_shm6y145n.pdf · the...
TRANSCRIPT

| CHAPTER TWO | The State of Homelessness in America
24
CHAPTER TWO:
THE ECONOMICS OF HOMELESSNESS
Although homelessness is often ascribed to characteristics of individual homeless
people, the root cause of homelessness can largely be explained by economics:
people who become homeless have insufficient financial resources to obtain or
maintain housing. This is especially the case for 83 percent of the homeless
population who experience episodic, transitional, or temporary periods of
homelessness.
An exemplification of the economic challenges that people in poverty face in
obtaining housing is the level of housing cost burden. Housing is considered
affordable when it accounts for 30 percent or less of monthly household income.
There are nearly 40 million U.S. renter households and nearly 1 in 4 are severely
housing cost burdened, meaning they spend 50 percent or more of their monthly
income for housing.1 Households below the poverty line face the most acute cost
burden and spend a considerably larger fraction of their incomes on rent.
Analysis of data from the U.S. Census Bureau’s 2010 American Community
Survey (ACS) shows that 75 percent of households at or below the poverty line
are severely housing cost burdened. When housing accounts for 50 percent or
more of a household’s resources, any unexpected financial crisis could jeopardize
housing stability and lead to an increased risk of homelessness.
While housing affordability is an issue across the nation, data show that
problems of severe housing cost burden vary by state. Table 2.1, which shows
states with the highest and lowest levels of housing cost burden among poor
renter households, reveals that Hawaii and Nevada have rates of severe housing
cost burdens of over 80 percent. The table also shows that even in the state with
the lowest level of housing cost burden, Maine, nearly 60 percent of households
below the poverty line are paying 50 percent or more of their incomes for
housing.
1 Joint Center for Housing Studies of Harvard University (2011) America’s Rental Housing: Meeting Challenges, Building on
Opportunities, Joint Center for Housing Studies of Harvard University, Cambridge, MA.

National Alliance to End Homelessness | CHAPTER TWO | 25
Table 2.1 States with Highest and Lowest Rates of Severe Housing Cost
Burdens among Poor Renter Households, 2010
Highest Rates,
Severe Housing
Cost Burden
Rate of
Homelessness
Lowest Rates, Severe
Housing Cost
Burden
Rate of
Homelessness
Hawaii 82.17 45 Maine 59.67 18
Nevada 80.97 39 South Dakota 63.34 10
New Jersey 79.67 16 West Virginia 64.67 12
Florida 79.31 30 Nebraska 66.46 19
California 78.19 36 Montana 66.48 18
Consistent with high levels of housing cost burden among people in poverty, one
of the most frequently self-reported reasons for homelessness is the inability to
afford housing. Another commonly self-reported reason is the lack or loss of a
job.2 Data from the U.S. Department of Labor’s Bureau of Labor Statistics (BLS)
show that the annual rate of unemployment in 2010 was 9.6 percent, the highest
annual rate since 1983.3 Table 2.2 shows states with the highest and lowest
unemployment rates in 2010. As indicated in the table, rates vary widely between
the states. Nevada’s unemployment rate – the highest in the country – was
almost four times higher than the lowest rate in North Dakota.
In addition to lack or loss of employment, low earnings among those who work
also affect the ability to afford housing. Analysis of the 2010 ACS shows that
workers in poor households who work at least 27 weeks out of the year earn only
20 percent of the national average for all workers. At $9,413 per year, a
household supported by a single worker earning the average poor worker
2 See National Alliance to End Homelessness and others (2009) “Foreclosure to Homelessness” webpage at
http://www.endhomelessness.org/section/data/interactivemaps/foreclosure. See especially survey results from Dallas,
Indianapolis, and San Francisco. 3 See U.S. Department of Labor’s Bureau of Labor Statistics, “annual average unemployment rate” webpage at
http://www.bls.gov/cps/prev_yrs.htm.
Table 2.2 States with Highest and Lowest Unemployment Rates, 2010
Highest Unemployment Rates Lowest Unemployment Rates
Nevada 14.9 North Dakota 3.9
Michigan 12.5 Nebraska 4.7
California 12.4 South Dakota 4.8
Rhode Island 11.6 Iowa 6.1
Florida 11.5 New Hampshire 6.1

| CHAPTER TWO | The State of Homelessness in America
26
income would need to find housing at less than $235 per month, in order for that
housing to be considered affordable. Fair market rents for a one-bedroom
apartment exceed this in every county in the U.S.4
It is also important to note the effect that foreclosure has had on current housing
trends in the country. People who lose housing due to a foreclosure are generally
not at high risk of experiencing immediate homelessness. Still, anecdotal
evidence suggests that some people who lose their housing due to foreclosure
turn to the homeless shelter system.5 Most who do so are renters who lived in
foreclosed rental properties, but some are identified as owners. Table 2.3 shows
the states with the highest and lowest foreclosure rates and the disproportionate
number of foreclosures in Nevada, Arizona, and Florida.
4 Fair Market Rent (FMR) is defined as the 40th percentile of gross rents for typical, non-substandard rental units occupied
by recent movers in a local housing market. For an FMR county data file, see U.S. Department of Housing and Urban
Development, “County Level Data File” on the “2010 Fair Market Rents” webpage at
http://www.huduser.org/portal/datasets/fmr/fmr2010f/index.html#2fmr. 5 See National Alliance to End Homelessness and others (2009) “Foreclosure to Homelessness: the Forgotten Victims of
the Subprime Crisis” webpage at
http://www.endhomelessness.org/content/article/detail/2409.
Table 2.3 States with Highest and Lowest Rates of Foreclosure, 2010
States with Highest Rates of
Foreclosure (1/x Housing Units)
States with Lowest Rates of
Foreclosure (1/x Housing Units)
Nevada 1 in 11 Vermont 1 in 795
Arizona 1 in 17 West Virginia 1 in 667
Florida 1 in 18 North Dakota 1 in 642
California 1 in 25 Wyoming 1 in 302
Utah 1 in 29 South Dakota 1 in 291

National Alliance to End Homelessness | CHAPTER TWO | 27
Changes in the Economics of Homelessness in
the United States, 2009 to 2010
Chapter One documented the changes in overall homelessness and in
homelessness among several subpopulations from 2009 to 2011, a period that
encompasses a portion of the most recent recession and some of its aftermath.
Homelessness, however, is considered a lagging indicator and changes in related
economic factors (e.g. poverty and unemployment) can lead to future increases
in homelessness.6 A review of the changes in the economic risk factors described
in the first section of this chapter—severely cost burdened poor renter
households, unemployed people, average income of working poor people, and
housing units in foreclosure—provides insight into the impact of the recent
recession on homelessness.
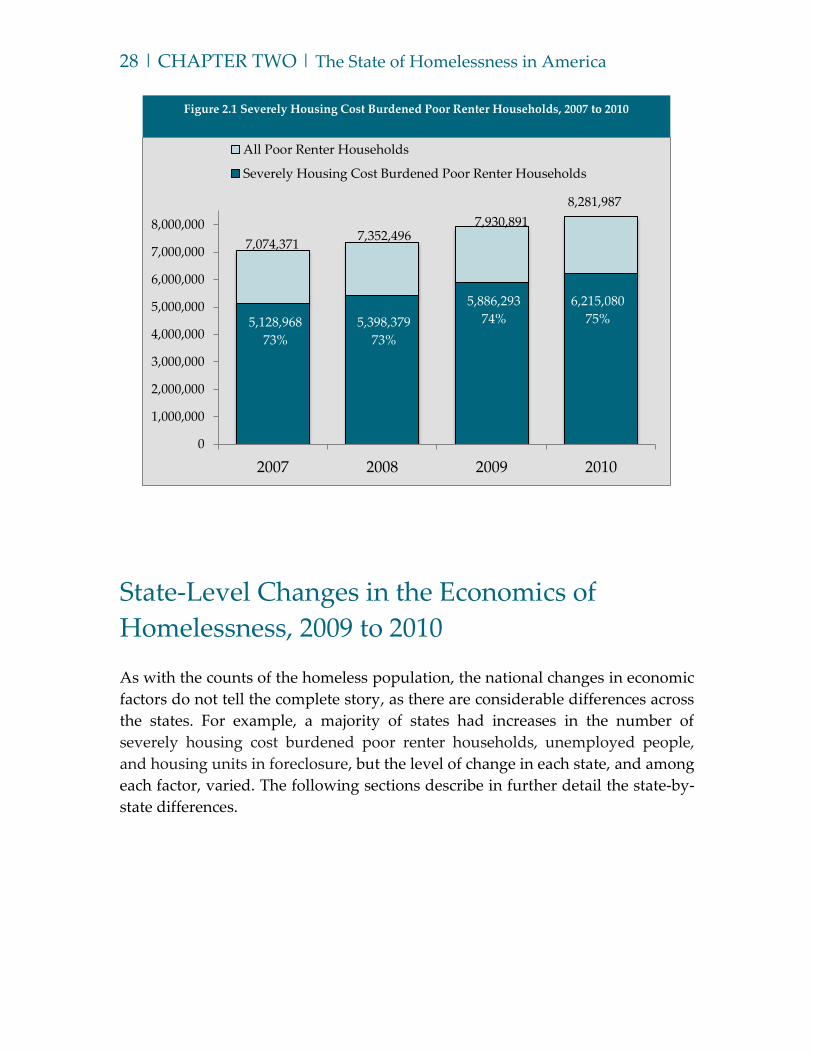
Table 2.4 shows the changes in each of the economic factors related to
homelessness. Although the average income of a working poor person increased
by 1 percent from 2009 to 2010, the percentage of severely housing cost burdened
poor renter households, unemployed people, and residential units in foreclosure
worsened during the same time period. These indicators are a reflection of the
continued impact of the recession on vulnerable people and families. Most
specifically, the 6 percent increase in the nation’s population of severely housing
cost burdened poor renter households directly reflects the root cause of
homelessness: the inability to afford housing. Figure 2.1, located on the next
page, reveals the historical changes in severely housing cost burdened poor
renter households, which increased 22 percent from 2007 to 2010.
6 Homelessness Research Institute (2011) Increases in Homelessness on the Horizon, National Alliance to End Homelessness,
Washington, DC.
Table 2.4 National Changes in Economic Factors, 2009 to 2010
Factor 2009 2010
Percent Change
2009 to 2010
Severely Housing Cost Burdened
Poor Renter Households 5,886,293 6,215,080 6 %
Unemployed People 14,265,000 14,825,000 4%
Average Income of Working Poor
People $9,301 $9,413 1%
Residential Units in Foreclosure 2,824,674 2,871,891 2%
| CHAPTER TWO | The State of Homelessness in America
28
State-Level Changes in the Economics of
Homelessness, 2009 to 2010
As with the counts of the homeless population, the national changes in economic
factors do not tell the complete story, as there are considerable differences across
the states. For example, a majority of states had increases in the number of
severely housing cost burdened poor renter households, unemployed people,
and housing units in foreclosure, but the level of change in each state, and among
each factor, varied. The following sections describe in further detail the state-by-
state differences.
Figure 2.1 Severely Housing Cost Burdened Poor Renter Households, 2007 to 2010
0
1,000,000
2,000,000
3,000,000
4,000,000
5,000,000
6,000,000
7,000,000
8,000,000
2007 2008 2009 2010
All Poor Renter Households
Severely Housing Cost Burdened Poor Renter Households
8,281,987
7,930,891
7,352,496
7,074,371
6,215,080
75%
5,886,293
74%
5,398,379
73%
5,128,968
73%

National Alliance to End Homelessness | CHAPTER TWO | 29
Severe Housing Cost Burden by State
As described earlier in this chapter, homelessness is often caused by the inability
of a household to afford the cost of housing. To measure changes in the size of
the poor population with housing affordability concerns, data from the U.S.
Census Bureau’s 2009 and 2010 American Community Survey (ACS), which
includes data on annual household income, monthly rent, and household
composition, was used to estimate the number of households whose size and
income qualifies them as below the federal poverty line and paying monthly rent
that is more than 50 percent of their estimated monthly income.
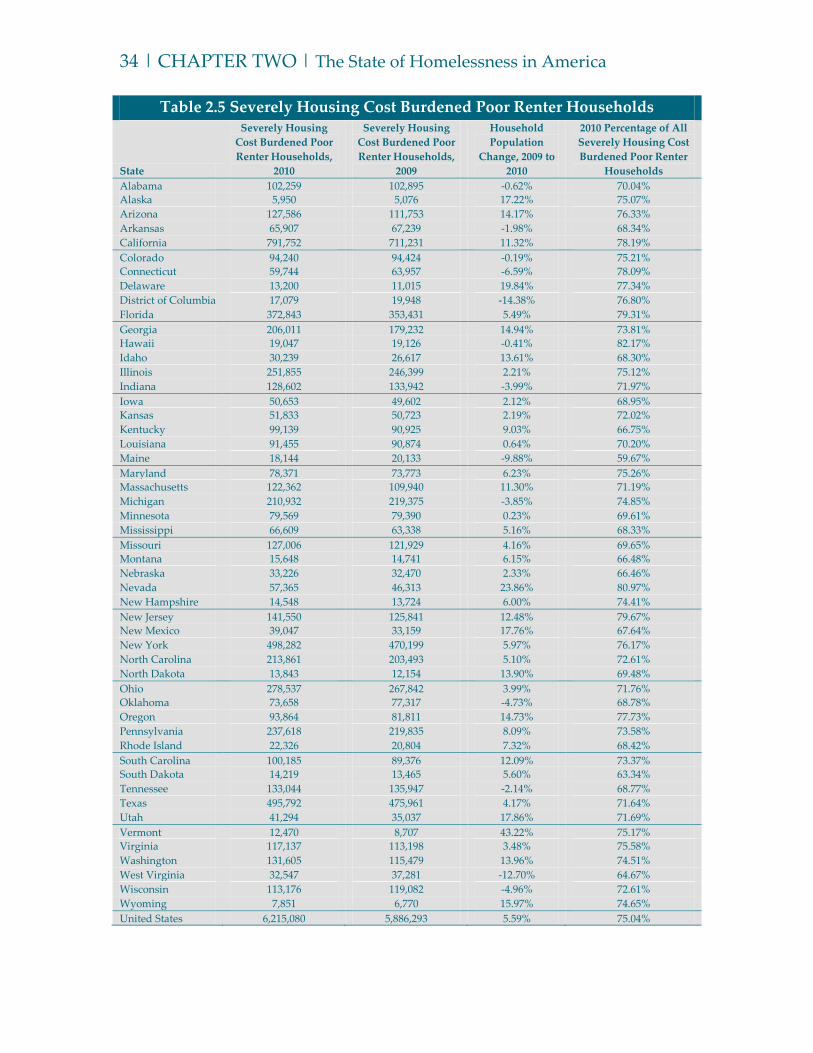
Map 2.1 and Table 2.5 show the change in the number of severely cost burdened
poor renter households from 2009 to 2010 for each of the 50 states, plus the
District of Columbia. The number of poor, severely cost burdened households in
the nation increased by 6 percent (328,787 people), going from 5,886,293 in 2009
to 6,215,080 in 2010. The data show that 38 of 51 states had increases and the
median state change was an increase of 6 percent. State changes range from a 14
percent decrease in the District of Columbia to a 43 percent increase in Vermont.
Map 2.1 Changes in Severely Housing Cost Burdened Poor Renter Households, 2009 to 2010
| CHAPTER TWO | The State of Homelessness in America
30
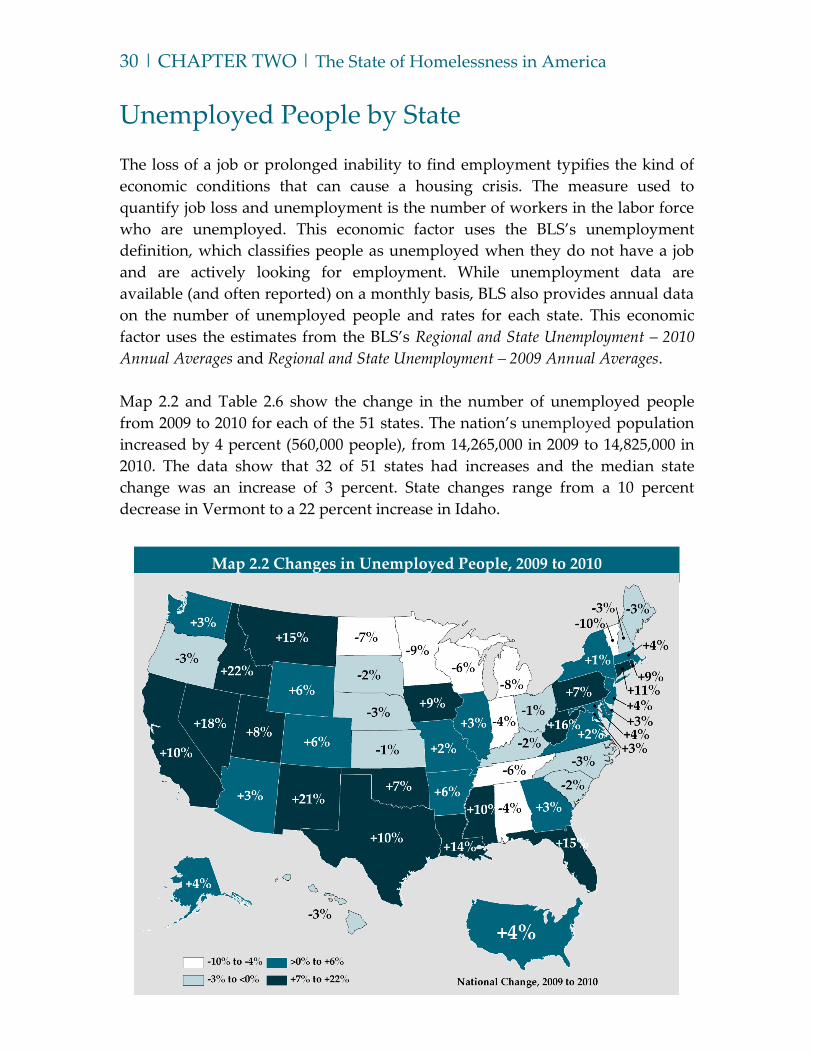
Unemployed People by State
The loss of a job or prolonged inability to find employment typifies the kind of
economic conditions that can cause a housing crisis. The measure used to
quantify job loss and unemployment is the number of workers in the labor force
who are unemployed. This economic factor uses the BLS’s unemployment
definition, which classifies people as unemployed when they do not have a job
and are actively looking for employment. While unemployment data are
available (and often reported) on a monthly basis, BLS also provides annual data
on the number of unemployed people and rates for each state. This economic
factor uses the estimates from the BLS’s Regional and State Unemployment – 2010
Annual Averages and Regional and State Unemployment – 2009 Annual Averages.
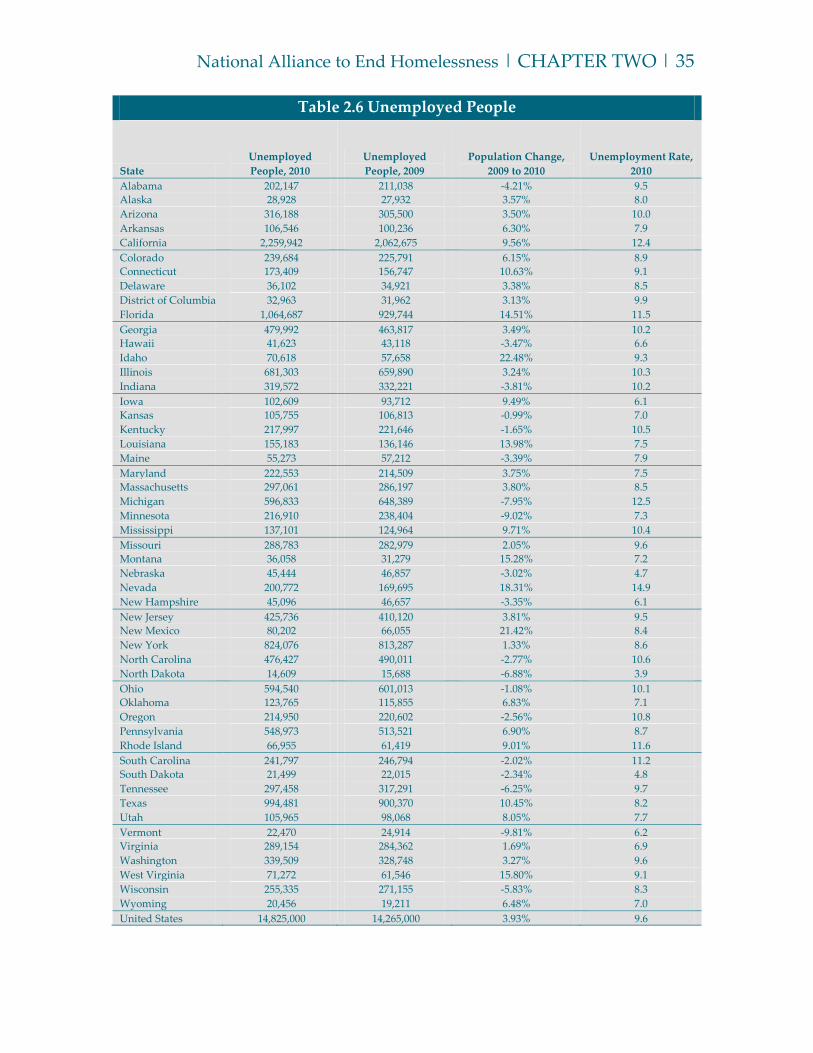
Map 2.2 and Table 2.6 show the change in the number of unemployed people
from 2009 to 2010 for each of the 51 states. The nation’s unemployed population
increased by 4 percent (560,000 people), from 14,265,000 in 2009 to 14,825,000 in
2010. The data show that 32 of 51 states had increases and the median state
change was an increase of 3 percent. State changes range from a 10 percent
decrease in Vermont to a 22 percent increase in Idaho.
Map 2.2 Changes in Unemployed People, 2009 to 2010

National Alliance to End Homelessness | CHAPTER TWO | 31
Average Real Income of Working Poor People
by State
Wage income is the most important resource for maintaining housing for a
majority of working people in the U.S. The measure used to quantify financial
resources available to working poor people for housing and other needs is an
estimate of the average income earned by people in poor households. This
economic factor uses data from the Census Bureau’s 2009 and 2010 ACS, which
includes data on individual income, number of hours worked, and household
poverty status. The BLS’s definition of working poor people was used,7 so this
factor only includes people who have worked at least 27 weeks in the past year.
Incomes of all workers (who worked over 27 weeks) were also calculated to
compare income change among poor workers and all workers. The 2009 incomes
were adjusted to 2010 dollars, so comparisons are of real income.
7 Bureau of Labor Statistics (2011) A Profile of the Working Poor, 2009, U.S. Department of Labor, Washington, DC.
Map 2.3 Changes in Average Income of Working Poor People, 2009 to 2010

| CHAPTER TWO | The State of Homelessness in America
32
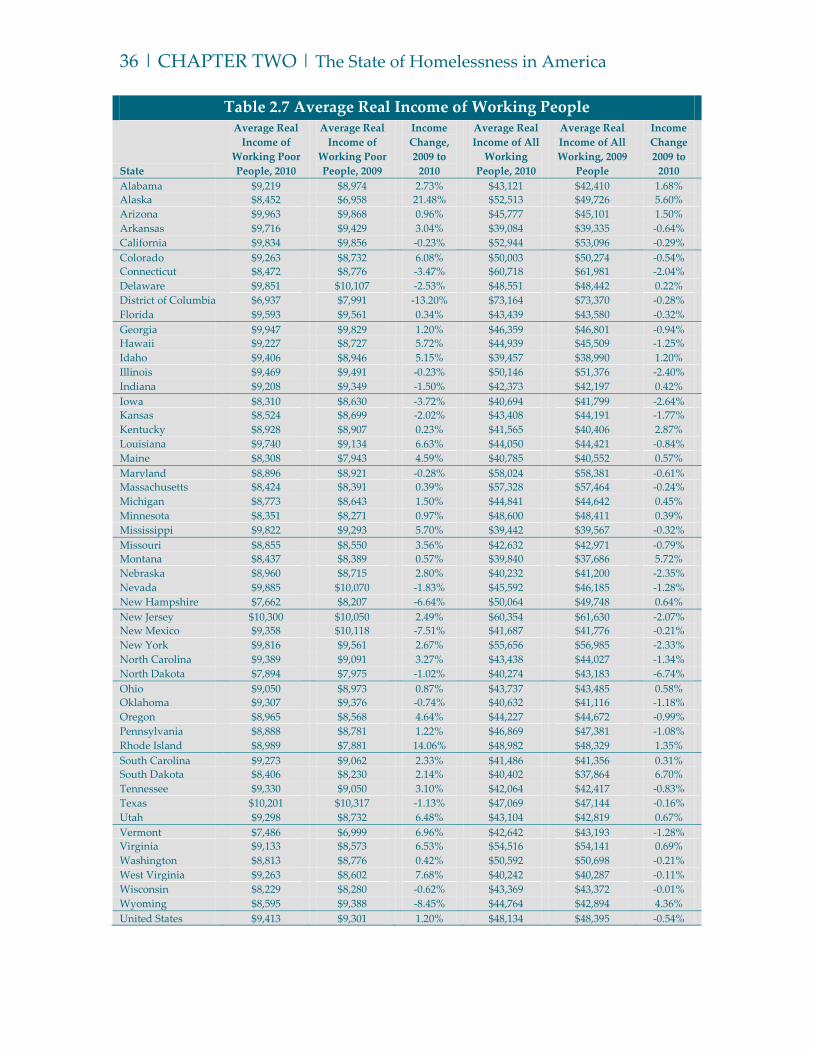
Map 2.3 and Table 2.7 show the change in average real income of working poor
people from 2009 to 2010 for each of the 51 States. The average real income of
working poor people increased 1 percent ($112), going from $9,301 in 2009 to
$9,413 in 2010. The data show that 17 of 51 states had decreases and the median
state change was a decrease of 1 percent. State changes range from a 21 percent
increase in Alaska to a 13 percent decrease in the District of Columbia. The
average real income of all working people decreased less than 1 percent ($261),
going from $48,395 in 2009 to $48,134 in 2010. These changes suggest that while
the income of all working people decreased slightly, the change was not
disproportionately borne by poor workers.
Residential Housing Units in Foreclosure by
State
Recent foreclosure activity has been described as a national “foreclosure crisis”
by some researchers, and evidence suggests that people will continue to be
affected by foreclosure filings on housing units in the coming years.8 While
substantial evidence is not available to suggest that a foreclosure puts the people
in the housing unit at imminent risk of homelessness, foreclosure activity has
had an effect on many individuals and on the housing market. To measure
changes in the housing stock that has been affected by foreclosure, change in the
number of residential housing units in foreclosure was estimated. This economic
factor uses data from RealtyTrac (a real estate research firm), which includes data
on residential housing units with a foreclosure filing as well as foreclosure rates.
Map 2.4 and Table 2.8 show the change in the number of residential housing
units in foreclosure from 2009 to 2010 for each of the 51 states. The national
number of residential housing units in foreclosure increased by 2 percent (47,217
units), going from 2,824,674 in 2009 to 2,871,891 in 2010. The data show that 38 of
51 states had increases and the median state change was an increase of 13
percent. State changes range from a 33 percent decrease in the District of
Columbia to a 175 percent increase in Vermont.
8 D. Gruenstein Bocian, W. Li, C. Reid, and R. Quercia (2011) Lost Ground, 2011: Disparities in Mortgage Lending and
Foreclosures, Center for Responsible Lending, Washington, DC.

National Alliance to End Homelessness | CHAPTER TWO | 33
Map 2.4 Changes in Housing Units in Foreclosure, 2009 to 2010
| CHAPTER TWO | The State of Homelessness in America
34
Table 2.5 Severely Housing Cost Burdened Poor Renter Households
State
Severely Housing
Cost Burdened Poor
Renter Households,
2010
Severely Housing
Cost Burdened Poor
Renter Households,
2009
Household
Population
Change, 2009 to
2010
2010 Percentage of All
Severely Housing Cost
Burdened Poor Renter
Households
Alabama 102,259 102,895 -0.62% 70.04%
Alaska 5,950 5,076 17.22% 75.07%
Arizona 127,586 111,753 14.17% 76.33%
Arkansas 65,907 67,239 -1.98% 68.34%
California 791,752 711,231 11.32% 78.19%
Colorado 94,240 94,424 -0.19% 75.21%
Connecticut 59,744 63,957 -6.59% 78.09%
Delaware 13,200 11,015 19.84% 77.34%
District of Columbia 17,079 19,948 -14.38% 76.80%
Florida 372,843 353,431 5.49% 79.31%
Georgia 206,011 179,232 14.94% 73.81%
Hawaii 19,047 19,126 -0.41% 82.17%
Idaho 30,239 26,617 13.61% 68.30%
Illinois 251,855 246,399 2.21% 75.12%
Indiana 128,602 133,942 -3.99% 71.97%
Iowa 50,653 49,602 2.12% 68.95%
Kansas 51,833 50,723 2.19% 72.02%
Kentucky 99,139 90,925 9.03% 66.75%
Louisiana 91,455 90,874 0.64% 70.20%
Maine 18,144 20,133 -9.88% 59.67%
Maryland 78,371 73,773 6.23% 75.26%
Massachusetts 122,362 109,940 11.30% 71.19%
Michigan 210,932 219,375 -3.85% 74.85%
Minnesota 79,569 79,390 0.23% 69.61%
Mississippi 66,609 63,338 5.16% 68.33%
Missouri 127,006 121,929 4.16% 69.65%
Montana 15,648 14,741 6.15% 66.48%
Nebraska 33,226 32,470 2.33% 66.46%
Nevada 57,365 46,313 23.86% 80.97%
New Hampshire 14,548 13,724 6.00% 74.41%
New Jersey 141,550 125,841 12.48% 79.67%
New Mexico 39,047 33,159 17.76% 67.64%
New York 498,282 470,199 5.97% 76.17%
North Carolina 213,861 203,493 5.10% 72.61%
North Dakota 13,843 12,154 13.90% 69.48%
Ohio 278,537 267,842 3.99% 71.76%
Oklahoma 73,658 77,317 -4.73% 68.78%
Oregon 93,864 81,811 14.73% 77.73%
Pennsylvania 237,618 219,835 8.09% 73.58%
Rhode Island 22,326 20,804 7.32% 68.42%
South Carolina 100,185 89,376 12.09% 73.37%
South Dakota 14,219 13,465 5.60% 63.34%
Tennessee 133,044 135,947 -2.14% 68.77%
Texas 495,792 475,961 4.17% 71.64%
Utah 41,294 35,037 17.86% 71.69%
Vermont 12,470 8,707 43.22% 75.17%
Virginia 117,137 113,198 3.48% 75.58%
Washington 131,605 115,479 13.96% 74.51%
West Virginia 32,547 37,281 -12.70% 64.67%
Wisconsin 113,176 119,082 -4.96% 72.61%
Wyoming 7,851 6,770 15.97% 74.65%
United States 6,215,080 5,886,293 5.59% 75.04%
National Alliance to End Homelessness | CHAPTER TWO | 35
Table 2.6 Unemployed People
State
Unemployed
People, 2010
Unemployed
People, 2009
Population Change,
2009 to 2010
Unemployment Rate,
2010
Alabama 202,147 211,038 -4.21% 9.5
Alaska 28,928 27,932 3.57% 8.0
Arizona 316,188 305,500 3.50% 10.0
Arkansas 106,546 100,236 6.30% 7.9
California 2,259,942 2,062,675 9.56% 12.4
Colorado 239,684 225,791 6.15% 8.9
Connecticut 173,409 156,747 10.63% 9.1
Delaware 36,102 34,921 3.38% 8.5
District of Columbia 32,963 31,962 3.13% 9.9
Florida 1,064,687 929,744 14.51% 11.5
Georgia 479,992 463,817 3.49% 10.2
Hawaii 41,623 43,118 -3.47% 6.6
Idaho 70,618 57,658 22.48% 9.3
Illinois 681,303 659,890 3.24% 10.3
Indiana 319,572 332,221 -3.81% 10.2
Iowa 102,609 93,712 9.49% 6.1
Kansas 105,755 106,813 -0.99% 7.0
Kentucky 217,997 221,646 -1.65% 10.5
Louisiana 155,183 136,146 13.98% 7.5
Maine 55,273 57,212 -3.39% 7.9
Maryland 222,553 214,509 3.75% 7.5
Massachusetts 297,061 286,197 3.80% 8.5
Michigan 596,833 648,389 -7.95% 12.5
Minnesota 216,910 238,404 -9.02% 7.3
Mississippi 137,101 124,964 9.71% 10.4
Missouri 288,783 282,979 2.05% 9.6
Montana 36,058 31,279 15.28% 7.2
Nebraska 45,444 46,857 -3.02% 4.7
Nevada 200,772 169,695 18.31% 14.9
New Hampshire 45,096 46,657 -3.35% 6.1
New Jersey 425,736 410,120 3.81% 9.5
New Mexico 80,202 66,055 21.42% 8.4
New York 824,076 813,287 1.33% 8.6
North Carolina 476,427 490,011 -2.77% 10.6
North Dakota 14,609 15,688 -6.88% 3.9
Ohio 594,540 601,013 -1.08% 10.1
Oklahoma 123,765 115,855 6.83% 7.1
Oregon 214,950 220,602 -2.56% 10.8
Pennsylvania 548,973 513,521 6.90% 8.7
Rhode Island 66,955 61,419 9.01% 11.6
South Carolina 241,797 246,794 -2.02% 11.2
South Dakota 21,499 22,015 -2.34% 4.8
Tennessee 297,458 317,291 -6.25% 9.7
Texas 994,481 900,370 10.45% 8.2
Utah 105,965 98,068 8.05% 7.7
Vermont 22,470 24,914 -9.81% 6.2
Virginia 289,154 284,362 1.69% 6.9
Washington 339,509 328,748 3.27% 9.6
West Virginia 71,272 61,546 15.80% 9.1
Wisconsin 255,335 271,155 -5.83% 8.3
Wyoming 20,456 19,211 6.48% 7.0
United States 14,825,000 14,265,000 3.93% 9.6
| CHAPTER TWO | The State of Homelessness in America
36
Table 2.7 Average Real Income of Working People
State
Average Real
Income of
Working Poor
People, 2010
Average Real
Income of
Working Poor
People, 2009
Income
Change,
2009 to
2010
Average Real
Income of All
Working
People, 2010
Average Real
Income of All
Working, 2009
People
Income
Change
2009 to
2010
Alabama $9,219 $8,974 2.73% $43,121 $42,410 1.68%
Alaska $8,452 $6,958 21.48% $52,513 $49,726 5.60%
Arizona $9,963 $9,868 0.96% $45,777 $45,101 1.50%
Arkansas $9,716 $9,429 3.04% $39,084 $39,335 -0.64%
California $9,834 $9,856 -0.23% $52,944 $53,096 -0.29%
Colorado $9,263 $8,732 6.08% $50,003 $50,274 -0.54%
Connecticut $8,472 $8,776 -3.47% $60,718 $61,981 -2.04%
Delaware $9,851 $10,107 -2.53% $48,551 $48,442 0.22%
District of Columbia $6,937 $7,991 -13.20% $73,164 $73,370 -0.28%
Florida $9,593 $9,561 0.34% $43,439 $43,580 -0.32%
Georgia $9,947 $9,829 1.20% $46,359 $46,801 -0.94%
Hawaii $9,227 $8,727 5.72% $44,939 $45,509 -1.25%
Idaho $9,406 $8,946 5.15% $39,457 $38,990 1.20%
Illinois $9,469 $9,491 -0.23% $50,146 $51,376 -2.40%
Indiana $9,208 $9,349 -1.50% $42,373 $42,197 0.42%
Iowa $8,310 $8,630 -3.72% $40,694 $41,799 -2.64%
Kansas $8,524 $8,699 -2.02% $43,408 $44,191 -1.77%
Kentucky $8,928 $8,907 0.23% $41,565 $40,406 2.87%
Louisiana $9,740 $9,134 6.63% $44,050 $44,421 -0.84%
Maine $8,308 $7,943 4.59% $40,785 $40,552 0.57%
Maryland $8,896 $8,921 -0.28% $58,024 $58,381 -0.61%
Massachusetts $8,424 $8,391 0.39% $57,328 $57,464 -0.24%
Michigan $8,773 $8,643 1.50% $44,841 $44,642 0.45%
Minnesota $8,351 $8,271 0.97% $48,600 $48,411 0.39%
Mississippi $9,822 $9,293 5.70% $39,442 $39,567 -0.32%
Missouri $8,855 $8,550 3.56% $42,632 $42,971 -0.79%
Montana $8,437 $8,389 0.57% $39,840 $37,686 5.72%
Nebraska $8,960 $8,715 2.80% $40,232 $41,200 -2.35%
Nevada $9,885 $10,070 -1.83% $45,592 $46,185 -1.28%
New Hampshire $7,662 $8,207 -6.64% $50,064 $49,748 0.64%
New Jersey $10,300 $10,050 2.49% $60,354 $61,630 -2.07%
New Mexico $9,358 $10,118 -7.51% $41,687 $41,776 -0.21%
New York $9,816 $9,561 2.67% $55,656 $56,985 -2.33%
North Carolina $9,389 $9,091 3.27% $43,438 $44,027 -1.34%
North Dakota $7,894 $7,975 -1.02% $40,274 $43,183 -6.74%
Ohio $9,050 $8,973 0.87% $43,737 $43,485 0.58%
Oklahoma $9,307 $9,376 -0.74% $40,632 $41,116 -1.18%
Oregon $8,965 $8,568 4.64% $44,227 $44,672 -0.99%
Pennsylvania $8,888 $8,781 1.22% $46,869 $47,381 -1.08%
Rhode Island $8,989 $7,881 14.06% $48,982 $48,329 1.35%
South Carolina $9,273 $9,062 2.33% $41,486 $41,356 0.31%
South Dakota $8,406 $8,230 2.14% $40,402 $37,864 6.70%
Tennessee $9,330 $9,050 3.10% $42,064 $42,417 -0.83%
Texas $10,201 $10,317 -1.13% $47,069 $47,144 -0.16%
Utah $9,298 $8,732 6.48% $43,104 $42,819 0.67%
Vermont $7,486 $6,999 6.96% $42,642 $43,193 -1.28%
Virginia $9,133 $8,573 6.53% $54,516 $54,141 0.69%
Washington $8,813 $8,776 0.42% $50,592 $50,698 -0.21%
West Virginia $9,263 $8,602 7.68% $40,242 $40,287 -0.11%
Wisconsin $8,229 $8,280 -0.62% $43,369 $43,372 -0.01%
Wyoming $8,595 $9,388 -8.45% $44,764 $42,894 4.36%
United States $9,413 $9,301 1.20% $48,134 $48,395 -0.54%

National Alliance to End Homelessness | CHAPTER TWO | 37
Table 2.8 Residential Housing Units in Foreclosure
State
Foreclosed Housing
Units, 2010
Foreclosed Housing
Units, 2009
Change in
Foreclosure 2009 to
2010
2010 Rate of Foreclosure
(1/x Housing Units)
Alabama 20,869 19,896 4.89% 103
Alaska 2,654 2,442 8.68% 104
Arizona 155,878 163,210 -4.49% 17
Arkansas 19,757 16,547 19.40% 66
California 546,669 632,573 -13.58% 25
Colorado 54,041 50,514 6.98% 40
Connecticut 21,705 19,679 10.30% 66
Delaware 4,727 3,034 55.80% 83
District of Columbia 2,153 3,235 -33.45% 133
Florida 485,286 516,711 -6.08% 18
Georgia 130,966 106,110 23.42% 31
Hawaii 12,425 9,002 38.02% 41
Idaho 19,088 17,161 11.23% 34
Illinois 151,304 131,132 15.38% 35
Indiana 44,172 41,405 6.68% 63
Iowa 8,663 5,681 52.49% 153
Kansas 11,415 9,056 26.05% 107
Kentucky 12,656 9,682 30.72% 152
Louisiana 15,753 11,750 34.07% 120
Maine 3,502 3,178 10.20% 200
Maryland 42,446 43,248 -1.85% 55
Massachusetts 36,092 36,119 -0.07% 76
Michigan 135,874 118,302 14.85% 33
Minnesota 31,315 31,697 -1.21% 74
Mississippi 5,280 5,402 -2.26% 240
Missouri 33,944 28,519 19.02% 78
Montana 3,307 1,373 140.86% 133
Nebraska 3,377 1,845 83.04% 233
Nevada 106,160 112,097 -5.30% 11
New Hampshire 7,703 7,210 6.84% 78
New Jersey 64,808 63,208 2.53% 54
New Mexico 11,133 7,212 54.37% 78
New York 43,913 50,369 -12.82% 182
North Carolina 40,151 28,384 41.46% 105
North Dakota 488 390 25.13% 642
Ohio 108,160 101,614 6.44% 47
Oklahoma 17,718 12,937 36.96% 92
Oregon 36,958 34,121 8.31% 44
Pennsylvania 51,278 44,732 14.63% 107
Rhode Island 5,246 5,065 3.57% 86
South Carolina 33,063 25,163 31.40% 62
South Dakota 1,244 765 62.61% 291
Tennessee 39,206 40,733 -3.75% 70
Texas 118,923 100,045 18.87% 81
Utah 32,520 27,140 19.82% 29
Vermont 393 143 174.83% 795
Virginia 51,588 52,127 -1.03% 64
Washington 43,856 35,268 24.35% 64
West Virginia 1,329 1,479 -10.14% 667
Wisconsin 39,920 35,252 13.24% 64
Wyoming 815 717 13.67% 302
United States 2,871,891 2,824,674 1.67% 45