chapter 3 availability of technology for instructional
TRANSCRIPT

29
Chapter 3
Availability of Technology For Instructional Purposes
Highlights
• The availability of educational technology increased substantially during the 1990s, par-ticularly at the school level. By 1999, most teachers reported having at least one computerin their classrooms, and over half of these teachers also had access to the Internet in theirclassrooms. Additionally, the majority of teachers also reported having these technologiesavailable at home.
• Despite the gains in computer and Internet availability at school and in classrooms, ap-proximately one-third of teachers reported that their classrooms had a single computer or asingle computer connected to the Internet available in 1999. In addition, the availability oftechnology was not equally distributed among schools with different characteristics. Forexample, teachers in schools with lower minority enrollments were generally more likelythan teachers in schools with the highest minority enrollments to report having the Internetavailable in the classroom. Additionally, teachers in schools with lower poverty concentra-tions (based on the percent of students eligible for free or reduced-lunch) were generallymore likely than teachers in schools with high minority concentrations to report having theInternet available in the classroom.
• In 1999, the availability of technology in the classroom was related to teachers’ use of thattechnology. For example, teachers who reported having more than five computers in theirclassrooms were more likely than teachers with fewer classroom computers to report usingcomputers a lot for various preparatory activities. Additionally, teachers who had morecomputers available in the classroom were generally more likely to report assigning stu-dents to use computers or the Internet to a large extent to conduct various tasks (e.g., solveproblems or analyze data).

3C H A P T E R
31
This chapter reviews data collected by several surveys on theavailability of education technology to teachers and their stu-dents. The chapter begins with background information on
computer availability from the National Assessment of EducationalProgress (NAEP) school surveys, as well as from the Fast Response Sur-vey System (FRSS) school survey, NAEP teacher survey, and the Cur-rent Population Survey (CPS) from 1994 to 1998. Data are also pro-vided from the 1994 to 1999 FRSS school surveys on the percent ofschools and instructional rooms with Internet connections. This back-ground information is followed by more recent, detailed findings onthe technology available to teachers and their students, taken from the1999 FRSS survey on teachers’ use of technology. Included are differ-ences in the availability of computers and Internet connections by char-acteristics of schools (e.g., instructional level, location of school, pov-erty concentration).
Availability of Computers and the Internet:1990 to 1999
Measures of computer availability come in a variety of forms, includingthe percent of students who have varying numbers of computers avail-able to them in their schools (NAEP), student-to-computer ratios inschools (FRSS), the percent of students who have computer labs andportable computers available to them (NAEP), the percent of studentswho have computers permanently available in the classroom (NAEP),and the percent of students for whom computers are best described asavailable in computer labs or available in the classroom (NAEP). Mea-sures of Internet availability in public schools are similar, but typicallyfocus on the percent of schools connected to the Internet rather thanon the percent of students with the Internet available to them. Thesemeasures include the percent of schools connected to the Internet
Availability ofTechnology for
InstructionalPurposes

32
• CHAPTER 3 •
(FRSS), the percent of instructional rooms connected to the Internet (FRSS), and student-to-instructional-computers-with-Internet ratios in schools (FRSS).
Computer Availability : 1990 to 1999
Number of computers available to students and student-to-computer ratios. Beginning in 1990,NAEP began collecting data from school administrators on the number of computers availableto students in the school. Results from these surveys demonstrate a substantial increase in thenumber of computers available to public school students in their schools between 1990 and1999 (figure 3.1). For example, the percent of fourth-grade students who had more than 76computers available in their schools rose from 1 percent in 1990 to 33 percent in 1998. Simi-larly, there was an increase from 8 percent to 51 percent of eighth-grade students and from 42percent to 73 percent of twelfth-grade students during those years. According to recent FRSSdata, approximately one computer was available for every six students in 1999 (Williams, 2000).
Computer availability in labs and classrooms. Data are also available from the NAEP 1998school survey on the location of computers in the school. For example, administrators indi-cated if the school had computer labs and whether computers were always available in class-rooms. Additionally, administrators were asked if computers were available to be brought toclassrooms for student use as a measure of portable computer availability.
The different types of computer availability (e.g., labs, available to be brought to class, class-rooms) varied by grade-level in 1998. For example, among public school students, eighth andtwelfth-grade students were more likely than fourth-grade students to have computer labs avail-able (90 percent and 94 percent, respectively, compared with 78 percent—figure 3.2). Con-versely, fourth-grade students were more likely to have computers always available in the class-room than eighth and twelfth-grade students (83 percent compared with 46 percent and 27percent, respectively).
Teachers’ reports of computer availability to students. In 1998, public school teachers of fourth-and eighth-grade students were asked to best describe the availability of computers for use bytheir students. Teachers reported whether: computers were “not available to students any-where,” computers for student use were “available in a lab,” or varying numbers of computersfor student use were “available in class.” According to their teachers, the majority of bothfourth-grade and eighth-grade students had computers available to them somewhere in theirschool in 1998, either in the classroom or elsewhere in the school (figure 3.3). Specifically, 72percent of fourth-grade students and 49 percent of eighth-grade students had at least one com-puter in their classrooms, and 23 percent of fourth-grade students and 42 percent of eighth-grade students had at least one computer available in lab. Thus, 5 percent of fourth-gradersand 9 percent of eighth-graders did not have computers available in their schools.
Internet Availability: 1994 to 1999
The FRSS also collected data on the percent of public schools and instructional rooms thatwere connected to the Internet as part of its school surveys between 1994 and 1999. Internet

33
• AVAILABILITY OF TECHNOLOGY FOR INSTRUCTIONAL PURPOSES •
availability in schools and instructional rooms increased steadily during that time (Williams,2000—figure 3.4). In 1994, a little over a third of all public schools were connected to theInternet. By 1999, availability had grown to 95 percent, with one computer connected to theInternet for every 9 students. The percent of instructional rooms connected to the Internetgrew even more sharply during that time—whereas 3 percent of instructional rooms were con-nected to the Internet in 1994, 63 percent were connected by 1999.
FIGURE 3.1.—PERCENT OF PUBLIC SCHOOL 4TH-, 8TH-, AND 12TH-GRADE STUDENTS WHO HAD SCHOOL ADMINISTRATORS
REPORTING VARYING NUMBERS OF COMPUTERS AT THE SCHOOL: 1990 AND1998
NOTE: Detail may not sum to 100 due to rounding.
SOURCE: National Center for Education Statistics, National Assessment of Educational Progress (NAEP), 1990 and 1998 ReadingAssessments.
Percent
4th-grade 8th-grade 12th-grade
1
0
10
20
30
40
50
60
70
80
90
100
76 or more
51 to 75
26 to 50
1 to 25
None available
199819901998199019981990
3
28 33
8
5142
73
60
20
13
40
20
21
13
1111
2722
73 3
36
31
167

34
• CHAPTER 3 •
Percent
Computer labsat school
Always havecomputers in
classroom
Computers available to
bring to class
78
9094
83
46
27
3942 40
0
10
20
30
40
50
60
70
80
90
100
4th-grade
8th-grade
12th-grade
199819981998
Differences in the Growth of Availability
Despite the gains made by public schools in obtaining computers and Internet connectivity,not all schools had made the same progress by 1999 (Williams, 2000). The 1999 FRSS dataindicate differences in student-to-instructional-computer ratios by such school characteristicsas enrollment size, location, poverty concentration, and minority enrollments. For example,the smallest schools had a lower student-to-instructional-computer ratio than medium andlarge schools (4 compared with 6 each), as well as a lower student-to-instructional-computer-with-Internet ratio (6 compared with 9 and 10, respectively—figure 3.5). Rural schools had alower student-to-instructional-computer ratio than schools in other locations (4 comparedwith 6 each for schools located in urban fringes, cities, and towns). Furthermore, rural schoolshad lower student-to-instructional-computer-with-Internet ratios than urban fringe and cityschools (7 compared with 9 and 11, respectively).
Additionally, there were differences in student-to-instructional-computer ratios by poverty con-centration and minority enrollments in 1999. Higher poverty schools (31 to 49 percent ofstudents eligible for free or reduced-price lunch) had more students per instructional computer
FIGURE 3.2.—PERCENT OF PUBLIC SCHOOL 4TH-, 8TH-, AND 12TH-GRADE STUDENTS WHO HAD SCHOOL ADMINISTRATORS
REPORTING COMPUTER LABS AT SCHOOL, COMPUTERS IN THE CLASSROOM, OR COMPUTERS AVAILABLE TO BRING TO
CLASS: 1998
SOURCE: National Center for Education Statistics, National Assessment of Educational Progress (NAEP), 1998 Reading Assess-ments.

35
• AVAILABILITY OF TECHNOLOGY FOR INSTRUCTIONAL PURPOSES •
FIGURE 3.3.—PERCENT OF PUBLIC SCHOOL 4TH- AND 8TH-GRADE STUDENTS HAVING TEACHERS REPORTING COMPUTERS
AVAILABLE IN THEIR CLASSES OR LABS AS THEIR BEST COMPUTER AVAILABILITY: 1998
SOURCE: National Center for Education Statistics, National Assessment of Educational Progress (NAEP), 1998 Reading Assess-ments.
Percent
72
49
23
42
0
10
20
30
40
50
60
70
80
90
1004th-grade
8th-grade
Available in labAvailable in class
than lower poverty schools (11 to 30 percent and less than 11 percent of students eligible forfree or reduced-price lunch—6 compared with 5 each). Similarly, schools with the highestminority enrollments had a higher student-to-instructional-computer ratio than schools withlower minority enrollments (6 to 20 percent or less than 6 percent minority enrollments—6compared with 5 each).
Differences by poverty concentration and minority enrollments were also present in student-to-instructional-computer-with-Internet ratios. Schools with more than 70 percent of stu-dents eligible for free or reduced-price lunch had more students per instructional computerwith Internet than schools with lower poverty concentrations (31 to 49 percent, 11 to 30percent, and less than 11 percent—16 compared with 9, 8, and 7, respectively). Similarly,schools with the highest minority enrollments had a higher student-to-instructional-computer-with-Internet ratio than schools with lower minority enrollments (21 to 49 percent, 6 to 20percent, and less than 6 percent—13 compared with 9, 8, and 7, respectively).
The highest poverty schools were also less likely to report having instructional rooms con-nected to the Internet than several other groups in 1997 and 1998 (Rowand, 1999; Williams,2000—figure 3.6). Between 1998 and 1999, all schools except those with the highest povertyconcentrations reported an increase in the percentage of instructional rooms connected to theInternet. In 1999, 39 percent of instructional rooms at schools with more than 70 percent ofstudents eligible for free or reduced-price lunch were connected to the Internet, comparedwith 62 to 74 percent of schools with lower concentrations of poverty.

36
• CHAPTER 3 •
Availability of Computers at Home: 1994 to 1998
Data are also available on the presence of computers in public and private school teachers’ andstudents’ homes, collected as part of the CPS. The following sections describe the growth inthe availability of home computers among elementary and secondary public and private schoolteachers and students between 1994 and 1998. The availability of computers in teachers’homes is compared with that of adults in other occupations, and the number and ages ofcomputers in the home are also given for the most recent year (1998).
Teachers’ Computer Availability at Home
Results from the 1994 to 1998 CPS indicate that the availability of computers in public andprivate school teachers’ homes increased significantly between 1994 and 1998 (54 percentcompared with 74 percent). Furthermore, elementary and secondary teachers were more likelyto have a computer at home than adults in all other occupations in 1994 through 1998 (e.g.,74 percent compared with 46 percent in 1998—figure 3.7). The majority of adults who had a
FIGURE 3.4.—PERCENT OF PUBLIC SCHOOLS AND INSTRUCTIONAL ROOMS WITH INTERNET ACCESS: 1994 TO 1999
Percent
35
50
65
78
8995
63
51
27
148
3
0
10
20
30
40
50
60
70
80
90
100
0
10
20
30
40
50
60
70
80
90
100
Percent of public schools with Internet access
Percent of public school instructional rooms with Internet access
199919981997199619951994
SOURCE: U.S. Department of Education, National Center for Education Statistics, Fast Response Survey System, “AdvancedTelecommunications in Public Schools, K-12,” FRSS 51, NCES 95-731; “Advanced Telecommunications in U.S. Public Elementaryand Secondary Schools, 1995,” FRSS 57, NCES 96-854; “Advanced Telecommunications in U.S. Elementary and Secondary PublicSchools, Fall 1996,” FRSS 61, NCES 97-944; “Internet Access in Public Schools,” FRSS 64, NCES 98-031; “Survey on InternetAccess in U.S. Public Schools, Fall 1998,” FRSS 69, 1998; and "Internet Access in U.S. Public Schools and Classrooms: 1994-99,"FRSS 75, NCES 2000-086.

37
• AVAILABILITY OF TECHNOLOGY FOR INSTRUCTIONAL PURPOSES •
FIGURE 3.5.—RATIO OF STUDENTS PER INSTRUCTIONAL COMPUTER AND STUDENTS PER INSTRUCTIONAL COMPUTER WITH
INTERNET ACCESS, BY SCHOOL CHARACTERISTICS: 1999
Enrollment size
Locale
Percent minorityenrollment in school
Percent of students eligible for free or reduced-
price school lunch
6
4
6
6
6
6
6
4
5
5
6
6
5
5
6
6
6 16
10
9
8
7
13
9
8
7
7
8
9
11
10
9
6
9
10 5 0 5 10 15 20
71 percent or more
50 to 70 percent
31 to 49 percent
11 to 30 percent
Less than 11 percent
50 percent or more
20 to 49 percent
6 to 20 percent
Less than 6 percent
Rural
Town
Urban Fringe
City
1,000 or more
300 to 999
Less than 300
Total Students per instructional computer
Students per instructional computer with Internet
SOURCE: U.S. Department of Education, National Center for Education Statistics, Fast Response Survey System, “Survey on InternetAccess in U.S. Public Schools, Fall 1999,” FRSS 75, 1999.

38
• CHAPTER 3 •
computer in the home in 1998 reported having one computer (71 percent of teachers withcomputers and 75 percent of adults in other occupations); fewer had two computers (20 per-cent of teachers and 18 percent of adults in other occupations). Additionally, in 1998, mostteachers and adults in other occupations reported having computers that were three years oldor newer (71 percent of teachers and 75 percent of adults in other occupations with comput-ers—table A-3.9).
Students’ Computer Availability at Home
The CPS also collected data on public and private school students’ computer availability athome in 1994 to 1998. According to these data, the percent of students who had at least onecomputer in the home increased from 36 percent in 1994 to 56 percent in 1998 (table A-3.9).
FIGURE 3.6.—-PERCENT OF PUBLIC SCHOOL INSTRUCTIONAL ROOMS WITH INTERNET ACCESS, BY FREE OR REDUCED-PRICE LUNCH
ELIGIBILITY: 1994 TO 1999
NOTE: In 1995 and 1997 the 31 to 49 percent and 50 to 70 percent categories were collapsed. Separate estimates are unavailablefor those years.
SOURCE: U.S. Department of Education, National Center for Education Statistics, Fast Response Survey System, “AdvancedTelecommunications in Public Schools, K-12,” FRSS 51, NCES 95-731; “Advanced Telecommunications in U.S. Public Elementaryand Secondary Schools, 1995,” FRSS 57, NCES 96-854; “Advanced Telecommunications in U.S. Elementary and Secondary PublicSchools, Fall 1996,” FRSS 61, NCES 97-944; “Internet Access in Public Schools,” FRSS 64, NCES 98-031; “Internet Access inPublic Schools and Classrooms, 1994-1998,” FRSS 69, NCES 1999-017; and "Internet Access in U.S. Public Schools andClassrooms: 1994-99," FRSS 75, NCES 2000-086.
0
10
20
30
40
50
60
70
80
90
100
0
10
20
30
40
50
60
70
80
90
100
Less than 11 percent
11 to 30 percent
31 to 49 percent
50 to 70 percent
71 percent or more
199919981997199619951994
42
310
9
514
39 39
12 18
62
5340
36
32
61 68
62
7174
Percent

39
• AVAILABILITY OF TECHNOLOGY FOR INSTRUCTIONAL PURPOSES •
FIGURE 3.7.—PERCENT OF ELEMENTARY AND SECONDARY TEACHERS AND ADULTS IN OTHER OCCUPATIONS WHO REPORT HAVING
COMPUTERS AT HOME: 1994, 1997, AND 1998
NOTE: Adults in other occupations includes all survey respondents who reported an occupation which was not elementary orsecondary teacher.
SOURCE: U.S. Census Bureau, Current Population Survey, November 1994, October 1997, December 1998.
Availability of Technology to Teachers and Students in 1999
The remaining sections of this chapter describe teachers’ reports of the availability of comput-ers in public school teachers’ schools and classrooms followed by the availability of the Internetin these locations, and the availability of both computers and the Internet at home. Finally, therelationship between computer availability in the classroom and teachers’ computer-relatedactivities is explored.
Computer Availability in the School
Nearly all public school teachers (99 percent) reported having computers available somewherein their schools in 1999 (table A-3.9). Eighty-four percent of public school teachers had com-puters available in their classrooms (table 3.1), and 95 percent of teachers had computers avail-able elsewhere in the school.1
Number of computers in the classroom. In addition to asking teachers if they had computersavailable in the classrooms, the 1999 FRSS survey also asked for the number of computers
Percent
54
6674
4640
28
0
10
20
30
40
50
60
70
80
90
100
0
10
20
30
40
50
60
70
80
90
100
Teachers
Adults in other occupations
199819971994
1 These two categories were not mutually exclusive.

40
• CHAPTER 3 •
TABLE 3.1.—PERCENT OF PUBLIC SCHOOL TEACHERS REPORTING COMPUTER AVAILABILITY IN THE CLASSROOM AND ELSEWHERE
IN SCHOOL, BY SCHOOL CHARACTERISTICS: 1999
NOTE: Detail may not sum to 100 due to rounding.
SOURCE: U.S. Department of Education, National Center for Education Statistics, Fast Response Survey System, “Public SchoolTeachers Use of Computers and the Internet,” FRSS 70, 1999.
available in the classroom. As previously indicated, most public school teachers (84 percent)reported having at least one computer in their classrooms in 1999 (table 3.1). Thirty-six per-cent had one computer in their classrooms, 38 percent reported having two to five computersin their classrooms, and 10 percent reported having more than five computers in their class-rooms (table 3.2).
Differences in school and classroom computer availability by school characteristics. Teachers’ com-puter availability in 1999 varied by several school characteristics, including instructional level,enrollment size, location, minority enrollments, and poverty concentration. Elementary teacherswere more likely to have computers in their classrooms (89 percent) than secondary teachers(75 percent—table 3.1). Teachers in schools enrolling less than 300 and 300 to 999 studentswere more likely to have computers in their classrooms (87 and 88 percent, respectively) thanteachers in schools with the largest enrollments (71 percent). Furthermore, teachers in schools
Computers available Computers availablein classroom elsewhere in school
School characteristics Yes No Yes No
All public schoolteachers 84 16 95 5
Instructional levelElementary 89 11 93 7Secondary 75 25 99 1
Enrollment sizeLess than 300 87 13 89 11300 to 999 88 12 95 51,000 or more 71 29 97 3
LocaleCity 80 20 94 6Urban fringe 83 17 95 5Town 92 8 93 7Rural 87 13 97 3
Percent minorityenrollment in school
Less than 6 percent 85 15 94 66 to 20 percent 86 14 95 521 to 49 percent 89 11 96 450 percent or more 77 23 95 5

41
• AVAILABILITY OF TECHNOLOGY FOR INSTRUCTIONAL PURPOSES •
located in towns were more likely to have computers located in their classrooms than teachersin schools located in cities and in urban fringes (92 percent compared with 80 percent and 83percent, respectively). Last, teachers in schools with 21 to 49 percent minority enrollmentswere more likely to have computers in the classroom than teachers in schools with 50 percentor more minority enrollments (89 percent of teachers compared with 77 percent of teachers).
There were also differences among teachers who had varying numbers of computers in theclassroom (table 3.2). Not only were some groups of teachers less likely to have computers intheir classrooms (e.g., teachers in secondary schools or large schools), but they were also morelikely than other teachers to have only one computer in their classrooms. Teachers in second-ary schools were more likely to have one computer than elementary teachers (45 percent com-pared with 33 percent), and less likely to have two to five computers than elementary teachers(20 percent compared with 46 percent).
Computer availability also varied by school size. For example, teachers in schools enrolling1,000 or more students were more likely to report having one computer in their classroomsthan teachers in schools with less than 300 students (41 percent compared with 28 percent).Teachers in schools enrolling 1,000 or more students were less likely, however, to report havingtwo to five computers than either schools enrolling 300 to 999 students or schools enrollingless than 300 students (20 percent compared with 43 percent and 46 percent, respectively).
Internet Availability at School
Sixty-four percent of public school teachers who reported having computers in their class-rooms also reported having Internet availability in their classrooms in 1999. Ninety percent ofteachers who reported having computers available elsewhere in their schools also reported thatthe Internet was available elsewhere in the school (table 3.3).2
Number of classroom computers connected to the Internet. Among the teachers who reportedhaving computers available in their classrooms, approximately one-third had no computersconnected to the Internet and about half had one computer connected to the Internet (figure3.8). It was less commonly reported that teachers had two to five computers connected ormore than five computers connected to the Internet (13 percent and 4 percent, respectively).
Differences in school and classroom Internet availability by school characteristics. There were differ-ences in overall Internet availability (in class or elsewhere in the school) and in the number ofclassroom computers connected to the Internet by several school characteristics. For example,secondary teachers with computers in their classrooms were more likely to have Internet avail-ability in their classrooms (72 percent) than elementary teachers (60 percent—table 3.3). Asindicated previously, elementary teachers were more likely to have computers in their class-rooms than secondary teachers; this indicates that although elementary teachers were morelikely to have computers in their classrooms, secondary teachers were more likely to have the
2 These two categories were not mutually exclusive.

42
• CHAPTER 3 •
TABLE 3.2.—PERCENT OF PUBLIC SCHOOL TEACHERS REPORTING VARYING NUMBERS OF COMPUTERS AVAILABLE IN THE
CLASSROOM, BY SCHOOL CHARACTERISTICS: 1999
NOTE: Detail may not sum to 100 due to rounding.
SOURCE: U.S. Department of Education, National Center for Education Statistics, Fast Response Survey System, “Public SchoolTeachers Use of Computers and the Internet,” FRSS 70, 1999.
Internet available on the computers that they did have in their classrooms. Furthermore, amongteachers who reported having computers available elsewhere in the school, secondary teacherswere also more likely to have Internet availability elsewhere in the school than were elementaryteachers (96 percent compared with 87 percent).
Additionally, teachers in schools located in towns were more likely to have Internet availabilityelsewhere in the school (96 percent) than teachers in urban fringe schools or city schools (87percent and 90 percent, respectively). Moreover, teachers in schools with less than 6 percent or6 to 20 percent minority enrollments were more likely to have the Internet available in the
Number of computers available in the classroom
School characteristics None One 2-5 More than 5
All public schoolteachers 16 36 38 10
Instructional levelElementary 11 33 46 10Secondary 25 45 20 10
Enrollment sizeLess than 300 13 28 46 12300 to 999 12 36 43 91,000 or more 29 41 20 10
LocaleCity 20 34 37 9Urban fringe 17 35 38 10Town 8 43 38 11Rural 13 37 38 11
Percent minorityenrollment in school
Less than 6 percent 16 34 40 106 to 20 percent 13 40 38 921 to 49 percent 11 39 40 1050 percent or more 23 33 35 10
Percent of students in schooleligible for free or reduced-price school lunch
Less than 11 percent 13 42 35 911 to 30 percent 16 36 38 1031 to 49 percent 16 37 38 950 to 70 percent 13 38 38 1171 percent or more 18 32 40 11

43
• AVAILABILITY OF TECHNOLOGY FOR INSTRUCTIONAL PURPOSES •
classroom than teachers in schools with 50 percent or more minority enrollments (69 percentand 71 percent compared with 51 percent). Similarly, teachers in schools with lower minorityenrollments were generally more likely to report this availability elsewhere in the school thanteachers in schools with the highest minority enrollments (93 percent of teachers in schoolswith 6 to 20 percent minority enrollments and 92 percent of teachers in schools with 21 to 49percent minority enrollments, compared with 83 percent of teachers in schools with 50 per-cent or more minority enrollments).
Internet availability also varied by poverty concentration. For example, public school teachersin schools where 11 to 30 percent and 31 to 49 percent of the students qualify for free orreduced-price lunch were more likely to have the Internet available in the classroom than teachersin schools with 71 percent or more students eligible (71 percent each compared with 51 per-cent). Teachers in lower poverty schools were also generally more likely than teachers in thehighest poverty schools to have Internet available elsewhere in the school. Specifically, teachersin schools with less than 11 percent, 11 to 30 percent, and 31 to 49 percent students eligible forfree or reduced-price lunch were more likely to have this availability than teachers in schoolswith 71 percent or more students eligible (92 to 93 percent, compared with 80 percent ofteachers).
As with overall Internet availability in the classroom, the number of classroom computers thatpublic school teachers reported as having Internet connections varied by instructional level and
Percent
3746
13
4
0
10
20
30
40
50
60
70
80
90
100
More than 52–5OneNone
NOTE: Teachers who reported that computers were not available to them in the classroom were excluded from the analysis presentedin this figure.
SOURCE: U.S. Department of Education, National Center for Education Statistics, Fast Response Survey System, "Public SchoolTeachers Use of Computers and the Internet," FRSS 70, 1999.
FIGURE 3.8.—PERCENT OF PUBLIC SCHOOL TEACHERS HAVING VARYING NUMBERS OF COMPUTERS CONNECTED TO THE INTERNET
WHEN THERE ARE COMPUTERS IN THE CLASSROOM: 1999

44
• CHAPTER 3 •
minority enrollments, but not percent of students eligible for free or reduced-price lunch (table3.4). For example, secondary teachers were more likely than elementary teachers to have eitherone computer connected to the Internet (55 percent compared with 43 percent) or more thanfive computers connected (6 percent compared with 3 percent).
In addition, teachers in schools with 6 to 20 percent minority enrollments were more likelythan teachers in schools with 50 percent or more minority enrollments to have one computer
TABLE 3.3.—PERCENT OF PUBLIC SCHOOL TEACHERS REPORTING INTERNET AVAILABILITY IN THE CLASSROOM AND ELSEWHERE INSCHOOL, BY SCHOOL CHARACTERISTICS: 1999
NOTE: Teachers who reported that computers were not available to them in the classroom were excluded from the “Internet availablein classroom” analyses presented in this table. Teachers who reported that computers were not available to them elsewhere in the schoolwere excluded from the “Internet available elsewhere in school” analyses presented in this table. Detail may not sum to 100 due torounding.
SOURCE: U.S. Department of Education, National Center for Education Statistics, Fast Response Survey System, “Public SchoolTeachers Use of Computers and the Internet,” FRSS 70, 1999.
Internet available in Internet availableclassroom elsewhere in school
School characteristics Yes No Yes No
All public schoolteachers 64 36 90 10
Instructional levelElementary 60 40 87 13Secondary 72 28 96 4
Enrollment sizeLess than 300 67 33 93 7300 to 999 62 38 89 111,000 or more 67 33 91 9
LocaleCity 60 40 90 10Urban fringe 64 36 87 13Town 67 33 96 4Rural 65 35 92 8
Percent minorityenrollment in school
Less than 6 percent 69 31 92 86 to 20 percent 71 29 93 721 to 49 percent 62 38 92 850 percent or more 51 49 83 17
Percent of students in schooleligible for free or reduced-price school lunch
Less than 11 percent 67 34 92 811 to 30 percent 71 29 93 731 to 49 percent 71 29 93 750 to 70 percent 55 45 87 1371 percent or more 51 49 80 20

45
• AVAILABILITY OF TECHNOLOGY FOR INSTRUCTIONAL PURPOSES •
connected to the Internet (55 percent compared with 39 percent). Moreover, teachers in schoolswith less than 6 percent minority enrollments were more likely to report having two to fivecomputers connected than teachers in schools with 50 percent or more minority enrollments(19 percent compared with 9 percent).
E-mail Availability in School
Public school teachers were asked whether e-mail was available in their schools in 1999. Amongthose who reported having any computers available in their schools, 74 percent indicated thate-mail was also available (table 3.5). E-mail availability varied by location of school, minorityenrollments, and poverty concentration. Rural teachers were more likely to report e-mail avail-ability (81 percent) than city teachers (70 percent). Moreover, teachers in schools with lowerminority enrollments were more likely to report that e-mail was available than teachers inschools with the highest minority enrollments (78 percent of teachers in schools with less than6 percent minority enrollments, 80 percent in schools with 6 to 20 percent minority enroll-ments, and 74 percent in schools with 21 to 49 percent minority enrollments, compared with62 percent of teachers in schools with 50 percent or more minority enrollments). Further-more, teachers in schools with less than 11 percent, 11 to 30 percent, and 31 to 49 percentstudents eligible for free or reduced-price lunch were more likely to have e-mail available thanteachers in schools with more than 70 percent eligible students (76 percent, 78 percent, and 80percent of teachers, compared with 61 percent).
Availaility at Home: Computers, Internet, and School Network
Teachers’ Computer, Internet, and School Network Availability at Home
As reported earlier, results of the 1998 CPS indicate that 74 percent of elementary and second-ary public and private school teachers had a computer at home. According to the 1999 FRSSsurvey of teachers’ technology use, 82 percent of public school teachers reported having acomputer at home (table 3.6). The 1999 FRSS teacher survey also asked teachers if they hadthe Internet available at home, and if their school had a network that they could access athome. Sixty-three percent of public school teachers reported having the Internet available athome in 1999. In addition, 27 percent reported that their school had a network that theycould use to access the Internet from home.
There were several differences in teachers’ availability of computers and the Internet at homeby school characteristics in 1999. For example, teachers in schools with 1,000 students ormore enrolled were more likely to have a computer at home than teachers in schools with lessthan 300 students enrolled (86 percent compared with 74 percent). Similarly, teachers inschools with 300 to 999 students enrolled and schools with 1,000 or more students enrolledwere more likely to have Internet at home than teachers in schools with less than 300 studentsenrolled (64 percent and 65 percent, compared with 52 percent). Teachers in urban fringeschools and schools located in towns were more likely to have the Internet available at home

46
• CHAPTER 3 •
than rural school teachers (67 percent and 66 percent, compared with 53 percent). Further-more, less than a third of all teachers reported having a school network that could be accessedfrom home, and teachers in the largest schools and the lowest poverty schools reported thehighest network availability, compared with teachers in the smallest schools and the highestpoverty schools.
NOTE: Teachers who reported that computers were not available to them in the classroom were excluded from the analyses presentedin this table. Detail may not sum to 100 due to rounding.
SOURCE: U.S. Department of Education, National Center for Education Statistics, Fast Response Survey System, “Public SchoolTeachers Use of Computers and the Internet,” FRSS 70, 1999.
TABLE 3.4.—PERCENT OF PUBLIC SCHOOL TEACHERS REPORTING VARYING NUMBERS OF COMPUTERS IN THE CLASSROOM WITH
INTERNET CONNECTIONS, BY SCHOOL CHARACTERISTICS: 1999
Number of computers in the classroom with Internet
School characteristics None One 2-5 More than 5
All public schoolteachers 37 46 13 4
Instructional levelElementary 40 43 14 3Secondary 29 55 11 6
Enrollment sizeLess than 300 33 48 14 4300 to 999 38 44 14 41,000 or more 36 52 9 3
LocaleCity 41 41 15 3Urban fringe 37 49 11 3Town 32 50 14 4Rural 35 46 14 5
Percent minorityenrollment in school
Less than 6 percent 31 46 19 36 to 20 percent 30 55 11 421 to 49 percent 39 45 13 450 percent or more 49 39 9 2
Percent of students in schooleligible for free or reduced-price school lunch
Less than 11 percent 34 47 14 511 to 30 percent 30 51 16 331 to 49 percent 29 51 15 550 to 70 percent 47 39 11 471 percent or more 49 39 9 3

47
• AVAILABILITY OF TECHNOLOGY FOR INSTRUCTIONAL PURPOSES •
TABLE 3.5.—PERCENT OF PUBLIC SCHOOL TEACHERS HAVING E-MAIL AVAILABLE TO THEM AT SCHOOL,BY SCHOOL CHARACTERISTICS: 1999
NOTE: Teachers who reported that computers were not available to them anywhere in the school were excluded from the analysespresented in this table. Detail may not sum to 100 due to rounding.
SOURCE: U.S. Department of Education, National Center for Education Statistics, Fast Response Survey System, “Public SchoolTeachers Use of Computers and the Internet,” FRSS 70, 1999.
Students’ Computer Availability at Home
Because 48 percent of the teachers surveyed in 1999 reported assigning projects using thecomputer outside of class, it is useful to know if students had the resources to complete theseassignments at home. This section uses data from the 1999 FRSS teacher survey3 to describethe availability of computers in students’ homes during that year. Results of this survey indi-cate that 36 percent of the teachers reported that more than half of their students had comput-ers at home (table 3.7). This means that 64 percent of teachers did not believe that the majorityof their students had a computer available at home. The percent of teachers who reported thatmore than half of their students had computers at home varied by several school characteristics.For example, teachers in urban fringe schools were more likely to report that the majority of
3 The FRSS data reported in this section are teachers’ estimates of students’ home computer availability, and therefore may not accu-rately reflect whether students had computers at home. Data from the 1998 CPS on the percent of students who reported having acomputer at home were presented earlier in the chapter.
E-mail available at school
School characteristics Yes No
All public schoolteachers 74 26
LocaleCity 70 30Urban fringe 71 29Town 79 21Rural 81 19
Percent minorityenrollment in schoolLess than 6 percent 78 226 to 20 percent 80 2021 to 49 percent 74 2650 percent or more 62 38
Percent of students in schooleligible for free or reduced-price school lunchLess than 11 percent 76 2411 to 30 percent 78 2231 to 49 percent 80 2050 to 70 percent 69 3171 percent or more 61 39

48
• CHAPTER 3 •
their students had computers at home than teachers in any other location (48 percent comparedwith 26 percent to 30 percent).
Teachers in schools with the highest minority enrollments (50 percent or more) were less likelyto report that the majority of their students had computers at home than teachers in any otherschools (9 percent as compared with 39 percent to 50 percent). In addition, teachers in thelower poverty schools (less than 71 percent of students eligible for free or reduced-price lunch)were more likely to report that their students had computers at home than teachers in thehighest poverty schools (71 percent or more eligible students).
TABLE 3.6.—PERCENT OF PUBLIC SCHOOL TEACHERS HAVING COMPUTERS AND THE INTERNET AVAILABLE TO THEM AT HOME, AND
THE PERCENT OF TEACHERS HAVING A SCHOOL NETWORK THAT THEY CAN ACCESS FROM HOME, BY SCHOOL
CHARACTERISTICS: 1999
NOTE: Teachers who reported that computers were not available to them anywhere in the school were excluded from the “Schoolnetwork accessible from home” analyses presented in this table. Detail may not sum to 100 due to rounding.
SOURCE: U.S. Department of Education, National Center for Education Statistics, Fast Response Survey System, “Public SchoolTeachers Use of Computers and the Internet,” FRSS 70, 1999.
Computer Internet School networkavailable available accessibleat home at home from home
School characteristics Yes No Yes No Yes No
All public schoolteachers 82 18 63 37 27 73
Enrollment sizeLess than 300 74 26 52 48 18 82300 to 999 83 17 64 36 27 731,000 or more 86 14 65 35 29 71
LocaleCity 79 21 62 38 26 74Urban fringe 86 14 67 33 29 71Town 84 16 66 34 28 72Rural 79 21 53 47 21 79
Percent of students in schooleligible for free or reduced-price school lunch
Less than 11 percent 85 15 70 30 36 6411 to 30 percent 86 14 67 33 25 7531 to 49 percent 83 17 57 43 28 7250 to 70 percent 79 21 59 42 25 7571 percent or more 79 21 59 41 20 80

49
• AVAILABILITY OF TECHNOLOGY FOR INSTRUCTIONAL PURPOSES •
4 The positive outcomes cited include increased job opportunity, learning experiences, and academic achievement (U.S. Department ofEducation, 1996). It should be noted, however, that disagreement exists in the research literature on the benefits of technology as itrelates to academic achievement. Some studies report a positive relationship between the use of education technology and studentachievement (e.g., Mann, Shakeshaft, Becker and Kottkamp, 1999; Wenglinsky, 1998), while others report marginal to no effect (e.g.,Becker, 1990a; Clark, 1994).
TABLE 3.7.—PERCENT OF PUBLIC SCHOOL TEACHERS REPORTING THAT MORE THAN 50 PERCENT OF THEIR STUDENTS HAVE
COMPUTERS AT HOME, BY SCHOOL CHARACTERISTICS: 1999
SOURCE: U.S. Department of Education, National Center for Education Statistics, Fast Response Survey System, “Public SchoolTeachers Use of Computers and the Internet,” FRSS 70, 1999.
Percent of teachers reporting>50% of students have
computers at homeSchool characteristics
All public schoolteachers 36
Enrollment size
LocaleCity 26Urban fringe 48Town 29Rural 30
Percent minority enrollment in schoolLess than 6 percent 446 to 20 percent 5021 to 49 percent 3950 percent or more 9
Percent of students in school eligible forfree or reduced-price school lunch
Less than 11 percent 7211 to 30 percent 4631 to 49 percent 3450 to 70 percent 2171 percent or more 2
Teachers’ Use of Technology and Computer Availabilityin their Classrooms
The push to increase the availability of technology in the classroom is based on the assumptionthat availability will increase students’ and teachers’ use of this technology, and that this use willlead to positive outcomes for students (U.S. Department of Education, 1996).4 This sectionexplores the relationship between the numbers of computers available in the classroom in 1999,and teachers’ use of those computers for instructional purposes.

50
• CHAPTER 3 •
Preparatory Tasks and Computer Availability
Among teachers who reported having computers located in their classrooms, those who hadmore than 5 classroom computers were more likely than those with fewer classroom computersto report doing various preparatory activities “a lot” (figure 3.9). For example, 28 percent ofteachers with more than five computers reporting using computers or the Internet a lot togather information for lesson plans, compared with 17 percent of teachers with two to fivecomputers and 13 percent of teachers with one computer. A similar relationship was found forusing computers or the Internet a lot to prepare multimedia presentations.
Classroom Instruction and Computer Availability
Teachers’ reports of assigning students to use computers or the Internet for various instruc-tional purposes differed by the number of computers in their classrooms. For example, 59percent of teachers with one computer in the classroom reported not assigning students to usecomputers or the Internet to solve problems or analyze data, compared with 40 percent ofteachers with two to five computers and 23 percent of teachers with more than five computers(table 3.8). Conversely, teachers with more than five computers in their classrooms were mostlikely to report assigning problem solving or data analysis computer work to a “large extent,”followed by teachers with two to five computers and teachers with one computer (21 percentcompared with 9 percent and 5 percent, respectively). Similar relationships were found forword processing and practicing drills.

51
• AVAILABILITY OF TECHNOLOGY FOR INSTRUCTIONAL PURPOSES •
FIGURE 3.9.—PERCENT OF PUBLIC SCHOOL TEACHERS WHO REPORT USING COMPUTERS OR THE INTERNET A LITTLE OR A LOT FOR
VARIOUS ACTIVITIES, BY NUMBER OF CLASSROOM COMPUTERS: 1999
NOTE: Teachers who reported that computers were not available to them in the classroom were excluded from the analyses presentedin this figure.
SOURCE: U.S. Department of Education, National Center for Education Statistics, Fast Response Survey System, "Public SchoolTeachers Use of Computers and the Internet," FRSS 70, 1999.
Percent
Create instruct-
ional materials
Gatherinforma-tion forlesson plans
Admin-istrativerecord
keeping
Access researchand bestpractice
examples
Multi-media
present-ations
Accessmodellessonplans
7986 88
5965
69
54 53
63
38 39
55
33
43
57
3338
48
0
10
20
30
40
50
60
70
80
90
100A lot
A little
>52–5
One>52–5
One>52–5
One>52–5
One>52–5
One>52–5
One
38
41
41
45
36
52
46
13
48
17
41
28
17
37
17
36
16
47
31
7
30
9
45
10
27
6
34
8
36
21
27
6
30
8
39
8

52
• CHAPTER 3 •
TABLE 3.8.—PERCENT OF PUBLIC SCHOOL TEACHERS BY NUMBER OF COMPUTERS AVAILABLE IN CLASSROOM WHO REPORT
ASSIGNMENT OF VARIOUS ACTIVITIES TO A SMALL, MODERATE, OR LARGE EXTENT, OR NOT AT ALL: 1999
NOTE: Teachers who reported that computers were not available them in the classroom were excluded from the analyses presented in this
table. Percents are computed down the column for each grouping, but may not sum to 100 because of rounding.
SOURCE: U.S. Department of Education, National Center for Education Statistics, Fast Response Survey System, “Public School
Teachers Use of Computers and the Internet,” FRSS 70, 1999.
Number of computers available in the classroom
Activities One 2-5 More than 5
All public schoolteachers 43 45 12
Solve problems/analyze dataNot at all 59 40 23Small extent 20 26 29Moderate extent 16 26 27Large extent 5 9 21
Word processing/spreadsheetsNot at all 45 33 14Small extent 19 20 21Moderate extent 21 24 23Large extent 15 23 42
Drills/practiceNot at all 61 37 21Small extent 21 20 23Moderate extent 14 26 26Large extent 4 18 30

53
Chapter 4
Frequency of Technology Use
Highlights
• In 1999, nearly all teachers used the computers and the Internet when available in theirschools, and most reported that their students used computers and the Internet in theschool as well. Teachers were generally more likely to use computers and the Internet whenlocated in their classrooms than elsewhere in the school, while their students were morelikely to use computers and the Internet outside the classroom than inside.
• Elementary teachers were more likely to report that their students used computers at school,and secondary teachers were more likely to report that their students used the Internet atschool.
• Teachers with more computers or more computers connected to the Internet in their class-rooms generally used these technologies more often than teachers with fewer computers orInternet connections (as did their students). Additionally, teachers with computer or Internetconnections in their classrooms used these technologies elsewhere in the school more oftenthan teachers without such equipment in their classrooms (as did their students).
• Teachers in schools with lower minority enrollments were generally more likely to reportusing e-mail than teachers in schools with the highest minority enrollments, and teachersin schools with lower minority enrollments and lower poverty concentrations were gener-ally more likely than teachers in schools with the highest minority enrollments and thehighest poverty concentrations to report that their students used the Internet.
• Teachers with fewer years of teaching experience were generally more likely than teacherswith more experience to report using computers, the Internet, and e-mail at school to alarge extent.
• In 1999, nearly all teachers with computers or the Internet available at home used thesetechnologies. Teachers with fewer years of teaching experience generally used these tech-nologies at home more frequently than their most experienced colleagues. Teachers whoused computers for instruction and who assigned projects that required their students touse a computer were more likely than teachers who did not use these technologies for suchpurposes to use computers and the Internet at home to a large extent.

4C H A P T E R
55
Frequency of Technology
Use
This chapter provides findings on the frequency with whichpublic school teachers and students use technology at schooland at home. The chapter is divided into three main sections.
The first uses the Current Population Survey (CPS) data to providebackground information regarding technology use in schools and class-rooms. The second section uses Fast Response Survey System (FRSS)and CPS data to describe the frequency of teachers’ and students’ tech-nology use in schools and classrooms. The final section uses FRSS,National Assessment of Educational Progress (NAEP), and CPS data toexamine teachers’ and students’ technology use at home. Each sectionexplores frequency of use by the location and availability of technologyin schools and classrooms, as well as school and teacher characteristics.
Frequency of Technology Use in Schoolsand Classrooms: 1997 to 1998
Internet
According to CPS data on Internet use, this technology has been usedsomewhat infrequently by public and private school teachers in pastyears, but use of this technology is growing. For example, in public andprivate schools, the percent of elementary teachers who used the Internetat work rose from 23 to 33 percent between 1997 and 1998, and thepercent of secondary teachers who used the Internet at work increasedfrom 28 to 43 percent (figure 4.1).
Current Frequency of Technology Use in Schools andClassrooms
This section presents recent data on teacher and student use of com-puters, including e-mail, Internet, and other technologies, from the

56
• CHAPTER 4 •
1 These two categories were not mutually exclusive.
Percent
Elementary teachers Secondary teachers
23
3328
43
0
10
20
30
40
50
60
70
80
90
100
1998199719981997
FIGURE 4.1.—PERCENT OF ELEMENTARY AND SECONDARY TEACHERS REPORTING USE OF THE INTERNET AT WORK: 1997 AND
1998
SOURCE: U.S. Census Bureau, Current Population Survey (CPS): October 1997 and December 1998.
1999 FRSS teacher survey of public school teachers’ use of technology.
Frequency of Teachers’ Technology Use at School
In the 1999 FRSS teacher survey, public school teachers were asked if computers, the Internet,and e-mail were available to them in various locations, and if available, the extent to which theyused them (“not at all,” “small extent,” “moderate extent,” or “large extent”). This sectiondescribes the frequency of teachers’ use of these technologies by selected teacher and schoolcharacteristics and by the availability and location of technology in schools and classrooms.
Overall technology use. Among teachers who reported that computers were available in theirschools, 99 percent indicated that they used computers either in their classrooms or elsewherein the school (figure 4.2). Additionally, among teachers who indicated that computers withInternet connections were available in their schools, 96 percent used the Internet from theirclassrooms or elsewhere in their schools. Furthermore, at least three-fourths of teachers with e-mail availability used it at school.
Frequency of use by location of technology. The 1999 FRSS teacher survey asked teachers howfrequently they used computers and the Internet in two locations: the classroom and elsewherein the school (i.e., computer labs, libraries, or media centers).1 Of the teachers who reportedhaving computer availability in their classrooms (84 percent), nearly all of them (98 percent)

57
• FREQUENCY OF TECHNOLOGY USE •
NOTE: Teachers who reported that computers, the Internet, and e-mail were not available to them anywhere in the school were excludedrespectively from the "Computers," "Internet," and "E-mail" analyses presented in this figure. Detail may not sum to totals due torounding.
SOURCE: U.S. Department of Education, National Center for Education Statistics, Fast Response Survey System, "Public SchoolTeachers Use of Computers and the Internet," FRSS 70, 1999.
FIGURE 4.2.—PERCENT OF PUBLIC SCHOOL TEACHERS REPORTING USE OF COMPUTERS, THE INTERNET, AND E-MAIL AT SCHOOL
TO ANY EXTENT WHEN AVAILABLE: 1999
99
96
77
0 10 20 30 40 50 60 70 80 90 100
Internet
Computers
reported using them at least to some extent (figure 4.3). Of the teachers who reported havingcomputers available elsewhere in the school (95 percent), 85 percent reported using them.Teachers were significantly more likely to use computers in the classroom than elsewhere in theschool, and they were also more likely to use them to a large extent in the classroom thanelsewhere in the school (39 percent compared with 18 percent).
In addition, among teachers with Internet availability in their classrooms (64 percent), 88percent reported using this technology. Of those teachers who reported Internet availabilityelsewhere in the school (90 percent), 70 percent indicated using it. Teachers were more likelyto use the Internet in the classroom than elsewhere in the school, and they were also more likelyto use it to a large extent in their classrooms than elsewhere in the school (20 percent comparedwith 10 percent). Furthermore, of the 74 percent of teachers reporting e-mail availability inthe school, 77 percent used it at least to some extent.
Frequency of use by number of computers available. The 1999 FRSS teacher survey also askedteachers the number of computers and computers with Internet connections that were locatedin their classrooms. Overall, teachers with more computers in their classrooms used themmore frequently than teachers with fewer computers in their classrooms. For example, 62percent of public school teachers with more than five computers in their classrooms used them

58
• CHAPTER 4 •
Percent
98
85
88
70
77
0 10 20 30 40 50 60 70 80 90 100
Small extent
Moderate extent
Large extent
E-mail in school
Internet elsewhere in school
Internet in classroom
Computers elsewhere in school
Computers in classroom 25 34
31
30
20
1825 34
41 10
37 20
37 18
39
to a large extent compared with 43 percent of teachers with two to five computers and 28percent of teachers with one computer in their classrooms (figure 4.4). Similarly, teachers withmore than five computers with Internet access in their classrooms used the Internet from theclassroom more frequently than teachers with fewer computers with Internet access in their
NOTE: Teachers reporting not having the listed technologies available were excluded from their respective analyses presented in thisfigure. The listed technologies were available to the following percentages of public school teachers: Computers in classroom, 84 percent;Computers elsewhere in school, 95 percent; Internet in classroom, 64 percent; Internet elsewhere in school, 90 percent; E-mail in school,74 percent. Detail may not sum to totals due to rounding.
SOURCE: U.S. Department of Education, National Center for Education Statistics, Fast Response Survey System, "Public SchoolTeachers Use of Computers and the Internet," FRSS 70, 1999.
FIGURE 4.3.—PERCENT OF PUBLIC SCHOOL TEACHERS REPORTING FREQUENCY OF USE OF VARIOUS TECHNOLOGIES TO A SMALL,MODERATE, OR LARGE EXTENT: 1999

59
• FREQUENCY OF TECHNOLOGY USE •
classrooms. For example, 45 percent of teachers with more than five computers connected tothe Internet used the Internet from the classroom to a large extent in their classrooms com-pared with 18 percent of teachers with one computer.
Furthermore, teachers with computers in their classrooms used computers elsewhere in the schoolmore often than teachers with no classroom computers (figure 4.5). At least one-fifth of teach-ers with computers in their classrooms used computers elsewhere in the school to a large extentcompared with 10 percent of teachers with no computers in their classrooms. Similarly, teach-ers with one or more than five computers connected to the Internet in their classrooms usedthe Internet elsewhere in the school more often than teachers without classroom computerswith Internet connections. Twenty-four percent of teachers with more than five classroomcomputers connected to the Internet and 12 percent of teachers with one classroom computerconnected to the Internet used the Internet elsewhere in the school to a large extent, comparedwith 7 percent of teachers with no classroom computers connected to the Internet.
Frequency of use by teacher and school characteristics. Differences were found in the frequency ofteachers’ use of computers, the Internet, and e-mail by school and teacher characteristics. Teachers
FIGURE 4.4.—PERCENT OF PUBLIC SCHOOL TEACHERS REPORTING USE OF COMPUTERS OR THE INTERNET IN THE CLASSROOM TO
A LARGE EXTENT, BY NUMBERS OF COMPUTERS AND COMPUTERS WITH INTERNET CONNECTIONS IN THE CLASSROOM: 1999
NOTE: Teachers who reported that computers were not available to them in the classroom were excluded from the "Number of comput-ers available in the classroom" analyses presented in this figure. Teachers who reported that computers with Internet connections werenot available to them in the classroom were excluded from the "Number of computers with Internet connections available in the class-room" analyses presented in this figure.
SOURCE: U.S. Department of Education, National Center for Education Statistics, Fast Response Survey System, "Public SchoolTeachers Use of Computers and the Internet," FRSS 70, 1999.
Percent
Number of computersavailable in classroom
Number of computers withInternet connections
available in classroom
28
43
62
1822
45
0
10
20
30
40
50
60
70
80
90
100
Used computer in the classroom to large extent
Used Internet in the classroom to large extent
More than 52–5OneMore than 52–5One

60
• CHAPTER 4 •
with fewer years of teaching experience were more likely to use computers, the Internet, and e-mail to a large extent at school than their more experienced colleagues. For example, 48percent of teachers with 3 or fewer years of teaching experience and 45 percent of teachers with4 to 9 years of experience used computers at school to a large extent, compared with 33 percentof teachers with 20 or more years experience (figure 4.6). The pattern is similar for Internetand e-mail use. Furthermore, teachers in schools with minority enrollments of 6 to 20 percentwere more likely to use e-mail to a large extent than teachers in schools with the highest minor-ity enrollments (42 percent compared with 25 percent—table 4.1).
Comparisons with other occupations. According to the 1997 CPS, 69 percent of adults employedas secondary teachers (either in public or private schools) and 67 percent employed as elemen-tary teachers (either in public or private schools) reported using computers at work (figure4.7). Both are significantly lower than such occupations as librarians, editors and reporters,and college faculty, and the percentage of elementary school teachers who reported using com-puters at work was lower than that of those employed as lawyers and judges and real estate and
FIGURE 4.5.—PERCENT OF PUBLIC SCHOOL TEACHERS REPORTING USE OF COMPUTERS OR THE INTERNET ELSEWHERE IN THE
SCHOOL TO A LARGE EXTENT, BY NUMBERS OF COMPUTERS AND COMPUTERS WITH INTERNET CONNECTIONS IN THE CLASSROOM:1999
NOTE: Teachers who reported that computers were not available to them in the classroom were excluded from the "Number of comput-ers available in the classroom" analyses presented in this figure. Teachers who reported that computers with Internet connections werenot available to them in the classroom were excluded from the "Number of computers with Internet connections available in the class-room" analyses presented in this figure.
SOURCE: U.S. Department of Education, National Center for Education Statistics, Fast Response Survey System, "Public SchoolTeachers Use of Computers and the Internet," FRSS 70, 1999.
Percent
Number of computers availablein classroom for instruction
Number of computers with Internetconnections available in classroom
10
2023 23
712 12
24
0
10
20
30
40
50
60
70
80
90
100
Used computer in the classroom to large extent
Used Internet in the classroom to large extent
More than 52–5OneNoneMore than 52–5OneNone

61
• FREQUENCY OF TECHNOLOGY USE •
FIGURE 4.6.—PERCENT OF PUBLIC SCHOOL TEACHERS REPORTING USE OF COMPUTERS, E-MAIL, AND THE INTERNET AT SCHOOL
TO A LARGE EXTENT, BY YEARS OF TEACHING EXPERIENCE: 1999
NOTE: Teachers who reported that computers were not available to them anywhere in the school were excluded from the "Computers atschool" analyses presented in this figure. Teachers who reported that e-mail was not available to them anywhere in the school wereexcluded from the "E-mail at school" analyses presented in this figure. Teachers who reported that the Internet was not available to themanywhere in the school were excluded from the "Internet at school" analyses presented in this figure.
SOURCE: U.S. Department of Education, National Center for Education Statistics, Fast Response Survey System, "Public SchoolTeachers Use of Computers and the Internet," FRSS 70, 1999.
Percent
48 45 41
33
48
3537
26 2821
1713
0
10
20
30
40
50
60
70
80
90
1003 or fewer years
4–9 years
10–19 years
20 or more years
Internet at schoolE-mail at schoolComputers at school
sales agents. However, the percentage for both elementary and secondary school teachers washigher than that of teachers’ aides (40 percent). Forty-eight percent of U.S. adults employed inother occupations reported using computers at work.
Frequency of Students’ Technology Use at School
In the 1999 FRSS teacher survey, public school teachers were asked how often students in oneof their typical classes used computers and the Internet—“not at all,” “rarely,” “sometimes,” or“often”—in various locations (i.e., in classrooms and elsewhere in the school). This sectiondescribes the frequency of students’ use of computers and the Internet by the availability andlocation of technology in schools and classrooms and by selected teacher and school character-istics. Findings presented in this section are restricted to teachers who reported that thesetechnologies were available in their schools.
2 Estimates of the frequency of teachers’ use of technology (figure 4.3) and students’ use of technology (figure 4.8) are not comparable.Due to differences in the way the questions were asked for teachers’ own use and their students’ use, the sample filter representingavailability is somewhat different for each group.

62
• CHAPTER 4 •
3 Distance learning is defined as the transmission of information from one geographic location to another via various modes of telecom-munications technology.
TABLE 4.1.—PERCENT OF PUBLIC SCHOOL TEACHERS REPORTING USING E-MAIL AT SCHOOL TO A LARGE EXTENT, BY SCHOOL
CHARACTERISTICS: 1999
NOTE: Teachers who reported that e-mail was not available to them anywhere in the school were excluded from the analyses presentedin this table.
SOURCE: U.S. Department of Education, National Center for Education Statistics, Fast Response Survey System, “Public SchoolTeachers Use of Computers and the Internet,” FRSS 70, 1999.
Overall technology use. Eighty-eight percent of teachers with computers available in their schoolsreported that their students used computers either in the classroom or in computer labs, librar-ies, and media centers in 1999 (table A-4.3). Furthermore, 61 percent of all teachers reportedthat students used the Internet in the classroom or somewhere else in the school in 1999 (tableA-4.3).
Frequency of use by location of technology. Approximately seven out of ten teachers reported thatstudents used classroom computers; however, a higher percentage of teachers (78 percent) re-ported that students used them elsewhere in the school (figure 4.8).2 Thirty-four percent ofteachers reported that students used the Internet in the classroom; however, a higher percent-age of teachers (55 percent) reported that students used the Internet elsewhere in the school.
Twenty-six percent of teachers reported that students used classroom computers often, and 28percent of teachers reported that students used computers elsewhere often. Six percent ofteachers indicated that students used classroom computers with Internet access often, and 9
School characteristics E-mail used
All public school teachers 34
LocaleCity 31Urban fringe 36Town 35Rural 32
Percent minority enrollment in schoolLess than 6 percent 366 to 20 percent 4221 to 49 percent 3050 percent or more 25
Percent of students in school eligiblefor free or reduced-price school lunch
Less than 11 percent 3711 to 30 percent 4131 to 49 percent 3350 to 70 percent 2671 percent or more 29

63
• FREQUENCY OF TECHNOLOGY USE •
NOTE: "All other occupations" refers to all full-time and part-time employed adults in occupations other than those listed in this figure.
SOURCE: U.S. Census Bureau, Current Population Survey (CPS), October 1997.
FIGURE 4.7.—PERCENT OF EMPLOYED ADULTS IN THE UNITED STATES REPORTING USE OF COMPUTERS AT WORK, BY VARIOUS
OCCUPATIONS: 1997
Percent
95
88
80
79
78
69
67
62
62
48
40
0 10 20 30 40 50 60 70 80 90 100
Teachers' aides
All other occupations
Clergy
Physicians
Elementary teachers
Secondary teachers
Lawyers and judges
Real estate/sales occupations
College and university teachers
Editors and reporters
Librarians
percent of teachers indicated that students used computers with Internet access elsewhere inthe school often. Sixteen percent of teachers reported that students used other technologies,such as distance learning3 through the Internet and other interactive media.
Frequency of use by number of computers available. Overall, teachers with more computers orInternet availability in their classrooms reported that they and their students used these tech-nologies more frequently than teachers with fewer computers in their classrooms. For ex-ample, 61 percent of teachers with more than five computers in their classrooms reported thatstudents used them often compared with 41 percent of teachers with two to five computers and

64
• CHAPTER 4 •
NOTE: Teachers who reported that computers were not available to them in the classroom were excluded from the analyses presented inthis figure. Detail may not sum to totals due to rounding.
SOURCE: U.S. Department of Education, National Center for Education Statistics, Fast Response Survey System, "Public SchoolTeachers Use of Computers and the Internet," FRSS 70, 1999.
FIGURE 4.8.—PERCENT OF PUBLIC SCHOOL TEACHERS REPORTING STUDENT USE OF VARIOUS TECHNOLOGIES IN SCHOOLS AND
CLASSROOMS: 1999
Percent
78
69
55
34
16
16
0 10 20 30 40 50 60 70 80 90 100
Rarely
Sometimes
Often
Distance learning via other modes of interactive media
Distance learning via the Internet
Internet in the classroom
Internet in a computer lab or library/media center
Computers in a classroom
Computer in a lab or library/media center 13
14 2629
27
14
10 5
510
1
14 6
20 9
2837
1

65
• FREQUENCY OF TECHNOLOGY USE •
FIGURE 4.9.—PERCENT OF PUBLIC SCHOOL TEACHERS REPORTING STUDENT USE OF COMPUTERS OR THE INTERNET IN THE
CLASSROOM OFTEN, BY NUMBER OF COMPUTERS AND NUMBER OF COMPUTERS WITH INTERNET CONNECTIONS IN THE CLASSROOM:1999
NOTE: Teachers who reported that computers were not available to them in the classroom were excluded from the analysespresented in this figure.
SOURCE: U.S. Department of Education, National Center for Education Statistics, Fast Response Survey System, "Public SchoolTeachers Use of Computers and the Internet," FRSS 70, 1999.
Percent
Number of computers available in classroom
Number of computers with Internetconnections available in classroom
13
41
61
6
18
33
0
10
20
30
40
50
60
70
80
90
100
Used computer in the classroom often
Used Internet in the classroom often
More than 52–5OneMore than 52–5One
13 percent of teachers with one computer in their classrooms (figure 4.9). Similarly, 33 per-cent of teachers with more than five classroom computers connected to the Internet reportedthat students used them often compared with 6 percent of teachers with one classroom com-puter connected to the Internet. Additionally, teachers with two to five classroom computersconnected to the Internet were more likely than teachers with one such computer to report thatstudents used the Internet often (18 percent compared with 6 percent).
Furthermore, teachers with computers in their classrooms reported that students used comput-ers elsewhere in the school more often than teachers with no classroom computers (figure 4.10).At least one out of three teachers with computers in their classrooms reported that studentsused computers elsewhere in the school, compared with one out of six teachers without aclassroom computer. Teachers with more than five computers connected to the Internet intheir classrooms were two to five times as likely as teachers with one or no computers withInternet connections to report that students used the Internet elsewhere in the school (29 per-cent compared with 5 to 11 percent). Additionally, teachers with one (11 percent), two to five(12 percent), and more than five (29 percent) computers with Internet access in the classroomwere more likely than teachers with no computers with Internet access in the classroom (5percent) to report that their students used the Internet elsewhere in the school.

66
• CHAPTER 4 •
FIGURE 4.10.—PERCENT OF PUBLIC SCHOOL TEACHERS REPORTING STUDENT USE OF COMPUTERS OR THE INTERNET ELSEWHERE
IN THE SCHOOL OFTEN, BY NUMBER OF COMPUTERS FOR INSTRUCTION AND NUMBER OF COMPUTERS WITH INTERNET CONNECTIONS
IN THE CLASSROOM: 1999
Percent
Number of computers availablein classroom for instruction
Number of computers with Internet connections
available in classroom
17
34 33 34
511 12
29
0
10
20
30
40
50
60
70
80
90
100
Used computer elsewhere in school
Used Internet elsewhere in school
Morethan 5
2–5OneNoneMorethan 5
2–5OneNone
NOTE: Teachers who reported that computers were not available to them anywhere in the school were excluded from the analysespresented in this figure.
SOURCE: U.S. Department of Education, National Center for Education Statistics, Fast Response Survey System, "Public SchoolTeachers Use of Computers and the Internet," FRSS 70, 1999.
Frequency of use by teacher and school characteristics. Students’ use of technology, as reported bytheir teachers, varied by teacher and school characteristics. For example, elementary teachers(92 percent) were more likely than secondary teachers (80 percent) to report that their studentsused computers at school to any extent (figure 4.11). However, secondary teachers (72 per-cent) were more likely than elementary teachers (56 percent) to report that their students usedthe Internet at school to any extent.
Furthermore, teachers in schools with lower minority enrollments were generally more likelythan teachers in schools with the highest minority enrollments to report that students used theInternet at school. Sixty-four percent of teachers in schools with less than 6 percent minorityenrollments and 65 percent of teachers in schools with 6 to 20 percent minority enrollmentsreported that students used the Internet in school compared with 53 percent of teachers inschools with more than 50 percent minority enrollments (table 4.2).
Similarly, teachers in schools with lower poverty concentrations were generally more likely toreport that students used the Internet at school than teachers in the highest poverty schools.

67
• FREQUENCY OF TECHNOLOGY USE •
FIGURE 4.11.—PERCENT OF PUBLIC SCHOOL TEACHERS REPORTING STUDENT USE OF COMPUTERS AND THE INTERNET AT SCHOOL
TO ANY EXTENT, BY INSTRUCTIONAL LEVEL: 1999
NOTE: Teachers who reported that computers were not available to them anywhere in the school were excluded from the analysespresented in this figure.
SOURCE: U.S. Department of Education, National Center for Education Statistics, Fast Response Survey System, "Public SchoolTeachers Use of Computers and the Internet," FRSS 70, 1999.
Percent
92
80
56
72
0
10
20
30
40
50
60
70
80
90
100
Elementary teachers
Secondary teachers
Students' use of Internet at school
Students' use of computers at school
Seventy-one percent of teachers in schools with less than 11 percent of students eligible for freeor reduced-price lunch, 63 percent of teachers in schools with 11 to 30 percent of eligiblestudents, and 66 percent of teachers in schools with 31 to 49 percent of students eligible forfree or reduced-price lunch reported that students used the Internet at school compared with50 percent of teachers in schools with 71 percent or more students eligible for free or reduced-price lunch.
Current Frequency of Technology Use at Home
Experience using a computer or the Internet may improve teachers’ and students’ technologyskills and increase their level of comfort with technology, regardless of whether the use is atschool or at home. In the 1999 FRSS teacher survey of technology use, teachers were asked ifa computer, the Internet, or a school network through which they could access the Internetwere available to them at home. If they were available, teachers were then asked about theextent to which they used them (“not at all,” “small extent,” “moderate extent,” or “large ex-tent”). Because the FRSS did not ask similar information about students, data from NAEP andCPS are used to describe students’ technology use at home.

68
• CHAPTER 4 •
4 Internet availability could not be ascertained from the CPS data.
TABLE 4.2.—PERCENT OF PUBLIC SCHOOL TEACHERS REPORTING STUDENT USE OF THE INTERNET IN THE CLASSROOM, COMPUTER
LABS, MEDIA CENTERS, OR LIBRARIES TO ANY EXTENT DURING CLASS TIME, BY SCHOOL CHARACTERISTICS: 1999
NOTE: Teachers who reported that the Internet was not available to them anywhere in the school were excluded from the analysespresented in this table.
SOURCE: U.S. Department of Education, National Center for Education Statistics, Fast Response Survey System, “Public SchoolTeachers Use of Computers and the Internet,” FRSS 70, 1999.
Teacher Use of Computers and the Internet at Home
The 1997 CPS indicates that for public and private school teachers, 83 percent of elementaryteachers and 89 percent of secondary teachers used home computers to any extent when theywere available (figure 4.12).4 This compares with 74 percent of adults in other occupationswith computers at home who used them to any extent. Two years later, the 1999 FRSS teachersurvey indicates that 98 percent of public school teachers with computers at home used them,and about half of the teachers used them to a large extent (table A-4.3).
Teachers’ Internet use at home significantly increased between 1997 and 1998 for both el-ementary and secondary teachers. According to the 1997 CPS, 35 percent of all elementaryteachers with computers in their households and 44 percent of all secondary teachers withcomputers in their households reported using the Internet at home (figure 4.12). In 1998, CPSdata show that 57 percent of elementary teachers with computers in their households and 60
School characteristics Internet used
All public school teachers 61
LocaleCity 58Urban fringe 60Town 64Rural 64
Percent minority enrollment in schoolLess than 6 percent 646 to 20 percent 6521 to 49 percent 6350 percent or more 53
Percent of students in school eligiblefor free or reduced-price school lunch
Less than 11 percent 7111 to 30 percent 6331 to 49 percent 6650 to 70 percent 5671 percent or more 50

69
• FREQUENCY OF TECHNOLOGY USE •
FIGURE 4.12.—PERCENT OF EMPLOYED U.S. ELEMENTARY TEACHERS, SECONDARY TEACHERS, AND ADULTS IN OTHER OCCUPA-TIONS REPORTING USE OF COMPUTERS AND THE INTERNET AT HOME TO ANY EXTENT WHEN COMPUTERS ARE AVAILABLE IN THE
HOUSEHOLD: 1997 AND 1998
NOTE: Adults who reported that computers were not available to them at home were excluded from the analyses presented in this figure.Availability of the Internet at home could not be determined.
SOURCE: U.S. Census Bureau, Current Population Survey (CPS): October 1997 and December 1998.
Percent
Computer use at homewhen available
Internet use at home
74
8389
3735
4451
5760
0
10
20
30
40
50
60
70
80
90
100
Adults in other occupations
Elementary teachers
Secondary teachers
199819971997
percent of secondary teachers with computers in their households reported using the Internetat home. Home Internet use also increased between 1997 and 1998 for adults in other occupa-tions with computers in their households, from 37 to 51 percent.
The 1999 FRSS teacher survey indicates that nearly all (97 percent) public school teachers withthe Internet available at home used it, and about two-fifths (43 percent) of teachers with homeInternet access reported using it to a large extent. The 1999 FRSS teacher survey also inquiredabout school networks that teachers can access at home. Fifty-six percent of teachers used thistechnology when it was available (table A-4.3).
Home use by teacher and school characteristics. Public school teachers’ use of computers and theInternet at home varied by their years of teaching experience. For example, teachers with 3 orfewer years and those with 4 to 9 years of teaching experience were more likely to use theirhome computers to a large extent than teachers with 20 or more years of teaching experience(65 percent and 57 percent, compared with 39 percent—figure 4.13). Similarly, teachers with3 or fewer years and those with 4 to 9 years of teaching experience were more likely to use the

70
• CHAPTER 4 •
FIGURE 4.13.—PERCENT OF PUBLIC SCHOOL TEACHERS REPORTING USE OF COMPUTERS AND THE INTERNET AT HOME TO ALARGE EXTENT, BY YEARS OF TEACHING EXPERIENCE: 1999
NOTE: Teachers who reported that computers were not available to them at home were excluded from the "Teacher used computer athome" analyses presented in this figure. Teachers who reported that the Internet was not available to them at home were excluded fromthe "Teacher used Internet at home" analyses presented in this figure.
SOURCE: U.S. Department of Education, National Center for Education Statistics, Fast Response Survey System, "Public SchoolTeachers Use of Computers and the Internet," FRSS 70, 1999.
Percent
6557
4639
6255
35 36
0
10
20
30
40
50
60
70
80
90
100
3 or fewer years
4–9 years
10–19 years
20 or more years
Teacher used Internet at homeTeacher used computer at home
Internet at home to a large extent than teachers with 10 to 19 years and those with 20 or moreyears of teaching experience (62 percent and 55 percent compared with 35 percent and 36percent).
Frequency of Technology Use at Home and Technology Use for Instruction
Public school teachers who used computers for instruction during class and teachers who as-signed projects that required their students to use a computer were more likely to use comput-ers and the Internet at home to a large extent than teachers who did not use these technologiesfor such purposes. For example, 54 percent of teachers who used computers for instructionalso used home computers to a large extent, compared with 43 percent of teachers who did notuse computers for instruction (figure 4.14). Likewise, 52 percent of teachers who assignedprojects requiring students to use computers also used home computers to a large extent, com-pared with 37 percent of teachers who did not assign such projects. The pattern is similar forInternet use at home.

71
• FREQUENCY OF TECHNOLOGY USE •
FIGURE 4.14.—PERCENT OF PUBLIC SCHOOL TEACHERS REPORTING TECHNOLOGY USE IN SCHOOL TO A LARGE EXTENT FOR
INSTRUCTION AND STUDENT ASSIGNMENT, BY THEIR USE OF COMPUTERS AND THE INTERNET AT HOME: 1999
NOTE: Teachers who reported that computers were not available to them at home were excluded from the "Used computers at home toa large extent" analyses presented in this figure. Teachers who reported that the Internet was not available to them at home were excludedfrom the "Used Internet at home to a large extent" analyses presented in this figure.
SOURCE: U.S. Department of Education, National Center for Education Statistics, Fast Response Survey System, "Public SchoolTeachers Use of Computers and the Internet," FRSS 70, 1999.
Percent
54
43
52
37
49
36
46
35
0
10
20
30
40
50
60
70
80
90
100
Used computers for instruction
Did not use computers for instruction
Assigned projects requiring students to use computers
Did not assign projects requiring students to use computers
Used Internet at homeUsed computers at home
Student Access to Computers and the Internet at Home
NAEP data indicate that the use of home computers by public school students increased from1992 to 1998 for fourth-graders, eighth-graders, and twelfth-graders. For example, fourth-graders, eighth-graders, and twelfth-graders who reported never or hardly ever using a com-puter at home declined between 1992 and 1998 (68 percent to 55 percent, 60 percent to 34percent, and 50 percent to 23 percent, respectively—figure 4.15).

72
• CHAPTER 4 •
FIGURE 4.15.—PERCENT OF PUBLIC SCHOOL 4TH-, 8TH-, AND 12TH-GRADE STUDENTS REPORTING USING A COMPUTER AT
HOME AT LEAST ONCE A WEEK, ONCE OR TWICE A MONTH, OR NEVER OR HARDLY EVER: 1992, 1994, AND 1998
NOTE: Percents may not sum to 100 due to rounding.
SOURCE: National Center for Education Statistics, National Assessment of Educational Progress (NAEP), 1992, 1994, and 1998Reading Assessments.
Percent
4th-grade 8th-grade 12th-grade
24
8
68
30
10
60
28
17
55
2119
60
2522
53
38
2834
30
21
50
34
25
4047
3023
0
10
20
30
40
50
60
70
80
90
100
At least once a week
Once or twice a month
Never or hardly ever
199819941992199819941992199819941992

73
Chapter 5
Teacher Preparation and Training
Highlights
• In 1999, one-third of teachers reported feeling very well or well prepared to use computersand the Internet for instruction, with less experienced teachers indicating they felt moreprepared to use technology than their more experienced colleagues. For many instruc-tional activities, teachers who reported feeling well prepared or very well prepared to usetechnology were more likely to use it or assign students to use it than teachers who reportedfeeling unprepared.
• Teachers cited independent learning most frequently as preparing them for technology use,followed by professional development activities and their colleagues. Whereas half of allteachers reported that college and graduate work prepared them to use technology, lessexperienced teachers were generally much more likely than their more experienced col-leagues to indicate that this education prepared them to use computers and the Internet.
• Most teachers indicated that professional development activities on a number of topicswere available to them, including training on software applications, the use of the Internet,and the use of computers and basic computer training. Participation was relatively high inthese three activities (ranging from 75 to 83 percent), with more experienced teachers oftenmore likely to participate than less experienced teachers. Teachers indicated that follow-upand advanced training were available less frequently, and approximately half of the teachersreporting that each of these two activities were available to them participated in them.
• Over a 3-year time period, most teachers participated in professional development activi-ties that lasted the equivalent of 4 days or less (i.e., 32 or fewer hours). Teachers whoreported spending more time in professional development activities (9 hours or more) weregenerally more likely than teachers who spent less time in such activities (fewer than 9hours) to report feeling well or very well prepared to use computers and the Internet forinstruction.

5C H A P T E R
75
The 1999 Fast Response Survey System (FRSS) teacher surveyof technology use asked public school teachers a number ofquestions regarding their preparation and training on the fol-
lowing topics: their feelings of preparedness, the extent to which vari-ous training sources contributed to their understanding of technology(e.g., colleagues, independent learning), their participation in a num-ber of different types of professional development activities and thelength of their participation, and the supports they received for partici-pating in training activities.
Teachers’ Feelings of Preparedness
In 1999, 10 percent of teachers reported feeling “very well prepared,”and 23 percent reported feeling “well prepared” to use computers andthe Internet for classroom instruction. At least half of teachers reportedfeeling “somewhat prepared” to use these technologies for instruction(53 percent), and 13 percent reported feeling “not at all prepared” touse these technologies for instruction (table A-5.5).
Teachers’ feelings of preparation varied by their years of teaching expe-rience. For example, teachers with 3 or fewer years of teaching experi-ence were generally more likely to report that they felt well prepared orvery well prepared, compared with teachers with more years of teachingexperience (45 percent compared with 31 percent of teachers with 10to 19 years and 27 percent of teachers with 20 or more years of teachingexperience—figure 5.1).
Preparedness and Teachers’ Use of Technology
For many instructional activities, teachers who reported feeling betterprepared to use technology were more likely to use it than teachers whoindicated that they felt unprepared. Specifically, teachers who reportedfeeling well prepared or very well prepared were more likely than teach-ers who reported feeling unprepared to create instructional materials
TeacherPreparation
and Training

76
• CHAPTER 5 •
FIGURE 5.1.—PERCENT OF PUBLIC SCHOOL TEACHERS REPORTING FEELING NOT AT ALL, SOMEWHAT, OR WELL/VERY WELL PREPARED
TO USE COMPUTERS AND THE INTERNET FOR CLASSROOM INSTRUCTION, BY YEARS OF TEACHING EXPERIENCE: 1999
SOURCE: U.S. Department of Education, National Center for Education Statistics, Fast Response Survey System, “Public SchoolTeachers Use of Computers and the Internet,” FRSS 70, 1999.
(88 percent compared with 50 percent), gather information for planning lessons (71 percentcompared with 28 percent), access model lesson plans (47 percent compared with 12 percent),access research and best practices for teaching (52 percent compared with 11 percent), createmultimedia presentations for the classroom (55 percent compared with 12 percent), and per-form administrative record keeping (62 percent compared with 34 percent). They were alsomore likely to communicate via e-mail with colleagues, students’ parents, and students outsidethe classroom, as well as post homework or project information (table 5.1).
Teachers’ use of technology for classroom assignments is also related to their feelings of prepared-ness. For each classroom instructional activity, teachers who reported feeling well prepared or verywell prepared were more likely than teachers who reported feeling unprepared to report assigningstudents to use these technologies. For example, 66 percent of teachers who reported feeling wellprepared or very well prepared to use technology indicated that they assigned students to usecomputers or the Internet to solve problems or analyze data, compared with 47 percent of teacherswho reported feeling somewhat prepared and 14 percent of teachers who reported feeling unpre-pared (table 5.2).
Teacher Preparation and Training
Because teachers’ use of technology is related to their feelings of preparedness, it is important tounderstand teachers’ training for technology use and how that relates to their feelings of prepared-
Percent
Years of teaching experience
10
45 45
10
49
41
14
55
31
16
57
27
0
10
20
30
40
50
60
70
80
90
100
Not at all prepared
Somewhat prepared
Well/very well prepared
20 or more10 to 194 to 93 or fewer

77
•TEACHER PREPARATION AND TRAINING •
ness. This section examines a number of different types of information about teachers’ trainingand preparation, including their sources of training, the availability of professional developmentin their schools and their participation in these activities, and the support and guidance theyreceive to facilitate their training.
Sources of Training
The 1999 teacher survey on technology use asked teachers to report the extent to which anumber of sources prepared them to use computers and the Internet, including college andgraduate work, professional development, colleagues, students, and independent learning. The
TABLE 5.1.—PERCENT OF PUBLIC SCHOOL TEACHERS REPORTING USING COMPUTERS OR THE INTERNET FOR VARIOUS ACTIVITIES
AT SCHOOL TO ANY EXTENT, BY EXTENT TO WHICH THEY FELT PREPARED TO USE COMPUTERS AND THE INTERNET FOR INSTRUCTION:1999
TABLE 5.1.—PERCENT OF PUBLIC SCHOOL TEACHERS REPORTING USING COMPUTERS OR THE INTERNET FOR VARIOUS ACTIVITIES AT
SCHOOL TO ANY EXTENT, BY EXTENT TO WHICH THEY FELT PREPARED TO USE COMPUTERS AND THE INTERNET FOR INSTRUCTION:1999—CONTINUED
NOTE: Teachers who reported that computers were not available to them anywhere in the school were excluded from the analysespresented in this table.
SOURCE: U.S. Department of Education, National Center for Education Statistics, Fast Response Survey System, “Public SchoolTeachers Use of Computers and the Internet,” FRSS 70, 1999.
Activities
Create Gather Access Access Multimediainstructional information model research presentations
materials for lesson and bestTeachers’ feelings of lesson plans practicepreparedness plans examples
All public schoolteachers 78 59 34 37 36
Not at all 50 28 12 11 12Somewhat 80 59 31 34 30Well/very well 88 71 47 52 55
Activities
Administrative Communicate Communicate Communicate Postrecord with with with homework/
keeping colleagues parents students assignmentsTeachers’ feelings ofpreparedness
All public schoolteachers 51 50 25 12 17
Not at all 34 28 9 4 9Somewhat 48 48 24 10 17Well/very well 62 63 32 17 20
See note at end of table.

78
• CHAPTER 5 •
most frequently cited sources of preparation were independent learning (93 percent of teachersindicated that independent learning prepared them to any extent), professional developmentactivities (88 percent), and colleagues (87 percent—figure 5.2). Furthermore, approximatelyhalf of all public school teachers reported that students and college/graduate work preparedthem to use computers or the Internet to any extent (54 percent and 51 percent, respectively).
Teachers with fewer years of teaching experience were generally more likely than their moreexperienced colleagues to indicate that college/graduate work prepared them to use computersand the Internet to any extent. Eighty-four percent of teachers with 3 or fewer years and 76percent of teachers with 4 to 9 years of teaching experience reported that college/graduate workprepared them to use these technologies to any extent, compared with 44 percent of teacherswith 10 to 19 years and 31 percent of teachers with 20 or more years of teaching experience(figure 5.3).
TABLE 5.2.—PERCENT OF PUBLIC SCHOOL TEACHERS REPORTING ASSIGNING STUDENTS VARIOUS ACTIVITIES TO ANY EXTENT THAT
USE COMPUTERS OR THE INTERNET, BY EXTENT TO WHICH THEY FELT PREPARED TO USE COMPUTERS AND THE INTERNET FOR
INSTRUCTION: 1999
NOTE: Teachers who reported that computers were not available to them anywhere in the school were excluded from the analysespresented in this table.
SOURCE: U.S. Department of Education, National Center for Education Statistics, Fast Response Survey System, “Public SchoolTeachers Use of Computers and the Internet,” FRSS 70, 1999.
TABLE 5.2.—PERCENT OF PUBLIC SCHOOL TEACHERS REPORTING ASSIGNING STUDENTS VARIOUS ACTIVITIES TO ANY EXTENT THAT
USE COMPUTERS OR THE INTERNET, BY EXTENT TO WHICH THEY FELT PREPARED TO USE COMPUTERS AND THE INTERNET FOR
INSTRUCTION: 1999—CONTINUED
Activities
Practice Solve problems/ Word processing/ GraphicalTeachers’ feelings of drills analyze data spreadsheets presentationspreparedness
All public schoolteachers 50 50 61 43
Not at all 20 14 27 19Somewhat 49 47 56 37Well/very well 63 66 80 63
Activities
Demonstrations/ Multimedia CD-ROM InternetTeachers’ feelings of simulations projects research researchpreparedness
All public schoolteachers 39 45 48 51
Not at all 14 23 19 23Somewhat 32 38 44 46Well/very well 59 63 66 68

79
•TEACHER PREPARATION AND TRAINING •
Percent
93
88
87
54
51
0 10 20 30 40 50 60 70 80 90 100
Small extent
Moderate extent
Large extent
College/graduate work
Students
Colleagues
Professional development activities
Independent learning 23
36
36
36
26 15 10
14 4
35 16
34 18
31 39
Professional Development
The 1999 teacher survey of technology use asked a number of questions about professional devel-opment availability and participation. Specifically, the survey asked teachers if the following typesof professional development activities were available to them and if they participated in these activi-ties: use of computers and basic computer training, software applications, use of the Internet, inte-gration of technology into the curriculum and classroom instruction, follow-up and/or advancedtraining, and use of other advanced telecommunications.
FIGURE 5.2.—PERCENT OF PUBLIC SCHOOL TEACHERS REPORTING FEELING PREPARED TO USE COMPUTERS AND THE INTERNET TO
A SMALL, MODERATE, OR LARGE EXTENT, BY VARIOUS SOURCES OF TRAINING: 1999
NOTE: Detail may not sum to totals due to rounding.
SOURCE: U.S. Department of Education, National Center for Education Statistics, Fast Response Survey System, “Public SchoolTeachers Use of Computers and the Internet,” FRSS 70, 1999.

80
• CHAPTER 5 •
Availability. Teachers reported that professional development training on the use of computersand basic computer training was the type most likely to be available to them (96 percent),followed by software applications (88 percent), use of the Internet (87 percent), and integra-tion of technology into the curriculum and classroom instruction (79 percent—figure 5.4).Teachers were least likely to report that follow-up and/or advanced training and use of otheradvanced telecommunications were available to them (67 percent and 54 percent, respectively).
Ninety-one percent of teachers in schools with 6 to 20 percent minority enrollments and 90percent of teachers in schools with 21 to 49 percent minority enrollments reported that suchtraining was available to them, compared with 81 percent of teachers in schools with 50 per-cent or more minority enrollments (figure 5.5). Furthermore, 94 percent of teachers in schoolswith less than 11 percent of the students eligible for free or reduced-price school lunch, 90percent of teachers in schools with 11 to 30 percent of students eligible, and 91 percent ofteachers in schools with 31 to 49 percent of students eligible for free or reduced-price schoollunch reported that training in the use of the Internet was available to them, compared with 80percent of teachers in schools with 50 to 70 percent of students eligible and 79 percent ofteachers in schools with more than 70 percent of students eligible for free or reduced-price schoollunch.
Participation. Among teachers who reported the availability of each professional developmentactivity, participation during the last 3 years was highest in the use of computers and basic
FIGURE 5.3.—PERCENT OF PUBLIC SCHOOL TEACHERS REPORTING WHETHER COLLEGE/GRADUATE WORK PREPARED THEM NOT AT
ALL OR TO ANY EXTENT TO USE COMPUTERS AND THE INTERNET, BY YEARS OF TEACHING EXPERIENCE: 1999
SOURCE: U.S. Department of Education, National Center for Education Statistics, Fast Response Survey System, “Public School Teach-ers Use of Computers and the Internet,” FRSS 70, 1999.
Percent
Years of teaching experience
16
84
24
76
56
44
69
31
0
10
20
30
40
50
60
70
80
90
100
Not at all
To any extent
20 or more10 to 194 to 93 or fewer

81
•TEACHER PREPARATION AND TRAINING •
computer training (83 percent) and software applications (81 percent), followed by use of theInternet (75 percent) and integration of technology into the curriculum and classroom instruc-tion (74 percent—figure 5.6). Approximately half of the teachers who reported that follow-upand/or advanced training or the use of other advanced telecommunications were available tothem participated in these activities (55 percent and 53 percent, respectively).
In general, teachers with more years of teaching experience were more likely to report havingparticipated in basic computer use and software applications professional development activi-ties than their less experienced colleagues. For example, 87 percent of teachers with 10 to 19years of teaching experience and 90 percent of teachers with 20 or more years of teaching experi-ence participated in computer use and basic computer training activities, compared with 63percent of teachers with 3 or fewer years and 77 percent of teachers with 4 to 9 years of teachingexperience (table 5.3).
FIGURE 5.4.—PERCENT OF PUBLIC SCHOOL TEACHERS REPORTING THE AVAILABILITY OF PROFESSIONAL DEVELOPMENT TRAINING
ACTIVITIES FOR VARIOUS USES AND APPLICATIONS OF TECHNOLOGY: 1999
SOURCE: U.S. Department of Education, National Center for Education Statistics, Fast Response Survey System, “Public SchoolTeachers Use of Computers and the Internet,” FRSS 70, 1999.
Percent
96
88
87
79
67
54
0 10 20 30 40 50 60 70 80 90 100
Use of other advanced telecommunications
Follow-up and/or advanced training
Integration of technology into the curriculum/classroom instruction
Use of the Internet
Software applications
Use of computers/basic computer training

82
• CHAPTER 5 •
Percent
Percent minorityenrollment in school
Percent of students in school eligible for free or
reduced-price lunch
87
91
90
81
94
90
91
80
79
0 10 20 30 40 50 60 70 80 90 100
71 percent or more
50 to 70 percent
31 to 49 percent
11 to 30 percent
Less than 11 percent
50 percent or more
21 to 49 percent
6 to 20 percent
Less than 6 percent
Time spent in professional development activities. The 1999 teacher survey of technology use alsoasked teachers the number of hours they participated in professional development activities inthe use of computers or the Internet during the last 3 years. Forty-three percent of teachersparticipated in such professional development activities for 1 to 8 hours, 34 percent partici-pated for 9 to 32 hours, and 12 percent participated in such activities for more than 32 hours
FIGURE 5.5.—PERCENT OF PUBLIC SCHOOL TEACHERS REPORTING THE AVAILABILITY OF TRAINING IN THE USE OF THE INTERNET,BY PERCENT MINORITY ENROLLMENT IN SCHOOL AND PERCENT OF STUDENTS IN SCHOOL ELIGIBLE FOR FREE OR REDUCED-PRICE
SCHOOL LUNCH: 1999
SOURCE: U.S. Department of Education, National Center for Education Statistics, Fast Response Survey System, “Public SchoolTeachers Use of Computers and the Internet,” FRSS 70, 1999.

83
•TEACHER PREPARATION AND TRAINING •
(figure 5.7). One in ten teachers indicated that they did not participate in any such professionaldevelopment activities.
Preparedness and time spent in professional development activities. Teachers who spent more timein professional development activities were generally more likely than teachers who spent lesstime in such activities to indicate they felt prepared to use computers and the Internet forinstruction. Specifically, teachers who reported spending more than a day (9 hours or more) inprofessional development were more likely to report feeling well prepared or very well prepared
FIGURE 5.6.—PERCENT OF PUBLIC SCHOOL TEACHERS REPORTING PARTICIPATING IN VARIOUS TYPES OF TRAINING, WHEN
AVAILABLE: 1999
NOTE: Teachers reporting not having the listed types of training available were excluded from their respective analyses presented in thisfigure. The listed types of training were available to the following percentages of public school teachers: Use of computers/basic computertraining, 96 percent; Software applications, 88 percent; Use of the Internet, 87 percent; Integration of technology into curriculum/classroom instruction, 79 percent; Follow-up and/or advanced training, 67 percent; Use of other advanced telecommunications, 54percent.
SOURCE: U.S. Department of Education, National Center for Education Statistics, Fast Response Survey System, “Public SchoolTeachers Use of Computers and the Internet,” FRSS 70, 1999.
Percent
83
81
75
74
55
53
0 10 20 30 40 50 60 70 80 90 100
Use of other advanced telecommunications
Follow-up and/or advanced training
Integration of technology into thecurriculum/classroom instruction
Use of the Internet
Software applications
Use of computers/basiccomputer training

84
• CHAPTER 5 •
NOTE: Teachers reporting not having the above listed training programs available were excluded from the analyses presented in thistable.
SOURCE: U.S. Department of Education, National Center for Education Statistics, Fast Response Survey System, “Public SchoolTeachers Use of Computers and the Internet,” FRSS 70, 1999.
to use computers or the Internet than those who reported spending a day or less (fewer than 9hours) in such activities (table 5.4).
Support and Guidance for Participationin Technology Training
In addition to asking teachers about their training and preparation in the use of technology, the1999 teacher survey of technology use also asked teachers if the following types of incentiveswere available to them for participation in professional development: course credit towardcertification, additional resources for the teacher or classroom, paid expenses, release time,stipends, or connection to the Internet from home.
Approximately half of all teachers reported that course credit toward certification and addi-tional resources were offered as incentives to participate in technology training (56 percent and46 percent, respectively—figure 5.8). About two-fifths of teachers reported having paid expenses(40 percent) and release time and stipends (39 percent) as incentives. In addition, about one infive teachers reported that connections to the Internet from home were offered (22 percent).
TABLE 5.3.—PERCENT OF PUBLIC SCHOOL TEACHERS REPORTING PARTICIPATION IN AVAILABLE TRAINING PROGRAMS, BY YEARS
OF TEACHING EXPERIENCE: 1999
Years of teaching experience
Training programs 3 or fewer 4-9 10-19 20 or more
Computer use/basiccomputer training 63 77 87 90
Software applications 64 78 85 84
Use of the Internet 65 74 75 78
Use of other advancedtelecommunications(e.g., interactive audio,video, closed-circuit TV) 44 56 56 52
Integration of technologyinto the curriculum/ classroominstruction 66 74 77 75
Follow-up and/oradvanced training 46 61 58 53

85
•TEACHER PREPARATION AND TRAINING •
Percent
Hours spent in professional development
10
43
34
12
0
10
20
30
40
50
60
70
80
90
100
More than 329–321–80
FIGURE 5.7.—PERCENT OF PUBLIC SCHOOL TEACHERS REPORTING NUMBER OF HOURS SPENT IN PROFESSIONAL DEVELOPMENT
ACTIVITIES IN THE USE OF COMPUTERS OR THE INTERNET DURING THE LAST 3 YEARS: 1999
NOTE: Percents may not sum to 100 due to rounding.
SOURCE: U.S. Department of Education, National Center for Education Statistics, Fast Response Survey System, “Public SchoolTeachers Use of Computers and the Internet,” FRSS 70, 1999.
TABLE 5.4.—PERCENT OF PUBLIC SCHOOL TEACHERS REPORTING FEELING PREPARED TO VARIOUS EXTENTS TO USE COMPUTERS
AND THE INTERNET FOR INSTRUCTION, BY HOURS SPENT IN PROFESSIONAL DEVELOPMENT: 1999
NOTE: Detail may not sum to 100 due to rounding.
SOURCE: U.S. Department of Education, National Center for Education Statistics, Fast Response Survey System, “Public SchoolTeachers Use of Computers and the Internet,” FRSS 70, 1999.
Teachers’ feelings of preparedness
Hours of professionaldevelopment Not at all Somewhat Well/very well
All public schoolteachers 13 53 33
0 hours 32 47 221-8 hours 19 55 269-32 hours 5 61 34More than 32 hours 2 32 66

86
• CHAPTER 5 •
FIGURE 5.8.—PERCENT OF PUBLIC SCHOOL TEACHERS REPORTING THE AVAILABILITY OF CERTAIN INCENTIVES FROM THE SCHOOL
DISTRICT FOR PARTICIPATION IN PROFESSIONAL DEVELOPMENT: 1999
SOURCE: U.S. Department of Education, National Center for Education Statistics, Fast Response Survey System, “Public School Teach-ers Use of Computers and the Internet,” FRSS 70, 1999.
Teachers in small schools were more likely than teachers in larger schools to report the availabilityof such incentives as release time and paid expenses. For example, about half (53 percent) of theteachers in schools with less than 300 students reported the availability of release time, comparedwith a little over one-third (37 percent) of teachers in schools with 300 to 999 students andschools with 1,000 or more students (figure 5.9). On the other hand, teachers in medium andlarge schools were more likely than teachers in small schools to report the availability of connec-tions to the Internet from home as an incentive to participate in technology training (22 percentand 24 percent, respectively, compared with 13 percent).
Percent
56
46
40
39
32
22
0 10 20 30 40 50 60 70 80 90 100
Connection to the Internet from home through your school's network
Stipends are provided
School provides release time
Expenses are paid
Additional resources for you or your classroom
Course credit toward certification is offered
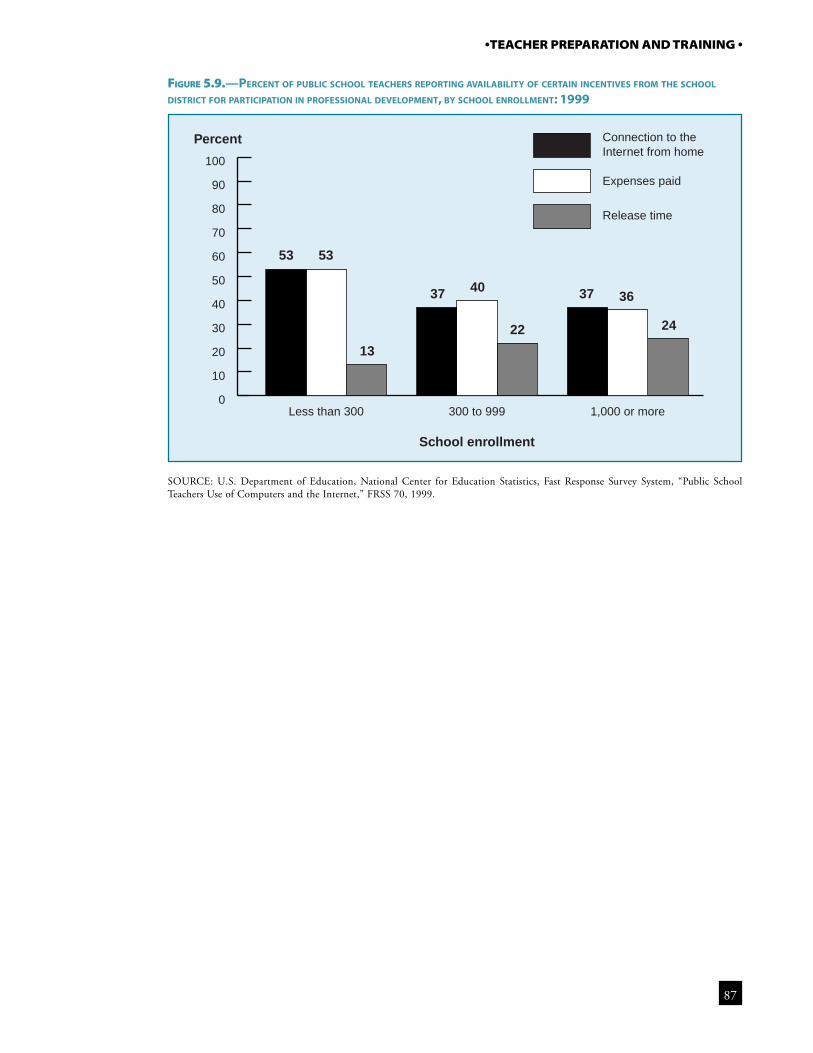
87
•TEACHER PREPARATION AND TRAINING •
FIGURE 5.9.—PERCENT OF PUBLIC SCHOOL TEACHERS REPORTING AVAILABILITY OF CERTAIN INCENTIVES FROM THE SCHOOL
DISTRICT FOR PARTICIPATION IN PROFESSIONAL DEVELOPMENT, BY SCHOOL ENROLLMENT: 1999
SOURCE: U.S. Department of Education, National Center for Education Statistics, Fast Response Survey System, “Public SchoolTeachers Use of Computers and the Internet,” FRSS 70, 1999.
Percent
School enrollment
53 53
13
37 40
22
37 36
24
0
10
20
30
40
50
60
70
80
90
100
Connection to the Internet from home
Expenses paid
Release time
1,000 or more300 to 999Less than 300