chapter 11 economic performance - trunity · 1 contemporary economics: lesson 11.1 © south-western...
TRANSCRIPT

© SOUTH-WESTERNCONTEMPORARY ECONOMICS: LESSON 11.11
CHAPTER 11
Economic Performance
11.1 Gross Domestic Product
11.2 Limitations of GDP Estimation
11.3 Business Cycles
11.4 Aggregate Demand and Aggregate
Supply

© SOUTH-WESTERNCONTEMPORARY ECONOMICS: LESSON 11.12
CHAPTER 11
Economic Performance
How is the economy’s performance measured?
What’s gross about the gross domestic product?
What’s the impact on gross domestic product if you make
yourself a sandwich for lunch?
How can you compare the value of production in one year
with that in other years if prices change over time?
What’s the business cycle?
What’s the big idea with the national economy?
Consider

© SOUTH-WESTERNCONTEMPORARY ECONOMICS: LESSON 11.13
LESSON 11.1
Gross Domestic Product
Describe what the gross domestic
product measures.
Learn two ways to calculate the gross
domestic product, and explain why they
are equivalent.
Objectives

© SOUTH-WESTERNCONTEMPORARY ECONOMICS: LESSON 11.14
LESSON 11.1
Gross Domestic Product
economy
gross domestic product (GDP)
consumption
investment
aggregate expenditure
aggregate income
Key Terms
© SOUTH-WESTERNCONTEMPORARY ECONOMICS: LESSON 11.15
The National Economy
National economics, or macroeconomics,
focuses on the overall performance of the
economy.
Economy describes the structure of
economic activity in a locality, a region, a
country, a group of countries, or the
world.
© SOUTH-WESTERNCONTEMPORARY ECONOMICS: LESSON 11.16
Gross Domestic Product
Gross domestic product (GDP)
measures the market value of all final
goods and services produced in the
United States during a given period.

© SOUTH-WESTERNCONTEMPORARY ECONOMICS: LESSON 11.17
National Income Accounts
Organize huge quantities of data
collected from a variety of sources across
the United States
Keep track of the value of final goods
and services

© SOUTH-WESTERNCONTEMPORARY ECONOMICS: LESSON 11.18
No Double Counting
Intermediate goods and services are those
purchased for additional processing and
resale.
Sales of intermediate goods and services are
excluded from GDP to avoid the problem of
double counting.
GDP also ignores most of the secondhand
value of used goods, such as existing homes
and used cars.
© SOUTH-WESTERNCONTEMPORARY ECONOMICS: LESSON 11.19
Calculating GDP
GDP based on the expenditure approach
GDP based on the income approach

© SOUTH-WESTERNCONTEMPORARY ECONOMICS: LESSON 11.110
GDP Expenditure Approach
The expenditure approach to GDP adds up the
spending on all final goods and services produced in
the economy during the year.
Consumption consists of purchases of final goods and
services by households during the year.
Investment consists of spending on new capital goods
and additions to inventories.
Aggregate expenditure equals the sum of
consumption, investment, government purchases, and
net exports.
C + I + G + (X – M) = GDP
© SOUTH-WESTERNCONTEMPORARY ECONOMICS: LESSON 11.111
GDP Income Approach
The income approach to GDP adds up
the aggregate income earned during the
year by those who produce that output.
Aggregate income equals the sum of all
the income earned by resource suppliers
in the economy.

© SOUTH-WESTERNCONTEMPORARY ECONOMICS: LESSON 11.112
Computation of Value
Added for a New Desk
Stage of
Production
(1)
Sale Value
(2)
Cost of
Intermediate Goods
(3)
Value Added
Logger $ 20 — $ 20
Miller 50 $ 20 30
Manufacturer 120 50 70
Retailer 200 120 80
Market value of final good $200

© SOUTH-WESTERNCONTEMPORARY ECONOMICS: LESSON 11.213
LESSON 11.2
Limitations of
GDP Estimation
Identify what types of production GDP
calculations neglect.
Determine why and how to adjust GDP
for changes over time in the general
price level.
Objectives

© SOUTH-WESTERNCONTEMPORARY ECONOMICS: LESSON 11.214
LESSON 11.2
Limitations of
GDP Estimation
depreciation
nominal GDP
real GDP
consumer price index (CPI)
Key Terms

© SOUTH-WESTERNCONTEMPORARY ECONOMICS: LESSON 11.215
What GDP Misses
Household production
Underground economy
Leisure, quality, and variety
Depreciation
GDP does not reflect all costs
Negative externalities
Both GDP and net national product ignore
the depletion of natural resources.

© SOUTH-WESTERNCONTEMPORARY ECONOMICS: LESSON 11.216
Adjusting GDP
for Price Changes
Nominal GDP versus real GDP
Price indexes
Consumer price index
GDP price index

© SOUTH-WESTERNCONTEMPORARY ECONOMICS: LESSON 11.217
Nominal GDP
Versus Real GDP
Nominal GDP is based on the prices at
the time of the transaction; current-dollar
GDP.
Real GDP is the economy’s aggregate
output measured in dollars of constant
purchasing power; GDP measured in
terms of the goods and services
produced.
© SOUTH-WESTERNCONTEMPORARY ECONOMICS: LESSON 11.218
Price Indexes
An index number compares the value of
a variable in a particular year to its value
in a base year, or reference year.
© SOUTH-WESTERNCONTEMPORARY ECONOMICS: LESSON 11.219
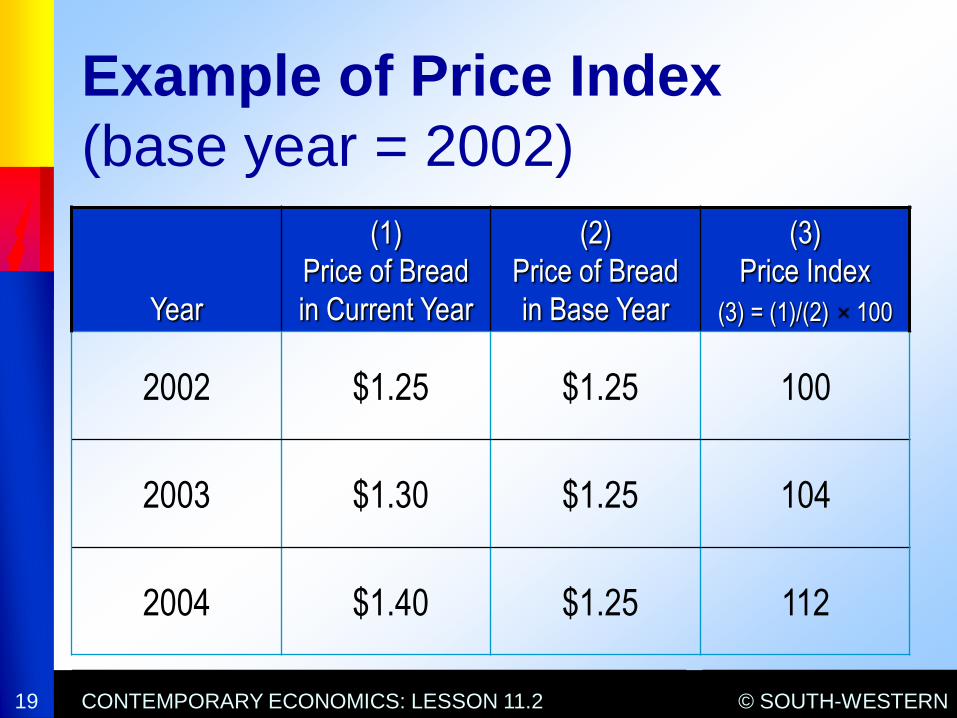
Example of Price Index
(base year = 2002)
Year
(1)
Price of Bread
in Current Year
(2)
Price of Bread
in Base Year
(3)
Price Index
(3) = (1)/(2) 100
2002 $1.25 $1.25 100
2003 $1.30 $1.25 104
2004 $1.40 $1.25 112
© SOUTH-WESTERNCONTEMPORARY ECONOMICS: LESSON 11.220
Consumer Price Index
The consumer price index (CPI)
measures changes over time in the cost
of buying a “market basket” of goods and
services purchased by a typical family.
The CPI is reported monthly, based on
prices from thousands of sellers across
the country.

© SOUTH-WESTERNCONTEMPORARY ECONOMICS: LESSON 11.221
GDP Price Index
The GDP price index includes all goods
and services produced.
GDP price index =Nominal GDP
Real GDP× 100

© SOUTH-WESTERNCONTEMPORARY ECONOMICS: LESSON 11.322
LESSON 11.3
Business Cycles
Distinguish between the two phases of
the business cycle, and compare the
average length of each.
Differentiate among leading, coincident,
and lagging economic indicators.
Objectives

© SOUTH-WESTERNCONTEMPORARY ECONOMICS: LESSON 11.323
LESSON 11.3
Business Cycles
business cycle
recession
expansion
leading economic indicators
Key Terms

© SOUTH-WESTERNCONTEMPORARY ECONOMICS: LESSON 11.324
U.S. Economic Fluctuations
The business cycle reflects the rise and
fall of economic activity relative to the
long-term growth trend of the economy.

© SOUTH-WESTERNCONTEMPORARY ECONOMICS: LESSON 11.325
Recessions and Expansions
A recession is a decline in total
production lasting at least two
consecutive quarters, or at least six
months.
Expansion is the phase of economic
activity during which the economy’s total
output increases.

© SOUTH-WESTERNCONTEMPORARY ECONOMICS: LESSON 11.326
Long-term Growth
The U.S. economy has grown
dramatically over the long run.

© SOUTH-WESTERNCONTEMPORARY ECONOMICS: LESSON 11.327
Business Cycles

© SOUTH-WESTERNCONTEMPORARY ECONOMICS: LESSON 11.328
Annual Percentage Change
in U.S. Real GDP Since 1929
© SOUTH-WESTERNCONTEMPORARY ECONOMICS: LESSON 11.329
Different Impact on States
The intensity of the business cycle varies
from region to region across the United
States.
A recession hits hardest those regions
that produce durable goods.
© SOUTH-WESTERNCONTEMPORARY ECONOMICS: LESSON 11.330
Business Cycles
Around the Globe
Market economies around the world
often move together.
A slump in other major economies could
worsen a recession in the United States,
and vice versa.

© SOUTH-WESTERNCONTEMPORARY ECONOMICS: LESSON 11.331
Economic Indicators
Leading indicators predict future changes.There are 10 leading indicators combined into the
index of leading indicators and reported monthly.
Coincident indicators measure ups and downs
as they occur.There are four coincident economic indicators
combined into the index of coincident indicators.
Lagging indicators measure ups and downs
after they have already occurred.There are seven economic measures combined into
the index of lagging indicators.

© SOUTH-WESTERNCONTEMPORARY ECONOMICS: LESSON 11.432
LESSON 11.4
Aggregate Demand
and Aggregate Supply
Explain what is meant by aggregate output
and the economy’s price level.
Describe the aggregate demand curve and the
aggregate supply curve, and show how they
determine the equilibrium level of price and
aggregate output.
Objectives

© SOUTH-WESTERNCONTEMPORARY ECONOMICS: LESSON 11.433
LESSON 11.4
Aggregate Demand
and Aggregate Supply
aggregate output
aggregate demand
price level
aggregate demand curve
aggregate supply curve
Key Terms

© SOUTH-WESTERNCONTEMPORARY ECONOMICS: LESSON 11.434
Aggregate Output
Aggregate output is the total amount of
goods and services produced in the
economy during a given period.
Aggregate demand is the relationship
between the average price of aggregate
output and the quantity of aggregate
output demanded.

© SOUTH-WESTERNCONTEMPORARY ECONOMICS: LESSON 11.435
The Price Level
A composite measure reflecting the
prices of all goods and services in the
economy relative to prices in a base
year.

© SOUTH-WESTERNCONTEMPORARY ECONOMICS: LESSON 11.436
Real Gross
Domestic Product
After adjusting GDP for price changes,
you end up with real GDP.

© SOUTH-WESTERNCONTEMPORARY ECONOMICS: LESSON 11.437
Aggregate Demand and
Aggregate Supply Curves
The aggregate demand curve shows the
relationship between the price level in the
economy and the real GDP demanded.
The aggregate supply curve shows how
much output U.S. producers are willing and
able to supply at each price level.
The intersection of the aggregate demand
curve and aggregate supply curve determines
the equilibrium levels of price and real GDP in
the economy.

© SOUTH-WESTERNCONTEMPORARY ECONOMICS: LESSON 11.438
Aggregate Demand and
Aggregate Supply Curves

© SOUTH-WESTERNCONTEMPORARY ECONOMICS: LESSON 11.439
U.S. Real GDP and
Price Level Since 1929