cavity enhanced immunoassay measurements in microtiter ... · 1 cavity enhanced immunoassay...
TRANSCRIPT

1
Cavity Enhanced Immunoassay Measurements in Microtiter Plates using
BBCEAS
Zuzana Bajuszova, Zulfiqur Ali, Simon Scott, L. Nitin Seetohula, and Meez Islam*
School of Science and Engineering, Teesside University, Borough Road, Middlesbrough, TS1 3BA,
United Kingdom aPresent address, College of Arts and Science, School of Science & Technology, Nottingham Trent
University, Burton Street, Nottingham, NG1 4BU
*To whom correspondence should be addressed. Email: [email protected]
We report on the first detailed use of broadband cavity enhanced absorption spectroscopy (BBCEAS) as
a detection system for immunoassay. A vertical R ≥ 0.99 optical cavity was integrated with a motorised
XY stage, which functioned as a receptacle for 96 well microtiter plates. The custom built cavity
enhanced microplate reader was used to make measurements on a commercially available osteocalcin
sandwich ELISA kit. A 30 fold increase in path length was obtained with a minimum detectable change
in the absorption coefficient, αmin(t), of 5.3 × 10⁻⁵
cm-1
Hz-1/2
. This corresponded to a 39 fold increase in
the sensitivity of measurement when directly compared to measurements in a conventional microplate
reader. Separate measurements of a standard STREP-HRP colorimetric reaction in microtiter plates of
differing optical quality produced an increase in sensitivity of up to 115 fold compared to a conventional
microplate reader. The sensitivity of the developed setup compared favorably with previous liquid-phase
cavity enhanced studies and approaches the sensitivity of typical fluorometric ELISAs. It could benefit
any biochemical test which uses single pass absorption as a detection method, through either the label
free detection of biologically important molecules at lower concentrations or the reduction in the
amount of expensive biochemicals needed for a particular test, leading to cheaper tests.
Enzyme linked Immunosorbent Assays (ELISA) are amongst the most widely used and important bio-
analytical techniques currently available. They are based on the detection of highly specific antibody
antigen reactions with key characteristics of, accuracy, precision, limit of detection, measurement range,
and cost. With the availability of a wide range of disease biomarkers and increased use of expensive
reagents an ELISA can be costly to use if several biomarkers need to be measured in an investigation [1]
.
The most commonly used ELISA detection method involves colorimetric detection through the use of
visible wavelength absorption spectroscopy with an appropriate microplate reader. There are, however,
a variety of other formats including simple dip strip ELISA [2]
. Absorption spectroscopy is simple and
widely used but has relatively poor sensitivity when compared to other analytical techniques. This is
because the measurement of a small absorption requires the measurement of a small difference between
two large signals, corresponding to the intensity with and without sample, unlike for example
fluorescence spectroscopy where the measurement can be made in principle against a zero background
signal. Consequently, fluorometric detection of ELISA is typically 100 - 1000 times more sensitive than
colorimetric detection [3]
. However, fluorometric detection requires the fluorescent labeling of some of
the ELISA reagents whilst the cost of fluorometric microplate readers is significantly higher than basic

2
colorimetric microplate readers as more expensive optical components are required. Methods which can
increase the sensitivity of colorimetric detection are therefore highly desirable as they would potentially
allow this simpler, cheaper and label free detection method to be used for tests where currently only
fluorometric detection has the required sensitivity.
The Beer–Lambert law states that the absorbance is proportional to the path length of measurement and
so the sensitivity of absorption measurements can be improved by increasing the path length. However,
increasing the physical path length is not feasible for most bio-analytical applications. Over the past two
decades the sensitivity of absorption spectroscopy has been greatly improved through the development
of techniques based on the use of optical cavities. These have used high reflectivity dielectric mirrors to
form an optical cavity around the sample which allows light entering through the back of one of the
mirrors to be essentially multi-passed many times through the sample and thus greatly increase the
effective path length of measurement. The first experimental studies were based on cavity ring down
spectroscopy (CRDS) [4]
, which required powerful laser light sources and complex and expensive fast
detection equipment to measure the decay in intensity of light exiting the cavity on a microsecond
timescale. This ‘ring down time’ could be directly related to the absorption coefficient of an analyte.
Later on an experimentally simpler variant, cavity enhanced absorption spectroscopy (CEAS) [5]
was
demonstrated. This required only the measurement of the time integrated intensity exiting the cavity and
so could use slower and cheaper detection setups but had the disadvantage of requiring calibration
measurements to obtain the absorption coefficient of analytes. Further experimental innovations were
demonstrated through broadband CEAS (BBCEAS) [6]
, where a high intensity lamp was used as the
light source instead of a laser and coupled with a multiplex detector to allow simultaneous measurement
across a wide wavelength range. LED-BBCEAS has additionally reduced complexity and cost through
the use of a high intensity LED as the light source [7]
. Most of the previous cavity based measurements
have been made on gas-phase analytes as low background scattering and absorption by gases allows a
very high number of passes (>104 with suitable high reflectivity mirrors) to be achieved. Only a few
liquid-phase cavity based studies have been reported to date as the solvent related scattering and
absorption losses are much higher [8][14]
. However, for bio-analytical applications the majority of
analytes are in the liquid-phase. Many of the previous liquid-phase studies have used CRDS and have
focused on using CRDS as a detection method for high performance liquid chromatography (HPLC).
Recently LED-BBCEAS has been applied to liquid-phase measurements both in cuvettes [15], [16]
and
also as a detector for HPLC measurements [17]
. The sensitivity of these measurements was comparable
to the CRDS measurements whilst using a substantially less complex and lower cost experimental setup.
There have been no previously reported CEAS studies that have been applied to more complex and
practically relevant liquid-phase assays such us immunoassay.
We have previously described the use of the CEAS detection for measurements in microtitre plates [18]
.
We now demonstrate the first use of LED-BBCEAS to absorption measurements for immunoassay in
microtiter plates. Absorbance based microplate readers are one of the most commonly used instruments
for bioassays. Their importance in clinical investigations is significant, however, the use of high cost
analytes and antibodies make the consumable cost of certain bioassays expensive. The potential benefits
of increasing the sensitivity of colorimetric detection include making the sensitivity of colorimetric
bioassays comparable to fluorometric bioassays and also a reduction in the quantity and cost of
expensive reagents needed to make a measurement for colorimetric bioassays where the existing
sensitivity is sufficient.
3
EXPERIMENTAL SECTION
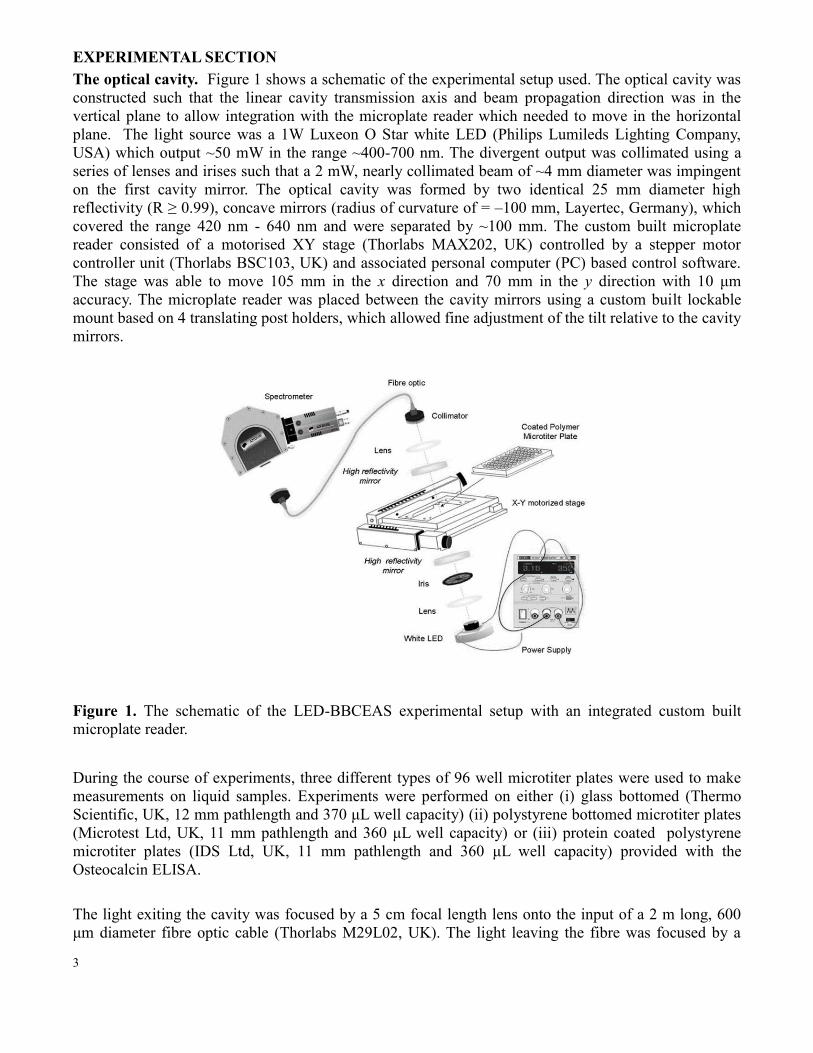
The optical cavity. Figure 1 shows a schematic of the experimental setup used. The optical cavity was
constructed such that the linear cavity transmission axis and beam propagation direction was in the
vertical plane to allow integration with the microplate reader which needed to move in the horizontal
plane. The light source was a 1W Luxeon O Star white LED (Philips Lumileds Lighting Company,
USA) which output ~50 mW in the range ~400-700 nm. The divergent output was collimated using a
series of lenses and irises such that a 2 mW, nearly collimated beam of ~4 mm diameter was impingent
on the first cavity mirror. The optical cavity was formed by two identical 25 mm diameter high
reflectivity (R ≥ 0.99), concave mirrors (radius of curvature of = –100 mm, Layertec, Germany), which
covered the range 420 nm - 640 nm and were separated by ~100 mm. The custom built microplate
reader consisted of a motorised XY stage (Thorlabs MAX202, UK) controlled by a stepper motor
controller unit (Thorlabs BSC103, UK) and associated personal computer (PC) based control software.
The stage was able to move 105 mm in the x direction and 70 mm in the y direction with 10 μm
accuracy. The microplate reader was placed between the cavity mirrors using a custom built lockable
mount based on 4 translating post holders, which allowed fine adjustment of the tilt relative to the cavity
mirrors.
Figure 1. The schematic of the LED-BBCEAS experimental setup with an integrated custom built
microplate reader.
During the course of experiments, three different types of 96 well microtiter plates were used to make
measurements on liquid samples. Experiments were performed on either (i) glass bottomed (Thermo
Scientific, UK, 12 mm pathlength and 370 μL well capacity) (ii) polystyrene bottomed microtiter plates
(Microtest Ltd, UK, 11 mm pathlength and 360 μL well capacity) or (iii) protein coated polystyrene
microtiter plates (IDS Ltd, UK, 11 mm pathlength and 360 μL well capacity) provided with the
Osteocalcin ELISA.
The light exiting the cavity was focused by a 5 cm focal length lens onto the input of a 2 m long, 600
μm diameter fibre optic cable (Thorlabs M29L02, UK). The light leaving the fibre was focused by a

4
fibre optic collimator (Thorlabs F240-SMA, UK) onto the 100 μm entrance slit of the detection
spectrometer. This consisted of an Andor Shamrock SR163 spectrograph coupled to a thermoelectrically
cooled Andor iDus DV420-OE CCD camera, which operated over the range ~420 nm - 550 nm with ~1
nm resolution when used with a 1200 lines/mm grating. The spectrometer and recording of spectra was
controlled through the software program SOLIS (Andor, UK) which ran on a PC which was connected
to the CCD camera via a USB connection. Comparative conventional single pass microtiter plate
measurements were made using a BioTek, Synergy HT Multi-Mode Microplate Reader (BioTek, USA)
which had a stated minimum detectable change in absorbance of 1 × 10⁻³
.
Experimental methodology. Previous studies have shown that the absorption in a gas-phase CEAS
experiment can be expressed by [19]
:
(1)
where, I0() and I() are the measured transmitted intensities with and without the absorber in the
cavity, is the base path length through the sample in the cavity in cm, R() is the average wavelength
dependent mirror reflectivity, ε is the wavelength dependent extinction coefficient in ng-1
mL cm-1
, and
C is the concentration of the sample in ng mL-1
. This expression, which is valid for all reasonable
absorptions, shows that in a cavity experiment, I0()/I() is linearly proportional to the concentration of
the analyte. It can be seen from Eqn.1 that the enhancement offered by a cavity experiment over a single
pass experiment is due to the term
. If this is set to be the wavelength dependent cavity
enhancement factor (CEF), then the expression can be rearranged in terms of CEF [8]
:
(2)
Therefore, the CEF can be calculated at a given cavity absorption wavelength and concentration if the
extinction coefficient of the analyte at a given wavelength ε and the base path length of measurement
are known, or if the cavity absorption and single pass absorbance (denominator term in Eqn.2) for the
same sample is known. The CEF values can be averaged over several readings to obtain a more
representative value. For measurements where the plot of cavity absorption against concentration was
not expected to be linear, such as immunoassay standard curves, this was the approach taken.
Alternatively if
is plotted versus concentration and the gradient of the linear plot
divided by 2.303εl, then a value of the CEF at a given wavelength and averaged over a range of
concentrations is obtained. In this case of a linear relationship between cavity absorption and
concentration a linear regression is fitted and the gradient obtained by a least squares method. The
standard deviation in the measurement of the gradient can also be used to calculate the standard
deviation in the CEF value. Although for gas-phase cavity measurements the CEF() =
and thus
can be used to determine the mirror reflectivity at a given wavelength, for the present liquid-phase
measurements in a microtiter plate, the CEF value contains significant contributions from both solvent

5
and microtiter plate related scattering and absorption losses and thus is a measure of the total cavity loss.
i.e.
(3)
where Ltotal() is the per pass total cavity loss at a given wavelength and Lscat+abs() is the per pass
scattering and absorption loss from the microtiter plate and solvent at a given wavelength.
The CEF value can be used to calculate the effective path length of measurement at a given wavelength
(leff = l × CEF) where l is the base path length. The effective path length is used in the calculation of the
sensitivity of the measurement which is defined in terms of the minimum detectable change in the
absorption coefficient αmin (also known as noise-equivalent absorption coefficient [19]
). This is given by
the expression:
(4)
where ∆ABSmin is the minimum detectable absorbance change in the cavity absorption spectrum. This
was determined by recording two successive I0 spectra for a blank solution and calculating an
absorbance spectrum by treating one of the spectra as the I spectrum. Ideally this 'blank' spectrum
should consist of a flat line centered around an absorbance of zero. ∆ABSmin could be calculated from
this spectrum by measuring the standard deviation in absorbance around the wavelength of
measurement which was usually the wavelength of peak cavity absorption.
The value of αmin could also be used to calculate the limit of detection (LOD) of an analyte which is
defined as the smallest amount that can be reliably measured [15]
. It was calculated from the expression:
(5)
To allow a fairer comparison of the sensitivity of an experiment, the ∆ABSmin values were normalised to
one second of measurement by taking the total acquisition time in seconds () into account by using the
following expression:
(6)
The time normalised αmin(t) value with units of cm-1
Hz-1/2
for each measurement was given as:
(7)
Optimisation and alignment of the setup. The BBCEAS measurements in a microtiter plate
introduced some new experimental challenges. Initially, the alignment of the empty cavity was

6
optimised by iterative adjustment of the kinematic controls on the top and bottom cavity mirror mounts,
such as to maximise the output reaching the detector. This procedure was repeated when an empty
microtiter plate was introduced into the cavity by the adjustment of the 4 lockable mounts relative to the
cavity mirrors. The insertion of the microtiter plate led to a decrease in output intensity as a result of
additional scattering and absorption losses. The glass bottomed microtiter plates, introduced a loss of
~20% compared to the ~50 - 70% loss of the lower optical quality polystyrene microtiter plates. The
addition of phosphate buffer solution (PBS) as a blank solution for measurements, introduced a further
cavity loss of ~10%. It was noticed that the total cavity loss (as measured by the intensity reaching the
detector) was sensitive to the level of liquid in the well. The losses were high at levels below full well
capacity, rapidly decreased as full well capacity was approached and then increased again as full well
capacity was exceeded. On closer examination, the loss appeared to be related to the shape of the
liquid/air interface. At levels less than full well capacity the shape of the meniscus was concave and
resulted in higher interface scattering losses. As the level approached full well capacity the meniscus
flattened leading to a substantial reduction in interface scattering losses. When the full well capacity was
slightly exceeded the shape of the meniscus became convex, again leading to increased interface
scattering losses. Consequently, to minimise interface losses, careful adjustment of the liquid level in the
well was made using a syringe to optimise both the liquid level and shape of the interface. This was
achieved through maximising the intensity reaching the detector.
Colorimetric reaction. Preliminary experiments to optimise the experimental setup were performed on
a colorimetric reaction involving the enzyme linked conjugate Streptavidin-Horseradish Peroxidase
(STREP-HRP), as this reaction was also used as part of the subsequent osteocalcin ELISA assay. The
reaction was performed in both glass and polymer bottomed microtiter plates to determine the relative
optical losses of the two types of microtiter plates.
A 25 µg mL-1
STREP-HRP conjugate was used as a stock solution to prepare serial dilutions of the
enzyme linked protein in the range from 0.1 ng mL-1
to 0.8 ng mL-1
. The colorimetric reaction was
carried out in clear 7.0 mL sterile plastic containers (Bijou PP, SLS Ltd) under dark conditions. 3,3',5,5'-
tetramethylbenzidine (TMB) was used as a non-carcinogenic substrate solution and was pipetted into
each STREP-HRP solution in a 1:10 ratio (100 µL of STREP-HRP and 1 mL of TMB). After 15 minutes
incubation time the chromogenic substrate was enzymatically oxidised to a blue coloured product. Upon
addition of 1mL of sulphuric acid to each vial a yellow colour change took place and samples were
immediately transferred into appropriate microplate wells for absorption measurement at 450 nm in the
cavity. Phosphate buffer solution (PBS) at a pH 7.4 was used as a blank solution for each of the samples.
The absorption at 450 nm directly reflected the quantity of streptavidin present in each sample. Cavity
absorption measurements were repeated three times at each concentration in the range 0.1 ng mL-1
to 0.8
ng mL-1
and the results were compared with single pass absorption measurements in a 1 cm quartz
cuvette, using a conventional UV-Visible double beam spectrometer (Jasco V-630).
Sandwich ELISA. A commercially available ELISA kit (N-MID Osteocalcin, IDS diagnostics) was
chosen for the application of BBCEAS. The assay is a well-known immunological diagnostic test
widely used in metabolic bone disorder clinical research. The test is designed to detect and quantify
osteocalcin in human serum and plasma. Osteocalcin is a non-collagenous calcium binding protein
mainly produced by osteoblasts. After synthesis, it is delivered to bone matrix and also partially released
into the circulation system. As it originates from bone, the amount of osteocalcin present in serum
directly reflects bone formation activity. Indication of osteoblast activity is a valuable aid in identifying
individuals at a risk of developing osteoporosis or conditions that are associated with both high and low
bone turnover respectively, such as growth hormone deficiency or hyper- and hypo-parathyroidism. The

7
method was based on a sandwich ELISA, using a biotinylated monoclonal antibody as a capture
antibody and an HRP-labelled monoclonal antibody as a detection antibody. Detection is accomplished
by measuring the activity of the peroxidase enzyme with a chromogenic substrate. The absorption of the
resulting coloured product is directly proportional to the concentration of osteocalcin present in the
sample.
The ELISA kit contained a 96 well polystyrene microtiter plate. The bottom of each well was coated
with a layer of streptavidin. Each subunit of the tetrameric protein can strongly bind four molecules of
biotin. During the assay the strong bond between the two compounds is utilized to attach biotin-labelled
osteocalcin antibody to the streptavidin coated plate.
Assay procedure. The complete ELISA procedure was carried out at room temperature (~22°C). The
antibody solution was prepared by adding 10 mL of the diluted conjugated solution to both the
peroxidase, and biotinylated antibody and then mixing equal volumes of the two solutions together. The
ELISA kit contained synthetic human osteocalcin standards (CAL 1-5) which were reconstituted with
500 μL of distilled water, resulting in solutions of concentration 3.7 ng mL-1
to 61.6 ng mL-1
. CAL 0 was
a blank solution which contained PBS, protein stabilizer and preservatives.
Figure 2 shows a schematic of the ELISA procedure. Immuno strips incubation required 20 µL of the
CAL 0-5 standards to be pipetted into appropriate wells (a), followed by addition of 150 µL of the
mixed antibody solution (b). The strips were incubated for 120±5 minutes without any mixing under
dark conditions. The wells were washed 5 times with approximately 300 µL of washing buffer solution
to remove excess antibody solution (c). For the final stage, 250 µL of chromogenic TMB substrate
solution was pipetted into each well except the one containing the PBS blank solution (d). After 15±2
min incubation in the dark, TMB was oxidized by the enzyme HRP attached to the detection antibody to
yield a blue colour. The reaction was stopped by adding 250 µL of H2SO4 stopping solution to each
well, resulting in a final yellow colour (e). The total volume of liquid added slightly exceeded the total
capacity of the well (360 µL) leading to a convex bulge on top of the well. A flat surface layer was
ensured to minimise interface losses as described previously (f). Comparison was made by determining
the osteocalcin ELISA standard calibration curve using a conventional microplate reader (BioTek,
Synergy HT) to make absorbance measurements at 450 nm.
Figure 2. Osteocalcin assay procedure: (a) CAL 0-5 standards, (b) mixed antibody solution, (c) removal
of excess antibodies, (d) TMB substrate solution, (e) H2SO4 stopping solution, (f) Cavity enhanced
measurement.
(a) (b) (c) (d) (e) (f)

8
RESULTS AND DISCUSSION
Colorimetric reactions. The colorimetric reaction between STREP-HRP and TMB was studied in both
polystyrene and glass bottomed microtiter plates. Figure 3 shows (a) a representative cavity absorption
spectrum of STREP-HRP in a glass bottomed plate in the range 400 nm - 520 nm and at a concentration
of 0.2 ng mL-1
and (b) a cavity absorption plot in a polymer plate at concentrations ranging from 0.1 ng
mL-1
to 0.8 ng mL-1
. Table 1 lists the figures of merit for the measurements along with those for the
osteocalcin ELISA measurements. It can be seen that the CEF value at 450 nm for the measurements in
the glass bottomed microtiter plates (55.6) is significantly higher than that in the polymer bottomed
plates (33.8) as a result of the better optical quality which produces lower optical losses in the optical
cavity. This also leads to lower ∆ABSmin values as a higher intensity reaches the detector and as the noise
is proportional to the square root of the intensity at the detector, for cases such as these which are
essentially shot noise limited. This also contributes to lower αmin(t) and LOD values. However, the
polymer bottomed microtiter plate results still produce a substantial improvement in both path length
and sensitivity (42 fold, Table 1) when compared to a single pass measurement. This is important
because current bio-analytical microtiter plate measurements are typically performed in polymer
bottomed microtiter plates.
Figure 3. (a) Representative cavity absorption spectrum of the STREP-HRP conjugate obtained in a
glass bottomed microtiter plate. (b) Cavity absorption plot in a polymer bottomed microtiter plate.
(a) (b)
400 420 440 460 480 500 5200
2
4
6
8
10
12
0.2 ng mL-1
[nm]
I o I-1
( )
CE_Plate Reader STREP-HRP conjugate (glass plate)
0.0 0.1 0.2 0.3 0.4 0.5 0.6 0.7 0.8 0.90
3
6
9
12
15
18
21
24
CE_Plate Reader STREP-HRP conjugate (polymer plate)
y = 21.6330x + 0.6680
R² = 0.9969
Concentration [ng mL-1]
I o I-1
( )

9
Table 1. Summary of the results in terms of the assay plate, the base path length, the CEF value at 450
nm and the standard deviation of the measurement, the αmin(t) and the LOD of the analyte, and the
minimum detectable change in absorbance noise ΔABSmin(t) at 450 nm with R≥0.99 mirror set.
Osteocalcin ELISA. BBCEAS measurements were made on the calibration solutions from a
commercial osteocalcin kit. These results were compared with measurements performed in a standard
microplate reader to determine the CEF values at 450 nm using Eqn. 2 whilst other figures of merit are
also listed in Table 1. Figure 4 shows (a) the cavity enhanced absorption plot of human osteocalcin
standards (CAL 1-5) and the blank solution (CAL 0) as a function of concentration in the range 0 ng
mL-1
to 61.6 ng mL-1
and (b) the single pass calibration curve using the standard microplate reader. Both
plots show a characteristic sigmoidal curve due to cooperative binding between the antibody and
antigen. The reduction in average number of passes (30.2) when compared to polymer bottomed plates
for STREP-HRP (33.8) was most probably the result of the increasing effect of stray light in the
spectrometer on the higher analyte concentrations (Table 2) which produced very large absorptions. This
would be expected to lead to the measured absorption being lower than the true absorption and thus an
underestimate of the calculated CEF value. Although the better optical quality of the ELISA microtiter
plate produced lower optical losses in the optical cavity and resulted in lower ∆ABSmin(t), the lower CEF
value contributed to higher αmin(t) and LOD values. The results obtained in the studied concentration
range were significant as they showed the ability of the system to measure higher analyte concentrations
and thus broaden its applicability.
Figure 4. The absorption versus concentration plot of human osteocalcin ELISA in the range 0 ng mL-1
to 61.6 ng mL-1
. The error bars represent the standard deviation of the measurements. (a) The
measurement in the cavity enhanced microplate reader. (b) The corresponding calibration curve obtained
in the standard microplate reader.
Technique Sample Microtiter plate
l /cm CEF ΔABSmin(t) αmin(t) /cm-1 Hz-1/2 LOD (ng mL-1)
CE-Plate Reader STREP-HRP Glass 1.2 55.6 ± 1.3 5.25 × 10⁻⁴ 1.81 × 10⁻⁵ 9.35 × 10⁻⁵
CE-Plate Reader STREP-HRP Uncoated polymer 1.1 33.8 ± 0.8 8.02 × 10⁻⁴ 4.96 × 10⁻⁵ 2.56 × 10⁻⁴
CE-Plate Reader OST ELISA Strep coated polymer 1.1 30.2 ± 4.6 7.45 × 10⁻⁴ 5.33 × 10⁻⁵ 2.75 × 10⁻⁴
Standard Plate Reader Polymer
1.1 1 ×10⁻³ 2.09 × 10⁻³
0 10 20 30 40 50 60 700
10
20
30
40
50
60
70
80
Concentration of CAL [ng mL-1]
CE_Plate Reader Osteocalcin ELISA
I o I-1
( )
CA
L2
CA
L5
CA
L0
CA
L1
CA
L4
CA
L3
0 10 20 30 40 50 60 700.0
0.2
0.4
0.6
0.8
1.0
1.2
1.4
CA
L4
CA
L5
CA
L3
CA
L2
CA
L0
Standard Plate Reader Osteocalcin ELISA
Absorb
ance
Concentration of CAL [ng mL-1]
CA
L1
(a) (b)
10
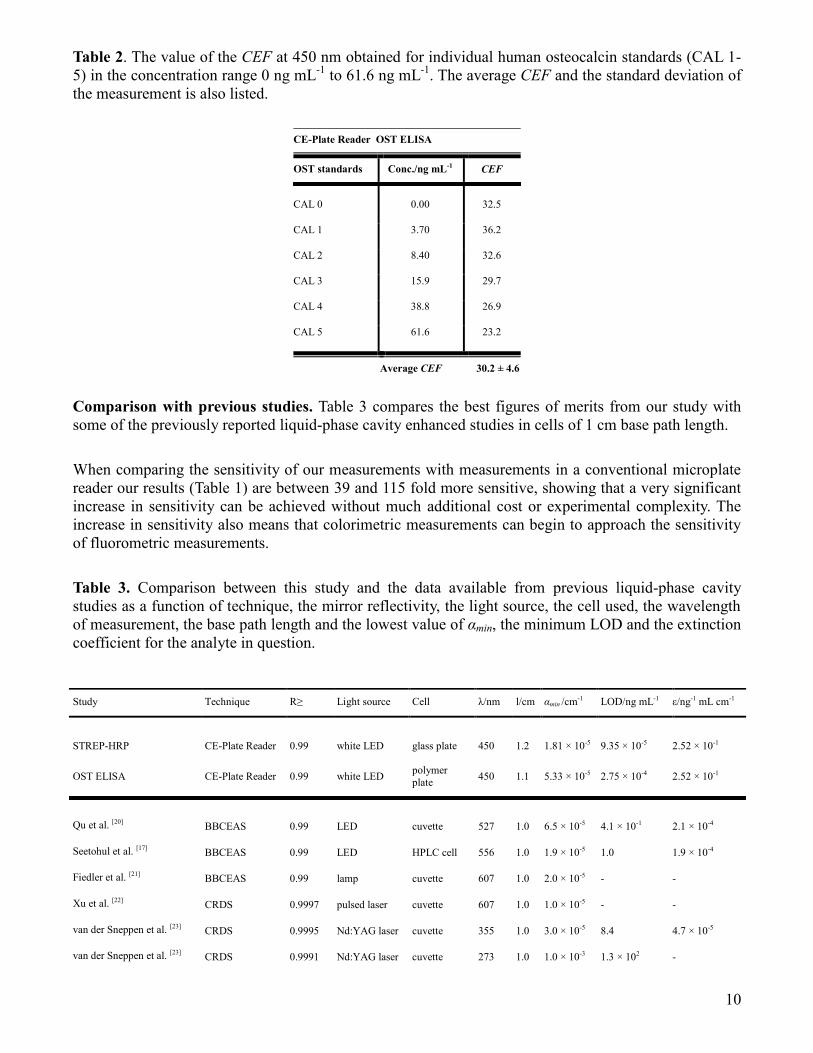
Table 2. The value of the CEF at 450 nm obtained for individual human osteocalcin standards (CAL 1-
5) in the concentration range 0 ng mL-1
to 61.6 ng mL-1
. The average CEF and the standard deviation of
the measurement is also listed.
Comparison with previous studies. Table 3 compares the best figures of merits from our study with
some of the previously reported liquid-phase cavity enhanced studies in cells of 1 cm base path length.
When comparing the sensitivity of our measurements with measurements in a conventional microplate
reader our results (Table 1) are between 39 and 115 fold more sensitive, showing that a very significant
increase in sensitivity can be achieved without much additional cost or experimental complexity. The
increase in sensitivity also means that colorimetric measurements can begin to approach the sensitivity
of fluorometric measurements.
Table 3. Comparison between this study and the data available from previous liquid-phase cavity
studies as a function of technique, the mirror reflectivity, the light source, the cell used, the wavelength
of measurement, the base path length and the lowest value of αmin, the minimum LOD and the extinction
coefficient for the analyte in question.
CE-Plate Reader OST ELISA
OST standards Conc./ng mL-1 CEF
CAL 0 0.00 32.5
CAL 1 3.70 36.2
CAL 2 8.40 32.6
CAL 3 15.9 29.7
CAL 4 38.8 26.9
CAL 5 61.6 23.2
Average CEF 30.2 ± 4.6
Study Technique R≥ Light source Cell λ/nm l/cm αmin /cm-1 LOD/ng mL-1 ε/ng-1 mL cm-1
STREP-HRP CE-Plate Reader 0.99 white LED glass plate 450 1.2 1.81 × 10⁻⁵ 9.35 × 10⁻⁵ 2.52 × 10⁻¹
OST ELISA CE-Plate Reader 0.99 white LED polymer
plate 450 1.1 5.33 × 10⁻⁵ 2.75 × 10⁻⁴ 2.52 × 10⁻¹
Qu et al. [20] BBCEAS 0.99 LED cuvette 527 1.0 6.5 × 10⁻⁵ 4.1 × 10⁻¹ 2.1 × 10⁻⁴
Seetohul et al. [17] BBCEAS 0.99 LED HPLC cell 556 1.0 1.9 × 10⁻⁵ 1.0 1.9 × 10⁻⁴
Fiedler et al. [21] BBCEAS 0.99 lamp cuvette 607 1.0 2.0 × 10⁻⁵ - -
Xu et al. [22] CRDS 0.9997 pulsed laser cuvette 607 1.0 1.0 × 10⁻⁵ - -
van der Sneppen et al. [23] CRDS 0.9995 Nd:YAG laser cuvette 355 1.0 3.0 × 10⁻⁵ 8.4 4.7 × 10⁻⁵
van der Sneppen et al. [23] CRDS 0.9991 Nd:YAG laser cuvette 273 1.0 1.0 × 10⁻³ 1.3 × 10² -

11
Most of the previous liquid-phase cavity studies in 1 cm base path length cell have been performed
using generally more complex and expensive experimental setups and also higher reflectivity mirrors.
The first study by Xu et al. [22]
CRDS on the C-H stretching fifth vibrational overtones of benzene and
reported a value of αmin of 1.0 × 10⁻⁵
cm-1
. HPLC-CRDS measurements by van der Sneppen et al. [23]
at
355 nm and 273 nm had lower sensitivity as a result of the decreased performance of the high
reflectivity mirrors in the deep UV region. Fielder et al. [21]
made the first demonstration of liquid- phase
BBCEAS whilst Seetohul et al. [17]
reported the first HPLC-BBCEAS measurements. Qu et al. [20]
made
BBCEAS measurements using a simple low cost webcam based spectrometer. The sensitivity of the
measurements in the present study compares favorably with all the previous studies showing that similar
levels of sensitivity can be achieved in microtiter plates as in cuvettes. Table 3 lists the best LODs
obtained in this study and the comparison with the LODs, where available, of previous liquid-phase
cavity studies. The value of the LOD is affected both by the calculated value of αmin and the absorptivity
for the particular analyte. As would be expected the glass bottomed microtiter plate gave the lowest
LOD for the strong absorber STREP-HRP. The increased losses in polymer bottomed plates led to
higher αmin and LOD values. The LODs in this study compare favorably with previous studies taking
into the account the differences in the extinction coefficients of the analytes studied.
We have shown here a successful application of LED-BBCEAS detection for immunoassay and
colorimetric reactions in a microplate reader. The LED-BBCEAS approach has been shown to provide
around a 100 fold increase in sensitivity over conventional microplate readers which can lead to lower
LODs and/or reduced consumption of reagents within the assay and allow colorimetric detection to
approach the sensitivity of fluorometric detection.
Further work. Although our LED-BBCEAS system showed significant improvement over
conventional microtiter plate readers and the performance of the technique compares favourably with
previous liquid-phase cavity studies, the current sensitivity could be improved by a number of
modifications. Losses related to the shape of the liquid/air interface can be further reduced by use of
automated liquid dispensing to measure out accurately the exact amount of samples needed to fill the
well and/or use of a lid to cover the surface of the microtiter plate to flatten the meniscus. It should be
noted that the use of higher reflectivity cavity mirrors to increase the number of passes through the
cavity would be ineffective due to the dominant optical losses from the polymer microtiter plate. Higher
sensitivity could be achieved by using high quality glass bottomed microtiter plates but this would
require appropriate coatings specific for antigen-antibody binding. A number of further improvements
could be made, including fibre coupling the light exiting the cavity on to the thermoelectrically cooled
CCD detector for higher light throughput and improved signal to noise.
CONCLUSION
We describe the first report on the detailed use of cavity enhanced detection for immunoassay
measurements in microplate readers. A vertical R ≥ 0.99 optical cavity using a broadband LED light
source and a CCD spectrograph was integrated with a custom built microplate reader to perform
colorimetric bio-analytical measurements. The major advantage over conventional microplate readers is
provided by the increased sensitivity of the setup which has the benefit of lower detection limits in
conjunction with reducing the consumable cost of currently expensive bioassays. Experiments
performed on a commercially available osteocalcin ELISA showed a 39 fold improvement in sensitivity
when compared to measurements in a standard microplate reader, whilst measurements on the STREP-
HRP reaction showed up to a 115 fold increase in sensitivity. This makes colorimetric detection
approach the sensitivity of fluorometric detection in microplate readers. In comparison with previous
liquid-phase CEAS and CRDS studies in 1 cm cuvettes, the lowest αmin values from our studies were
found to offer similar sensitivities, using microtiter plates with generally higher optical losses. Further

12
improvements can be made in light coupling as well as developing a more compact and robust
integrated cavity enhanced detection system.
Acknowledgements
We acknowledge the support of the European Commission through the projects MAPTech (20316),
InFuLoC (230749) and CE-microArray (606618). We also thank Anasyst Ltd for assistance in
development of the CEAS microtiter plate system.
REFERENCES
1 Taipa, M. Â. Comb.Chem.High Throughput Screen. 2008, 11, 325-335.
2 Armstrong, S.; Miao, Z. -.; Rowell, F. J.; Ali, Z. Anal.Chim.Acta. 2001, 444, 79-86.
3 Rincón, V.; Corredor, A.; Martínez-Gutíerrez, M.; Castellanos, J. E. J.Virol.Methods. 2005, 127,
33-39.
4 O'Keefe, A.; Deacon, D. A. G. Rev.Sci.Instrum. 1988, 59, 2544-2551.
5 Engeln, R.; Berden, G.; Peeters, R.; Meijer, G. Rev.Sci.Instrum. 1998, 69, 3763-3769.
6 Fiedler, S. E.; Hese, A.; Ruth, A. A. Chemical Physics Letters. 2003, 371, 284-294.
7 Ball, S. M.; Langridge, J. M.; Jones, R. L. Chemical Physics Letters. 2004, 398, 68-74.
8 Van Der Sneppen, L.; Hancock, G.; Kaminski, C.; Laurila, T.; MacKenzie, S. R.; Neil, S. R. T.;
Peverall, R.; Ritchie, G. A. D.; Schnippering, M.; Unwin, P. R. Analyst. 2010, 135, 133-139.
9 Rushworth, C.; Vallance, C. Proceedings of SPIE - The International Society for Optical
Engineering. 2010, 7838
10 Kiwanuka, S. -.; Laurila, T.; Kaminski, C. F. Anal.Chem. 2010, 82, 7498-7501.
11 Neil, S. R. T.; Rushworth, C. M.; Vallance, C.; MacKenzie, S. R. Lab on a Chip - Miniaturisation
for Chemistry and Biology. 2011, 11, 3953-3955.

13
12 James, D.; Oag, B.; Rushworth, C. M.; Lee, J. W. L.; Davies, J.; Cabral, J. T.; Vallance, C. Rsc
Advances. 2012, 2, 5376-5384.
13 Kiwanuka, S. -.; Laurila, T. K.; Frank, J. H.; Esposito, A.; Blomberg Von Der Geest, K.;
Pancheri, L.; Stoppa, D.; Kaminski, C. F. Anal.Chem. 2012, 84, 5489-5493.
14 Rushworth, C. M.; Jones, G.; Fischlechner, M.; Walton, E.; Morgan, H. Lab Chip Miniaturisation
Chem.Biol. 2015, 15, 711-717.
15 Islam, M.; Seetohul, L. N.; Ali, Z. Appl.Spectrosc. 2007, 61, 649-658.
16 Seetohul, L. N.; Ali, Z.; Islam, M. Analyst. 2009, 134, 1887-1895.
17 Seetohul, L. N.; Ali, Z.; Islam, M. Anal.Chem. 2009, 81, 4106-4112.
18 Ali, Z.; Seetohul, L. N.; Auger, V.; Islam, M.; Scott, S. M. Microfluidic device with CEAS
detection. 2008, US 8,325,342 B2
19 Mazurenka, M.; Orr-Ewing, A. J.; Peverall, R.; Ritchie, G. A. D. Annual Reports on the Progress
of Chemistry - Section C. 2005, 101, 100-142.
20 Qu, Z.; Engstrom, J.; Wong, D.; Islam, M.; Kaminski, C. F. Analyst. 2013, 138, 6372-6379.
21 Fiedler, S. E.; Hese, A.; Ruth, A. A. Rev.Sci.Instrum. 2005, 76, 023107-1-023107-7.
22 Xu, S.; Sha, G.; Xie, J. Rev.Sci.Instrum. 2002, 73, 255.
23 van der Sneppen, L.; Ariese, F.; Gooijer, C.; Ubachs, W. Journal of Chromatography A. 2007,
1148, 184-188.

14
Table of contents graphic