contentssciencesearch.defra.gov.uk/document.aspx?document=nt2602... · web viewevaluation of...
TRANSCRIPT

‘Evaluation of urea-based nitrogen fertilisers’ Report for Defra projects NT2601/02
Report for Defra Projects NT2601 and NT2602
Evaluation of urea-based nitrogen fertilisers
Edited by
Anne Bhogal, ADAS Gleadthorpe
Peter Dampney, ADAS Boxworth
Keith Goulding, Rothamsted Research
October 2003
document.doc 1

‘Evaluation of urea-based nitrogen fertilisers’ Report for Defra projects NT2601/02
Contents
ABBREVIATIONS
GLOSSARY OF TERMS
1. EXECUTIVE SUMMARY............................................................................................................................................6
2. INTRODUCTION........................................................................................................................................................12
3. CHARACTERISTICS OF UREA..............................................................................................................................14
3.1 WORLD CONSUMPTION AND PRODUCTION.................................................................................................................143.2 CHEMICAL AND PHYSICAL PROPERTIES......................................................................................................................143.3 CURRENT USE ON UK FARMS.....................................................................................................................................143.4 CONCLUSIONS............................................................................................................................................................15
4. BEHAVIOUR AND FATE OF UREA-N APPLIED TO SOIL...............................................................................16
4.1 FATE OF UREA APPLIED TO SOIL.................................................................................................................................164.2 CONCLUSIONS............................................................................................................................................................19
5. AGRONOMIC EFFECTIVENESS............................................................................................................................21
5.1 ARABLE CROPPING.....................................................................................................................................................215.2 GRASSLAND................................................................................................................................................................305.3 HORTICULTURAL CROPS.............................................................................................................................................335.4 CONCLUSIONS............................................................................................................................................................43
6. ENVIRONMENTAL IMPACTS................................................................................................................................46
6.1 AMMONIA EMISSIONS.................................................................................................................................................466.2 NITROUS OXIDE EMISSIONS........................................................................................................................................516.3 NITRIC OXIDE EMISSIONS...........................................................................................................................................566.4 LEACHING AND SURFACE RUNOFF..............................................................................................................................566.5 CONCLUSIONS............................................................................................................................................................58
7. METHODS TO MITIGATE AMMONIA EMISSIONS..........................................................................................61
7.1 SLOW RELEASE FORMULATIONS OF UREA..................................................................................................................617.2 CHEMICAL ADDITIVES................................................................................................................................................617.3 INORGANIC SALTS......................................................................................................................................................627.4 PELLET SIZE AND SOIL INCORPORATION....................................................................................................................627.5 UREASE INHIBITORS...................................................................................................................................................637.6 CONCLUSIONS............................................................................................................................................................78
8. EFFECTS ON SOIL PROCESSES............................................................................................................................81
8.1 FACTORS AFFECTING SOIL PROCESSES.......................................................................................................................818.2 IMPACTS OF UREA ON BIOLOGICAL PROCESSES..........................................................................................................828.3 IMPACTS OF UREA ON CHEMICAL PROCESSES.............................................................................................................838.4 CONCLUSIONS..............................................................................................................................................................84
9. MODELLING AMMONIA EMISSIONS.................................................................................................................85
9.1 MODELLING PROCESS STAGES....................................................................................................................................869.2 SCENARIO TESTING.....................................................................................................................................................909.3 CHOICE OF MODELS FOR FUTURE USE........................................................................................................................969.4 EUROPEAN APPROACHES TO MODELLING AMMONIA EMISSIONS................................................................................979.5 CONCLUSIONS............................................................................................................................................................99
10. IMPLICATIONS FOR NEW RESEARCH AND OTHER STUDIES.............................................................101
document.doc 2
‘Evaluation of urea-based nitrogen fertilisers’ Report for Defra projects NT2601/02
11. REFERENCES......................................................................................................................................................103
AbbreviationsAC Ammonium carbonateACl Ammonium chlorideAN Ammonium nitrateAPP Ammonium polyphosphateATS Ammonium thiosulphateAS Ammonium sulphateASN Ammonium sulphate nitrateAnA Anhydrous ammoniaAqA Aqueous ammoniaBSFP British Survey of Fertiliser PracticeCAN Calcium ammonium nitrateCC Calcium cyanamideCEC Cation Exchange CapacityCN Calcium nitrateChilean CN Chilean potassic nitrateCORINAIR Core Inventory of Air Emissions in EuropeCV Coefficient of VariationCDU CrotonylidenediureaDAP Di-ammonium phosphateEF Emission factorEMEP Cooperative programme for monitoring and evaluation of the long-range FMA Fertiliser Manufacturers AssociationFSU Former Soviet UnionHSE Health and Safety ExecutiveIBC Intermediate Bulk ContainerIBDU Isobutylidene ureaMgAP Magnesium ammonium phosphateMgN Magnesium nitrate MU Methylene ureaMAP Mono-ammonium phosphateMOP Muriate of potashN NitrogenNARSES National Ammonia Reduction Strategy Evaluation SystemOSN Other straight nitrogenOx OxamideKN Potassium nitratePSDA Product Safety data SheetSMB Soil microbial biomassSSP Single superphosphateNaN Sodium nitrate (nitrate of soda)SCU Sulphur coated ureaTAN Total Ammonical NitrogenTSP Triple superphosphateU UreaUAN Urea ammonium nitrateUAS Urea ammonium sulphateUCN Urea calcium nitrateUKAEI United Kingdom Ammonia Emissions Inventory UNECE United Nations Economic Commission for EuropeUP Urea phosphate
document.doc 3
‘Evaluation of urea-based nitrogen fertilisers’ Report for Defra projects NT2601/02
Glossary of terms
Blended fertiliser Compound fertiliser produced by dry mixing of two or more different particulate or powder materials.
Bulk density Density of a mass of material, often expressed as kg/litre. The mass comprises the particles and the air spaces between them so bulk density is determined by the shape and size of particles as well as by the true density of the material from which the particles are formed. Particulate materials show differences in bulk density between loose and tamped or shaken states, in some materials as great as 15%. The bulk densities shown are intended to describe those of material in a spreader hopper. A value of 1.00 kg/l means that a 1000 litre hopper should hold 1tonne of material.
Caking Formation of large hard agglomerations of fertiliser particles due to chemical properties of the materials or to absorption of water. This phenomenon occurs when fertiliser granules adhere to one another through crystal bridges or plastic deformation.
Complex fertiliser Compound fertiliser where all particles have the same composition.
Compound fertiliser Product containing more than one of the major nutrients.
Deliquesce Absorption of atmospheric water vapour resulting in the loss of physical structure of particles.
Fluid fertiliser Products supplied in liquid form, either as solution or suspension.
Granulation Methods of forming fertiliser particles, mainly in the range 2 to 4mm diameter. There are two main classes of granulation: slurry and non-slurry processes. In slurry processes, solid particles of the fertiliser (obtained through recycling of undersize particles) are coated with a slurry of the fertiliser in successive layers. In non-slurry processes, a liquid component is added to finely divided particles causing them to agglomerate. Most granular products are slightly irregular in shape but some, those made by fluidised bed processes for example, are nearly spherical.
Granular fertiliser Solid fertiliser where particles are all produced by granulation. May be complex or blended though the term is sometimes erroneously used as an alternative to complex.
Hygroscopic Material absorbs moisture from the air.
IBC Intermediate bulk container or big bag, usually containing 500, 600 or 1000kg of fertiliser. IBC also can refer to 1m3 containers of solution fertiliser.
Median size The particle size at which 50% of the material by weight is smaller and 50% larger. The median size can vary in some materials and the values shown should be treated as guides. The particle size for most manufactured granular and prilled fertilisers is in the range 2 to 4mm range.
Particle crushing strength
Force that must be applied to cause a particle to shatter or break. Measured in newtons (N).
Particle or true density
Density of the solid material from which the particles are formed. Particle density therefore is independent of particle size and shape. The weight of a particle is
document.doc 4

‘Evaluation of urea-based nitrogen fertilisers’ Report for Defra projects NT2601/02
determined by it’s size and density and is an important factor in spreading properties.
Prilling Method of particle formation in which the molten fertiliser is forced through holes in a metal disc or spinning bucket and allowed to fall as droplets in a tower. The particles solidify as they fall. Prills tend to be more spherical and slightly smaller than granules
Solution fertiliser Products where the nutrients are present in true solution.
Straight fertiliser Product containing only one of the major nutrients (nitrogen, phosphate or potash)
Suspension fertiliser
Products where the nutrients are present partly in solution and partly as finely divided particles in suspension.
document.doc 5
‘Evaluation of urea-based nitrogen fertilisers’ Report for Defra projects NT2601/02
1. Executive summary
1. This report forms part of the NT2601 and NT2602 projects for Defra. It describes and discusses existing knowledge on the effects of using urea-based nitrogen (N) fertilisers on the performance of arable, grassland and horticultural crops, and likely impacts on the air, water and soil environments. The report discusses possible mitigation options to minimise or avoid adverse effects. The information sources comprised published international literature, as well as information provided by representatives of the UK and international fertiliser industries. Other reports from the NT2601 and 2602 projects cover ‘Nitrogen fertilising materials’ and ‘Production and use of nitrogen fertilisers’.
Characteristics of urea
2. Urea is the predominant source of fertiliser nitrogen used in agriculture throughout the world (50% of total N use). However, in the EU-15, the predominant source (40%) of N is ammonium nitrate (AN) or calcium ammonium nitrate (CAN), and AN is used predominantly on UK farms. There is no production capacity for urea in the UK. All current supplies are imported from within or outside Europe.
3. Urea can be manufactured as prills or granules. However, because urea is very hygroscopic (i.e. absorbs water), its use as a raw material in the production of compound fertilisers is much less flexible and more limited than for AN or CAN.
4. Urea is primarily used as a solid straight N fertiliser (46% N) or in the production of urea ammonium nitrate (UAN) solution (28-30% N w/w). Solid urea represents 9% and UAN 10% of the total UK consumption of N-containing fertilisers. Most (95%) is applied as a topdressing to winter cereals (63%), oilseed rape (16%) or grass (17%), largely in the February to April period; only 12% is applied in the warm and dry months of May to August. Very little urea (2% of total) is used on spring cereals and virtually none on potatoes, sugar beet or horticultural crops.
5. Urea has a lower bulk density than AN which makes accurate spreading by spining disc more difficult. A small particle size, as usually found with urea prills, aggravates this problem. Urea granules are larger (up to 3.5mm diameter), which should improve the spreading accuracy.
Behaviour and fate of urea applied to soil
6. Following application to soil, urea undergoes hydrolysis to ammonium (NH4) which is then subject to the same chemical and biological transformations as AN and other N fertilisers. The hydrolysis process is controlled by the urease enzyme (which is ubiquitous in soil, on vegetation and in surface litter), urea concentration, soil temperature and moisture. Grassland soils have more urease enzyme activity than arable soils. Rates of hydrolysis are generally rapid in most UK soils, but could be slower in arable soils low in organic matter, or in very dry, very wet or very cold weather.
7. Hydrolysis of urea results in a localised very high soil pH which can result in large emissions of ammonia to the atmosphere (see also paras 20-41). This is a well documented major loss process and is the main reason why urea has often been shown to be less effective for crop uptake compared to nitrate based fertilisers (see also paras 10-19). More research is needed to quantify ammonia emissions under different UK soil and agricultural conditions.
8. Unhydrolysed urea is soluble in soils and there is a risk that heavy rain immediately after urea application could wash urea and/or ammonium into surface or groundwaters, but there is little existing data. In soils above neutral pH, nitrite (NO2) could accumulate with risk of plant damage and leaching to waters. Both nitrate (NO3) and nitrite are at risk of loss as nitrous oxide (N2O) gaseous emissions. These transformations and processes make the efficiency of use of urea more difficult to predict and manage compared to AN.
document.doc 6

‘Evaluation of urea-based nitrogen fertilisers’ Report for Defra projects NT2601/02
9. There is no evidence that continued use of urea will have any long-term adverse effects on the national soil resource. Compared with the other major factors controlling biological and chemical processes in soils (e.g. pH, organic matter content), impacts arising from nitrogen fertilisers have always been observed to be small. No impact of urea (or the urease inhibitor Agrotain – see paras 29-33) on the soil microbial biomass (SMB) was observed in a 1-year trial. The spatial and temporal variations in microbial, chemical and biochemical properties were found to be much larger than any changes resulting from urea or Agrotain use.
Agronomic effectiveness of urea
Arable crops
10. There have been many studies comparing the agronomic efficiency of solid urea with other N fertilisers, largely from trials between 1960-1980 on winter cereals. The general conclusion was that urea gives more variable results and sometimes only 80-90% of the yield produced from other solid N fertilisers. Yield reductions have largely been attributed to a poorer efficiency of use of urea-N by the crop due to ammonia volatilisation losses post-application. A few studies comparing UAN solution with urea and AN have shown that UAN can give similar yields to urea (and sometimes less), and lower yields than AN.
11. Some trials have reported higher optimum rates of N (Nopt) from use of urea compared to AN, but lower yields at these N rates; however, in most cases the statistical significance of any differences was not reported. Where errors could be estimated there was no significant difference in the mean Nopt. Agronomic studies have shown no clear benefits from splitting urea applications. However, splitting of urea applications might be a strategy to consider to reduce ammonia emissions and increase the effectiveness of urea.
12. Statistically significant decreases in wheat grain N (protein) content have been reported from the use of urea compared to AN, typically ranging between 0.05-0.15% N in wheat (0.3-0.9% protein at 100% DM). Protein content is important for wheat grain marketing. Many reports have shown that foliar applications of straight urea solution are effective for increasing grain protein content, but these have a poor N use efficiency.
13. A few studies have reported that the effectiveness of urea appeared lower on calcareous soils, perhaps because of slower hydrolysis limiting the availability of N at a critical growth stage or due to higher ammonia losses. There appeared to be no effect of soil texture on the effectiveness of urea-N. Some trials have indicated a positive relationship between the effectiveness of urea and rainfall, but most reports gave little or no information on the prevailing weather, soil moisture or wind conditions.
14. A few studies have been done on the effectiveness of urea incorporated into crop seedbeds, but these did not record any adverse effects on germination or establishment of spring cereals where up to 90kg N/ha had been applied. However, higher rates of seedbed N for spring cereals (and oilseed rape) are currently used in the UK. Combine-drilled urea can result in reduced establishment and crop yields, but this practice is not recommended in the UK.
15. For sugar beet, no significant differences in sugar yield between urea and other nitrogen fertilisers were recorded. Reductions in plant population occurred at 3 trials, where 60 or 120kg N/ha as urea was applied in the seedbed, but this was unlikely at the normal seedbed recommendation of 40kg N/ha.
Grassland
16. Most grassland studies comparing urea with other N materials were carried out before 1985. The general conclusion was that urea was as effective as CAN or AN for spring grass production, but can result in 5 to 15% lower yields when used in the summer. Large yield reductions were observed on light textured soils and in dry weather periods. Rainfall in the 3 days after fertiliser application has been shown to increase the effectiveness of urea. Little research has been carried out under grazing conditions.
document.doc 7
‘Evaluation of urea-based nitrogen fertilisers’ Report for Defra projects NT2601/02
Potatoes and horticultural crops
17. Many potato experiments comparing urea with other N fertilisers have been carried out, but relatively few on other vegetable crops. Responses tended to vary with soil type and weather conditions but, with a few exceptions, equivalent yields were obtained where urea was used.
18. Some horticultural studies have reported that urea produced lower yields, e.g. on brassicas, lettuce, onion, beans, red beet, tomatoes. These reports far outnumbered those where urea produced larger yields, and suggest that there may be significant risks associated with the use of urea for horticultural crops. Reasons proposed to explain the lower yields were the same as for arable and grass, i.e. ammonia loss and phytotoxicity.
19. The likelihood of adverse reactions to urea is greatest for young plants shortly after N application. At this stage, plant tissues are more sensitive and urea concentrations in the soil are at their highest. Strategies to minimise damage to young plants should be based on avoiding high concentrations of urea in the seedbed – e.g. use of nitrate-based fertilisers, placement or splitting of urea, use of controlled-release fertilisers.
Environmental impacts
Ammonia emissions
20. Atmospheric pollution with ammonia has impacts on the acidification of land and eutrophication of water. The UK has a commitment under the EU National Emission Ceilings Directive and the UNECE Gothenburg Protocol to reduce ammonia (NH3) emissions to 297kt NH3/yr by 2010, compared with emissions of about 348kt NH3/yr in 1999. Because of the much higher risk of ammonia emissions following use of urea compared to nitrate-based fertilisers, a significant change in national fertiliser practice away from AN towards urea would have a serious impact on the UK’s obligations to meet this target.
21. The risk of ammonia emission following use of urea is much greater than following use of nitrate-based fertilisers, but the level of risk varies. The greatest risks are on coarse-textured/low organic matter soils, where crop cover is low, and where conditions are dry, warm and windy following application.
22. Studies measuring ammonia emissions following urea use, and its effect on N use efficiency and crop performance, have given highly variable results. Field measurements of emission factors have ranged from 4 to 47% (arable crops) and 6 to 46% (grassland) of the urea N applied. These can be compared with emissions of less than 4% of N applied as AN or CAN. Within the arable experiments, the greatest emissions have been measured from no-till systems (10 to 47%). Emission factors for urea used on cultivated cereals ranged from 4 to 19%, although there were few studies on tilled land.
23. Ammonia emission inventories have used a range of factors to calculate emissions from urea applications. Early UK experiments suggested an average emission factor of 10% for urea. More recently, a factor of 23% has been used in the UK for urea applied to grassland. In the absence of any direct field measurements, emissions from arable land were considered to be half those from grassland (i.e. 11.5%).
24. Information on ammonia emissions from N fertilisers other than urea is sparse, so ammonia emission inventories have tended to group all N fertilisers together except for urea. Emissions from AN and CAN tend to be small and current inventories use an emission factor of 1.6% and 0.8% of the N applied to grass and arable crops, respectively. Ammonium sulphate (AS) is also often grouped with AN and CAN, but separate factors have been proposed depending on the soil pH (2% on soils with pH<7, 18% if pH>7).
25. The UK Ammonia Emission Inventory (UKAEI) emission factors proposed for grassland and arable land are:-
urea 23 % (grass) 11.5% (arable)all other N forms 1.6% (grass) 0.8% (arable)
Ammonia emissions - mitigation options
document.doc 8
‘Evaluation of urea-based nitrogen fertilisers’ Report for Defra projects NT2601/02
26. Ammonia emissions from urea could potentially be reduced by slow release formulations, chemical additives, larger particle size, soil incorporation or use of urease inhibitors. The use of a urease inhibitor offers the best prospect; the other options have constraints of very high cost (e.g. slow release fertilisers), limited effect (e.g. large particle size), or lack of practical opportunities (e.g. soil incorporation).
27. Incorporation of urea below the soil surface will minimise ammonia volatilisation but this would be impractical in most agricultural systems as 95% of fertiliser N is topdressed to growing crops. Soil incorporation may be possible for fluid fertiliser applications if some means of injection into the soil was adopted, but capital and time-related costs would be major limiting factors. Band-spread urea has some potential as less urea is in contact with the soil compared with broadcast urea. But the high concentrations of urea might increase ammonia emissions and root growth in the band might be restricted.
28. Inhibiting urease activity slows the conversion of urea to ammonium-N and hence the potential for ammonia volatilisation and seedling damage. Slowing the hydrolysis allows more time for the urea to diffuse into the soil, or for rain or irrigation to occur. Thousands of chemicals have been tested for their potential as inhibitors of soil urease activity, but few have proved both effective and commercially attractive.
29. The only current practicable option is N–(n-butyl) thiophosphoric triamide (nBTPT) which is commercially available (trade name Agrotain). Numerous field studies with nBTPT-coated urea have been conducted in the USA with arable crops and grass, where its use has increased yield and N uptake compared with untreated urea.
30. Apart from work in Northern Ireland and Defra funded studies in 2003, there is no British data on the use of nBTPT treated urea. A few studies in Europe have shown that nBTPT-coated urea can reduce ammonia losses from surface applications of urea. Increasing the concentration of nBTPT has been shown to reduce ammonia losses according to the law of diminishing returns; the inhibitor was very effective at low concentrations, resulting in approximately 50% inhibition at a concentration of 0.01%. There was little benefit in using concentrations above 0.1%. Use of nBTPT has been shown to reduce seedling damage from seed-placed urea and to improve the emergence of cereal seedlings with urea under simulated combine drilling conditions in a greenhouse.
31. In Northern Ireland studies on grassland, there was no evidence of any long-term adverse effects on grass production with repeated applications of nBTPT-coated urea over a 3-year period, and no indication that its efficacy to reduce ammonia emissions declined when used repeatedly. nBTPT has been shown to have no effect on N mineralisation or on the size and activity of the soil microbial biomass; it does not inhibit nitrification or denitrification.
32. Agrotain has successfully passed US-EPA toxicological and environmental tests and degrades into fertiliser elements N, P and S after approximately 10-14 days. Some information indicates that the shelf life of Agrotain treated solid urea is dependent on the nBTPT concentration and the way that it is applied, but other information indicates that nBTPT in treated urea does degrade within months. A new stabilisation technique has suggested that Agrotain added to the urea melt (thus incorporated within the urea granule) is stable for several years. nBTPT can be added to UAN solutions, but advice is that these should be applied soon after mixing, as nBTPT gradually decomposes in the presence of water.
33. Agrotain treated urea offers the best current prospect for a modified urea fertiliser that might provide an effective alternative to AN for crop production with minimal impact on the environment. However, more UK-based research is needed.
Ammonia emissions - modelling
34. Ammonia emission models are required to predict future emissions in the event of increased urea usage and to assess the potential impact of different mitigation methods. Unfortunately, specific urea-based models are relatively few. If mechanistic modelling was required, then the model of Rachhpal-Singh and Nye would be the best one to develop. In the short term, the UK NARSES (National Ammonia Reduction Strategy Evaluation System) model provides the best platform to build on for predicting ammonia
document.doc 9
‘Evaluation of urea-based nitrogen fertilisers’ Report for Defra projects NT2601/02
emissions, following different scenarios of urea use and taking account of a range of factors to predict losses.
35. Generally the approach in mainland Europe is the same as in the UK, utilising inventories and some modelling. The MARACCAS model (Model for the Assessment of Regional Ammonia Cost Curves for Abatement Strategies) has been used to compare emissions from agricultural activities in different European countries and to assess the applicability and efficacy of potential ammonia abatement measures. In 1998, the UNECE Ammonia Expert Group adopted the emission factors used in MARACCAS to revise the guidelines for calculating ammonia emissions. The MARACCAS model is being updated and adopted for use with disaggregated ‘activity’ data in the NARSES model.
36. The impact of a complete switch from use of AN to use of urea on ammonia emissions, and the impact of possible mitigation options, was tested using current emission inventory data. Three approaches were compared - the UK Ammonia Emissions Inventory (UKAEI), the ‘prototype’ NARSES model and the EMEP/CORINAIR Emission Inventory Guidebook. All gave similar results.
37. Total ammonia emissions from current manufactured fertiliser N forms applied to UK agricultural land in 2001 were estimated as 34.7, 37.9 and 49.8kt using the UKAIE, NARSES and EMEP/CORINAIR emission factors, respectively. The models predicted that, if all this fertiliser N was applied as urea, the total emissions from manufactured N fertilisers would increase by around 220kt NH3 to 260kt NH3. This would represent an increase of 75–85% in the total of all ammonia emissions from UK agriculture, including those from livestock manures. For total emissions from fertiliser N to remain the same as 2001, the emission factor for urea would have to be reduced to 2.25% of applied N if urea was used to replace all other N fertilisers, or to 3.1% if urea was used to replace AN fertiliser only.
38. Three potential abatement scenarios were tested: (1) the use of urease inhibitor nBTPT (Agrotain), (2) the application of urea in liquid form and, (3) an increased proportion of urea applied to arable land and incorporated into the soil. The results suggest that, if all urea was treated with the urease inhibitor nBTPT, and assuming an 80-90% reduction in ammonia emissions compared to untreated urea, then the impact on total ammonia emissions from UK agriculture would only be a 5% increase. Liquid application was estimated to half emissions; soil incorporation was assessed to have little effect because of the potential difficulty of incorporation for most tillage crops.
Nitrous oxide emissions
39. Agricultural soils are a major source of nitrous oxide (N2O) emissions, contributing c.50% of total UK emissions of N2O. Modelling has predicted that c.77% of the nitrous oxide from soils is derived from N fertiliser.
40. There have been many studies on the effect of N fertilisers on nitrous oxide emissions, but only a few have studied the form of N used. Current IPCC guidelines for greenhouse gas inventories suggest the use of a single nitrous oxide emission factor of 1.25% ( 1%) for fertiliser applications, with no allowance made for different fertiliser types.
41. Assuming denitrification is the dominant source process for nitrous oxide, emissions will be greater from nitrate-based fertilisers than ammonium-based fertilisers (e.g. urea); the difference will increase as soil moisture content increases. Use of urea in wet springs (when there is a high potential for denitrification) is therefore likely to result in a significant reduction in total annual emissions compared to use of AN. Results from Scotland and reviews of European research support this, but differences are generally small in numerical terms. In Scotland, differences between fertiliser forms have also been more apparent on grassland than tilled land, but the magnitude of these differences was very dependent on the season.
Nitric oxide emissions
42. There is very little published information on nitric oxide (NO) emissions from different forms of N fertiliser. Most nitric oxide emissions are associated with nitrification, so urea would be expected to result
document.doc 10
‘Evaluation of urea-based nitrogen fertilisers’ Report for Defra projects NT2601/02
in larger emissions that AN. Measured losses of nitric oxide have ranged from 0.003 to 11% of applied fertiliser N, with a mean of 0.3%. The CORINAIR Emissions Inventory Guidebook uses an emission factor of 1%, with no division for fertiliser form or cropping system.
Leaching and surface runoff
43. The risk of direct leaching of any N fertiliser following application is generally regarded as small, unless rainfall follows applications to heavy soils and results in drainflow or surface runoff, or N is applied to young crops with limited rooting systems (e.g. potatoes and spring cereals) in wet springs. There is little evidence of direct leaching of residual, unused fertiliser N at the end of the growing season if the correct amount of N is applied. However, numerous studies have shown an increase in soil mineral N and associated leaching losses from applications in excess of the economic optimum, which could occur if farmers overfertilise with urea N to provide ‘insurance’ against potential NH3-N losses.
44. Urea is non-ionic and therefore susceptible to leaching and runoff. Although there has been very little research on N leaching or runoff from urea or its decomposition products, the potential for leaching has been demonstrated in leaching columns under laboratory conditions; urea was considered to be more susceptible to leaching than ammonium-N, but less than nitrate-N. In one field study, 24% of the applied unhydrolysed urea was lost in runoff following 10mm of rainfall shortly after application to an impermeable grassland soil. Use of urea treated with a urease inhibitor (see paras 28-33) may exacerbate the problem, as this urea will remain unhydrolysed for longer.
45. Whether leached urea would persist until it reaches a watercourse is uncertain. However, the hydrolysis of urea within watercourses is likely to impact on concentrations of ammonium-N, nitrite-N and nitrate-N. This could increase ammonium-N concentrations above the European guidelines for Salmonid and Cyprinid waters. The EU Freshwater Fish Directive (FFD) has set mandatory threshold concentrations for total ammonium-N of 0.78mg/l, and guide levels of 0.03mg/l for Salmonid and 0.16mg/l for Cyprinid fish. Guide levels of nitrite-N have been set; 0.003mg/l for Salmonid and 0.009mg/l for Cyprinid fish.
document.doc 11

‘Evaluation of urea-based nitrogen fertilisers’ Report for Defra projects NT2601/02
2. Introduction
This report summarises existing international knowledge on the use of urea-based fertilisers as a source of nitrogen for use in agriculture. It is part of the suite of reports produced as part of the Defra projects NT2601 and NT2602. Each section or sub-section has been written by a lead author as indicated, with overall editing by Anne Bhogal and Peter Dampney (ADAS), and Keith Goulding (Rothamsted Research).
Section 3 summarises the supply, characteristics and current use of urea. Much of this information has been presented and discussed in detail in the NT2601/2602 reports ‘Nitrogen fertilising materials’ and ‘Production and use of nitrogen fertilisers’. These reports provide detailed information on other N fertiliser materials as well as urea.
Section 4 describes the behaviour of urea-N in soil and the wider environment.
Section 5 reviews existing knowledge on the agronomic effectiveness of urea-based fertilisers compared to other N fertiliser materials in arable, grassland and horticultural cropping systems.
Section 6 reviews existing knowledge on the effects of using urea on the air, water and soil environments. The potential for urea to emit ammonia to the atmosphere is a major concern.
Section 7 considers methods that are or might be used for mitigating the adverse effects of urea on agronomic production and the environment.
Section 8 discusses the potential effects on the biological and chemical sustainability of the soil resource.
Section 9 discusses the potential use of models, including estimates of the effect of using urea on UK ammonia emissions.
Section 10 highlights the implications of the review for new research and other studies.
document.doc 12
‘Evaluation of urea-based nitrogen fertilisers’ Report for Defra projects NT2601/02
Acknowledgements
The conclusions and recommendations contained in this report have been considered by the contractor organisations collaborating in the Defra NT2601 and NT2602 research projects (as shown below), and represent a concensus agreement of these organisations. The willing help provided the FMA, and representatives of Hydro Agri (UK) Ltd., Kemira Growhow (UK) Ltd. and Terra Nitrogen (UK) Ltd., is gratefully acknowledged.
Contractor organisations:-
ADAS Edinburgh University (School of Geosciences) Horticulture Research International (HRI) Institute of Grassland and Environmental Research (IGER) Queen’s University, Belfast (Dept. of Agricultural and Environmental Sciences - QuB) Rothamsted Research SAC Silsoe Research Institute (SRI)
document.doc 13
‘Evaluation of urea-based nitrogen fertilisers’ Report for Defra projects NT2601/02
3. Characteristics of urea
(Lead author: Peter Dampney, ADAS)
This section summarises the supply, characteristics and current use of urea-based fertilisers. More details are given in the NT2601 reports ‘Nitrogen fertilising materials’ and ‘Production and use of nitrogen fertilisers’.
3.1 World consumption and productionUrea is the predominant source of fertiliser nitrogen used in agriculture throughout the world (50% of total N use). In the last 30 years, there has been an approximate 2-fold increase in the global productive capacity of urea compared to little change for other N-containing fertilisers. There is no production capacity for urea in the UK and all current supplies are imported from within or outside Europe.
In the EU-15, the predominant source of N is ammonium nitrate (AN) or calcium ammonium nitrate (CAN); together they represent over 40% of the consumption of N-containing fertilisers. Solid urea represents only 13%, and UAN 11%, of the total consumption of N-containing fertilisers in EU-15; France, Germany, Italy, Spain and the UK are significant users of urea-based fertilisers.
3.2 Chemical and physical propertiesUrea (CO (NH2)2) contains 46% N and is produced by reacting ammonia with carbon dioxide. The molten urea is solidified by granulation or prilling, and the final product may be coated with an anti-caking agent. Urea is primarily used as a solid straight N fertiliser (46% N) or in the production of urea ammonium nitrate (UAN) solution fertiliser (28-30% N w/w). Because urea is very hygroscopic (absorbs water), its use as a raw material in the production of compound fertilisers is more restricted than for AN or CAN.
Urea can be manufactured as prills or granules. Around 30% of world urea production is as granules. Urea has a lower bulk density than AN (prills 0.73kg/l; granules 0.77kg/l; AN 1.00kg/l) ) which makes accurate spreading by spining disc more difficult. A small particle size, as usually found with urea prills (e.g. 2mm diameter), will aggravate this problem so that urea prills cannot usually be spread satisfactorily by spinning disc spreaders used in 24m wide tramline systems. Urea granules have a larger particle size, some with 3.5mm diameter, which should improve the spreading accuracy.
3.3 Current use on UK farmsAN is the main source of N-containing fertilisers used on UK farms, either as straight AN or AN used in the production of compound fertilisers. Overall, the use of solid urea represents 9% (c.100,000t N) of the total use of fertiliser N (1.1 million tonnes). Most (95%) of the solid urea used is applied as topdressings to winter cereals (63%), oilseed rape (16%) or grass (17%). Very little urea (2% of total) is used on spring cereals and virtually none on potatoes, sugar beet or horticultural crops - this may reflect concerns about possible crop phytotoxicities from use of urea to these crops. Nitrogen applied as UAN solution (50% AN:50% urea) represents a further c.10% of the total N use. A high proportion of the potato area (30%) receives N in fluid form as straight UAN or compound fluid N materials.
Nearly 80% of solid urea and UAN solution is applied in February, March and April when soil and weather conditions are more likely to be cool and moist. Only 12% of urea-N is applied in the warm and dry months of May, June, July and August suggesting that farmers may perceive a poor efficiency from urea applied at this time.
document.doc 14

‘Evaluation of urea-based nitrogen fertilisers’ Report for Defra projects NT2601/02
3.4 Conclusions1. Urea is the predominant source of fertiliser nitrogen used in agriculture throughout the world (50% of total
N use). However, in the EU-15, the predominant source (40%) of N is ammonium nitrate (AN) or calcium ammonium nitrate (CAN), with AN used predominantly on UK farms. Solid urea represents only 9% and urea ammonium nitrate (UAN) solution 10% of the total UK consumption of N in manufactured fertilisers. There is no production capacity for urea in the UK. All current supplies are imported from within or outside Europe. A switch from AN to urea would require a major restructuring of UK agriculture.
2. Urea is primarily used as a solid straight N fertiliser (46% N) or in the production of UAN solution (28-30% N w/w). Urea can be manufactured as prills or granules. However, because urea is very hygroscopic (absorbs water), its use as a raw material in the production of compound fertilisers is much less flexible and more limited than for AN or CAN.
3. Urea has a lower bulk density (0.7-0.8kg/l) than UK manufactured AN (0.99kg/l) which makes accurate spreading by spining disc more difficult. A small particle size, as usually found with urea prills, aggravates this problem. Urea granules have a larger particle size (up to 3.5mm diameter), which should improve the spreading accuracy.
5. Most (95%) of the solid urea used in the UK (100,000t) is applied as a topdressing to winter cereals (63%), oilseed rape (16%) or grass (17%), largely in the February to April period. Very little urea (2% of total) is used on spring cereals and virtually none on potatoes, sugar beet or horticultural crops. Only 12% of urea-N is applied in the warm and dry months of May to August when the risk of ammonia emissions will be highest.
document.doc 15
‘Evaluation of urea-based nitrogen fertilisers’ Report for Defra projects NT2601/02
4. Behaviour and fate of urea-N applied to soil
(Lead author: Keith Goulding, Rothamsted Research)
When urea is applied to soil, it enters the soil nitrogen cycle and, like other N fertilisers, becomes subject to various biological and physicochemical processes. The following biological processes affect urea (Myers, 1974; Kissel et al., 1985):
1. Urea hydrolysis. CO(NH2)2 → NH4+
2. Nitrification NH4+ → NO2
- → NO3-
3. Denitrification NO3- → NO2
- → NO → N2O → N2
4. Ammonification-immobilisation NO3- → NH4
+ → organic N
All biological processes are mediated by the micro-organisms in the soil. Thus the amount, diversity and activity of the soil microbial biomass (SMB) is of great importance in determining the reaction rates of these processes. There is as yet, however, no clear understanding of the link between microbial function and process in soils. Most UK soils, other than those contaminated by industrial works or mining, appear to sustain a SMB that can carry out all necessary functions and processes. Thus we would not expect any of the above processes to be inhibited by anything other than the normal controls such as temperature and moisture.
In addition to the biological processes, N fertilisers are affected by the following physicochemical processes (Myers, 1974; Kissel et al., 1985):
5. Diffusion6. Convection or mass flow7. Sorption-desorption
Diffusion and convection transport the urea or its by-products through the soil to the plant. Sorption-desorption are especially important for NH4
+, which can be fixed by soil clays particles thus preventing rapid nitrification and N loss to surface waters. Following hydrolysis, urea-N can be lost to the atmosphere through ammonia volatilisation, or urea and its by-products may be washed out of the soil, should there be sufficient rainfall to generate runoff or drainflow. The impacts of these processes on the efficiency of use of urea fertiliser, and their interaction with growing crop plants, are explained below.
4.1 Fate of urea applied to soilWhen urea is applied to soils the processes above begin to act. The first step is hydrolysis to NH4
+ (process 1 above) which is controlled by the activity of the urease enzyme and urea concentration (Figure 4.1), as well as temperature (Figure 4.2) and soil moisture content (Myers, 1974). Ureolytic micro-organisms that produce urease are ubiquitous in soil, on vegetation and in surface litter. Urease activity is related to soil organic matter content and pH, with an optimum rate at pH 7-8.5 (Kissel et al., 1985).
On soils with a pH of c.6.3 or greater, urea is hydrolysed mainly to ammonium bicarbonate:
CO(NH2)2 + H+ + 2 H2O 2NH4+
+ HCO3-
whereas on more acid soils, the hydrolysis occurs as follows:
CO(NH2)2 + 2H+ + 2 H2O 2NH4+
+ H2O + CO2
Thomlinson (1970) quotes work showing that, in a silt loam at 24% moisture content, rates of hydrolysis for 224 kg N/ha applied urea were c. 20 kg N/ha/day at 4OC rising to 105 kg N/ha/day at 20OC, and O’Toole &
document.doc 16

‘Evaluation of urea-based nitrogen fertilisers’ Report for Defra projects NT2601/02
Morgan (1988) calculated mean rates of 510, 340 and 160 kg urea-N/ha/day at 24, 16 and 8OC (N applied = 500 mg/kg) from a laboratory experiment. Thus urea hydrolysis is generally rapid and unlikely to be a major factor in the efficiency of use of urea in most UK arable soils in which the pH is maintained at near neutral values. It could be slowed in grassland for which the optimum recommended pH is 6.0 (MAFF, 2000) or greatly reduced in grassland that has been allowed to become acid. Skinner and Todd (1998) found from Representative Soil Sampling Scheme data that the only soils with declining pH were under permanent grassland. These had declined from an average pH of 5.7 in 1970 to 5.4 in 1992, sufficient to affect urea hydrolysis.
The rate of urea hydrolysis could also be slowed in arable soils depleted of organic matter, or slowed or stopped in very dry, very wet or very cold weather. It is unlikely to be too hot for urea hydrolysis. However, Powlson et al. (1988) found that denitrifiers were adapted to local environments, with maximum rates at c.10oC in the UK and c.20oC in sub-tropical areas of Australia; similar adaptation could occur to other soil micro-organisms controlling N cycling.
Figure 4.1. Rate of urea hydrolysis vs urea concentration.
Figure 4.2. Rate of urea hydrolysis vs soil temperature (Note log scale for hydrolysis).
Since unhydrolysed urea is soluble in water, any urea that is not hydrolysed is at risk of leaching into surface or ground waters. There is little research information on direct leaching of urea but, since hydrolysis of urea is usually very fast, leaching directly into waters is generally considered unlikely except in high risk situations such as intense rainfall on very sandy or cracking clay soils immediately after urea application. Further research is needed on this issue (also see section 6.4).
document.doc 17

‘Evaluation of urea-based nitrogen fertilisers’ Report for Defra projects NT2601/02
The effect of pH on the ammonia/ammonium equilibrium is shown in Figure 4.3 (Thomlinson, 1970). The ammonium produced is in equilibrium with free ammonia in the soil solution, which is in turn in equilibrium with atmospheric ammonia. In solution, the proportion of ammoniacal-N present as ammonia increases with increasing pH; thus there is greater likelihood of ammonia emission at a higher pH. This has given rise to the idea that ammonia loss is more likely from high pH soils such as calcareous soils. However, this is not necessarily true because urea hydrolysis by itself will result in a temporary rise in pH up to about pH 9, which tends to override the bulk soil pH. The small volumes of high pH around individual urea particles has been termed ‘alkaline microsites’ (Tomlinson, 1970).
Figure 4.3. The percentage of total N present as ammonia (■) or ammonium ions (NH4+; ▲)
at various soil pH values.
Once urea has hydrolysed, its reaction products are subject to the many competing and interacting processes listed above. The first breakdown product, NH4
+, can be taken up by plants, fixed on clays, immobilised by the SMB, nitrified or volatilised as NH3 (Myers, 1974; Kissel et al., 1985). Ammonia emission is considered in detail in section 6.1. Although ammonia emissions from surface-applied urea can be considerable, much of this ammonia could be re-absorbed by any crop plants present (Hutchinson et al., 1972), or washed out of the air and returned in rainfall (Viets, 1971). Regarding re-absorption, Sommer et al. (1993) found that only a small amount (c. 2-3%) of volatilised ammonia was absorbed by cereal crop canopies. However Ping et al. (2000) found that, following a 100 kg N/ha topdressed application of urea to spring wheat, 13% was volatilised over 7 days and, of this, up to 15% was absorbed by the crop canopy. It might be expected that the amount of N absorbed by crop foliage will vary depending on various factors such as canopy cover and, probably more important, air flow. Absorption would be more likely in still rather than windy conditions. Regarding return in rainfall, Yaalon (1964) calculated that an equivalent amount of ammonia to that volatilised from soils in Israel each year was returned in rainfall.
Nitrification (process 2, above) is sensitive to soil pH, temperature and moisture. Nitrification can occur between soil pH 5-10, but the optimum pH is in the range 6.0-8.0 (Paul & Clark, 1989); little nitrification occurs below pH 5 or above pH 8, with the exact value depending on soil texture and the character of the SMB (Boswell et al., 1985). Since nitrification produces protons and thus local acidification, the rate of nitrification can decrease with time, especially in poorly buffered, unlimed sandy soils.
Rates of nitrification and ammonification-immobilisation increase with soil moisture up to a maximum water potential of about –0.1 bar. At water contents above this, oxygen limitation begins to become important and the rates of these aerobic processes decline rapidly, e.g. by 50% at 2% oxygen content (Boswell et al., 1985), while that of denitrification increases.
document.doc 18
‘Evaluation of urea-based nitrogen fertilisers’ Report for Defra projects NT2601/02
The first product of nitrification of NH4+ is nitrite (NO2
-). This is generally short-lived and rapidly oxidised to nitrate (NO3
-). However, ammonium oxidisers Nitrosomonas have an optimum pH of 7-9 but nitrite oxidisers Nitrobacter have an optimum pH of 6.5-7.5. Thus, above pH 7 the conversion of NO2
- to NO3- is inhibited and
NO2- can accumulate. Thus the local increase in pH around hydrolysing urea can result in the presence of
significant concentrations of NO2- that can be toxic. The NO2
- could also be leached, causing pollution of waters, denitrified as described in process 3, or nitrified as in process 2.
Both nitrite and nitrate are at risk of denitrification (process 3, above). This is the anaerobic, strictly anoxic, reduction of oxidised forms on N through to the gases nitrous oxide (N2O) and nitrogen (N2). The process causes an economic loss to the farmer by reducing the efficiency of N use by the crop and, if denitrification stops at N2O, causes environmental pollution because N2O is a potent greenhouse gas. Denitrification and N2O production are discussed in detail in section 6.2.
Both NH4+ and NO3
- can be immobilised, i.e. taken up into the bodies of the SMB (process 4, above). Recent research has shown this to be a very rapid process (Murphy et al., 2003); the SMB competes very effectively with plant roots for inorganic N in the soil solution. The NH4
+ form is preferred to the NO3- form by the SMB,
which could be a cause of the reduced effectiveness of urea compared to nitrate forms of N (see section 5)However, immobilised N is not lost but is likely to be made available again when the SMB dies and is mineralised and nitrified, i.e. converted to NH4
+ and NO3-. Subsequent release is probably slow, so immoblised
N from urea may be effectively lost to the current year’s crop. The understanding, modelling and control of this mineralisation-immobilisation turnover (MIT) have been at the centre of much of Defra's research in the last 10 years.
4.2 Conclusions1. When urea is applied to soil, it enters the soil nitrogen cycle and becomes subject to hydrolysis,
nitrification, denitrification and ammonification-immobilisation processes. Following hydrolysis, urea-N can be lost to the atmosphere through ammonia volatilisation or urea or its decomposition products may be washed out of the soil should there be sufficient rainfall to generate runoff or drainflow. Diffusion and convection transport urea or its by-products through the soil to the plant. Sorption-desorption processes are especially important for ammonium N (NH4
+-N), which can be fixed by soil clay particles and can potentially reduce ammonia volatilisation losses, delay nitrification and subsequent N loss to water systems.
2. Hydrolysis of urea to NH4+-N is controlled by the activity of urease enzymes, urea concentrations, soil
temperature and soil moisture contents. Ureolytic micro-organisms that produce urease are ubiquitous in soil, on vegetation and in surface litter. Rates of hydrolysis are generally rapid in most UK soils and are unlikely to affect the efficiency of urea use by crops. However, hydrolysis could be reduced in arable soils depleted of organic matter, or in very dry, very wet or very cold weather. Hydrolysis could also be slowed in grassland soils that have been allowed to become acid (optimum range for hydrolysis: pH 7-8.5).
3. Urea is soluble in water and therefore at risk of leaching into surface or ground waters. There is little information on direct leaching of urea, but hydrolysis is usually considered to be so fast as to make leaching unlikely, except in high risk situations such as intense rainfall on ‘wet’ soils soon after application, that results in surface runoff or drainflow.
4. The NH4+ produced when urea hydrolyses is in equilibrium with free ammonia (NH3) in the soil solution,
which is in turn in equilibrium with atmospheric NH3. The proportion of NH4+ present as NH3 increases
with increasing pH, thus the risk of a NH3 loss increases with pH. Urea hydrolysis causes a temporary rise in pH (up to pH 9) in the environment surrounding the applied urea-N which exacerbates the problem. Ammonia volatilisation is the major N loss process responsible for the lower agronomic efficiency of urea compared to AN.
5. The first product of nitrification of NH4+ is nitrite (NO2
-). This is generally short-lived and rapidly oxidised to nitrate (NO3
-). However, above pH 7 the conversion of NO2- to NO3
- is inhibited and NO2- can
accumulate. Thus the local increase in pH around hydrolysing urea can result in the presence of significant
document.doc 19

‘Evaluation of urea-based nitrogen fertilisers’ Report for Defra projects NT2601/02
concentrations of NO2- that can be toxic. The NO2
- could also be leached (causing pollution of waters) denitrified or nitrified. Both NO2
- and NO3- are at risk of denitrification.
6. Both NH4+ and NO3
- can be immobilised. The NH4+ form is preferred to the NO3
- form by the soil microbial biomass (SMB), which could be a cause of the reduced effectiveness of urea compared to nitrate based fertilisers. Subsequent release is probably slow, so immobilised N from urea may be effectively lost to the current year’s crop.
document.doc 20
‘Evaluation of urea-based nitrogen fertilisers’ Report for Defra projects NT2601/02
5. Agronomic effectiveness
This section reviews information on the agronomic effectiveness of solid urea and UAN solution fertilisers, without the use of urease inhibitors, compared with ammonium nitrate (AN), calcium ammonium nitrate (CAN), calcium nitrate (CN) and ammonium sulphate (AS). Effects on the main arable, grassland and horticultural crops grown in the UK are considered. Information has been sourced from both published literature and unpublished information.
The use of urease inhibitors is reviewed in section 7.2.
5.1 Arable cropping(Lead author:- Tony Lloyd, ADAS)
5.1.1 Seedbed N and combine drilling Nitrogen fertiliser is recommended for seedbed application for certain spring sown or planted crops. Currently, very little urea is used for seedbed applications (less than 2% of total urea-N use, see NT2601 report ‘Production and use of nitrogen fertilisers’), but it is important to know if seedbed applications of urea might adversely affect crop germination and early growth. The maximum recommended amounts of N for seedbed application are given in Defra (2000) as shown below:
For later drilled spring wheat crops, up to 180 kg N/ha or for light sandy soils up to 70 kg N/ha. For spring rape, up to 120 kg N/ha or for light sandy soils 80 kg/ha. For potatoes up to 270 kg N/ha or, for light sands and shallow soils, only two thirds of this amount. DAP
is commonly used as a seedbed dressing for potatoes. For sugar beet, a maximum of 40 kg N/ha.
The risk of adverse effects is greatest when the fertiliser is combine drilled with the seed. This is largely thought to be due to ammonia toxicity in the vicinity of the germinating seed. Buiret toxicity used to be of concern for seedbed applications, but under the Fertiliser Regulations (1990) urea fertiliser must now contain no more than 1.2% buiret (formed as a by-product during urea manufacture) which, at this concentration, is considered to have no adverse effect on crop growth.
At 4 trials, Widdowson & Penny (1960) compared the effect of 30-95 kg N/ha of combine drilled urea and AS on the yield of spring barley. Urea supplying 60 kg N/ha checked early growth while at 95 kg N/ha growth was severely checked and some plants died. Widdowson et al. (1964) also compared 45 or 90 kgN/ha of urea and AS applied to spring barley either combine drilled in contact with the seed, or placed one inch to the side of the seed. Combine drilling urea (even at the lower N rate) killed some plants and reduced yield whereas the same effect did not occur with AS. Placing urea one inch from the seed reduced the adverse growth effects noted with combine drilled urea.
Devine & Holmes (1963a) investigated the effect of combine drilling urea and other fertilisers on spring barley at 21 trials. Combine drilling urea at 50 kg N/ha had no effect on early growth, but at 80 or 100 kg N/ha there was a serious delay to brairding and reduced plant population, with resultant lower yields.
Combine drilling is now rarely practised in the UK and is not recommended, so a switch to urea-based fertilisers should not cause concern, unless this practice increased. Comparisons of fertilisers for non-combine drilled seedbed applications are given in the relevant crop sections.
document.doc 21
‘Evaluation of urea-based nitrogen fertilisers’ Report for Defra projects NT2601/02
5.1.2 Topdressed ureaMany early trials in the 1960s and 1970s have been discussed in reviews (Gasser, 1964; Tomlinson, 1970). Tomlinson (1970) concluded that urea had variable effectiveness compared to other nitrogen fertilisers but that significant differences only occurred in a minority of cases; where they did occur, urea was usually the least effective fertiliser. He considered that, although environmental conditions had not been reported in sufficient detail to help explain any differences, the main factor affecting the efficiency of urea was ammonia loss (i.e. reduced N availability). He added that urea tended to be more effective when cultivated into the soil than when broadcast on the soil surface, which also suggests ammonia volatilisation to be responsible. Some authors also suggest direct toxicity as a mechanism for reduced effectiveness of urea (Court et al. 1964) due to a reduction in rhizosphere pH, induction of cation deficiencies or plant water stress in carbohydrate metabolism associated with the detoxification of ammonium-N within the plant (Haynes, 1986). However, there is no evidence to suggest that this occurs for UK arable crops (Tomlinson, 1970).
The greatest potential for loss of ammonia is when urea is topdressed (broadcast) on the soil surface. However this will be strongly dependent on soil moisture conditions and rainfall at and following the time of application. Provided the soil is dry, very little hydrolysis of the urea is likely to occur. Terman (1979) reported that urea applied to air-dry soil does not hydrolyse and suggested that, even at high humidity, urea on a dry soil will not take up enough moisture to support quantitative hydrolysis. The inference from this is that urease enzyme activity is not observed in the highly concentrated solutions formed by deliquescence of the solid. On the other hand, if a large amount of rain falls after application, then the urea will be washed into the soil and ammonia emissions will be considerably reduced; this can have the same effect as physical incorporation of the fertiliser.
Between these two extremes, there will be situations where urea will remain on the surface of a moist soil and be at risk for ammonia loss, for example:
1. Where the soil is moist before application (either from previous rain or dew) and there is little rain for a few days following application.
2. Where the soil is dry before application and then there is sufficient rain to moisten the surface but not to wash the urea into the soil. In this circumstance, hydrolysis will occur and, as there is no soil cover to adsorb the ammonia, considerable loss to the atmosphere will occur.
In both cases, the amount of loss will be affected by wind speed across the soil surface.
Several workers have commented on the effect of weather on the effectiveness of topdressed urea. Lloyd et al. (1997), studying the effect of a single application of urea to winter cereals at growth stage (GS) 31, found that grain N offtake increased with increasing rainfall on the day of application but not on subsequent rainfall; on chalk soils grain N offtake increased with increasing rainfall up to the fifth day after application. Gately (1994) found that the drier the weather around the time of N application, the poorer was the performance of urea relative to CAN for topdressing winter wheat. Sanderson & White (1987) found that, for potatoes, 80% of yield variation between the use of urea and AN could be explained by the temperature and accumulated rainfall in the week prior to and following application, as well as the temperature two weeks after planting. Fox et al. (1996) measured ammonia losses from urea topdressed to maize crops; c. 30% of applied N was lost as ammonia and this relatively high amount was attributed to the relatively rain-free period for at least 6 days after application in each year. They quoted five other reports suggesting that a rainfall of 5-10 mm within 6 days of application was sufficient to significantly reduce ammonia volatilisation.
The following sections reviews trial results carried out on arable crops. The results are summarised in Appendix 1.
5.1.2.1 Winter cerealsDevine & Holmes (1963b) compared spring topdressing of AN and urea for winter wheat at 17 trials during 1958-61. Two low rates of N (28 and 50 kg/ha) were tested with nil N controls and the response (yield increase above nil N) was adjusted to 39 kg/ha (assuming an exponential response curve). Over all the trials, the
document.doc 22
‘Evaluation of urea-based nitrogen fertilisers’ Report for Defra projects NT2601/02
response to urea was 96% of that to AN, but the difference was not statistically significant; there was no effect of soil pH or texture. However, three of the trials showed a significantly (P<0.05) lower yield response from urea (one of these was on a highly calcareous loam where the response to urea was only 50% of that to AN) while at two other trials a higher yield response was observed with urea (P<0.05).
Chaney & Paulson (1988) compared topdressed AN with urea at 33 winter wheat and 7 winter barley trials. Only one rate of N (besides the nil N control) was tested at each trial and for most trials this rate was low (mostly 50 kg N/ha). When meaned over all 41 trials, the relative efficiency of urea (calculated as the yield response to urea as a % of the yield response to AN) was 91.3% for wheat and 86.8% for barley, but there were no consistent differences in yield loss from urea according to soil texture, pH or location. It is interesting to note that for six trials, where a much higher N rate was tested (140 or 160 kg N/ha), the relative efficiency of urea increased to 94.3% and 91.4% for the wheat and barley trials respectively. Differences between N materials are likely to be less when tested at high N rates ie higher up the response curve. This is an important factor when interpreting trials results.
It should also be noted that it is important to consider how the relative efficiency has been calculated. In the two papers above, it was calculated as ‘% response’ ((YU - Ynil N)/(YAN - Ynil N)) * 100 where Y=yield. If it had been calculated as ‘% yields’ (YU/YAN)*100, then the values would have been higher. For instance, the effectiveness of urea for the 1985-86 trials reported by Chaney & Paulson (1988), if expressed as ‘% yields’, would have been 97.6% and 96.4% for wheat and barley respectively.
Jonsson & Johanssen (1972) reported on 303 trials on winter wheat during 1963-68. Urea was compared with CAN at 30, 60, 90 kg N/ha and with CN generally up to 120 kg N/ha. Where possible, production functions were calculated (using the response equation Y = a + bx - cx2 where x is the N rate). Parameters b and c were smaller for urea than for CN. It was calculated that urea gave maximum yield at higher N rates than CN. For six trials comparing CN and urea at rates up to 160 kg N/ha, maximum (not economic optimum) yields and N rates to achieve this were 5.03 t/ha at 147 kg N/ha with CN compared to 4.86 t/ha at 174 kg N/ha with urea. Soil type and pH had no effect on response between N fertilisers.
Van Burg et al. (1982) reported on 16 trials to investigate the response of winter wheat to urea and UAN compared to CAN or CN. Only relative yields (stated as ‘effectivity factors’) were reported (Table 5.1). Both urea and UAN gave considerably lower yields than CN on calcareous clay soils. On other soil types in these trials, UAN was on average as effective as CAN while urea gave 90-95% of CAN yields.
Table 5.1. Effectiveness of urea and UAN compared to CAN or CN on winter wheat (from Van Burg et al., 1982)
Soil type U and UAN Urea UANcompared with No. of
trialsEffectivity factor
No. of trials
Effectivity factor
Sand, reclaimed peat CAN 7 0.95 8 1.00Older clay CAN 3 0.90 5 1.00Young calcareous marine clay
CN 6 0.81 9 0.83
Gately (1994) compared CAN and urea for winter wheat at 9 sites. In addition to a nil N control, four rates of N up to 200 kg N/ha were applied, split with 50 kg N/ha in late February and the remainder in April. Over all sites, grain yield from urea was significantly lower from CAN at all N rates; however the loss in yield from urea decreased at higher N rates - from 0.64 t/ha at 50 kg N/ha to 0.24 t/ha at 200 kg N/ha (a yield loss from urea of 10.8 and 2.9% respectively). Grain protein content was significantly higher following CAN than urea (at 200 kg N/ha the difference was 10 g/kg @ 100% dm). Urea effectiveness was not related to soil pH, texture
document.doc 23

‘Evaluation of urea-based nitrogen fertilisers’ Report for Defra projects NT2601/02
or location but was related to soil moisture content and rainfall around the time of application - the drier the weather and soil around the time of application, the poorer was the response of urea relative to CAN.
Lloyd et al. (1997) compared urea and AN at rates of up to 300 kg N/ha, either as a single application at GS31 or split, with half at GS31 and half two weeks later. The overall results (meaned across all N rates) from 26 trials showed that relative grain N offtake was 2.5% greater from AN; splitting the main application increased grain N offtake from urea by about 1.5 kg N/ha but not from AN. At 3 sites, all on chalk soils, yield was greater from AN (P<0.05) while on 2 sites yield was greater from urea (P<0.05). However, when averaged across all sites, there was no statistically significant yield difference from using AN, and there was no yield benefit from splitting the urea application. The overall grain N concentration was c.0.05% greater from AN compared to urea except at the highest N rate. The N requirement for optimum yield (Nopt) was similar for the two fertilisers and splitting the main dressing had no effect on yield or Nopt. Some explanation of why these results differ from other trials such as Chaney & Paulson (1988) was offered; i) the N dressings were applied some 3 weeks later than those reported by Chaney & Paulson (1988) and ii) large actively growing crops may be less prone to direct damage from ammonia than those at an earlier growth stage.
In 2002, two trials on the same farm compared AN, U and UAN solution for winter cereals, one wheat and one barley (Terra, pers. comm.). Four rates of nitrogen (100, 150, 200, 250 kg N/ha) plus nil N controls were applied, with 50 kg/ha in early March, and the remainder split between mid-April (50-150 kg/ha @ GS 30) and early May (50-100 kg/ha @ GS32-33), except for the 100 kg/ha dressing which received nil N in May. Yield results (t/ha @ 85% DM) are shown below. In both trials, AN gave the highest yield and UAN the lowest (0.84-1.08 t/ha lower yield); urea was intermediate. Since the fertilisers for both trials were applied on the same dates, weather conditions could not account for the greater differences in yield between urea and AN for the barley trial compared to the wheat trial.
Winter wheat: AN (8.95) > U (8.85) > UAN (8.11). The only statistically significant difference was that UAN gave 0.84t/ha less yield than AN and 0.74 t/ha less yield than urea (P<0.05). Winter barley: AN (8.27) > U (7.66) > UAN (7.19). The differences between all three N sources were statistically significant (P<0.05)
Four trials in 2002 compared AN and urea for winter wheat (Terra, pers. comm.). Two sites were on shallow clay soils over chalk or limestone, and the other two sites on deep heavy clay loams; all sites had a soil pH of at least 7.5. At each site, only one rate of N was applied (200-250 kg N/ha) plus a nil N control; 80% was either applied all at GS30 or split equally between GS30 and GS32, the remainder was applied either at GS25 or GS39. For the four sites averaged over the timing strategies, urea gave 98% of the yield from AN; the yield reduction from urea was greatest at both shallow soil sites, although this was only significant at one of them (P<0.05); on a shallow Cotwold brash soil (site 4). Differences in grain N offtake showed some similarity with yield; meaned for all sites there was a reduction of 7 kg/ha from urea but only at site 4 was the reduction (10 kg/ha) significant (P<0.05). Urea gave a lower grain protein content at site 4 (a reduction of 0.5 % protein at 100% DM), but there were no consistent differences at the other sites. Biomass and leaf N contents were measured during the growing season in April, May and June (c. GS 32, 39 and 65). Biomass results showed no consistent differences between the two fertilisers, although there was a tendency for urea to give lower leaf N concentrations than AN, particularly from samplings in May. There was also a tendency for lower N uptakes following urea applications although there were no consistent differences.
Between 1984-88, Hydro (pers. comm., confidential) compared urea-based materials (urea and UAN) with nitrate-based materials (AN, CAN, CN) for topdressing winter wheat at 15 sites in England. Six rates of N (80-280 kg N/ha) were applied - part at GS30 and the remainder at GS32-33. AN gave significantly higher yields than urea at only 2 of the 15 sites (Table 5.2). Over all 15 sites the average difference between urea and AN was not significant but both urea and UAN gave significantly lower yields than CN (P<0.05). The optimum N rates for urea and UAN were 15-20 kg N/ha higher than for the nitrate based fertilisers.
Urea and UAN had similar grain N contents and grain N offtakes but these were significantly lower than all the nitrate fertilisers. These results suggest that grain N content is reduced with urea-based fertilisers compared to
document.doc 24

‘Evaluation of urea-based nitrogen fertilisers’ Report for Defra projects NT2601/02
AN, even where there is no overall yield reduction. It is interesting to note that at 3 sites, there was no significant difference in yield from AN and urea although there was a significant reduction in grain N content.
Table 5.2. Yields, grain N contents and grain N offtakes of winter wheat (mean results of 15 trials, data courtesy of Hydro Agri)
Mean of all trials and N ratesN material Yield (t/ha) Grain N (%) N offtake (kg/ha)Nil N (Control) 5.00 1.59 67.1
AN 8.52 2.02 146.1CAN 8.55 2.02 146.5CN 8.66 2.04 149.9
Urea 8.42 1.96 140.1UAN 8.45 1.96 140.8
LSD (5%) 0.13 0.03 3.03
No. of trials (out of 15) where there was a significant difference (P<0.05):AN > UreaUrea > ANUrea > UANUAN > Urea
2011
6024
4021
German official trials (Hydro Agri, pers. comm.) during 1984-2002 compared CAN and UAN for winter wheat at 97 sites. Only a single N rate per trial was used, varying from 60-265 kg N/ha (mean of 180 kg N/ha). Over all sites, the average yield from UAN was 9.08 t/ha compared to 9.35 t/ha from CAN, a reduction of 2.9%. Grain protein contents were measured at 64 sites; UAN gave 0.5% less than CAN.
Readman et al. (2002a and 2002b) compared 170 kg N/ha applied as AN or solid urea for winter wheat, with 50 kg N/ha applied in mid-March and the remainder at GS 30/31. The treatments were applied to a sandy loam soil and to the same plots over 3 years. No significant difference in yields, above ground plant N or apparent N recovery at harvest between the fertilisers were found. In one year, the GS 30/31 treatments were applied as labelled 15N fertilisers to microplots. Percentage recovery in grain, total above ground crop and soil was similar from the two fertilisers, although there was a significantly greater recovery of labelled N from AN in the straw and chaff. These trials also investigated replacing an increasing proportion of the solid urea application with foliar-applied urea solution (20% w/v); these were applied in 30 kg N/ha increments a few days apart to avoid scorch effects. Replacing part or all of the GS30/31 solid urea with foliar urea made no significant difference to yields or above ground plant N at harvest compared to solid fertiliser applications. However, replacing all of the 170 kg N/ha solid urea (including that in mid-March) with foliar urea significantly reduced yield in one year and above ground N offtake in two years. The authors concluded that urea sprays could successfully replace soil-applied N fertiliser at stem extension in wheat; however the extra application costs could outweigh any efficiency (or environmental) benefits except where dry soils would inhibit uptake of soil-applied N.
Foliar applications of urea solution (maximum 20% N concentration) are commonly applied by milling wheat growers with the intention of increasing grain protein concentrations and thereby attracting a financial premium. As grain yields continue to increase so grain protein concentrations are tending to decrease, resulting in a potential increased adoption of this application of nitrogen. Several authors have shown that late foliar urea applications are effective at raising the grain protein content, though they can cause crop leaf scorch. For instance, Dampney et al. (1995) reported results from 45 trials carried out between 1988-1991. These trials showed that the optimum timing of foliar urea was during the grain milk development stage (GS 70-79) and
document.doc 25

‘Evaluation of urea-based nitrogen fertilisers’ Report for Defra projects NT2601/02
that application of 30 kg N/ha as foliar urea increased the grain protein content by an average of 0.67% protein (at 86% DM). Baking tests confirmed that this increase in grain protein was reflected in an improved loaf volume and quality. However, the N use efficiency of this application was poor; the apparent recovery of applied N by grain averaged 30% from an application of 30 kg N/ha and decreased at higher application rates. The causes of the poor recovery were not directly measured but were presumed to be ammonia loss and/or a poor efficiency of the crop to absorb late applied N.
5.1.2.2 Winter oilseed rapeRodgers et al. (1986) compared urea with ‘Nitro-chalk’ topdressed at 150 kg N/ha either as single dressing in early March or split with half in early February and half in mid-March. They found that urea, whether single or split dressed, was completely hydrolysed to ammonium-N within 2 weeks of application. Measured ammonia losses during the 3 weeks after urea application were never more than 3% of the fertiliser N applied and were similar for single and split applications. In both years, the single but not the split urea dressing caused scorching of the leaves 2-3 weeks later - this was attributed to ammonia toxicity. They suggested that a large, single application of urea in the spring may be detrimental to oilseed rape unless the plants are strong at the time of application, and that urea should be split as an ‘insurance policy’. Seed yield results showed that, on average, urea gave 90% of the yields from Nitro-chalk; splitting urea dressings increased yields in 1985 but not in 1984. The oil and nitrogen contents of the grain were not affected by the fertiliser type or timing.
Darby & Hewitt (1990) applied 200 kgN/ha as urea or CAN, either as a single dressing at the end of February or split in various combinations, to oilseed rape grown on a silty clay loam soil. Seed yield from urea was on average 98% that from CAN, and timing had little effect on yield. However, yield from CAN was only significantly higher than from urea in one of the trials (3.99 vs. 3.84 t/ha). Seed oil content was slightly higher from urea than from CAN which compensated for the slightly lower yield and resulted in almost equal oil yields for the two fertilisers. When 150 kg N/ha was applied in a single dressing, seed protein content was significantly decreased from urea compared to CAN. In comparison to the trials of Rodgers et al. (1986), no leaf scorch was observed; there were no obvious differences in rainfall or temperature between the two studies and the differences in leaf scorch were thought to be due to varietal differences.
Between 1994-98, Hydro (pers. comm., confidential) examined the effectiveness of AN, CAN, CN, urea and UAN solution at 6 rates of N (80-280 kg N/ha) at 15 trials in England. There were significant differences in seed yield at 7 sites (P<0.05); at 5 of these sites, the mean yield (averaged over the 6 N rates) for solid urea was significantly lower than for AN; UAN solution either gave similar or higher yields than urea. In Figure 5.1, the fitted yield response curves (mean of 15 trials) show that urea gave lower yields than the other solid N fertilisers at all N rates, while the yields from UAN solution increased above those from urea at the higher N rates (c.>200 kg N/ha). Although the trials were located on soils of differing topsoil texture (from loamy sand to clay), there was no obvious link between soil type and response to different N materials; no details on weather conditions were available.
document.doc 26
‘Evaluation of urea-based nitrogen fertilisers’ Report for Defra projects NT2601/02
Figure 5.1. Response of oilseed rape to different N materials (mean of 15 trials, data courtesy of Hydro Agri).
The economic optimum N rates (Nopt , based on N costing 29p/kg N and seed valued at £150/t) were calculated (Table 5.3). The Nopt for urea was 15 kg N/ha higher than for AN but the yield at this N rate was 0.16t/ha lower. The Nopt for UAN was 35 kg N/ha higher than for AN but the yield at this N rate was 0.05t/ha lower.
Table 5.3. Economic N rate (Nopt) and yield at Nopt for oilseed rape (mean results of 15 trials, data courtesy of Hydro Agri)
N material Nopt (kg/ha) Yopt (t/ha)AN 198 4.13CAN 212 4.09CN 208 4.19Urea 213 3.97UAN solution 233 4.08
Urea gave significantly lower seed N contents and seed N offtakes than AN at four and five of the trials, respectively and at no trial was the converse true; UAN generally gave similar results as urea. Over all 15 trials, urea and UAN gave significantly lower seed N contents and N offtakes than the other fertilisers (Table 5.4). Values are given for the mean of all N rates (i.e. 160 kg N/ha) and also for the 200 kg N/ha rate because this was the nearest rate to the optimum for most of the fertilisers - at this latter rate, urea and UAN showed c.8 kg N/ha lower N offtake than non urea fertilisers.
Terra (pers. comm.) compared AN, U and UAN solution on winter oilseed rape at one trial. Rates of 100, 150, 200, 250 kg N/ha were split with half at end February and half at end March; nil N controls were included. Table 4.5 shows seed yields meaned across all N rates tested. Yields were similar from urea and UAN but both of these were significantly less than from AN (P<0.05). The data was fitted, using an exponential response curve. The calculated optima showed that the Nopt for urea was 15 kg N/ha higher than for AN but the yield at
document.doc 27
3
3.2
3.4
3.6
3.8
4
4.2
4.4
80 120 160 200 240 280N (kg/ha)
Yiel
d (t/
ha)
AN U CAN CN UAN

‘Evaluation of urea-based nitrogen fertilisers’ Report for Defra projects NT2601/02
this N rate was 0.14t/ha lower. Similarly, the Nopt for UAN solution was 56 kg N/ha higher than for AN but the yield at this N rate was 0.13t/ha lower.
Table 5.4. Seed N contents and N offtakes for oilseed rape (mean of 15 trials, data courtesy of Hydra Agri)
N material Seed N (%), mean of all N rates for all trials (value at 200 kg/ha in brackets)
Seed N offtake (kg/ha), mean of all N rates for all trials (value at 200 kg/ha in
brackets)AN 3.04 (3.11) 108.8 (117.1)CAN 3.06 (3.18) 107.4 (117.0)CN 3.04 (3.15) 109.7 (119.8)Urea 3.00 (3.07) 102.2 (109.5)UAN solution 2.99 (3.04) 103.4 (108.8)LSD (0.05) 0.03 - 3.33 -
Table 5.5. Seed yield, economic optimum N rate (Nopt) and yield at Nopt for oilseed rape (1 trial) (data courtesy of Terra Nitrogen)
N material Yield (t/ha), mean of all N rates
Nopt (kg N/ha) Yopt (t/ha)
AN 3.78 141 3.74Urea 3.61 156 3.60UAN solution 3.51 197 3.61
5.1.2.3 Spring cerealsBetween 1962-1966, at over 200 trial sites (mainly spring barley, but also spring oats and spring wheat), Jonsson and Johannsen (1972) compared urea and CAN at N rates up to 90 kg N/ha applied before sowing and harrowed into the seedbed. Overall, the two nitrogen sources gave similar yields. Some trials also investigated the same treatments broadcast 2-3 weeks after emergence; fitted curves to the yield data showed that, for 82 trials, maximum yield was slightly lower from urea, although the N required to achieve this was greater (112 kg N/ha) than for CAN (91 kg N/ha). It should be noted that, because of the low N rates applied, considerable extrapolation of the data was required to obtain these values. Grain N contents from these trials showed no significant difference between the N materials.
Devine & Holmes (1963b) compared urea and AN broadcast on the seedbed for spring barley (25 trials). Low rates of N (28-50 kg N/ha) were applied and yield responses adjusted to 39 kg N/ha. At 5 trials, where significant differences occurred between the fertilisers, urea gave 0.24-0.5 t/ha less grain yield than AN (mean yield from AN was 3.45 t/ha). Of these, four were on soils of pH over 7. Over all the trials, the yield response from urea was 89% that from AN, although this decrease was not significant. However, if only the trials on soils of pH over 7 were considered, the yield response was 86% which was significantly different to the yield response from AN (P<0.05). There was no difference in relative response between the trials due to soil texture or location.
5.1.2.4 Sugar beetAdams (1960) compared urea and CN with AS at 28 trials; 75 and 150 kg N/ha were applied either in the seedbed or broadcast at the end of June. When applied in the seedbed at 75 kg N/ha, CN gave similar yields to
document.doc 28

‘Evaluation of urea-based nitrogen fertilisers’ Report for Defra projects NT2601/02
AS but urea gave a lower yield (not significant); at 150 kg N/ha all N materials gave similar yields (Table 5.6). When broadcast, sugar yields were in the order CN > U > AS, though the differences were not significant.
Table 5.6. Sugar yields with 75 kg N/ha applied as AS, CN and urea (Adams, 1960)
Increase in sugar yield above nil N (t/ha)Method of N application
Sugar yield, nil N (t/ha)
AS CN Urea
In seedbed 5.24 + 0.81 + 0.82 + 0.73Broadcast 5.24 + 0.50 + 0.73 + 0.59
Carroll & McEnroe (1970) also compared CN, urea and AS for sugar beet. 56 and 112 kg N/ha were applied either at sowing or singling (thining of the crop – not practiced in the UK) or split between them. Significant differences in sugar yield only occurred at 5 sites but there was no consistent effect from any one N material. When averaged over 32 trials there was no significant differences in sugar yield between the N materials. Any effects of N timing on the relative efficiencies of the materials was not reported.
Devine & Holmes (1963b) compared AN and urea broadcast on the seedbed at rates of 56-67 kg N/ha. When averaged over 19 trials, the sugar yield response from urea was 88% that from AN but the difference was not significant; for sugar beet tops, the value was 94%, which was again not significant. At five trials, all with soil pH over 7, use of AN resulted in a significantly higher yield of sugar or sugar beet tops (P<0.05); however only 4 of the 19 sites were on soils of pH<7. Jonsson & Johanssen (1963) reported on 27 trials where Chilean potassic nitrate (sodium and potassium nitrate) was compared with urea at rates of 40-60 kg N/ha all applied before sowing. Fitted curves showed that maximum root yields were obtained with 148 kg N/ha as Chilean CN and 137 kg N/ha as urea, giving root yields of 47.1 and 43.8 t/ha respectively. As sugar contents were similar from both fertilisers, sugar yields followed the same pattern as root yields.
Three trials, on sandy loam or loamy sand soils compared 120 kg N/ha as AN or urea applied either at drilling or split between drilling and 2-4 leaf stage (SBREC, 1990). Applying 120 or 60 (but not 30) kg N/ha as urea at drilling caused significant reductions in plant numbers, particularly at one site (28% and 9% reductions respectively compared to AN). However, despite this, there were no significant differences in root or sugar yield between treatments; the growing conditions permitted very high plant populations and, even with reductions, these were sufficient for maximum yield. The authors suggested that, in more difficult seasons, when plant establishment may be a problem, yield reductions could occur. They recommended that, for light land, urea application at drilling should be restricted to 30-40 kg N/ha with the remainder at the 2-4 leaf stage. Similar results were found in the following two years (Hopkinson, 1992).
UAN solution (Nuram 37) was compared with AN on a chalky loam soil in 1989 (SBREC, 1990). 120 kg N/ha was applied either all at drilling (sideband application), or 30 kg N/ha at drilling and the remainder at the 2-4 leaf stage. There were no significant differences in plant populations, root or sugar yields between the treatments. However the UAN did give significantly lower amino-N levels than the solid AN.
5.1.2.5 Forage maizeYerokun (1997) compared AN and urea for maize on a calcareous clay soil at rates up to 200 kg N/ha, either broadcast or incorporated into the seedbed. No significant differences in yield were found.
Several workers in the USA have compared N materials for ‘no till’ maize. Although maize is not grown in this way in the UK, the results do show some interesting trends.
document.doc 29

‘Evaluation of urea-based nitrogen fertilisers’ Report for Defra projects NT2601/02
Touchton & Hargrove (1982) compared UAN, urea and AN at 90, 180 and 270 kg N/ha for no till maize at one site in each of 3 years. Maize grain yields and grain N recovery showed that the urea was least effective, UAN intermediate and AN most effective (the difference between urea and AN was statistically significant in two years, P<0.05). Averaged over all N rates and trials, grain yields were 8.00, 8.69 and 9.03 t/ha for urea, UAN and AN respectively, with the urea showing particularly low yields compared to the other materials at the lowest N rate (90 kg N/ha). The N materials were applied either in a surface band or shallow incorporated; in general, there were no differences between these methods of application. The lack of improvement for the shallow incorporated compared to surface banded urea, was thought to be due to the low CEC of the sandy loam soil which could not adsorb significant amounts of ammonium-N. UAN solution was also applied as a broadcast spray which considerably reduced yields compared to other methods of application. The authors noted that in each year the N materials were applied when the soil was drying rapidly - so creating favourable conditions for ammonia volatilisation. They also suggested that urease activity could be stimulated by accumulated organic matter under no till conditions, leading to more rapid urea hydrolysis than in tilled soil.
Similar comparisons were reported by Fox et al. (1986) with N rates up to 200 kg N/ha. Surface-banded AN and shallow incorporated AN and urea, all produced the same yields and grain N offtakes. However, yield reductions from surface banded urea (thought due to ammonia volatilisation) were strongly influenced by the number of days after application until 10mm of rain fell. It was also considered that soil moisture content at the time of application could have been a contributory factor, although this was not measured. Surface banded urea and UAN gave similar yields, but shallow injection of UAN did not increase N fertiliser efficiency as shallow incorporation did with urea; the reasons for this were unclear.
Howard & Essington (1998) compared the effectiveness of UAN, urea and AN at 168 kg N/ha for no-till maize at two sites (one over 5 years and the other for 2 years). The soil on both sites was silt loam. The yields (Table 5.7) at site 1 showed that solid urea, whether applied as a single dressing or split (half at planting and the remainder at the leaf 8), gave significantly lower yields than AN, although splitting the urea did increase its effectiveness. Site 2 also gave lower yields from urea but splitting the application did not improve the effectiveness. At both sites, UAN gave the highest yield when injected but this was much reduced when broadcast, although it still outyielded urea broadcast at the same time. Ear leaf N concentrations were measured at mid silk stage and gave results in line with the yields (low yields corresponding with low leaf N% and vice-versa). There was also a surface applied lime treatment in these trials (1.1 t/ha each year, applied 1-3 weeks before the N treatments). This lime treatment significantly reduced grain yields but only for the broadcast urea treatments; this suggests that the higher pH from liming may have led to more ammonia volatilisation losses.
Table 5.7. Mean yields (t/ha) of maize (Howard & Essington, 1998)
Fertiliser Application Site 1* Site 2 *UAN Broadcast within 5 days after planting 7.86 c 10.07 bUAN Injected within 5 days after planting 9.33 a 11.38 aUrea Broadcast within 5 days after planting 6.56 d 9.24 cUrea ½ broadcast, ½ surface banded at 8 leaf 7.64 c 9.35 cAN Broadcast within 5 days after planting 8.57 b 11.11 a* values followed by the same letter are not significantly different (P<0.05)
5.2 Grassland(Lead author:- David Scholefield, IGER)
document.doc 30
‘Evaluation of urea-based nitrogen fertilisers’ Report for Defra projects NT2601/02
There is much information available about the agronomic efficiency of urea, relative to AN or CAN, when applied as a top-dressing to temperate grassland. Most of this information derives from field experiments conducted in the UK and Ireland during the period 1960 to 1985, with little new data generated since. The information is contained mainly in two major reviews:- the earlier one summarising research conducted prior to 1968 (Tomlinson, 1970) and the later one containing this and additional information obtained up to about 1987 (Watson et al., 1990). This section therefore relies strongly on these two sources, with some additional, more recent relevant information obtained from other European and New Zealand sources included.
Information on the agronomic efficiency of urea applied to grassland is expressed in terms of the urea relative yield (URY) value. This is normally the dry matter (DM) yield of herbage for one or more cuts obtained with an applied quantity of urea divided by the yield obtained with the same quantity (nitrogen equivalent) of AN or CAN expressed as a percentage. Much of the early work is exemplified by the results reported by Devine and Holmes (1963b), who calculated URYs for 73 cut-plot experiments conducted in England and Scotland on soils with a range of textures and pH. The mean URY (compared to AN) for 47 experiments in which N was applied in one dose at 50 lb/acre was 90%, with 8 experiments giving greater yields in response to urea. At 100 lb/acre (26 experiments) the mean URY dropped to 87%, with only 4 experiments in which urea treatment plots out-yielded those receiving AN. In general, the conclusion from these early experiments was that urea application results in 10-15% less DM yield compared with AN, and that the reductions were greater on lighter soils during dry periods.
As urea became cheaper per kg of N than AN during the early 1980s, there was a resurgence of interest in its agronomic performance for grass production. Consequently, ADAS carried out a series of 40 grass cut-plot trials on a range of soils in England and Wales during 1983-1985 (Lloyd, 1990). Nitrogen was applied at 7 rates in the range 0-240 kg/ha and 2 cuts were taken. The URY for 3 rates combined (80, 120 and 160 kg/ha N) were 97.9% ( 1st cut) and 95.2% (2nd cut), with ranges of 79.6-113.3% and 74.5-112.6% respectively. Although these results show urea to be perhaps more effective relative to AN than the earlier data, the variability between sites according to soil and, within sites, according to seasonal weather differences was great. There was little evidence in the ADAS data that urea was less effective with higher rates of application. The main factor identified to account for some of the variation in URY was rainfall in the 3 days prior to fertiliser application:- provided that more than 15mm rainfall fell during this period, urea was as or more effective at first cut and almost (within 2%) as effective for second cut.
The most comprehensive review of the agronomic performance of urea applied to grassland in the British Isles was conducted by Watson et al (1990). These authors assembled information to calculate URY (relative to CAN) from 17 and 14 experimental datasets relating to spring and summer grass production, respectively, obtained during the period 1967-1987 in Northern Ireland, Scotland, Eire and England. The URYs for spring applications ranged between 90.5 and 121% (mean >100%), while those for summer applications ranged between 71.7 and 102.2% (mean <100%). The clear conclusions reached were in general agreement with those from earlier studies alone, that urea is as effective as CAN or AN for spring grass production but some 5-15% less effective for summer production. There was no evidence found to indicate that urea is a significantly more variable N source than CAN, but that maximum yields are lower than those achievable with CAN.
The most recently reported data also indicate a variable response to urea compared with CAN or AN. While Herlihy (1988), reported a ‘somewhat higher herbage dry matter response to and N recovery’ from urea in an Irish study, Belgian work, reported by Behaege et al. (1986), showed poorer efficiency of applied N from spring-applied urea (56%) compared with that from AN (73%), as did Craighead et al. (1997) working in New Zealand, who explained the effect by low soil temperatures. It seems that it is the interaction of soil temperature and water content that determines the relative efficiency of urea and AN for spring grass production.
Bussink and Oenema (1996) attempted to explain differences in relative response of cut grass to urea and CAN in the Netherlands, UK and Eire by effects of rainfall and temperature. The URY data were consistent with that obtained in previous European studies but, by pooling the international results, a regression equation was derived that was used as a basis of a Decision Support Model for optimising urea application. The equation is:
document.doc 31
‘Evaluation of urea-based nitrogen fertilisers’ Report for Defra projects NT2601/02
URY = 89.48 (±0.78) + [2.188 (±0.15) x R3] -1.091 (±0.07) x T3 % r2(adj) = 98.9%
where R3 and T3 are rainfall amount and temperature 3 days after fertiliser application. These results suggested that rainfall and temperature define the agronomic efficiency of urea in a similar way across all three countries. Bussink and Oenema (1996) went on to use this relationship to predict the profitability of urea use. It was observed that to obtain equal profit for U and CAN, rainfall needed to exceed 6 mm and 9.5mm for the first and second cuts, respectively. For later cuts urea was considered to be unprofitable.
Another important observation from this study was that with urea, N yield is not so well converted into DM yield, as with AN. Chaney and Paulson (1988) were much less optimistic that simple models based on geographical location and soil differences would be useful in explaining the relative performance of urea for grass growth. These authors reported the results of 173 field experiments carried out for Norsk Hydro Fertilisers Ltd during the period 1957-1986 and concluded that yield losses from urea are just as likely on first cut silage as second or third cut.
Much of the above data derive from cut-plot or ‘simulated’ grazing experiements; relatively few comparative studies have been carried out under actual grazing. There are no additional considerations with grazing that would lead to different ranges of URYs obtained under cutting and it is possible to obtain yield benefits (e.g. Carlier et al., 1990) and penalties (e. g. Craighead et al., 1997; Murphy, 1981, 1982, 1983). However, there are possibilities of ‘secondary’ effects that may be identified and which may need further study. These include impacts on intake and on diet selection in mixed species swards as well as consideration of forage quality differences due to the reduced nitrate content in the urea-fertilised sward. Ammonium-N has been shown to be taken up in preference to nitrate by forage plants at lower temperatures (Scholefield and Stone, 1995; Clarkson et al., 1984). Additionally, urea could produce relatively N-rich herbage (following from Bussink and Oenema, 1996), which would have the effect of decreasing the content of ‘true protein’ of the feed and lead to reduced N capture by the animal and changes to milk quality.
The other grassland management that may give rise to differential yield responses to urea compared to AN or CAN, is cultivation and reseeding. Again, there is little reported data from which to draw generalised conclusions, but it might be expected that large doses of urea could have detrimental effects on young emerging seedlings (e.g. Widdowson and Shaw, 1960) and that the change in soil physical conditions on cultivation would effect urease and nitrification activities as well as the rate of ammonia volatilisation.
It might be assumed that the reduced efficiency with which urea-N is used in grass production is a consequence of greater N losses from the soil, particularly through ammonia volatilisation in dry warm and high pH conditions and with soils of low buffering capacity (Jenkinson and Smith, 1987). There is little information from UK sources about either the size of total N loss from urea fertilised pastures, or the relative sizes of losses due to ammonia, denitrification and leaching, compared with those due to AN. There are many New Zealand studies however (e.g. Ledgard et al., 1996; Di and Cameron, 2000) showing that N losses from pastures with urea are similar in size and proportion to those expected with AN at similar levels of output. Losses of ammonium and nitrite-N through leaching might be expected to be of particular importance in relation to impacts on aquatic life in surface waters (Scholefield and Stone, 1995; Burns et al., 1995; Sharpley et al., 1983). As urea is itself highly soluble and mobile, direct leaching to watercourses could occur after application to wet grassland soils in early spring.
Much of the earlier research (pre-1970) conducted to assess the URY for UK grass production would have been with swards containing several species, while the later research would have been conducted on perennial ryegrass dominated swards. There is little specific information on any differential impacts of sward botanical constitution on URY, but as the URY results remained consistent with time, we can conclude that plant effects are probably quite small. However, the differential impacts of fertiliser form on swards botanical diversity are largely unknown and warrant further study. Impacts of urea-N inputs on the content of white clover in New Zealand grass/clover pastures are similar to the reductions expected by input of AN (e.g. Harris et al., 1996; Smith et al, 2000). That is, clover content is reduced due to increasingly strong competition from the companion grasses as N inputs are increased. Other more subtle effects on the forage plant, sward composition
document.doc 32

‘Evaluation of urea-based nitrogen fertilisers’ Report for Defra projects NT2601/02
and subsequently on the animal product and environmental impact of the grassland system might be expected if urea has differential impacts on soil behaviour and/or uptake of other nutrients. There is some evidence that urea application results in localised enhanced immobilsation of soil P and differences in the uptake patterns of S and Mg (Garrett et al., 1989).
5.3 Horticultural crops(Lead author:- Ian Burns, HRI)
This section deals with the impacts of urea as a N fertiliser on a range of horticultural crops (mainly annual vegetables grown in the field or under protection) and potatoes, and compares the responses with those from other sources of N where data is available. Because of the large number and diversity of vegetable crops, these have been grouped to simplify the presentation. Most of the data have been taken from agronomic experiments on the effects of the various N sources on crop yield and quality, although (where relevant) information from hydroponic experiments have also been included, either because these conditions conform more closely to UK production systems (e.g. for tomato and cucumber), or because they provide a clearer mechanistic understanding of the reasons for any response. The final sections of this paper consider possible underlying causes of urea damage to plants, and discuss the implications for nitrogen use efficiency and potential environmental impacts of its use in horticultural production systems.
5.3.1 Vegetable brassicasExperiments to evaluate the performance of urea-based fertilisers have been carried out on broccoli, cabbage, cauliflower, Chinese cabbage, kohlrabi, pak-choi and vegetable kale. Most of these trials have been restricted to one or two isolated sites in Europe, USA, Asia and New Zealand over periods of up to 2 years. With few exceptions, the soils were below pH 7.0, although the more acid soils were normally limed before the experiments were started, so actual differences in pH may have been relatively small.
Generally, the crops were quite responsive to applications of urea (compared with zero N plots), where N residues in the soil were low, although accurate estimates of optimum N dressings were often difficult because of the limited numbers of application rates. However responses up to 250 and 200 kg N/ha have been observed for cabbage (Wiedenfeld, 1986b) and Chinese cabbage (Cheng et al., 2002) respectively. By comparison, broccoli grown following a green manure crop (Schroeder et al., 1998) only responded up to 84 kg N/ha of urea applied before planting. There was no evidence of toxic effects from the urea in these experiments, as heavier applications did not suppress broccoli yields and the urea treatments had less of an effect on plant stand than the green manure residues. Similar responses have been observed for collard with or without a green manure although responses varied between years (Itulya et al., 1997). In one alkaline soil (pH 7.8), cabbage responded more strongly to urea phosphate mixtures, largely because the acidity of this fertiliser and its added phosphate helped to overcome P immobilisation which tends to occur at high pH (Rubeiz et al., 1989). Brassica crops also have high S requirements and can benefit from applying gypsum (CaSO4) with urea (Ahmad et al., 1999).
With few exceptions, urea performed quite well in comparisons against other N sources in the field. For example, yields of cabbage (Sharma et al., 1976; Smith and Hadley, 1992), turnip greens (Sharma et al., 1976) and vegetable kale (Widdowson et al., 1960) grown with urea were not significantly different than for crops grown with AS or AN. In another study, yields of turnip greens fertilised with urea even exceeded equivalent dressings of poultry litter (Alsup et al., 2002b). Several controlled release forms of urea have also been shown to act as perfectly acceptable sources of N, including SCU on cabbage (Sharma et al., 1976; Wiedenfeld, 1986b) and PCU on Chinese cabbage (Cheng et al., 2002) and pak-choi (Akiyama and Tsuruta, 2002). SCU treatments even out-yielded urea in trials with cauliflower (Kotur, 1993) and turnip greens (Sharma et al., 1976).
Where urea did fare less well than other forms of N fertiliser under field conditions, the differences were generally statistically significant but small, as for example, with Chinese cabbage (Vavrina et al., 1993).
document.doc 33

‘Evaluation of urea-based nitrogen fertilisers’ Report for Defra projects NT2601/02
However, both urea and ammonium forms of N caused significant adverse effects on cauliflower (Pimpini et al, 1971). Kohlrabi grown in peat with a mixture of urea and AS (applied as a supergranule under the CULTAN system) also produced plants with glaucous leaves due to changes in their epicuticular wax and chlorophyll contents (Blanke et al., 1996). The latter was attributed to uptake of ammonium from its localised accumulation in the peat. Comparisons of urea with other N sources have shown lower yields of other brassica species on a heavy clay loam soil, but not on a lighter sand (Grant et al., 2002).
Hydroponic studies on Chinese cabbage suggest that reduced growth from urea application may be caused by a toxic reaction to ammonium ions formed by the hydrolysis of urea in the rooting medium, producing plants with stunted shoots and roots, and leaves with reduced turgor (Luo et al., 1993). A mild manifestation of such a response is the most likely cause of the reduced growth observed in soil culture, where urea hydrolysis is normally rapid. Indirect evidence in support of this comes from a hydroponic experiment with pak-choi, in which partial substitution of nitrate with up to 25% urea actually increased growth (Zhu et al., 1997). However, a direct toxic reaction to urea cannot be ruled out in other brassica species. For example, hydroponically grown rape plants showing mild visual symptoms of toxicity (pale chlorotic leaves) had higher concentrations of molecular urea in their tissues (Gerendas and Sattelmacher, 1997a; 1999), but when nickel (Ni) was added to the nutrient solution to stimulate endogeneous urease activity, both toxicity symptoms and urea accumulation declined.
5.3.2 Lettuce and spinachData on the response of lettuce to urea have been collated from a number of trials in Europe (including UK), USA and Egypt grown either under protection (in soil or hydroponically using nutrient film technique, NFT) or in the open field to reflect the different growing systems and environments used in UK production. Most of these experiments were carried out at single sites over 1 or 2 years using one variety, but two of the reports examined the responses of 2 or 3 different cultivars. No UK trials on the use of urea on spinach were identified, but data was available for soil-grown crops in USA, Denmark and Egypt, and for soil- or NFT-grown crops in Japan.
Lettuce crops responded to increasing rates of N up to between 112 and 138 kg N/ha, with a tendency for yields to decline thereafter. There was no evidence of any differences in optimum fertiliser rates between different N sources (Richardson and Hardgrave, 1992; Walworth et al., 1992). However, the size of the yield response was strongly dependent on the form of the N applied. For the large majority of soil-grown crops, yields from urea were consistently lower than those fed on ammonium and/or nitrate (Bakr and Gawish, 1997; Smith and Harrison, 1991), with no apparent differences between varieties (Richardson and Hardgrave, 1992). At moderate application rates these effects were generally not large, but at higher rates evidence of visual symptoms of ammonium toxicity (stunted plants with blue-green leaves) and yield reductions of up to 40% have been reported (Smith and Harrison, 1991). In two trials, there were little detectable differences in yield between urea and either AN or CN (Pew et al., 1983; Walworth et al., 1992), despite distinct signs of urea damage when applied at a single rate of 168 kg N/ha as a base dressing (Pew et al., 1983). However, even when overall yield differences from the various N sources were small, applications of urea were often reported to produce a larger proportion of small heads (Pew et al., 1983; Richardson and Hardgrave, 1992).
Stone et al. (2000) examined the responses of lettuce to eutectic mixtures of urea and AN (UAN), and showed that liquid UAN injected below and to the side of the seed drill produced similar yields to equivalent broadcast dressings of AN. In a second experiment, liquid UAN proved to be less effective than ammonium phosphate as a starter fertiliser, but was equally as good as granular AN when supplementing a starter dressing of ammonium phosphate injected below the seed at drilling. This suggests that lettuce plants are more sensitive to UAN in the seedling stage, perhaps due to osmotic effects or to direct or indirect effects of urea. Experiments in the USA have shown that splitting the applications of urea or applying it in controlled release forms (as SCU or MU) can reduce the risk of urea damage to young plants (Pew et al., 1983).
There is also evidence that lettuce grown hydroponically can respond adversely to urea. Lettuce plants showed 20% less growth when fed continuously on a nutrient solution in which 50 or 100% of the nitrate-N had been
document.doc 34
‘Evaluation of urea-based nitrogen fertilisers’ Report for Defra projects NT2601/02
replaced with urea (Luo et al., 1993). The plants grown in the urea treatments showed visual toxicity symptoms (discoloured roots, stunted shoots and leaves with a tendency to wilt) possibly because of the observed increase in ammonia concentrations in the roots. Smaller reductions in head weight at maturity have been observed for 2 cultivars of lettuce grown in NFT when 20% of the nitrate in the nutrient solution was substituted with either urea of ammonium forms of N (Gunes et al., 1995), although this effect was not always duplicated (Gunes et al., 1994), and in other experiments plants tolerated up to 75% of the N as urea before showing adverse effects on growth (Zhu et al., 2000).
Spinach plants are also generally believed to prefer nitrate as their main source of N. However, with one exception, where urea was reported as performing less well than CN, AS, or mixtures of the two (Bakr and Gawish, 1997), most of the results suggest there is little difference between different N sources. Comparisons of the yield of three varieties on two sites showed no evidence of any differences between urea, AN or (in one experiment) KN (Barker et al., 1971). Similar results were observed when two varieties of spinach were grown for seed in a series of experiments in Denmark (Nordestgaard, 1978). Seed yields were statistically indistinguishable irrespective of whether the crop was grown with urea, CN, CAN or a commercial compound fertiliser. In another trial, urea incorporated in the soil as a base dressing (followed by a top dressing with a mixture of AS and nitrate) was as effective as the best application of poultry litter (Alsup et al., 2002b).
These observations are consistent with data for spinach plants grown hydroponically, where 20% substitution of nitrate with urea actually enhanced growth, particularly when Ni was added to the nutrient solution (Khan et al., 1999; 2000). Nickel acts as a co-factor for the enzyme urease, and concentrations as low as 0.01 mg/l in the nutrient solution can substantially reduce the accumulation of urea in spinach shoots (Khan et al., 1999).
Both lettuce and spinach have a tendency to accumulate nitrate in their shoots and, as such, are subject to EU legislation on maxium permitted nitrate contents (Anon, 2001). There is, therefore, considerable interest in the use of alternative sources of N to minimise the risk of nitrate accumulation in these crops. Applying N fertiliser largely or wholly as urea was found to reduce lettuce nitrate concentrations in a number of experiments (Bakr and Gawish, 1997; Barker et al., 1971; Gunes et al., 1994; Richardson and Hardgrave, 1992; Zhu et al., 2000), although this was often associated with a reduction in yield (see above). Other trials found no discernable difference in nitrate accumulation from equivalent rates of different N sources (Gunes et al., 1995; Pew et al., 1983; Stone, 2000). Montemurro et al. (1998) also showed that combining the nitrification inhibitor DCD with urea fertiliser reduced the nitrate content of lettuce significantly, whereas the urease inhibitor N-(n-butyl)-thiophosphoric triamide (nBTPT) had no effect. In spinach, substituting urea either partly (Khan et al., 1999; 2000) or completely (especially late in growth, Barker et al., 1971) for nitrate fertiliser also reduced nitrate accumulation, as did controlled release forms of urea (Omodi et al., 2000). However, in another trial, urea unexpectedly increased both nitrate and oxalate concentrations in spinach shoots compared with CN or AS (Bakr and Gawish, 1997).
5.3.3 Allium cropsWork on allium crops has largely focussed on onion, with most of the field experiments carried out in Europe and USA. In the UK, experiments showed that UAN solution and AN were equally effective at rates up to 240 kg N/ha when injected as a side dressing (below seed depth) to supplement an ammonium phosphate starter dressing, with yields either matching or exceeding those from standard broadcast dressings of AN (Stone, 2000). Responses were unaffected by incorporating nitrapyrin nitrification inhibitor with UAN, but were smaller when UAN (even at the lowest rate) was injected closer to the seed. This was probably due to a slight osmotic effect rather than from urea toxicity.
Separate studies have shown that germination and emergence of onion and leeks decline with application rate up to 225 kg N/ha, irrespective of N source when urea, CAN and CN were compared (Henriksen, 1979). However, hydroponic studies have shown that partial substitution of nitrate with either urea or ammonium in the nutrient solution can reduce the growth rate of young onion plants in some situations (Inal and Tarakcioglu, 2001), but not others (Gunes et al., 1996; Inal et al., 1995). Although urea is unlikely to persist for long in normal field production, maximum yields of garlic bulbs were less with urea than with AN (Alcantar et al.,
document.doc 35
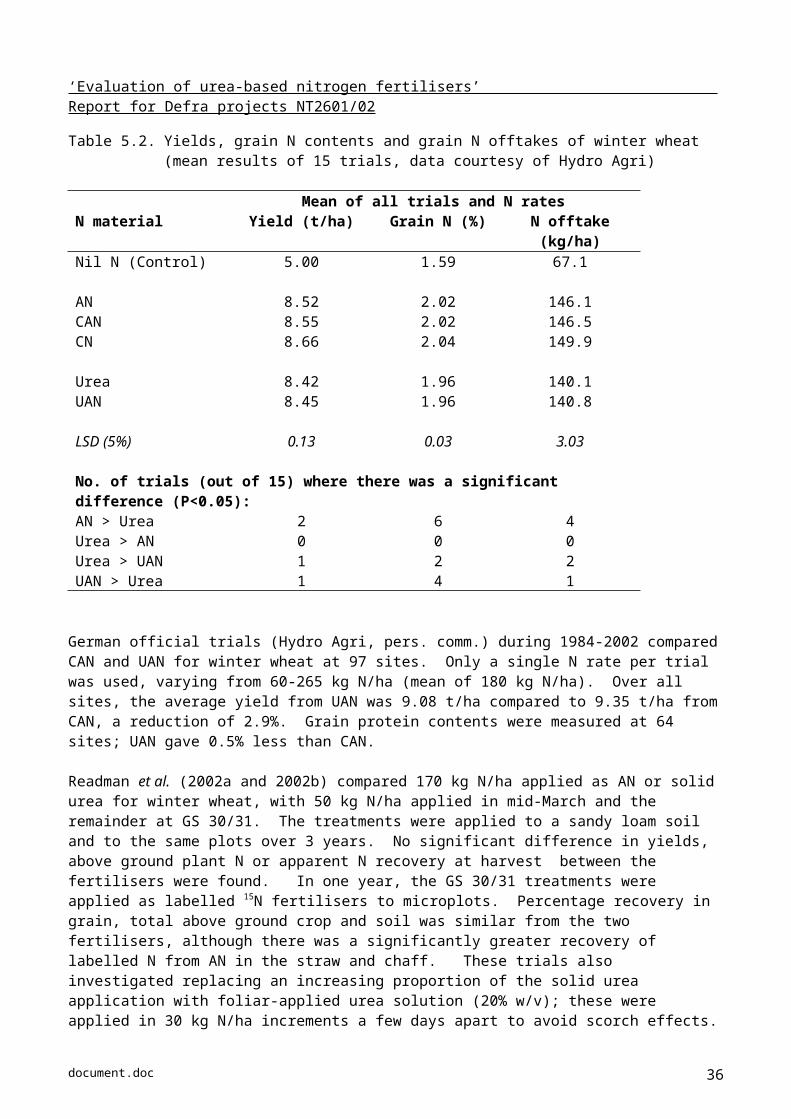
‘Evaluation of urea-based nitrogen fertilisers’ Report for Defra projects NT2601/02
2002). However, Fenn et al. (1991) have demonstrated that at least some of the adverse effects of urea on onion yield arises from the release of ammonium ions in the soil, but that this can be partly alleviated by additions of calcium chloride which enhance nitrogen use efficiency.
In the USA, it has also been shown that splitting applications of urea, or replacing part of it with polymer coated urea (PCU) or SCU can increase onion yield (Brown et al., 1988; Drost et al., 2002) by reducing salt damage, although equivalent applications of MU failed to provide an adequate N supply to maintain growth (Wiedenfeld, 1986b).
5.3.4 Sweet corn, peas and beansTwo reports on an experiment with sweet corn showed that the crop responded to urea, AS or AN up to 150 kg N/ha, but that total yields were slightly larger with AS and slightly smaller with AN (Salardini et al., 1992a; 1992b). Differences were, however, quite small, with little or no effect on nitrogen use efficiency from the various N sources. In view of its relative cheapness, the authors recommend urea as the preferred N source for sweet corn in Australia. In other trials, there were little or no differences in yield of sweet corn grown with either urea or poultry litter applied at an equivalent rate over a two year period (Alsup et al., 2002a).
Growth of green (French) bean seedlings in sand culture varied between N sources over a 3 week period, with the pattern of dry matter production declining from nitrate, through AN, and urea to ammonium fed conditions (Wallace and Ashcroft, 1956). Reductions in growth from urea were relatively small, but ammonium (as the sole N source) proved to be particularly toxic. The difference in response between urea and ammonium fed conditions suggests that most of the urea was taken up in molecular form, confirming the conclusions of Hentschel (1976). The experiment was terminated before the crop matured, so no data on pod yield were presented, although these are normally found to reflect the total dry weights of the plants at flowering. However, an experiment with another type of green bean showed that urea split dressings (applied to supplement a small AS starter treatment) gave yields which exceeded normal farmer practice, especially when a small dressing was included at flowering (Yinbo et al., 1997).
No studies of the effects of urea on the yield of the pea crop were identified, but anatomical investigations using scanning electron microscopy revealed significant differences between the chloroplasts of urea and nitrate fed plants, with severe reductions in storage structures (starch granules, lipid drops) in the former, indicating active outflow of assimilates (especially carbohydrates) from the leaves (Zernova, 1993).
5.3.5 Root VegetablesStudies on these crops have largely focussed on red beet, because of its ability to accumulate nitrate in the same way as lettuce and spinach (Maynard et al., 1976). There were no yield differences reported from comparisons of urea and AN on red beet in trials in Finland (Kallio et al., 1982), although dry matter percentage of the roots was somewhat higher in the latter. This contrasts with results for sugar beet, where urea has been found to produce larger roots (Vanbeusichem and Neeteson, 1982) and increased sugar yield, especially when the nBTPT urease inhibitor was present (Bayrakli and Gezgin, 1996). Urea also reduces nitrate contents of red beet roots compared with nitrate forms of fertiliser (Kallio et al., 1982; Peck et al.,1971), and including nitrapyrin (nitification inhibitor) with the fertiliser can reduce nitrate accumulation still further (Kallio et al., 1980; 1982). However, there is some evidence that when nitrapyrin is applied with urea, more nitrapyrin accumulates in red beet than when it is combined with calcium or AN (Kallio and Sandholm, 1982).
Concerns about the influence on crop quality from interactions in the uptake of ammonium (released by the hydrolysis of urea fertiliser) and calcium, prompted Fenn et al. (1994) to examine the effects of adding calcium chloride to the solution of urea injected as three equal split applications to red beet. Incorporating calcium increased yields by an average of 26% over a 3 year period, even though the soil had a free calcium carbonate content of more than 10%. Similar responses have been observed with onions grown in the same soil (Fenn et al., 1991). This may also explain why yields of sugar beet were greater when fertilised with CAN than either urea or UAN (Brentrup et al., 2001).
document.doc 36

‘Evaluation of urea-based nitrogen fertilisers’ Report for Defra projects NT2601/02
Information for other root crops is restricted to a report on radish and carrot grown with urea or with three formulations of MU (of differing solubility) as part of a cropping sequence in a mixture of sand and soil in pots (Tlustos et al., 2002). Yields of radish bulbs increased with N rate, but were lower with urea than with the most soluble forms of MU, and similar to the other MU formulations. It was unclear whether this difference was caused by a slight toxic reaction in the urea treatment. Yields of carrot grown in the same soil (following the radish and a subsequent unfertilised lettuce crop) also increased with N rate, but were slightly greater from the two more insoluble formulations of MU, possibly because the N supply was enhanced from unused residues of the same fertilisers remaining from the earlier radish crop.
5.3.6 PotatoNumerous experiments to evaluate the use of urea have been conducted with potatoes, including trials in Europe, North America and Asia. Several reports refer to multiple trials carried out on a series of sites in the UK (Devine and Holmes, 1963b; Widdowson et al., 1960), Canada (MacLean, 1983; Sanderson and White, 1987; Giroux, 1984) and the USA (Tyler et al., 1962), typically over 2 to 4 years. Other papers cite results from repeated experiments on the same site over periods of up to 5 years (Bundy et al., 1986; Lorenz et al., 1974).
Most experiments show a clear curvilinear response to increasing rates of urea with an optimum dressing which typically varies from around 130 kg N/ha to as much as 240 kg N/ha (e.g. Bundy et al., 1986; Lorenz et al., 1974; Sanderson and White, 1987) although lower optima were observed in specific circumstances, for example, when soil residual N levels were larger. At higher rates of urea, yields normally remained approximately constant or declined slightly (Sanderson and White, 1987).
Direct comparison of the responses to urea with those to other N sources (including AS, AN, ammonium chloride, CAN and CN either alone or in combination) have been reported in a number of papers. Results tend to vary between experiments. In the largest series of trials (Devine and Holmes, 1963b), average tuber yields from urea were 84% of those from AS at 120 kg N/ha over all sites, with urea giving lower yields on 15 sites and slightly higher yields on 7 sites. Statistical analysis of the results revealed no consistent effect of soil pH or texture, region of the country, or N application method. Results from other UK experiments on the other hand showed no consistent difference in responses to urea or AS when data for a high biuret-urea source were excluded (Widdowson et al., 1960). Parallel multi-site comparisons of urea and AN in Canada revealed similar results. Sanderson and White (1987) found that tuber yields increased to around 135 kg N/ha for the two N sources and although responses varied between experiments over the 6 sites, the pattern of results were similar for both, with no obvious differences between three cultivars tested. However, yields from urea were less than those from AN in about half of the experiments and were seldom significantly larger in the remainder except in isolated treatments. Giroux (1984) also reported lower yields from urea on sandy soils with optimum N rates of 140 and 210 kg N/ha for urea and AN respectively. However, on another site there was no difference in maximum yields from the two N sources, but 10% more N (as urea) had to be applied to achieve them (Giroux, 1984). Similar results were observed by Tyler et al. (1962) on sandy and loamy sand soils, where crops given AS out-yielded those given urea in almost every treatment. In contrast, the studies of MacLean (1983) did not reveal any significant yield differences between a range of N sources on heavier textured soils.
The results from these multi-site trials are broadly consistent with other smaller trials. These showed that urea produced lower yields than AS in six of the studies (Barker et al., 1980; Bundy et al., 1986; Lorenz et al., 1974; Sharma, 1991; Sharma and Grewal, 1987; Sharma and Singh, 1991) and only matched its performance in two others (Maier et al. 2002; Murphy and Goven, 1966). On balance, urea performed marginally better against AN or CAN, with lower yields in only three of the studies (Penny et al., 1984; Sud et al., 1991; Widdowson et al., 1960) and no significant differences in the remainder (Bundy et al., 1986; Maier et al. 2002; Murphy and Goven, 1966; Sharma et al., 1986). Similar comparisons with CN fertiliser showed that urea matched its performance in one study (Maier et al. 2002) and was either better (Bundy et al., 1986) or worse (Sud et al., 1991) in two others.
document.doc 37
‘Evaluation of urea-based nitrogen fertilisers’ Report for Defra projects NT2601/02
The causes of the reduced yields with urea were not always clear, although it is generally agreed that urea toxicity per se is unlikely because of its rapid conversion to ammonium or nitrate. There is some evidence that urea can reduce emergence, particularly from banded applications in neutral or alkaline soils (Sharma and Grewal, 1987; Sud et al., 1991), probably from ammonia damage to the young plants, although as long as the resultant thinning of the canopy is not too great this may not be reflected in reduced tuber yield. Growth suppression from localised accumulation of ammonium or nitrite around the roots has also been postulated (Meisinger et al., 1978) and blamed for the appearance of toxicity symptoms (Sanderson and White, 1987; Giroux, 1984) even though the soils at many of these sites were distinctly acid and would not be expected to release ammonia in significant quantities.
Trials have also been carried out with various slow or controlled release formulations of urea, including SCU or PCU (each with different release rates) and IBDU and MU which release N by either microbial or chemical hydrolysis. These products have the potential to reduce the risk of urea damaging early growth in addition to protecting against environmental damage from denitrification or leaching during the growth season. However, in general, the results were disappointing. Yields from applications of IBDU, MU or SCU were generally less than soluble N sources including urea applied either at planting or in split dressings, largely because the rates of N supply were too slow to maintain plant growth (Elkashif et al., 1983; Lorenz et al., 1974; Martin et al., 1993; Penny et al., 1984; Waddell et al., 1999). Only the PCU formulations proved able to match (Shoji et al., 2001) or exceed (Zvomuya and Rosen, 2001) equivalent broadcast or split applications of urea, which (in the latter case) were partly attributed to reduced losses of N2O.
5.3.7 Tomato, cucumber and pepperAlthough most commercial production of tomato, cucumber and pepper crops is currently carried out in hydroponic systems, a small proportion are also grown in soil under protection. There are a number of references to both types of culture in the scientific literature, so both will be considered here.
5.3.7.1 Soil cultureMost of the studies relate to one or more experiments on up to two (for pepper) or three sites (for tomato) in the USA, under conditions (soils and climates) similar to those prevalent in UK protected environments. Responses vary between soils or sites, largely because of differences in mineral N residues from previous crops or in N released by mineralisation during growth. However, there is also evidence of adverse effects from the use of urea as a fertiliser in some experiments.
Optimum application rates of urea on pepper varied from about 75 kg N/ha (Haynes, 1988) to between 140 (Locascio et al., 1981) and 160 kg N/ha (Hartz et al., 1993), with fertigation making more efficient use of N than preplant treatments where comparisons were made. Higher rates generally did not suppress yields greatly, suggesting that any toxic effects on this crop were relatively small, although there is some evidence that urea can increase soil aluminium (Al) to potentially harmful levels as a result of acidification from hydrolysis and nitrification of the urea (Haynes, 1988). However, as with many other crops, it is important to protect pepper seedlings from urea damage. A pot experiment with 2 varieties in sandy and clay loam soils fertilised at a range of N rates produced plants with marginal scorch and necrosis on leaves (Gabal, 1982) at all applications of urea. The effect was more pronounced in the sandy soil, especially at higher glasshouse temperatures. Similar symptoms were exhibited at high AS applications but not when calcium nitrate was used. This indicates that either urea had a specific toxic effect or that it generated high localised ammonia concentrations which damaged the seedlings. This damage was reflected in reduced yields relative to the ammonium and nitrate N sources, especially in early harvests. Applying controlled release forms of urea (SCU, PCU, MU) may reduce the risk of seedling damage and can be effective sources of N, provided their release rate meets the demand of the crop. Optimum application rates span from 90 to 134 kg N/ha (Wiedenfeld, 1986a) and from 135 to 180 kg N/ha (Guertal, 2000). These are similar to those for soluble urea have been observed, although Locasio et al. (1981) found that slightly higher rates were sometimes required to achieve the same yields from the controlled release forms. They also showed that applications of urea could match the performance of AN or AS, particularly if it was banded to the side of the crop.
document.doc 38

‘Evaluation of urea-based nitrogen fertilisers’ Report for Defra projects NT2601/02
Measurements of the response of soil-grown tomato to soluble urea are limited. Experiments over 2 years at one site showed that the total yield responses over whole seasons were consistently small, with optimum application rates of only up to a maximum of 68 kg N/ha for 2 varieties with contrasting indeterminate and determinate growth habits (Taber, 2001). This poor response may have been due to the high mineralisation rate measured in this soil. Alternatively, although yields were not significantly depressed at higher rates, there may have been some toxic reaction to the urea, because the proportion of unmarketable fruit was consistently large across all urea treatments in these experiments.
Toxic effects of urea have been observed in some experiments, but not others. Comparisons of growth responses to urea, ammonium and nitrate forms (applied daily in nutrient solution) showed that growth rates were smallest with ammonium-fed plants, with urea fed plants either similar to (sand culture) or smaller than (soil culture) than those fed on nitrate (Barker and Corey, 1990). The adverse effects of urea were partly offset by increasing the K concentration in the liquid feed. Ammonium and urea fed plants exhibited different visual symptoms of toxicity. Lower leaves of plants grown on urea were slightly chlorotic and these symptoms were made more acute by the application of the phenylphosphorodiamidate (PPD) urease inhibitor which produced severe marginal foliar burns typical of heavy urea damage. In contrast, plants treated with the nitrification inhibitor nitropyrin showed increased incidence of stem lesions associated with enhanced uptake of ammonium. Urea-fed plants treated with PPD also produced more ethylene, indicating a higher level of stress than the other treatments. These results compare with other experiments in three different soil types where the response to a single preplant application of urea was less than that to an equivalent rate of AS (Abdullatif and Stroehlein, 1990). However, it is likely that applying urea in a single large dose to the soil before planting may have been more detrimental to plant growth than more frequent smaller applications, especially as growth reductions from urea were greater in a loamy sand than in sandy loam or loam soils.
Tomato crops grown with various controlled release formulations of urea (SCU, PCU, MU) either alone (Shelton, 1976) or in combination with soluble forms of N (as AN with or without KN, Csizinszky, 1994; Shelton, 1976) responded to applications of between 195 and 294 kg N/ha or to at least 392 kg N/ha respectively, without evidence of any detrimental effects from the urea. Indeed, formulations of SCU (with either medium or fast release rates) produced marketable yields which were indistinguishable from split applications of AN (Sharma et al., 1976; Shelton, 1976). Various combinations of SCU and AN were also high yielding (although fruit acidity increased when more AN was present, Mcardle and Mcclurg, 1986), but a PCU formulation applied at 224 kg N/ha (either as a base or in various split dressings) yielded less than AN over the whole season, especially when a larger proportion of the latter was applied by fertigation (Motis et al., 1998).
Urea toxicity may also occur with soil-grown cucumber crops. Delayed urea hydrolysis from applying 3-amino-2, 5-dichlorobenzoate (a urease inhibitor) with methylene urea was found to produce plants with pale green leaves (typical of incipient N deficiency) and yield reductions of 20% compared to treatments without the inhibitor (Hankin and Hill, 1982). However, no papers reporting the responses of cucumber to soluble forms of urea could be located.
5.3.7.2 Hydroponic cultureAlthough commercial tomato and cucumber crops in the UK are largely grown hydroponically (in rockwool or NFT systems) using nutrient feeds consisting mainly of nitrate (with some ammonium), there has been considerable interest in the possibility of substituting all or part of these with urea for economic and other reasons. However, a number of studies (both in the short term and with long season crops) have shown that urea can have adverse effects on plant growth, especially in the early growth stages.
Over a 3 week period, root and shoot growth of young tomato plants was much larger when fed on nitrate than on either ammonium or urea as the sole N source (Ikeda and Tan, 1998). There were significant growth responses to increasing solution concentrations of the different N forms, with plant dry weights peaking between 84 and 168 mg N/l for nitrate and at 168 mg N/l for urea. Largest growth rates for ammonium fed plants occurred at 28 mg N/l (the lowest concentrations tested) but declined strongly at higher concentrations.
document.doc 39
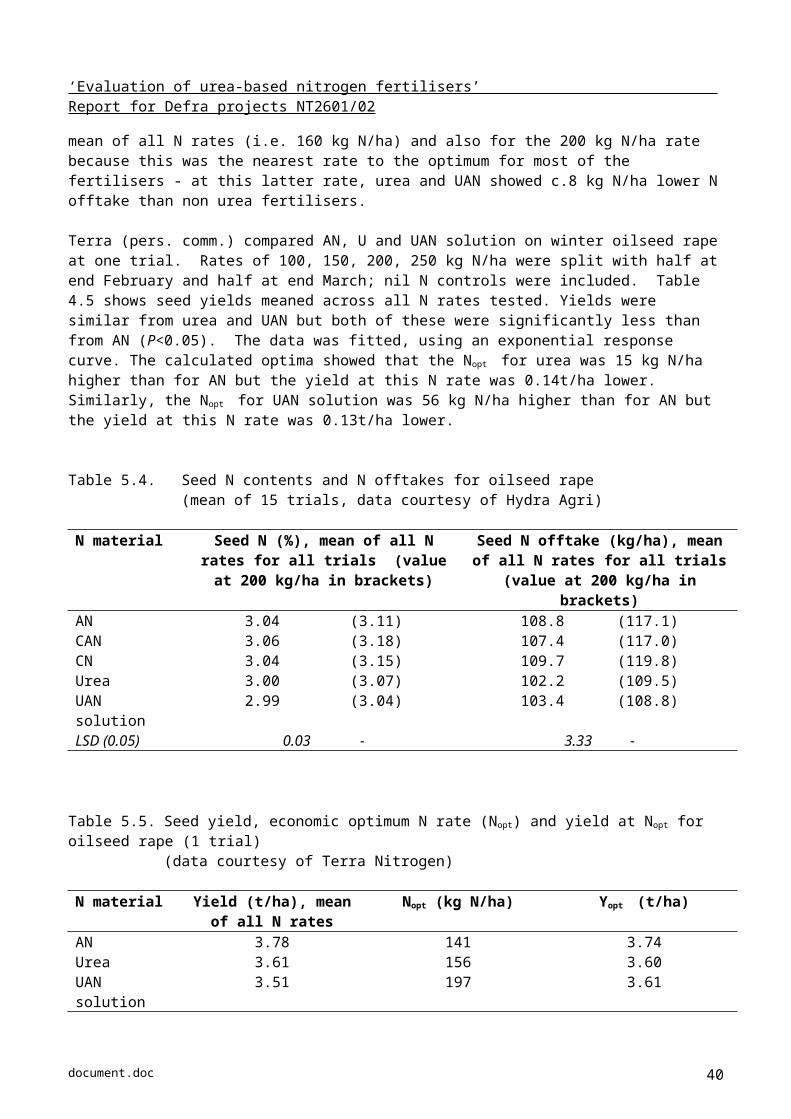
‘Evaluation of urea-based nitrogen fertilisers’ Report for Defra projects NT2601/02
At these optimum concentrations, maxium plant dry weights were largest for nitrate and smallest for urea. Paired combinations of urea with either nitrate or ammonium (each at 84 mg N/l) gave intermediate growth responses to the individual N sources (at 168 kg N/ha):
(NH4 + NO3) - N > NO3 - N > (urea + NO3) - N > urea - N > (urea + NH4) - N > NH4 - N
suggesting the contribution of each N form may be additive. The same relative pattern of growth response at similar concentrations of the individual N sources have also been observed by others (Kirkby and Mengel, 1967; Qasem and Hill, 1993). However, it is clear from the different sensitivities of tomato to the three N forms (Ikeda and Tan, 1998), that the relative performance of ammonium fed plants would have been improved had the comparison been made at lower concentrations.
These adverse growth responses are often associated with visual symptoms of toxicity. Plants fed on urea produced smaller shoots with an appearance of N deficiency at 28 mg N/l, and necrotic leaf margins at higher concentration (336 mg N/l), although roots were little affected (Ikeda and Tan, 1998). These symptoms were different to those on ammonium fed plants where leaves were darker green and exhibited partial yellowing, mottled chlorosis, curling and wilting, stem lesions, and short stubby roots at concentrations above 84 mg N/l (Barker and Corey, 1990; Ikeda and Tan, 1998; Kirkby and Mengel, 1967; Qasem and Hill, 1993). In other studies, Feng and Barker (1992) showed that urea toxicity symptoms were reduced if the pH of the hydroponic solution was maintained at pH 6.5, rather than allowed to decline to, or be maintained at pH 3.5. Maintaining the solution at pH 3.5 also caused further reductions in shoot growth.
Nickel is an important micronutrient for higher plants (Brown et al., 1987) where it is believed to act as an essential cofactor for the enzyme urease which is used to hydrolyse urea before it is assimilated into amino acids within the plant. Tan et al. (2000a) showed that some of the adverse effects of urea could be reduced by adding nickel to the nutrient solution. Optimum concentrations of 0.1 mg Ni/l completely eliminated any visual symptoms of urea toxicity and increased chlorophyll contents, although growth rates were still only 80% of those for nitrate fed plants. The most likely cause is that urea is a less efficient source of N than nitrate.
Evidence in support of this is provided by the results of pulse-chase studies with 15N labelled urea, sodium nitrate or AS over 24 hour periods at different stages of growth (Tan et al., 2000b). These studies confirmed that uptake, translocation and assimilation of urea were much slower than for nitrate in the seedling stage, although the differences became smaller in the reproductive stages of growth. This led the authors to speculate that urea might be a suitable source of N for hydroponic tomatoes during fruit production. However, as their plants were fed mainly on nitrate between the relatively short (24 hour) exposures to urea, further work would be needed to ensure there were no long term effects of urea accumulation in the shoots.
Hydroponic studies with cucumber show similar responses to urea in the early stages of growth. Fresh weights of transplants grown for a month with urea as the sole source of N were 56% smaller than those grown in a solution consisting mainly of nitrate, with intermediate responses to AN solutions (Heuer, 1991). Unlike tomato, urea produced no differential effects on shoot and root growth. Part of this response may have been caused by a decline in the pH of the nutrient solution in the urea treatment, which can increase the adverse effects of urea in some crops (Feng and Barker, 1992). However, the efficiency of urea in cucumber is also likely to be lower than for other N forms, because of an absence of urease in the roots of this crop (Bollard, 1959), which will restrict urea assimilation to the shoots. Urease activity was increased by adding nickel to the nutrient solution (0.59 mg Ni/l), reducing some of the toxic effects of urea, and increasing root growth by 36%. No studies of the effects of urea on mature cucumber crops were identified.
5.3.8 Other fruiting annual cropsA number of small trials have been carried out on the effects of soluble or controlled release forms of urea with various types of melon and squash (zucchini) crops grown in soil, none of which indicate any adverse effects on yield or quality. He et al. (1995) studied the responses of two types of melon to urea in the presence and absence of a calcium cyanimide formulation, which acts as an inhibitor of both urease and nitrification activity
document.doc 40

‘Evaluation of urea-based nitrogen fertilisers’ Report for Defra projects NT2601/02
in the soil. The inhibitor increased the yield of melon and watermelon by 5 and 20% respectively compared with urea alone, possibly because the crops prefer urea to ammonium N. Other studies with musk melon showed that SCU and MU produced identical yields as AS, irrespective of whether the N was applied in the base, at thinning or split (Wiedenfeld, 1986a). Applications of urea were also equivalent to the same rate of N from poultry litter (Alsup et al., 2002a). Urea phosphate applications proved to be a satisfactory source of N for an irrigated squash crop grown in a calcareous soil, although most of the responses are likely to have been due to the beneficial effects of P, both directly from the application itself and from soil P released by the acid reaction of the fertiliser (Rubeiz et al., 1989), much as was observed for tomato (Mikkelson and Jarrell, 1987).
However, zucchini transplants grown hydroponically are much more sensitive to urea. In one experiment, plants grown for 4 weeks were only 30 or 60% of the weight of those fed AN, depending on whether adequate concentrations of nickel were either absent or present respectively (Gerendas and Sattelmacher, 1997b). Plants grown without nickel were metabolically N deficient, with low amino N concentrations (despite high tissue concentrations of urea) and chlorotic leaves. In a separate comparison of six contrasting species, zucchini plants proved to be particularly sensitive to additions of nickel, which reduced urea accumulation by up to one hundred times in the plant (Gerendas and Sattelmacher, 1997a).
5.3.9 Toxic effects of urea fertiliser on horticultural cropsThere have been many examples of phytotoxic effects on plants arising from urea fertiliser. These are manifested in reduced growth and, in more extreme situations, through the appearance of visual toxicity symptoms, which are particularly prevalent in young plants. Symptoms range from pale leaves typical of incipient N deficiency (Gerendas and Sattelmacher, 1997a; Hankin and Hill, 1982; Ikeda and Tan, 1998) to plants with spindly shoots and leaves with chlorotic leaf margins or leaf tips which later become necrotic (Ikeda and Tan, 1998; Kirkby and Mengel, 1967). In most cases root systems are not seriously damaged by urea, and are usually almost as vigorous as for nitrate fed plants (Feng and Barker, 1992; Kirkby and Mengel, 1967; Tan et al., 2000a).
Toxicity symptoms are more noticeable in hydroponic systems and are associated directly to an accumulation of urea within the plant (Gerendas and Sattelmacher, 1997a; 1997b; Tan et al., 2000a). Some plant types appear to have the capacity to assimilate urea directly (Harper, 1984; Mothes, 1961) and may be more tolerant to higher concentrations of urea in their tissues. However, most rely on the presence of endogeneous urease to hydrolyse urea to carbon dioxide and ammonia, before the latter is assimilated. Several authors have shown that visual symptoms of urea toxicity are reduced or even eliminated where nickel is added to stimulate urease activity (Gerendas and Sattelmacher, 1997a; 1997b), despite the risk that ammonia can also become toxic if it accumulates in the plant (Harper, 1984). However, at best, growth rates are still lower than for nitrate fed plants (Tan et al., 2000a), especially with crops such as cucumber, which do not possess any urease activity in their roots (Bollard, 1959).
Although there is some evidence that urea can cause toxic symptoms in soil grown crops (Barker and Corey, 1990; Gabal, 1982; Giroux, 1984; Pew et al., 1983), its short residence time in most soils means that serious damage arising directly from urea is likely to be restricted to a relatively short period after application (Court et al., 1964; Maclean and Mcrae, 1987). In most soils, urea is rapidly hydrolysed to ammonium ions which are then adsorbed on the soil exchange matrix. This hydrolysis temporarily raises the soil pH, simultaneously increasing ammonia volatilisation in the soil and inhibiting nitrification processes (Harper, 1984). In some situations, significant localised concentrations of free ammonia can accumulate in the soil, and this can scorch both roots and shoots of sensitive young seedlings, reducing crop establishment and growth (Gabal, 1982; Sharma and Grewal, 1987; Sud et al., 1991). Although the severity of these effects vary with soil and weather conditions, ammonia damage is more likely in higher pH soils, or sandy soils (which have low cation exchange capacities), especially under dry conditions and at higher temperatures (Gabal, 1982). For example, Sanderson and White (1987) showed that yield responses in a series of potato trials were related to temperature and/or rainfall in the weeks either side of planting, due to the increased potential for free ammonia accumulation in the root zone and the associated risk of increased damage to newly emerging roots at this time.
document.doc 41
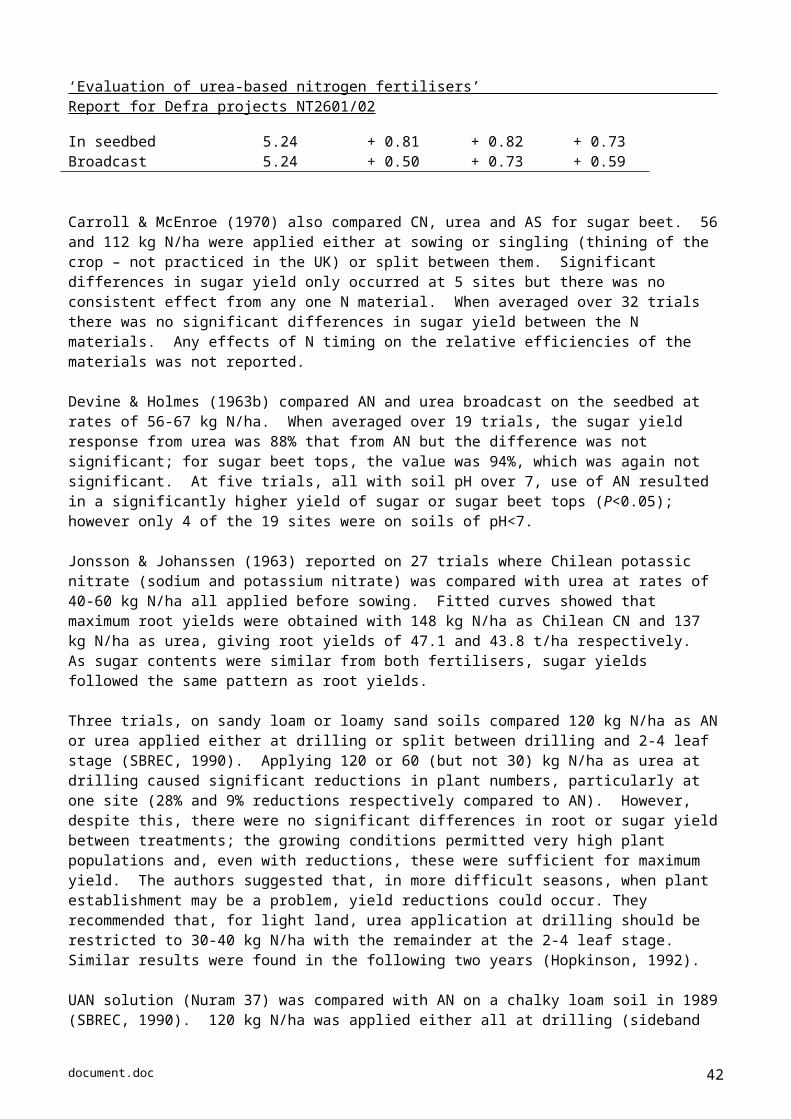
‘Evaluation of urea-based nitrogen fertilisers’ Report for Defra projects NT2601/02
The accumulation of ammonium ions in the soil encourages plants to take up N predominently in the ammonium form, which can also result in symptoms of toxicity (Ikeda and Tan, 1998; Kirkby and Mengel, 1967; Qasem and Hill, 1993). These predominate when nitrate (the preferred form of N for most crop plants) and/or cations, especially K (Barker and Corey, 1990) or Ca (Fenn et al., 1991; 1994) are low, due to the impact of ammonium uptake on the ion balance within the plant. These symptoms, which typically consist of stunted plants with dark green leaves, often with chlorotc or necrotic spots, and short stubby brown roots, are quite distinct from those observed for urea (Gabal, 1982; Ikeda and Tan, 1998). Other reports suggest that nitrite may also contribute to plant damage (e.g. Meisinger et al., 1978; Sanderson and White, 1987), although hard evidence for this is limited. Nitrite is undoubtedly toxic to plants, but it is normally oxidised rapidly and seldom accumulates in soil, even if fertilising with urea is more likely to create conditions conducive to nitrite accumulation in the soil (Court et al., 1964).
As the risk of urea damage to soil-grown crops appears to be greater in the early stages of growth, a number of approaches have been examined to protect the plants at this time. These include:
i) Placing urea to avoid close contact with the developing seedling, for example, using side banding (Cheng et al., 2002; Locascio et al., 1981; Stone, 2000) or supergranules (Blanke et al., 1996) instead of broadcasting.
ii) Splitting urea dressings to avoid high concentrations at the most vulnerable time, with part in the base and part as one or more top or side dressing subsequently (Barker et al., 1971; Brown et al., 1988; Salardini et al., 1992a).
iii) Applying urea in tandem with other forms of N either on its own as a supplementary dressing (Bundy et al., 1986; Rubeiz et al., 1989; Zvomuya and Rosen, 2001) or combined with other N sources to dilute any adverse effects, for example, as UAN (Grant et al., 2002; Hartz et al., 1993; Stone, 2000).
iv) Using controlled (or slow) release forms of urea either as single or split dressings to limit available concentrations of urea-N on the root zone (Brown et al., 1988; Cheng et al., 2002; Sharma et al., 1976; Wiedenfeld, 1986b; Zvomuya and Rosen, 2001).
v) Using urease (Barker and Corey, 1990; Feng and Barker, 1992; Hankin and Hill, 1982; Montemurro et al., 1998) or nitrification (Abdullatif and Stroehlein, 1990; Bakr and Gawish, 1997; Montemurro et al., 1998; Smith, S.R. and Hadley, P., 1992) inhibitors to modify the concentrations of urea, ammonium and nitrate present in the soil.
In general, placing or splitting urea applications, or combining them with other forms of N has proved to be quite successful, provided final dressings are not over-delayed. Controlled release fertilisers can also work well (and reduce the risk of leaching) but are more expensive and their release rates may not synchronise with crop demand for N. Application of urease inhibitors proved successful in reducing adverse effects on lettuce (Montemurro et al., 1998), but depend on the crop being tolerant to increased concentrations of urea (Hankin and Hill, 1982). As with nitrification inhibitors, their performance can be unpredictable and, as such, are unlikely to see widespread use.
5.3.10 Nitrogen use efficiency Few of the reference sources quoted refer to nitrogen use efficiency (NUE) explicitly. However, as NUE is defined as the weight of marketable produce per unit of N fertiliser applied, it follows that there is no difference in NUE where the same yields are obtained from different N sources applied at the same rate. This applies to a number of the experiments reported, particularly in cases where care has been taken to minimise any crop damage in the early stages of growth (e.g. Salardini et al., 1992a). However, in many experiments there is a tendency for NUE to be reduced because of lower yields in the urea treatments. Using data from one multiple series of trials on potato as an example, NUE for urea varied from 76 to 95% of that for AS when applied at an equivalent rates close to the optimum (Devine and Holmes, 1963b), due entirely to the differences in yield from the two forms of N. Similar comparisons are obtained with other N sources (Sanderson and White, 1987). Reduced yields in those situations are invariably caused by reduced N uptake by the crop, with the result that apparent recoveries of urea N are generally lower than for other forms of N (Barker et al., 1980; Bundy et al., 1986; Sharma and Grewal, 1987).
document.doc 42
‘Evaluation of urea-based nitrogen fertilisers’ Report for Defra projects NT2601/02
Similar examples of reduced NUE (due to lower yields) and/or poorer apparent N recoveries from urea have been reported for other crops, including cauliflower (Pimpini et al., 1971), Chinese cabbage (Vavrina et al., 1993), lettuce (Bakr and Gawish, 1997; Richardson and Hardgrave, 1992; Smith and Harrison, 1991), onion (Inal and Tarakcioglu, 2001), garlic (Alcantar et al., 2002), pepper (Gabal, 1982) and tomato (Ikeda and Tan, 1998; Tan et al., 2000b). Such responses are caused (at least in part) by the lower uptake rates of urea relative to nitrate or ammonium forms, particularly in the early stages of growth (Heuer 1991; Tan et al., 2000b). There are also less frequent examples where NUE is reduced because larger dressings of urea are required to achieve the same yield as for other forms of N either in soil (Giroux, 1984), or in hydroponic culture (Ikeda and Tan, 1998). However, such situations are relatively unusual, as are those where urea appears to increase NUE (Sharma et al., 1976; Stone, 2000).
5.3.11 Environmental impactsLower N uptake rates and percent recoveries of N from urea will maintain higher mineral N levels in the soil (Montemurro et al., 1998) and may, therefore, increase the risk of N losses to the environment by leaching or gaseous evolution. Being a neutral molecule, urea is only weakly adsorbed on most soils, making it vulnerable to leaching. In one experiment, urea was displaced to depths in excess of 60 cm in the soil beneath an onion crop, whereas N from an equivalent dressing of PCU remained largely in the top 10 to 15 cm (Drost et al., 2002). In another, leaching of N applications to a potato crop was reduced when SCU replaced urea (Waddell et al., 2000). However, once the urea has been hydrolysed to ammonium N, leaching losses will be reduced until the latter is transformed to nitrate by nitrification.
Temporary increases in soil pH following hydrolysis of urea increase the chance of ammonia volatilisation. Examples of damage to young crops as a result of ammonia volatilisation were described in the last section, but if conditions persist over several days there can be significant losses of ammonia from the soil, reducing the amounts of N available to crops and increasing aerial pollution. In one study, as much as 17% of an application of urea (at 105 kg N/ha) was lost from a pH 8.0 soil by ammonia volatilisation over a 24 day period, with most occurring in the first 4 days (Kissel and Cabrera, 1988). Losses from the same rate of IBDU were negligable over the same time period. Likewise in another experiment, 17% of N applied as urea at 60 kg N/ha were lost by volatilisation, although this was reduced to only 2% by incorporating the nBTPT urease inhibitor with the urea (Montemurro et al., 1998). Similar results were obtained over the lifetime of a beet crop, where 12.6% of the N added as urea was volatilised from a soil (pH 8.4), but this was almost halved by the addition of nBTPT (Bayrakli and Gezgin, 1996).
Applications of urea can also lead to increased losses of nitrous and nitric oxides (which are implicated in global warming) during nitrification of ammonium and denitrification of nitrate released after hydrolysis of urea. Although no direct comparisons of differences between urea and other soluble N sources have been made for horticultural crops, measurements have shown that evolution of N2O and NO from summer and autumn pak-choi crops were greater from PCU than from CN, although the magnitude of the losses were always less than 1% of the fertiliser applied (Akiyama and Tsuruta, 2002). Likewise, comparison of different urea application methods showed that losses of N2O and NO from a soil cropped with Chinese cabbage were greater from broadcast and from banded treatments respectively (Cheng et al., 2002). However, the losses again represented only a small proportion (less than 0.4%) of the 250 kg N/ha applied.
The environmental impacts of urea applications are discussed further in section 6.
5.4 ConclusionsArable 1. There is a large amount of international information on the agronomic efficiency of urea compared with
other N materials (such as AN) applied to arable crops, but mostly from trials carried out between 1960 and 1980 on winter cereals. The general consensus was that urea gave more variable results and sometimes only 80-90% of the yield produced from other solid N fertilisers. However, these trials were mostly carried
document.doc 43

‘Evaluation of urea-based nitrogen fertilisers’ Report for Defra projects NT2601/02
out with varieties no longer used and with N rates considerably less than used now (e.g. 50 kg N/ha for winter wheat). The few recent trials with winter-sown crops generally showed a yield reduction in the range 0-10%, rather than 10-20%. Yield reductions have largely been attributed to a reduction in the amount of crop available N because of ammonia volatilisation losses post application. Farmers have absorbed the information and assume that urea will be less effective than AN. They are likely to compensate for this, perhaps over-compensate, and apply more N. This could lead to even greater losses.
2. Some trials have reported higher yields at the optimum (Yopt) but lower economic optimum N rates (Nopt) from the use of AN or other nitrate fertilisers compared with urea-based materials; however, in most cases the statistical significance of any differences was not reported. Where errors could be estimated there was no significant difference in the mean Nopt.
3. Statistically significant decreases in wheat grain N content have been reported where urea was compared to AN, typically ranging between 0.05-0.15% N in wheat (0.3-0.9% protein at 100% DM). For oilseed rape, an overall reduction of 0.1% N was recorded.
4. A limited number of trials have investigated the effects of different timing strategies on the effectiveness of topdressed urea, but these have not shown any clear benefit from splitting urea applications. However, if ammonia loss is the main reason for urea inefficiency and ammonia loss rate increases proportionally with N application rate, then ‘splitting’ the application might reduce ammonia loss risks.
5. There were a few reports where the effectiveness of urea appeared to be lower on calcareous soils, perhaps because of slower hydrolysis limiting the availability of N at a critical growth stage or elevated ammonia losses. There appeared to be no effect of soil texture. Some trials indicated a positive relationship between the effectiveness of urea and rainfall, but most gave little or no information on the prevailing weather, soil moisture or wind conditions. Further research is needed to quantify the environmental and soil factors that control N loss processes and the agronomic effectiveness of urea-based materials.
6. The limited amount of research on the effectiveness of urea that had been incorporated into arable seedbeds did not record any adverse effects on germination or establishment of spring cereals where up to 90 kg N/ha had been applied. However, higher rates of seedbed N for spring cereals (and oilseed rape) are currently used in the UK. Combine-drilled urea can result in reduced establishment and crop yields, but this practice is not recommended in the UK.
7. For sugar beet, no significant differences in sugar yield between urea and other nitrogen fertilisers were recorded. Reductions in plant population occurred at 3 trials, where 60 or 120 kg N/ha as urea was applied in the seedbed, but this was unlikely at the normal seedbed recommendation of 40 kg N/ha.
8. A limited number of trials comparing UAN solution with urea and AN have shown that UAN commonly gives similar yields to urea (but occasionally less), but lower yields than with AN. Foliar applications of urea solution can increase cereal grain protein, but are associated with a poor N use efficiency.
Grassland9. Most grassland studies comparing urea with other N materials were carried out before 1985. The general
conclusion was that urea can have a similar effectiveness to CAN or AN for spring grass production, but some 5-15% lower effectiveness for summer production. Large yield reductions were observed on light textured soils and in dry weather periods. Rainfall and high temperatures in the 3 days after fertiliser application were also seen to reduce the effectiveness of urea.
Horticultural crops10. Many multi-site experiments evaluating the effectiveness of urea on potatoes have been carried out in
different countries, but relatively few on other vegetable crops. Most experiments have compared urea with AN and ammonium sulphate (AS). Responses tended to vary with soil type and weather conditions but, with a few exceptions, the pattern of results observed for potatoes also appeared to apply to many of the vegetable species: equivalent yields of most vegetable and potato crops can be obtained where urea is used as a fertiliser.
document.doc 44

‘Evaluation of urea-based nitrogen fertilisers’ Report for Defra projects NT2601/02
11. However, there were a notable number of reports where urea had produced lower yields. Examples included various brassicas (Chinese cabbage, cauliflower and Kohlrabi), lettuce, onion, garlic, green beans red beet, tomato, cucumber and pepper, in addition to potatoes. These reports far outnumbered those where urea produced larger yields, and suggest that there are likely to be additional risks associated with the widespread use of urea as a N fertiliser for horticultural crops. Reasons proposed to explain the lower yields were the same as those for arable and grass: reduced N availability (largely as a result of ammonia losses) and delayed uptake creating incipient N deficiency and phytotoxicity from urea, ammonium or nitrite ions.
12. The likelihood of adverse reactions to urea is greatest for young plants shortly after fertiliser application; partly because their tissues are more sensitive to damage, and partly because concentrations of urea and its transformation products tend to be greater in the soil at this time. Strategies to minimise damage to young plants are therefore based on avoiding high concentrations of urea in the seedbed. Of these, the most practical include placing or splitting the urea dressings, applying it as a slow- or controlled-release fertiliser, or using it in combination with other N sources (either as a mixture or on its own as a supplementary topdressing). However, it is important to ensure that there is an adequate N supply to meet crop demand, particularly in the early stages of growth, and this may require extra care with controlled release forms of urea.
document.doc 45
‘Evaluation of urea-based nitrogen fertilisers’ Report for Defra projects NT2601/02
6. Environmental impacts
(Overall lead authors: Keith Goulding, RR and Anne Bhogal, ADAS)
The potential agronomic problems of using urea as discussed in section 5 are important, but of equal concern is the environmental impact from any increased use of urea as a source of nitrogen fertiliser. This section reviews existing knowledge on the various potential environmental impacts that might result from an increased use of urea-based nitrogen fertilisers in the UK, including:
Ammonia emissions to air Nitrous oxide emissions to air Nitric oxide emissions to air Leaching or surface runoff of urea, NH4
+, NO3-, and NO2
- ions to surface waters
6.1 Ammonia emissions(Lead authors: David Chadwick, IGER; Anne Bhogal and J Webb, ADAS)
Atmospheric pollution with ammonia has impacts on the acidification of land and eutrophication of water. The UK has a commitment under the EU National Emissions Ceilings Directive and the UNECE Gothenburg Protocol to reduce ammonia emissions to 297kt NH3/yr by 2010 against emissions of about 348kt NH3/yr in 1999; these emission targets are expressed as NH3 not NH3-N. It has been estimated that there will be the following beneficial impacts from implementing the UNECE Gothenburg Protocol with respect to ammonia pollution (taken from http://www.unece.org/env/lrtap/multi_h1.htm):
1. The area in Europe with excessive levels of acidification will shrink from 93 million hectares in 1990 to 15 million hectares.
2. The area with excessive levels of eutrophication will fall from 165 million hectares in 1990 to 108 million hectares.
These projected beneficial effects from reduced ammonia emissions must be considered when assessing the potential impact of increasing the use of urea-based N fertilisers in place of AN.
6.1.1 Emissions from ureaA major environmental concern is that a significant change in practice away from AN towards urea could have a serious impact on the UK’s obligations to meet ammonia emission standards. Increased use of urea could therefore make it more difficult to achieve the UK commitments for emission reduction.
Ammonia emissions following urea applications have been an important focus of research, as this is the most commonly used fertiliser worldwide and has the greatest potential for NH3 loss. Urea is usually rapidly hydrolysed to ammonium carbonate ((NH4)2CO3) by the action of the enzyme urease upon contact with soils (section 4). This results in an increase in the soil pH up to c.9 around the fertiliser granule. Ammonium carbonate is highly unstable and readily dissociates into CO2, NH4
+ and consequently NH3 (due to the high pH). The increase in pH associated with urea hydrolysis therefore tends to mask any effect of the bulk soil pH, which is an important factor affecting NH3 emissions from ammonium-based fertilisers (particularly AS). The cation exchange capacity (CEC) of soils and environmental conditions post-spreading (soil moisture, temperature, rainfall and wind speed) are considered to be the most important factors affecting NH3 emissions from urea.
Urea hydrolysis tends to proceed most rapidly in warm, moist soils, where complete hydrolysis can occur within 2-4 days (Broadbent et al., 1958; O’Toole & Morgan, 1988). Windy conditions and low crop cover tend to increase the potential for NH3 volatilisation, by promoting removal of NH3 away from the soil surface.
document.doc 46
‘Evaluation of urea-based nitrogen fertilisers’ Report for Defra projects NT2601/02
However, short-term rainfall immediately after application can reduce volatilisation by washing urea into the soil profile. The amount of rain required will depend on the soil type and timing of rainfall relative to urea hydrolysis, but in most soils it is at least 10 –20 mm (Watson, 2000). Soils with a high CEC tend to reduce volatilisation due to fixation of ammonium ions on to soil cation exchange sites. For example, O’Toole & Morgan (1988) observed that NH3 emissions from urea were unlikely on soils with a buffered CEC (pH 8) > 250-260 milliequivalent/kg irrespective of the season of application, whereas there was a very high risk of NH3 volatilisation on soils with a CEC < 160 me/kg. The greatest risk of NH3 emissions from urea is therefore likely to occur on coarse-textured soils, with a low organic matter content and where there are low amounts of crop cover. High emission rates are also generally associated with drying soils, when urea is applied to wet (near field capacity) surface soils and followed by several days of little (<1 cm) or no rainfall (Hargrove, 1988).
The proportion of urea N emitted as NH3 has also been shown to increase with N application rate up to 200 kg/ha (Watson & Kilpatrick, 1991). This was attributed to an increase in the surface area affected by the rise in soil pH associated with urea hydrolysis. However, high urea concentrations were also shown to delay urea hydrolysis, with NH3 emissions peaking a lot later than at lower N application rates (Watson & Kilpatrick, 1991).
6.1.1.1 Measurements of ammonia emissionThe actual amount of NH3 emitted following urea applications and its effect on N use efficiency and crop performance is highly variable. Table 6.1 summarises and updates much of the information reviewed by Harrison & Webb (2001) on NH3 emission factors following urea. Losses from ammonium nitrate (AN) and calcium ammonium nitrate (CAN) have been included for comparision, where available.
Field measurements ranged from 4-47% and 6-46% of the urea N applied to arable crops and grassland, respectively. This compares with emissions of <4% of the N applied as AN or CAN (Table 6.1). Within the arable experiments, the greatest emissions have been measured from no-till systems (10-47%). These systems behave more like grasslands, where the incorporation and fixation of urea into soils is limited and entirely dependent on rainfall. Emission factors from cultivated cereals ranged from 4-19% (4 studies measuring NH3 emissions directly, Table 6.1). The magnitude of NH3 losses will depend to some extent on the method of measurement. Laboratory studies tend to produce larger emission factors (6-48%), as they are usually conducted under conditions that favour urea hydrolysis (warm and wet). This was acknowledged by Whitehead & Raistrick (1990), who suggested that field losses would be half those obtained in the laboratory. For field studies, wind tunnels are regarded as the most robust and accurate method of measuring NH3 emissions from small plot experiments, and the micrometerological mass balance method for field scale experiments (Nicholson, 2001).
Ammonia emission inventories have used a range of factors to calculate emissions from urea applications. Early work suggested an average emission factor of 10% of urea N applied (Sutton et al., 1994). More recently, van der Weerden & Jarvis (1997) considered these to be too low and suggested a factor of 23% for urea applications to grassland. This was based on their work (Table 6.1) and other field studies (on grasslands) at N application rates of < 200 kg/ha (higher rates were regarded as unrealistic). In the absence of many direct field measurements on arable soils (most of those quoted in Table 6.1 are either very recent or were conducted on no-till soils), emissions were considered to be half those from grassland (i.e. 11.5%). This estimate was based on work by Black et al. (1989) where emissions from urea applied to winter wheat were 59% (surface application) and 4% (incorporation) of those from urea applied to pasture. However, Whitehead & Raistrick (1990) suggested that grass emissions should be reduced by 30% to allow for a proportion being applied by drilling rather than top-dressing on arable land. Emissions from grasslands are generally considered to be greater than those from arable soils, as fertilisers are typically surface spread and the grass matt has a high urease activity and low absorption capacity (O’Toole & Morgan, 1988; Jarvis & Pain, 1990; Palma & Conti, 1990). In addition, Touchton & Hargrove (1982) suggested that the accumulation of organic matter and increased biological activity at the surface under No-till conditions could stimulate urease activity and result in greater ammonia loss. This effect could also occur under the minimal cultivation conditions used in the UK and merits further research.
document.doc 47
‘Evaluation of urea-based nitrogen fertilisers’ Report for Defra projects NT2601/02
From the above it is clear that the emission factors used in current inventories for NH3 losses following urea applications to arable land (11.5%) are based on little information (Misselbrook, 2001; Anon, 2002).
Table 6.1. Ammonia emissions following the application of urea and ammonium nitrate fertilisers to soils (expressed as % of the N applied). Updated from Harrison & Webb (2001).
Reference Cropping % N lost Measurement technique
Urea AN/CANField measurementsARABLEKeller & Mengel (1986) No till corn 30 (sl)*
11 (zl)4 (sl)2 (zl)
Chambers
Grezgin & Bayrakli (1995) Winter wheat 11 4 ChambersFox et al (1996) No till corn 33-47 nd MicrometWeber et al (2001) Winter wheat 5.5 1.5 ChambersZubillaga et al (2002) No till wheat 17 nd ChambersGuangming et al (2001) Wheat 4-19 nd ChambersLloyd et al (1997) Cereals 2.5 - Agronomic efficiencya
Black et al (1989) Winter wheatFallow
1321
nd Chambers
GRASSBlack et al (1989) Grass 22 nd ChambersSommer & Jensen (1984) Wheat & grass 18-25 <2 Wind tunnelsRyden et al (1987) Grass 6-36 <3 Wind tunnelsVelthof et al (1990) Grass 7-32 ns Wind tunnels
Van der Weerden & Jarvis (1997)
Grass 12-46 <2 Wind tunnels
Lightner et al (1990) Orchard grass 12-41 ns ChambersLloyd (1992) Grass 7 (1st cut)
17 (2nd cut)- Agronomic efficiencya
Laboratory measurementsb:Prasad (1976) 8-11 CalcareousMeyer & Jarvis (1989) Grass 6-18Whitehead & Raistrick (1990)
Grass 24 (pH<7)48 (pH>7)
Sommer & Ersboll (1996) 23-28 SandyVermoesen et al (1996) 19-27 (pH<7)
21-30 (pH>7)LoamClay
a. Agronomic efficiency of urea relative to ANb. Only a few laboratory studies have been presentednd Not determinedns negligible NH3 emissions sl: sandy loam; zl: silt loam
Information on ammonia emissions from other N fertilisers is sparse. Consequently, ammonia emission inventories have tended to group all N fertilisers, except urea. On the whole, NH3 emissions from AN and CAN tend to be small and often negligible (Table 6.1). The current UK inventory (UKAEI, 2001) uses an emission factor of 1.6% or 0.8% of the N applied as AN or CAN to grass and arable crops, respectively (Van der
document.doc 48

‘Evaluation of urea-based nitrogen fertilisers’ Report for Defra projects NT2601/02
Weerden & Jarvis, 1997; Misslebrook et al., 2001). AS is also often grouped with AN and CAN. However, emission factors for AS have been reported to range from <1 to 48% of the N applied depending on the soil pH (Hargrove et al., 1977; Sommer & Jensen, 1994; Gezgin & Baryrakli, 1995; Whitehead & Raistrick, 1990). As a result, Harrison & Webb (2001) suggested that AS should also be treated separately in the construction of ammonia emission inventories. They proposed factors of 2% and 18% for AS on soils with pH<7 and >7, respectively.
Comparative assessments of ammonia emissions from urea as contrasted to AN almost always show much larger rates of ammonia emission. However, the actual rate of ammonia emission is extremely variable, with the lowest emissions in very cold and very wet conditions (e.g. 2% volatilisation, measured by Nemitz et al. (2001). However, some moisture is necessary for urea hydrolysis, so the largest emissions are likely to occur in warm drying conditions where application is made onto a soil following rain (Harrison and Webb, 2001). The default value is based on an average of measurements for grassland and arable soils, where emissions from the latter are half those on grassland, due to the frequent incorporation of urea into arable soils (Misselbrook et al., 2000).
Bouwman et al. (2002a) recently estimated the global NH3 volatilisation loss from N fertilisers, based on the results from 148 research papers covering over 1600 measurements of NH3 loss. This included both field and laboratory studies. Of the 78mt inorganic fertiliser N applied globally (in 1995) 11mt (14%) was predicted to be lost as NH3, with c. 65% of this coming from urea applications. The majority of these losses occurred in wetland and upland cropping in developing countries, where 60% of N fertiliser used is urea. Mean emission factors were: U 21%; AS 16%; AN 6% and CAN 3%. Higher emissions were observed in laboratory experiments compared to field studies, in upland cropping systems compared to grasslands and from soils with a high pH (>8.5) or low CEC ( 16 cmol/kg). Losses were also greater from broadcasting compared to soil incorporation. However, there was no clear relationship between NH3 loss and rate of N application, soil texture or organic matter content.
6.1.2 Ammonia emission factorsThe EU Emission Inventory Guidebook was recently updated (EMEP/CORINAIR: Anon, 2003) with a revised method for calculating NH3 emissions following fertiliser applications, based on the review by Harrison and Webb (2001) and other recent European studies. The new methodology takes into account regional differences in emissions based on spring soil temperatures (emissions increasing with soil temperature: >13C, 6-13C and < 6C) and soil pH (>pH 7; Table 6.2). The factors given in Table 6.2 are shown in descending order and demonstrate the high potential for NH3 losses from fertilisers containing urea. Soil pH is considered to be most important factor for AS, DAP/MAP and anhydrous ammonia emissions, and on soils at pH>7, NH3 losses can be greater than those from urea. Foliar NH3 emissions are included and make up the total NH3 loss from nitrate-based fertilisers given in Table 6.2.
document.doc 49
‘Evaluation of urea-based nitrogen fertilisers’ Report for Defra projects NT2601/02
Table 6.2. Emission factors for NH3 losses from soils following fertiliser application (including foliar emissions) as proposed in the EU Emissions Inventory Guidebook 2003 (Anon, 2003).
Fertiliser type Region A Region B Region C pH multiplier CommentsTs >13C Ts 6-13C Ts <6C pH>7
Urea 0.20 0.17 0.15 1 Weak temperature effect; no pH effect expected as urea hydrolysis controls micro-site pH.
Nitrogen solutions (e.g. UAN)
0.11 0.09 0.07 1 Temperature effect based on urea and AN.
AnA 0.04 0.03 0.02 4 Weak temperature effect assumed. Expert judgement would suggest a strong pH effect, which is an area of high uncertainty.
AS 0.025 0.02 0.015 10 Note very strong pH effect supported by measurements and chemical principles.
Ammonium phosphates (DAP)
0.025 0.02 0.015 10 Expert judgement; some data and based on similarity to AS.
AN 0.02 0.015 0.01 1 Difficult to justify pH effect based on solubility of all nitrate salts.
CAN 0.02 0.015 0.01 1 Difficult to justify pH effect, based on similarity of observed emissions to AN.
Other NK and NPK(AN based)
0.02 0.015 0.01 1 For ammonium fertilisers, largely based on AN.
Nitrate only (e.g. KNO3)
0.007 0.005 0.005 1 This term accounts for the plant-mediated emission.
Ts = Spring soil temperatures
The UK falls in Regions B and C. Here the EU Guidebook proposes separate emission factors for grass and arable land (Table 6.3).
Table 6.3. Emission factors for total NH3 losses from arable and grassland soils (fertiliser & foliar NH3) for Regions B and C in the EU Emissions Inventory Guidebook 2003 (Anon, 2003).
Fertiliser type Grassland Arable landUrea 0.23 0.115Nitrogen solutions (UAN) 0.12 0.06AN 0.016 0.006CAN 0.016 0.006Other NK and NPK (based on AN) 0.016 0.006
By the very nature of generalising for a simple methodology, these estimates are subject to many uncertainties. Key uncertainties that require further attention include:
The extent of the temperature effect. In principle, this can be quite clearly based on physico-chemical principles. However, it is noted that warm conditions tend to be more drying due to a larger vapour pressure deficit.
The effect of pH on emissions from AN and CAN. The similar emissions for these two fertilizers and suggests that there is not an effect of pH in practice. Similarly, the results of GRAMINAE (Sutton et
document.doc 50
‘Evaluation of urea-based nitrogen fertilisers’ Report for Defra projects NT2601/02
al., 2000, 2001 & 2002) suggest no effect of soil pH for grasslands. It is possible however, that there may be some effect of pH for bare arable soils.
The emission rate from AnA is considered to be particularly uncertain. This is normally applied under pressure by deep injection into arable soils. Basic thermodynamics would suggest that there should be a clear effect of both temperature and soil pH.
Experimental data show that the vegetation-mediated ammonia emissions from fertilized cultures may be extremely variable depending on climatic conditions. In principle, larger emissions are expected in warm conditions. However, Schjoerring et al. (1991) found that under cool wet summer conditions with poor growth, grainfilling of cereals was less effective than in warm summer conditions and this coupled with higher ammonia emissions.
The emmission factors used in the current UK Ammonia Emmissions Inventory (UKAEI) are shown in Table 6.4. The table also includes proposed values for the NARSES model (National Ammonia Reduction Strategy Evaluation System), which will become the model for the national emissions inventory for UK agriculture (DEFRA Project AM0101) and the values given in the EMEP/CORINAIR Emission Inventory Guidebook (3rd edn. currently being updated - http://www.tfeip-secretariat.org/). The UKAEI inventory model has the greatest difference in emission factors for fertiliser applications to grassland and arable land, those for applications to arable land being half the value of those for applications to grassland. The difference is smaller in the NARSES model, with emission factors for applications to arable land being approximately 20% less than those for applications to grassland for a given fertiliser type. The EMEP/CORINAIR makes no differentiation in emission factors for applications to arable land and grassland.
Table 6.4. Ammonia emission factors for different fertiliser types (% applied N).
Fertiliser type Grassland ArableUKAEIa EMEP/
CORINAIRbNARSESc UKAEIa EMEP/
CORINAIRbNARSESc
AN 1.6 1.5 1.4 0.8 1.5 1.1Urea 23.0 17.0 19.0 11.5 17.0 15.0N solutions 1.6 9.0 2.3 0.8 9.0 1.8AnA 1.6 3.0 2.3 0.8 3.0 1.8AS 1.6 2.0 2.3 0.8 2.0 1.8Ammonium phosphates
1.6 2.0 2.3 0.8 2.0 1.8
Other N 1.6 1.5 1.4 0.8 1.5 1.1a UK Ammonia Emissions Inventoryb EU Emissions Inventory Guidebook (Region B, see Table 6.2)c Mean UK emission factors derived from proposed fertiliser model within NARSES
More detail on development of the UKAEI is given in section 9.2.1, together with estimates of modelled ammonia emissions that might result from different scenarios of change in the use of N-containing fertilisers.
6.2 Nitrous oxide emissions(Lead author: Keith Smith, EU)
Agricultural soils are a major source of N2O emissions. It has been estimated recently that they contribute c. 50% of total UK emissions of N2O (Brown et al., 2002a), and modelling has predicted that c. 77% of the N2O from soils is derived from N fertiliser (Brown et al., 2002b). Although there have been many studies of the effect of N fertiliser on N2O emissions, only a few have been concerned with the effect of the type of N used on the emissions. The reviews of this subject include those by Eichner (1990), Bouwman (1990, 1994, 1996, 2002b), Granli and Bøckman (1994) and Harrison & Webb (2001).
document.doc 51

‘Evaluation of urea-based nitrogen fertilisers’ Report for Defra projects NT2601/02
Nitrous oxide can be produced both aerobically during the nitrification of ammonium ions and anaerobically during the denitrification of nitrate. Differences between fertilisers therefore depend on the form of N applied (nitrate or ammonium), their effect on soil pH (optimum pH for nitrification is in the range 6.0-8.0; Paul & Clark, 1989), and the soil and environmental conditions following application. It has been suggested that losses will be greater in aerobic soils if a nitrifiable source of N is applied, with emissions from urea and ammonium salts larger than that from nitrate salts (Bolle et al., 1986).
However, results from Scotland suggest a more complicated picture. In a detailed comparison of emissions from AN, CN, urea, and AS conducted between 1992 and 1994 (McTaggart et al., 1994; Clayton et al., 1997), larger emissions occurred from CN and AN compared with urea in cool wet springs when denitrification was the dominant source of N2O; larger emissions occurred from urea in warm wet summers when nitrification was the dominant source of N2O.
Later, between 1996 and 1998, N2O emissions from AN and urea were measured on four grassland sites and five arable sites (2 winter wheat, 2 potatoes, 1 oilseed rape; Dobbie et al., 1999; Dobbie and Smith, 2003b). The site in this study was the same as in Clayton et al. (1997). Application rates were 300 kg N ha-1 yr-1, applied in 3 equal splits in April, June and August.
On grassland, N2O fluxes from urea were smaller than from AN in 6 out of 13 sites x seasons, but were larger in 3 (Table 6.4). Emission factors for AN were 2.75 0.56%, and from urea 2.12 0.44%. This overall difference was not significant (P>0.1); however, a more detailed examination of the data revealed that the differences were principally on the wetter grassland site in cool spring conditions, and to some extent in early summer. Again, the most likely explanation was that the denitrification pathway to N 2O (from nitrate) was favoured over the nitrification pathway under these conditions.
Table 6.4. Total seasonal emissions of N2O from grassland fertilised with either AN or urea (data from Dobbie and Smith, 2003; including data from Clayton et al., 1997).
Seasonal N2O flux (kg N2O-N ha-1)Mean Standard error
Season Region AN Urea AN Urea92-93 Central Scotland 1.5 3.0 0.2 0.293-94 Central Scotland 4.2 5.2 0.3 0.694-95 Central Scotland 0.896-97 Central Scotland 1.9 1.4 0.3 0.797-98 Central Scotland 13.9 7.0 2.8 0.898-99 Central Scotland 22.6 20.2 2.6 2.799-00 Central Scotland 11.6 3.9 3.4 2.300-01 Central Scotland 16.0 9.1 4.1 3.9
96 South-East Scotland 3 2 0.2 0.397 South-East Scotland 7.9 7.3 1.4 198 South-East Scotland 17.2 19.3 1.5 1.9
96 South-West Scotland 4.5 6.5 0.5 1.297 South-West Scotland 4 2.6 0.4 0.198 South-West Scotland 10.6 7.9 1.3 0.6
In The Netherlands, evidence has been obtained that supports these findings. Velthof et al. (1997) described experiments comparing emissions from AS, CN, urea and CAN, on grass growing on clay and sandy soils of
document.doc 52
‘Evaluation of urea-based nitrogen fertilisers’ Report for Defra projects NT2601/02
differing drainage classes. Rising water tables after heavy rain, following fertiliser application, gave much higher fluxes from CN and CAN than from AS or urea, at soil temperatures below 10C.
In contrast with the results for grassland in Scotland, those comparing AN and urea on arable crops in Scotland (Dobbie and Smith, 2003a) showed no difference in total seasonal N2O emissions between these two fertiliser types (Table 6.5).
Table 6.5. Total seasonal emissions of N2O from arable crops fertilised with ammonium nitrate or urea (data from Dobbie and Smith, 2003).
Seasonal N2O flux (kg N2O-N ha-1)Mean Standard error
Season Crop AN Urea AN Urea96-97 Winter wheat 0.6 0.7 0.2 0.297-98 Winter wheat 0.9 1.0 0.3 0.396-97 Potatoes 3.5 3.7 1.1 1.397-98 Potatoes 5.0 4.8 1.0 1.098-99 Oilseed rape 1.6 1.4 0.4 0.3
Granli and Bøckman (1994) compiled data on N2O losses from different fertilisers, based on reviews by five authors. These are shown in Table 6.6. Granli and Bøckman concluded that the N2O loss (i.e. the Emission Factor, in current parlance) was usually in the range of about 0.1-2%, with no single mineral fertiliser (with the possible exception of anhydrous ammonia) giving more emission than the others. They also concluded that some situations could be associated with high emissions: 1) application of urea/ammonium compounds under conditions favouring N2O production by both nitrification
and denitrification, e.g. in moist but well-aerated soil;2) use of nitrate fertilisers where denitrification is favoured, e.g. on clay soils in wet climates;3) injection of anhydrous (but not aqueous) ammonia.
Table 6.6. Median N2O yields (%) for different fertiliser types (with ranges) from reviews by 5 authors.
N form A B C D ENitrate 0-07
(0.01-1.8)0.04
(0.001-1.3)0.07/0.04
(0.001-0.5)0.05 0.04
Ammonium 0.12(0.03-0.9)
0.15(0.03-1.5)
0.15(0.05-1.8)
0.11 0.173
Urea 0.11(0.07-0.2)
0.1(0.01-0.6)
0.2/0.61
(0.1-2.1)0.52
AN 0.1/0.4(0.04-1.7)
0.7(0.3-1.6)
Ammonia 1.2/1.4(0.9-6.8)
0.1(0.01-2.05)
Authors: A: Eichner (1990); B: Bouwman (1990); C: Keller et al. (1988);; Galbally (1985); Bolle et al. (1986). 1NH4NO3 included; 2NH3 included; 3urea included.
In their review, Harrison and Webb (2001) proposed a scheme for assessing the relative emissions of N2O from different fertilisers (Table 6.7). In most cases, N2O emissions will be greater from NO3-based fertilisers compared with NH4-based fertilisers, this difference increasing with moisture content (assuming denitrification
document.doc 53
‘Evaluation of urea-based nitrogen fertilisers’ Report for Defra projects NT2601/02
to be the dominant source of N2O). For example, Leick & Engels (2001) measured higher emissions from CN and CAN compared with AS, due to an increase in the soil NO3-N content.
Table 6.7. Proposed scheme for assessing the relative emissions of N2O from different fertilisers (from Harrison & Webb, 2001).
Moisture Relative emission for N forms
Relative emission from urea
dry low nitrate ammonium urea ammonium Rate of urea hydrolysis limited
wet high nitrate > ammonium urea >> ammonium Rate of urea hydrolysis increases with temperature
v. wet high nitrate >> ammonium
urea ammonium High pH associated with hydrolysis dispersed by moisture
Urea behaves differently from ammonium forms of N. During hydrolysis, the rise in soil pH in the vicinity of the fertiliser granule can inhibit the oxidation of nitrite (NO2) to nitrate (NO3) by nitrobacter (Gould et al., 1986). The accumulation of nitrite in soils can then lead to increased N2O (and nitric oxide, NO) losses (see below). Therefore, conditions which lead to rapid urea hydrolysis (i.e. warm and wet soils) can lead to N 2O emissions which are much greater than those from NH4-based fertilisers and may even exceed those from NO3-based fertilisers.
In this context, the grain size of the urea granules could have an important effect on N 2O emissions. In a laboratory study, Tenuta and Beauchamp (2000) found that the production of N2O (and the concentration of NO2
-) in soil increased steadily as the granule size increased from a powder to prills and to larger granules. A high concentration of prills produced a similar but greater effect than large granules. The proportion of urea transformed into N2O increased with granule size but did not exceed 1.24%, but a high concentration of urea prills resulted in 2.80% being transformed into N2O.
In comparison to urea, AS applications tend to decrease soil pH and therefore inhibit nitrification, so that N2O losses tend to be least from this fertiliser form.
In Guelph, Canada, continuous measurements of N2O (and NO and NO2 fluxes, see below) were made for three growing seasons by micrometeorological techniques over turf grass fertilised with AN, urea and slow release urea (Maggiotto et al., 2000). N2O fluxes were found to be dependent on weather conditions and soil moisture at the time of fertiliser application. Largest fluxes of N2O were observed from AN-fertilised grass in two out of three seasons. In the third season, N2O fluxes from AN were smaller than from the two forms of urea. However, averaged over the three seasons, N2O emissions from AN were three times larger than from the two urea treatments. This difference was almost entirely the result of an extreme peak in N2O flux of two to three days duration following AN application when the soil was particularly wet. While emissions from slow release urea were initially smaller, they increased above those from conventional urea in the third season. This might be related to a increase in mineral N concentrations resulting from longer term application of slow release urea, a trend also observed by Smith and Dobbie (2002).
6.2.1 Chemically amended fertiliser materialsThe use of nitrification inhibitors has been shown to reduce N2O emissions from NH4-based fertilisers. Earlier work with Nitrapyrin (2-chloro-6-(trichloromethyl)-pyridine, also called N-serve) has been reviewed by Granli and Bøckman (1994), who quoted several authors as showing a reduction in N2O emission with this compound. Work since the mid-1990s, mainly with dicyandiamide (DCD), has also shown reduced emissions (McTaggart
document.doc 54
‘Evaluation of urea-based nitrogen fertilisers’ Report for Defra projects NT2601/02
et al., 1997; Velthof et al., 1997; Leick and Engels, 2001). Under cool Scottish conditions on a relatively wet grassland soil, the DCD (as 'Didin Fluid'), reduced N2O emissions from urea by 72% for the period from June 1999-June 2000 and by 46% from June 2000 to June 2001 (Dobbie and Smith, 2001). This confirms earlier work in Scotland by McTaggart et al. (1994, 1997) and in The Netherlands by Velthof et al. (1997). McTaggart et al. (1994) also showed a 50% reduction in emission from AS amended with DCD. In contrast, neither the urease inhibitor ('Agrotain', N-(n-butyl) thiophosphoric triamide (nBTPT)), as a sole additive to urea, or in combination with the nitrification inhibitor DCD, nor controlled release urea, reduced N2O emissions significantly below those from conventional urea under these conditions (Dobbie and Smith, 2003b).
6.2.2 Emission factorsIn a review of over 100 experiments, Eichner (1990) suggested the following emission factors for the loss of N2O from N fertilisers: anhydrous NH3-N 2.7% (range 0.86-6.84); AN 0.44% (range 0.04-1.71); ammonium-N 0.25% (range 0.02-0.90), urea 0.11% (range 0.07-0.18); nitrate-N 0.07% (range 0.001-0.5). However, these emission factors were later considered to be unrepresentative, due to the high proportion of studies conducted on fallow land in the absence of a competing crop.
The IPCC guidelines for greenhouse gas inventories suggest the use of a single N2O emission factor for fertiliser applications, with no allowance made for different fertiliser types because (a) they were based on very limited data, and (b) it was thought that fertiliser type was likely to have little impact on the total emission (IPCC, 1997). A factor of 1.25% 1% was adopted, based on the work of Bouwman (1994, 1996). This factor was used in the UK inventory of N2O emissions from farmed livestock (Chadwick et al., 1999) and has been recommended in the EU Emissions Inventory Guidebook (Anon., 2003).
More recently, it has been recognised that measured emission factors for N2O are log-normally distributed, with an uncertainty range from one-fifth of the mean to 5 times the mean. This translates into a range from 0.25% to c. 6% of the N applied, assuming no change in the IPCC default average value, rather than the 0.25-2.25% implied by the formula of 1.25 1% (Mosier and Kroeze, 1999; Smith et al., 2002).
This is broadly borne out by the research reviewed by Eichner (1990) and Harrison & Webb (2001): N 2O emission factors ranged from <0.01 to 12.0% of the N applied. However, it was still not possible to identify clearly defined emission factors for individual fertiliser types, as there was considerable overlap. The studies also took place on grass, fallow and cropped land, and again there were no clear differences in emission factors between cropping practices. Indeed the Emissions Inventory Guidelines for N2O (Anon., 2003) does not differentiate between cropping systems, but the IPCC's Good Practice Guidance and Uncertainty Management in National Greenhouse Gas Inventories (IPCC, 2001) recognises the possibility that there may be differences in emission factors (EFs).
Within the UK, differences in EFs have been more evident between broad crop types than between types of fertiliser N applied. Generally, emissions from grassland and from potatoes and horticultural crops have been found to be greater than those from cereals or oilseed rape, the latter EFs averaging below the IPCC default value (Dobbie et al., 1999; Smith & Dobbie, 2002; Dobbie & Smith, 2003a). Work in France compared emissions from AN, AS, urea and potassium nitrate applied to winter wheat and oilseed rape. This showed similar emissions from both crops, with little difference in EFs between the fertiliser forms: all were in the range 0.42-0.55%, again well below the IPCC default (Hénault et al., 1998). In arable cropping systems generally, the timing of fertiliser applications and whether or not inhibitors are used may well be more important than fertiliser type in determining the magnitude of N2O (and NO) emissions. A key management factor is to minimise the period when nitrification can occur in the absence of active crop N uptake (Smith et al., 1997).
Recent estimates of global annual N2O emissions from fertilised fields Bouwman et al. (2002b) also suggest a reduction in the IPPC default emission factor from 1.25% to 1.0%, based on information from c.850 nitrous oxide emission measurements from 126 different studies. Separate emission factors for different fertiliser types were also suggested ranging from 0.7% for CAN to 1.1% for urea.
document.doc 55
‘Evaluation of urea-based nitrogen fertilisers’ Report for Defra projects NT2601/02
6.3 Nitric oxide emissionsThere is very little published information regarding NO emissions from different fertiliser sources. Most emissions are associated with the nitrification process, so a NO3-based fertiliser is likely to have less impact than an NH4-based fertiliser, i.e. urea would be expected to result in larger NO emissions that AN. In a review by Skiba et al. (1997) losses of NO ranged from 0.003 to 11% of applied fertiliser N, with a mean of 0.3%. Veldkamp & Keller (1997) suggested an emission factor of 0.5% for temperate agriculture from an evaluation of 6 different studies, although there was insufficient data to separate fertiliser types. Harrison and Webb (2001) summarised results from two other studies that suggested greater emissions from urea and NH 4-based fertilisers, although the emission factors were still < 4%. The EU Emissions Inventory Guidebook (Anon., 2003) uses an emission factor of 1%, with no division for fertiliser type or cropping system. In Guelph, Maggiotto et al. (2000) found emissions of NO to be always largest from a urea-amended plot. Slow release urea and AN emitted on average less than half as much NO. Nevertheless, during all measurement periods and for all types of fertiliser, NO2 uptake was always larger than NO emission, turning the fertilised turfgrass into a net sink for N oxides irrespective of the type of fertiliser used.
More recently Bouwman et al (2002b) suggest an emission factor of 0.7% based on 99 nitric oxide measurements from 29 studies.
6.4 Leaching and surface runoff(Lead authors: Keith Goulding, RR; Anne Bhogal, ADAS)
6.4.1 NitrateThe direct leaching of N fertiliser following application is generally regarded as minimal, unless fertiliser is applied to young crops with limited rooting systems (e.g. potatoes and spring cereals) in wet springs (Davies & Sylvester-Bradley, 1995), or following spring applications to drained clay soils. Here rainfall soon after application can result in N losses by by-pass (i.e. macropore) flow to field drains. For example, at the Brimstone drainage experiment in Oxfordshire, Goss et al. (1993) showed that when the soils were close to field capacity, loss of nitrate-N following spring N applications depended on rainfall, such that 100mm of rainfall resulted in 30% of the fertiliser N being lost by leaching. Around 18% more nitrate-N was lost from direct drilled than from ploughed land in spring, reflecting the greater continuity of vertically orientated pores (i.e. by-pass flow routes) in the direct drilled plots. There is little evidence of direct leaching of residual, unused fertiliser N at the end of the growing season, if the correct amount of N is applied (Macdonald et al., 1989). Whereas numerous studies have shown an increase in soil mineral N and associated leaching losses from applications in excess of the optimum (Davies & Sylvester-Bradley, 1995; Chaney, 1990; Sylvester-Bradley & Chambers, 1992).
Very little work has been conducted linking differences in fertiliser type to nitrate leaching losses. Indeed RB209 (Anon, 2000) states that the leaching risk from NH4-based fertilisers will be same as that from NO3-based fertilisers, reflecting the fact that nitrification is generally rapid in most temperate soils and once in the nitrate form, all fertilisers will behave the same. The main exceptions would be where there was significant heavy rainfall creating runoff or drainage immediately after fertiliser applications, or if nitrification was delayed either artificially (using inhibitors) or because of environmental conditions (soil temperature, moisture and pH). In these cases, overall leaching losses are likely to be lower following NH4-based fertiliser applications, but any NH4-N losses may themselves be important in terms of water quality for fresh water fish. The Freshwater Fish Directive (FWFD) has set mandatory threshold concentrations for total ammonium-N of 0.78mg/l and guide levels of 0.03mg/l and 0.16mg/l for Salmonid and Cyprinid fish, respectively (EC, 1978). At ADAS Boxworth (unpublished Defra project NT1406), following the application of AN in March or May, drainage water ammonium-N concentrations were up to 5mg/l NH4-N.
Nitrification is an aerobic process and is inhibited at temperatures <5C and soil pH <5 (Paul and Clark, 1989). For example, Smith et al (in press) measured lower nitrate leaching losses from AS compared with KN when applied in November, which was attributed to a delay in nitrification as a result of the low soil temperatures at
document.doc 56
‘Evaluation of urea-based nitrogen fertilisers’ Report for Defra projects NT2601/02
the time of application. Stevens & Laughlin (1988) measured greater N use efficiency by cut grass following AS applications in February compared with CN; it was suggested under the high rainfall and low soil temperatures conditions (<4C in Ireland) that AS was more efficient than CN, due to lower nitrate leaching losses. Vanburg et al. (1982) demonstrated a decrease in the effectiveness of CN compared with urea and AS with increasing rainfall 40 days after application. Cereal yields were lower following the application of CN (relative to those achieved with CAN), but higher with urea and AS. However, these differences were only apparent after more than 75mm of rainfall during this period.
6.4.2 Urea and ammonium-NUrea is non-ionic and therefore can be susceptible to leaching and runoff (Gould et al., 1986). However, under favourable conditions urea hydrolysis usually proceeds in less than 3-4 days (Broadbent et al., 1958). Once in the NH4-N form this is usually relatively immobile (until it is nitrified), due to adsorption onto the soil exchange complex. Therefore, direct leaching of urea is only likely to be a problem in situations when urea hydrolysis is delayed or heavy rainfall occurs soon after application. Similarly, where fertiliser has been applied in the NH4-N form or has been hydrolysed to NH4-N from urea, direct leaching losses are only likely where it has not been adsorbed onto the soil complex and heavy rainfall causes runoff or drainflow soon after spreading. The rate of urea hydrolysis is strongly influenced by soil temperature, moisture and urea concentration (see section 4.1). The longest persistence of unhydrolysed urea is therefore likely in cold, dry soils.
The potential for urea leaching has been demonstrated in leaching columns under laboratory conditions (Broadbent et al., 1958), where urea was considered to be more susceptible to leaching than NH4-N, but less than NO3-N. Urea can also form weak complexes with soil organic matter and clay minerals (Chin & Kroontje, 1962), such that movement may be retarded by high organic matter contents (Tomlinson, 1970). Besides these early laboratory studies there is very little information on urea leaching or runoff. In one field study, however, Sherwood & Fanning (1985) measured substantial losses of unhydrolysed urea (c. 24% of that applied) in runoff following 10 mm of rainfall shortly after application to an impermeable grassland soil. Moreover, the use of urease inhibitors (to minimise NH3 emissions) may exacerbate the problem, particularly where there is runoff or drainflow (i.e. by-pass flow) as a result of heavy rainfall shortly after application. For example, Prakash et al. (1999) observed 4% greater leaching of urea following the application of urea treated with the urease inhibitor, Agrotain (N-(n-butyl)-thiophosphoric triamide) compared to that from straight urea. However, total N leaching (NH4-N, NO3-N + urea) was greater following the straight urea application compared to Agrotain, which delayed urea hydrolysis and maintained the N in a less leachable form (i.e as urea rather than NO3-N) for a longer period of time. Whether unhydrolysed urea will persist until it reaches a watercourse is uncertain. However, the hydrolysis of urea within watercourses is likely to impact on both NH4-N and NO3-N concentrations, and could increase NH4-N concentrations above the European guidelines for salmonid and cyprinid waters (EC, 1978).
Urea applications may also have an indirect impact on nitrate leaching. Past advice (e.g. Paulson & Chaney, 1986; SAC, 1994) has often encouraged farmers to apply c.10% more N as urea than as AN, to compensate for potential NH3-N losses, to ensure that crop yields and quality are not compromised. However, actual NH3 losses from urea can vary from nil to c.50% of the N applied (Harrison & Webb, 2001), so in some cases crops may be over-fertilised. As reported above, post harvest SMN levels rapidly increase with N applications in excess of the optimum. Lord (1992) derived average gradients for relationships between leachable nitrate and fertiliser N applied. At N applications below the optimum, a 10% increase in fertiliser N rate (e.g. 20kg/ha on a 200kg/ha application) would result in a small increase in leachable nitrate (from c.14 to 15kg/ha after cereals and 44 to 46kg/ha after potatoes). However, if the 10% increase in N rate was above the optimum, the increase in leachable nitrate would be 10-16kg/ha (from 14 to 24kg/ha after cereals and 44 to 60kg/ha after potatoes).
In addition, urea can be quite difficult to spread evenly (Paulson & Chaney, 1986). Its low density and size variability can lead to patchy distribution, particularly if spread in windy conditions. This could well lead to ‘hotspots’ of urea, which are over-fertilised, while other areas of the field may not receive enough. This could result in localised leaching problems in the autumn following harvest.
document.doc 57

‘Evaluation of urea-based nitrogen fertilisers’ Report for Defra projects NT2601/02
6.4.3 NitriteThere is no information quantifying the leaching of NO2
- from applied urea. However the Freshwater Fish Directive (FWFD) has set guideline levels of 0.003mg/l and 0.009mg/l for Salmonid and Cyprinid fish, respectively (EC, 1978).
6.5 ConclusionsThe biological and chemical transformations that urea N undergoes make it even more susceptible to loss to the environment than other forms of N.
Ammonia emissions1. The UK has a commitment under the EU National Emissions Ceilings Directive and the UNECE
Gothenburg Protocol to reduce ammonia (NH3) emissions to 297kt NH3/yr by 2010, compared with emissions of about 348kt NH3/yr in 1999. A significant change in practice away from AN towards urea would have a serious impact on the UK’s obligations to meet these targets
2. The most important factors affecting NH3 emissions from urea are the cation exchange capacity (CEC) of the soil, land use and crop cover, application rate and environmental conditions post-spreading (temperature, rainfall and wind speed). Urea hydrolysis tends to proceed most rapidly in warm, moist soils, where complete hydrolysis can occur within 2-4 days. Windy conditions and low crop cover tend to increase the potential for NH3 volatilisation, by promoting removal of NH3 away from the soil surface. Rainfall immediately after application can reduce volatilisation by washing urea into the soil profile.
3. Soils with a high CEC tend to have lower volatilisation losses due to exchange of ammonium ions on to soil cation exchange sites. The greatest risks of NH3 emissions from urea are therefore likely to occur on coarse-textured soils (with a low organic matter content) where there are low amounts of crop cover and where the environmental conditions are dry, warm and windy following application.
4. The proportion of urea N emitted as NH3 has also been shown to increase with N application rate up to 200 kg/ha. However, high urea concentrations in soil were also shown to delay urea hydrolysis, with NH3
emissions peaking later than at lower N application rates.
5. Reports of the actual amount of NH3 emitted following urea applications and its effect on N use efficiency and crop performance were highly variable. Field measurements of emission factors ranged from 4-47% and 6-46% of the urea-N applied to arable crops and grassland, respectively. This compared with emissions of <4% of N applied as AN or CAN. Within the arable experiments, the greatest emissions have been measured from no-till systems (10-47%). Emission factors from cultivated cereals ranged from 4-19%, although there were few studies on tilled land.
6. The magnitude of measured NH3 losses depended on the method of measurement. Laboratory experiments tended to produce larger emission factors than field experiments, as they were usually conducted under conditions that favour urea hydrolysis (warm and wet). For field studies, wind tunnels are regarded as the most robust and accurate method of measuring NH3 emissions from small plot experiments, and the micrometerological mass balance method for field scale experiments.
7. Ammonia emission inventories have used a range of factors to calculate emissions from urea applications. Most information on ammonia emission factors has been derived from studies on grassland, with very few direct measurements on tilled arable land. Early UK experiments suggested an average emission factor of 10% of urea-N applied. More recently a factor of 23% has been used in the UK for urea applications to grassland. In the absence of many direct field measurements on arable soils, emissions were considered to be half those from grassland (i.e. 11.5%) due to the lower levels of urease activity in arable soils.
8. Information on ammonia emissions from N fertilisers other than urea is sparse, so ammonia emission inventories have tended to group all N fertilisers except urea together. Emissions from AN and CAN tend to be small: current inventories use an emission factor of 1.6% and 0.8% of the N applied as AN or CAN to grass and arable crops, respectively. AS is also often grouped with AN and CAN, but separate factors have been proposed depending on the soil pH (2% or 18% on soils with pH<7 and >7, respectively).
document.doc 58

‘Evaluation of urea-based nitrogen fertilisers’ Report for Defra projects NT2601/02
9. The UK Emission Inventory (UKAEI, 2001) emission factors are: urea, 23% (grassland) and 11.5% (arable); all other forms, 1.6% (grassland) and 0.8% (arable).
Nitrous oxide and nitric oxide emissions10. Agricultural soils are a major source of nitrous oxide (N2O) emissions, contributing c. 50% of total UK
emissions of N2O. Modelling has predicted that c. 77% of the N2O from soils is derived from N fertiliser. There have been many studies of the effect of N fertiliser on N2O emissions, but only a few have studied the form of N used. Current IPCC guidelines for greenhouse gas inventories recommend the use of a single N2O emission factor of 1.25% 1% for fertiliser applications, with no allowance made for different forms of fertiliser N.
11. Nitrous oxide can be produced both aerobically during the nitrification of NH4+ ions and anaerobically
during the denitrification of NO3- or NO2
-. Emissions will therefore depend on the form of N applied, its effect on soil pH, and soil and environmental conditions post-spreading. Assuming denitrification is the dominant source of N2O, emissions will be greater from NO3-based fertilisers compared with NH4-based fertilisers, these difference increasing with moisture content. Use of ammonium/urea N forms in wet springs (when there is high potential denitrification)is therefore likely to make a significant reduction in total annual emissions. Results from Scotland and reviews of European research support this, but differences are generally small in numerical terms.
12. European research reports Emission Factors usually in the range of 0.1-2%, with no difference between forms of N fertiliser. However, increased emissions were recognised from: (1) applications of urea/ NH4
+
compounds under conditions favouring N2O production by both nitrification and denitrification, e.g. in moist but well-aerated soil; (2) NO3
- fertilisers where denitrification was favoured, e.g. on clay soils in wet climates; (3) injection of anhydrous (but not aqueous) ammonia. In the UK (Scotland), differences between fertiliser types have also been more apparent on grassland than tilled land, the magnitude of these differences was very dependent on the season.
13. During urea hydrolysis, the rise in soil pH in the vicinity of the fertiliser granule can inhibit the oxidation of NO2
- to NO3- by nitrobacter. The consequent accumulation of NO2
- in soils can then lead to increased N2O (and nitric oxide, NO) losses. Therefore, conditions which lead to rapid urea hydrolysis (i.e. warm and wet soils) could lead to N2O emissions which are much greater than those from NH4-based fertilisers and may even exceed those from NO3-based fertilisers. Increasing granule or prill size could increase emissions by this means.
14. The use of nitrification inhibitors such as nitrapyrin (2-chloro-6-(trichloromethyl)-pyridine, also called N-serve) and dicyandiamide (DCD) has been shown to reduce N2O emissions from NH4-based fertilisers. In contrast, neither the urease inhibitor Agrotain (as a sole additive to urea) or in combination with the nitrification inhibitor DCD, reduced N2O emissions significantly below those from conventional urea.
15. There is very little published information on nitric oxide (NO) emissions from different fertiliser sources. Most NO emissions are associated with nitrification, so urea would be expected to result in larger NO emissions that AN (in which half the N is in the NO3
- form). Measured losses of NO have ranged from 0.003 to 11% of applied fertiliser N, with a mean of 0.3%. The CORINAIR Emissions Inventory Guidebook uses an NO emission factor of 1%, with no division for fertiliser form or cropping system.
Leaching and surface runoff16. The risk of direct leaching of any N fertiliser following application is generally regarded as small, unless
rainfall follows spring applications to heavy soils and results in drainflow or surface runoff, or N is applied to young crops with limited rooting systems (e.g. potatoes and spring cereals) in wet springs. There is little evidence of direct leaching of residual, unused fertiliser N at the end of the growing season if the correct amount of N is applied. However, numerous studies have shown an increase in soil mineral N and associated leaching losses from applications in excess of the economic optimum, which could occur if farmers overfertilise with urea N to provide insurance against potential NH3-N losses.
document.doc 59
‘Evaluation of urea-based nitrogen fertilisers’ Report for Defra projects NT2601/02
17. Very little work has been conducted measuring N losses following use of different forms of fertiliser N. This is particularly important in the light of the Fresh Water Fish Directive which sets mandatory limits for NH4
+-N and NO2--N concentrations in surface water systems.
18. Urea is non-ionic and therefore susceptible to leaching and runoff. However, under favourable conditions urea hydrolysis usually proceeds in < 4 days. Once in the NH4
+-N form, this is usually relatively immobile (until it is nitrified), due to adsorption onto the soil exchange complex. Therefore, direct leaching of urea is only likely to be a problem in situations when urea hydrolysis is delayed or heavy rainfall occurs soon after application. Similarly, where fertiliser has been applied in the NH4
+-N form or urea has been hydrolysed to NH4-N, direct leaching losses are only likely where the NH4
+ has not been adsorbed onto the soil complex and heavy rainfall causes runoff or drainflow soon after spreading.
19. The potential for urea leaching has been demonstrated in leaching columns under laboratory conditions: urea was considered to be more susceptible to leaching than NH4
+-N, but less than NO3--N. Urea can also
form weak complexes with soil organic matter and clay minerals, so movement may be retarded by high organic matter contents. In one field study, 24% of the applied unhydrolysed urea was lost in runoff following 10 mm of rainfall shortly after application to an impermeable grassland soil.
20. The use of urease inhibitors (to minimise NH3 emissions) may exacerbate the problem of urea leaching, particularly where there is surface runoff or drainflow (i.e. by-pass flow) as a result of heavy rainfall shortly after application: 4% greater leaching of urea was measured following the application of urea treated with the urease inhibitor Agrotain compared with straight urea. However, total N leaching (NH4
+-N, NO3
--N + urea) was greater following the straight urea application compared with urea + Agrotain, which delayed urea hydrolysis and maintained the N in a less leachable form for a longer period of time. There was no information quantifying the leaching of NO2
- from applied urea.
21. Whether leached urea would persist until it reaches a watercourse is uncertain. However, the hydrolysis of urea within watercourses is likely to impact on both NH4
+-N, NO2--N and NO3
--N concentrations, and could increase NH4-N concentrations above the European guidelines for salmonid and cyprinid waters. The Freshwater Fish Directive (FWFD) has set mandatory threshold concentrations for total ammonium-N of 0.78mg/l and guide levels of 0.03mg/l and 0.16mg/l for Salmonid and Cyprinid fish, respectively. For nitrite-N guide levels of 0.003mg/l and 0.009mg/l have been set for Salmonid and Cyprinid fish, respectively.
22. Urea can be quite difficult to spread evenly. Its low density and size variability can lead to patchy distribution, particularly if spread in windy conditions. This could lead to over-fertilised ‘hotspots’ while other areas of the field may not receive enough, resulting in localised leaching in the autumn following harvest.
document.doc 60

‘Evaluation of urea-based nitrogen fertilisers’ Report for Defra projects NT2601/02
7. Methods to mitigate ammonia emissions
As urea is a significant source of ammonia, minimising its use has been suggested as a cheap option for reducing emissions (Anon., 2002). Other measures have been suggested which can reduce ammonia emissions from the use of urea.
Slow release formulations of urea Chemical additives Changing pellet size and soil incorporation Urease inhibitors
Slow release systems and urease inhibitors are designed to slow the rate of hydrolysis and consequently volatilisation. This will occur by preventing the formation of localised areas of high pH, decreasing the concentration of ammonium (NH4-N) in the soil solution and allowing a greater of amount of time for urea to be washed into the soil by rainfall. The use of chemical additives and altering the pellet size are designed to modify the environment of the granule microsite, to prevent the formation of localised zones of high pH. By placement, N transformation rates may be retarded and a barrier created to reduce NH3 losses.
The potential economic benefit of such measures can be estimated from information about the crop response to urea and the amount of N saved from loss by the modification imposed. Buresh & Baanante (1993) presented a model which showed that modified urea products (e.g. inhibitors, acidifying agents, soluble salts etc) provide the highest economic benefit compared with conventional urea in situations where the price of urea, the crop response to urea-N and the potential loss of urea N are all high. This could also be improved if the modifications also increased the maximum crop yield as well as reduced N losses.
7.1 Slow release formulations of ureaUrea has been coated with sulphur (Youngdahl et al., 1986), with films or a matrix of impervious materials, e.g. Shellac coated urea (Chauhan and Mishra, 1989) or natural rubber (Hassan et al., 1992) or with a thermo-plastic resin, e.g. polyolefin coated urea (Shoji et al., 1991). More recently condensation products of urea and urea-aldehydes (methylene ureas, MU) have gained more usage in the sports turf, greenhouse and nurseries industries (Trenkel, 1997) but these are expensive to produce (c.8-10 times the cost of producing AN).
Slow release fertilisers, especially sulphur-coated urea, have been reviewed by Davies (1976) and are generally regarded as a speciality product. They can be applied at a high rate (up to 380 kg N/ha) and often result in yield increases because of reduced leaching losses. Although some of these slow release products have been shown to reduce NH3 loss from urea, they are generally considered to be uneconomic for agriculture at present. Any uncertainty over the release of nitrogen from slow release fertilisers could lead to more unused N being left after crop growth that could increase the risk of nitrate leaching.
The press cake from the production of neem oil (from the Indian neem tree, Azadirachta indica) has a controlled release and nitrification inhibiting effect. Coating urea with neem has been shown to improve N use efficiency and lower losses (Trenkel, 1997). However, the performance of neem coated urea is not always reliable.
7.2 Chemical additivesMixing urea with acidic materials lowers the microsite pH and suppresses the build up of high NH3 concentrations in the soil. Under acidic conditions (pH<5), the enzyme urease may also become irreversibly inactivated. Inorganic acids will reduce NH3 volatilisation from urea if more than 1 mole of acid is added per mole of urea (Fenn and Hossner, 1985). Nitric and hydrochloric acids are not recommended. However, urea phosphoric (UP) acid could be potentially useful in being able to supply both N and P to plants. It can be co-
document.doc 61
‘Evaluation of urea-based nitrogen fertilisers’ Report for Defra projects NT2601/02
granulated with urea to produce urea-urea phosphoric acid (UUP) with blends producing N:P ratios varying from 0.9:1 to 7:1 (w/w).
Field evaluations have shown that both UP and UUP are superior N fertilisers to urea when surface applied, due to lower NH3 losses (Mikkelsen and Bock, 1988). However, the method of application can play an important role in determining the effectiveness of UP in reducing NH3 losses, due to differential diffusion of the UP components (urea is very mobile, whereas H3PO4 has limited mobility). Uniformly applied UP solution can therefore be more effective than granular applications (Mikkelsen and Bock, 1988).
7.3 Inorganic saltsThe addition of insoluble salts to urea fertiliser results in the formation of calcium carbonate, reducing soil pH and consequently NH3 loss. Several studies have reported the ability of inorganic salts, e.g. CaCl2, Ca(NO3)2, KCl, KNO3 and MgSO4, to reduce NH3 volatilisation from urea (Watson, 2000, Reddy et al., 2000). However, the benefit may not be cost-effective, as large quantities of salts are required. For example a calcium:urea ratio greater than 0.25 is necessary to significantly reduce NH3 volatilisation (Fenn et al., 1982), and at this level nutrient imbalances may occur.
Several studies have also shown that interactions can occur between different N sources when combined within a single fertiliser (Watson et al., 1990). For example, greater N use efficiency has been achieved with a granular formulation containing 30% urea, 30% AN, 10% AS and 30% dolomite compared to urea or CAN on grassland (Garret, 1987; Watson, 1987). However, urea and AN are generally incompatible for mixing in the production of fertiliser products. Ammonia volatilisation has also been reported to be lower from surface application of urea calcium nitrate (Eriksen & Kjedby, 1987) and urea ammonium sulphate (Joris & Sor, 1971).
Ouyang et al. (1998) found that both triple superphosphate (TSP) and potassium chloride (KCl) reduced ammonia volatilisation when applied with urea. The effect of TSP was attributed to acidification while the effect of KCl was considered to be due to the potassium displacing exchangeable acidity into the soil solution and thus reducing soil pH.
7.4 Pellet size and soil incorporationThere are conflicting reports on the affect of pellet size on NH3 volatilisation. Some authors have reported no effect (Buresh et al., 1984; Eriksen et al., 1985; Watkins et al., 1972), whereas others have indicated that large pellets can increase (Black et al., 1987; Volk,1961) or decrease (Nommik, 1973, Prins and Rauw, 1989; Sudhakara and Prasad, 1986) volatilisation. Increasing pellet size can decrease the rate of urea hydrolysis and delay the time at which the maximum rate of NH3 loss occurs, due to slower dissolution of the larger granules and restricted contact of the large granules with soil urease (Black et al., 1987; Watson and Kilpatrick, 1991). Delaying the time of maximum rate of loss in the field allows a greater opportunity for rainfall to move the urea below the soil surface and lowers NH3 volatilisation. However, the influence of pellet size on NH3 losses is small and varies with soil type. For example, Watson & Kilpatrick (1991) observed that doubling the pellet size (from 3-4mm to 6.3-8mm) only reduced NH3 losses by 16% (from 17.4% of the N applied to 14.5%) and delayed the time taken to reach maximum NH3 loss by 0.7 days.
Incorporation of urea below the soil surface will minimise the loss of NH3 by volatilisation (Terman, 1979, Roelke et al., 2002) in a similar way that has been observed with rapid incorporation of animal manures (Smith et al., 2000). For example, Black et al. (1989) observed that incorporation of urea to 25cm depth reduced NH3 emissions to 1.0% of the N applied, compared to 13% of the N broadcast to wheat or 21% of the N applied to a fallow field. The reduction in emissions as a result of cropping was thought to be due to a reduction in air flow and temperature at the soil surface and/or foliar uptake of the NH3 emitted.
Soil incorporation of topdressed solid urea would be practically difficult or impossible in most agricultural systems; topdressing to established crops is the main method of application of N fertilisers. However, urea is effectively incorporated into the soil when applied to the seedbed prior to sowing but this will only be
document.doc 62
‘Evaluation of urea-based nitrogen fertilisers’ Report for Defra projects NT2601/02
applicable for spring-sown crops and some autumn grass reseeds. Soil incorporation may be more possible for fluid fertiliser applications if some means of injection into the soil is adopted, but the capital and time-related costs of purchasing and using injection equipment may be limiting. Tine injection is not suitable for all soil types or under all soil conditions; injection would be difficult or impossible on wet, hilly or stony land. In the UK, application by point injection (Baker et al., 1985) or high pressure injection (Johnston, 1988) may be a practical option.
Band-spread urea can decrease NH3 emissions as less of the banded urea is in contact with the soil compared to broadcast or incorporated urea (Gould et al., 1986; Chen & MacKenzie, 1993). In subtropical Australia, banding and delaying urea applications until after canopy development reduced ammonia volatilisation (Weier, 1994). Banding urea under no-till on the Canadian Prairies slowed its hydrolysis, reducing losses by denitrification and leaching (Malhi et al., 2001). However, the placement of urea in a band can result in a region of high pH and NH4-N concentration in the immediate vicinity of the band. This can inhibit nitrification leading to an accumulation of NO2 and possible increased N losses as N2O. Root growth may also be inhibited as a result of ammonia toxicity in the vicinity of the band (Gould et al., 1986).
7.5 Urease inhibitors(Lead author:- Catherine Watson, Queens University, Belfast)
Inhibiting urease activity slows the conversion of urea to NH4+, and hence reduces the concentration of NH4
+ present in the soil solution and the potential for NH3 volatilisation and seedling damage. Slowing the hydrolysis of urea allows more time for the urea to diffuse away from the application site, or for rain or irrigation to dilute urea and NH4
+ concentration at the soil surface and increase its dispersion in the soil.
Urease inhibitors are expected to be most beneficial on soils when: loss of NH3 from urea fertiliser is high. incorporation of urea is difficult. there is little opportunity for the urea to move into the soil with infiltrating water. the soil surface has a high urease activity due to lack of cultivation or the accumulation of organic matter.
There are a number of requirements for a successful urease inhibitor to be used with urea fertiliser. The inhibitor must:- be environmentally and toxicologically safe under a reasonable set of handling conditions. be non-phytotoxic be highly active and specific for the urease enzyme be cost effective be stable, non volatile and compatible with a wide range of fertiliser materials (solids and fluids) have similar solubility and diffusivity characteristics to that of urea.
Thousands of chemicals have been tested for their potential as inhibitors of soil urease activity for use with urea fertilisers. The inhibitors can be classified according to their structures and how they are thought to interact with urease. They can interact with either the enzyme active site or a key functional group elsewhere in the molecule, which may change the conformation of the active sites and preclude urea hydrolysis. Medina and Radel (1988) classified inhibitors into 4 classes:-
1. Reagents which interact with the sulphydryl groups (sulphydryl reagents) (Figure 7.1).2. Hydroxamates (Figure 7.2).3. Agricultural crop protection chemicals.4. Structural analogues of urea and related compounds (Figures 7.3 and 7.4).
document.doc 63
‘Evaluation of urea-based nitrogen fertilisers’ Report for Defra projects NT2601/02
7.5.1 Major classes of urease inhibitors
7.5.1.1 Sulphydryl ReagentsAny organic or inorganic compound which will react with sulphydryl (mercapto) groups will inhibit urease to various degrees. The structures of some sulphydryl compounds that have been evaluated as urease inhibitors are shown in Figure 7.1.
p-Chloromercuribenzoate (Moe, 1967), polyhydric phenols, aminocresols (Rodgers, 1984) and quinones (e.g. p-benzoquinone, 2-5 dimethyl benzoquinone) have also been used to inhibit soil urease (Mulvaney and Bremner, 1978; Tomar and Mackenzie, 1984). The polyhydric phenols only inhibit urease after oxidation to the corresponding quinones (e.g. catechol, hydroquinone, quinhydrone). The most effective benzoquinones for retarding urea hydrolysis (e.g. 2,5 dimethylbenzoquinone) are carcinogens unsuitable for use with fertilisers. Several heterocyclic sulphur compounds (Figure 7. 1) inhibit both jack bean urease and soil urease, via a thiol-disulphide exchange reaction between a heterocyclic disulphide and the sulphydryl group at the urease active site.
Figure 7.1. Compounds which interact with sulphydryl groups and have been evaluated as urease inhibitors.
document.doc 64
OH
OH
OH
OH
O
O
N
CS
C
N
HS S H
N
CS
C
N
H2N S H
Hydroquinone Catechol p-Benzoquinone
1,3,4-Thiadiazole-2,5-dithiol 5-Amino-1,3,4-thiadiazole-2-thiol
‘Evaluation of urea-based nitrogen fertilisers’ Report for Defra projects NT2601/02
CH3C NHOH
O
C NHOH
O
C NHOH
O
CH3(CH2)6H2N
Acetohydroxamic acid Hydroxyurea Caprylohydroxamic acid
Figure 7.2. Hydroxamates evaluated as urease inhibitors.
document.doc 65
‘Evaluation of urea-based nitrogen fertilisers’ Report for Defra projects NT2601/02
A. Substrate analogues
C NH2
S
H2N NH C NH2
O
Thiourea Phenylurea
B. Phosphoroamides
P NH2
O
N
O P NH2
O
NH2
NH2H
P NH2
S
N
NH2H
R
R
Phenylphosphorodiamidate (PPD)
Phosphoryl triamide structure
Thio proinhibitors of the phosphoryl triamides (R = any saturated (alkyl) group)
Figure 7.3. Structural analogues of urea that have been evaluated as urease inhibitors
document.doc 66
1.1.1.1.1 Phosphoryl triamide structureThio proinhibitors of the phosphoryl triamides ( ‘R’ = any saturated (alkyl) group)
‘Evaluation of urea-based nitrogen fertilisers’ Report for Defra projects NT2601/02
P NH2
S
N
NH2H
(CH2)3CH3
P NH2
O
N
NH2H
(CH2)3CH3
N-(n-butyl) thiophosphoric triamide (nBTPT)
N-(n-butyl) phosphoric triamide (oxygen analogue)
Figure 7.4. Structure of the urease inhibitor nBTPT and its oxygen analogue.
Several inorganic materials (generally halide, CO32- or SO4
2- salts) have been tested as soil urease inhibitors (Table 7.1). Fluoride is a competitive inhibitor which binds to the Ni cation in the active site. It is likely that the acid inhibitors reduce the pH below the optimum for urea hydrolysis rather than directly inhibiting the enzyme. Ammonium thiosulphate (ATS) is currently used as a sulphur and nitrogen fertiliser and is readily available at a low cost. Thiosulphate (S2O3
2-) and its transformed intermediate tetrathionate (S4O62-) were found
to inhibit nitrification of ammonia and hydrolysis of urea (Goos, 1985; Sullivan and Havlin, 1992). Mixtures of ATS with fluid fertilisers have been shown to increase maize growth and grain yield (Graziano, 1990; Graziano and Parente, 1996). The inhibition of urea hydrolysis by ATS has been reported to range from 10-50% (Goos, 1985) and is considerably lower than inhibition by the more recent structural analogues of urea. For example, Grant et al. (1996) showed that N-(n-butyl) thiophosphoric triamde, (nBTPT) was more effective in reducing volatilisation loss from UAN solution than was ATS.
Table 7.1. A selection of inorganic materials tested as soil urease inhibitors.
Name Formula ReferencesSodium chloride NaCl Medina & Radel, 1988Sodium carbonate Na2CO3 Medina & Radel, 1988Urea phosphate H3PO4.CON2H4 Medina & Radel, 1988Urea nitrate HNO3.CON2H4 Medina & Radel, 1988Ammonium thiosulphate (NH4)2 S2O3 Goos, 1985; Sullivan and Havlin, 1992Calcium chloride CaCl2 Goos, 1985Fluoride ion F- Dixon et al., 1980
document.doc 67
‘Evaluation of urea-based nitrogen fertilisers’ Report for Defra projects NT2601/02
McCarty et al., (1990) concluded that ATS had little potential for retarding the hydrolysis of urea, because to be effective it needed to be applied at high rates (2500 5000 g/g soil) that lead to crop damage. In comparison nBTPT effectively retarded urea hydrolysis at rates as low as 1 g/g soil.
The advantages of using ATS in combination with solid and liquid mineral fertilisers and slurries was recently shown in an EU project, involving 6 countries (Austria, Finland, France, Ireland, Italy and Portugal) plus a private Italian Company (Esseco) (EU, 2000). The benefits of ATS were associated with its sulphur content, its ability to inhibit nitrification and increase the solubilisation of micronutrients, rather than being due to its urease inhibitory properties per se.
A substantial number of transition metal ions (e.g. Ag, Hg, Cu) and compounds (e.g. phenylmercuric borate, phenylmercuric acetate) inhibit urease by reacting with the sulphydryl groups and the observed inhibition is inversely proportional to the solubility product of the metal-sulphide complex (Gould et al. 1986). Phenylmercuric acetate, commonly used to inhibit urease during the extraction of urea from soil, can be effective at concentrations as low a 5mg/l of extractant, but its large–scale use in fertiliser manufacture is environmentally unacceptable because of its Hg component.
Norsk Hydro investigated the efficacy of metal nitrates (iron and aluminium) mixed with urea to lower ammonia loss from soil when applied either in the form of solid fertiliser or liquid fertiliser, especially urea-ammonium nitrate solutions. They found that ferric nitrate was the most promising, lowering ammonia loss from urea in incubation studies by over 50% in one week. The preferred molar ratio of ferric nitrate : urea was found to be in the range of 1:1 to 1: 15 (UK Patent Application GB 2285803, 26 July 1995).
7.5.1.2 HydroxamatesThe hydroxamates are specific, non-competitive inhibitors of urease, which form a complex with one of the nickel atoms at the active site (Figure 7.2). Caprylohydroxamic acid is the most potent hydroxamate type inhibitor. However, these compounds do not appear to be effective in soil systems (Medina and Radel, 1988).
7.5.1.3 Agricultural Crop Protection ChemicalsA large number of pesticides and herbicides have been tested as urease inhibitors (Medina and Radel, 1988) but many exhibit only weak activity. Martens and Bremner (1993) showed that 28 formulated herbicides were unlikely to substantially affect either urease activity or nitrification when applied to soils in conjunction with urea fertiliser.
7.5.1.4 Structural analogues of urea and related compounds Compounds that have structural similarities to urea inhibit urease by competing for the same active site on the enzyme. Thiourea, methylurea and the substituted phenylureas have been shown to inhibit jack bean urease (Fig. 7.3A). Xanthates inhibit both urea hydrolysis and nitrification in soil (Gould et al., 1986). However, neither the substituted ureas nor the xanthates provide sufficient inhibition of soil urease to be of practical agricultural value. Urea – thiourea mixtures (Urea:thiourea 2:1 w/w) placed in either bands or pellets have been shown to retard the transformations of urea in the soil (Malhi and Nyborg, 1979 and 1984). Thiourea is both a weak urease and nitrification inhibitor and can provide a slowly available source of nitrogen and sulphur.
Considerable interest has recently developed around the organophosphorus inhibitors, particularly the phosphorodiamidates, the phosphorotriamides and the thiophosphorotriamides (Figure 7.3B). These compounds are structural analogues of urea and are some of the most effective inhibitors of soil urease activity blocking the active site of the enzyme. Examples from this class of compound, that have been used in scientific research during the last 10 years include:-
document.doc 68

‘Evaluation of urea-based nitrogen fertilisers’ Report for Defra projects NT2601/02
Phenyl phosphorodiamidate (PPD) Luo et al. (1994)Phongpan et al. (1995)Varel (1997)Watson (1990a)
Thiophosphoryl triamide (TPT) Radel et al. (1992)
Cyclohexyl thiophosphoric triamide (CHTPT) Christianson et al. (1990)Cyclohexyl phosphoric triamide (CHPT) Byrnes and Freney (1995)
Christianson et al. (1990)Freney et al. (1995)Phongpan et al. 1997Varel (1997)
Phosphoric triamide (PT) Martens & Bremner (1984)
N – (n-butyl) thiophosphoric triamide (NBPT or nBTPT) orN – (n-butyl) phosphoric triamide (NBPTO)
Grant and Bailey (1999)Hendrickson (1992)Joo et al. (1991)Luo et al. (1994)Phongpan et al. (1997)Schlegel (1991)Watson et al. (1990, 1994b)
Phenylphosphorodiamidate (PPD) was the first structural analogue found to be a potent urease inhibitor, which was identified by East German scientists in the late 1970’s through screening over 14,000 compounds (Medina and Radel, 1988). An electron–withdrawing group, such as phenol or trichloroethyl, is necessary for the diamide to achieve inhibition (Byrnes and Freney, 1995). Substitutions, such as Cl- on the phenol ring, can improve inhibition if they do not cause stearic hindrance by being located adjacent to the ester group (Byrnes and Freney, 1995).
PPD was found to inhibit soil urease activity at concentrations as low as 0.2g/g of soil. Martens and Bremner (1984) measured the inhibition of soil urease by two phosphorodiamides (PPD and phosphorodiamidic acid) and 10 phosphorotriamides. They found that most of these compounds were better inhibitors of soil urease activity than hydroquinone, which had been reported to be the most effective inhibitor of soil urease prior to 1976. The performance of PPD in the field has been rather inconsistent, being effective in some studies (Katyal et al. 1987, Rodgers et al., 1987) but ineffective in others (Broadbent et al., 1985; Tomar et al., 1985). The effectiveness of PPD in reducing NH3 volatilization from urea is limited at high temperatures (O’Connor and Hendrickson, 1987) and on soils with high pH and low titratable acidity (Watson, 1990c).
A triamide must contain a saturated or alkyl group to have appreciable urease inhibition. The more commonly tested compounds have contained either n-butyl or cyclohexyl as the ‘R’ group (Figure 7.3B). The solubility and mobility of compounds with other alkyl groups can be reduced as the group becomes larger (Byrnes and Freney, 1995). Phosphoryl triamide itself (where ‘R’ is a proton rather than an alkyl group) is also a urease inhibitor, but it is not as potent as the other compounds (Byrnes and Freney, 1995) and is unstable when mixed with urea (Radel et al., 1988).
7.5.2 N-(n-butyl) thiophosphoric triamide (nBTPT)The most widely tested triamide is N – (n-butyl) thiophosphoric triamide (nBTPT) (Figure 7.4) which shows similar solubility and diffusivity characteristics to urea (Carmona et al., 1990). This and other thiophosphoric triamides are not direct urease inhibitors. They have to be converted to their oxygen analogues, which are the actual inhibitors. The factors that affect the rate of conversion to the oxygen analogues have not been fully elucidated and will likely be dependent on a number of biotic and abiotic soil properties. The conversion of nBTPT to its oxygen analogue N – (n-butyl) phosphoric triamide (NBPTO) (Figure7.4) is rapid, occurring
document.doc 69
‘Evaluation of urea-based nitrogen fertilisers’ Report for Defra projects NT2601/02
within minutes/hours in aerobic soils (Byrnes and Freney ,1995), but can take several days in the floodwater of tropical soils. NBPTO forms a tridentate ligand with the urease enzyme, blocking the active site (Manunza et al., 1999).
Laboratory testing under aerobic soil conditions has shown that the thio triamides and their oxygen analogues are superior urease inhibitors to PPD (Byrnes and Freney, 1995). nBTPT has received most attention because its performance is generally better than that of the other compounds. Even though NBPTO is the active compound, comparisons of nBTPT and NBPTO applied to a variety of upland soils have shown that nBTPT consistently controlled urea hydrolysis more effectively than NBPTO (Hendrickson and Douglass, 1993). The reason for this superiority appears to relate to the rate of formation of NBPTO and the relative stability of the two compounds (Hendrickson and Douglass, 1993).
7.5.2.1 Field trials with nBTPTNumerous field studies with nBTPT amended urea have been conducted in the USA with corn (Hendrickson, 1992), rice (Buresh et al., 1988), orchardgrass (Bundy and Oberle, 1988) and Kentucky bluegrass (Joo et al., 1991), where the inhibitor has led to increases in yield and N uptake compared to un-amended urea.
Table 7.2. Corn response to the urease inhibitor nBTPT in the USA (11 years testing)(from Trenkel, 1997).
Bushels per acre (t per ha)N Source No of sites With nBTPT Without nBTPT Yield responseUrea 316 127.9
(8.02)113.7(7.13)
14.2(0.89)
UAN 119 130.9(8.21)
121.6(7.62)
9.0(0.56)
Field trials involving corn and solid urea plus nBTPT have been conducted in the US for 14 years in over 19 states. These have involved 22 universities and 7 private research companies. The average increase in yield to nBTPT addition in 316 replicated ‘nitrogen responsive’ sites was 14.2 bushels per acre (0.89 t/ha) (Table 7.2). In contrast to solid urea, UAN solutions treated with nBTPT resulted in an increase in corn yields of 9.0 bushels per acre (0.56 t/ha), when averaged for 119 replicated sites (Trenkel, 1997).
Research at the University of Maryland showed that nBTPT amended urea and UAN, surface applied at a rate of 135 kg N/ha, improved the yield of corn, making it comparable to UAN injected into the soil or AN (Table 7.3). Results from numerous field trials undertaken in various states in the USA are summarized on the Agrotain web site (www.agrotain.com). The range of crops studied include corn, wheat, barley, rice, cotton, grain sorghum, ryegrass, brome grass and sugarcane. Urea, AN and UAN solutions and nBTPT (0.14% w/w) treated urea have been compared. The results show that generally nBTPT significantly increases the yield from urea.
document.doc 70

‘Evaluation of urea-based nitrogen fertilisers’ Report for Defra projects NT2601/02
Table 7.3. Effect of nBTPT on corn yield (t/ha) in trials undertaken at the University of Maryland at two locations (from Kincheloe, 1997).
N Source Poplar Hill Wye CenterUrea 6.8 7.6Urea + nBTPT 9.1 8.6Ammonium nitrate 9.3 8.3UAN 8.5 9.1UAN + nBTPT 8.9 10.0UAN injected 9.0 -Anhydrous ammonia - 9.8
In Canada Grant (2002) reported that nBTPT reduced ammonia volatilisation from surface applications of urea under no-till and increased the effectiveness of in-crop applications of urea and UAN solutions for improving the protein content in wheat.
Few field trials have been undertaken in Western Europe with urease inhibitors. nBTPT was found to reduce NH3 volatilisation in field experiments with maize in Italy, and with sugarbeet in Turkey (Trenkel, 1997).
The value of nBTPT for temperate grassland in Northern Ireland has been shown by Watson et al. (1990b, 1994c). nBTPT (at 0.5% w/w) lowered cumulative NH3 loss from urea when surface applied to perennial ryegrass in mid summer and delayed by approximately 5 days the time at which maximum NH3 loss (Tmax) occurred (Figure 7.5). Delaying Tmax increases the chance of rain falling to move the urea below the soil surface and hence lower NH3 volatilisation. The recovery of N by difference and DM yield of the amended urea treatment were increased by 20% and 8.8% respectively compared to urea alone, making the yield performance of urea plus nBTPT comparable to that of CAN (Table 7.4).
Table 7.4. Total ammonia loss and yield performance of ryegrass with urea, urea + 0.5% nBTPT and calcium ammonium nitrate (CAN) (from Watson et al., 1990c).
Parameter Control Urea Urea +
nBTPTCAN SE Significance
Total NH3 loss (% of that applied)
- 8.10 1.89 0.09 0.620 ***
DM yield kg/ha 644 2991 3255 3278 61.0 ***Recovery of N by difference (%) - 57.2 68.6 68.7 2.69 **Significance: *** P < 0.001; ** P < 0.01
document.doc 71

‘Evaluation of urea-based nitrogen fertilisers’ Report for Defra projects NT2601/02
Figure 7.5. Daily loss of NH3-N (%) from urea, urea + nBTPT and CAN (soil temperature 16-19C)
Further field trials evaluated a range of concentrations of nBTPT (0.01, 0.05, 0.1, 0.25 and 0.5% nBTPT w/w) to determine the optimum incorporation rate for temperate grassland under a range of environmental conditions (Watson et al., 1994b). Increasing the inhibitor concentration lowered NH3 volatilisation according to a law of diminishing returns (Figure 7.6). The inhibitor was very effective at low concentrations, resulting in approximately 50% inhibition at a concentration of 0.01%. There was little benefit in using concentrations above 0.1% nBTPT on a range of grassland soils (Watson et al., 1994). However, as nBTPT is less effective at high temperatures (Carmona et al., 1990; Bremner et al., 1991), higher concentrations may be required under tropical conditions.
Figure 7.6. Effect of different levels of nBTPT on the % inhibition of NH3-N volatilisation.
A soil incubation study, using a wide range of soil types, indicated that the effectiveness of nBTPT in lowering NH3 volatilization was greatest in soils with a high pH and low buffering capacity (Watson et al., 1994). As
document.doc 72

‘Evaluation of urea-based nitrogen fertilisers’ Report for Defra projects NT2601/02
these were the soil conditions leading to high NH3 loss from unamended urea, nBTPT clearly has considerable potential to improve the efficiency of urea for temperate grassland. In addition, there is no evidence of any long-term adverse effect on grass production with repeated applications of nBTPT-amended urea over a 3 year period and no indication that its efficacy to reduce NH3 loss from urea-treated swards declined when used repeatedly on the same soil (Watson et al., 1998).
Trials with barley under conventional and zero tillage have recently shown that nBTPT had no effect on N mineralisation or on the size and activity of the soil microbial biomass (Banerjee et al., 1999). In addition nBTPT and PPD do not inhibit nitrification or denitrification (Bremner et al., 1986).
7.5.2.2 Short-term plant physiological effectsSolution culture studies have shown that urea can be taken up by plant roots as the intact molecule (Bollard et al., 1968; Harper, 1984). In soil, urea is normally rapidly hydrolysed to NH4-N, so plants would rarely take up urea as the intact molecule. However, if urea hydrolysis in soil is delayed by nBTPT then urea can be taken up by ryegrass as the intact molecule, albeit at a significantly slower initial rate of uptake than NH4-N. Transient leaf tip scorch has been shown to occur approximately 7-15 days after application of urea amended with a urease inhibitor (Krogmeier et al., 1989; Watson and Miller, 1996). Leaf tip scorch was greatest with high concentrations of nBTPT (0.5%) and high urea–N application rates (Figure 7.7). However, new developing leaves showed no visual sign of tip necrosis.
Figure 7.7. Effect of increasing urea-N application rate and nBTPT concentration on leaf tip necrosis.
document.doc 73
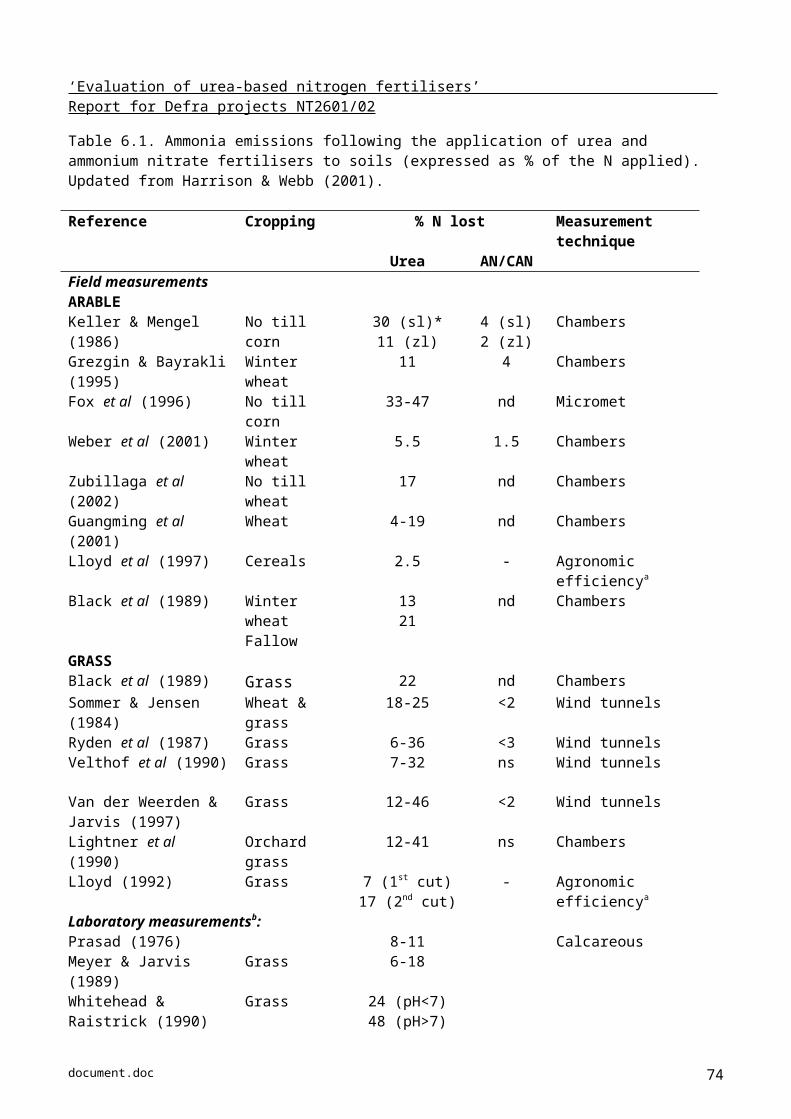
‘Evaluation of urea-based nitrogen fertilisers’ Report for Defra projects NT2601/02
0
20
40
60
80
100
120
0 1 2 3 4 5 6 7 8 9 10Days
ug N
H4-
N / g
fwt /
30
min
s
00.010.10.5
% nBTPT(S.E. = 8.07)
Figure 7.8. Effect of urea amended with different concentrations of nBTPT on shoot urease activity.
It is not clear whether the phytotoxicity is due to urea per se or as a result of pH fluctuations within the plant tissue following its hydrolysis by shoot urease. Watson and Miller (1996) showed that nBTPT amended urea markedly reduced shoot urease activity of ryegrass for the first few days after application compared to unamended urea (Figure 7.8). The higher the nBTPT concentration the longer the time required for shoot activity to return to that in the unamended treatment. At the highest inhibitor concentration of 0.5%, shoot urease activity had returned to that of unamended urea by 10 days. Root urease activity was unaffected by nBTPT in the presence of urea but was affected by nBTPT in the absence of urea. Watson and Miller (1996) studied the composition of amino-acids in roots and shoots of ryegrass and suggested that urea-N within the plant was not metabolised in the same way as N taken up in the NH4-N form.
Although nBTPT–amended urea affected plant urease activity and caused some leaf-tip scorch, the effects were transient and short-lived. The previously reported benefits of nBTPT in reducing NH3 volatilisation of urea and increasing yield would appear to far outweigh any of the observed short-term detrimental effects.
7.5.2.3 Use in flooded soilsSeveral studies have shown that PPD and nBTPT have limited success in reducing NH3 loss in flooded soils. The main reasons for the lack of success of PPD in flooded rice fields seem to be its rapid hydrolysis under the alkaline conditions generated in the floodwater by photosynthetic algae, or its decomposition due to the high floodwater temperatures. Field trials in Thailand with flooded rice showed that the activity of PPD could be prolonged and NH3 loss markedly reduced, by controlling the floodwater pH with the algicide terbutryn (Freney et al., 1993).
The failure of nBTPT in flooded soils seems to be related to the urease activity of the soil and the capacity of the soil to convert nBTPT to the oxygen analogue nBPTO. Hence, in soils with high urease activity, most of the urea is hydrolysed before appreciable conversion of nBTPT occurs, and in strictly anaerobic soils, nBTPT fails to inhibit urease activity (Byrnes and Freney, 1995). Phongpan et al. (1995) found that a mixture of nBTPT and PPD in the presence of the algicide terbutryn was even more effective than PPD alone (Table 7.5). It appears that during the time when the PPD was effective, nBTPT was being converted to the oxygen
document.doc 74
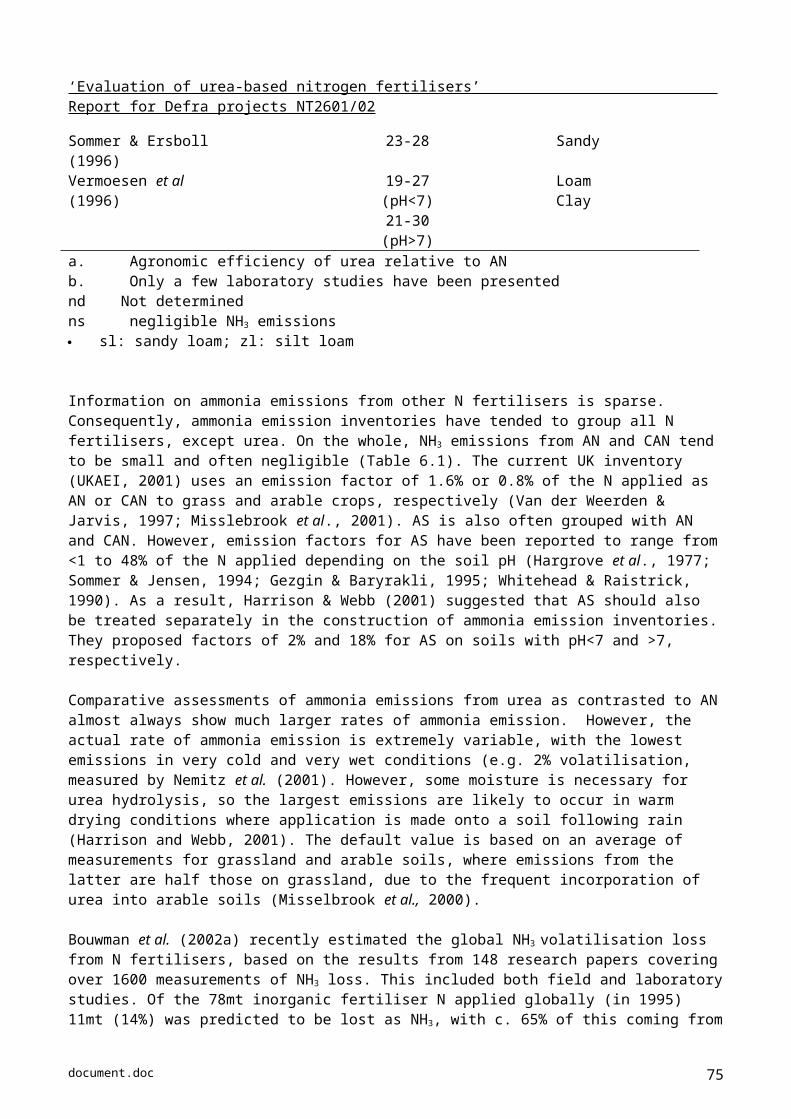
‘Evaluation of urea-based nitrogen fertilisers’ Report for Defra projects NT2601/02
analogueue, which inhibited urease activity when PPD lost its capacity to inhibit urease activity. The combined urease inhibitor – algicide treatment reduced NH3 loss from 15 to 3% of the applied N and increased grain yield from 3.6 to 4.1 t/ha (Table 7.5). Chaiwanakupt et al. (1996) found that the grain yield of flooded rice was increased by the application of urease, algal and nitrification inhibitors.
Table 7.5. Effect of inhibitor treatments on ammonia loss and grain yield of flooded rice top-dressed with urea (60 kg N/ha) and algicide terbutryn (from Phongpan et al., 1995).
Total NH3
loss (% of applied N)after 11 days
Grain yield*(t/ha)
Urea 15.0 3.6nBTPT 5.4 3.7PPD 7.3 4.0nBTPT + PPD 3.0 4.1LSD (P = 0.05) 2.38 0.28* Plots without added N yielded 2.7 t/ha.
It appears that inclusion of an inhibitor with immediate inhibitory activity rather than use of nBTPT alone is essential to decrease NH3 loss in tropical flooded soils. Because the oxygen analogues of the triamides have immediate inhibition, it is logical that mixtures of the oxygen and thio compounds may find a niche in markets with flooded rice or on soils that convert the thio compound to its active form too slowly to be effective. Further research is required on the forms and amounts needed prior to urease inhibitors being used commercially in tropical systems.
7.5.2.4 nBTPT and seedbed ureaUrea has an adverse effect on seed germination and seedling growth in soil (Tomlinson, 1970; Court et al., 1964) because of the accumulation of high NH4
+-N and NO2- -N concentrations in close proximity to the seed
following rapid hydrolysis of urea by soil urease. nBTPT has been shown to reduce seedling damage from seed-placed urea (Bremner and Krogmeier 1988; Xiaobin et al., 1995) and to improve the emergence of cereal seedlings with urea under simulated combine drilling conditions in a greenhouse. Only 6% of spring barley seedlings emerged when urea was applied at an equivalent rate of 60 kg N/ha compared with 56% in the presence of 0.1% nBTPT (Watson, unpublished). The % emergence with amended urea applied at 60kg N/ha was comparable to that with CAN applied at 80 kg N/ha (Table 7.6).
Table 7.6. Effect of urea amended with N-(n-butyl) thiophosphoric triamide (nBTPT) on the emergence of spring barley seedlings 14 days after sowing.
Fertiliser Rate applied(kg N/ha)
Emergence(%)
Average seedlingheight (mm)
Control 0 82.5 73.7Urea 60 6.0 24.0Urea 80 3.5 24.6CAN 60 75.5 37.9CAN 80 58.0 24.4Urea + nBTPT 60 56.0 36.7Urea + nBTPT 80 36.0 21.1s.e. (21 df) 2.93 6.13
document.doc 75
‘Evaluation of urea-based nitrogen fertilisers’ Report for Defra projects NT2601/02
Recent field trials in Canada have shown the effect of seed-placed urea and nBTPT on emergence (Malhi et al., 2001) and grain yield of barley (Grant and Bailey, 1999). Table 7.7 shows the effect of seed-placed urea, with (+) and without (-) 0.14% nBTPT, on stand density (plants/m2) of barley at 2 sites averaged for 3 growing seasons (from 1994 to 1996). The stand density decreased with increasing N rate indicating seedling damage from the applied urea. nBTPT significantly reduced seedling damage and improved seedling emergence at N rates where damage from seed-placed urea occurred. Dry-matter yield at heading was frequently not increased by use of nBTPT but grain yield was generally higher when nBTPT was used than in its absence. Table 7.8 shows the grain yield, averaged over 3 years, at each of the 2 sites.
Table 7.7. Effect of seed placed urea with (+) and without (-) the urease inhibitor nBTPT, on stand density (plants/m2) of Bedford barley on a clay loam and fine sandy loam soil, averaged over 3 years (1994 to 1996) (from Grant and Bailey, 1999).
Clay loam Sandy loamN (kg/ha) (-) nBTPT (+) nBTPT (-) nBTPT (+) nBTPT0 134.2 125.220 121.5 129.6 130.6 135.240 117.1 129.4 119.8 126.560 110.4 124.8 99.6 117.580 94.4 127.5 95.2 117.1100 80.4 114.2 76.5 122.1S.E. 4.18 4.17
Table 7.8. Effect of seed placed urea with (+) and without (-) the urease inhibitor nBTPT, on grain yield (kg/ha) of Bedford barley on a clay loam and fine sandy loam soil, averaged over 3 years (1994 to 1996) (from Grant and Bailey, 1999).
Clay loam Sandy loamN (kg/ha) (-) nBTPT (+) nBTPT (-) nBTPT (+) nBTPT0 2810 235220 2773 2784 2425 241340 2798 2987 2486 274460 2890 2905 2429 255980 2870 3368 2472 2653100 2436 3027 2266 3016S.E. 178.5 142.4
7.5.2.5 Control of ammonia emissions from livestock manuresCurrent waste management systems for cattle feedlots and swine facilities in the United States result in N losses of approximately 75%. Most of this loss occurs through NH3 volatilisation following the rapid hydrolysis of urinary N (urea). This contributes to odour, environmental problems and loss of a valuable fertiliser resource. The urease inhibitors cyclohexylphosphoric triamide (CHPT), phenyl phosphorodiamidate (PPD) and N-(n-butyl) thiophosphoric triamide (nBTPT) have been shown to delay the hydrolysis of urea and reduce NH3 emissions from livestock facilities, increasing the fertiliser value of the livestock wastes by improving the N:P ratio for plant growth (Varel, 1997; Varel et al., 1999). The most effective method of preventing urea hydrolysis was to spray the surface of the manure with the urease inhibitors, once per week.
Further work is required to determine whether urease inhibitors applied to livestock manures are cost effective. The di- and tri-amide urease inhibitors are not toxic to animals, do not have antibacterial activity and are not
document.doc 76
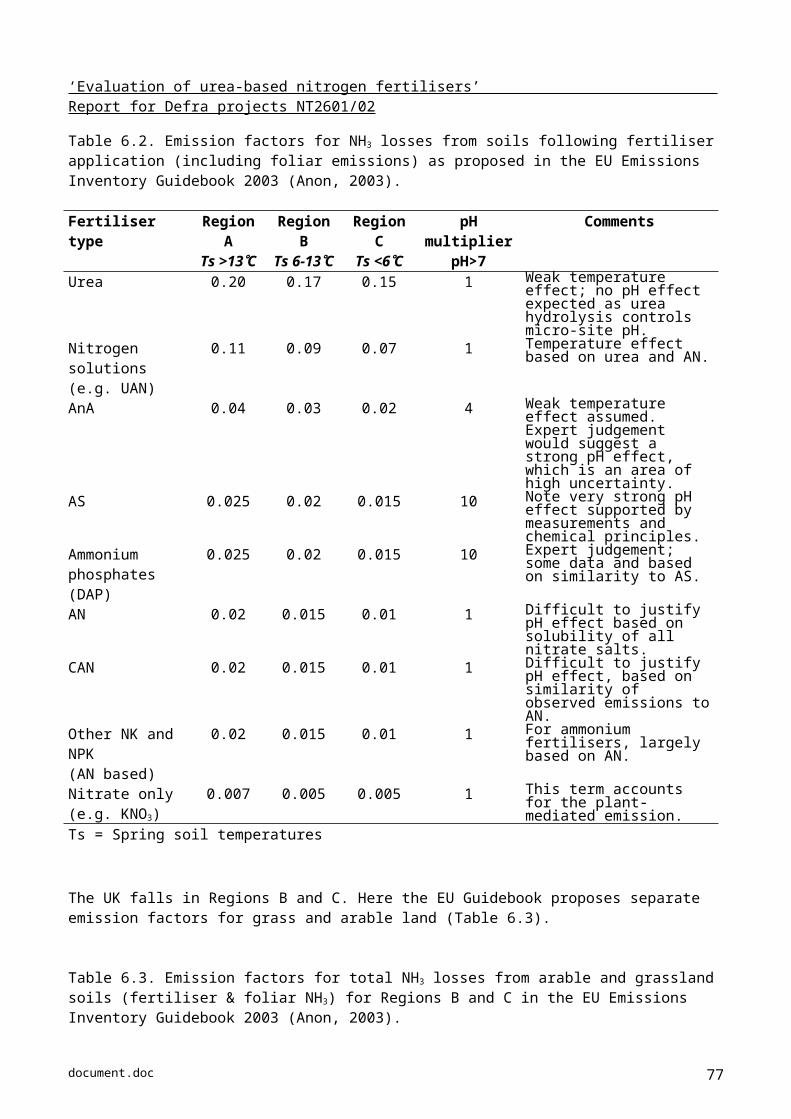
‘Evaluation of urea-based nitrogen fertilisers’ Report for Defra projects NT2601/02
known to present any environmental problems when used at concentrations which effectively inhibit urease activity. These are important considerations if such inhibitors are to be used in or around animal facilities.
In addition, nBTPT has been used to reduce the rate of NH3-N release from dietary urea in in vitro digestion experiments and therefore has the potential to improve non-protein N utilisation in ruminants (Ludden et al., 2000).
7.5.3 Agrotain – a commercially available urease inhibitornBTPT was first introduced by IMC-Agrico for the American corn market in spring 1996, under the trade name of Agrotain. A new branch of the company was launched in the year 2000 called ‘Agrotain International’ who have expanded their marketing to Australia, Argentina, Canada, New Zealand and have recently obtained approval for the use of Agrotain in Ireland. Registration in South America, particularly Brazil, is likely in 2003. The Department of Agriculture and Food in Dublin have given the fertiliser company Quinphos Ireland (subsidiary of Summit Quinphos, New Zealand), approval to market Agrotain treated urea in Ireland from January 2003. The product is called Sustain which uses granular urea (from Germany), that has been spray impregnated with Agrotain at 0.15% w/w and blended with bentonite-S to provide 4% S. Summit Quinphos in Auckland, have been selling Sustain in New Zealand for approximately one year. The New Zealand product is slightly different to the Irish product in that wet elemental sulphur coats the Agrotain treated urea to give 4% S.
Agrotain is formulated as a green clear liquid containing 25% of the active ingredient nBTPT. The nBTPT is in a mixed solvent consisting of 10% by weight of N methyl-pyrolidone with the balance consisting of a non-hazardous solvent and inert ingredients (IMC-Agrico, 1997). This can be used to impregnate urea granules, be added to the urea melt during manufacture, or be added to UAN fluid fertiliser solutions prior to spreading in the field. The recommended rate for spray impregnation is 0.11 to 0.14% (1.1 to 1.4kg of active ingredient per tonne of urea). This requires a concentrate loading of approximately 3.91 to 5.21litres/t of urea. Urea impregnated at this concentration will be effective in inhibiting the activity of urease regardless of the rate of urea application.
The shelf life of Agrotain in solid urea is dependent on its concentration and the way that it is applied. A new stabilisation technique (patented by Agrotain International) has shown that Agrotain incorporated within the urea granule is stable for several years (Semple 2003, pers. comm.). In dry bulk blends, the urea should be impregnated prior to the introduction of other fertiliser materials. For UAN solutions, the recommended concentration is 2.0 to 2.7litres/t for a 30% N solution. This amended UAN solution should be applied soon after mixing as nBTPT gradually decomposes in the presence of water. In pre-mixed UAN solutions, there is a loss of approximately 5% nBTPT in 10 days at 25 C.
Agrotain has successfully passed extensive toxicological and environmental tests and degrades into fertiliser elements N, P and S after approximately 10-14 days. It is compatible with most agricultural chemicals (IMC-Agrico, 1997).
Agrotain has been used on a wide variety of crops. It is primarily recommended for pre-plant surface application of urea and urea-containing fertilisers but can be used as pre-emergence, side dressing, top-dressing or other post-planting applications. A version of Agrotain containing nBTPT is marketed under the label of ‘conserve N’ as an additive to livestock waste for control of odour. Agrotain is also showing potential as a safener (prevents the adverse effect of urea on seed germination and seedling growth) when urea is placed in close proximity to small grain cereals and canola (Sutton, 2000, pers. comm.), and has been shown to significantly reduce N leaching compared to unamended urea in a fine sandy soil (Prakash et al., 1999). Malhi et al. (2001) found that using the inhibitor Agrotain 'showed promise' in improving the efficiency of surface-applied urea under no-till, and reduced seedling damage from seed-placed urea. Grant (2002) reported that Agrotain reduced ammonia volatilisation from surface applications of urea under no-till and increased the effectiveness of in-crop applications of urea and UAN for improving protein content in wheat. However, these authors wanted more research on defining the limitations of Agrotain to improve the safety of seed-placed urea and on its impact on ammonia and greenhouse gas emissions under a range of agricultural systems.
document.doc 77
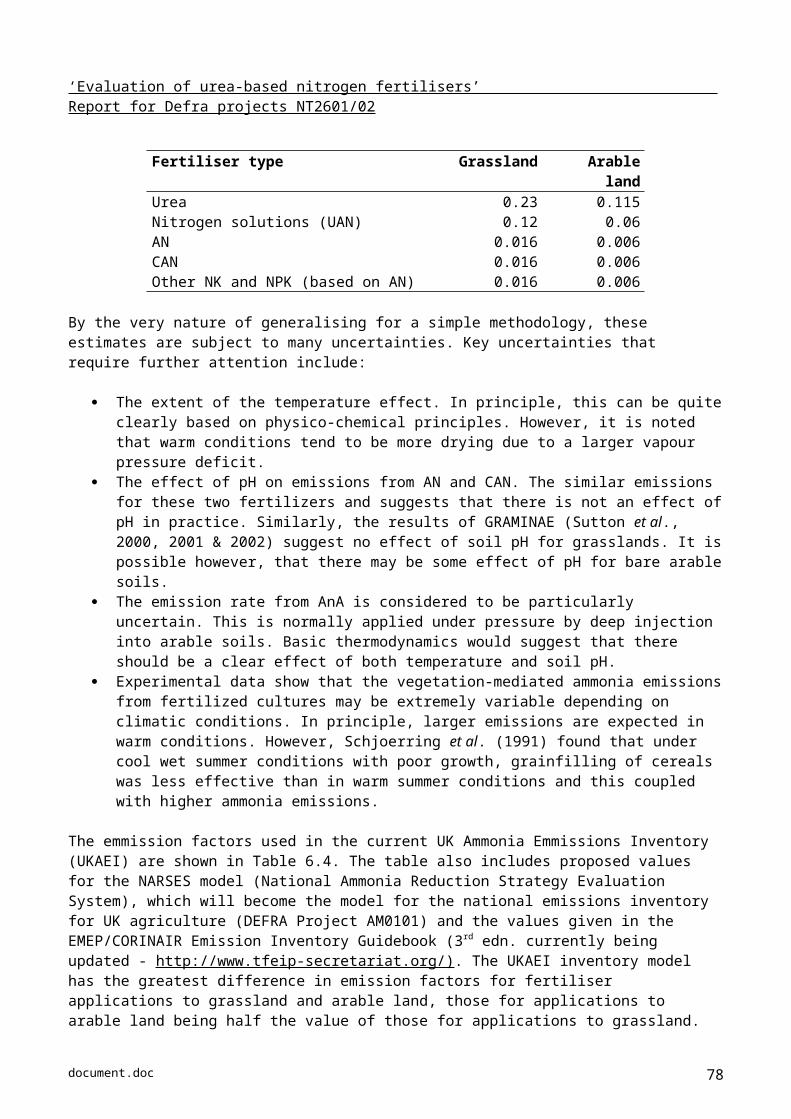
‘Evaluation of urea-based nitrogen fertilisers’ Report for Defra projects NT2601/02
Other commercially available products which are registered trademarks of IMC Phosphates Company, licensed exclusively to Agrotain International LLC are Super U, UFLEX and UMAX which contain varying proportions of nBTPT and the nitrification inhibitor dicyandiamide (DCD). These products are for the amenity and horticultural market and are regarded as slow release products. The distributors for these products in the UK are Headland Amenity and Vitex (Semple, 2003, pers. comm.).
In the US, the cost of treating urea with Agrotain is US$66-68 per tonne of urea. At that price, it would cost US$20 to impregnate solid urea at an application rate of 135kg/ha N and US$10 to treat UAN solution 28%N (at the same application rate of N). Results from 316 N responsive sites demonstrated that Agrotain treated urea increased corn yields by 14.2 bushels per acre. With corn at US$2.67 per bushel (autumn 1997), this increase would result in an additional gross income of US$38 or a net income of US$18 per acre. However, the actual net income is dependent on the price of corn, which is linked to the US government support programme. The practice of applying extra N to no till or low tillage systems to compensate for possible NH3 losses could be discontinued; this would further improve the economics of using Agrotain.
If the additional cost of amending urea is $68 per ton this is equivalent to c.$150 per ton of N or approximately £100. The current price differential between urea and CAN in the UK is c.£110/t N, so currently there is only a slight advantage in using amended urea. However, when comparing the economics of Agrotain-amended urea and CAN, the lime requirement of the two fertilisers needs to be considered. Soil acidity is influenced by ammoniacal fertiliser sources which produce H+ ions during nitrification. Generally 1.8 t CaCO3 is required to neutralise the acidity of 1t N as urea. Acidification caused by CAN is partly compensated by its CaCO3 content (~21%), so that 1t lime is required to neutralise the acidity of 1t N as CAN. Use of amended urea instead of CAN would require an extra 0.8t lime per t N which would cost an additional £12. Hence this would make the amended urea product more expensive than CAN on a unit N basis. The lime requirement of ammonium nitrate and urea are the same (Table 7.9).
Table 7.9. Soil acidity produced by N materials (from Adams, 1984).
N material Nitrification reaction Acid residue CaCO3 equivalentkgCaCO3 / kg N
Ammonium Sulphate (NH4)2SO4 + 4O2 4H+ + 2NO3
- + SO42- + 2H2O
4H+
2NO3-
SO42-
5.4
Urea (NH2)2CO + 4O2 2H+ + 2NO3
- + CO2 + H2O2H+
2NO3-
1.8
Ammonium nitrate NH4NO3 + 2O2 2H+ + 2NO3
- + H2O2H+
2NO3-
1.8
7.6 Conclusions1. Ammonia emissions from urea could potentially be reduced by slow release formulations, chemical
additives, changing pellet size, soil incorporation and urease inhibitors. Modified urea products (e.g. inhibitors, acidifying agents, soluble salts, etc) provided the greatest economic benefit compared with conventional urea in situations where the price of urea, the crop response to urea and the potential loss of urea were all high. Economic benefits were also improved if the modifications increased the maximum crop yield, as well as reducing N losses.
2. Slow release fertilisers such as sulphur-coated urea can be applied at a high rate (up to 380 kg N/ha) and have often resulted in yield increases because of reduced leaching losses. Although some of these products
document.doc 78

‘Evaluation of urea-based nitrogen fertilisers’ Report for Defra projects NT2601/02
were shown to reduce NH3 loss from urea, they were generally considered to be uneconomic for present agricultural use. Any uncertainty over the release of N from slow release fertilisers could lead to more unused N being left after crop growth that could subsequently increase the risk of leaching losses.
3. Mixing urea with acidic materials lowers the microsite pH and suppresses the build up of high NH3 concentrations in the soil. However, under acidic conditions (pH<5), the enzyme urease may also become irreversibly inactivated. Several studies have reported the ability of inorganic salts such as CaCl2, Ca(NO3)2, KCl, KNO3 and MgSO4, to reduce NH3 volatilisation from urea. However, the benefit may not be cost-effective, as large quantities of salts are required, and nutrient imbalances may also occur.
4. Increasing pellet size could potentially decrease the rate of urea hydrolysis, delay the time at which the maximum rate of NH3 loss occurs and so allow a greater opportunity for rainfall to move the urea below the soil surface, reducing NH3 volatilisation. However, the influence of pellet size on NH3 losses has been shown to be small and varied with soil type.
5. Incorporation of urea below the soil surface will minimise NH3 volatilisation. However, incorporation of topdressed solid urea would be impractical in most agricultural systems. Soil incorporation may be possible for fluid fertiliser applications if some means of injection into the soil was adopted, but the capital and time-related costs of purchasing and using injection equipment are likely to be a major limiting factor.
6. Band-spread urea could potentially decrease NH3 emissions as less of the banded urea is in contact with the soil compared with broadcast urea. However, the placement of urea in a band can result in a region of high pH and NH4
+ concentration in the immediate vicinity of the band and this is likely to enhance NH3 emissions. Also, this could inhibit nitrification leading to an accumulation of NO2
- and possible increase in N losses as N2O. Root growth may also be inhibited as a result of NH4
+ toxicity in the vicinity of the band.
7. Inhibiting urease activity slows the conversion of urea to NH4+ and hence the potential for NH3
volatilisation and seedling damage. Slowing the hydrolysis of urea allows more time for the urea to diffuse away from the application site, or for rain or irrigation to dilute urea and NH4
+ concentration at the soil surface and increase its dispersion in the soil.
8. Thousands of chemicals have been tested for their potential as inhibitors of soil urease activity. Few have proved both effective and commercially attractive. The only current practicable option is N – (n-butyl) thiophosphoric triamide (nBTPT), sold as ‘Agrotain’. Numerous field studies with nBTPT-amended urea have been conducted in the USA with arable crops and grass, where using the inhibitor has increased yield and N uptake compared with un-amended urea.
9. In the few studies conducted in Europe (Italy, Northern Ireland & Turkey), nBTPT has been found to reduce ammonia volatilisation from surface applications of urea. Increasing the inhibitor concentration reduced NH3 volatilisation according to a law of diminishing returns: the inhibitor was very effective at low concentrations, resulting in approximately 50% inhibition at a concentration of 0.01%. There was little benefit in using concentrations above 0.1%.
10. nBTPT has been shown to reduce seedling damage from seed-placed urea and to improve the emergence of cereal seedlings with urea under simulated combine drilling conditions in a greenhouse.
11. In Northern Ireland studies, there was no evidence of any long-term adverse effects on grass production with repeated applications of nBTPT-amended urea over a 3-year period, and no indication that its efficacy to reduce NH3 loss from urea-treated swards declined when used repeatedly on the same soil. nBTPT has been shown to have no effect on N mineralisation or on the size and activity of the soil microbial biomass; it does not inhibit nitrification or denitrification.
12. Agrotain has successfully passed extensive US-EPA toxicological and environmental tests and degrades into fertiliser elements N, P and S after approximately 10-14 days. It is compatible with most agricultural chemicals. Its shelf life in solid urea is dependent on its concentration and the way that it is applied. A new stabilisation technique has shown that Agrotain incorporated within the urea granule is stable for several years. UAN amended solutions should be applied soon after mixing, as nBTPT gradually decomposes in the presence of water.
document.doc 79
‘Evaluation of urea-based nitrogen fertilisers’ Report for Defra projects NT2601/02
13. Agrotain has been shown to reduce N leaching compared with unamended urea, to improve the efficiency of surface-applied urea under no-till, to reduce seedling damage from seed-placed urea, to reduce ammonia volatilisation from surface applications of urea under no-till, and to increase the effectiveness of in-crop applications of urea and UAN for improving the protein content in wheat. However, more research is needed under UK conditions, to define the ability of Agrotain to improve the safety of seed-placed urea and to quantify its impact on ammonia and greenhouse gas emissions under a range of agricultural situations.
14. Of the many ammonia mitigation methods tried, slow release forms of urea and the urease inhibitor Agrotain are the only significant, commercially available options. The former is expensive and considered a specialist product for high-value crops. Agrotain (N – (n-butyl) thiophosphoric triamide, nBTPT) is now widely available as a commercial inhibitor the use of which has been proven in many situations, with no short- or long-term adverse effects on crops or soils. However, its very efficacy can cause problems via the increased risk of leaching of urea to waters. Depending on Agrotain, crop and fertiliser prices its use could be cost-effective but this and its impact on emissions to the environment need to be tested under a wide range of UK conditions.
document.doc 80

‘Evaluation of urea-based nitrogen fertilisers’ Report for Defra projects NT2601/02
8. Effects on soil processes
(Lead author: Keith Goulding, Rothamsted Research)
8.1 Factors affecting soil processesBefore considering the likely impact of urea on soil biological and chemical processes some general introduction to the factors that affect these processes is necessary.
The productivity and health of agricultural systems depend greatly upon the functional processes carried out by soil microbial communities - bacteria and fungi. Soils contain very large and diverse bacterial populations, typically 108 – 1010 bacterial cells (estimated to represent at least 106 different species) per g soil, with several orders of magnitude fewer filamentous bacteria (actinomycetes) and fungi. In some ecosystems, 'keystone species' can be identified: their removal causes a significant change in the functioning of the ecosystem; an example of this would be rhizobia in a legume-based pasture. However, for most processes carried out by soil bacteria, the identification of keystone species is impossible. It is more relevant to identify keystone processes or functions, although the species diversity underpinning such functions may be important in conferring stability and resilience to the function. The presence of a range of individual species with different physiological optima for a particular function may provide continuity of that function in a changing environment. In such dynamic systems, the relative abundance of particular species would be expected to be spatially and temporally variable. Nevertheless, there are some groups of organisms that can be associated with particular processes and are almost always present, corresponding to “core species”.
The management of soils has a great impact upon the overall 'health' of microbial communities. However, soils are highly variable in space and time. The nature of a soil depends on many factors including the minerals from which it is derived, the geological processes that formed it, local climatic factors, aspect and slope. Superimposed on this are long-term climatic changes, seasonal cycles and daily variation in weather (rainfall, temperature), and soil management. Thus, soil ecosystems are fundamentally both diverse and dynamic. The abiotic chemical and physical properties of soil influence, and in turn are affected by, the microbial, plant and animal populations that it supports. Crops and their associated microflora, their exudates and residues, animal manures and other organic soil amendments are the major biotic inputs; inorganic fertilisers and atmospheric deposition are the main abiotic inputs in agricultural systems. One must assess the impact of urea and N fertilisers generally on soil processes in the context of soil variability and the relative importance of all the influencing factors.
Plants have a major impact on soil processes. Manipulation of the soil biota via crop rotation is an accepted part of agricultural practice. In some circumstances it is the only way to control the build up of soil pests such as plant pathogenic nematodes. The roots of growing plants help to aerate soil by creating channels through which water, soil solutions, associated microorganisms and soil invertebrates can move faster than is possible via the torturous channels formed by the voids between soil aggregates. Root system architecture and rooting depth affects soil aeration, increasing both the availability of oxygen and the level of CO2; the latter is increased by root respiration. As roots grow they exude carbon-rich compounds, mainly sugars and organic acids, and deposit extracellular polysaccharides, lysates from cells damaged by their passage through the soil and entire cells sloughed from the root surface. Together, this rhizodeposition increases microbial growth around roots and creates the 'rhizosphere effect'. The composition of root exudates and the other inputs to soil varies according to plant type and favours different groups of microorganisms accordingly. Added to this effect are more specific signal molecules produced by roots in smaller quantities, which may be volatile or soluble and tend to diffuse further than the major components of rhizodeposition. These molecules may attract or stimulate groups of microorganisms with which the plant has a beneficial or symbiotic relationship (e.g. legumes signal to their specific rhizobial symbionts) but also signal the presence of the plant to potential pests and pathogens. Thus plants have both direct and indirect effects on soil microorganisms which can be difficult to predict.
document.doc 81

‘Evaluation of urea-based nitrogen fertilisers’ Report for Defra projects NT2601/02
The pH of the soil has a major effect on chemical and biological processes, and is probably the most significant factor affecting soil biota, both microorganisms and larger organisms. In very acid soils (<pH 4) decomposition of plant litter is inhibited. Increasing the plant productivity of soils using ammonium-based fertilisers, elemental sulphur or by growing legumes tends to reduce pH, and the practice of adding lime to return pH towards 6 and above has been known since Roman times. Nitrogen fertilisers will therefore have a significant impact on all processes affected by pH. As already indicated above in section 4, AN acidifies soil and urea produces transient local alkalinity followed by acidity. Soil acidification is well understood and ameliorated with lime in arable soils, less so in grassland soils.
Ploughing can improve soil structure and thus oxygen and water availability, important for their diffucion through the soil, microbial activity and healthy plant growth. However, it also disturbs the soil and severely impacts on some organisms that seem to require stability such as methane oxidisers (e.g. Goulding et al. 1995). Also, some vulnerable soils are damaged by excessive cultivation or by compaction during cultivation. Minimum tillage methods protect such soils but require alternative management strategies especially for control of weeds. This usually means more herbicide use, which may in turn affect soil microorganisms. Incorporating urea to reduce ammonia emissions is unlikely to impact on chemical and biological processes if it were part of general cultivations. If it added an extra cultivation treatment then the extra disturbance could impact on biological processes, but probably not severely.
Animal manures can have a major impact on soil processes, affecting losses of N to the environment and N cycling generally. Grazed meadows receive urine and faeces in localised ‘hot spots’ which, like farmyard manure, provides a wealth of 'foreign' bacteria. Both the short- and long-term application of manures increases soil organic matter and the SMB.
8.2 Impacts of urea on biological processesCompared with the major factors controlling biological processes in soil, impacts arising from nitrogen fertilisers have always been observed to be small. As explained in section 4.1, the interconversion of ammonium and nitrate in soil is an important process. Nitrification, the conversion of ammonium to nitrate via nitrite, is carried out by two specialised groups of bacteria: the ammonia oxidizers and the nitrite oxidizers. The majority of ammonia and nitrite oxidizers in agricultural soils identified to date belong to only a few species. Nitrite oxidizers (e.g nitrobacter) in particular, are very sensitive to soil pH. During urea hydrolysis, the rise in soil pH in the vicinity of the fertiliser granule can inhibit the oxidation of nitrite to nitrate leading to an accumulation of nitrite in soils which can result in increased N2O emissions (Gould et al., 1986; section 6.2).Clearly an impact of urea or a urease inhibitor on nitrogen cycling processes, especially nitrification, could be harmful to soil function.
Urea hydrolysis increases with pH up to pH 8.5-9. Both the hydrolysis and the NH3 produced 'interfere' with microbial reactions; NH3 concentrations may be locally toxic. This is important where alkaline microsites are located at the soil surface, where the effect can increase NH3 volatilisation, and near germinating seedlings. However, the effect can be ameliorated by appropriate methods of application (Tomlinson, 1970).
Banding fertilisers may increase the local concentration of ammonia and, therefore, ammonia toxicity, and also exaggerate that effect by locally increasing pH. In soils at pH 5, lime, but not gypsum, removed the symptoms of ammonia toxicity, it was assumed by increasing the pH and making available free calcium ions (Zhang and Rengel, 2000).
Banerjee et al. (1999) found no impact of urea or the urease inhibitor Agrotain on the soil microbial biomass (SMB) in a 1-year trial. As suggested in section 8.1, the spatial and temporal variations in microbial, chemical and biochemical properties were found to be much larger than any changes resulting from urea or the inhibitor. Neither is there any evidence of changes to soil processes from the repeated use of nitrogen fertilisers (Ryan and Ash, 1999; Mendum et al., 1999). However, the long-term impact of applying urea with inhibitors has not been assessed.
document.doc 82

‘Evaluation of urea-based nitrogen fertilisers’ Report for Defra projects NT2601/02
A recent observation by Malhi et al. (2002) that urea application may result in slower rates of accumulation of organic N and C in the ‘light fraction’ of grassland soils, has important consequences for C sequestration potential of grasslands and needs further investigation. This observation also need reconciling with results of an earlier study by Nannipieri et al. (1985) which demonstrated that with urea, more N was immobilised in microbial biomass. Another potentially important environmental effect of urea application is its impairment of the methane oxidation capacity of grassland soils (Hutsch, 2001).
A major change to urea fertiliser would lead to increased variations in soil pH in the region of fertiliser particles. Hydrolysis of urea will cause an increase in pH, often large (see section 4.1), followed by a decrease as ammonium is nitrified and protons produced. One might expect this ‘swing’ in pH to exert an additional stress on soil microbes, perhaps altering the community structure. However, it would be wrong to over-state the likely impacts of such an effect. First, a change in community structure (if it does occur) will not necessarily have any impact on soil functioning. Second, in areas of the world where urea has been used continuously for many years there has been no indication of a problem, although few studies have been conducted to look for such changes in population or function. With no body of evidence on this topic, it would seem prudent to conduct some experimental work to specifically search for long-term impacts of continued urea application if suitable sites can be found. Presumably greatest effects would be expected in poorly buffered soils, probably sandy soils with low organic matter content and CEC.
In this context, however, Hargreaves et al. (2003) recently examined the variation of the SMB under arable land and woodland. They found CVs of c. 25% for both. This was surprising when compared with CVs for chemical properties (pH, etc.) of <10% for the arable land and >25% for the woodland. They concluded that SMB would not be a good indicator of environmental change unless unreasonably large numbers of samples were analysed. One can conclude from this that significantly different impacts of urea on the SMB compared to other forms of N fertilisers are likely to be hard to measure.
8.3 Impacts of urea on chemical processesImpacts of urea on soil chemical processes will occur through (a) the addition of N to the soil systems and (b) the change in pH caused by the hydrolysis to ammonium and subsequent transformation processes described above and in section 4.1.
In adding N to soil, urea is no different from any other fertiliser. Approximately the same amount of N will be applied as with AN, and this been observed to have little if any observable effect on soil chemistry, as might be expected. An old arable soil containing 1% organic carbon will contain c. 0.1% N in total. This equates to c. 2.5 t N/ha in a plough layer of 23 cm. A 250 kg N/ha application of urea equates to an extra 10% N to this layer and much less to the whole soil depth. Most arable and especially grassland soils contain >0.1% total N. Applying fertiliser thus has a relatively small impact on total soil N levels. It does, however, have a significant impact on available inorganic N, which is exactly the aim. The main impact of this is on biological processes, as described above, and of course on N losses as described in section 6.
The net effect of AN and urea on soil acidity and lime requirement is the same: the nitrification of 2 mols of N in AN or urea produces 2 mols of protons, H+ (Kennedy, 1986). However, as explained in section 8.2, applying urea produces large localised swings in pH: firstly a large increase as urea is hydrolysed, perhaps to reach pH 9 around the urea prill or granule; then a marked reduction in pH as the ammonium ions are nitrified. Thus the net change to the whole soil is small but in the locality of the prill/granule the effect will be quite extreme.
In the context of this report, the main consequences of such changes in pH are to the availability of other nutrients. Soil pH has a marked effect on the availability of phosphorus (P) and trace elements. Generally, the availability of P and most trace elements decreases as pH increases over the range relevant here, pH 6-9 (MAFF, 2000). (The availability of these nutrients can also decrease at more acid pH values, but these are not likely in the well-managed soils to which large amounts of urea will be applied.) Thus seedlings could be briefly starved of P and trace elements during urea hydrolysis if urea is applied too close to the seed. However, this is unlikely for the reasons described in section 5. Besides, hydrolysis is usually rapidly followed by
document.doc 83
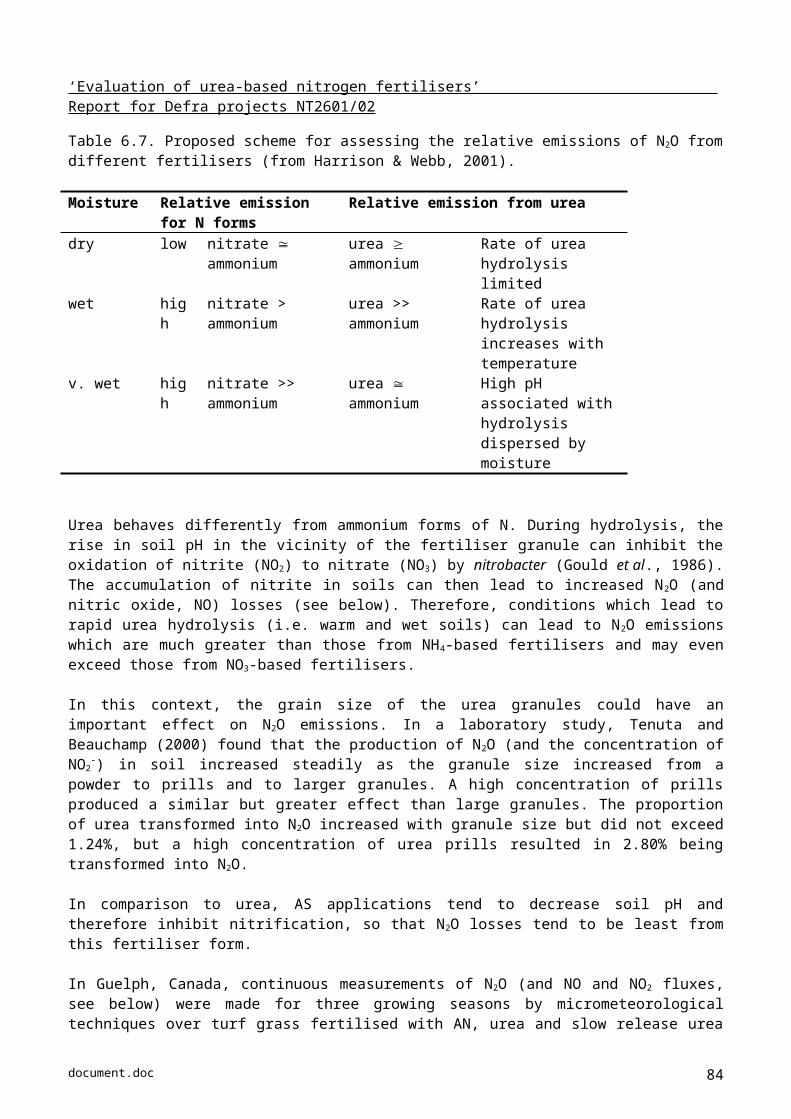
‘Evaluation of urea-based nitrogen fertilisers’ Report for Defra projects NT2601/02
nitrification (section 4), so any deficiencies will be transient. It is possible that localised nutrient deficiencies contribute to the sometimes observed reduction in yield from urea compared to other forms of N. There is no detailed research to prove that this is so, however.
Literature searches reveal nothing that is not covered elsewhere in this report on the effects on soil chemical processes of urea compared to other fertilisers. The focus of comparative research is always N losses, i.e. nitrate leaching, volatilisation and denitrification, and these are covered fully in section 6. It is highly unlikely that applying urea instead of AN or other forms of N fertiliser will impact on soil chemical processes other than on N losses.
8.4 Conclusions1. The productivity and health of agricultural systems depends on the functional processes carried out by soil
microbial communities - bacteria and fungi. The management of soils has a great impact upon the overall 'health' of microbial communities. However, soils are highly variable in space and time; they are diverse and dynamic. It is important to consider the impact of urea and nitrogen fertilisers generally on soil processes in the context of soil variability and the relative importance of all the influencing factors. Compared with the other major factors controlling biological and chemical processes in soil (e.g. pH, organic matter content), impacts arising from nitrogen fertilisers have always been observed to be small. No impact of urea (or Agrotain) on the soil microbial biomass (SMB) was observed in a 1-year trial. The spatial and temporal variations in microbial, chemical and biochemical properties were found to be much larger than any changes resulting from urea or the inhibitor.
2. The hydrolysis of urea will cause an often large increase in pH around the prill or granule, followed by a decrease as NH4
+ is nitrified and protons produced. The rise in pH in the vicinity of the fertiliser granule can inhibit the oxidation of NO2
- to NO3-, leading to an accumulation of NO2
-, which could be leached or denitrified to N2O. One might expect this ‘swing’ in pH during hydrolysis and then nitrification to exert an additional stress on soil microbes, perhaps altering the community structure. However, a change in community structure (if it does occur) will not necessarily have any impact on soil functioning. With no body of evidence on this topic, it would seem prudent to conduct some experimental work to specifically search for long-term impacts of continued urea application (and Agrotain) if suitable sites can be found.
document.doc 84
‘Evaluation of urea-based nitrogen fertilisers’ Report for Defra projects NT2601/02
9. Modelling ammonia emissions
(Lead author:- Tom Misselbrook, IGER; John King & Jim Webb, ADAS)
It has been demonstrated elsewhere in this report and from the literature (Harrison & Webb, 2001) that following application, urea can lose considerable amounts of applied nitrogen (up to c.50%) to the atmosphere as ammonia gas. Models of the emission of ammonia gas from the soil after the application of urea are required to help predict future emissions in the event of increased urea usage, and also to help identify ways to ameliorate losses and evaluate the efficacy of such treatments.
Models to date focus on either:-1. the whole nitrogen cycle, with an input option for fertiliser N, but usually not specific forms of N fertiliser -
good examples are SUNDIAL, NCYCLE and WELL-N, or 2. ammonia volatilisation, mostly from manures.
Specific urea-based models are relatively few and are listed in Table 9.1. They are either empirical (Stevens et al., 1989), or mechanistic, process based models which require several soil and climate parameters in order to run (Sherlock & Goh, 1985; Rachhpal-Singh & Nye, 1986a, b, c; Roelcke et al., 1996). One model developed at the University of Georgia (USA), which does not seem to be formally described in the literature, is available downloadable from the web-site of a manufacturer for a urease inhibitor (IMC-Agrico, 2003). This is primarily targeted at farmers as a demonstration of the (economic) effectiveness of the urease inhibitor Agrotain (N-(n-butyl)-thiophosphoric triamide: nBTPT), but includes a prediction of ammonia volatilisation from urea applications. Models of ammonia volatilisation from flooded (rice paddy) soils (Jayaweera & Mikkelsen, 1990) and slurry manure sources (Génermont & Cellier, 1997; Hengnirun et al., 1999) may also be suitable (with some adaptation) for predicting ammonia losses from urea applications.
One of the earliest detailed mechanistic models of ammonia volatilisation from urea was produced by Rachhpal-Singh and Nye (1986a,b) and Rachhpal-Singh (1987); Kirk further developed this model (1991a,b). Roelke et al. (1996) modelled ammonia volatilisation from urea applied to laboratory columns of calcareous Chinese soils (1996) based largely on Rachhpal-Singh and Nye’s (1986a,b) model.
Godwin et al. (1984) produced a simple but workable model of ammonia volatilisation for use in larger simulation models, based on earlier work by Reddy et al. (1979); ammonia loss is a function of soil pH, application depth, wind speed, CEC and temperature; volatilisation was modelled in competition with nitrification. He (1999) confirmed the relevance of most of these soil factors to ammonia volatilisation, so the model has a sound basis. However it, and a number of others like it, have not been developed and tested as rigorously as that of Rachhpal-Singh and Nye.
Schumann (2000) developed a model of ammonia volatilisation from urea applied to sugar cane. Nathan and Malzer (1994) correlated ammonia volatilisation from urea with a number of environmental factors, and Sommer and Ersboll (1996) studied volatilisation from CAN and urea in chambers.
There are several models tending to focus on ammonia loss from manures and other organic amendments. However, many of the processes that occur during volatilisation from manures will be similar to those that occur when ammonia volatilises from urea applications to soil. Smith et al. (1996) quantified the factors influencing ammonia loss from urban sewage sludge applied to land. Bussink and Oenema (1998) reviewed the factors affecting ammonia volatilisation from dairy farming systems. Di and Cameron (2000) developed a semi-empirical model of N losses from dairy systems that included ammonia volatilisation. Misselbrook et al. (2001) modelled the loss of ammonia from manure. Sogaard et al. (2002) modelled ammonia losses from animal slurry.
document.doc 85
‘Evaluation of urea-based nitrogen fertilisers’ Report for Defra projects NT2601/02
Table 9.1. Models of ammonia emission following the application of urea fertiliser (and associated models)
Reference Source of NH3 emission NotesStevens et al. (1989) Urea Empirical; grassland soilsSherlock & Goh (1985) Urea & urine patches Mechanistic; grassland soilsSherlock et al. (1995) Urea & urine patches Mechanistic; grassland soilsRachhpal-Singh & Nye(1986a, b, c)
Urea Mechanistic; arable/bare soils
Kirk & Nye (1991) Urea Adaptation of Rachhpal-Singh & Nye’s model
Roelcke et al. (1996) Urea Test/adaptation of Rachhpal-Singh & Nye’s model
IMC-Agrico (2003) Urea Demonstration of effect of a urease inhibitor
Jayaweera & Mikkelsen (1990) Paddy soils Mechanistic; flooded soilsGénermont & Cellier (1997) Slurry MechanisticHengnirun et al. (1999) Slurry Mechanistic
The models in Table 9.1 concentrate on emissions from the soil surface. More complex models exist which take into account the volatilisation of plant ammonium from leaf surfaces, and the potential deposition of atmospheric ammonia to leaf surfaces. These are also used to model atmospheric ammonia concentrations (Sutton et al., 2001). However, they do not target urea fertiliser use per se, instead they start with plant nitrogen (derived from any source).
9.1 Modelling process stagesTaking an overview, the process (from urea prill or liquid application to ammonia in the free atmosphere) can be described as a series of stages from being placed on or in the soil to various interactions. Each of these is potential a rate-limiting step and could, in theory, be a point at which mitigation actions could be taken. The series of stages are given in Table 9.2, and each is used as a heading for discussion of the potential for modelling in the remainder of this section.
document.doc 86
‘Evaluation of urea-based nitrogen fertilisers’ Report for Defra projects NT2601/02
Table 9.2. Modelling process stages of ammonia emission from urea fertiliser use.
Process stage Type of process
Main mechanism of process Possible mitigation
Placement Physical Solid urea either surface broadcast, drilled or ploughed in to surface soil. Urea in solution; sprayed, dribbled onto surface, or injected into soil.
Burial of urea by soil greatly reduces NH3 losses.
Hydrolysis Chemical /Biological
Hydrolysis of urea to ammonium carbonate which decomposes to ammonia and carbon dioxide. Catalysed by ubiquitous soil enzyme urease.
Inhibition of urease enzyme (e.g. nBTPT).
Equilibration of NH4
+/NH3 and NH3 gas volatilisation
Chemical / Physical
Ammonium and ammonia in solution achieve an equilibrium depending upon pH. Aqueous and gaseous ammonia also achieve an equilibrium according to Henry’s Law.
Acidifying conditions keep ammonium in solution.
Re-distribution of NH4
+/NH3 in solution
Physical / Chemical
Diffusion and mass flow of ammonium solution deeper into the soil. Fixation of NH4
+ onto ion exchange sites.
Rainfall/irrigation carry urea and ammonium into soil.
Soil surface emission of NH3 gas
Physical Diffusion out of soil surface and removal into atmospheric sink by turbulent air flow.
Interaction of volatilised NH3 with crop leaves and canopies.
Physical / Biological
Diffusion out of leaf surface occurs if the internal leaf ammonia concentration is higher than the “ammonia compensation point”
9.1.1 PlacementSynthetic urea [CO(NH2)2] is manufactured by reacting ammonia with carbon dioxide under pressure and at elevated temperatures. It is commercially available, most commonly, as solid prills although it is increasingly used in solution as mixtures with other compounds. It is highly deliquescent and soluble, and when spread onto the land readily hydrolyses to ammonium carbonate unless the surface is very dry. The most developed model of ammonia emissions from surface-applied urea fertiliser applied to non-flooded soils is probably that of Rachhpal-Singh & Nye (1986a). Clearly this model could be used to simulate ammonia volatilisation across a number of scenarios.
However, it is also possible that urea may be cultivated or drilled to depths of around 10cm (Black et al.,1989), or injected into the soil as solution; an example of the latter practice is the “Regent” injection applicator system. Injection of urea solution is somewhat analogous to shallow injection of livestock slurries into the soil, and ammonia emissions from this practice have been modelled by Hengnirun et al. (1999) who factored in the depth of injection and mixing into their “VOLAT” model. Injection of slurry is well known to reduce emissions (Misselbrook & Smith, 2002), chiefly by increasing soil contact with the ammonium ions in solution. Similarly the placement of urea below the surface also reduces emissions (Black et al., 1989). Models of losses from injected slurry or of surface applied urea would need modification to permit their application to injected/drilled urea.
document.doc 87

‘Evaluation of urea-based nitrogen fertilisers’ Report for Defra projects NT2601/02
9.1.2 Hydrolysis Once in soil solution the hydrolysis of urea proceeds in the presence of the urease enzyme, such that one mole of urea-N releases one mole of ammonium-N and one mole of a base (Rachhpal-Singh & Nye, 1986a). In Rachhpal-Singh & Nye’s model (1986a, b, c), the rate of hydrolysis is a function of the concentration of urea and soil pH, and the presence of urease is not considered to be rate limiting. However, subsequent work has shown that urease inhibitors, such as nBTPT (n-butyl thiophosphoric triamide) effectively reduce ammonia emissions (Watson et al., 1990), presumably by controlling the rate of hydrolysis. For this reason, the action of urease and its possible inhibition should also be factored in as a rate controlling step in future ammonia volatilisation models. Earlier studies of urease activity (Rachhpal-Singh & Nye, 1984a) found the usual variation with substrate concentration and pH according to Michaelis-Menten kinetics, but did not study the effect of inhibitors. Watson (2000), however, has demonstrated that the degree of inhibition of ammonia volatilisation is related to the concentration of urease inhibitor (nBTPT) present, according to a law of diminishing returns (section 7.5). Inhibition increased rapidly to > 80% inhibited as the concentration of nBTPT increased from 0 to only 0.05 % (w/w), with little benefit observed in using concentrations above 0.1% nBTPT for a range of grassland soils (Watson, 2000).
9.1.3 Equilibration of NH4+/NH3 and NH3 gas volatilisation
Ammonia ions in solution will attain an instantaneous equilibrium with ammonia in the aqueous phase, which is then in equilibrium with ammonia in the gaseous phase according to Henry’s law (Rachhpal-Singh & Nye, 1986a; Sherlock & Goh, 1985). This is the point of actual volatilisation, and is partly controlled by the temperature and pH at the site of volatilisation. Higher temperatures will increase volatilisation (Hengnirun et al., 1999), as will higher pH values (favouring NH3 (aq) in the equilibrium between NH4
+ and NH3; Harrison & Webb, 2001). Rachhpal-Singh & Nye (1986a) however, demonstrated that the volatilisation of ammonia would lower the pH, and tend to counteract volatilisation. Therefore diffusion of acid away from the surface, and ammonium ions to the surface (Rachhpal-Singh & Nye, 1984b), were necessary components of their model.
The model of Rachhpal-Singh & Nye (1986a) was found to adequately predict the volatilisation of ammonia from a surface application of urea to soil in columns (Rachhpal-Singh & Nye, 1986b), and also to model the distribution, with depth, of attendant pH and ammonium ion concentration changes. A sensitivity analysis of this model indicated that the major factors influencing rate loss were indeed those that regulate ammonia volatilisation, namely initial pH and soil buffer capacity, as well as rate of urea application and urease activity (Rachhpal-Singh, 1986c). The main rate controlling process of ammonia loss appeared to be the diffusion of bicarbonate ions to the surface to neutralise the acid generated by ammonia volatilisation. Hence, soil physical factors such as the pore space, which influence the diffusion coefficients of the surface soil, need to be included in any modelling process.
9.1.4 Re-distribution of NH4+/NH3 in solution
The fixation of ammonium ions onto cation exchange sites has been considered an important abatement mechanism when considering ammonia emissions from manures (Hengnirun et al., 1999). In a model of ammonia losses from soils and manures, Hengnirun et al. (1999) used a relative loss factor (rFCEC) that was linearly related to the soil/slurry cation exchange capacity (CEC), when this was greater than 30 cmol 100 g-1 (rFCEC = 1 – 0.033 (CEC)). However, Rachhpal-Singh & Nye (1986a) considered the immobilisation of ammonium ions onto exchange sites to be negligible in comparison to the amount added from urea applications. They used a Freundlich adsorption isotherm (As = a Ab where A is the ammonium concentration in solution, As that in solids and a & b are defined by the isotherm) to derive the ammoniacal solution concentration. However in their sensitivity analysis, this factor proved relatively ineffectual in influencing the rate of ammonia loss (Rachhpal-Singh & Nye 1986c), certainly less so than the soil pH buffering capacity.
Sherlock et al. (1995) described the overall ammonia efflux (F) from the soil surface following the application of urea by a linear relationship (F = k.uz.0). Here, a general site-specific parameter (k) was used to define the partitioning of ammonium between solution and exchange sites. This parameter also defined the effect of other factors such as surface roughness (Harrison & Webb, 2001). The effect of pH and temperature, were accounted
document.doc 88
‘Evaluation of urea-based nitrogen fertilisers’ Report for Defra projects NT2601/02
for in the derivation of the term 0 and u is the mean wind speed at a reference height (z) above the soil surface (Harrison & Webb, 2001).
Both the main model considered so far (Rachhpal-Singh & Nye, 1986a) and that of Sherlock et al. (1995) focus on emissions from a very narrow layer of soil at the surface and not from lower depths. This is acceptable as a first approximation because emissions are very rapid after application; Rachhpal-Singh & Nye (1986b) recorded that a maximum of 27% of applied urea-N was emitted 14 days after application, but half of this was emitted after only 6 days (Rachhpal-Singh & Nye, 1986a). Explicit in their model however, was the diffusion of ammoniacal-N away from the surface, which was dependent upon the pore space and water content of the surface soil. Variation of this water content between 90 and 125% of that at field capacity had little effect on ammonia volatilisation, with predicted losses at their minimum when water contents were slightly higher than field capacity, and increasing sharply as moisture content fell below 90% of field capacity (Rachhpal-Singh, 1987).
In the field however, water movement would be a reasonable expectation within the 6 to 14 day period mentioned above, and with this in mind Kirk & Nye (1991a) expanded the model to accommodate steady-state water movements. In this case the soil did not dry out appreciably, but movement downward by drainage and/or upward by evaporation could occur. They did this by incorporating the equation for steady-state movement described by Childs (1969) suggesting that these conditions approximate to actual events over a wide range of conditions. When evaporation predominated, volatilisation was increased because ammonium and bicarbonate ions were carried upward to the surface, whereas when drainage predominated solutes were carried into the soil and volatilisation was thereby reduced (Kirk & Nye, 1991a). Increased overall volatilisation was also predicted when evaporation dried the surface soil from a steady state moisture content (Kirk & Nye, 1991b).
9.1.5 Soil surface emission of NH3 gasThe underlying assumption of the volatilisation equations for all models is that the concentration of ammonia gas in the atmosphere is negligible (Rachhpal-Singh & Nye, 1986a). To maintain this condition at the site of volatilisation, the sink effect of the atmosphere has to be maintained by the effective transfer and removal of ammonia gas away from the surface. The transfer function of ammonia to the atmosphere (Ka) used by Rachhpal-Singh & Nye (1986a) in their basic emission equation encompassed factors for surface roughness, temperature and wind-speed. Ka increased with wind-speed over the surface, but not linearly (Rachhpal-Singh & Nye, 1986b). In a sensitivity analysis of the model, Rachhpal-Singh & Nye (1986c) showed this function to be relatively ineffectual at governing volatilisation rates if values were above 0.083cm s-1, increasing by only 20% until 0.25cm s-1, after which there was no increase. By contrast, Sherlock et al. (1995) suggested that wind-speed exerted a continual effect throughout its range, and included it as an independent term in their model.
Wind-speed also featured in the model of ammonia emission after slurry applications of Génermont & Cellier (1997). Here, the mean ammonia efflux from a field was related to its length (for a field measuring 90 by 190m) and surface roughness. In a sensitivity analysis of their model, reducing the wind-speed by 50% reduced ammonia emission by 26%, whereas a 50% increase in wind-speed increased the flux by 17% (Génermont & Cellier, 1997). Wind-speed was also included in the slurry-based model (VOLAT) of Hengnirun et al. (1999). Here, the maximum ammonia flux occurred at the fairly low wind-speed of 0.06km hr-1, and was therefore suggested to be an insignificant factor controlling volatilisation (Hengnirun et al., 1999).
9.1.6 Interaction of volatilised NH3 with crop leaves and canopies Resistance analysis-type models of ammonia flux through growing plants do not model the emission of ammonia from applied urea, but the exchange of ammonia taken up by plants from any source, with that in the atmosphere. As such they are only mentioned here to highlight the potential they have to describe how growing crop canopies may actually be taking up ammonia through their leaves, when the ammonia concentration in the atmosphere is above the ammonia compensation point of the leaves (Sutton & Harrison, 2002). This has been demonstrated within an oilseed rape canopy, where ammonia emitted from decaying
document.doc 89
‘Evaluation of urea-based nitrogen fertilisers’ Report for Defra projects NT2601/02
leaves on the soil surface was effectively re-cycled into the crop by leaf absorption. By the same mechanism, a degree of ammonia emission abatement may be encountered when urea fertilisers are applied to well developed crops with large canopies (Sutton & Harrison, 2002). This resistance-type model of plant ammonia flux as discussed by Sutton et al. (2001) could form an additional component to any model of ammonia fluxes following urea applications.
9.1.3 The performance of models against measured dataAll the authors of the models mentioned above incorporated some degree of validation against measured data in their modelling, and unsurprisingly found fairly good agreement with the limited ranges of conditions tested (Rachhpal-Singh & Nye 1986b; Génermont & Cellier, 1997; Hengnirun et al.,1999; Sherlock et al., 1995). However, only the model of Rachhpal-Singh & Nye (1986) has been subjected to an independent systematic validation procedure, as reported by Roelcke et al. (1996). Here, the soil studied had a pH value of 7.7 and CaCO3 content of 10%, whereas the model (Rachhpal-Singh & Nye 1986a) was based on a neutral, non-calcareous soil. Simulations were therefore carried out with various changes made to the model parameters to reflect the different soil properties (pH, bulk density, pH buffering capacity etc). Initially the model simulated volatilisation well, but none of the simulations could adequately describe the process over the full period of the experiment: after 10 days NH3 loss continued at a rate greater than predicted. Soil pH was seen as an important factor and it was suggested that the model’s description of the effect of pH buffering capacity was inadequate.
9.2 Scenario testing The objective of this part of the project was to use the Inventory of Ammonia (NH 3) Emissions from UK Agriculture (Misselbrook et al., 2000; Pain et al., 1998) as a tool for evaluating the impact on the total NH3
emission from UK agriculture of different urea use scenarios. In particular, the impact of replacing AN and other N fertilisers with urea was evaluated as was the effect of potential measures to reduce emissions from urea applications. In addition, the uncertainties in the current emission factors used for NH 3 losses from urea applications to grassland and arable land are discussed.
9.2.1 Current estimates of ammonia emissions from fertiliser applicationsThe most recent submission of the NH3 emissions inventory for UK agriculture is for the year 2001 (DEFRA Project AM0113). Emissions from fertilisers applied to grazed land are calculated as part of emissions from grazing animals, with emission factors expressed as g NH3 per livestock unit (500g liveweight) per day. Separate calculations are made for emissions from fertilisers applied to grassland for conservation and to arable land. For the purposes of this study, direct emissions from fertilisers applied to grazing land were included with emissions from fertilisers. Therefore, all fertilisers applied to grassland were included in the calculations.
In 2001, fertiliser use in the UK was estimated at 1,258 kt N (Table 9.3). Of this, 1,155 kt fertiliser N were applied to agricultural land in Great Britain (BSFP, 2002) and 103 kt N were supplied to farms in Northern Ireland (DARDNI statistics). Of that applied in Great Britain, 51% was as AN, 8% as urea, 2% as AS or N solutions, 1% as CAN, 1% as ammonium phosphate or DAP and the remainder (37%) as NK or NPK compound blends. For Northern Ireland the proportions were 74% as compounds and blends, 18% as AN/lime mixtures and 8% as urea/other nitrogen.
There exists a range in the estimates of emission factors for the different types of fertilisers (Harrison and Webb, 2001; van der Weerden and Jarvis, 1997). Those used in the current inventory are shown in Table 9.4. The table includes proposed values for the NARSES model (National Ammonia Reduction Strategy Evaluation System), which will become the model for the national emissions inventory for UK agriculture (DEFRA Project AM0101) and the values given in the EMEP/CORINAIR Emission Inventory Guidebook (3rd edn. currently being updated - http://www.tfeip-secretariat.org/). The model proposed for deriving emission factors for fertilisers for the NARSES model is shown in Figure 9.1 (this model is still under development within Project AM0101 and may be subject to change). Mean emission factors for the UK were derived from this model by assuming a mid temperature (10-20 oC), 50% of applications would receive significant rainfall
document.doc 90
‘Evaluation of urea-based nitrogen fertilisers’ Report for Defra projects NT2601/02
within 5d, a small proportion of urea would be applied at >100 kg N ha-1, and for applications to arable land, 10% would be pre-tillage, 50% to a short crop and 40% to a growing crop. The UKAEI inventory model has the greatest difference in emission factors for fertiliser applications to grassland and arable land, those for applications to arable land being half the value of those for applications to grassland. The difference is smaller in the NARSES model, with emission factors for applications to arable land being approximately 20% less than those for applications to grassland for a given fertiliser type. The EMEP/CORINAIR makes no differentiation in emission factors for applications to arable land and grassland. For this study, the emission factor for AN was also applied to all other fertilisers, excepting urea. Errors introduced by this would be small, as other fertilisers form only a small percentage of the total N applied.
Table 9.3 Fertiliser use in the UK, 2001.
N Fertiliser Arable Grassland†
kt N % to arable kt N % to grasslandAN 416.3 68.9 188.2 31.1Urea 82.8 78.3 23.0 21.7Other N 164.1 29.9 384.0 70.1Total 663.1 52.7 595.2 47.3Urea as % of total 12.5 3.9†includes fertiliser N applications to grazed land
Table 9.4. Ammonia emission factors for different fertiliser types (% applied N).
Fertiliser type Grassland ArableUKAEIa EMEP/
CORINAIRbNARSESc UKAEIa EMEP/
CORINAIRbNARSESc
AN 1.6 1.5 1.4 0.8 1.5 1.1Urea 23.0 17.0 19.0 11.5 17.0 15.0N solutions 1.6 9.0 2.3 0.8 9.0 1.8AnA 1.6 3.0 2.3 0.8 3.0 1.8AS 1.6 2.0 2.3 0.8 2.0 1.8Ammonium phosphates
1.6 2.0 2.3 0.8 2.0 1.8
Other N 1.6 1.5 1.4 0.8 1.5 1.1a UK ammonia emissions inventoryb Emissions inventory guidebook, Region B.c Mean UK values derived from proposed fertiliser model within NARSES
Total emission from fertilisers applied to agricultural land in the UK in 2001 is given in Table 9.5, using the UKAEI model (total emissions from fertilisers calculated using the EMEP/CORINAIR and NARSES models were 49.8 and 37.9 kt NH3, respectively). Due to the much greater emission factor for urea fertiliser, emissions from urea accounted for over half of the total emissions from fertiliser applications even though urea represented <10% of the total fertiliser N applied (Table 9.3). Total emission from fertilisers represented 13.5% of total emission from UK agriculture, based on the 2001 submission of 256.8 kt NH3 using the UKAEI model.
Table 9.5. Emissions from fertiliser applications (kt NH3) derived using the UKAEI model for 2001.
Fertiliser type Arable Grassland Total % of totalAN 4.0 3.7 7.7 22Urea 11.6 6.4 18.0 52Other N 1.6 7.5 9.1 26Total 17.2 17.5 34.7
document.doc 91

‘Evaluation of urea-based nitrogen fertilisers’ Report for Defra projects NT2601/02
Figure 9.1. NARSES Direct emissions from fertilisers – conceptual model
document.doc 92
Fertiliser type
Soil pH/type
Land use
Application rate
Rainfall
Temperature
maximumpotential emission
35% 2.5% 40% 40%
urea AS DAP
>7 or <7if >7, then max. pot. unchanged
if <7, then max potential 4% (as for AN)
If grass/short crop 0% reductionIf tilled after appn 80% reductionIf growing crop 30% reduction
If > 100kgN/ha 0% reductionIf < 100kgN/ha 30% reduction
If no rain within 5d 0% reductionIf sig rainfall (>5mm) within 5d 50% reduction
If > 20C 0% reductionIf 10-20C 25% reductionIf < 10C 50% reduction
Key
Emission source
Influencing factors
AN/other N
‘Evaluation of urea-based nitrogen fertilisers’ Report for Defra projects NT2601/02
9.2.2 Urea use scenariosThe inventory model was used to derive estimates of NH3 emissions for a series of scenarios where urea increasingly replaced other N fertilisers. The results of these model runs are shown in Figure 9.2, with the proportion of urea to total N applied assumed to be equal for both grassland and arable land. There was very little difference between the current inventory model and that using the NARSES fertiliser emission factors, while the EMEP/CORINAIR emission factors gave greater emissions than the other 2 models (proportionally greater at lower % urea use). The overwhelming conclusion is that increases in the proportion of N fertiliser applied as urea will result in large increases in NH3 emissions from fertiliser applications, with a total emission from fertilisers of 260 kt NH3 if all fertiliser N was applied as urea. The effect of this on the total emission from UK agriculture can be seen from Figure 9.2b, with increases in the region of 75–85% if all fertiliser N was applied as urea.
For total emissions from fertilisers to remain the same as current, the emission factor for urea would have to be reduced to 2.25% applied N if urea was used to replace all other N fertilisers or to 3.1% if urea was used to replace just AN fertiliser (straight AN only).
9.2.3 Abatement scenariosThree potential abatement techniques were included in the model assessments:
1. The use of urease inhibitor nBTPT2. Application of urea in liquid form3. Increased proportion of urea applied to arable land as pre-tillage.
Work in Northern Ireland suggests that the use of nBTPT with urea applications to grassland or bare soil reduces emissions by approximately 80% (Watson et al., 1994; Watson et al., 1998; Watson et al., 1990), so this reduction factor was used in the scenarios. Few data exist showing the relative emissions from solid vs. liquid fertiliser applications, but Fox et al., (1996) reported losses from granular urea of c. 30% of the applied N compared with c. 15% for spray applications of UAN solutions to maize. A reduction factor of 50% was therefore used for liquid applications. However, it should be borne in mind that the reduction factor will be very dependent on weather conditions and crop/soil surface characteristics and it is quite possible that liquid applications may result in greater losses than from solid fertilisers. Incorporation of fertiliser into the soil by cultivation or direct drilling will greatly reduce the emission factor (e.g. Black et al., 1989), as is reflected in the NARSES model (Fig. 9.1). In the scenario testing, it was assumed that 30% of applications to arable land would be applied in this way, with the remainder applied to a growing crop in the spring.
The results of the scenario testing on abatement strategies are shown in Figure 9.3. The results would suggest that if an increase in urea usage was combined effectively with the use of the urease inhibitor nBTPT, then the impact on the total NH3 emissions from UK agriculture would be small; a 5% increase if all fertiliser N was applied as urea (compared with an increase of 85% using the NARSES model with no abatement strategies). Increasing the proportion of urea directly incorporated into the soil to 30% of applications to arable land would give an increase on the current inventory total (again, assuming all fertiliser N applied as urea) of 70%. This abatement strategy would be limited in terms of potential application as it would only apply to arable land, and not grassland, and the majority of applications to arable crops would be to growing crops, making incorporation impractical. Assuming a mean reduction of 50% for liquid applications, and all fertiliser N applied as liquid urea, would result in a 35% increase in the inventory total. As stated above, this reduction factor is based on very limited data and presumably reflects the rapid infiltration of liquid N into the soil where it will be less vulnerable to losses via volatilisation. However, coating of vegetation with liquid fertilisers may actually increase the surface area for volatilisation, thereby increasing emissions compared with granular fertiliser applications. Further research is needed to improve our understanding of losses from liquid fertiliser applications.
document.doc 93
‘Evaluation of urea-based nitrogen fertilisers’ Report for Defra projects NT2601/02
Figure 9.2. Effect of different levels of urea use on NH3 emissions, using 3 different inventory models. a) total emissions (kt) from fertiliser applications to agricultural land; b) impact on the inventory total
document.doc 94
a
b

‘Evaluation of urea-based nitrogen fertilisers’ Report for Defra projects NT2601/02
Figure 9.3. Scenario testing abatement strategies for urea use, using the NARSES model. a) total NH3 emission (kt) from fertilisers; b) impact on inventory total for UK agriculture
document.doc 95
a
b
‘Evaluation of urea-based nitrogen fertilisers’ Report for Defra projects NT2601/02
The uncertainties in the scenario predictions are likely to be large due to the uncertainties in the emission factors used. More data are required to provide robust emission factors for the different fertiliser types, particularly urea, and particularly to better quantify the difference in emission factor for applications to grassland or arable crops. Additionally, the 80% reduction in emission assumed when the urease inhibitor nBTPT is used requires field validation under a range of environmental conditions.
9.3 Choice of models for future useAll the models presented here have their merits. Rachhpal-Singh & Nye’s (1986) model is probably the most developed and offers considerable scope for future testing and expansion. That of Génermont & Cellier (1997) also offers promise if modified for urea fertiliser use, especially if this is in the liquid form which can be seen as a somewhat analogous material to livestock slurry (although with a very different infiltration rate). In both cases additional sub-models should be added to accommodate specific mitigation steps such as the use of urease inhibitors.
The end-use and application of the model is of particular importance when determining its structure and parameterisation, as well as deciding whether a mechanistic or empirical model would be most suitable. The model of Rachhpal-Singh & Nye (1986) was primarily for research purposes to investigate the primary factors which control volatilisation, and so many variables could be changed. However, it did not perform particularly well for a soil that did not resemble the soil used in its initial development (Roelcke et al.,1996). In the above case, the description of pH buffering capacity was inadequate, and modifications were necessary to describe a calcareous soil. This would be important for the UK as much of the southern and eastern wheat growing area in England has calcareous clay loam soils.
Another example is the downloadable model of ammonia volatilisation from urea and UAN fertilisers, which calculates the impact of using a urease inhibitor on yield and profitability (IMC-Agrico, 2003). This model is briefly mentioned by Watson (2000), and requires input data on the crop (maize), weather, fertiliser and soil parameters to run. The output details the volatilisation of ammonia from urea over the post application period and also tracks urea-hydrolysis over the same period. However, the impact of the urease inhibitor is only shown as an effect on the final yield and profitability. This is because the model is primarily targeted at growers, to demonstrate whether the use of the urease inhibitor Agrotain would be cost effective.
One strategy for future modelling could be based on the development of a series of sub-models that identify and emphasise processes for which mitigation options exist, as detailed in Table 9.2. In so doing, sufficient attention must be given to the range of conditions pertinent to British soils and the inclusion of decision-making steps (e.g. depth of placement). One possible approach may initially be via empirical modelling of the type described by Stevens et al. (1989) for ammonia emissions following urea applications to grassland soils. Their modelling consisted of a two-stage process. First the total cumulative ammonia loss (expressed as a percentage of the urea N applied: Amax) and time (days) after application when the emission rate was at its maximum (Tmax) were defined by soil specific parameters. This was then followed by a stepwise linear regression analysis of Amax and Tmax values on soil properties. Amax ranged from 1.6 to 26.1% with a mean of 16.8% of the urea-N emitted. The most influential soil property governing Amax was the titratable acidity, whilst moisture loss (over measurement period) and pH (in KCl) were also significant (P<0.05). Tmax was most affected by non-buffered urease activity, but buffer activity, loss on ignition, clay and calcium carbonate content were also significantly related.
This approach (Stevens et al., 1989) highlighted the same sort of properties as the sensitivity analyses of Rachhpal-Singh & Nye (1986b; 1986c) as being of importance; namely the pH, buffering capacity and urease activity, as well as features of the moisture dynamics in the pore space of the surface soil. Having identified such influential properties one could then ensure that these were adequately emphasised in modules of a process based model, such that it operated successfully for all soil types. It would also highlight the most suitable type of output for the set of conditions studied. For instance in the Stevens model (Stevens et al., 1989) Amax (and consequently the soil properties most influential on Amax) was deemed the most important characteristic of the ammonia volatilisation process, but only in the absence of significant rainfall. The amount
document.doc 96
‘Evaluation of urea-based nitrogen fertilisers’ Report for Defra projects NT2601/02
of rain received in the initial few days after application (e.g. > 5 mm in 2 days prevents volatilization) will influence the value of Tmax. Tmax (and the soil properties most influential on Tmax) therefore becomes more in high rainfall areas.
Also important in determining the type of model needed, is the degree of precision required. If all that is needed is a mean flux rate over a relatively long timeframe or large area, then it may not be necessary to proceed beyond a generalized empirical model suitable for the region of interest. Finally, attention must also be given to the output of the model. This should aim to assess the environmental impact of the various mitigation options addressed (e.g. the change in NH3 emission due to the presence of nBTPT), but should also be open to the addition of other modules for crop uptake and yield if desired.
9.4 European approaches to modelling ammonia emissionsUnderstanding the methodology used by other Member States for estimating ammonia emissions is important to ensure that there are comparable approaches being used to meeting nationally agreed emission targets.
Generally the approach to estimating ammonia emissions in mainland Europe is the same as in the UK, utilising inventories and some modelling. Broadest coverage was achieved by the United Nations Economic Commission for Europe (UNECE) Ammonia Expert Panel, which derived ammonia emission factors for agriculture in Europe (Van der Hoek, 1998). Included were emissions from animal husbandry (housing, storage of the manures outside the building, grazing and application of the manures), application of fertilisers to crops and grasslands, stubble burning of agricultural residues and latrines. For Germany, ammonia emission inventories have been calculated using the guidebooks of the UNECE and the Intergovernmental Panel on Climate Change (IPCC) (Daemmgen et al., 2002).
Models have been used to estimate ammonia emissions and the potential for, and costs of abatement strategies. ApSimon et al. (1995) and Cowell & ApSimon (1998) reported the development of the MARACCAS model to compare emissions from agricultural activities in different European countries and to assess the applicability and efficacy of potential abatement measures for ammonia. The aim was to derive abatement costs for each country relating successive emission reductions to the costs of achieving them. These were to be used by the UNECE Task Force on Integrated Assessment Modelling (TFIAM) with the Abatement Strategies Assessment Model, ASAM. They produced a set of guideline measures that, they argued, could provide significant reductions at competitive costs. There are no published results to indicate if measures were followed and, if they were, whether they were successful.
The earliest attempt to use an interactive model of ammonia emissions, using the TAN-flow concept, to enable cost-curve production, was with the MARACCAS (Model for the Assessment of Regional Ammonia Cost Curves for Abatement Strategies) model of Cowell and ApSimon (1998). The TAN-flow approach regards ammonia emissions from livestock husbandry as originating from a pool of total ammoniacal-N (TAN) in livestock excreta. Ammonia may be volatilized from this TAN pool at any stage of manure management, until the TAN is absorbed onto soil colloids. This concept of a TAN pool from which ammonia may be successively lost, but to which no newly-generated TAN is added, allows calculation of the consequences of reducing NH3 emissions at one stage of manure management (upstream) on emissions at later stages (downstream) (Webb and Anthony, 2002). In 1998 the UNECE Ammonia Expert Group adopted the EF’s used in MARACCAS to replace the EF’s in the earlier version by Van der Hoek to revise the Guidelines for calculating NH3 emissions. Daemmgen et al. (2002) also adopted the TAN-flow approach for their inventory. Menzi et al. (pers comm) have developed a TAN flow model (DYNAMO) for estimating national NH3 emissions for Switzerland. The MARACCAS model is being updated and adopted for use with disaggregated ‘activity’ data in the NARSES model (Webb and Anthony, 2002). Thus the TAN-flow approach to estimating national emissions, which originated in the UK, has been taken up by other European workers.
Brink et al. (2001) used the RAINS (Regional Air pollution INformation and Simulation) model to estimate NH3 emissions from European agriculture for 1990 and four scenarios for the year 2010 in the context of abatement strategies and their impact on other emissions. They also linked this with the IPCC method for
document.doc 97
‘Evaluation of urea-based nitrogen fertilisers’ Report for Defra projects NT2601/02
national greenhouse gas inventories to provide a full database for agricultural emissions of NH3, N2O and CH4
for the European agricultural sector. The results indicated that abating agricultural emissions of NH3 could increase emissions of N2O by up to 15%, with large variations across EU countries.
Some broader scale modelling has included sulphur, nitrogen oxides, and volatile organic compounds as well as ammonia. Johansson et al. (2001) described an integrated assessment model for Finland, Denmark, Spain and Sweden aimed at supporting the evaluation of European emission reduction strategies. The model incorporated several related effects and pollutants into complex, integrated multi-pollutant/multi-effect models, and included policy assessments. Some effects-oriented, cost-effective emission reduction strategies for Europe were developed. Assessment of control techniques and related costs of various concentration and deposition scenarios were compared, together with the temporal aspects and uncertainty analyses of both the individual and integrated models. Measures to disseminate results to stakeholders were considered. The work was seen as providing a consistent framework for the harmonization of input data and scientific research on emissions, pollutant loading and impacts.
Erisman et al. (2003) reviewed the success of Europe in reducing emissions of nitrogenous pollutants, including ammonia. Emissions of ammonia are estimated to have decreased by 14% between 1990 and 1998. However, most of this is the result of a decrease in industrial and agricultural activities in the east of Europe. Only a small part of the reduction is due to specific measures designed to reduce emissions. The reduction is significant but far from the target for Europe. The Gothenburg Protocol will lead to reductions of 12% by 2010, relative to 1990, but further reductions are necessary to reach critical limits for ecosystem protection, air quality standards, and climate change. In Erisman’s view, measures to reduce emissions need to focus on decreasing the production or import of reactive N. Reactive-N ceilings for regions, based on critical limits for all N-related effects, can help to focus abatement measures. An integrated approach to nitrogen pollution was seen as having advantages over a pollutant-specific approach.
It is also worth noting that annual biogenic emissions of ammonia from European seas and their transboundary flows were estimated by Barrett (1998). Atmospheric fluxes were calculated from monitored seawater ammonium (NH4
+) levels, via a compensation point approach in the EMEP acid deposition model. Total emissions from European seas are similar to those of smaller EU countries, although seas export larger proportions of their emissions than land areas. Contributions to NHx-N deposition approach 5% in coastal regions of Scotland. Although fluxes are small, seas may represent the 3rd and 4th largest source of imported NHx-N to the Republic of Ireland and the U.K., respectively. Uncertainty associated with the data is between -40% and +80% of the best estimate.
As discussed in section 6.1.2, the current EU guidebook chapter on emissions from cultures for ammonia emissions (EMEP/CORINAIR) has recently been updated by the TFEI Agriculture Panel (Sutton et al., 2002). The new revised methodology was based on initial estimates of emission from Webb et al. (1998), Sutton (1996) and ECETOC (1994), the review of Harrison and Webb (2001), which incorporates the findings from the UK National Ammonia Emissions Inventory (Misselbrook et al. 2000), results from the EU GRAMINAE and EXAMINE projects (e.g. Sutton et al. 2000, 2001 and 2002), the general findings of other literature including modelling work and expert judgement based on first principles, where experimental information was lacking.
Emissions include both the direct emission of ammonia following fertilizer application and the indirect emissions from vegetation, for example following cutting and during senescence of foliage. Estimates are based on normal practice, with no abatement measures explicitly included. They should therefore form a reference against which ammonia emissions abatement techniques can be considered. For the Simpler Approach, no distinction is made between the application of fertilisers to arable land vs. grassland; a distinction is made between three areas of Europe, reflecting different climate and soil types (see section 6.1.2). For the Detailed Approach there is a distinction between arable/grass etc. (and possibly more detailed types), and more detailed environmental functions can be developed; further research is needed in these areas.
document.doc 98
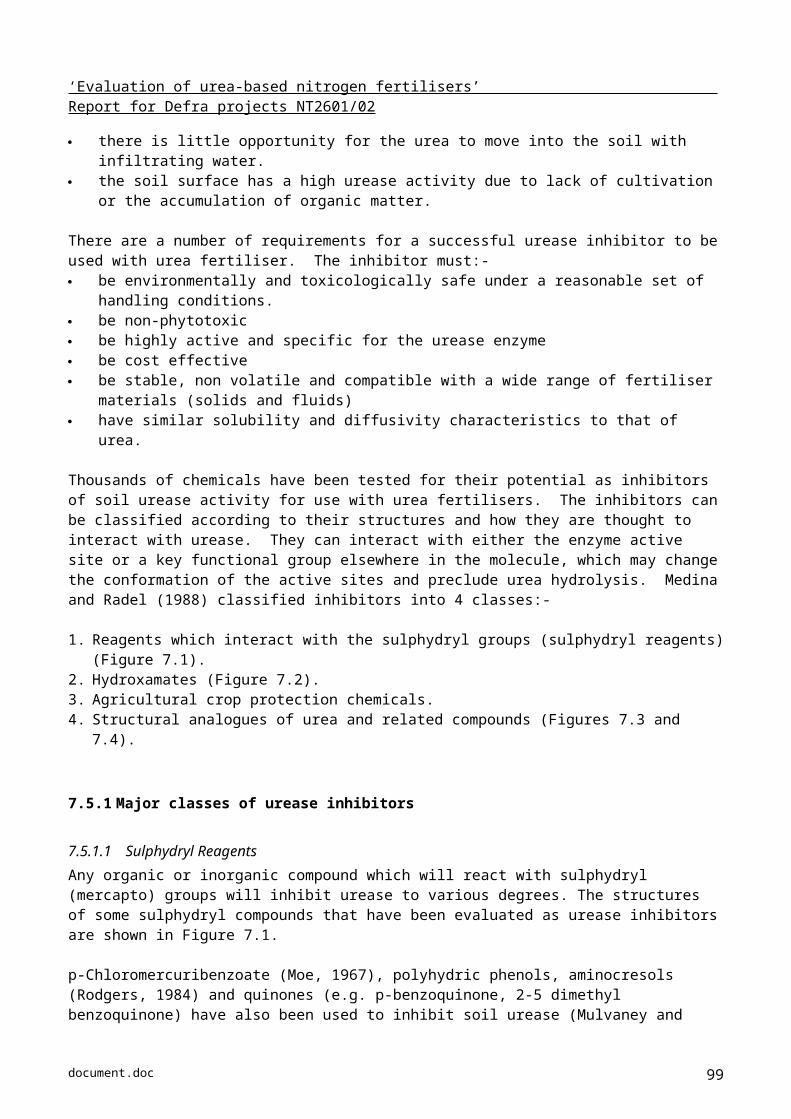
‘Evaluation of urea-based nitrogen fertilisers’ Report for Defra projects NT2601/02
A simple dynamic model of ammonia emissions following application of fertiliser-N is currently under development for use in NARSES (see section 9.2 & Figure 9.1). This model will incorporate the approach put forward by Sutton et al. (2002) and be linked to a spatial database giving access to disaggregated information on soil type and climate.
9.5 Conclusions
1. Models that accurately predict the emission of NH3 from applied urea are required to help predict future emissions in the event of increased urea usage, and also to identify ways to ameliorate losses and evaluate the efficacy of such treatments. Specific urea-based ammonia emission models are relatively few. One of the earliest and most thoroughly tested mechanistic models of NH3 volatilisation from urea was produced by Rachhpal-Singh and Nye (1986a,b); many others have been developed from it. Several models focus on NH3 loss from manures and other organic amendments. Moreover, many of the processes that occur during volatilisation from manures are similar to those that occur when NH3 volatilises from urea applications to soil, so these could be of relevance.
2. All the models had been subject to some degree of validation against measured data, and fairly good agreement was found within the limited ranges of conditions tested. However, only the model of Rachhpal-Singh & Nye had been subjected to an independent systematic validation procedure.
3. Taking an overview, the process of NH3 volatilisation from urea or liquid applications to NH3 in the free atmosphere, can be described as a series of stages, viz: application, hydrolysis, NH4
+ fixation, NH3 volatilisation, the effective transfer and removal of NH3 gas away from the surface. Each of these stages is potentially a rate-limiting step and could, in theory, be a point at which mitigation actions could be taken.
4. Because of the complexity and limited ability of mechanistic models to simulate ammonia volatilisation, national and international emission inventories are compiled using simple emission factors. These are continually being revised as better data become available. Understanding the methodology used by other EU Member States for estimating NH3 emissions is important to ensure that there are comparable approaches being used to meeting nationally agreed emission targets. Generally the approach in mainland Europe is the same as in the UK, utilising inventories and some modelling.
5. The MARACCAS model (Model for the Assessment of Regional Ammonia Cost Curves for Abatement Strategies) has been used to compare emissions from agricultural activities in different European countries and assess the applicability and efficacy of potential abatement measures for NH3. In 1998 the UNECE Ammonia Expert Group adopted the emission factors used in MARACCAS to revise the Guidelines for calculating NH3 emissions. The MARACCAS model is being updated and adopted for use with disaggregated ‘activity’ data in the NARSES model (National Ammonia Reduction Strategy Evaluation System for the UK).
6. A simple dynamic model of NH3 emissions following the application of fertilizer-N is currently under development for use in NARSES. This model incorporates a ‘N flow’ approach and is linked to a spatial database giving access to information on soil type and climate. In the UK, the development of the NARSES model appears to be the way forward.
Scenario testing -ammonia7. Scenarios were run in which the impact on NH3 emissions of replacing all or part of the non-urea N with
urea were tested. Because of the complexity and limited ability of mechanistic models to simulate NH3
volatilisation, scenarios were tested using simple emission factors. Mean emission factors for the UK were derived from the UK Ammonia Emissions Inventory for 2001 (UKAEI), the ‘prototype’ NARSES model and the EMEP/CORINAIR Emission Inventory Guidebook. The emission factor for AN was applied to all other fertilisers, excepting urea. Errors introduced by this would be small, as other fertilisers form a small percentage of total N applied.
document.doc 99
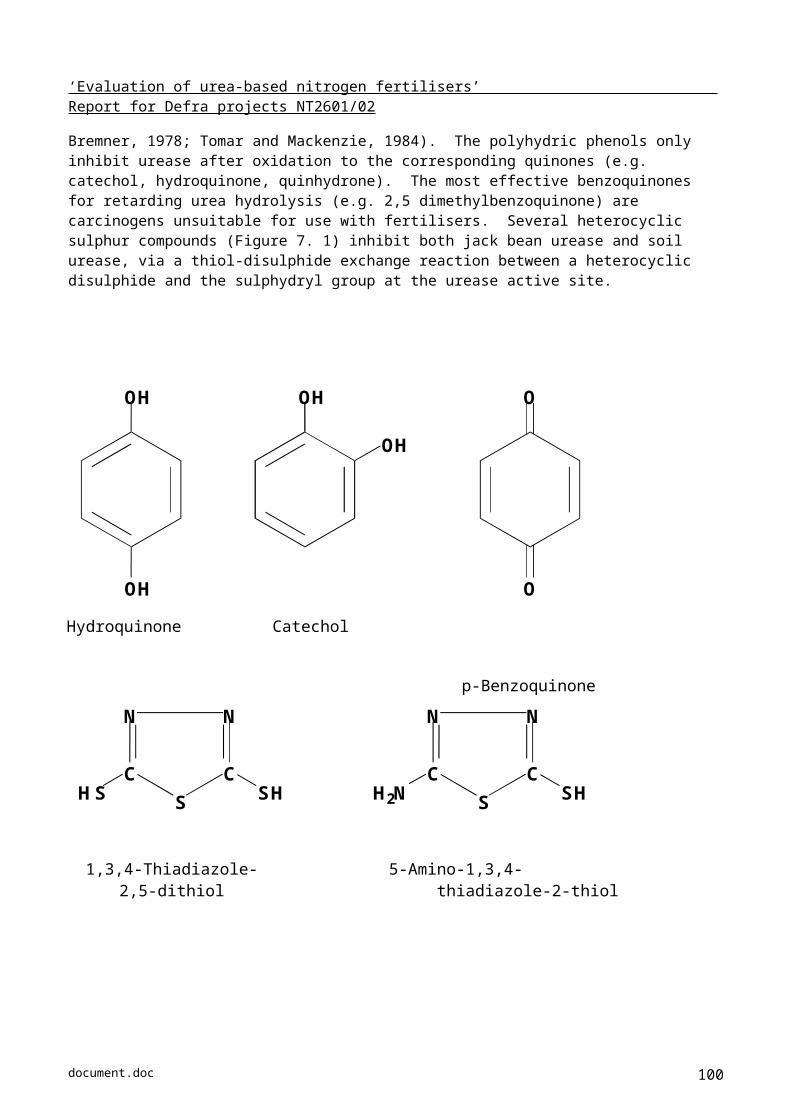
‘Evaluation of urea-based nitrogen fertilisers’ Report for Defra projects NT2601/02
8. Total ammonia emissions from current manufactured fertiliser N forms applied to UK agricultural land in 2001 were estimated as 34.7, 37.9 and 49.8kt using the UKAIE, NARSES and EMEP/CORINAIR emission factors, respectively. The models predicted that, if all this fertiliser N was applied as urea, the total emissions from manufactured N fertilisers would increase by around 220kt NH3 to 260kt NH3. This would represent an increase of 75–85% in the total of all ammonia emissions from UK agriculture, including those from livestock manures. For total emissions from fertiliser N to remain the same as 2001, the emission factor for urea would have to be reduced to 2.25% of applied N if urea was used to replace all other N fertilisers, or to 3.1% if urea was used to replace AN fertiliser only.
9. Three potential abatement scenarios were tested: (1) the use of urease inhibitor nBTPT (i.e. Agrotain), (2) the application of urea in liquid form, (3) an increased proportion of urea applied to arable land and incorporation into the soil pre-tillage. The results suggest that, if an increase in urea usage was combined effectively with the use of the urease inhibitor nBTPT (assuming an 80-90% reduction in NH3 emissions through using Agrotain), then the impact on the total NH3 emissions from UK agriculture would be small; a 5% increase if all fertiliser N was applied as urea. Liquid application was estimated to half emissions; soil incorporation was assessed to have little effect because of the potential difficulty of incorporation for most tillage crops. There is clearly a need to confirm these predictions, in particular to establish whether nBTPT will be as consistently effective under commercial conditions as is currently claimed, and to obtain the optimum formulation of inhibitor-containing fertiliser urea to make full use of the abatement potential.
document.doc 100

‘Evaluation of urea-based nitrogen fertilisers’ Report for Defra projects NT2601/02
10. Implications for new research and other studies
1. Urea comprises a small but important part of the N presently applied in the UK (9% as straight urea). Its chemical and physical properties are different from those of AN. No urea is manufactured in the UK. A switch from AN to urea would require a major restructuring of UK agriculture from the manufacturing and supply chain, through storage and application methods to agronomic advice and farm practice. The implications of this need to be fully explored before a switch was made.
2. Urea is subject to the same chemical and biological transformations as all N fertilisers, with the additional initial hydrolysis to ammonium ions. These N transformations are dependent on soil biological and chemical conditions and the weather in determining its availability to crops, and the threat of loss to the air and water environments. The initial hydrolysis of urea to ammonium and the accompanying increase in pH makes urea especially susceptible to ammonia volatilisation and, perhaps, more rapid immobilisation by the soil microbial biomass. Hydrolysis is generally very fast, but heavy rain immediately after N application could wash urea and/or ammonium ions into surface and groundwaters. In soils above neutral pH, nitrite could accumulate with risk of plant damage and leaching to waters. Both nitrate and nitrite are at risk of denitrification. These transformations and processes make the efficiency of use of urea more difficult to predict and manage. The crop efficiency of use and losses to the environment need to be fully researched on a range of soils, climates and management practices to provide Best Practice advice on urea use to the UK farming industry and Government Policy makers.
3. Crop trials reinforce doubts over the efficiency of use of urea N, suggesting the risk of yield losses in some situations of up to 20% compared to AN for all crops (arable, grass and vegetables) and in other situations a similar N efficiency to AN. It will be important to develop an understanding of where urea will behave with a similar efficiency to AN and where urea will be less efficient. Phytotoxicity has been demonstrated in vegetable crops. Little research has been carried out to test the efficiency of use of urea on many vegetable crops and grazed grassland. If farmers are to be able to use urea confidently without yield and quality penalties, much agronomic research needs to be done with all crops to develop Best Management Practices for urea use and to modify RB209 and other recommendation systems.
4. The dominance of urea on the world N market has resulted in much research on NH3 volatilisation, although there is a paucity of information on emission factors for tilled land under UK conditions. A switch from AN to urea will greatly increase NH3 emissions and could make it impossible for the UK to meet its commitments to the EU National Emissions Ceilings Directive and the UNECE Gothenburg Protocol. Very little is known on the risk of direct leaching of urea or ammonium to surface and ground waters, or loss of nitrous and nitric oxides to the atmosphere, especially in comparison with other forms of N. Of particular concern is the risk of peak concentrations of urea and ammonium in surface waters, in breach of the Freshwater Fish Directive. Research is needed in all these areas and to confirm the environmental implications of a switch to urea.
5. Agrotain (N – (n-butyl) thiophosphoric triamide, nBTPT) is now widely available as a commercial inhibitor, the use of which has been proven to improve the efficiency of use of urea in many situations, with no short- or long-term adverse effects on crops or soils. There is, however, an increased risk of leaching of urea to surface and ground waters. Its agronomic effectiveness and especially its impact on ammonia emissions to the environment need to be tested under a wide range of UK conditions.
6. The hydrolysis of urea will cause an increase in pH, often large, followed by a decrease as ammonium is nitrified and protons produced. One might expect this ‘swing’ in pH to exert an additional stress on soil microbes, perhaps altering the community structure. However, a change in community structure (if it does occur) will not necessarily have any impact on soil functioning. With no body of evidence on this topic, it would seem prudent to conduct some experimental work to specifically search for long-term impacts of continued urea application with and without Agrotain.
document.doc 101
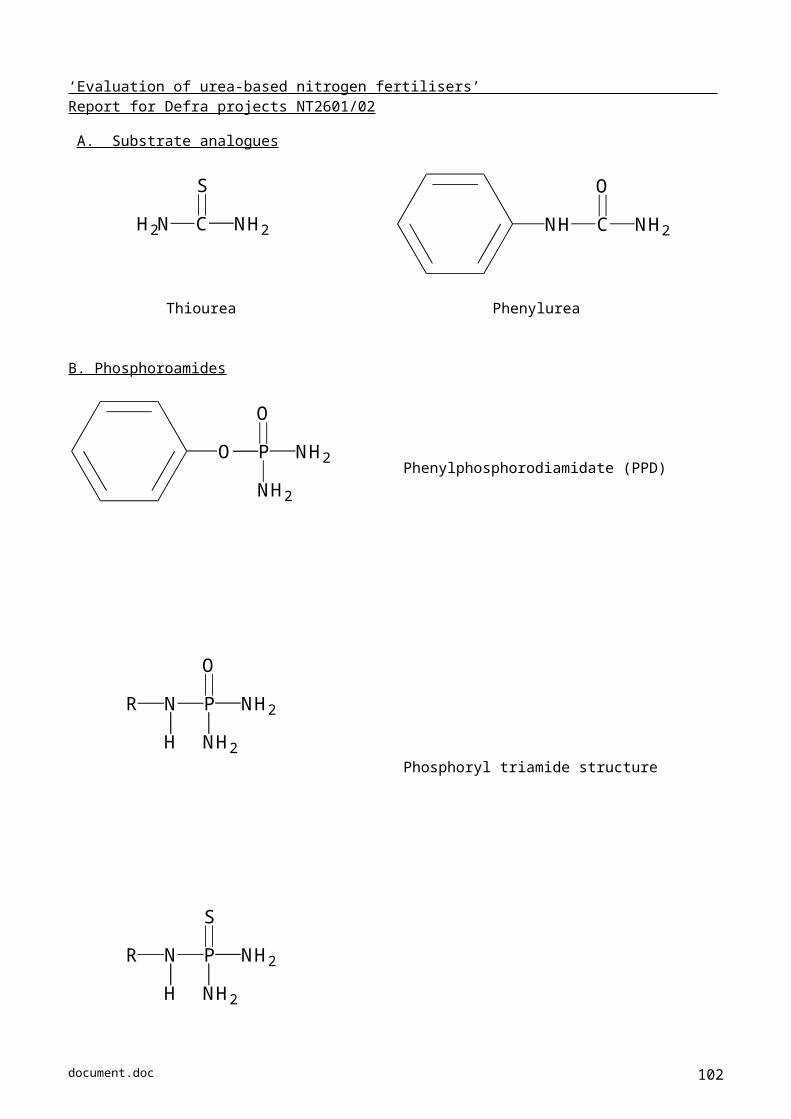
‘Evaluation of urea-based nitrogen fertilisers’ Report for Defra projects NT2601/02
7. Models of the emission of ammonia from applied urea would help predict future emissions in the event of increased urea usage, and also to help identify ways to ameliorate losses and evaluate the efficacy of such treatments. Unfortunately, specific urea-based models are relatively few. If mechanistic modelling is to be done then the model of Rachhpal-Singh and Nye would be the best to develop. In the short term, the NARSES model provides the best platform for predicting ammonia emissions following the land application of urea, taking into account soil pH, land use, application rate and weather (rainfall and temperature) factors to predict losses.
8. The impact on ammonia emission scenarios of a switch to urea, and possible mitigation options, were tested using simple emission inventory data. Three approaches, the UK Ammonia Emissions Inventory, the ‘prototype’ NARSES model and the EMEP/CORINAIR Emission Inventory Guidebook, all gave the similar results. If all fertiliser N was applied as urea there would be an increase of 75–85% in ammonia emissions. However, almost all of this increase could potentially be avoided by using Agrotain; no other mitigation options were assessed to be of major benefit. There is clearly a need to confirm these predictions.
document.doc 102

‘Evaluation of urea-based nitrogen fertilisers’ Report for Defra projects NT2601/02
11. References
Abdullatif, F. A. and Stroehlein, J. L. (1990). Response of Tomato to Rates and Methods of Placement of Urea and Ammonium-Sulfate as Affected by Dwell, a Nitrification Inhibitor. Communications in Soil Science and Plant Analysis, 21, 2163-2171.
Adams S.N. (1960). The value of calcium nitrate and urea for sugar beet, and the effect of late nitrogenous top dressings. J. Agric. Sci. 54: 395-398.
Ahmad, A., Abrol, Y. P. and Abdin, M. Z. (1999). Effect of split application of sulphur and nitrogen on growth and yield attributes of Brassica genotypes differing in time of flowering. Canadian Journal of Plant Science, 79, 175-180.
Akiyama, H. and Tsuruta, H. (2002). Effect of chemical fertiliser form on N2O, NO and NO2 fluxes from Andisol field. Nutrient Cycling in Agroecosystems, 63, 219-230.
Alcantar, G., Sandoval, M., Castellanos, J. Z., Mendez, F., Sanchez, P. and Rodriguez, M. N. (2002). Diagnostic methods to evaluate nutrient status of garlic, onion, and broccoli. Communications in Soil Science and Plant Analysis, 33, 2585-2598.
Alsup, C. M., Kahn, B. A. and Payton, M. E. (2002a). Using hairy vetch to manage soil phosphorus accumulation from poultry litter applications in a warm-season vegetable rotation. Hortscience, 37, 490-495.
Alsup, C. M., Kahn, B. A. and Payton, M. E. (2002b). Using cowpea to manage soil phosphorus accumulation from poultry litter applications in a cool-season vegetable rotation. Hortscience, 37, 496-501.
Anon, (1978). Council Directive on the quality of fresh waters needing protection or improvement in order to support fish life. Council directive 78/659/EEC.
Anon, (2000). Fertiliser Recommendations for Agricultural and Horticultural Crops (RB209) HMSO, London.
Anon, (2001). Commission Regulation (EC) No 466/2001 Of 8 March 2001 Setting Maximum Levels for Certain Contaminants in Foodstuffs. Official Journal of the European Communities L77, 1-13.
Anon, (2002). Ammonia in the UK. DEFRA Publications, Admial 6000, London.
Anon, (2003). Emission Inventory Guidebook. Cultures with Fertilisers, Activities 100101-100105, European Commission. 42pp.
ApSimon HM, Couling S, Cowell D, Warren RF. (1995) Reducing the contribution of ammonia to nitrogen deposition across Europe. Water Air And Soil Pollution 85, 1891-1896.
Baker J.L., Colvin, T.S., Marley, S.J. & Dawelbeit, M. (1985). Improved fertiliser management with a point-injector applicator. Paper Maerican Society of Agricultural Engineers No. 85-1516 12pp.
Bakr, A. A. and Gawish, R. A. (1997). Trials to reduce nitrate and oxalate content in some leafy vegetables 2. Interactive effects of the manipulating of the soil nutrient supply, different blanching media and preservation methods followed by cooking process. Journal of the Science of Food and Agriculture, 73, 169-178.
Banerjee, M.R., Burton, D.L. & Grant, C.A. (1999). Influence of urea fertilization and urease inhibitor on the size and activity of the soil microbial biomass under conventional and zero tillage at two sites. Canadian Journal of Soil Science 79, 255-263.
Barker, A. S., Yehuda, R. B. and Kafkafi, U. (1980). Effects of rate, source and distribution method of nitrogen fertiliser on seed potato production. Journal of Agricultural Science, Cambridge, 94, 745-747.
Barker, A. V. and Corey, K. A. (1990). Ethylene Evolution by Tomato Plants Receiving Nitrogen Nutrition from Urea. Hortscience, 25, 420-421.
Barker, A. V., Peck, N. H. and Macdonald, G. E. (1971). Nitrate accumulation in vegetables. I. Spinach grown
document.doc 103
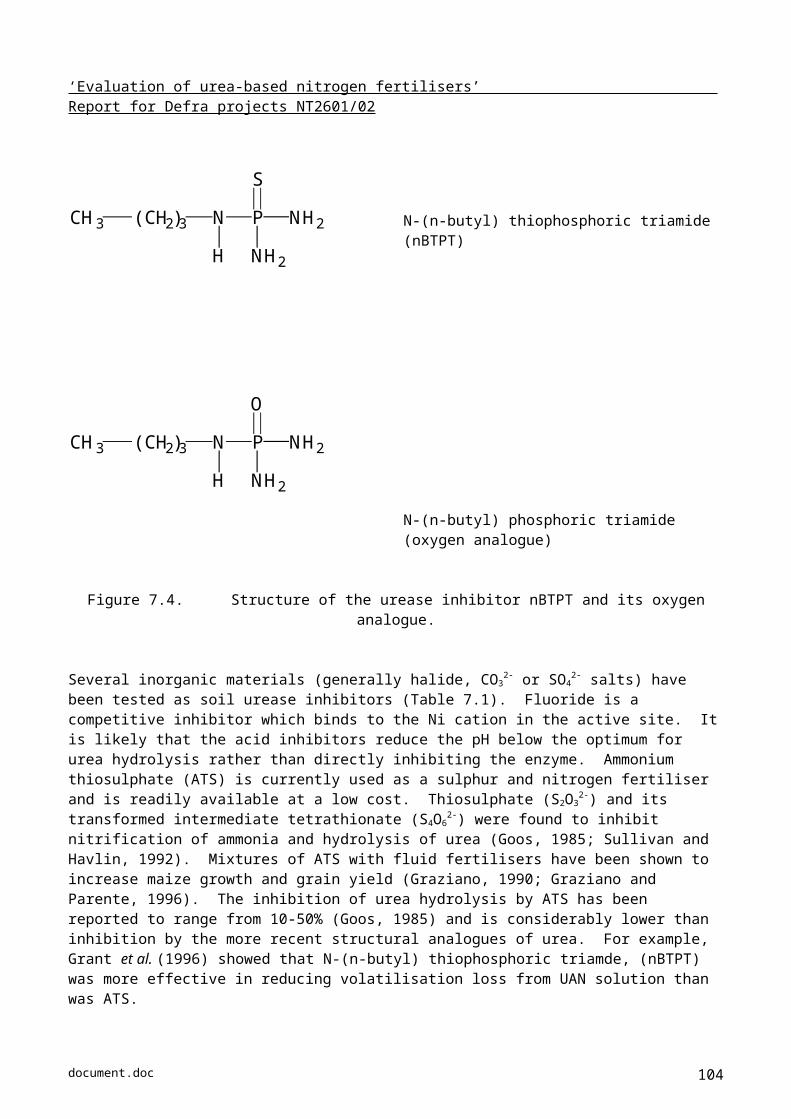
‘Evaluation of urea-based nitrogen fertilisers’ Report for Defra projects NT2601/02
in upland soils. Agronomy Journal, 63, 126-129.
Barrett K. (1998) Oceanic ammonia emissions in Europe and their transboundary fluxes. Atmospheric Environment 32, 381-391.
Brink C, Kroeze C, Klimont Z. (2001). Ammonia abatement and its impact on emissions of nitrous oxide and methane - Part 2: application for Europe. Atmospheric Environment 35, 6313-6325.
Bayrakli, F. and Gezgin, S. (1996). Controlling ammonia volatilization from urea surface applied to sugar beet on a calcareous soil. Communications in Soil Science and Plant Analysis, 27, 2443-2451.
Black, A. S., Sherlock, R. R., Smith, N. P. and Cameron, K. C. (1989). Ammonia volatilisation from urea broadcast in spring to autumn-sown wheat. New Zealand Journal of Crop and Horticultural Science 17, 175-182.
Black, A.S., Sherlock, R.R. & Smith, N.P. (1987b). Effect of urea granule size on ammonia volatilization from surface-applied urea. Fertiliser Research 11, 87-96.
Blake, A. 1991. Going green over nitrogen leaching. Farmers Weekly, 1 March 1991, Arable Supplement, pp 6-7.
Blanke, M. M., Bacher, W., Pring, R. J. and Baker, E. A. (1996). Ammonium nutrition enhances chlorophyll and glaucousness in Kohlrabi. Annals of Botany, 78, 599-604.
Bollard, E.E. (1959). Urease, Urea and Ureides in Plants . In: Utilisation of Nitrogen and its Compounds by Plants, XIII Symposia of Soc. Exp. Biol., Acad Press, New York, USA, p304-329.
Bollard, E.G., Cook, A.R. & Turner, N.A. (1968). Urea as sole source of nitrogen for plant growth. I. The development of urease activity in Spirodela oligorrhiza. Planta 83, 1-12.
Bolle, H.J., Seiler, W., and Bolin, B. (1986). Other greenhouse gases and aerosols. Assessing their role for atmospheric radiative transfer. In: (B.R. Doos, J. Jager, and R.A. Warrick, eds.), “The Greenhouse Effect, Climatic Change and Ecosystems”, pp. 157-202. John Wiley & Sons, Chichester, UK.
Boswell, F.C., Meisinger, J.J. and Case, N.L. (1985) Production, marketing and use of nitrogen fertilisers. In Fertiliser technology and use, 3rd edition, ed. O.P. Engelstad. Soil Science Society of America, Madison, USA, pp 229-292.
Bouwman, A.F. (1990). Soils and the Greenhouse Effect. Wiley, Chichester.
Bouwman A.F. (1994) Method to estimate direct nitrous oxide emissions from agricultural soils. Report 773004004, National Institute of Public Health and Environmental Protection, Bilthoven, The Netherlands.
Bouwman, A.F. (1996) Direct emissions of nitrous oxide from agricultural soils. Nutrient Cycling in Agroecosystems 46, 53-70.
Bouwman, A.F., Boumans, L.J.M. & Batjes, N.H. (2002a) Estimation of global NH3 volatilisation loss from synthetic fertilisers and animal manure applied to arable lands and grasslands. Global Biogeochemical Cycles 16 (2) 8-1 – 8-15.
Bouwman, A.F. & Boumans, L.J.M. (2002b) Modelling global annual N2O and NO emissions from fertilised fields. Global Biogeochemical cycles 16 (4) 28-1 – 28-9.
Bremner J.M. & Chai H.S. (1986) Evaluation of N-butyl phosphorothioic triamide for retardation of urea hydrolysis in soil. Communications in Soil Science and Plant Analysis. 17: 337-351.
Bremner, J.M., McCarty, G.W., Yeomans, J.C. & Chai, H.S. (1986). Effects of phosphoroamides on nitrification, denitrification, and mineralization of organic nitrogen in soil. Communications in Soil Science and Plant Analysis 17, 369-384.
Bremner, J.M. & Krogmeier, M.J. (1988). Elimination of the adverse effects of urea fertiliser on seed germination, seedling growth and early plant growth in soil. Proceedings of the National Academy of Sciences of the United States of America 85, 4601-4604.
document.doc 104
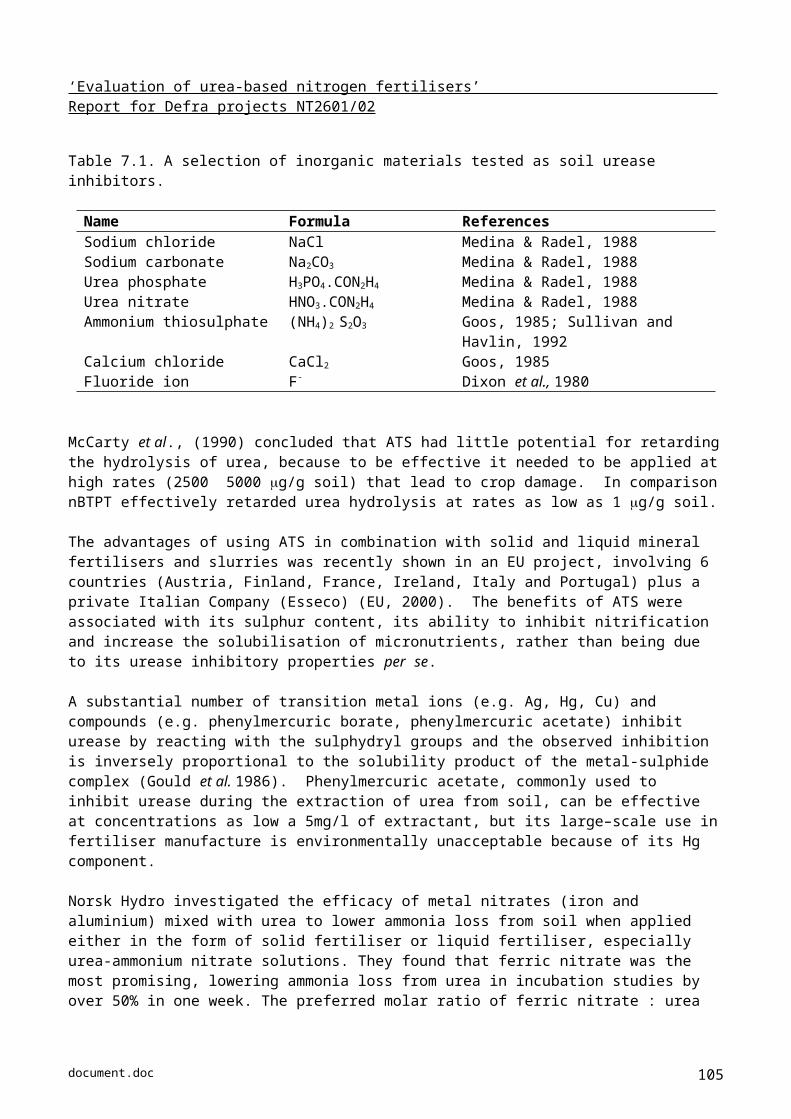
‘Evaluation of urea-based nitrogen fertilisers’ Report for Defra projects NT2601/02
Bremner, J.M., McCarty, G.W. & Higuchi, T. (1991). Persistence of the inhibitory effects of phosphoroamides on urea hydrolysis in soils. Communications in Soil Science and Plant Analysis 22, 1519-1526.
Brentrup, F., Kusters, J., Kuhlmann, H. and Lammel, J. (2001). Application of the Life Cycle Assessment methodology to agricultural production: an example of sugar beet production with different forms of nitrogen fertilisers. European Journal of Agronomy, 14, 221-233.
Brink C, Kroeze C, Klimont Z. (2001) Ammonia abatement and its impact on emissions of nitrous oxide and methane - Part 2: application for Europe. Atmospheric Environment 35, 6313-6325.
Broadbent, F.E., Hill, G.N. & Tyler, K.B. (1958) Transformations and movement of urea in soils. Soil Sci. Soc. Am. Proc. 22, 303-307.
Brown, B. D., Hornbacher, A. J. and Naylor, D. V. (1988). Sulfur-Coated Urea as a Slow-Release Nitrogen-Source for Onions. Journal of the American Society for Horticultural Science, 113, 864-869.
Brown, L., Armstrong-Brown, S., Jarvis, S.C., Syed, B., Goulding, K.W.T., Phillips, V.R., Sneath, R.W. and Pain, B.F. (2002a). An inventory of nitrous oxide emisions from agriculture in the UK using the IPCC methodology: emission estimate, uncertainty and sensitivity analysis. Atmos. Environ., 35, 1439-1449.
Brown, L., Syed, B., Jarvis, S.C., Sneath, R.W., Phillips, V.R., Goulding, K.W.T. and Li, C. (2002b). Development and application of a mechanistic model to estimate emission of nitrous oxide from UK agriculture. Atmos. Environ., 36, 917-928
Brown, P.H., Welch, R.M. and Carey, E.E. (1987). Nickel: a micronutrient essential for higher plants. Plant Physiology, 85 801-803.
BSFP (2002). British Survey of Fertiliser Practice for Crop Year 2001. Web address: (http://www.defra.gov.uk/environ/pollute/bsfp/index.htm)
Bundy L.G., Wolkowski R.P. & Weis G.G. (1986). Nitrogen source evaluation for potato production on irrigated sandy soils. American Potato Journal 63: 385-397.
Bundy, L.G. & Oberle, S.L. (1988). Evaluation of methods for control of ammonia volatilization from surface-applied urea-containing fertilisers. Journal of Fertiliser Issues. 5, 24-30.
Buresh, R.J., Vlek, P.L.G. & Stumpe, J.M. (1984). Labeled nitrogen fertiliser research with urea in the semi-arid tropics. I. Greenhouse studies. Plant and Soil 80, 3-19.
Buresh, R.J. & Baanante, C.A. (1993) Potential economic benefits of modifications to urea that increase yield through reduction in nitrogen losses. Agronomy Journal 85, 947-954.
Buresh, R.J., De Datta, S.K., Padilla, J.L. & Samson, M.I. (1988). Effect of two urease inhibitors on floodwater ammonia following urea application to lowland rice. Soil Science Society of America Journal 52, 856-861.
Burke, J.I., O'Reilly, B. & Gallagher, E.G. 1999. Agronomic performance of acid-based liquid fertiliser on winter wheat. Teagasc Report 4415, Crops Research Centre, Carlow, 18 pp. ISBN 1 84170 091 6.
Bussink D.W. & Oenema O. (1996) Differences in rainfall and temperature define the use of different types of nitrogen fertiliser on managed grassland in UK, NL and Eire. Netherlands J. Agric. Sci. 44: 317-338.
Byrnes, B.H. & Freney, J.R. (1995). Recent developments on the use of urease inhibitors in the tropics. Fertiliser Research 42, 251-259.
Carmona, G., Christianson, C.B. & Byrnes, B.H. (1990). Temperature and low concentration effects of the urease inhibitor N-(n-butyl) thiophosphoric triamide (nBTPT) on ammonia volatilization from urea. Soil Biology & Biochemistry 22, 933-937.
Carroll P.J. & McEnroe P. (1970). Effect of source, rate and time of nitrogen application on sugar beet. Irish J. Agric. Research 9: 383-390.
Chadwick, D.R., Sneath, R.W., Phillips V.R. and Pain, B.F. (1999). A UK inventory of nitrous oxide emissions from farmed livestock. Atmos. Environ., 33, 3345-3354.
document.doc 105
‘Evaluation of urea-based nitrogen fertilisers’ Report for Defra projects NT2601/02
Chai H.S. & Bremner J.M. (1987) Evaluation of some phosphoroamides as soil urease inhibitors. Biology and Fertility of Soils 3: 189-194.
Chalmers, A., Hounsome, B. and Rush, C. (2001). The British survey of fertiliser practice. Fertiliser use on farm crops for the year 2000. DEFRA, London.
Chaney K. & Paulson G.A. (1988). Field experiments comparing ammonium nitrate and urea top-dressing for winter cereals and grassland in the U.K. J. Agric. Sci 110: 285-299.
Chaney, K. (1990) Effect of nitrogen fertiliser rate on soil nitrate nitrogen content after harvesting winter wheat. Journal of Agricultural Science, Cambridge 114, 171-176.
Chauhan, H.S. & Mishra, B. (1989). Ammonia volatilization from a flooded rice field fertilized with amended urea materials. Fertiliser Research 19, 57-63.
Chen, J.A. & MacKenzie, A.F (1993) Effects of rates and placement methods of urea and potassium chloride on soil nitrogen and potassium and corn dry matter yields. Canadian Journal of Soil Science 73, 147-155
Cheng, W., Nakajima, Y., Sudo, S., Akiyama, H. and Tsuruta, H. (2002). N2O and NO emissions from a field of Chinese cabbage as influenced by band application of urea or controlled-release urea fertilisers. Nutrient Cycling in Agroecosystems, 63, 231-238.
Childs E.C. 1969. An Introduction to the Physical Basis of Soil water Phenomena. Publ., Wiley-Interscience, London.
Chin, W. Kroontje, W. (1962) Mechanisms of urea adsorption by soils. Soil Sci. Soc. Am. Proc. 26, 479-481.
Clayton, H., McTaggart, I. P., Parker, J., Swan, L., and Smith, K. A. (1997). Nitrous oxide emissions from fertilised grassland: a 2-year study of the effects of fertiliser form and environmental conditions. Biol. Fertil. Soils 25, 252-260.
Court, M. N., Stephen, R. C. and Waid, J. S. (1964). Toxicity as a cause of the inefficiency of ure as a fertiliser. I. Review. Journal of Soil Science, 15, 42-48.
Cowell DA, Ap Simon HM. (1998). Cost-effective strategies for the abatement of ammonia emissions from European agriculture. Atmospheric Environment 32, 573-580.
Crutzen, P. J. (1981). Atmospheric chemical processes of the oxides of nitrogen, including nitrous oxide. In “Denitrification, Nitrification and Nitrous Oxide” (J. Delwiche, ed.), pp 17-44. J. Wiley and Sons, New York.
Crutzen, P. J., (1979). The role of NO and NO2 in the chemistry of the troposphere and the stratosphere. Ann. Rev. Earth Planet Sci., 7, 333-372.
Csizinszky, A. A. (1994). Yield Response of Bell Pepper and Tomato to Controlled-Release Fertilisers on Sand. Journal of Plant Nutrition, 17, 1535-1549.
Daemmgen U, Luttich M, Dohler H, Eurich-Menden B, Osterburg B. (2002) GAS-EM - a procedure to calculate gaseous emissions from agriculture. Landbauforschung Volkenrode 52, 19-42.
Dampney, P.M.R, Salmon, S.E., Greenwell, P., and Pritchard, P.E. (1995). Management of breadmaking wheat: Effects of extra nitrogen on yield, grain and flour quality. Project report 109, Home-Grown Cereals Authority, London.
Darby R.J. & Hewitt M.V. (1990). A comparison of the effects of single or multiple spring applications of prilled urea or ‘Nitro-chalk’ to winter oilseed rape (Brassica napus). J. Agric. Sci 115: 363-368.
Davies, D.B. & Sylvester-Bradley, R. (1995) The contribution of fertiliser nitrogen to leachable nitrogen in the UK: A review. J. Sci. Food Agric. 68, 399-406.
Davies, L.H. 1976. Slow-release fertilisers, particularly sulphur-coated urea. Proceedings of the Fertiliser Society 153, 64 pp.
document.doc 106
‘Evaluation of urea-based nitrogen fertilisers’ Report for Defra projects NT2601/02
Devine J.R. & Holmes M.R.J. (1963a). Field experiments comparing ammonium sulphate, ammonium nitrate, calcium nitrate and urea combine-drilled with spring barley. J. Agric. Sci 61: 381-390.
Devine J.R. & Holmes M.R.J. (1963b). Field experiments on the value of urea as a fertiliser for barley, sugar beet, potatoes, winter wheat and grassland in Great Britain. J. Agric. Sci 61: 391-396.
Dobbie, K.E., McTaggart, I.P. and Smith, K.A. (1999) Nitrous oxide emissions from intensive agricultural systems: variations between crops and seasons; key driving variables; and mean emission factors. Journal of Geophysical Research 104, 26891-26899.
Dobbie K.E. and Smith K.A. (2001). Impact of different forms of N fertiliser on N2O emissions from intensive grassland. Poster presentation at the N2001 conference, October 2001, Maryland, USA.
Dobbie, K.E. and Smith, K.A. (2003a). Nitrous oxide emission factors for agricultural soils in Great Britain: the impact of soil water-filled pore space and other controlling variables. Global Change Biology 9, 204-218.
Dobbie K.E. and Smith, K,A, (2003b), Impact of different forms of fertiliser on N2O emissions from intensive grassland. Nutrient Cycling in Agroecosystems (in press).
Dosche, P. & Gutser, R. (1996) Reducing N losses (NH3, N2O, N2) and immobilisation from slurry through optimised application techniques. Fertiliser Research 43, 165-171.
Drost, D., Koenig, R. and Tindall, T. (2002). Nitrogen use efficiency and onion yield increased with a polymer-coated nitrogen source. Hortscience, 37, 338-342.
EC (1978) Council Directive on the quality of fresh waters needing protection or improvement in order to support fish life. Council directive 78/659/EEC.
ECETOC (1994). Ammonia emission to the air in Western Europe. Technical Report No. 62, ECETOC, Brussels, Belgium.
Eicher, M. J. (1990). Nitrous oxide emissions from fertilized soils: summary of available data. Environ. Qual. 19, 272-280.
Elkashif, M. E., Locascio, S. J. and Hensel, D. R. (1983). Isobutylidene Diurea and Sulfur-Coated Urea as N-Sources for Potatoes. Journal of the American Society for Horticultural Science, 108, 523-526.
Eriksen, A.B. & Kjeldby, M. (1987) A comparative study of urea hydrolysis rate and ammonia volatilisation from urea and urea calcium nitrate. Fertiliser Research 11, 9-24.
Eriksen, A.B., Kjeldby, M & Nilsen, S. (1985). The effect of intermittent flooding on the growth and yield of wetland rice and nitrogen-loss mechanism with surface applied and deep placed urea. Plant and Soil 84, 387-401.
Erisman JW, Grennfelt P, Sutton M. (2003) The European perspective on nitrogen emission and deposition. Environment International 29, 311-325.
Feng, J. and Barker, A. V. (1992). Ethylene Evolution and Ammonium Accumulation by Tomato Plants with Various Nitrogen Forms and Regimes of Acidity .1. Journal of Plant Nutrition, 15, 2457-2469.
Fenn L.B. & Hossner L.R. (1985). Ammonia volatilization from ammonium or ammonium-forming nitrogen fertilisers. Advances in Soil Science. 1: 121-169.
Fenn, L. B., Taylor, R. M. and Burks, C. M. (1994). Calcium Stimulation of Ammonium Absorption and Growth by Beet. Agronomy Journal, 86, 916-920.
Fenn, L. B., Taylor, R. M., Binzel, M. L. and Burks, C. M. (1991). Calcium Stimulation of Ammonium Absorption in Onion. Agronomy Journal, 83, 840-843.
Fenn, L.B., Matocha, J.E. & Wu, E. (1982). Soil cation exchange capacity effects on ammonia loss from surface-applied urea in the presence of soluble calcium. Soil Science Society of America Journal 46, 78-81.
document.doc 107
‘Evaluation of urea-based nitrogen fertilisers’ Report for Defra projects NT2601/02
Fox R.H., Kern J.m. & Piekielek W.P. (1986). Nitrogen fertiliser source, and method and time of application effects on no-till corn yields and nitrogen uptake. Agronomy Journal 78: 741-746.
Fox R.H., Piekielek W.P. & Macneal K.E. (1996). Estimating ammonia volatilization losses from urea fertilisers using a simplified micrometeorological sampler. Soil Sci. Soc. Am. Journal 60: 596-601.
Gabal, M. R. (1982). Effect of Urea Nutrition on Seedlings, Plant-Growth, Flowering Time and Yield of Sweet Pepper (Capsicum-Annuum-L). Acta Agronomica Academiae Scientiarum Hungaricae, 31, 371-385.
Galbally, I.E. (1985). The emission of nitrogen to the remote atmosphere: Background paper. In: The Biogeochemical Cycling of Sulfur and Nitrogen in the Remote Atmosphere (I.E. Galbally et al., eds), D. Reidel Publishing Co, Dordrecht, The Netherlands, pp. 27-53.
Garrett, M.K (1987) The rationale for mixed ammonium nitrate-urea fertilisers and assessment of granular products. Proceedings of the Fertiliser Society No. 257, 36pp.
Gasser J.K.R. (1964). Urea as a fertiliser. Soils and Fertilisers 27: 175-180
Gateley G.F. (1994). A note on urea versus calcium ammonium nitrate for winter wheat. Irish Journal of Agricultural and Food Research 33: 193-196
Génermont S. & Cellier P. (1997). A mechanistic model for estimating ammonia volatilisation from slurry applied to bare soil. Agricultural and Forest Meteorology, 88: 145-167.
Gerendas, J. and Sattelmacher, B. (1997a). Significance of Ni supply for growth, urease activity and the concentrations of urea, amino acids and mineral nutrients of urea-grown plants. Plant and Soil, 190, 153-162.
Gerendas, J. and Sattelmacher, B. (1997b). Significance of N source (urea vs. NH4NO3) and Ni supply for growth, urease activity and nitrogen metabolism of zucchini (Cucurbita pepo convar. giromontiina). Plant and Soil, 196, 217-222.
Gerendas, J. and Sattelmacher, B. (1999). Influence of Ni supply on growth and nitrogen metabolism of Brassica napus L. grown with NH4NO3 or urea as N source. Annals of Botany, 83, 65-71.
Gezgin, S. & Bayrakli, F. (1995) Ammonia volatilisation from ammonium sulphate, ammonium nitrate, and urea surface applied to winter wheat on a calcareous soil. Journal of plant nutrition 18, 2483-2494.
Giroux, M. (1984). Comparison of Urea and Ammonium-Nitrate as N-Fertiliser Sources for Potato. American Potato Journal, 61, 522-523.
Gooding, M.J. and Davies, W.P. 1992. Foliar urea fertilization of cereals - a review. Fertiliser Research 32, 209-222.
Goss, M.J., Howse, K.R., Lane, P.W., Christian, D.G. & Harris, G.L. (1993) Losses of nitrate nitrogen in water draining from under autumn-sown crops established by direct drilling or mouldboard ploughing. Journal of Soil Science 44, 35-38.
Gould, W.D., Hagedorn, C. & McCready, R.G.L. (1986). Urea transformations and fertiliser efficiency in soil. Advances in Agronomy 40, 209-238.
Goulding, K.W.T., Hutsch, B.W., Webster, C.P., Willison, T.W. & Powlson, D.S. (1995) The effect of agriculture on methane oxidation in soil. Philosophical Transactions of the Royal Society of London A 351, 313-325.
Granli, T. and Bøckman, O.C. (1994). Nitrous oxide from agriculture. Norwegian J. Agric. Sci., Supplement No 12, pp. 1-128.
Grant, C. (2002). Untitled interview in 'The growing market for nitrification inhibitors, urease inhibitors and stabilised fertilisers.’ New AG International, December 2002, p 28.
Grant, C. A., Brown, K. R., Racz, G. J. and Bailey, L. D. (2002). Influence of source, timing and placement of nitrogen fertilization on seed-yield and nitrogen accumulation in the seed of canola under reduced- and conventional-tillage management. Canadian Journal of Plant Science, 82, 629-638.
document.doc 108
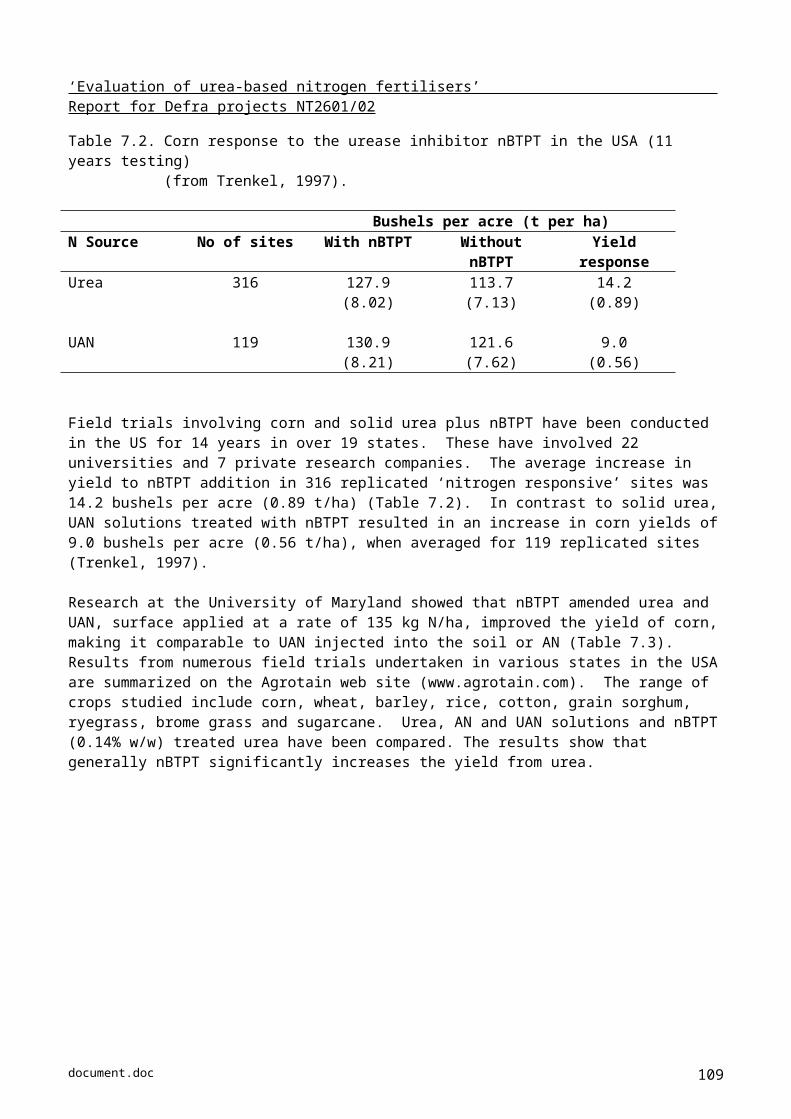
‘Evaluation of urea-based nitrogen fertilisers’ Report for Defra projects NT2601/02
Grant, C.A. & Bailey, L.D. (1999). Effect of seed-placed urea fertiliser and N-(n-butyl) thiophosphoric triamide (NBPT) on emergence and grain yield of barley. Canadian Journal of Plant Science 79, 491-496.
Guangming, T., Zucong, C., Jinliu, C. & Xiaoping, L. (2001) Factors affecting ammonia volatilisation from a rice-wheat rotation system. Chemosphere, 42 (2) 123-129.
Guertal, E. A. (2000). Preplant slow-release nitrogen fertilisers produce similar bell pepper yields as split applications of soluble fertiliser. Agronomy Journal, 92, 388-393.
Gunes, A., Post, W. N. K., Kirkby, E. A. and Aktas, M. (1994). Influence of Partial Replacement of Nitrate by Amino-Acid Nitrogen or Urea in the Nutrient Medium on Nitrate Accumulation in Nft Grown Winter Lettuce. Journal of Plant Nutrition, 17, 1929-1938.
Gunes, A., Post, W. H. K. and Aktas, M. (1995). Effect of partial replacement of nitrate by NH4-N, urea-N and amino acid-N in nutrient solution on nitrate accumulation in lettuce (Lactuca sativa L). Agrochimica, 39, 326-333.
Gunes, A., Inal, A. and Aktas, M. (1996). Reducing nitrate content of NFT grown winter onion plants (Allium cepa L) by partial replacement of NO3 with amino acid in nutrient solution. Scientia Horticulturae, 65, 203-208.
Hamid A. & Ahmad M. (1995). Interaction of 15N-labelled ammonium nitrate, urea and ammonium sulphate with soil N during growth of wheat (Triticum aestivum L.) under field conditions. Biol. Fertil. Soils 20: 185-189
Hankin, L. and Hill, D. E. (1982). Yield Losses and Increases in Certain Vitamins in Cucumbers Treated with the Herbicide 3-Amino-2,5-Dichlorobenzoate and Urea Fertiliser. Soil Science, 134, 193-197.
Hargreaves, P.R., Brookes, P.C., Ross, G.J.S. & Poulton, P.R. (2003) Evaluating soil microbial biomass carbon as an indicator of long-term environmental change. Soil Biology & Biochemistry 35, 401-407.
Hargrove W.L. (1988) Evaluation of ammonia volatilisation in the field. Journal of Production Agriculture 1, 104-111.
Hargrove, W. L., Kissel, D. E., and Fenn, L. B. (1977). Field measurements of ammonia volatilization from surface applications of ammonium salts to a calcareous soil. Agron. J. 69, 473-476.
Harper, J.E. (1984). Uptake of organic nitrogen forms by roots and leaves. In: Hauck R.D. (ed) Nitrogen in Crop Production. pp. 165-170. ASA, CSSA, SSSA, Madison, WI, USA.
Harrison R. and Webb J. (2001) A review of the effect of N fertilizer type on gaseous emissions. Advances in Agronomy 73, 65-108.
Hartz, T. K., Lestrange, M. and May, D. M. (1993). Nitrogen Requirements of Drip-Irrigated Peppers. Hortscience, 28, 1097-1099.
Hassan, Z.A., Young, S.D., Hepburn, C. & Arizal, R. (1992). Urea-rubber matrices as slow-release fertilisers. Fertiliser Research 32, 83-90.
Haynes R.J. (1986) Uptake and assimilation of mineral nitrogen by plants. In: Haynes R.J. (ed). Mineral nitrogen in the plant-soil system. pp 303-378. Academic Press, Inc. London
Haynes, R.J. & Goh, K.M. (1978). Ammonium and nitrate nutrition of plants. Biological Reviews 53, 465-510.
Haynes, R. J. (1988). Comparison of Fertigation with Broadcast Applications of Urea-N on Levels of Available Soil Nutrients and on Growth and Yield of Trickle-Irrigated Peppers. Scientia Horticulturae, 35, 189-198.
He, N. Z., Ye, Z. Q., Ouyang, H. and Xiong, J. S. (1995). Effect of Lime Nitrogen on the Efficiency of Urea and Other Ammonium Nitrogen Fertilisers. Fertiliser Research, 41, 19-26.
Hénault, C., Devis, X., Lucas, J.L. and Germon, J.C. (1998). Influence of different agricultural practices (type of crop, form of N-fertiliser) on soil nitrous oxide emissions. Biol. Fert. Soils, 27, 299-306.
document.doc 109

‘Evaluation of urea-based nitrogen fertilisers’ Report for Defra projects NT2601/02
Hendrickson, L.L. (1992). Corn yield response to the urease inhibitor NBPT: Five-year summary. Journal of Production Agriculture 5, 131-137.
Hengnirun S., Barrington S., Prasher S.O. & Lyew D. 1999. Development and verification of a model simulating ammonia volatilisation from soil and manure. Journal of Environmental Quality, 28: 108-114.
Henriksen, K. (1979). Emergence of vegetables influenced by increasing nitrogen fertilisation - in leeks combined with three sowing depths. Tidsskrift for Planteavl, 83, 563-574.
Hentschel, G (1976). Aufnahme und Verteilung van 15N-markiertem Harnstoft bei Phaseolus Vulgaris L. Pfl. Ernähr, Buden Kd. 139 239-251.
Heuer, B. (1991). Growth, Photosynthesis and Protein-Content in Cucumber Plants as Affected by Supplied Nitrogen Form. Journal of Plant Nutrition, 14, 363-373.
Hopkinson I.P. (1992). Safe and effective use of the available forms of solid nitrogen fertiliser for sugar beet. Aspects of Applied Biology 32: (Production and protection of sugar beet) 141-145.
Howard D.D. & Essington M.E. (1998). Effects of surface-applied limestone on the efficiency of urea-containing nitrogen sources for no-till corn. Agronomy Journal 90: 523-528.
Hutchinson G.L. and Davidson, E.A. (1993) Processes for production and consumption of gaseous nitrogen oxides in soil. In. Agricultural Ecosystem Effects on Trace Gases and Global Climate Change, vol. 55 pp. 79-93. American Society of Agronomy Special Publication, Madison.
Hutchinson, G.L., Millington, R.J. and Peters, D.B. (1972) Science 175, 771.
Ikeda, H. and Tan, X. W. (1998). Urea as an organic nitrogen source for hydroponically grown tomatoes in comparison with inorganic nitrogen sources. Soil Science and Plant Nutrition, 44, 609-615.
IMC - Agrico (1997). Urease inhibitor Agrotain. Product Information Guidebook. p. 1-43.
IMC - Agrico (2003). Downloadable model of ammonia volatilisation from urea, at ; www.agrotain.com
Inal, A., Gunes, A. and Aktas, M. (1995). Effects of Chloride and Partial Substitution of Reduced Forms of Nitrogen for Nitrate in Nutrient Solution on the Nitrate, Total Nitrogen, and Chloride Contents of Onion. Journal of Plant Nutrition, 18, 2219-2227.
Inal, A. and Tarakcioglu, C. (2001). Effects of nitrogen forms on growth, nitrate accumulation, membrane permeability, and nitrogen use efficiency of hydroponically grown bunch onion under boron deficiency and toxicity. Journal of Plant Nutrition, 24, 1521-1534.
IPCC (Intergovernmental Panel on Climate Change) (1997). Nitrous oxide and carbon dioxide in agriculture; OECD/IPCC/IEP phase II development of IPCC guidelines for national greenhouse gas inventory methodology. Workshop Report, 4-6 December 1995. OECD, IPCC, IEA. Geneva.
IPCC (Intergovernmental Panel on Climate Change) (2001). Good Practice Guidance and Uncertainty Management in National Greenhouse Gas Inventories. Institute for Global Environmental Strategies, Kanagawa, Japan.
Itulya, F. M., Mwaja, V. N. and Masiunas, J. B. (1997). Collard-cowpea intercrop response to nitrogen fertilization, redroot pigweed density, and collard harvest frequency. Hortscience, 32, 850-853.
Jayaweera G.R. & Mikkelsen D.S. (1990). Ammonia volatilisation from flooded soil systems: A computer model. I. Theoretical aspects. Soil Science Society of America Journal, 54: 1447-1455.
Johansson M, Alveteg M, Amann M, Bak J, Bartnicki J, Ekqvist M, Forsius M, Frohn L, Geernaert G, Gimeno B, Guardans R, Karvosenoja N, Martin F, Posch M, Suutari R, Syri S. (2001) Integrated assessment modeling of air pollution in four European countries. Water Air and Soil Pollution 130, 175-186.
Johnston, D. (1988) Method and apparatus for the jet injection of agricultural liquids into the soil. Canadian Patent No 12327895.
document.doc 110

‘Evaluation of urea-based nitrogen fertilisers’ Report for Defra projects NT2601/02
Jonsson L & Johansson O. (1972). Field trials on urea as a source of nitrogen for some Swedish agricultural crops. Swedish J. Agric. Res. 1: 203-223
Joo, Y.K., Christians, N.E., & Blackmer, A.M. (1991). Kentucky bluegrass recovery of urea-derived nitrogen – 15 amended with urease inhibitor. Soil Science Society of America Journal 55, 528-530.
Joris, G.G. & Sor, K. (1971) Urea-ammonium sulphate fertilisers show good market potentials. Agr. Chem 26, 14-15 & 31-32.
Kallio, H. and Sandholm, J. (1982). Distribution of nitrapyrin [2-chloro-6-(trichloromethyl)-pyridine] and 2-chloro-6-(dichloromethyl)-pyridine in red beet treated with nitrapyrin. Journal of the Science of Food and Agriculture, 33, 451-455.
Kallio, H., Kyyro, M., Evers, A. M. and Korkman, J. (1982). Distribution of Nitrate in Red Beet Roots and Leaves Fertilized with Urea or Ammonium-Nitrate. Annales Agriculturae Fenniae, 21, 131-136.
Kallio, H., Linko, R. R., Tikanmaki, E. and Puntari, I. (1980). Effect of nitrapyrin residues and nitrate content in red beet roots fertilised with urea. Journal of the Science of Food and Agriculture, 31, 701-708.
Keller, G.D. & Mengel, D.B. (1986) Ammonia volatilisation from nitrogen fertilisers surface applied to no-till corn. Soil Science Society of America Journal 50, 1060-1063.
Keller, M., Kaplan, W.A., Wofsy, S.C. and DaCosta, J.M. (1988). Emissions of nitrous oxide from tropical forest soils: Response to fertilization with ammonium, nitrate, and phosphate. J. Geophys. Res., 93, 1600-1604.
Kennedy, I.R. (1986) Acid soil and acid rain. John Wiley and Sons, New York.
Khan, N. K., Watanabe, M. and Watanabe, Y. (1999). Effect of different concentrations of urea with or without nickel addition on spinach (Spinacia oleracea L.) growth under hydroponic culture. Soil Science and Plant Nutrition, 45, 569-575.
Khan, N. K., Watanabe, M. and Watanabe, Y. (2000). Effect of partial urea application on nutrient absorption by hydroponically grown spinach (Spinacia oleracea L.). Soil Science and Plant Nutrition, 46, 199-208.
Kirk G.J.D. & Nye P.H. (1991a). A model of ammonia volatilisation from applied urea. V. The effects of steady-state drainage and evaporation. Journal of Soil Science, 42: 103-113.
Kirk G.J.D. & Nye P.H. (1991b). A model of ammonia volatilisation from applied urea. VI. The effects of transient-state water evaporation. Journal of Soil Science, 42: 115-125
Kirkby, E. A. and Mengel, K. (1967). Ionic balance in different tissues of the tomato plant in relation to nitrate, urea, or ammonium nutrition. Plant Physiology, 42, 6-14.
Kissel, D. E. and Cabrera, M. L. (1988). Ammonia volatilisation from urea and an experimental triazone fertiliser. Hortscience, 23, 1087.
Kissel, D.E., Sander, D.H. and Ellis, R. Jr. (1985) Fertiliser-plant interactions in alkaline soils. In Fertiliser technology and use, 3rd edition, ed. O.P. Engelstad. Soil Science Society of America, Madison, USA, pp 153-196.
Kotur, S. C. (1993). Relative Efficacy of Different Forms of Urea on Rainy-Season Cauliflower (Brassica-Oleracea Convar Botrytis Var Botrytis) and Brinjal (Solanum-Melongena) on Alfisol of Chhotanagpur. Indian Journal of Agricultural Sciences, 63, 436-439.
Krogmeier, M.J., McCarty, G.W. & Bremner, J.M. (1989). Potential phytotoxicity associated with the use of soil urease inhibitors. Proceedings of the National Academy of Sciences of the United States of America 86, 1110-1112.
Kwabiah, A.B., Voroney, R.P., Palm, C.A. and Stoskopf, N.C. (1999). Inorganic fertiliser enrichment of soil: effect on decomposition of plant litter under subhumid tropical conditions. Biology and Fertility of soils 30, 2240231.
document.doc 111

‘Evaluation of urea-based nitrogen fertilisers’ Report for Defra projects NT2601/02
Laughlin W.M. (1971). Response of potato to urea and other nitrogen sources. Research Report, Institute of Agricultural Sciences, University of Alaska. No. 71-1.
Leick, B. & Engels, C. (2001) Effects of various nitrogen fertilisers on nitrous oxide emissions from arable soils. In. Plant Nutrition – Food Security and Sustainability of Agro-Ecosystems (W.J. Horst, ed), Kluwer Academic Publishers, Dordrecht, The Netherlands, pp. 882-882.
Lightner, J. W., Mengel, D. B., and Rhykerd, C. L. (1990). Ammonia volatilization from nitrogen fertiliser surface applied to orchardgrass sod. Soil Sci. Soc. Am. J. 54, 1478-1482.
Lloyd, A. (1992) Urea as a nitrogen fertiliser for grass cut for silage Journal of Agricultural Science, Cambridge 119, 373-381.
Lloyd, A., Webb, J., Archer, J.R. & Sylvester-Bradley, R. (1997) Urea as a nitrogen fertiliser for cereals. Journal of Agricultural Science, Cambridge 128, 263-271.
Locascio, S. J., Fiskell, J. G. A. and Martin, F. G. (1981). Responses of bell pepper to nitrogen sources. Journal of the American Society for Horticultural Science, 106, 628-632.
Logan, J.A. (1983). Nitrogen oxides in the troposphere, global and regional budgets. J. Geophys. Res. 88,785-807.
Lord E.I. (1992) Modelling nitrate leaching: nitrate sensitive areas. Aspects of Applied Biology 30 19-28.
Lorenz, O. A., Weir, B. L. and Bishop, J. C. (1974). Effect of sources of nitrogen on yield and nitrogen absorption of potatoes. American Potato Journal, 51, 56-65.
Ludden, P.A., Harmon, D.L., Larson, B.T. & Axe, D.E. (2000). Influence of the novel urease inhibitor N-(n-butyl) thiophosphoric triamide on ruminant nitrogen metabolism: I. In vitro urea kinetics and substrate digestion. Journal of Animal Science 78, 181-187.
Luo, J. A., Lian, Z. H. and Yan, X. L. (1993). Urea Transformation and the Adaptability of 3 Leafy Vegetables to Urea as a Source of Nitrogen in Hydroponic Culture. Journal of Plant Nutrition, 16, 797-812.
Macdonald, A.J., Powlson, D.S., Poulton, P.R. & Jenkinson, D.S. (1989) Unused fertiliser nitrogen in arable soils – its contribution to nitrate leaching. Journal of the Science of Food and Agriculture 46, 407-419.
Maclean, A. A. (1983). Sources of fertiliser nitrogen and phosphorus for potatoes in Atlantic Canada. American Potato Journal, 60, 913-918.
Maclean, A. A. and Mcrae, K. B. (1987). Rate of Hydrolysis and Nitrification of Urea and Implications of Its Use in Potato Production. Canadian Journal of Soil Science, 67, 679-686.
MAFF. (2000) Fertiliser recommendations for agricultural and horticultural crops (RB209). London: The Stationery Office, 177 pp.
Maggiotto, S.R., Webb, J.A., Wagner-Riddle, C. and Thurtell, G.W. (2000). Nitrous oxide emissions from turfgrass receiving different forms of nitrogen fertiliser. J. Environ. Qual., 29, 621-630.
Maier, N. A., Mclaughlin, M. J., Heap, M., Butt, M. and Smart, M. K. (2002). Effect of nitrogen source and calcitic lime on soil pH and potato yield, leaf chemical composition, and tuber cadmium concentrations. Journal of Plant Nutrition, 25, 523-544.
Malhi, S.S., Grant, C.A., Johnston, A.M. and Gill, K.S. 2001. Nitrogen fertilization management for no-till cvereal production in the Canadian Great Plains: a review. Soil & Tillage Research 60, 101-122.
Manunza, B., Deiana, S., Pintore, M. & Gessa, C. (1999). The binding mechanism of urea, hydroxamic acid and N-(n-butyl) phosphoric triamide to the urease active site. A comparative molecular dynamics study. Soil Biology and Biochemistry. 31, 789-796.
Martin, H. W., Graetz, D. A., Locascio, S. J. and Hensel, D. R. (1993). Nitrification Inhibitor Influences on Potato. Agronomy Journal, 85, 651-655.
document.doc 112
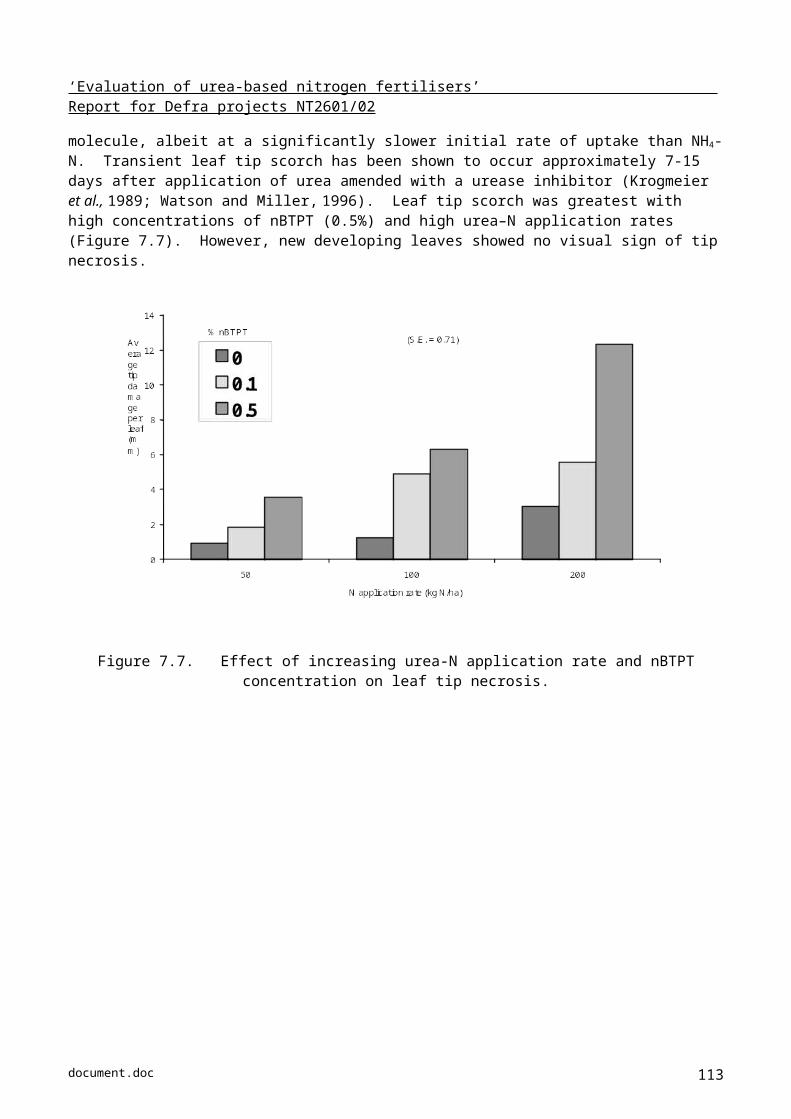
‘Evaluation of urea-based nitrogen fertilisers’ Report for Defra projects NT2601/02
Maynard, D. N., Barker, A. V., Minotti, P. L. and Peck, N. H. (1976). Nitrate accumulation in vegetables. Advances in Agronomy, 28, 71-118.
Mcardle, R. N. and Mcclurg, C. A. (1986). Effects of Sulfur-Coated Urea Fertiliser Regimes on Production of Processing Tomatoes on a Sandy Loam. Fertiliser Research, 8, 259-262.
McTaggart, I. P., Clayton, H., Parker, J., Swan, L.,and Smith, K. A. (1997). Nitrous oxide emissions from grassland and spring barley, following N fertiliser application with and without nitrification inhibitors. Biol. Fert. Soils 25, 261-268.
McTaggart, I.P., Clayton, H. & Smith, K.A. (1994). Nitrous oxide flux from fertilised grassland: strategies for reducing emissions. In: Non-CO2 Greenhouse Gases: Why and How to Control?. (J. van Ham, L.J. Janssen & R.J. Swart, eds.), Kluwer Academic Publishers, The Netherlands, pp 421-426.
Meisinger, J. J., Bouldin, D. R. and Jones, E. D. (1978). Potato yield reductions associated with certain fertiliser mixtures. American Potato Journal, 55, 227-234.
Mendum, T. A., Sockett, R. E., and Hirsch, P. R. (1999). Use of molecular and isotope techniques to monitor the response of autotrophic ammonia-oxidizing populations of the beta subdivision of the class Proteobacteria in arable soils to nitrogen fertiliser. Applied and Environmental Microbiology 65, 4155-4162.
Meyer, R. D., and Jarvis, S. C. (1989). The effects of fertiliser/urine interactions on NH3-N loss from grassland soils. In “Proceedings XVI International Grassland Conference, “pp. 155-156. Nice, France.
Mikkelsen, R. L. and Jarrell, W. M. (1987). Application of Urea Phosphate and Urea Sulfate to Drip- Irrigated Tomatoes Grown in Calcareous Soil. Soil Science Society of America Journal, 51, 464-468.
Mikkelsen, R.L. & Bock, B.R. (1988). Ammonia volatilization from urea phosphate fertilisers. In: Bock, B.R. and Kissel, D.E. (eds). Ammonia volatilization from Urea Fertilisers. pp 175-189. Bulletin Y-206, Alabama: National Fertiliser Development Center.
Misselbrook, T. H., van der Weerden, T. J., Pain, B. F., Jarvis, S. C., Chambers, B. J., Smith, K. A., Phillips, V. R. and Demmers, T. G. M. (2000). Ammonia emission factors for UK agriculture. Atmospheric Environment 34, 871-880.
Misselbrook T. & Smith K.A. (2002). Ammonia emissions from cattle farming. In, “Ammonia in the UK.” Publ., DEFRA, London, 2002. 40-47.
Misselbrook T.H., Chadwick, D.R., Chambers B.J., Smith, K.A., Webb, J., Phillips, V.R. and Sneath, R.W. (2002) Inventory of Ammonia Emissions from UK Agriculture 2001. DEFRA Contract AM0113, November 2002.
Montemurro, F., Capotorti, G., Lacertosa, G. and Palazzo, D. (1998). Effects of urease and nitrification inhibitors application on urea fate in soil and nitrate accumulation in lettuce. Journal of Plant Nutrition, 21, 245-252.
Mosier, A. and Kroeze, C. (1999). Contribution of agroecosystems to the global atmospheric N2O budget. Proceedings Of International Workshop on Reducing N2O Emissions from Agroecosystems, Banff, Canada, March 1999.
Mothes, K. (1961). The metabolism of urea and ureides. Canadian Journal of Botany, 39, 1785-1807.
Motis, T. N., Kemble, J. M., Dangler, J. M. and Brown, J. E. (1998). Tomato fruit yield response to nitrogen source and percentage of drip- or band-applied nitrogen associated with leaf potassium concentration. Journal of Plant Nutrition, 21, 1103-1112.
Murphy, D.V., Recous, S., Stockdale, E.A., Fillery, I.R.P., Jensen, L.S., Hatch, D.J. & Goulding, K.W.T. (2003). Gross nitrogen fluxes in soil: theory, measurement and application of 15N pool dilution techniques. Advances in Agronomy, 79, 69-118.
Murphy, H. J. and Goven, M. J. (1966). Effect of three nitrogen sources and biuret on yield and specific gravity of Katahdin potatoes in Maine. American Potato Journal, 43, 291-293.
document.doc 113

‘Evaluation of urea-based nitrogen fertilisers’ Report for Defra projects NT2601/02
Myers, R.J.K. (1974) Soil processes affecting nitrogenous fertilisers. In Fertilisers and the environment, ed. D.R. Leece, Australian Institute of Agricultural Science, Sydney, pp 13-25.
Nastri, A., Toderi, G., Bernati, E. & Govi, G. (2000) Ammonia volatilisation and yield response from urea applied to wheat with urease (NBPT) and nitrification (DCD) inhibitors. Agrochimica 44, 231-239.
Nemitz E., Flynn M, Williams P.I., Milford C., Theobald M.R., Blatter A., Gallagher M.W., and Sutton M.A. (2001) A relaxed eddy accumulation system for the automated measurement of atmospheric ammonia fluxes. Water, Air and Soil Pollution: Focus 1, 189-202.
Nicholson, F.A. (2001) Techniques for measuring ammonia emissions following land spreading of organic manures. Final report for defra project WA0645, March 2001.
Nômmik, H. (1973). The effect of pellet size on the ammonia loss from urea applied to forest soil. Plant and Soil 39, 309-318.
Nordestgaard, A. (1978). Trials in seed growing cultures of spinach (Spinacea oleracea) with various solid nitrogen fertilisers in increasing amounts and on different seeding rates and row spacings. Tidsskrift for Planteavl, 82, 231-242.
Nye, P.H. (1992). Towards the quantitative control of crop production and quality. 2. The scientific basis for guiding fertiliser and management practice, particularly in poorer countries. Journal of Plant Nutrition 15, 1151-1173.
O’Toole, P.O. and Morgan, M.A. (1988) Efficiency of Fertiliser Urea: The Irish Experience. In. Nitrogen Efficiency of Agricultural Soils (Eds. D.S. Jenkinson & K.A. Smith) Elsevier Applied Science. pp. 191-206.
Ombodi, A., Kosuge, S. and Saigusa, M. (2000). Effects of polyolefin-coated fertiliser on nutritional quality of spinach plants. Journal of Plant Nutrition, 23, 1495-1504.
Ouyang D.S., Mackenzie A.F. & Fan M.X. (1998) Ammonia volatilization from urea amended with triple superphosphate and potassium chloride. Soil Sci. Soc. Am. Journal 62: 1443-1447.
Overrein, L.N. & Moe, P.G. 1967. Factors affecting urea hydrolysis and ammonia volatilization in soil. Soil Science Society of America Proceedings 31, 57-61.
Pain, B. F., van der Weerden, T. J., Chambers, B. J., Phillips, V. R. and Jarvis, S. C. (1998). A new inventory for ammonia emissions from UK agriculture. Atmospheric Environment 32, 309-313.
Paul, E.A. & Clark, F.E. (1989) Soil Microbiology and Biochemistry. Academic Press, San Diego, California
Paulson G.A. & Chaney K. (1986). Urea as a nitrogen source in the UK. Levington Research Station (internal report)
Peck, N. H., Barker, A. V., MacDonald, G. E. and Shallenberger, R. S. (1971). Nitrate accumulation in vegetables. II. Table beets grown in upland soils. Agronomy Journal, 63, 30-33.
Penny, A., Addiscott, T. M. and Widdowson, F. V. (1984). Assessing the Need of Maincrop Potatoes for Late Nitrogen by Using Isobutylidene Di-Urea, by Injecting Nitrification Inhibitors with Aqueous N Fertilisers and by Dividing Dressings of Nitro-Chalk. Journal of Agricultural Science, 103, 577-585.
Pew, W. D., Gardner, B. R. and Bessey, P. M. (1983). Comparison of Controlled-Release Nitrogen Fertilisers, Urea, and Ammonium-Nitrate on Yield and Nitrogen Uptake by Fall-Grown Head Lettuce. Journal of the American Society for Horticultural Science, 108, 448-453.
Pimpini, F., Ventner, F. and Wunsch, A (1971). The influence of different nitrogen doses on the content of total nitrogen and nitrate in cauliflower plants. Warszawa-Skierniewice 13-17 Sept 1971. Instytut Warzywnictwa (Research Institute of Vegetable Crops).
Ping J., Bremer E. & Janzen H. (2000). Foliar uptake of volatilized ammonia from surface-applied urea by spring wheat. Communications in Soil Science and Plant Analysis 31: 165-172.
document.doc 114
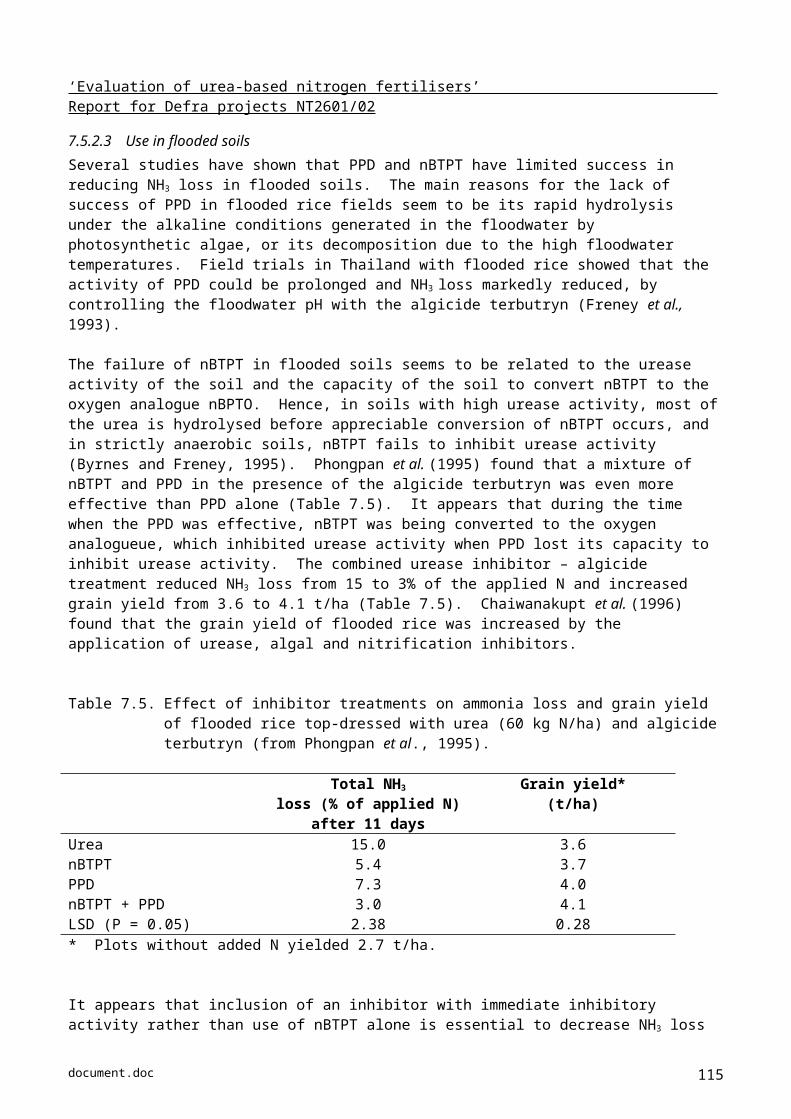
‘Evaluation of urea-based nitrogen fertilisers’ Report for Defra projects NT2601/02
Powlson, D.S., Saffigna, P.G. & Kragt-Cattarr, M. (1988) Denitrification at sub-optimal temperatures in soils from different climatic zones. Soil Biology & Biochemistry 20, 719-723.
Prakash, O., Alva, A.K. & Paramasivam, S. (1999). Use of urease inhibitor N-(n-butyl) thiophosphoric triamide decreased nitrogen leaching from urea in a fine sandy soil. Water, Air and Soil Pollution 116, 587-595.
Prasad, M. (1976). Gaseous loss of ammonia from sulfur-coated urea, ammonium sulfate and urea applied to calcareous soil (pH 7.3). Soil Sci. Soc. Am. J. 40, 130-134.
Prasertsak, P., Freney, J.R., Denmead, O.T., Saffigna, P.G. & Prove, B.G. 2001. Significance of gaseous nitrogen loss from a tropical dairy pasture fertilised with urea. Australian Journal Of Experimental Agriculture 41, 625-632.
Prins, W.H. & Rauw, G.J.G. (1989). Use of large granular urea (LGU) to improve efficiency of broadcast urea in wetland rice cultivation. Fertiliser Research 19, 21-27.
Qasem, J. R. and Hill, T. A. (1993). Effects of the Form of Nitrogen on the Growth and Nutrient- Uptake of Tomato, Groundsel and Fat-Hen. Journal of Horticultural Science, 68, 161-170.
Rachhpal-Singh & Nye P.H. (1984a). The effect of pH and high urea concentrations on urease activity in soil. Journal of Soil Science, 35: 519-527.
Rachhpal-Singh & Nye P.H. (1984b). Diffusion of urea, ammonium and soil alkalinity from surface applied urea. Journal of Soil Science, 35: 529-538.
Rachhpal-Singh & Nye P.H. (1986a). A model of ammonia volatilisation from applied urea. I. Development of the model. Journal of Soil Science, 37: 9-20.
Rachhpal-Singh & Nye P.H. (1986b). A model of ammonia volatilisation from applied urea. II. Experimental testing. Journal of Soil Science, 37: 21-29.
Rachhpal-Singh & Nye P.H. (1986c). A model of ammonia volatilisation from applied urea. III. Sensitivity analysis, mechanisms, and applications. Journal of Soil Science, 37: 31-40.
Rachhpal-Singh, (1987). Predicting the effect of soil-water-air dynamics on ammonia volatilisation from urea with a mechanistic model. Fertiliser Research, 13: 277-285.
Readman R.J., Kettlewell P.S. & Beckwith C.P. (2002a). Effects of spray application of urea fertiliser at stem extension on winter wheat yield. J. Agric. Sci. 139: 1-10
Readman R.J., Beckwith C.P. & Kettlewell P.S. (2002b). Effects of spray application of urea fertiliser at stem extension on winter wheat: N recovery and nitrate leaching. J. Agric. Sci. 139: 11-25.
Reddy, D.D. & Sharma, K.L. (2000) Effect of amending urea fertiliser with chemical additives on ammonia volatilisation loss and nitrogen use efficiency. Biology and Fertility of Soils 31, 24-27.
Richardson, S. J. and Hardgrave, M. (1992). Effect of Temperature, Carbon-Dioxide Enrichment, Nitrogen Form and Rate of Nitrogen-Fertiliser on the Yield and Nitrate Content of 2 Varieties of Glasshouse Lettuce. Journal of the Science of Food and Agriculture, 59, 345-349.
Rodgers, G.A. 1986. Nitrification inhibitors in agriculture. Journal of Environmental Science and Health A21, 701-722.
Rodgers G.A., Penny A. & Hewitt M.V. (1986). A comparison of the effects of prilled urea, used alone or with a nitrification or urease inhibitor, with those of ‘Nitro-Chalk’ on winter oil-seed rape. J. Agric. Sci. 106: 515-526
Roelcke M., Han Y., Li S.X. & Richter J. (1996). Laboratory measurements and simulations of ammonia volatilisation from urea applied to calcareous Chinese loess soils. Plant and Soil, 18: 123-129.
Roelcke, M. Li, S.X., Tian, X.H., Gao, Y.J. & Richter, J. (2002) In situ comparisons of ammonia volatilisation from N fertilisers in Chinese loess soils. Nutrient Cycling in Agroecosystems 62 73-88.
document.doc 115
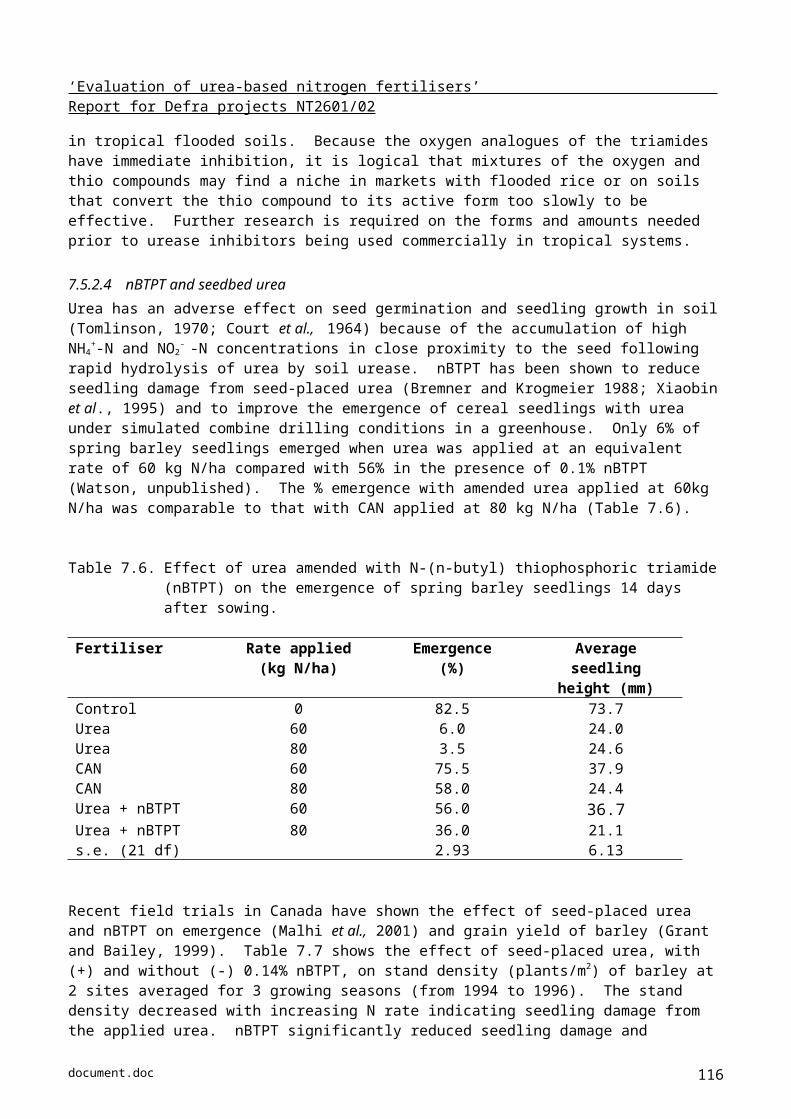
‘Evaluation of urea-based nitrogen fertilisers’ Report for Defra projects NT2601/02
Roelofs, J. G. L., and Houdijk, A. L.M., (1991). Ecological effects of ammonia. In “Ammonia and Odour Emission from Livestock Production”. (V. C. Nielson, B. F. Pain, and Hartung, J., eds.), pp.10-16. Elsevier, Barking UK.
Rubeiz, I. G., Oebker, N. F. and Stroehlein, J. L. (1989). Subsurface Drip Irrigation and Urea Phosphate Fertigation for Vegetables on Calcareous Soils. Journal of Plant Nutrition, 12, 1457-1465.
Ryan, M. and Ash, J. (1999). Effects of phosphorus and nitrogen on the growth of pasture plantsand VAM fungi in SE Australian soils with contrasting fertiliser histories (conventional and biodynamic). Agriculture, Ecosystems and Environment 73, 51-62.
Ryden, J.C., Whitehead, D.C., Lockyer, D.R., Thompson, R.B., Skinner, J.H. & Garwood, E.A. (1997) Ammonia emission from grassland and livestock production systems in the UK. Environmental Pollution 48, 173-184.
SAC (1994) Urea as a Grassland Fertiliser. SAC Technical Note. Fertiliser Series No.25.
Salardini, A. A., Sparrow, L. A. and Holloway, R. J. (1992a). Sweet Corn Responses to Basal and Top-Dressed Rates and Sources of Nitrogenous Fertilisers. Australian Journal of Agricultural Research, 43, 171-180.
Salardini, A. A., Sparrow, L. A. and Holloway, R. J. (1992b). The Mobility and Transformation of Soil-Nitrogen and the Relationships between Soil and Plant Nitrogen and Yield at Different Times Following Application of Various Nitrogen Fertilisers to Sweet Corn. Australian Journal of Agricultural Research, 43, 1643-1652.
Sanderson, J. B. and White, R. P. (1987). Comparison of Urea and Ammonium-Nitrate as Nitrogen-Sources for Potatoes. American Potato Journal, 64, 165-176.
Schjørring J.K. and Byskov-Nielsen (1991) Ammonia emission from barley plants: field investigations 1989 and 1990. In: Nitrogen and phosphorus in soil and air. pp 249-265. Nat. Agency of Env. Prot., Ministry of Env., Denmark.
Schroeder, J. L., Kahn, B. A. and Lynd, J. Q. (1998). Utilization of cowpea crop residues to reduce fertiliser nitrogen inputs with fall broccoli. Crop Science, 38, 741-749.
Sharma R.C. & Gaur P.C. (1994). Use of urea for potato production in India. In: Potato: present and future. ed. Shekhawat GS, Khurana SMP, Pandey SK & Chandla VK. Indian Potato Association, Shimla.
Sharma, G. C., Patel, A. J. and Mays, D. A. (1976). Effect of sulphur-coated urea on yield, N uptake, and nitrate content in turnip greens, cabbage, and tomato. Journal of the American Society for Horticultural Science, 101, 142-145.
Sharma, H. L., Singh, C. M. and Kapur, B. L. (1986). Effect of Neem-Cake-Blended Urea on Germination and Yield of Potato. Indian Journal of Agricultural Sciences, 56, 802-804.
Sharma, U. C. (1991). Release Pattern of Nitrate-Nitrogen from Nitrogenous Fertilisers under Field Condition in Meghalaya and Its Effect on Yield of Potato (Solanum-Tuberosum). Indian Journal of Agricultural Sciences, 61, 561-566.
Sharma, U. C. and Grewal, J. S. (1987). Effect of sources, levels and methods of nitrogen application on the yield and nitrogen uptake of potato. Indian Journal of Agricultural Sciences, 57, 640-645.
Sharma, U. C. and Singh, K. (1991). Effect of Sources of Phosphatic and Nitrogenous Fertiliser on Potato (Solanum-Tuberosum) Crop under Acidic Soil of North-East India. Indian Journal of Agronomy, 36, 559-562.
Shelton, J. E. (1976). An evaluation of sulphur-coated urea as a preplant total season nitrogen supply for trellised tomatoes. Soil Science Society of America Journal, 40, 126-129.
Sherlock R.R. and Goh K.M. (1985). Dynamics of ammonia volatilisation from simulated urine patches and aqueous urea applied to pasture II. Theoretical derivation of a simplified model. Fertiliser Research, 6: 3-22.
document.doc 116

‘Evaluation of urea-based nitrogen fertilisers’ Report for Defra projects NT2601/02
Sherlock R.R., Freney J.R., Bacon P.E. and van der Weerden T.J. 1995. Estimating ammonia volatilisation from unsaturated urea fertilized and urine affected soils by an indirect method. Fertiliser Research, 40: 197-205.
Sherwood, M. & Fanning, A. (1985) Runoff of nitrogen fertiliser. In. Soil and Grassland Production Research Report. An Foras Taluntais, Dublin. pp. 10-11.
Shoji, S., Delgado, J., Mosier, A. and Miura, Y. (2001). Use of controlled release fertilisers and nitrification inhibitors to increase nitrogen use efficiency and to conserve air and water quality. Communications in Soil Science and Plant Analysis, 32, 1051-1070.
Shoji, S., Gandeza, A.T. & Kimura, K. (1991). Simulation of crop response to polyolefin-coated urea: II. Nitrogen uptake by corn. Soil Science Society of America Journal 55, 1468-1473.
Simpson, J.R. and Freney, J.R. (1974) The fate of fertiliser nitrogen under different cropping systems. In Fertilisers and the environment, ed. D.R. Leece, Australian Institute of Agricultural Science, Sydney, pp 27-33.
Skiba, U, Fowler, D. and Smith, K.A. (1997) Nitric oxide emissions from agricultural soils in temperate and tropical climates: Sources, controls and mitigation options. Nutrient Cycling in Agroecosystems 48, 75-90.
Skinner, R.J. & Todd, A.D. (1998) Twenty-five years of monitoring pH and nutrient status of soils in England and Wales. Soil Use & Management 14, 162-169.
Smith, J. D. and Harrison, H. C. (1991). Polymers Act as Nitrogen Carriers to Fertilize Greenhouse and Field-Grown Lettuce. Communications in Soil Science and Plant Analysis, 22, 1165-1177.
Smith, K. A., McTaggart, I. P., and Tsuruta, H. (1997). Emissions of N2O and NO associated with nitrogen fertilization in intensive agriculture, and the potential for mitigation. Soil Use Management 13, 296-304.
Smith, K.A. and Dobbie, K.E. (2002). Another look at N2O emission factors for agricultural soils, and implications for inventory calculations. In: Non-CO2 Greenhouse Gases: Scientific Understanding, Control Options and Policy Aspects (J. van Ham, A.P.M. Baede, R. Guicherit and J.G.F.M. Williams-Jacobse, eds.), Millpress, Rotterdam, pp. 245-250.
Smith, K.A., Bouwman, L. and Braatz, B. (2002). N2O: direct emissions from agricultural soils. In: Background Papers: IPCC Meetings on Good Practice Guidance and Uncertainty Management in National Greenhouse Gas Inventories, Inst. for Global Environmental Strategies, Kanagawa, Japan, pp 361-380.
Smith, K.A., Jackson, D.R., Misselbrook, T.H., Pain, B.F. & Johnson, R.A. (2000) Reduction in ammonia emissions by slurry application techniques. Journal of Agricultural Engineering Research 77, 277-287.
Smith, K.A., Anthony, S.G., Henderson, D. & Jackson, D.R. Critical drainage and nitrate leaching losses from manures applied to freely draining soils. Soil Use and Management in press.
Smith, S. R. and Hadley, P. (1992). Nitrogen-Fertiliser Value of Activated Sewage Derived Protein - Effect of Environment and Nitrification Inhibitor on No3- Release, Soil Microbial Activity and Yield of Summer Cabbage. Fertiliser Research, 33, 47-57.
Sommer S.G., Jensen E.S. & Schjorring J.K. (1993). Leaf absorption of atmospheric ammonia emitted from pig slurry applied beneath the canopy of winter wheat. Acta Agriculturae Scandinavica, Section B, Soil and Plant Science 43: 21-24.
Sommer, S. G., and Ersbøll, A. K. (1996). Effect of air flow rate, lime amendments, and chemical soil properties on the volatilization of ammonia from fertilisers applied to sandy soils. Biol. Fertil. Soils 21, 53-60.
Sommer, S.G. & Jensen, C. (1994) Ammonia volatilisation from urea and ammoniacal fertilisers surface applied to winter wheat and grassland. Fertiliser Research 37, 85-92.
document.doc 117
‘Evaluation of urea-based nitrogen fertilisers’ Report for Defra projects NT2601/02
Stevens R.J., Laughlin R.J. and Kilpatrick D.J. (1989). Soil properties related to the dynamics of ammonia volatilisation from urea applied to the surface of acidic soils. Fertiliser Research, 20: 1-9.
Stevens, R.J. and Laughlin, R.J. (1988) The effects of time of application and chemical forms on the efficiencies of 15N-labelled fertilisers for ryegrass at two contrasting field sites. J. Sci. Food, Agric. 43, 9-16.
Stone, D. A. (2000). The effects of starter fertilisers on the growth and nitrogen use efficiency of onion and lettuce. Soil Use and Management, 16, 42-48.
Sud, K. C., Grewal, J. S. and Sharma, R. C. (1991). Efficient Use of Urea by Potato (Solanum-Tuberosum) in Shimla Hills. Indian Journal of Agricultural Sciences, 61, 389-394.
Sudhakara, K. & Prasad, R. (1986). Ammonia volatilization losses from prilled urea, urea supergranules (USG) and coated USG in rice fields. Plant and Soil 94, 293-295.
Sugar Beet Research and Education Committee (SBREC) (1990). Committee Paper 2456.
Sutton M.A. (1996) Ammonia emissions from cultures with and without fertilizers. Cultures Chapter: UNECE Expert Panel on Ammonia Emissions. In: Atmospheric Emissions Inventory Guide Book (Ed. G. McInnes) UNECE/EC Atmospheric Emissions Inventory Task Force, European Environment Agency, Copenhagen.
Sutton, M. A., Place, C. J., Fowler, D., and Smith, R. I. (1994). Assessment of the magnitude of ammonia emissions in the United Kingdom. Atmos. Environ. 29, 2, 1393-1411.
Sutton M.A., Nemitz E., Fowler D., Wyers G.P., Otjes R.P., Schjoerring J.K., Husted S., Nielsen K., San José R., Moreno J., Gallagher M.W. Gut A. (2000) Fluxes of ammonia over oilseed rape: Overview of the EXAMINE experiment Agric. For. Meteorol. (Ammonia Exchange Special Issue) 105 (4), 327-349.
Sutton M.A., Milford C., Nemitz E., Theobald M.R., Hill P.W., Fowler D., Schjoerring J.K., Mattsson M.E., Nielsen K.H., Husted S., Erisman J.W., Otjes R., Hensen A., Mosquera J., Cellier P., Loubet B., David M., Genermont S., Neftel A., Blatter A., Herrmann B., Jones S.K., Horvath L., Führer E., Mantzanas K., Koukoura Z., Gallagher M., Williams P., Flynn M. and Riedo M. (2001) Biosphere-atmosphere interactions of ammonia with grasslands: experimental strategy and results from a new European initiative. Plant and Soil 228: 131-145.
Sutton M, Cellier P, van der Hoek K, Klimont Z and Webb J. (2002) TFEI Agriculture Panel. Working Group 2 Report: Review of Simpler Methodology for Calculating European Ammonia Emissions from Fertilized Cultures (100100). Vienna, 28-30 October 2002.
Sutton M. & Harrison R. 2002. Emissions from fertilisers and crops. In, “Ammonia in the UK.” Publ., DEFRA, London, 2002. 66-73.
Sutton M.A., C. Milford, E. Nemitz, M.R. Theobald, K.J. Hargreaves, D. Fowler, J.K. Schjoerring, M.E. Mattsson, S. Husted, J.W. Erisman, A. Hensen, J. Mosquera, R.Otjes, P. Jonejon, P. Cellier, B. Loubet, M. David, A. Neftel, A. Blatter, B.Herrmann, S.K. Jones, L. Horvath, T., Weidinger, J. Raso, R. Meszaros, E. Führer, K. Mantzanas, Z.Koukoura, V. Papanastasis, M. Gallagher, J.R. Dorsey, M. Flynn and M. Riedo (2002) Biosphere-atmosphere interactions of ammonia with European Grasslands. Final Synthesis Report. Contracts: ENV4-CT98-0722 and IN2O-CT98-0118. CEH Edinburgh.
Sylvester-Bradley, R. & Chambers, B.J. (1992) The implications of restricting use of fertiliser nitrogen for the productivity of arable crops, their profitability and potential pollution by nitrate. Aspects of Applied Biology 30, Nitrate and Farming Systems, 85-94.
Taber, H. G. (2001). Petiole sap nitrate sufficiency values for fresh market tomato production. Journal of Plant Nutrition, 24, 945-959.
Tan, X. W., Ikeda, H. and Oda, M. (2000a). Effects of nickel concentration in the nutrient solution on the nitrogen assimilation and growth of tomato seedlings in hydroponic culture supplied with urea or nitrate as the sole nitrogen source. Scientia Horticulturae, 84, 265-273.
document.doc 118

‘Evaluation of urea-based nitrogen fertilisers’ Report for Defra projects NT2601/02
Tan, X. W., Ikeda, H. and Oda, M. (2000b). The absorption, translocation, and assimilation of urea, nitrate or ammonium in tomato plants at different plant growth stages in hydroponic culture. Scientia Horticulturae, 84, 275-283.
Tenuta, M. and Beauchamp, E.G. (2000). Nitrous oxide production from urea granules of different sizes. J. Environ. Qual., 29, 1408-1413.
Terman G.L. (1979). Volatilization losses of nitrogen as ammonia from surface-applied fertilisers, organic amendments, and crop residues. Advances in Agronomy 31: 189-223
Tlustos, P., Pavlikova, D., Balik, J. and Vanek, V. (2002). The uptake of nitrogen released from slow release fertilisers by radish, lettuce and carrot. Acta Horticulturae, 571, 127-134.
Tomlinson T.E. (1970). Urea- agronomic applications. Proceedings of the Fertiliser Society 113: 1-76.
Touchton J.T. & Hargrove W.L. (1982). Nitrogen sources and methods of application for no-tillage corn production. Agronomy Journal 74: 823-826
Trenkel, M.E. (1997). Improving fertiliser use efficiency. Controlled-release and stabilized fertilisers in agriculture. International Fertiliser Industry Association, Paris.
Tyler, K. B., Lorenz, O. A., Takatori, F. H. and Bishop, J. C. (1962). Urea Nitrogen for potatoes. American Potato Journal, 39, 89-99.
Vallejo, A., Diez, J.A., Lopez-Valdivia, L.M., Gasco, A. & Jimenez, C. (2001). Nitrous oxide emission and denitrification nitrogen losses from soils treated with isobutylenediurea and urea plus dicyandiamide. Biology And Fertility Of Soils 34, 248-257.
Van Burg P.F.J., Dilz K. & Prins W.H. (1982). Agricultural value of various nitrogen fertilisers. Results of research in the Netherlands and elsewhere in Europe. Netherlands Nitrogen Technical Bulletin no. 13, November 1982.
Van der Hoek KW. (1998) Estimating ammonia emission factors in Europe: Summary of the work of the UNECE ammonia expert panel. Atmospheric Environment 32, 315-316.
van der Weerden, T. J. and Jarvis, S. C. (1997). Ammonia emission factors for N fertilisers applied to two contrasting grassland soils. Environmental Pollution 95, 205-211.
Vanbeusichem, M. L. and Neeteson, J. J. (1982). Urea Nutrition of Young Maize and Sugar-Beet Plants with Emphasis on Ionic Balance and Vascular Transport of Nitrogenous Compounds. Netherlands Journal of Agricultural Science, 30, 317-330.
Varel, V.H. (1997). Use of urease inhibitors to control nitrogen loss from livestock waste. Bioresource Technology 62, 11-17.
Varel, V.H., Nienaber, J.A. & Freetly, H.C. (1999). Conservation of nitrogen in cattle feedlot waste with urease inhibitors. Journal of Animal Science 77, 1162-1168.
Vavrina, C. S., Obreza, T. A. and Cornell, J. (1993). Response of Chinese-Cabbage to Nitrogen Rate and Source in Sequential Plantings. Hortscience, 28, 1164-1165.
Veldkamp, E. and Keller, M. (1997). Nitrogen oxide emissions from a banana plantation in the humid tropics.. J. Geophys Res., 102, 15,889-15,898.
Veldkamp, E., and Keller, M. (1997). Fertiliser-induced nitric oxide emissions from agricultural soils. Nutr. Cyc. Agroecosys. 48, 69-77.
Velthof, G. L., Oenema, O., Postmus, J., and Prins, W. H. (1990). In situ field measurements of ammonia volatilization from urea and calcium ammonium nitrate applied to grassland. In “Soil-grassland-animal relationships” (N. Gáborcik, V. Krajcovic, and M. Zimkvá, eds.), Proceedings of the 13th General Meeting of the European Grassland Federation II, pp. 51-55. The Grassland Research Institute, Banská Bystrica, Slovakia.
document.doc 119
‘Evaluation of urea-based nitrogen fertilisers’ Report for Defra projects NT2601/02
Velthof, G.L., Oenema, O., Postma, R. and Van Beutsichem, M.L. (1997). Effects of type and amount of applied nitrogen fertiliser on nitrous oxide fluxes from intensively managed grassland. Nutr. Cycl. Agroecosys., 46, 257-267.
Vermoesen, A., Demeyer, P., Hofman, G. & Van Cleemput, O. (1996) Ammonia volatilisation from mineral N-fertilisers, influenced by pH, temperature and soil moisture content. In.Transactions of the 9 th Nitrogen Workshop. Braunschweig, Sept. 1996.
Viets, F.G. (1971) Fertiliser technology and use, 2nd edition. Soil Science Society of America, Madison.
Volk, G.M. (1961). Gaseous loss of ammonia from surface-applied nitrogenous fertilisers. Agricultural and Food Chemistry 9, 280-283.
Waddell, J. T., Gupta, S. C., Moncrief, J. F., Rosen, C. J. and Steele, D. D. (1999). Irrigation and nitrogen management effects on potato yield, tuber quality, and nitrogen uptake. Agronomy Journal, 91, 991-997.
Waddell, J. T., Gupta, S. C., Moncrief, J. F., Rosen, C. J. and Steele, D. D. (2000). Irrigation- and nitrogen-management impacts on nitrate leaching under potato. Journal of Environmental Quality, 29, 251-261.
Wallace, A. and Ashcroft, R. T. (1956). Preliminary comparisons of the effects of urea and other nitrogen sources on the mineral composition of rough lemon and bean plants. Proceedings of the American Society for Horticultural Science, 68, 227-233.
Walworth, J. L., Carling, D. E. and Michaelson, G. J. (1992). Nitrogen-Sources and Rates for Direct-Seeded and Transplanted Head Lettuce. Hortscience, 27, 228-230.
Watkins, S.H., Strand, R.F., DeBell, D.S. & Esch, J. (1972). Factors influencing ammonia losses from urea applied to Northwestern forest soils. Soil Science Society of America Proceedings 36, 354-357.
Watson C.J. (2000). Urease activity and inhibition – principles and practice. Proceeding No. 454. Publ., The International Fertiliser Society, York, UK. 40pp.
Watson, C.J. (1987) The comparative effect of a mixed urea, ammonium nitrate, ammonium sulphate granular formulation on the efficiency of N recovery by perennial ryegrass. Fertiliser Research 14, 193-204.
Watson, C. J., Stevens, R. J. and Laughlin, R. J. (1990a). Effectiveness of the urease inhibitor nbpt (n-normal-butyl) thiophosphoric triamide) for improving the efficiency of urea for ryegrass production. Fertiliser Research 24, 11-15.
Watson, C.J., Stevens, R.J., Garrett, M.K. & McMurray, C.H. (1990b). Efficiency and future potential of urea for temperate grassland. Fertiliser Research 26, 341-357.
Watson, C.J., & Kilpatrick, D.J. (1991). The effect of urea pellet size and rate of application on ammonia volatilization and soil nitrogen dynamics. Fertiliser Research 28, 163-172.
Watson, C. J., Miller, H., Poland, P., Kilpatrick, D. J., Allen, M. D. B., Garrett, M. K. and Christianson, C. B. (1994a). Soil Properties and the Ability of the Urease Inhibitor N-(N- Butyl) Thiophosphoric Triamide (Nbtpt) to Reduce Ammonia Volatilization From Surface-Applied Urea. Soil Biology & Biochemistry 26, 1165-1171.
Watson, C.J., Poland, P., Miller, H., Allen, M.B.D., Garrett, M.K., & Christianson, C.B. (1994b). Agronomic assessment and 15N recovery of urea amended with the urease inhibitor nBTPT (N-(n-butyl) thiophosphoric triamide) for temperate grassland. Plant and Soil 161, 167-177.
Watson, C.J. & Miller, H. (1996). Short-term effects of urea amended with the urease inhibitor N-(n-butyl) thiophosphoric triamide on perennial ryegrass. Plant and Soil 184, 33-45.
Watson, C. J., Poland, P. and Allen, M. B. D. (1998). The efficacy of repeated applications of the urease inhibitor N-(n-butyl) thiophosphoric triamide for improving the efficiency of urea fertiliser utilization on temperate grassland. Grass and Forage Science 53, 137-145.
Webb J and Anthony SG (2002) A national model for estimating potential reductions in ammonia emissions
document.doc 120
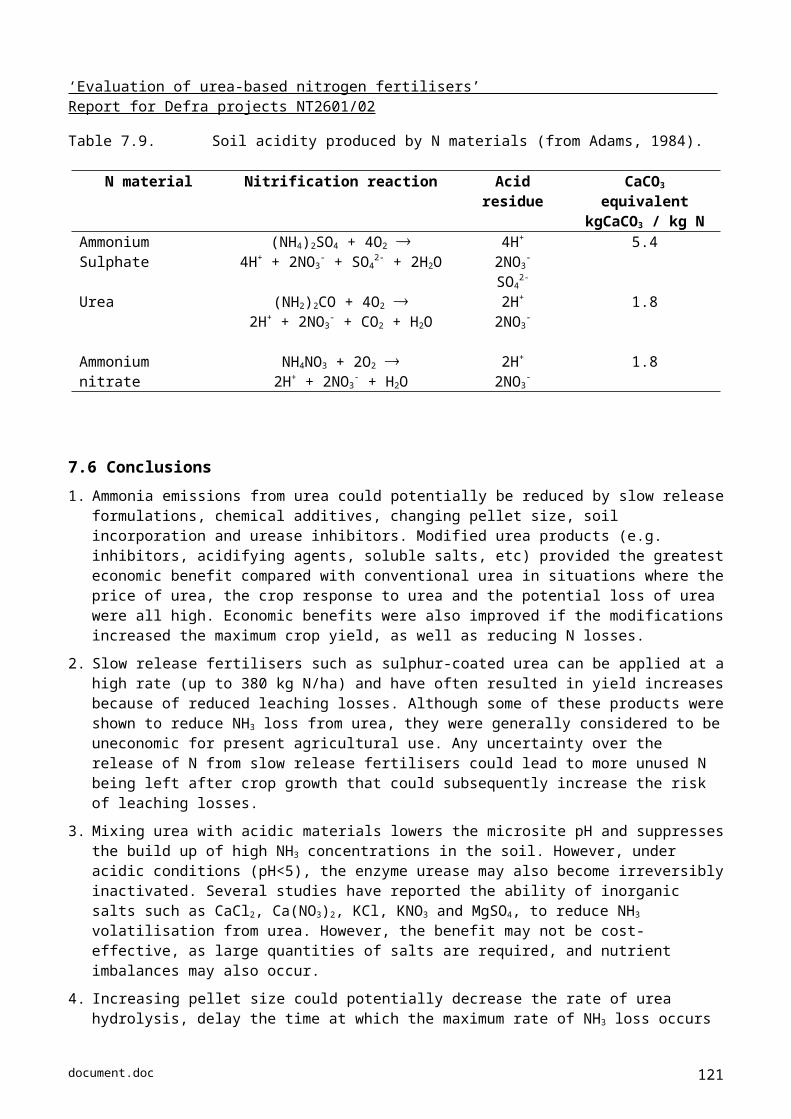
‘Evaluation of urea-based nitrogen fertilisers’ Report for Defra projects NT2601/02
and their costs. 10th FAO RAMIRAN Conference, May 14 - 18, 2002, Srbske Pleso, Hotel Patria, Slovak Republic
Webb J., Misselbrook T., Sutton M. & ApSimon H. (2002). Estimating total ammonia emissions from the UK. In, “Ammonia in the UK.” Publ., DEFRA, London, 2002. 32-38.
Webb J., Sutton M., Kroeze C., Skiba U., Winiwater W., Pain B., Bonazzi G., Svedinger I. and D. Simpson (1998) Cultures with fertilizers (Fertilized agricultural land). In: Emission Inventory Guidebook. pp 1010-1 – 1010-31. TFEI, CORINAIR/EEA, Copenhagen.
Weber, A., Gutser, R. & Schmidhalter, U. (2001) Field emissions of NH3 and NOx following urea application to wheat. In Plant Nutrition-Fodd Security and Sustainability of Agro-ecosystems (Eds. W.J. Horst et al.) pp. 884-885.
Weier, K.L. (1994). Nitrogen use and losses in agriculture in subtropical Australia. Fertiliser Research 39, 245-257.
Westerdahl, B. B., Carlson, H. L., Grant, J., Radewald, J. D., Welch, N., Anderson, C. A., Darso, J., Kirby, D. and Shibuya, F. (1992). Management of Plant-Parasitic Nematodes with a Chitin Urea Soil Amendment and Other Materials. Journal of Nematology, 24, 669-680.
Whitehead, D. C., and Raistrick, N. (1990). Ammonia volatilization from five nitrogen compounds used as fertilisers following surface application to soils. J. Soil Sci. 41, 387-394.
Widders, I. E. (1991). Absorption and Translocation of Foliar Applied Triazone-N as Compared to Other Nitrogen-Sources in Tomato. Journal of Plant Nutrition, 14, 1035-1045.
Widdowson F.V. & Penny A. (1960). Experiments with urea on spring barley. Experimental Husbandry 5: 22- 26.
Widdowson, F. V., Penny, A. and Cooke, G. W. (1960). The value of calcium nitrate and urea for mian-crop potatoes and kale. Journal of Agricultural Science, 55, 1-10.
Widdowson F.V., Penny A. & Williams R.J.B. (1964). Side-placing urea and other nitrogen fertilisers for spring barley. J. Agric. Sci. 62: 73-82.
Wiedenfeld, R. P. (1986a). Rate, timing, and slow-release nitrogen fertilisers on bell peppers and muskmelon. Hortscience, 21, 233-235.
Wiedenfeld, R. P. (1986b). Rate, timing, and slow-release nitrogen fertilisers on cabbage and onions. Hortscience, 21, 236-238.
Wiesler, F. 1998. Comparative assessment of the efficiency of various nitrogen fertilisers. In: Nutrient use in crop production, ed. Z. Rengel, (also published as J. Crop Prod. 1, No 2), The Haworth Press, Binghamton NY, pp 81-114.
Xiaobin, W., Jingfeng, X., Grant, C.A. & Bailey, L.D. (1995). Effects of placement of urea with a urease inhibitor on seedling emergence, N uptake and dry matter yield of wheat. Canadian Journal Plant Science 75, 449-452.
Yaalon, D.H. (1964) Tellus 16, 200.
Yerokun O.A. (1997). Response of maize to ammonium nitrate, urea and cogranulated urea-urea phosphate. South African J. Plant and Soil 14: 63-66.
Yinbo, G., Peoples, M. B. and Rerkasem, B. (1997). The effect of N fertiliser strategy on N-2 fixation, growth and yield of vegetable soybean. Field Crops Research, 51, 221-229.
Youngdahl, L.J., Lupin, M.S. & Craswell, E.T. (1986). New developments in nitrogen fertilisers for rice. Fertiliser Research 9, 149-160.
Zernova, O. V. (1993). Effect of Oxidized and Reduced Forms of Nitrogen Nutrition on Ultrastructure of the Photosynthetic Apparatus in Pea and Wheat Leaves. Russian Plant Physiology, 40, 390-396.
document.doc 121
‘Evaluation of urea-based nitrogen fertilisers’ Report for Defra projects NT2601/02
Zhang, X. and Rengel, Z. (2000). Role of soil pH, Ca supply and banded P fertilisers in modulating ammonia toxicity to wheat. Australian Journal of Agricultural Research 51, 691-699.
Zhu, Z., Gerendas, J. and Sattelmacher, B. (1997). Effects of replacing nitrate with urea or chloride on the growth and nitrate accumulation in pak-choi in hydroponics. In: Plant Nutrition for Sustainable Food Production and Environment. Proceedings of the XIII International Plant Nutrition Colloquium, 13-19 September 1997, Tokyo, Japan, Kluwer Academic Publishers, Dordrecht, The Netherlands.
Zhu, Z., Gerendas, J. and Sattelmacher, B. (2000). Influence of nitrate and urea supply on growth and nitrate accumulation in hydroponically grown lettuce (Lactuca sativa). Proceedings of Xth International Colloquium for the Optimisation of Plant Nutrition, 8-13 April 2000, Cairo, Egypt.
Zubillaga, M.S., Zubillaga, M., Urricariet, S. & Lavado, R.S. (2002) Effect of nitrogen source on ammonia volatilisation, grain yield and soil nitrogen losses in no-till wheat in an Argentine soil.
Zvomuya, F. and Rosen, C. J. (2001). Evaluation of polyolefin-coated urea for potato production on a sandy soil. Hortscience, 36, 1057-1060.
document.doc 122
‘Evaluation of urea-based nitrogen fertilisers’ Report for Defra projects NT2601/02
APPENDIX 1. SUMMARY OF TRIAL RESULTS ON ARABLE CROPS
Reference No of trials, dates & location
Crop N fert’rs Soil type N Application Main Results & Comments
Devine & Holmes (1963b)
17 in 1958-61UK
W Wheat U, AN Various Broadcast in spring. 25-60 kg /ha
On av. U gave 96% yield from AN. U less efficient on pH>7 soils. On one chalk soil, U yield was 50% of AN
Jonsson & Johanssen (1972)
101 in 1963-68Sweden
W Wheat CAN, CN, U
Various 0-90 kg /ha for U vs. CAN; 0-120 kg N/ha for U vs. CaNO3
U gave lower yield, N content and N recovery than CAN or CaNO3
van Burg et al. (1982)
16 in 1960sNetherlands
W Wheat CAN, CN, U
Various Broadcast. Rates not given
Effectiveness of urea rel. to CAN on yield was 0.95 for sand & reclaimed peat, 0.9 for older clay. On calcareous marine clay, it was 0.81 as effective as CN
Chaney & Paulson (1988)
41 in 1958-86UK
34 W Wheat, 7 W Barley
AN, U Various Broadcast. Single rate from 50-160 kg N/ha
For yield, U 91.5% as efficient as AN (av yield loss 2.5% for wheat and 5.2% for barley). No obvious effect of soil pH, texture or site location. At some trials, yield loss from U was c.20%
Gateley (1994)
9 in 1983-85Ireland
W Wheat CAN,U SL (4) and L-CL (5) pH 6.1-7.1
Broadcast. 50gN/ha at end Feb, then 50-150 kg N/ha in April
CAN outyielded U at each N rate. Yield loss was 10.8, 7.1, 2.9% at 50, 100, 150 kg N/ha resp. Protein contents were sig higher with CAN. Loss from urea was affected by rainfall/ soil moisture around application
document.doc 123
‘Evaluation of urea-based nitrogen fertilisers’ Report for Defra projects NT2601/02
APPENDIX 1 (continued)
Reference No of trials, dates & location
Crop N fert’rs Soil type N Application Main Results & Comments
Lloyd et al. (1997)
26 in 1983-85UK
W wheat,W barley
AN, U Various but most with pH >7
Broadcast. 0-300 kgN/ha either all at GS 30/31 or split with half two weeks later)
Overall no difference in grain yield between fertilisers or splitting applications. Grain N offtake was 2.5% greater from AN than U. Splitting appl’n increased N offtake from U. On chalk soils, rainfall up to 5th day after application was related to grain N offtake
Terra 2 in 2002UK
One WWOne WB
AN, U, UAN
Not given Broadcast. 4 rates from 100-250 kg N/ha
Yield wheat: AN=U>UANYield barley: AN>U>UAN
Terra 4 in 2002UK
W Wheat AN, U Various but all pH7.5+
1 N rate per site (200-250 kg N/ha)
For yield & grain N offtake AN=U, except at shallow brash soils where AN>U. Mean yield loss of 2% from Urea
Hydro 15 in 1994-1998UK
W Wheat AN, CAN, CN, U , UAN
Not given 6 N rates (80-280 kg N/ha)
Over all 15 trials, no sig difference between U, UAN, AN. However U & UAN gave sig lower grain N contents than the nitrate fertilisers.
German official trials
97 in 1984-2002Germany
W Wheat CAN, UAN
Various 1 N rate per trial, mean N rate being 180 kg N/ha
Over all trials: compared to CAN, UAN gave a 2.9% yield reduction. For 64 of these trials, UAN gave a reduction of 0.5% protein in the grain.
Readman et al. (2002 a,b)
3 in 1992-94UK
W wheat AN, U SL 170 kg N/ha. 50 kg/ha in March, rest at GS 30/31
No difference between fertilisers for yield, N recovery. Trials on same plots each year
Rodgers et al. (1986)
3 in 1984-85UK
W OSR CAN, U CL Broadcast: 150 kg N/ha in March or 75kgN/ha in Feb & March
Yield with U was 90% of CAN. Split urea better than single urea in 1995. Leaf scorch with single urea dressing
document.doc 124
‘Evaluation of urea-based nitrogen fertilisers’ Report for Defra projects NT2601/02
APPENDIX 1 (continued)
Reference No of trials, dates & location
Crop N fert’rs Soil type N Application Main Results & Comments
Darby & Hewitt (1990)
3 in 1986-88UK
W OSR CAN, U ZCL Broadcast either single dressing at end Feb or split 6 ways from Feb-May. 200 kg N/ha
Yield with urea was 98% that from AN. % oil in seed slightly higher with U - thus oil yield similar between fertilisers. Crude protein decreased when >150 kg N/ha as urea was applied at end Feb. Timing of application had little effect. no leaf scorch noted.
Hydro 15 during 1994-98UK
W OSR AN, CAN CN, U,UAN
Various 6 rates 80-280 kg N/ha. Broadcast, ½ end Feb, ½ end Mar
For yield: AN=CN=CAN > U=UAN. Seed N offtake was c. 8kg N/ha lower from U, UAN than from nitrate fertilisers. AN had lower Nopt than U,UAN but higher yields
Terra 1 in 2002UK
W OSR AN, U, UAN
Not given 4 rates (100-250 kg N/ha). Broadcast ½ end Feb, ½ end March
For yields AN>U=UAN. Nopt for AN was lower than for U or UAN but Yopt higher. UAN had higher Nopt than U but similar yield
Devine & Holmes (1963b)
25 in 1957-61UK
S Barley AN, U Various Broadcast on seedbed. Only 25-45 kg N/ha.
U 86% less than AN on pH>7 soils but no difference on other soils. Crystalline urea used
Jonsson & Johansson (1972)
583 in 1963-66Sweden
S wheat, S barley, S oats
CAN, CN, U
Various 0-90 kg N/ha. Prior to sowing or 2-3 weeks after emergence
When applied prior to sowing, no difference in yields between fertilisers. Post emergence, CAN gave higher yield than U. No difference in grain N between ferts applied pre-sowing.
document.doc 125
‘Evaluation of urea-based nitrogen fertilisers’ Report for Defra projects NT2601/02
APPENDIX 1 (continued)
Reference No of trials & dates
Crop N fert’rs Soil type Application Main Results & Comments
Adams (1960) 28 in 1956-58UK
S Beet U, AS, CN
Various All in seedbed or broadcast at end June. 75, 150 kg N/ha
No difference in sugar yield between fertilisers. little N response above 75 kg N/ha
Devine & Holmes (1963b)
19 in 1957-61UK
S Beet AN, U Various Broadcast on seedbed. 50-60 kg N/ha
No overall difference in sugar or tops. At 3 trials, U gave sig. less sugar yield than AN
Carroll & McEnroe (1970)
32 in 1963-65Ireland
S Beet U, AS, CN
Various 0,56,112 kg N/ha either all at singling or split (1/2 at sowing, ½ at singling)
No difference between fertilisers except at 5 trials - but no one source consistently better. Split better than all at singling for ALL fertilisers.
Jonsson & Johansson (1972)
27 in 1966-68Sweden
S Beet U, NaNO3 Various 0-160 kg N/ha applied pre sowing
On av.: NaNO3 & U had Nopt of 148 and 137 kgN/ha resp. Yopts were 47.1 and 43.8 t/ha resp.
SBREC (1990),Hopkinson (1992)
3 in 19892 in 1991UK
S Beet U, AN SL, LS, light silt
1 rate (100 or 120 kg N/ha). Either all at drilling or part at drilling, part broadcast at 2-4 leaf stage.
No difference in root or sugar yield between fertilisers. This despite reduction in plant numbers from urea applied at 60 kg N/ha or more at drilling
SBREC (1990)
1 in 1989UK
S Beet U, AN, UAN
Chalky loam 120 kg N/ha. All at drilling or 30 kg/ha at drilling, rest at 2-4 leaf stage
No sig difference in plant populations, root or sugar yields. UAN gave lower amino-N content than AN
document.doc 126
‘Evaluation of urea-based nitrogen fertilisers’ Report for Defra projects NT2601/02
APPENDIX 1 (continued)
Reference No of trials & dates
Crop N fert’rs Soil type Application Main Results & Comments
Yerokun (1997)
2 years’ trials but dates not given.Zambia
Maize U, AN Clay soil, pH 7.9
Either broadcast or incorporated in seedbed. 67, 134 or 202 kg N/ha
No yield difference between fertilisers or method of application.
Touchton & Hargrove (1982)
3 (1978-80)USA
Maize AN, U, UAN
SL Surface band or shallow incorp’d 0,180,270 kg N/ha
For yield and grain N recovery: U< UAN <AN. Trials on ‘no till’ soils
Fox et al.(1986)
3 (1982-84)USA
Maize AN, U, UAN
Fine loamy Surface band or shallow incorp’d. 3 rates up to 200 kg N/ha
AN & U gave similar yields and grain N offtake when incorporated. When surface banded, U gave lower yields than AN, depending on following rain. Trials on ‘no till’ soils
Howard & Essington (1998)
2 (one in 1990-95 & other 1994-95)USA
Maize AN, U ZL; initial pH 6.1
Broadcast - on ‘no till’ crops. 168 kgN/ha within 5 days of sowing. U dressings either single or split
Urea resulted in 22% yield reduction compared to AN. Splitting the U dressing increased yield cf. single dressing. Trials on ‘no til’ soils. Liming decreased yield from urea by 12%.
document.doc 127