oregon dot - portland state universityppms.trec.pdx.edu/.../final_report_ebike__june_2016.docx ·...
TRANSCRIPT

EVALUATION OF AN ELECTRIC BIKE PILOT PROJECT AT THREE EMPLOYMENT CAMPUSES IN
PORTLAND, OREGON
Final Report
NITC-XX-000
by
John MacArthurNicholas Kobel
Jennifer DillZakari Mumuni
Portland State University
for
National Institute for Transportation and Communities (NITC)P.O. Box 751
Portland, OR 97207
June 2016

Technical Report Documentation Page1. Report No.
NITC-XX-0002. Government Accession No. 3. Recipient’s Catalog No.
4. Title and Subtitle
EVALUATION OF AN ELECTRIC BIKE PILOT PROJECT AT THREE EMPLOYMENT CAMPUSES IN PORTLAND, OREGON
5. Report DateJune 2016
6. Performing Organization Code
7. Author(s)John MacArthur, Portland State UniversityNicholas Kobel, Portland State UniversityJennifer Dill, Portland State UniversityZakari Mumuni, Portland State University
8. Performing Organization Report No.
9. Performing Organization Name and Address
Portland State University1825 SW BroadwayPortland, OR 97201
10. Work Unit No. (TRAIS)
11. Contract or Grant No.
12. Sponsoring Agency Name and Address
National Institute for Transportation and Communities (NITC)P.O. Box 751Portland, Oregon 97207
13. Type of Report and Period Covered
14. Sponsoring Agency Code
15. Supplementary Notes
16. Abstract
This report examines the results of an electric bike (e-bike) pilot project, which took place April 2014–September 2015 in the Portland region. Participants from three Kaiser Permanente Northwest campuses (1 urban and 2 suburban) were issued an e-bike for 10 weeks to use for various trip purposes, focusing on first/last-mile commuting. Participants were asked to complete three surveys—before, during and after using the e-bike—to evaluate how their perceptions and levels of cycling may have changed. Responses were analyzed using statistical software and a GIS. Results show that participants biked more often and to a wider variety of places than before the study; they become more confident cyclists after the study; and they cited fewer barriers to cycling when given the opportunity to use an e-bike, particularly for overcoming hills and reducing sweat. This study’s findings support the general hypothesis that e-bikes enable users to bike to more distant locations, bike more frequently and allow a broader participation in cycling by certain segments of the population through reducing barriers to cycling. Further research is needed to understand how e-bikes might replace other modes of transportation, including standard bicycles, vehicles and public transit.
17. Key Wordse-bikes, bicycle, multimodal, commuting
18. Distribution StatementNo restrictions. Copies available from NITC:www.nitc.us
19. Security Classification (of this report)
Unclassified
20. Security Classification (of this page)
Unclassified
21. No. of Pages
76
22. Price
i

ACKNOWLEDGEMENTS
The authors would like to thank Metro Regional Government for providing a generous Regional Travel Options grant for fund the demonstration project with Drive Oregon and Kaiser Permanente Northwest. We would particularly like to thank Zach Henkin, Mark Bernard, Jeff Allen and Emmaline Pohnl from Drive Oregon and Lauren Whyte and Shannon Mayorga from Kaiser Permanente Northwest for all their efforts on the project to make sure it was successfully organized and implemented. We also acknowledge the Kaiser Permanente employees that participated in the project.
We extend our gratitude to the Portland State University Bike Hub (Clint Culpepper, Daniel Penner and staff) and Bike N Hike of Hillsboro and Milwaukie, OR (Kevin Chudy and staff) for their time and effort in keeping the bikes functioning properly and coordinating hand-offs. We also acknowledge Larry Pizzi and Rob Kaplan at CurrieTech for their technical expertise and assistance with their product. Finally, we thank Steve Boughton and staff at the Washington County Bicycle Transportation Coalition for providing materials and bicycle safety training to Kaiser Permanente employees.
This research was also funded in part by the National Institute for Transportation and Communities (NITC), a program of the Transportation Research and Education Center at Portland State University and a U.S. Department of Transportation university transportation center.
DISCLAIMER
The contents of this report reflect the views of the authors, who are solely responsible for the facts and the accuracy of the material and information presented herein. This document is disseminated under the sponsorship of the U.S. Department of Transportation University Transportation Centers Program in the interest of information exchange. The U.S. Government assumes no liability for the contents or use thereof. The contents do not necessarily reflect the official views of the U.S. Government. This report does not constitute a standard, specification, or regulation.
iii

TABLE OF CONTENTS
1.0 INTRODUCTION.............................................................................................................71.1 INTRODUCTION...............................................................................................................71.2 RESEARCH OBJECTIVES................................................................................................81.3 ORGANIZATION OF REPORT........................................................................................9
2.0 E-BIKE EVALUATION RESEARCH..........................................................................102.1 WHAT IS AN E-BIKE?....................................................................................................102.2 BICYCLE-STYLE ELECTRIC BIKES (BSEB)..............................................................102.3 E-BIKE RESEARCH........................................................................................................12
3.0 PROGRAM OVERVIEW...............................................................................................153.1 E-BIKE DEMOSTRATION PROGRAM DESCRIPTION..............................................153.2 DESCRIPTION OF KAISER PERMANENTE................................................................16
4.0 METHODOLOGY..........................................................................................................194.1 SURVEY OBJECTIVES...................................................................................................194.2 USER SURVEYS..............................................................................................................194.3 USER SURVEY DISTRIBUTION AND DATA ANALYSIS.........................................194.4 SURVEY RESPONSE RATES.........................................................................................204.5 LIMITATIONS..................................................................................................................20
5.0 RESULTS.........................................................................................................................225.1 DEMOGRAPHICS............................................................................................................225.2 TRAVEL CHARACTERISTICS......................................................................................235.3 LEVELS OF CYCLING, BARRIERS AND CYCLIST TYPOLOGY............................275.4 USE OF E-BIKES.............................................................................................................30
5.4.1 Frequency..................................................................................................................305.4.2 Experiences................................................................................................................32
5.5 PERCEPTIONS OF E-BIKES AND POTENTIAL CHANGES IN BEHAVIOR...........326.0 DISCUSSION...................................................................................................................37
6.1 E-BIKES REDUCE BARRIERS TO PARTICIPATION IN CYCLING.........................376.2 E-BIKES MAY MAKE PEOPLE MORE COMFORTABLE ON BICYCLES...............376.3 E-BIKES ENCOURAGE MORE TRIPS BY BICYCLE.................................................38
7.0 CONCLUSIONS..............................................................................................................398.0 REFERENCES................................................................................................................419.0 APPENDICES..................................................................................................................43
9.1 APPENDIX A: PRE-USE SURVEY................................................................................439.2 APPENDIX B: DURING USE SURVEY.........................................................................659.3 APPENDIX B: POST USE SURVEY..............................................................................70
v

LIST OF TABLES
Table 2-1: Common alternative terms for two main categories of bicycle-style e-bikes..............11Table 3-1: Kaiser Permanente Facilities........................................................................................17Table 4-1: Survey Distribution and Response Rates.....................................................................20Table 5-1: Demographic characteristics of survey respondents....................................................23Table 5-2: Barriers to participation in cycling cited by respondents.............................................28Table 5-3: Change in cyclist typology (individual) before and after using e-bike, by self-
described cyclist type.............................................................................................................29Table 5-4: Frequency of bicycle usage by trip purpose, before and during program....................31
LIST OF FIGURES
Figure 2-1: A common throttle mechanism for powered bicycles. Image source: CurrieTech.com...............................................................................................................................................11
Figure 2-2: Kalkhoff Sahel I8—a modern power-assisted bicycle (PAB) or pedelec. Image source: Kalkhoff-Bikes.com..................................................................................................12
Figure 3-1: Currie iZip E3—a hybrid PB/PAB folding electric bicycle. Image source: CurrieTech.com.....................................................................................................................16
Figure 5-1: Map overview of employment centers, transit and survey respondents' homes, Portland Metro.......................................................................................................................24
Figure 5-2: Summary statistics for GIS distance analysis.............................................................25Figure 5-3: Mode choice by trip purpose......................................................................................26Figure 5-4: Commuting mode choice by Kaiser employment campus.........................................26Figure 5-5: Frequency of bicycle usage by trip purpose, before and during program..................30Figure 5-6: Reported usage of e-bike (trip frequency) for commuting by distance from work... .32Figure 5-7: Reported likelihood of using a standard bike after using e-bike................................33Figure 5-8: Reported likelihood of using a standard bike after using e-bike by gender...............34Figure 5-9: Respondents’ rating of specific e-bike features and functions...................................35Figure 5-10: Comparing the environmental and health benefits of an e-bike with other modes.. 36
vi

1.0 INTRODUCTION
1.1 INTRODUCTION
Cities and states across the United States have begun taking serious measures to reduce rates of single-occupancy vehicles as part of larger efforts to mitigate congestion, climate change and public health concerns. One alternative has been to get more people on bicycles, but much of the programs and research has focused on bicycle infrastructure, land use and awareness programs rather than the bicycle itself (Pucher et al., 2010, Pucher and Buehler, 2012). Despite efforts to get more people biking, North America still has low ridership numbers, especially commuters and those biking for urban transportation (Alliance for Biking and Walking, 2014).
While small-scale batteries and motors have been around since before even the chain-driven bicycle was invented, it wasn’t until the 1980s that bicycles were outfitted with electric components (Parker, 1999), giving rise to electric bicycles, or e-bikes. Indeed, only recent innovations in these technologies have decreased the cost of production—and more importantly the weight—of the components, making it more feasible for bicycles to be outfitted with batteries and hub motors (Rose, 2012). Although e-bikes comprise a large share of trips in China (Weinert et al., 2008) and are gaining popularity in Europe (Hurst and Gartner, 2013), they are still in the “early adopter” phase in much of North America (Dill and Rose, 2012, MacArthur et al., 2014). But this is quickly changing, which presents opportunities and challenges for cyclists, entrepreneurs and policymakers.
Although this innovation shows promise, the general perceptions of e-bikes are still unclear. The most provocative question is whether e-bikes allow a wider array of people to participate in cycling and whether they get people to bike more often. For certain segments of the population, there is lower participation in cycling, particularly women, older adults and individuals with physical limitations (Edmond et. al, 2009, Pucher et al., 2011). Can e-bikes help lower the barriers to participation for these groups? More broadly, what is the role of e-bikes in the transportation system? Can e-bikes help with first/last-mile commuting in conjunction with public transit?
While these are critical elements in mode choice decisions, less research exists on improving the technology and usability of the mode itself to encourage more trips by bike and for more people to participate. This study focuses on electric-assist bicycles and whether this technology can encourage more bike trips, farther bike trips and increase the number of people biking by attracting people who typically do not—or cannot—ride a regular bicycle. By increasing the amount of biking, there is potential to accrue the positive benefits of reduced vehicle emissions and increased physical activity and mental well-being. This report provides insights into an e-bike demonstration program at Kaiser Permanente that took place in Portland, Oregon from April 2014 – September 2015.
7

1.2 RESEARCH OBJECTIVES
Drive Oregon and Kaiser Permanente Northwest (Kaiser) developed a program to give e-bikes to Kaiser employees at three Portland region campuses (1 urban and 2 suburban) for trial use. The program is funded by a grant to Drive Oregon through the Metro Regional Travel Options program. The program’s primary goal is to test user acceptance of electric-assist folding bicycles as a first/last mile commuting solution and be able to communicate positive stories to a broad range of workplaces to help reduce single occupancy vehicle (SOV) use. By addressing first and last mile issues and barriers, as well as midday errand trips while at the workplace, the project looked to demonstrate the e-bike’s role as an everyday commuting substitute to the SOV in many cases when tied to existing transportation infrastructure. As part of the program goals, the plan was to create a replicable model for deployment within Kaiser as well as other area employers. The project was the first in the U.S. to provide e-bikes to employees for extended trail use.
Portland State University teamed with Drive Oregon to conduct the evaluation of the e-bike program. The evaluation was designed to gather information on an e-bike demonstration project to gain greater understanding of how e-bikes can be integrated into a sustainable transportation system.
In attempts to inform ongoing e-bike research, this research project has two objectives: (1) Understand Kaiser Permanente employee perceptions and attitudes of e-bikes; and (2) Evaluate the use of e-bikes by study participants in Portland Metro region. The objectives were addressed through surveys of study participants, each of which had use of an e-bike for a ten week period. Participant use and behavior data was collected before, during and after use of the bikes. The intent of the e-bike evaluation study was to provide valuable insight into the potential market, user characteristics and barriers to adoption.
Through the data collected by this project we will seek to provide insights on the following board research questions:
What gaps in the transportation system can e-bikes fill?
How do e-bikes change transportation and commuting behavior?
Which demographics are more likely to use e-bikes?
What are the social, technical, and financial barriers to widespread e-bike use?
The characteristics of the project participant pool and participant behavior and response to the e-bikes will increase understanding of which demographics are most likely adopters of e-bikes and how they use bikes. The project will identify any issues and barriers identified by project participants related to the usability, utility, safety, and benefits and disadvantages of e-bikes. These outcomes will assist e-bike manufacturers with e-bike design and provide valuable information to policymakers and transportation officials seeking to develop a multimodal, sustainable transportation system.
8
1.3 ORGANIZATION OF REPORT
This report attempts to provide a comprehensive overview of the research approach, process and findings of this study. The chapters of the report are as follows:
Section 2 (page 10) provides an overview of e-bikes and prior research around e-bikes.
Section 3 (page 15) provides a description of the Kaiser Permanente E-bike demonstration program.
Section 4 (page 19) describes the methodology employed for evaluation.
Section 5 (page 22) summarizes the findings of the evaluation.
Section 6 (page 37) discusses the findings from the research.
Section 7 (page 39) states the conclusion of the research.
The report’s appendices provide the details on the survey instruments.
9
2.0 E-BIKE EVALUATION RESEARCH
2.1 WHAT IS AN E-BIKE?
Electric bicycles (e-bikes) are similar in geometry to human-powered bicycles but have a small electric motor that provides pedal assistance and allows riders to accelerate, climb hills, and overcome wind resistance more easily than manually powered bikes. They are part of a broader classification of motorized bicycles, which includes a range of bicycles with motors, from gasoline- and diesel-powered internal combustion engines, to even steam-powered engines. The modern electric variety of motorized bicycles emerged in the early 1980s in Japan as a way to make cycling easier for the elderly. By 2001, Japan had sold over 900,000 units (Rose & Cock, 2003). E-bikes can be generally divided into two categories: bicycle-style electric bikes (BSEB) and scooter-style electric bikes (SSEB).
Because the e-bike market is quickly changing and evolving, there is more of a spectrum of low-speed electric bicycles that range from more traditional bicycles to scooters than there are distinct classifications, all of which could be officially classified as an e-bike by the federal Consumer Product Safety Commission (CPSC) definition (15 U.S. Code § 2085). A variety of e-bikes on the market have caused some confusion for policymakers, the general public, retailers, law enforcement, media and other groups in understanding what an electric bicycle is and how it may differ from other devices, such as scooters, mopeds, motorcycles, bicycles, and Segways. For the purpose of this report and the Kaiser program, we will focus the discussion on BSEBs.
2.2 BICYCLE-STYLE ELECTRIC BIKES (BSEB)
In North America, many terms are associated with the general classification of bicycle-style electric bicycles (BSEB), sometimes called low-powered electric bicycles or low-speed electric bicycles. In general, BSEBs have an electric motor powered up to 750 watts that goes up to 20 miles per hour. These bikes have working pedals that are meant to propel the bicycle with or without the help of the electric motor.
BSEBs can be further divided into two broad categories: powered bicycles (PB) and power-assisted bicycles (PAB), or pedelecs (Table 2-1). The term pedelec is mostly used in Europe but increasingly used in the U.S. S-pedelecs (speed), another common classification in Europe, are bikes with motor power greater than 250 watts and can attain speeds up to 28 mph (European Parliament & European Council, 2003). In the U.S. there are not many S-pedelec electric bikes on the market but they are a rapidly slow growing class. In most cases, s-pedelecs would potentially be classified as a moped or motorized bicycle in local jurisdictions, except in California where they have recently created a “3-Type” classification system through Assembly Bill 1096 (Peopleforbikes, 2015).
10
Table 2-1: Common alternative terms for two main categories of bicycle-style e-bikes.E-bike type Alternative terms a
Powered bicycle(PB, E-PB)
Throttle-assisted bicycle; electrically propelled bicycle (EPB); electric bike power-on-demand (POD); on-demand bikes; motorized bicycle
Power-assisted bicycle(PAB, E-PAB)
Pedal-assisted bicycle; electrically assisted bicycle (EAB); pedal electric cycle (pedelec); electric pedal assist cycle (EPAC); human-powered hybrids
a Bold indicates more commonly used terms in North America.
Powered bicycles have a throttle on the handlebar that is often twisted with the wrist or thumb to engage the motor, similar to how a motorcycle or moped engages (Figure 2-1). Pedelecs do not have a throttle that propels the bike without pedaling; rather, the motor engages only when the operator pedals the wheels (Figure 2-2). Pedelecs include an electronic controller that stops the motor from producing power when the rider is not pedaling or when a certain speed—usually 20 mph—has been reached. An electronic sensor, typically torque or cadence, detects changes in resistance or in the cranks and then engages the motor. This provides an extra boost when the bike accelerates or attempts to climb a hill.
Figure 2-1: A common throttle mechanism for powered bicycles. Image source: CurrieTech.com
11

Figure 2-2: Kalkhoff Sahel I8—a modern power-assisted bicycle (PAB) or pedelec. Image source: Kalkhoff-Bikes.com
2.3 E-BIKE RESEARCH
E-bike research is beginning to mature, but few studies to date have evaluated the use of e-bikes by individuals. Europe has been in the forefront of naturalistic studies focusing on e-bikes (Dozza et al., 2015, Twisk et al., 2013, Gehlert et al., 2012, Fyhri and Fearnley, 2015). These studies have mostly focused on e-bike speed and safety compared to conventional bicycles by instrumenting bicycles with GPS and video cameras and allowing participants to cycle through a defined course or keeping the e-bikes for short time periods. These studies show that e-bikes tend to be ridden faster than traditional bicycles (4-8 kph on average), but vary in determining if e-bikes interact differently with other cyclists or pedestrians than conventional bicycles.
Few e-bike demonstration projects have occurred in North America. In 2000, partnering organizations across four regions in Canada introduced an e-bike pilot project to document their performance and to better inform federal and provincial regulations (Lamy, 2001). Having reached over 369 participants, who traveled over 15,000 miles, the project found that most respondents (83%) felt as safe on an e-bike as standard bikes, and many car commuters (42%) said they would opt to take an e-bike to work instead of a car.
The most recent and prominent e-bike demonstration project in the U.S. ran from 2011 to 2014 on the campus of the University of Tennessee–Knoxville. CycleUshare (www.cycleushare.com) was a small-scale bike sharing system, which consisted of 15 e-bikes and 6 conventional bikes with approximately 100 active users. Results have looked at the system, user behavior and safety implications (Ji et al., 2014, Langford, 2013,Langford et al., 2013, Langford et al., 2015). This research has shown that speed and ease of use are important in participants’ decisions to use the system, and speed and comfort are the most influential factors in selecting an e-bike over a conventional bicycle. Langford et al. found riders of e-bikes behave very similarly to riders of bicycles (Langford et al., 2015). On-road speeds of e-bike riders were higher than bicyclists by 3 kph on average, but shared-use recreational path speeds of e-bike riders were lower than
12
bicyclists by 1.5 kph. In addition, they found that bicycles and e-bikes violate traffic signals at similar rates. Finally, most users (77%) agreed that e-bikes are more attractive than standard bicycles because they remove cycling barriers, such as topography.
In a survey of the bike commute literature, Heinen and colleagues found that barriers to biking include: safety, weather, inconvenience, lack of fitness, lack of time, being tired, too much effort, and difficulties with trip chaining (Heinen et al., 2010). These barriers can be more or less significant based on an individual’s age, fitness or physical ability. Infrastructure improvements and destination amenities can address some of these concerns related to safety and distance but fail to address other barriers related to the individual rider such as fitness, topography and effort. Distance and topography can be tied to many of the barriers to biking that include lack of fitness, lack of time, being too tired, too much effort and difficulties with trip chaining. E-bikes could allow people with physical limitations, older adults and people in geographically challenging areas to participate in bicycling (Dill and Rose, 2012, MacArthur et al., 2014). MacArthur et al. found from a survey of North American e-bike owners that e-bikes enable users to bike more often, to more distant locations and to carry more cargo with them. Additionally, electric-assist technology enables people to participate in cycling who would otherwise not be able to because of physical limitations or proximity to locations (MacArthur et al., 2014).
13
3.0 PROGRAM OVERVIEW
3.1 E-BIKE DEMOSTRATION PROGRAM DESCRIPTION
Drive Oregon, a nonprofit 501(c)(6) trade association dedicated to growing the electric mobility industry in Oregon, and Kaiser Permanente Northwest (Kaiser) teamed to apply for a Regional Travel Options grant through Metro, Portland’s metropolitan planning organization. Drive Oregon’s mission is to promote, support, and grow the electric mobility industry in Oregon. The program’s primary goal was to test user acceptance of electric-assist folding bicycles as a first/last mile commuting solution and be able to communicate positive stories to a broad range of workplaces to help reduce single occupancy vehicle (SOV) use. The Transportation Research and Education Center (TREC) of Portland State University partnered with Drive Oregon and Kaiser to evaluate the program.
The Drive Oregon & Kaiser E-bike demonstration program aimed to see if e-bikes can encourage more people to bike and to bike more often. The program was based at three Kaiser Permanente campuses in the Portland metropolitan region. Drive Oregon contracted with Bike N’ Hike (a local dealer) to obtain thirty (30) Currie Technologies I-ZIP E3 Compact folding electric bicycles. The program was divided into six test groups (cohorts) of participants from the three regional campuses (Westside Medical Center (KWMC), Sunnyside Medical Center (KSMC) and Lloyd District). The project kicked off in April 2014 and the final participants returned their e-bikes in September 2015. Each campus was assigned 10 e-bikes and the plan was to have 6 cohorts of employees over the year and a half of the program. Each cohort lasted ten weeks, and participants were encouraged to use their e-bikes for a wide range of trips but with a particular focus on commuting. In the end, 155 employees participated in the program.
The I-ZIP E3 Compact (Figure 3-3) has a rear rack mounted 36 Volt 8.8Ah lithium-ion (315 Watt Hours) battery pack and 250 Watt front-wheel motor system. The 42-lbs. bicycle can reach 18+ mph under motor assist and has either a twist-and-go (TAG) or pedal actuated (PAS) mode selectable on the handlebar (see Figure 2-1). The battery range is 15 (24 km) to 22 miles (35 km) depending on the carrying weight, terrain and level of assist used.
15

Figure 3-3: Currie iZip E3—a hybrid PB/PAB folding electric bicycle. Image source: CurrieTech.com
Participants were recruited and selected by the project team (Kaiser and Drive Oregon personnel). Recruitment reached out to employees at the campuses who are willing to test an e-bike for ten weeks and try to use the bike to commute to work. Kaiser staff were responsible of marketing the program thru newsletters, marketing events and other employee engagement events. They planned to recruit over 200 individuals to participate and received over 250 interested employees. Individuals for six (6) cohorts were chosen using criteria developed by the project team and the results of a pre-screening survey. The project team anticipated that approximately 15% of the individuals would drop out of the study or would not complete all the surveys, leaving approximately 180 participant pool. Before joining the program, all individuals were informed of program conditions and responsibilities. All participants received an orientation on e-bikes and bicycle safety tips from Bike N Hike and Washington County Bicycle Transportation Coalition staff before receiving a bicycle. Bicycle maintenance and repairs were handled by Bike N Hike locations and PSU’s Bike Hub.
Once participants were selected for the program, Portland State University researchers were able approach each participant to ask their interest in taking part in the research study. All individuals were informed of research project conditions and their rights as human subjects in a statement of informed consent. Participants were asked to take three online surveys: pre-use, during use, and post-use. These surveys are described in more detail in the Methodology section. Before each survey, participants were asked to reaffirm their informed consent.
3.2 DESCRIPTION OF KAISER PERMANENTE
Kaiser Permanente Northwest is nonprofit integrated health plan that serves more than 500,000 members in the Portland metro area, Salem, Oregon, and southwest Washington. The region is home to 33 medical offices, 17 dental offices, 11 administrative offices as well as 2 hospitals. There are 8,900 employees in the Northwest region, including 880 physicians and 116 dentists. Table 3-2:
16

Kaiser Permanente Facilities provides an overview of each of the Kaiser Permanente facilities that participated in the program.
Table 3-2: Kaiser Permanente FacilitiesFacility Address DescriptionKaiser Permanente Westside Medical Center (KWMC)
2875 NW Stucki Avenue, Hillsboro, OR 97124
Kaiser Westside Medical Center (KWMC) is a hospital in the Tanasbourne neighborhood in Hillsboro, Oregon. KWMC opened in August 2013 with 126 hospital beds and provides emergency, medical and surgical hospital care.
Kaiser Sunnyside Medical Center (KSMC)
10180 SE Sunnyside Road, Clackamas, OR 97015
Kaiser Sunnyside Medical Center (KSMC) is a not-for-profit, general care hospital in the Sunnyside area of Clackamas County. KSMC opened in 1975 and has 196 hospital beds and provides emergency, medical and surgical hospital care, as well as labor and delivery services and regional medical services for cancer and heart and vascular care. As of October 2008, the facility had approximately 2,400 employees.
Kaiser Permanente Medical Group (KPB) – Lloyd District
500 NE Multnomah St, Portland, OR 97232
Kaiser Permanente Northwest (KPB) houses the regional administrative departments. Approximately 440 employees work at this office building.
17

4.0 METHODOLOGY
The Transportation Research and Education Center (TREC) of Portland State University partnered with Drive Oregon and Kaiser Permanente Northwest to evaluate the Kaiser e-bike demonstration program.
4.1 SURVEY OBJECTIVES
The primary objective of the participant surveys was to gain a better understanding of the following:
Previous bicycling experience and attitudes cycling;
Perceptions and attitudes of e-bikes; and
Evaluate the use of e-bikes during the program.
4.2 USER SURVEYS
Participants were asked to take three online surveys: pre use (Appendix A), during use (Appendix B), and post use (Appendix C). Study protocols were reviewed and approved by the Portland State University Office of Research Integrity’s Institutional Review Board.
The pre-use survey, administered before receiving the e-bike, collected data on the following topics: demographics; attitudes towards biking and e-bikes; and typical travel behavior. The during use survey collected data on how participants were using the bicycles, issues with the bicycles and general impressions of the experience. The post-use survey reiterated questions from the pre-use survey of attitudes towards biking and e-bikes and expanded questions on the use of the e-bikes and travel behavior.
4.3 USER SURVEY DISTRIBUTION AND DATA ANALYSIS
Participant names and contact information were given to researchers prior to their test group orientation and receiving an e-bike. Participants received an email explaining the research program and study protocols. All individuals were informed of research project conditions and their rights as human subjects in the statement of informed consent form. Participation in the research program was voluntary and not contingent to participating in the e-bike demonstration program.
Participants were offered a $10 gift card incentive for completing the pre-use and post-use survey. The participants were also entered into a lottery to win one of the e-bikes used in the study. For each survey the participants completed, they received one entry and if they completed all three surveys they received two additional entries, for a total of five.
19

Surveys were designed and distributed using Qualtrics. Closed-ended responses were analyzed for trends and differences using SPSS and R statistical package, though only aggregate results are reported in this report. Open-ended questions were analyzed, coded and grouped where possible. Some responses were re-coded where necessary.
4.4 SURVEY RESPONSE RATES
Response rates for each cohort are shown in Table 4-3. A total of 155 participants signed up to participate in the program, of which 5 individuals dropped out during the program. Of the 150 participants that used the bicycles for the ten week periods, 125 finished and submitted surveys for each of the survey periods and 4 only finished the pre and post surveys. The results use the data from these 129 participants. Surveys were considered completed as long as any portion of the survey was completed. Twenty-one (21) participants either didn’t finish any surveys or submitted only one survey or only the first two surveys.
Table 4-3: Survey Distribution and Response Rates
Facility
Cohorttotal participants (number with unfinished surveys)
1 2 3 4 5 6 Dropped Out Totals
KPB (Lloyd) 11 (0) 10 (1) 10 (4) 7 (1) 10 (0) 11 (1) 0 59 (7)
KSMC (Sunnyside) 10 (1) 10 (1) 8 (1) 5 (0) 4 (1) 6 (0) 2 43 (4)
KWMC (Westside) 9 (2) 9 (2) 9 (0) 7 (0) 6 (1) 8 (5) 3 48 (10)Totals 30 (3) 29 (4) 27 (5) 19 (1) 20 (3) 25 (6) 5 150 (21)
4.5 LIMITATIONS
The results from this study have a number of limitations. These include selection bias, sample bias and a low sample size. Only participants who were interested in using an e-bike signed up to participate for the program. Although volunteers were incentivized to take the survey, this doesn’t account for their initial interest in using an e-bike. Additionally, although the program was open to all Kaiser Permanente employees, this does not constitute a representative sample for all potential e-bike users, although the anecdote of participants in the market for e-bikes in the United States may lend support for these results. Further, the small preliminary sample size of 155 does not enable robust inferential statistics for this analysis. Lastly, participants were issued e-bikes for only 10 weeks at a time throughout the year, meaning some cohorts had inclement weather that may have affected use and interest in the program.
The program had hoped to include GPS and trip logging data collection to provide better understanding of travel behavior and use of the e-bikes. At the time of the program launch, a GPS solution that could continuously log data for 10 weeks without participant interaction (starting and stopping the device, charging batteries, etc.) was not available. The program team and researchers looked into a variety of solutions but no cost-effective, easy and accurate device
20

was on the market. GPS data would have greatly improved understanding of route choice and use of the bikes.
21

5.0 RESULTS
5.1 DEMOGRAPHICS
Participants were largely been white (73%), female (64%), between the ages of 35 and 54 (76%), have a household income between $100,000–$150,000, have a college degree, were in good health and have no physical limitations (Table 5-4). Household income is consistent with the higher levels of education. Almost half indicated their household income was over $100,000, and over 75% had a bachelor’s degree or higher. These demographics seem typical for a healthcare facility. The average household size was 2.9 individuals. Nearly 60% of households had zero children under 16 years of age, and 95% had fewer than three children.
Over 90% of respondents indicated they were in good health or better, yet over 20% acknowledged that they had some physical limitation that made it difficult to get around. These limitations included joint pain or arthritis, problems with obesity, asthma and chronic pain, among others. Data on height and weight were also collected, allowing us to roughly gauge the potential health level by calculating body mass index (BMI). BMIs ranged from 19.4 to 47.0, and the average BMI for the entire sample was 27.7. The optimal range is between 18.5 and 25.
22

Table 5-4: Demographic characteristics of survey respondents.Race/ethnicity # % Household Income # %White 94 73% $15,000 – $24,999 1 1%Black 4 3% $25,000 – $34,999 1 1%Hispanic/Latino 10 8% $35,000 – $49,999 11 9%Asian 10 8% $50,000 – $74,999 22 18%American Indian 1 1% $75,000 – $99,999 30 24%Native Hawaiian 2 2% $100,000 – $149,999 45 36%Two or more 5 4% $150,000 or more 15 12%Total (n) 129 100% Total (n) 125 100%Sex # % Physical limitations # %Male 47 36% No 96 77%Female 82 64% Yes 29 23%Total (n) 129 100% Total (n) 90 100%Age group # % BMI index by age Male Female18-24 5 4% 18 – 24 25.7 23.025-34 25 17% 25 – 34 25.0 25.735-44 41 34% 35 – 44 29.2 27.345-54 35 30% 45 – 54 28.4 29.055-64 19 13% 55 + 28.9 27.965+ 2 1% Average 28.0 27.4Total (n) 127 100%Educational attainment # % Reported health # %High school 4 3% Excellent 17 13%Some college 27 21% Very Good 47 37%College graduate 57 45% Good 52 41%Advanced degree 39 31% Fair 12 9%Total (n) 127 100% Total (n) 90 100%
5.2 TRAVEL CHARACTERISTICS
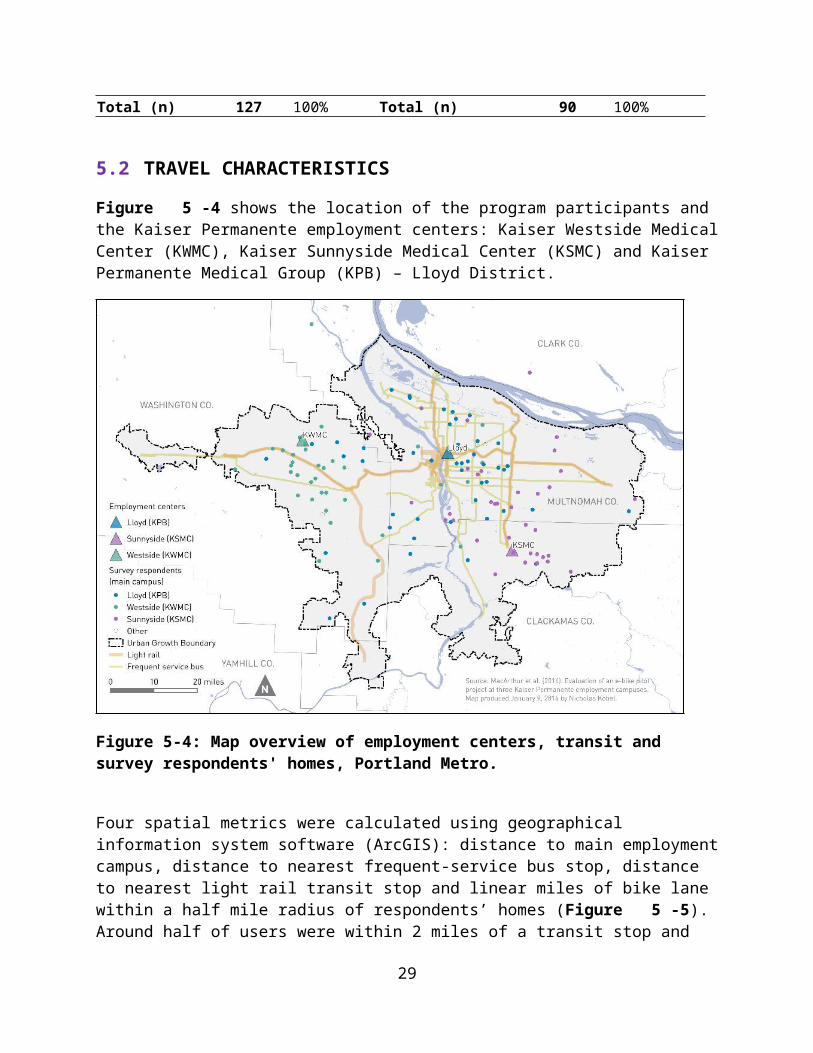
Figure 5-4 shows the location of the program participants and the Kaiser Permanente employment centers: Kaiser Westside Medical Center (KWMC), Kaiser Sunnyside Medical Center (KSMC) and Kaiser Permanente Medical Group (KPB) – Lloyd District.
23
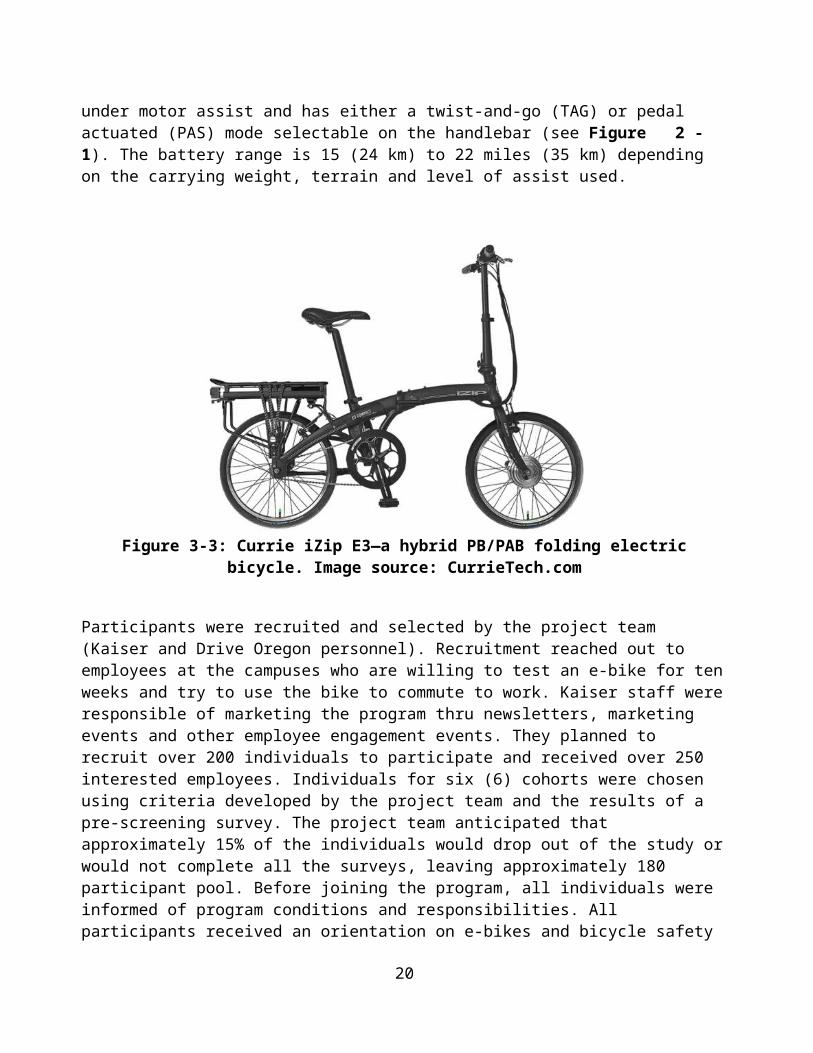
Figure 5-4: Map overview of employment centers, transit and survey respondents' homes, Portland Metro.
Four spatial metrics were calculated using geographical information system software (ArcGIS): distance to main employment campus, distance to nearest frequent-service bus stop, distance to nearest light rail transit stop and linear miles of bike lane within a half mile radius of respondents’ homes (Figure 5-5). Around half of users were within 2 miles of a transit stop and just over 10 miles from their main employment campus. Participants generally had at least 2 linear miles of bike routes within a half mile from their home.
24

Variable n Mean Median SD Range Min MaxDistance to main employment center 118 11.20 10.01 6.88 31.63 0.44 38.51Distance to nearest frequent service bus stop 124 1.52 0.75 2.25 14.94 0.03 17.19Distance to nearest light rail transit stop 124 2.14 1.56 2.36 18.45 0.17 20.81Linear miles of bike routes within ½ mile 123 1.90 1.89 1.15 5.78 0.00 6.93
Figure 5-5: Summary statistics for GIS distance analysis.
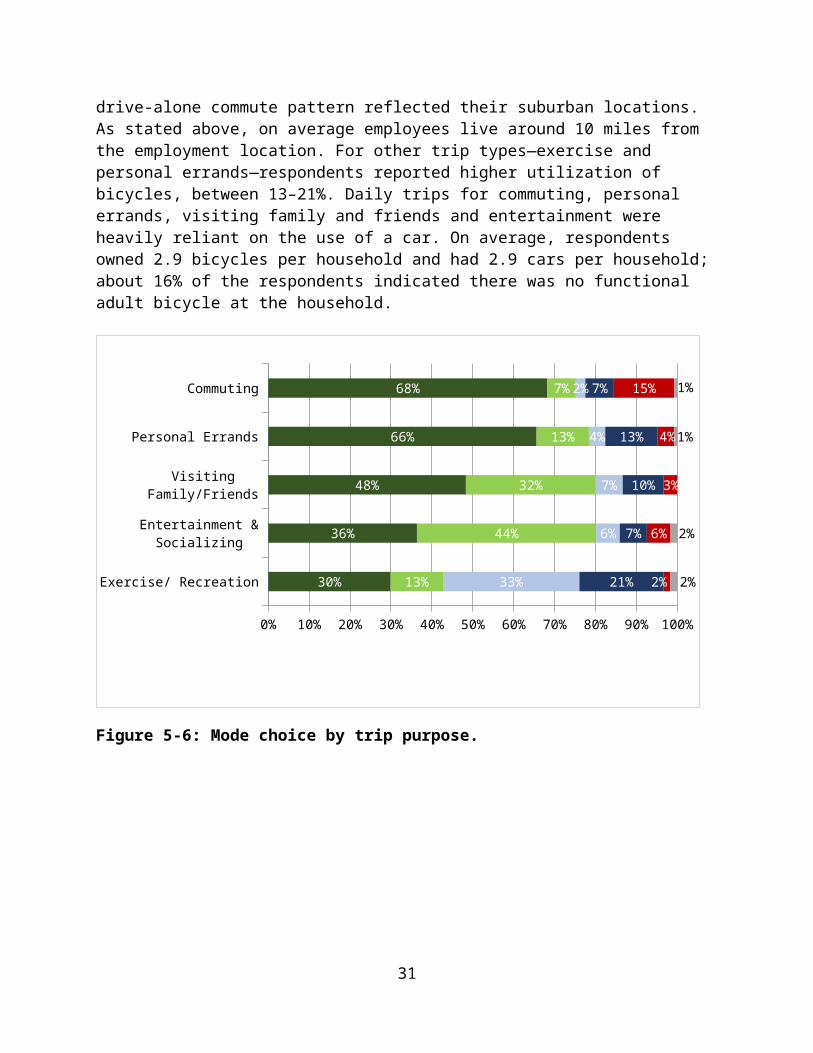
Prior to the program, participants’ mode of transportation varied by trip type (Figure 5-6). For commuting, over two-thirds (68%) drove alone and a quarter used active or public transportation. Of the 7% who primarily biked to work, over half of these respondents worked at the Lloyd District campus, located in close-in Northeast Portland (Figure 5-7). About a fifth (19%) of respondents reported having a monthly or yearly transit pass, and 15% overall commuted primarily using public transit. The Lloyd District campus employees had the largest percentage using transit to commute (32%). The other two campuses’ high drive-alone commute pattern reflected their suburban locations. As stated above, on average employees live around 10 miles from the employment location. For other trip types—exercise and personal errands—respondents reported higher utilization of bicycles, between 13–21%. Daily trips for commuting, personal errands, visiting family and friends and entertainment were heavily reliant on the use of a car. On average, respondents owned 2.9 bicycles per household and had 2.9 cars per household; about 16% of the respondents indicated there was no functional adult bicycle at the household.
25

Exercise/ Recreation
Entertainment & Socializing
Visiting Family/Friends
Personal Errands
Commuting
0% 10% 20% 30% 40% 50% 60% 70% 80% 90% 100%
30%
36%
48%
66%
68%
13%
44%
32%
13%
7%
33%
6%
7%
4%
2%
21%
7%
10%
13%
7%
2%
6%
3%
4%
15%
2%
2%
1%
1%
Drive alone Carpool/passenger Walk Bike Public transit Other
Figure 5-6: Mode choice by trip purpose.
Drive alone Carpool Walk Bike Public transit Other0%
10%
20%
30%
40%
50%
60%
70%
80%
90%78%
11%3% 3% 6% 0%
47%
6%2%
13%
32%
0%
82%
5% 3% 3% 5% 3%
Westside Lloyd
Sunnyside
Figure 5-7: Commuting mode choice by Kaiser employment campus.
26

5.3 LEVELS OF CYCLING, BARRIERS AND CYCLIST TYPOLOGY
When asked how they would describe themselves as a cyclist, 22% of respondents said they bike “regularly,” 67% said “occasionally” and 11% said “never ride a bike.” Most respondents (75%) stated they had biked for commuting or other activities as an adult in the past. However, only 36 (39%) of these had done so within the last 6 months and 23 (18%) in the last month. In other words, about a fifth (18%) of the respondents had biked to work recently; about 8% were active cyclists, logging 10 or more bike commutes in the last month. Additionally, about 67% had biked for recreation in the last 6 months. Overall, about 39% of respondents had biked at least once in the past month for either transportation to work or for recreation. Fewer than 10% of respondents had ever ridden an e-bike before, and about 75% said they were “somewhat [or] very unfamiliar” with e-bikes. More than 30% said they had considered purchasing an e-bike prior to the study, but no one had one in their household.
All respondents were also asked about the barriers to biking more often (Table 5-5). The first three columns represent participants either stopped biking to work (A) or for recreation (B) and what factors keeping them biking more (C). Columns D and E represent what was keeping them from biking more during the trial. The top reasons were inclement weather (67%, n=95), didn’t want to arrive sweaty at their destination (47%), carrying capacity (41%), destination is too far (40%) and hills (38%). In looking at how barriers vary between gender, there are slight differences a couple categories. Women find hills more of a barrier than men (43% v. 29%) and more concerned about safety (18% v. 9%). Men find that arrive to work sweaty or not having showers is a bigger barrier than women (65% v. 38%).
For cyclists who had commuted by bike in the last year but had stopped biking (n=55), the reasons they cited included inclement weather (45%), making the trip too far (44%) and time constraints/trip logistics (45%). Lastly, for respondents who had biked for recreation in the last year but stopped (n=31), the most cited barriers were time constraints/trip logistics (61%), inclement weather (39%) and physical limitations or health concerns (16%).
Comparing what barriers participants faced before and after the program. There were notable shifts in some barriers, such as arriving sweaty/no showers (47% to 10%), destination too far (40% to 23%), trip logistics/time constraints (18% to 10%), and hills (38% to 0%). These shifts show that an e-bike decreases the difficulty people face during bicycling. There were some shifts in barriers that increased, such as biking is uncomfortable (0% to 19%), physical unable and health concerns (3% to 10%), and poor transit connections (0% to 9%). These barriers seem aligned with people trying to cycling for commuting and other trips and people experiencing issues related to cycling. Majority of the participants found weather conditions as a major barrier to cycling.
27

Table 5-5: Barriers to participation in cycling cited by respondents.Standard bicycle E-bike
(A) (B) (C) (D) (E)Sample size (n) 55 31 95 79 86
Weather conditions 45% 39% 67% 59% 55%
I don't like to arrive sweaty/no showers at work 4% 0% 47% 14% 10%
I can’t carry the things I need 0% 0% 41% 43% 50%
My destination is too far 44% 10% 40% 16% 23%
Hills 4% 0% 38% 1% 0%
Trip logistics, preparation and/or time constraints 45% 61% 18% 14% 10%
I am concerned for my safety 5% 3% 15% 16% 14%I do not have access to a bicycle OR there was an issue with my e-bike 11% 10% 12% 0% 0%I am unable to bike for health concerns or am physically unable 15% 16% 3% 5% 10%
There is no place to securely store my bicycle 0% 0% 2% 6% 17%
"Laziness" (self-reported) 2% 6% 2% 1% 1%
Transit connections are not easy or convenient 0% 0% 0% 8% 9%
The bike is uncomfortable or causes pain 11% 16% 0% 11% 19%
Other 2% 6% 3% 4% 7%(A): Pre-use: Why did you stop biking for transportation to work?(B): Pre-use: Why did you stop biking for recreation?(C): Pre-use: What are the main factors keeping you from biking more often?(D): Mid-use: If you would like to use the e-bike to commute to work more often, what prevents you from doing so?(E): Post-use: If you weren't able to use the e-bike as often as you would have liked, what prevented you from doing so?NOTE: Categories combined where appropriate
In 2006, the City of Portland Bicycle Coordinator Roger Geller proposed a typology in the white paper, “Four Types of Cyclists”, which placed people into classifications based on stated level of comfort bicycling in different types of environments and their interest in and ability to bicycle (Geller, 2006). The paper developed the classifications of “strong and fearless,” “enthused and confident,” “interested but concerned,” and “no way no how.” Strong and fearless cyclists do not need any accommodation in the form of bicycle-specific infrastructure to ride comfortably, even on busy streets. Enthused and confident cyclists are generally comfortable riding on streets with motor vehicles, but prefer bike facilities, such as a bike lane. The interested but concerned want to ride a bicycle or are at least curious about bicycling, but generally require comfortable bike facilities and will not want to ride on streets with heavy vehicle traffic. Finally, the no way no how group will not ride a bicycle on the street no matter what, either due to inability, lack of interest or other factors. In 2012 and 2015, Dill and McNeil took this typology and determined the percentages for Portland, Oregon and nationwide, respectively, for the classifications: 4%/7%
28

strong and fearless, 9%/5% enthused and confident, 56%/51% interested but concerned, and 31%/37% no way no how (Dill and McNeil, 2012, Dill and McNeil, 2015).
Using the survey instrument developed by Dill & McNeil (2012), participants’ cyclist typology was calculated before and after use of the e-bike (Table 5-6). Before use, 38% of respondents were categorized as “strong and fearless” or “enthused and confident.” After using an e-bike, 52% were categorized as such. Overall, 42 respondents (33%) increased in confidence through participating in the program, while 20 respondents (16%) moved down in typology confidence.
Table 5-6: Change in cyclist typology (individual) before and after using e-bike, by self-described cyclist type.
"I ride a bike…"Total Portland
regional/National average †/**
"never" "occasionally" "regularly"
# % # % # % # %
Before 14 100% 87 100% 28 100% 129 100% -
No way, no how 4 29% 8 9% 0 0% 12 8% 31% / 37%
Interested but concerned 7 50% 45 52% 18 64% 70 54% 56% / 51%
Enthused and confident 3 21% 33 38% 8 29% 44 35% 9% / 5%
Strong and fearless 0 0% 1 2% 2 7% 3 3% 4% / 7 %
After 13 100% 87 100% 28 100% 128 100% -
No way, no how 0 0% 8 9% 0 0% 8 6% 31% / 37%
Interested but concerned 5 33% 40 46% 9 32% 54 42% 56% / 51%
Enthused and confident 8 67% 34 39% 12 54% 57 45% 9% / 5%
Strong and fearless 0 0% 5 6% 2 14% 9 7% 4% / 7 %
Total 14 100% 87 100% 28 100% 129 100% -
Became less confident 0 0% 16 18% 3 13% 20 16% -
No change 3 22% 51 59% 13 46% 67 52% -
Became more confident 10 71% 20 23% 12 43% 42 33% -
† Cyclist typology results from Dill & McNeil, 2012. ** Dill & McNeil, 2015
29

5.4 USE OF E-BIKES
5.4.1 Frequency
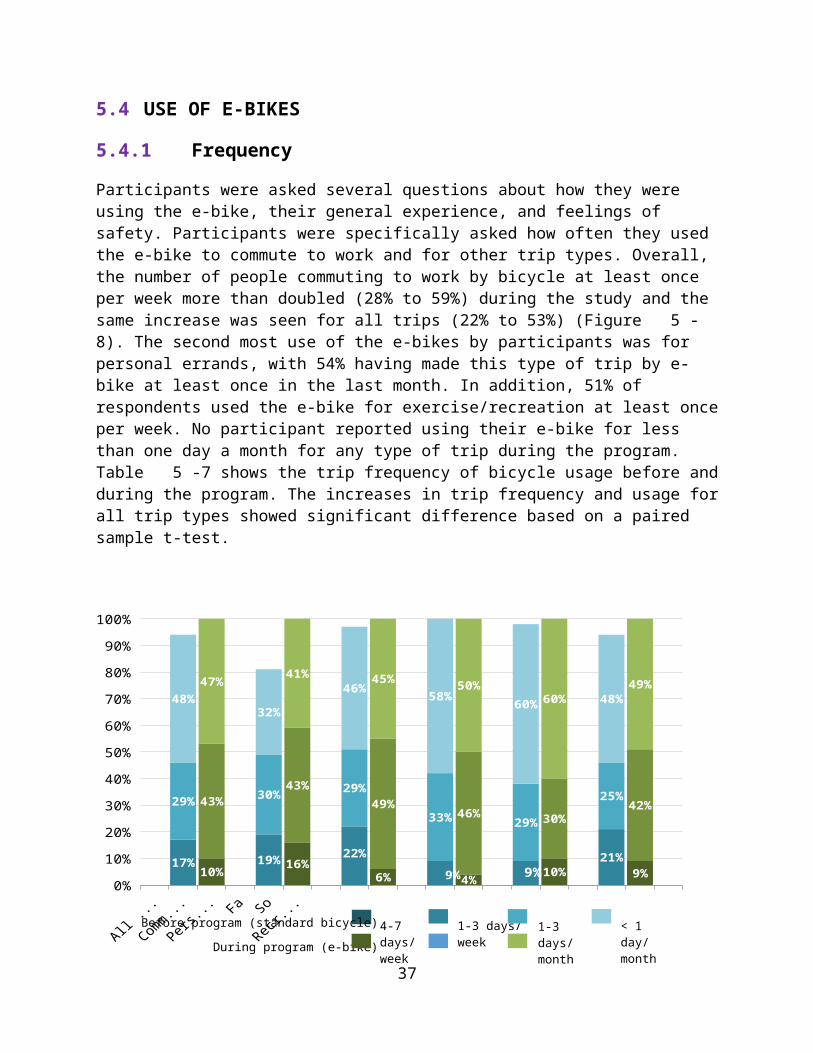
Participants were asked several questions about how they were using the e-bike, their general experience, and feelings of safety. Participants were specifically asked how often they used the e-bike to commute to work and for other trip types. Overall, the number of people commuting to work by bicycle at least once per week more than doubled (28% to 59%) during the study and the same increase was seen for all trips (22% to 53%) (Figure 5-8). The second most use of the e-bikes by participants was for personal errands, with 54% having made this type of trip by e-bike at least once in the last month. In addition, 51% of respondents used the e-bike for exercise/recreation at least once per week. No participant reported using their e-bike for less than one day a month for any type of trip during the program. Table 5-7 shows the trip frequency of bicycle usage before and during the program. The increases in trip frequency and usage for all trip types showed significant difference based on a paired sample t-test.
0%
10%
20%
30%
40%
50%
60%
70%
80%
90%
100%
17% 19% 22% 21%
29% 30% 29%
33% 29%
25%
48%32%
46%58%
60% 48%
10%16%
6% 4%10% 9%
43%43%
49%46% 30%
42%
47%41% 45% 50%
60%49%
9% 9%
Figure 5-8: Frequency of bicycle usage by trip purpose, before and during program.“For each activity, how often do you travel by bicycle?” (pre-use, n=115)“How often do you use your e-bike for the following activities?” (mid-use, n=75)
30
4-7 days/ week
1-3 days/ week 1-3 days/ month < 1 day/ monthBefore program (standard bicycle)
During program (e-bike)

Table 5-7: Frequency of bicycle usage by trip purpose, before and during program.
Trip Purpose
PREUSE DURING USE
Avg Diff.
t-Value Sig*
Trip Frequency Trip Frequency
More likely
Less likely
Neither more
nor less likely Avg
More likely
Less likely
Neither more
nor less likely Avg
Std Error
Commuting to work/school 17% 14% 69% 4.57 47% 12% 41% 1.9 -58% 0.183 14.58 <0.001
Personal errands 17% 19% 64% 4.34 45% 14% 41% 1.93 -56% 0.161 14.92 <0.001
Visit family or friends 4% 16% 80% 4.98 37% 15% 48% 2.08 -58% 0.141 20.63 <0.001
Entertainment, dining/ socializing
5% 14% 81% 4.98 25% 16% 60% 2.31 -54% 0.129 20.63 <0.001
Exercise or recreation 24% 23% 53% 3.63 64% 5% 31% 1.69 -53% 0.143 13.60 <0.001
Note: Boldface indicates a significant difference between values based on paired sample t-test, p ≤ .05.
According to the 2009 National Household Travel Survey, 57% of daily vehicle trips are less than 5 miles long—a reasonable distance to ride a bike (US DOT, 2009). Research has shown that distance of bike trip plays an important role in why people bike or not (Pucher et al., 2010). Over half of the respondents (59%) reported using the e-bike to commute to work at least once a week, and about fifth (19%) used the bike three or more times per week. This varied considerably with distance from employment center, as the likelihood of using the e-bike to commute to work at least once per week greatly decreased when the respondent lived 5 or more miles from their employment location (Figure 5-9). Of the 79 participants that lived over 5 miles from their employment location, 48% commuted by e-bike at least once a week.
For cyclists who were not actively cycling prior to receiving an e-bike (n=78), about 42% started commuting by e-bike at least once per week. For exercise and recreation, only about 24% of this group reported never using the e-bike.
31

≤ 5 mi(n=24)
> 5 mi, < 10 mi(n=29)
≥ 10 mi(n=50)
0%
10%
20%
30%
40%
50%
60%
0%3% 4%
21% 21%16%
42%
24%28%
38%
52% 52%
5+ day/week 3-4 days/week1-2 days/week Less than once per week
Figure 5-9: Reported usage of e-bike (trip frequency) for commuting by distance from work.“How often do you use the e-bike to commute to your work campus?” (mid-use)
5.4.2 Experiences
Less than a fifth of respondents (15%) tried taking their e-bike onto public transportation, and most of these cyclists suspended the bike from bicycle hooks on the TriMet MAX light rail cars or placed the bike in a rack at the front of the bus. A quarter (26%) of those reported having trouble taking the e-bikes onto transit, citing crowded trains and a heavy bike that was difficult to maneuver as the primary reasons.
Twenty eight of respondents (21%) had been involved in an incident or near-miss with another road user or object during their experience. Of the 4 crashes reported, one was considered to have minor injuries and the other moderate injuries. Two of the crashes involved another road user and the other two involved objects in the roadway. Of the near-misses reported most involved other cyclists and/or pedestrians. Two participants reported they felt the e-bike helped contribute to the crash because speed of the throttle or poor braking. There was no significant correlation between change in typology and the participant reporting any incidents, including crashes or near-misses.
5.5 PERCEPTIONS OF E-BIKES AND POTENTIAL CHANGES IN BEHAVIOR
Most respondents “somewhat [or] strongly agreed” that the e-bikes were comfortable (85%), fun (91%) and easy to use overall (92%). About three-quarters (79%) felt e-bikes allow them to go faster/farther than a standard bicycle. Most participants (93%) said they felt safe overall riding
32
the e-bike, and two-thirds (69%) said they feel more comfortable riding in traffic on an e-bike than they do on a standard bike. For those answering whether the e-bike allowed them to keep up with friends or family on bike rides (n=79), 76% “somewhat [or] strongly agreed” that an e-bike enabled them to keep up.
Only a small fraction of respondents (7%) had a “poor [or] very poor” experience overall riding the e-bike, where most (70%) had a “good [or] very good” experience. Fewer people responded favorably when asked about the bicycle itself, but most (69%) rated it as “good [or] very good.”
After using the e-bike for ten weeks, respondents were asked whether they would be more or less likely to use a standard bicycle for particular trips (Figure 5-10). An average of 43% of respondents indicated they would be more likely to bike for certain trips, most commonly for exercise or recreation (64%). Over half of all users reported that they are more likely to take a standard bike on at least 2 or more types of trips (out of five listed). In looking at the results by gender, males are more likely to bicycle than females for commuting (53% to 43%), socializing (34% to 20%) and visiting family and friends (45% to 33%) (Figure 5-11).
Over a third of respondents (33%) said they would definitely consider purchasing their own e-bike, primarily because it is “fun” (21%) a good way to get exercise (21%) and a cost-effective form of transportation (21%). The mean price respondents said they were willing to pay for an e-bike was $1,339; however, most (47%) felt that the cost of an e-bike set at $2,000 was “about right.” Fewer people (n=50) felt that the $2,000 price tag was overpriced after having tested out the e-bike for 10 weeks.
Commuting
Personal errands
Socializing
Exercise & recreation
Family & friends
0% 10% 20% 30% 40% 50% 60% 70% 80% 90% 100%
47%
45%
25%
64%
37%
41%
41%
60%
31%
48%
12%
14%
16%
5%
15%
More likely Neither more nor less likelyLess likely
Figure 5-10: Reported likelihood of using a standard bike after using e-bike.
33

Commuting: Males
Commuting: Females
Personal errands: Males
Personal errands: Females
Socializing: Males
Socializing: Females
Exercise & recreation: Males
Exercise & recreation: Females
Family & Friends: Males
Family & Friends: Females
0% 10% 20% 30% 40% 50% 60% 70% 80% 90% 100%
53%
43%
47%
44%
34%
20%
66%
62%
45%
33%
38%
43%
43%
40%
55%
62%
32%
30%
47%
49%
9%
15%
11%
16%
11%
18%
2%
7%
9%
18%
More likely Neither more nor less likely Less likely
Figure 5-11: Reported likelihood of using a standard bike after using e-bike by gender
Respondents were asked to rate specific features of the e-bike used in the study—a Currie IZIP E3 Compact (Figure 5-12). Overall, the participants had a favorable opinion of the e-bike (71% “very good [or} good”). The most liked features related to functions of the e-bike, power-assist (90%), battery range (86%) and charging (89%). The features that were rated the most poorly were the weight of the e-bike (69% “fair, poor [or] very poor”), pedaling the bike without electric assist (52%) and folding the bike (47%).
34
Weight of e-bike (n=125)
Folding the e-bike (n=119)
Pedaling without electric assist (n=126)
Size of e-bike unfolded (n=125)
Size of e-bike folded (n=117)
Time it takes to recharge battery (n=123)
Stability while riding (n=126)
Braking/slowing down (n=127)
Charging the battery overall (n=124)
Battery range for most trips (n=125)
Engaging pedelec (PAS) assist (n=127)
Engaging throttle (TAG) assist (n=127)
Average
0% 10% 20% 30% 40% 50% 60% 70% 80% 90% 100%
7%
14%
19%
21%
28%
33%
34%
37%
40%
42%
45%
54%
31%
23%
39%
28%
46%
40%
53%
44%
43%
49%
44%
41%
36%
40%
35%
27%
25%
28%
20%
14%
14%
15%
9%
11%
13%
7%
18%
27%
13%
17%
4%
10%
6%
7%
7%
7%
10%
2%
1%
3%
Very Good Good Fair Poor Very Poor
Figure 5-12: Respondents’ rating of specific e-bike features and functions.“How would you rate these features in terms of ease of use or convenience?” (post-use)
Participants were asked a series of questions before and after the program on their perceptions of the environmental and health benefits of using an e-bike versus a car, transit and a standard bicycle (Figure 5-13). Overall, participants strongly agreed that an e-bike was better for the environment and their health than using a car for a trip with little change before and after the use of the e-bike. As for transit, participants believe that an e-bike is better for the environment (85% “strongly agree [or] somewhat agree”) and better for their health (92% “strongly agree [or] somewhat agree”) than using transit. As for comparing e-bikes and standard bicycles, participants were less in agreement with the benefits to the environment and health. Fewer participants believe that an e-bike is better for the environment (23% “strongly agree [or] somewhat agree”) and better for their health (25% “strongly agree [or] somewhat agree”) than using a standard bicycle. These attitudes did slightly improve after the use of the e-bike.
35

Figure 5-13: Comparing the environmental and health benefits of an e-bike with other modes.
36

6.0 DISCUSSION
This research project has two objectives: In attempts to inform ongoing e-bike research, this research project has two objectives: (1) Understand Kaiser Permanente employee perceptions and attitudes of e-bikes; and (2) Evaluate the use of e-bikes by study participants in Portland Metro region. The analysis presented here suggests that e-bikes enable users to bike more often and increases the frequency that existing cyclists bike. Additionally, e-bikes allow people who would otherwise not be able to bike—because of physical limitations or proximity to locations—the opportunity to overcome these challenges by utilizing an electric assist.
6.1 E-BIKES REDUCE BARRIERS TO PARTICIPATION IN CYCLING
Distance, hills and sweat stand in the way of using a standard bicycle more often, according to nearly half of our respondents. But these perceived barriers become insignificant when presented with an electric-assist bicycle to help climb hills, distance to travel and reduce exertion. There were notable shifts in some barriers, such as arriving sweaty/no showers (47% to 10%), destination too far (40% to 23%), trip logistics/time constraints (18% to 10%), and hills (38% to 0%). Although not unique to e-bikes, this finding has implications for promoting “complete” bicycles as a means to increase cycling. These findings are consistent with previous survey research (MacArthur et al., 2014).
6.2 E-BIKES MAY MAKE PEOPLE MORE COMFORTABLE ON BICYCLES
These results suggest that given a chance to use an e-bike for 10 weeks, participants feel more comfortable on a bike than previously. There were 28 respondents (31%) whose cyclist typology became more confident (compared to 13 respondents who became less confident). Even when considering the frequency participants used to describe their own cycling habits, these results hold up. In other words, participants' possible lack of experience on a bike does not significantly affect whether they experienced an increase in typology confidence. Participants who described themselves as riding occasionally or regularly experienced an increase in typology confidence at a rate of about 28% (and 16% experienced a decrease); additionally, 78% of those who reported never riding bicycles experienced an increase in confidence (zero decreased). Some of the decrease in confidence could be due the participants’ experience of bicycling more. There were some shifts in barriers to cycling more that increased, such as biking is uncomfortable (0% to 19%), physical unable and health concerns (3% to 10%), and poor transit connections (0% to 9%). These barriers seem aligned with people trying to cycling for commuting and other trips and people experiencing issues related to cycling. Majority of the participants found weather conditions as a major barrier to cycling.
37

6.3 E-BIKES ENCOURAGE MORE TRIPS BY BICYCLE
This analysis shows that people will use a bicycle more if it is electric assist. About 85% of respondents had access to a functional bicycle before the program, yet 23% reported using a bicycle once per week or more (for all trips on average). During the program, this rate doubled to 53%. This is expected given the findings that e-bikes lower barriers to participation and make people feel more comfortable on a bike. The most significant changes were trips for personal errands and for socializing/entertainment. Participants biking at least once a month for personal errands doubled, and those biking for socializing and visiting family at least once per week more than quadrupled.
These changes in attitudes toward biking and frequency of trips may hold up even after the program. About half (46.5%) of the participants indicated they are more likely to commute by bike after the program, compared to just 12% who said they are less likely. More than a third stated they would “definitely consider” purchasing an e-bike, and another third said “maybe.” What is still unclear is the extent to which participants’ motivations going into the program informed their usage during the program and their attitudes coming out of it.
38

7.0 CONCLUSIONS
This study uses an employer-based demonstration project to evaluate how e-bikes can encourage more cycling, especially for commuting. The findings suggest e-bikes reduce perceived barriers to cycling, may increase confidence and comfort on a bicycle, and encourage more frequent trips to a variety of destinations.
One possible solution to increase biking in urban areas is through wider adoption of e-bikes. By providing electric power assistance to a rider, the potential role of the bicycle, especially for commuting and errands, can be expanded by addressing the limits of trip distance and terrain. In addition to distance and terrain, e-bikes have the potential to overcome other barriers to biking that have been identified in previous studies (Dill and Rose, 2012, Cherry and Cervero, 2007).
The next steps of our research will expand on this research. The program had hope to include GPS and trip logging to provide better understanding of travel behavior and use of the e-bikes. Future naturalistic and travel behavior studies using GPS would provide more information of specific usage. Additionally, research could examine how, when, and to what extent users engage in power assistance in conjunction with pedaling. More insight is needed to understand how e-bikes might replace trips by standard bike, transit or car. Finally, more in-depth studies of e-bike users in the Portland region are planned, which will monitor travel activity, physical activity and user feedback on the technology.
There are many factors (i.e., adequate infrastructure and supportive policies) that affect the extent to which bicycling will be a viable transportation mode in urban and suburban communities (Pucher et al., 2010). According to the 2009 Nationwide Household Travel Survey, 57% percent of daily vehicle trips are under five miles in length (US DOT, 2009). Even with extensive bike infrastructure, riders must be willing and physically able to operate bikes for a full range of trips. Because of this, bicycle trips tend to be shorter than motor vehicle trips and cyclists tend to avoid hilly locations (Broach et al., 2012). If urban and suburban areas want to increase the number of people cycling for transportation, barriers for some individuals must be addressed.
The program was not able to effectively understand how e-bikes could be used for first and last mile connections to transit. Very few participants tried to trip chain with the e-bike and transit. The Portland metro has a very extensive transit system and all three Kaiser facilities are within 2 miles of a light rail line. There are no restrictions to bringing an e-bike on a bus or a light rail line, though some people mentioned the bikes being too heavy to lift and carry. This research could be explored in more detail to understand what are the barriers in connecting bicycling and transit.
39

8.0 REFERENCES
15 U.S.C. Chapter 47 Section 2085 “Low-speed electric bicycles” https://www.law.cornell.edu/uscode/text/15/2085
Alliance for Biking & Walking. (2014) Bicycling and walking in the United States: 2014 benchmarking report. http://www.bikewalkalliance.org/resources/benchmarking, accessed July, 2015.
Assembly Bill (AB-1096) “Vehicles: Electric Bicycles” https://leginfo.legislature.ca.gov/faces/billNavClient.xhtml?bill_id=201520160AB1096
Broach, J., J. Gliebe, & J. Dill. (2012) Where do cyclists ride? A route choice model developed with revealed preference GPS data. Transportation Research Part A, (46)10, 1730-1740.
Cherry, C., & R. Cervero. (2007) Use characteristics and mode choice behavior of electric bike users in China. Transport Policy, 14(3), 247-257.
Dill, J. & N. McNeil. (2013) Four types of cyclists? Examination of typology for better understanding of bicycling behavior and potential. Transportation Research Record, 2387, 129-138.
Dill, J. & G. Rose. (2012) E-bikes and transportation policy: Insights from early adopters. Transportation Research Record, 2314, 1-6.
Dill, J. & N. McNeil. (2016), “Revisiting the Four Types of Cyclists: Findings from a National Survey,” Transportation Research Record, forthcoming.
Dozza, M. G. Piccinini & J. Werneke, (2015) Using naturalistic data to assess e-cyclist behavior. Transportation Research Part F. In Press.
Edmond, C.R., W. Tang and S.L. Handy. (2009) Explaining gender difference in bicycling behavior. In Transportation Research Record, 2125, 16-25.
Fyhri A., & N. Fearnley. (2015) Effects of e-bikes on bicycle use and mode share. Transportation Research Part D, 36, 45–52.
41
Gehlert, T., M. Kuhn, K. Schleinitz, T. Petzoldt, S. Schwanitz, & R. Gerike. (2012) The German pedelec naturalistic cycling study: Study design and first experiences. Proceedings from International Conference on Cycling Safety, 2012.
Geller, R. (2006) Four Types of Cyclists. Portland Bureau of Transportation, Portland, Ore., http://www.portlandoregon.gov/transportation/article/264746. Accessed May 23, 2016.
Heinen, E., B. van Wee, & K. Maat. (2010) Commuting by bicycle: an overview of the literature. Transport Reviews, 30(1), 59-96.
Hurst, D., & J. Gartner. (2013) Electric bicycles global market opportunities, barriers, technology issues, and demand forecasts for e-bicycles, pedal assist bicycles, and e-bicycle batteries and motors. Boulder, CO: Navigant Research.
Ji, S., C. Cherry, L. Han, & D. Jordan. (2014) Electric bike sharing: Simulation of user demand and system availability. Journal of Cleaner Production, 85, 250-257.
Lamy, V. (2001) Electric Bike 2000 project. Center for Electric Vehicle Experimentation in Quebec. TP-13732E.
Langford, B. (2013) A comparative health and safety analysis of electric-assist and regular bicycles in an on-campus bicycle sharing system. Doctoral dissertation at the University of Tennessee–Knoxville.
Langford, B., C. Cherry, T. Yoon, S. Worley, & D. Smith. (2013) North America’s first electric bicycle share: A year of experience. Transportation Research Record, 2387, 120-128.
Langford, B., J. Chen, & C. Cherry. (2015) Risky riding: Naturalistic methods comparing safety behavior from conventional bicycle riders and electric bike riders. Accident Analysis and Prevention, 82, 220–226.
MacArthur, J., J. Dill and M. Person. (2014) Electric Bikes in the North America: Results from an online survey. Transportation Research Record, 2468, 123-130.
National Household Travel Survey NHTS (2009). FHWA, U.S. Department of Transportation. http://nhts.ornl.gov/tools.shtml. Accessed April, 2016.
42

Parker, A. A. (1999) Green products to help move the world beyond oil: Power-assisted bicycles. Proceedings of Solar, (99)37, 1-4.
Peopleforbikes (2015). New E-Bike Law Passes in California. October 07, 2015 http://www.peopleforbikes.org/blog/entry/new-e-bike-law-passes-in-california. Assessed April, 2016.
Pucher, J. E., and R. E. Buehler. (2012) City cycling. Cambridge, MA: MIT Press.
Pucher, J., J. Dill, and S. Handy. (2010) Infrastructure, programs, and policies to increase bicycling: an international review. Preventive Medicine, (50), 106-125.
Pucher, J., R. Buehler, and M. Seinen. (2011) Bicycling renaissance in North America? An update and re-appraisal of cycling trends and policies. Transportation Research Part A, (45), 451-475.
Rose, G. (2012). E-bikes and urban transportation: emerging issues and unresolved questions. Transportation, (39), 81-96.
Twisk, D., M. Boele, W. Vlakveld, M. Christoph, R. Sikkema, R. Remij & A. Schwab. (2013) Preliminary results from a field experiment on e-bike safety: speed choice and mental workload for middle-aged and elderly cyclists. Proceedings from International Cycling Safety Conference 2013.
US DOT. (2009) National Household Travel Survey, http://nhts.ornl.gov/tools.shtml, accessed July, 2015.
Weinert, J., J. Ogden, D. Sperling, & A. Burke. (2008) Electric two-wheelers in China: Effect on travel behavior, mode shift, and user safety perceptions in a medium-sized city. Transportation Research Record, 2038, 62-68.
43

9.0 APPENDICES
9.1 APPENDIX A: PRE-USE SURVEY
Q116 Statement of Informed Consent Evaluation of Electric Bike Commuting to Three Kaiser Permanente NW Employment Centers in the Portland Metro Region
Q118 You are invited to participate in a research study conducted by John MacArthur from the Oregon Transportation Research and Education Consortium (OTREC) at Portland State University (PSU). The project studies transportation behavior and electric bike (e-bike) use of approximately one hundred eighty (180) employees of Kaiser Permanente Health Plan of the Northwest, Kaiser Permanente Hospitals and Permanente Medical Group (Individually and collectively referred to as “KPFHP”) at three employment centers in the Portland metropolitan area; the Westside Medical Center, Sunnyside Medical Center, and Lloyd District as part of a Metro Regional Travel Options grant.
Q120 What will I have to do? Participants will receive an e-bike to use for a ten week period as part of an e-bike trial program. KPFHP project managers will coordinate with participants to deliver e-bikes to participants and also answer any questions they may have. If you agree to be in the research study in addition to the trial program, during the ten week trial period, you will be asked to respond to three surveys regarding how you are using the e-bike and your perceptions of the bike- before, during and after participating. Following the ten week period, program managers will arrange for drop-off of the e-bike at the PSU Bike Hub. I have read and understand this section.
Q122 Are there any risks? There are no expected risks from participating in this research study other than the possibility of a risk of breach of confidentiality. The risk of privacy breach in this study is expected to be minimal because we have taken steps to protect your privacy (as described below). There is no direct cost to you for participating in this study. I have read and understand this section.
Q124 Your participation is voluntary. Your participation in this study is completely voluntary. You are under no obligation to participate and choosing not to participate will not affect your relationship with Portland State University, KPFHP or your participation in the e-bike trial program. You may choose to not use the e-bike, not answer questions or withdraw from participating in this study at any time. I have read and understand this section.
45

Q126 What will I get in return? Everyone participating in the research study will have a chance to win one of the Currie iZip e-bikes used in the study. For each survey completed, your name will be entered into a drawing. If you complete all three surveys, you will be awarded two additional entries. The drawing will be held at the end of the project. In addition, you will receive up to two $10 gift cards for completing the first and third surveys. I have read and understand this section.
Q128 What are you doing to protect me? Your privacy is important to us. We have done many things to protect you: Your name and other personal information, which we need in order to keep track of who we talk to, will be kept in a locked file cabinet inside our locked research office. I have read and understand this section.
Q130 Any questions? If you have concerns or problems about your participation in this study or about your rights as a research subject, please contact: PSU Office of Research Integrity 1600 SW 4th Ave. Market Center Building, Ste. 620 Portland, OR 97207 phone (503) 725-2227 or 1 (877) 480-4400. If you have questions about the study itself, please contact John MacArthur by telephone at (503) 725-2866, by e-mail at [email protected], or by mail at: Oregon Transportation Research and Education Consortium P.O. Box 751 Portland State University Portland, OR 97207-0751 I have read and understand this section.
Q132 I have read and understand the above statements. By way of signature, I provide my fully informed consent to participate in this study.
Q134 Full legal name: By typing your name, you provide your consent to participate in this study.
Q136 Please continue to the pre-use survey on the next page.
Q135 We have received your consent form. Now we ask you to complete our 20-minute pre-use survey.
46

Q1.1 Thank you for participating in this electric bicycle (e-bike) pre-use survey.
Kaiser Permanente is working with Drive Oregon to launch an e-bike initiative for Kaiser Permanente employees. The initiative provides research opportunities to help understand travel behavior for first and last mile commuting using e-bikes. The Oregon Transportation Research and Education Consortium (OTREC) at Portland State University has teamed with Kaiser Permanente to conduct a study on this initiative. By participating in this study, you will receive a folding electric bicycle to use at your disposal, free of charge, for 10 weeks. You will also be eligible to win an e-bike and gift cards. In return for participating in this study, you have the chance to win one of the e-bikes used in this study. For each survey you complete, your name will be entered into a lottery. If you complete all three surveys, we will provide an additional two entries for a total of five possible entries. Additionally, you will receive a $10 gift card for the first and third surveys completed. This is the first of three surveys and will take approximately 20 minutes to complete. The second survey takes 5 minutes and will be sent during your use of the e-bike. The third survey takes 10 minutes and will be sent after you have returned the bicycle. We take the protection of your privacy and identity seriously. All of your survey responses are completely confidential. Once data collection is complete, all datasets will be identified using an ID number, which is kept separate from your name and email addresses. All data collected will be stored on a secure, password-protected server accessible only to project staff. Furthermore, once the study concludes, the data will be aggregated as an additional measure to protect your privacy. Your participation in this study is voluntary. If you have concerns or problems about your participation in this study or your rights as a research subject, please contact: Human Subjects Research Review Committee Office of Research and Strategic Partnerships Market Center Building, 6th floor 1600 SW 4th Avenue Portland State University tel: (503) 725-4288 / 1-877-480-4400. If you have any questions about the study, contact John MacArthur at 503-725-2866 or [email protected].
Q1.2 I have read this information and agree to participate in this survey. Continue
Q101 What is your home address? This information will only be used to map how far from your employment center you live and to see which bus/MAX routes are closest.
AddressCityZIP Code
Q114 What is the best phone number to reach you at?
Q2.1 The following set of questions will ask you to share information about your travel behavior and commuting habits.
47

Q103 Which Kaiser Permanente employment campus in Portland do you primarily work at? Westside Lloyd Sunnyside Home Other ____________________
Q2.2 How do you commute to work?Means of commute
Drive alone (car,
truck, van,
motorbike)
Carpool (car, truck, van,
motorbike)
Walk
Bike
MAX, drive and park
at statio
n
MAX, walk/bi
ke to station
MAX, dropped off
at station by car
MAX, take bus to
station
Bus, walk/bi
ke to stop
Bus, drive
or dropped off at stop
Taxi
Car share
(Car2Go,
Zipcar, etc.)
Other
None
Most often
Second most often
("None" if never take a
different mode)
Q113 About how far is your current daily commute (approximate miles in one direction)? 1 or less 2 3 4 5 6 7 8 9 10 11-15 16-20 Over 20 Don't commute on a daily basis
48

Q115 About how long does your commute take from door to door? Less than 10 minutes Between 10 and 20 minutes Between 20 and 30 minutes Between 30 and 45 minutes Between 45 and 60 minutes Longer than one hour
49

Q2.3 Please provide information on the types of trips made in the past seven days.Which mode did you PRIMARILY take to this activity? Which other mode(s) did you take to this activity? (check all
that apply)I did not partake in this activity
Walk Bike Drive alone
Carpool/passenger
Public transit Taxi
Car share (e.g.
Car2Go, ZipCar)
Other Walk Bike Drive alone
Carpool/ passenger
Public transit Taxi
Car share (e.g.
ZipCar)
Other
Personal errands (e.g.
groceries, appointments)
Visit family or friends
Entertainment, dining out, or
socializing
Exercise or recreation
50

Q2.4 How often do you leave the Kaiser campus during work hours for the activities below. Which mode(s) do you take?Frequency of activity Which mode do you PRIMARILY take to this activity? Which mode(s) doyou take to this activity? (check all that
apply)
4-7 days per
week
1-3 days per
week
1-3 days per
month
Less than
once per month
Rarely/never
Walk
Bike
Drive alone
Carpool/passenger
Public transit
Taxi
Car share (e.g.
Car2Go, ZipCar)
Other
Walk
Bike
Drive alone
Carpool/ passenger
Public transit
TaxiCar
share (e.g.
ZipCar)
Other
Meal or snack (i.e., lunch, coffee)
Business-related meeting
Personal errand
Gym or exercise
Other
51

Q2.5 Do you have a monthly or yearly transit pass? Yes No
Q3.1 The following set of questions will ask you about your experience with electric bicycles.
Q107 Do you or someone in your household have an electric bicycle? Yes No Not sure
Q3.2 How familiar are you with e-bikes (electric bicycles)? Very familiar Somewhat familiar Somewhat unfamiliar Very unfamiliar
Q3.4 Have you ever ridden an e-bike? Yes No Don't Know
Q3.3 Have you seriously considered purchasing an e-bike? Yes No
Q111 Why are you interested in trying out an e-bike?
Q4.1 The following set of questions will ask you about your impressions of e-bikes. Please choose the answer that best fits your current feelings and understandings. There is no right or wrong answer to these questions.
Q4.2 E-bikes usually look like standard bicycles: Definitely true Possibly true Possibly false Definitely false Don't know
52

Q4.3 How does the weight of an e-bike compare to a standard bicycle? E-bike is significantly lighter E-bike is a little lighter E-bike is about the same E-bike is a little heavier E-bike is significantly heavier Don't know
Q4.4 The rider does not need to pedal an e-bike to make it go: Definitely true Possibly true Possibly false Definitely false Don't know
Q4.5 Many e-bikes can go about 20 miles on a single charge: Definitely true Possibly true Possibly false Definitely false Don't know
Q4.6 In the United States, most regulations require an e-bike's motor to top out at 20 miles per hour: Definitely true Possibly true Possibly false Definitely false Don't know
Q4.7 In the United States, a driver's license is not required to ride an e-bike: Definitely true Possibly true Possibly false Definitely false Don't know
53

Q4.8 E-bikes can be ridden on standard pedestrian/bicycle paths where motor vehicles and motorized scooters are prohibited: Definitely true Possibly true Possibly false Definitely false Don't know
Q4.9 E-bikes can be ridden on roads, just like standard bicycles: Definitely true Possibly true Possibly false Definitely fasle Don't know
Q4.10 Do YOU think that using an e-bike is considered "cheating" compared to riding a standard bicycle? Strongly Agree Somewhat Agree Somewhat Disagree Strongly Disagree Don't Know
Q4.11 Do you think OTHER people view using an e-bike as "cheating" compared to riding a standard bicycle? Strongly Agree Somewhat Agree Somewhat Disagree Strongly Disagree Don't Know
Q4.12 Riding an e-bike is better for the environment than taking a car for the same trip: Strongly Agree Somewhat Agree Somewhat Disagree Strongly Disagree Don't Know
54

Q4.13 Riding an e-bike is better for the environment than taking public transit for the same trip: Strongly Agree Somewhat Agree Somewhat Disagree Strongly Disagree Don't Know
Q4.14 Riding an e-bike is better for the environment than riding a standard bicycle: Strongly Agree Somewhat Agree Somewhat Disagree Strongly Disagree Don't Know
Q4.15 Riding an e-bike is better for my health than taking a car for the same trip: Strongly Agree Somewhat Agree Somewhat Disagree Strongly Disagree Don't Know
Q4.16 Riding an e-bike is better for my health than taking public transit for the same trip: Strongly Agree Somewhat Agree Somewhat Disagree Strongly Disagree Don't Know
Q4.17 Riding an e-bike is better for my health than riding a standard bicycle: Strongly Agree Somewhat Agree Somewhat Disagree Strongly Disagree Don't Know
Q4.18 An e-bike would make me feel more comfortable riding in traffic with motor vehicles compared to a standard bicycle: Strongly Agree Somewhat Agree Somewhat Disagree Strongly Disagree Don't Know
55
Q4.19 An e-bike would better allow me to keep up with friends or family on bike rides: Strongly Agree Somewhat Agree Somewhat Disagree Strongly Disagree Don't Know
Q4.20 How much would you be willing to pay for an e-bike? Please slide the scale to the approximate dollar amount:______ $ Dollars
Q4.21 AAA released information that stated the annual cost to own and operate a car is approximately $8,500. Given this information, do you think $2,000 for an e-bike is: Underpriced About right Overpriced Other ____________________
Q4.22 About how far would an e-bike need to travel on a single charge in order to be useful to you? At least 5 miles At least 10 miles At least 15 miles At least 20 miles At least 30 miles More than 30 miles
Q4.23 Anxiety of having the battery run out would be a major concern for you: Strongly Agree Agree Disagree Strongly Disagree Don't Know
Q4.24 Fear or concern of having the e-bike stolen would be a major issue: Strongly Agree Agree Disagree Strongly Disagree Don't Know
56

Q4.25 How long would you be willing to wait for an e-bike to fully charge? 1 hour or less Up to 2 hours Up to 4 hours Longer than 4 hours
Q4.26 An ordinary bike weighs between 20 and 30 pounds. In order for an e-bike to be useful to you, about what should the maximum weight be? 20 pounds 30 pounds 40 pounds 50 pounds Don't know
Q4.27 Should a driver's license be required to operate an e-bike? Yes No Not sure
Q4.28 About what should the maximum speed of e-bikes be when powered by the motor? 10 mph 15 mph 20 mph 25 mph 30 mph
Q4.29 Should e-bikes be allowed to be ridden on bicycle/pedestrian paths with standard bicycles and pedestrians? Yes No Not sure
Q4.30 Should e-bikes be allowed to be ridden in bike lanes with standard bicycles? Yes No Not sure
Q5.1 The following set of questions will ask you general questions about travel. Please choose the answer that best fits your current feelings and understandings. There is no right or wrong answer to these questions.
57

Q5.2 I like riding a bike. Strongly Agree Somewhat Agree Somewhat Disagree Strongly Disagree
Q5.3 Pollution from vehicles is a major problem. Strongly Agree Somewhat Agree Somewhat Disagree Strongly Disagree
Q5.4 Traveling by car is safer overall than riding a bike. Strongly Agree Somewhat Agree Somewhat Disagree Strongly Disagree
Q5.5 Biking can sometimes be easier for me than driving. Strongly Agree Somewhat Agree Somewhat Disagree Strongly Disagree
Q5.6 The only good thing about traveling is arriving at your destination. Strongly Agree Somewhat Agree Somewhat Disagree Strongly Disagree
Q5.7 It is important to me to get some physical exercise every day. Strongly Agree Somewhat Agree Somewhat Disagree Strongly Disagree
Q6.1 The following set of questions is about different places you could ride a bike. Please tell us how comfortable you would feel biking there under these hypothetical scenarios. Please choose the answer that best fits your current feelings and understandings. There is no right or wrong answer to these questions.
58
Q6.2 A path or trail separated from the street. How comfortable would you be biking there? Very uncomfortable Somewhat uncomfortable Somewhat comfortable Very comfortable
Q6.3 A quiet, residential street? Very uncomfortable Somewhat uncomfortable Somewhat comfortable Very comfortable
Q6.4 What if that residential street also had bicycle markings, wide speed humps, and other things that slow down and discourage traffic? How comfortable would you be biking there? Very uncomfortable Somewhat uncomfortable Somewhat comfortable Very comfortable
Q6.5 A two-lane neighborhood commercial shopping street with traffic speeds of 25-30 miles per hour, on-street car parking, and no bike lanes? Very uncomfortable Somewhat uncomfortable Somewhat comfortable Very comfortable
Q6.6 What if a striped bike lane was added to the previous street? Very uncomfortable Somewhat uncomfortable Somewhat comfortable Very comfortable
Q6.7 A major suburban street with four lanes, on-street parking, traffic speeds of 30-35 miles per hour, and no bike lane. How comfortable would you be biking there? Very uncomfortable Somewhat uncomfortable Somewhat comfortable Very comfortable
59

Q6.8 What if that major suburban street also had a wide bike lane separated from traffic by a raised curb or parked cars? Very uncomfortable Somewhat uncomfortable Somewhat comfortable Very comfortable
Q6.9 A major street with two lanes in each direction, a center divider, on-street parking, traffic speeds of 35-40 miles per hour, and no bike lane. How comfortable would you be biking there? Very uncomfortable Somewhat uncomfortable Somewhat comfortable Very comfortable
Q6.10 What if a striped bike lane was added to that major street referenced above? Very uncomfortable Somewhat uncomfortable Somewhat comfortable Very comfortable
Q6.11 What if it also had a bike lane separated from traffic by a raised curb or parked cars? Very uncomfortable Somewhat uncomfortable Somewhat comfortable Very comfortable
60

Q6.12 Consider these statements about a generic intersection. How do you agree/disagree with each of the following statements? Each statement begins with the words "I might ride through a stop sign or red light if..."
Strongly disagree
Disagree Neither Agree nor Disagree
Agree Strongly Agree
I don't know
... I have stopped first and there is no cross traffic (red light only).
... another cyclist also runs the stop sign or
red light.
... it is raining/snowing and I am cold.
... I am riding with a group of other adults
and one of them does.
... it is dark out. ... I am running late or
in a hurry.
... I have been waiting a long time and do not
know when I will receive a green light.
... I have already had to stop at lights several
times already.
... there is no one around to see me do it.
... I don't want to lose momentum while traveling on a hill.
... I am turning right. ... I know the signal is about to turn green.
... I am carrying a heavy backpack, pannier(s), or
other load (not including children).
Q7.1 The following set of questions will ask you about how you use a standard bicycle.
61

Q7.2 How would you describe yourself as a bicyclist? I never ride a bike I ride a bike occasionally I ride a bike regularly
Q7.3 Please answer the following questions about your current biking habits. For each activity, how often do you travel by bicycle?
Frequency
4-7 days/week
1-3 days/week
1-4 days/month
7 or more times/year
1-6 times/year Rarely/never
Commute (e.g. work, school)
Personal errands (e.g.
groceries, appointments)
Visit family or friends
Entertainment, dining out, or
socializing
Exercise or recreation
Q7.4 Have you biked for commuting or other activities as an adult in the past? Yes No
Q7.5 As an adult, when did you last commute to work by bike? Less than 6 months ago 6 months to 1 year ago More than 1 year ago
62

Q7.6 Why did you stop biking for transportation to work (check all that apply)? Home location changed Work location changed Injury Busy/Time constraints Pregnancy/Children Other health issues Bike sold Weather Bike stolen Other ____________________
Q7.7 In the past 31 days, about how many days did you ride a bike to work? (Enter "0" if none.)
Q7.8 As an adult, when did you last bike for recreation? Less than 6 months ago 6 months to 1 year ago More than 1 year ago
Q7.9 Why did you stop biking for recreation (check all that apply)? Home location changed Work location changed Injury Busy/Time constraints Pregnancy/Children Other health issues Bike sold Weather Bike stolen I have not stopped biking for recreation Other ____________________
Q7.10 In the past 31 days, about how many days did you ride your bike just for recreation? (Enter "0" if none.)
63

Q111 What are the main factors (if any) keeping you from biking more often, either to your workplace or for daily needs (check all that apply)? Not physically able Distances to places I want to go are too far I do not feel safe biking Hills make it difficult I can't carry the things I need I do not have access to a bicycle I don't like biking I don't like to arrive sweaty Biking is too slow Weather conditions None - I feel I bike enough already Other (Please Specify) ____________________
Q7.11 During the last 7 days, on how many days did you do the following activities for at least 10 minutes?
None 1 day 2 days 3 days 4 days 5 days 6 days 7 days
Walking
Jogging/Running
Housework
Gardening
Riding a bicycle
Participate in an active sport
Home workout
Gym workout
Exercise classes
Q8.1 The following set of questions will ask for demographic information. Please remember your answers are completely confidential.
64

Q8.2 How many working motor vehicles are currently in your household (please do not include RVs, motor homes, or off-road vehicles) 0 1 2 3 4 5 6 7 or more
Q8.3 How many functional adult bicycles do you have in your household that you could use? 0 1 2 3 4 5 6 7 or more
Q8.4 How many people currently live in your household, including yourself? 1 2 3 4 5 6 7 or more
Q8.5 Of those people, how many have a valid driver's license (including yourself)?
Q8.6 Of those people, how many are under the age of 16?
Q119 Which gender do you most identify with? Male Female
Q8.7 How old are you?
Q8.8 What is your height?FeetInches
65

Q8.9 What is your weight in pounds?
Q8.10 What is your highest level of education? Did not finish high school High school graduate or equivalent (e.g. GED) Some college or vocational training College graduate Graduate or professional degree
Q8.11 Household Income Less than $15,000 $15,000 to less than $25,000 $25,000 to less than $35,000 $35,000 to less than $50,000 $50,000 to less than $75,000 $75,000 to less than $100,000 $100,000 to less than $150,000 $150,000 or more
Q8.13 Do you consider yourself of Hispanic, Latino, or Spanish origin? Yes No
Q8.12 Which race do you identify with (check all that apply)? White, European, Middle Eastern, or Caucasian Black, African-American, or African Asian or Asian-American American Indian or Alaskan Native Native Hawaiian or other Pacific Islander Other (please specify) ____________________
Q8.14 How would you describe your general state of health? Excellent Very Good Good Fair Poor
Q8.15 Do you have any physical conditions that make biking difficult for you? No Yes, please describe ____________________
66

Q128 Thank you for completing the survey! Now we ask you to provide information about your preferred gift. Please asnwer the question(s) below.
Q130 What type of gift would you like for completing the survey? $10 gift card to Starbucks (delivered to your KP mailbox) $10 gift card to Powell's Books (delivered to your KP mailbox) $10 gift credit on Amazon.com (electronically delivered)
Q132 Please provide the email address to which we shall send the gift credit.
67

9.2 APPENDIX B: DURING USE SURVEY
Q1.1 Thank you for participating in this electric bicycle (e-bike) mid-use survey. Kaiser Permanente is working with Drive Oregon on an e-bike initiative for KP employees. The initiative provides research opportunities to help understand travel behavior for first and last mile commuting using e-bikes. The Transportation Research and Education Center (TREC) at Portland State University has teamed with Kaiser Permanente to conduct a study on this initiative. By participating in this study, you will receive a folding electric bicycle to use at your disposal, free of charge, for 10 weeks. You will also be eligible to win an e-bike and gift cards. In return for participating in this study, you have the chance to win one of the e-bikes used in this study. For each survey you complete, your name will be entered into a lottery. If you complete all three surveys, we will provide an additional two entries for a total of five possible entries. Additionally, you will receive a $10 gift card for the first and third surveys completed. This is the second of three surveys and will take approximately 5-10 minutes to complete. You took the first survey around the time you received your e-bike. The third survey takes 10 minutes and will be sent after you have returned the bicycle. We take the protection of your privacy and identity seriously. All of your survey responses are completely confidential. Once data collection is complete, all data sets will be identified using an ID number, which is kept separate from your name and email addresses. All data collected will be stored on a secure, password-protected server accessible only to project staff. Furthermore, once the study concludes, the data will be aggregated as an additional measure to protect your privacy. Your participation in this study is voluntary. If you have concerns or problems about your participation in this study or your rights as a research subject, please contact: Human Subjects Research Review Committee Office of Research and Strategic Partnerships Market Center Building, 6th floor 1600 SW 4th Avenue Portland State University tel: (503) 725-4288 / 1-877-480-4400 If you have any questions about the study, contact John MacArthur at 503-725-2866 or [email protected].
Q1.2 I agree to participate in this survey: Yes No
Q1.3 How would you rate your overall experience of riding the e-bike? Very poor Poor Fair Good Very Good
68

Q1.4 How would you rate the e-bike itself overall? Very poor Poor Fair Good Very Good
Q1.5 How often do you use the e-bike to commute to your Kaiser Permanente work campus? Less than once per week Once or twice per week Three or four times per week Five or more times per week
Q1.6 Do you agree with this statement below?"I would like to use the e-bike to commute to work more often." Strongly disagree Disagree Neutral Agree Strongly agree
Q1.7 What prevents you from commuting to work more often? (Mark all that apply.) Weather conditions I am concerned for my safety Work is too far away from my home I can't carry the things I need Other people rely on me to take my car (children, coworkers, etc.) I don't like to arrive sweaty to work The e-bike is uncomfortable to ride I have physical discomfort after riding (e.g., soreness) I have trouble storing or securing the bicycle Transit connections are not easy or convenient Other ____________________
Q35 Have you had any specific problems with the function of the e-bike? If so, please describe.
Q36 Has the battery run out while you were riding the e-bike? Yes No
69

Q37 How many times has the battery run out? Once Twice Three times Four times Five times More than five times
Q38 Why do you think this happened, or what is problem you are having with the battery?
Q1.8 Have you taken the e-bike onto public transportation? Yes No
Q1.9 When taking public transportation, which of these do you typically do to secure the e-bike? (Mark all that apply.) Place it in the bike rack at the front of bus Fold bike and take it aboard Suspend unfolded bike from hook (on MAX) Other (please describe) ____________________
Q1.10 Did you have any trouble taking the e-bike onto public transportation? Yes No
Q1.11 What kind of trouble did you encounter taking the e-bike onto public transit? (Mark all that apply.) Operator forbid me from taking it aboard/inside Operator forbid me from using the bike racks at the front of bus Other passengers gave me disapproving looks or comments The bus/train was crowded The bike was hard to maneuver inside bus/train Transferring bus/train lines was difficult Difficulty folding the bike The bike was too heavy Other (please describe) ____________________
Q1.12 Have you had any trouble using the GPS device? Yes No
70

Q1.13 What kind of trouble have you had using the GPS device? (Mark all that apply.) It is difficult to use (turn on, start recording, etc.) Trouble with the battery or charging It takes too long to connect to the satellite Other (please describe): ____________________
Q1.14 How would you describe your feeling of safety while riding the e-bike?
Q1.15 Do you feel safe riding the e-bike overall? Yes No No opinion
Q1.16 Do you feel comfortable riding the e-bike in a bike lane with other bicyclists? Yes No (please explain) ____________________
Q1.17 While riding the e-bike, do you feel like you go faster than other cyclists? Yes No I don't know
Q39 How often do you use your e-bike for the following activities?4-7 days per
week1-3 days per
week1-3 days per
monthNever Not applicable
Commute (e.g. work, school)
Personal errands (e.g. groceries,
appointments)
Visit family or friends
Entertainment, dining out, or socializing
Exercise or recreation
71
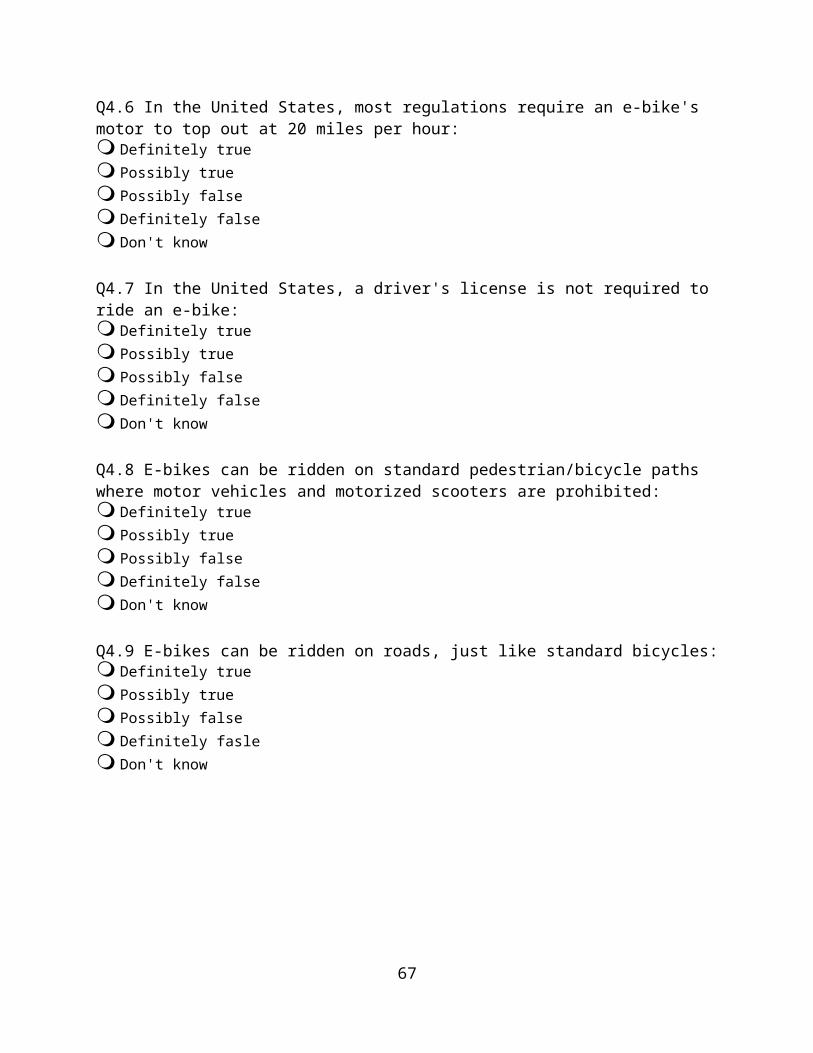
Q1.18 Do you use the e-bike for travel where you had previously...Yes No Not applicable
...used a motor vehicle?
...used public transportation?
...walked?
...used a standard bicycle?
...used another mode? (please describe)
Q1.19 What additional features would you add to make the e-bike more useful to you?
Q1.20 Do you have any positive experiences using the e-bike that you would like to share with us?
Q1.21 Do you have any negative experiences using the e-bike that you would like to share with us?
Q1.22 Do you have any unique or interesting experiences regarding the e-bike that you would like to share with us?
Q1.23 Thank you for your time.
72

9.3 APPENDIX B: POST USE SURVEY
Q1.1 Thank you for participating in this e-bike exit survey. Kaiser Permanente is working with Drive Oregon to launch an e-bike initiative for Kaiser Permanente employees. The initiative provides research opportunities to help understand travel behavior for first and last mile commuting using e-bikes. The Oregon Transportation Research and Education Consortium (OTREC) at Portland State University has teamed with Kaiser Permanente to conduct a study on this initiative. By participating in this study, you will receive a folding electric bicycle to use at your disposal, free of charge, for 10 weeks. You will also be eligible to win an e-bike and gift cards. In return for participating in this study, you have the chance to win one of the e-bikes used in this study. For each survey you complete, your name will be entered into a lottery. If you complete all three surveys, we will provide an additional two entries for a total of five possible entries. Additionally, you will receive a $10 gift card for completing this survey. This is the last survey and will take approximately 15 minutes to complete. We take the protection of your privacy and identity seriously. All of your survey responses are completely confidential. Once data collection is complete, all datasets will be identified using an ID number, which is kept separate from your name and email addresses. All data collected will be stored on a secure, password-protected server accessible only to project staff. Furthermore, once the study concludes, the data will be aggregated as an additional measure to protect your privacy. Your participation in this study is voluntary. If you have concerns or problems about your participation in this study or your rights as a research subject, please contact: Human Subjects Research Review Committee Office of Research and Strategic Partnerships Market Center Building, 6th floor1600 SW 4th Avenue Portland State University tel: (503) 725-4288 / 1-877-480-4400. If you have any questions about the study, contact John MacArthur at 503-725-2866 or [email protected].
Q1.2 I agree to participate in this survey: Continue
Q2.1 How would you rate your overall experience riding the e-bike? Very poor Poor Fair Good Very Good
Q2.2 How would you rate the e-bike itself overall? Very poor Poor Fair Good Very Good
73

Q2.3 This question asks you about specific features of the e-bike you used (Currie IZIP E3 Compact). How would you rate the features below in terms of ease of use or convenience?
Very Good Good Fair Poor Very Poor
Don't know
Weight of e-bike
Size of e-bike unfolded
Size of e-bike folded
Folding the e-bike
Battery range for most trips
Remaining charge indicator on bike
Charging the battery overall
Time it takes to recharge battery
"Charge complete" indicator on charger
Engaging throttle (TAG) assist
Engaging pedelec (PAS) assist
Pedaling the e-bike without electric assist
Braking/slowing down
Stability while riding
Securing with lock
Using the lights
Panniers
Inflating the tires
Other
Q2.4 You felt that the recharge time of the e-bike wasn't convenient. Can you tell us more about that? (Check all that apply.) E-bike did not charge fast enough E-bike was difficult to charge I could not tell when the e-bike was charged Other: ____________________
74

Q2.5 You felt that the weight of the e-bike wasn't convenient. Can you tell us more about that? (Check all that apply.) The e-bike was heavy to peddle without the assist The e-bike was heavy to lift on a rack, up stairs, etc. The e-bike's weight was noticeable while riding Other ____________________
Q2.6 You felt that the range of the e-bike wasn't sufficient for most of your trips. Can you tell us more about that? (Check all that apply.) The battery would run out on some of my trips I was fearful that the battery would run out on some of my trips As the battery power decreased, the electric assist wasn't as powerful. There were not places to charge the battery at many locations Other ____________________
Q3.1 The e-bike was comfortable to ride: Strongly Disagree Somewhat Disagree Somewhat Agree Strongly Agree
Q3.2 The e-bike was fun to ride: Strongly Disagree Somewhat Disagree Somewhat Agree Strongly Agree
Q3.3 The e-bike was easy to use overall: Strongly Disagree Somewhat Disagree Somewhat Agree Strongly Agree
Q3.5 The e-bike allowed me to go farther/faster than a standard bicycle: Strongly Disagree Somewhat Disagree Somewhat Agree Strongly Agree Don't know
75

Q3.6 The e-bike made me feel more comfortable riding in traffic with cars or other bicycles compared to a standard bicycle: Strongly Disagree Somewhat Disagree Somewhat Agree Strongly Agree Don't know
Q3.7 The e-bike allowed me to keep up with friends or family on bike rides: Strongly Disagree Somewhat Disagree Somewhat Agree Strongly Agree Don't know
Q3.8 Do YOU think that using an e-bike is considered "cheating" compared to riding a standard bicycle? Strongly Disagree Somewhat Disagree Somewhat Agree Strongly Agree Don't know
Q3.9 Do you think OTHER people view using an e-bike as "cheating" compared to riding a standard bicycle? Strongly Disagree Somewhat Disagree Somewhat Agree Strongly Agree Don't know
Q72 Do YOU think e-bikes should be allowed in bicycle lanes? Strongly Disagree Somewhat Disagree Somewhat Agree Strongly Agree Don't know
76

Q73 Do YOU think e-bikes should be allowed on multi-use trails or paths, alongside pedestrians? Strongly Disagree Somewhat Disagree Somewhat Agree Strongly Agree Don't know
Q71 Do YOU think e-bikes should be allowed on dedicated bicycle trails or paths, without pedestrians? Strongly Disagree Somewhat Disagree Somewhat Agree Strongly Agree Don't know
Q3.10 Riding an e-bike is better for the environment than taking a car for the same trip: Strongly Disagree Somewhat Disagree Somewhat Agree Strongly Agree Don't know
Q3.11 Riding an e-bike is better for the environment than taking public transit for the same trip: Strongly Disagree Somewhat Disagree Somewhat Agree Strongly Agree Don't know
Q3.12 Riding an e-bike is better for the environment than riding a standard bicycle for the same trip: Strongly Disagree Somewhat Disagree Somewhat Agree Strongly Agree Don't know
77

Q3.13 Riding an e-bike is better for my health than taking a car for the same trip: Strongly Disagree Somewhat Disagree Somewhat Agree Strongly Agree Don't know
Q3.14 Riding an e-bike is better for my health than taking public transit for the same trip: Strongly Disagree Somewhat Disagree Somewhat Agree Strongly Agree Don't know
Q3.15 Riding an e-bike is better for my health than riding a standard bicycle for the same trip: Strongly Disagree Somewhat Disagree Somewhat Agree Strongly Agree Don't know
Q3.16 After using an e-bike, how have your perceptions of them changed? I view e-bikes more favorably. (Please explain.) ____________________ I view e-bikes less favorably. (Please explain.) ____________________
Q4.1 The following set of questions is about different places you could ride the electric bike. Please tell us how comfortable you would feel biking on the e-bike under these hypothetical scenarios. Please choose the answer that best fits your current feelings and understandings. There is no right or wrong answer to these questions.
Q4.2 A path or trail separated from the street. How comfortable would you be biking the e-bike there? Very uncomfortable Somewhat uncomfortable Somewhat comfortable Very comfortable
Q4.3 A quiet, residential street? Very uncomfortable Somewhat uncomfortable Somewhat comfortable Very comfortable
78

Q4.4 What if that residential street also had bicycle markings, wide speed humps, and other things that slow down and discourage traffic? How comfortable would you be biking there? Very uncomfortable Somewhat uncomfortable Somewhat comfortable Very comfortable
Q4.5 A two-lane neighborhood commercial shopping street with traffic speeds of 25-30 miles per hour, on-street car parking, and no bike lanes. Very uncomfortable Somewhat uncomfortable Somewhat comfortable Very comfortable
Q4.6 What if a striped bike lane was added to the previous street? Very uncomfortable Somewhat uncomfortable Somewhat comfortable Very comfortable
Q4.7 A major suburban street with four lanes, on-street parking, traffic speeds of 30-35 miles per hour, and no bike lane. How comfortable would you be biking there? Very uncomfortable Somewhat uncomfortable Somewhat comfortable Very comfortable
Q4.8 What if that major suburban street also had a wide bike lane separated from traffic by a raised curb or parked cars? Very uncomfortable Somewhat uncomfortable Somewhat comfortable Very comfortable
Q4.9 A major street with two lanes in each direction, a center divider, on-street parking, traffic speeds of 35-40 miles per hour, and no bike lane. Very uncomfortable Somewhat uncomfortable Somewhat comfortable Very comfortable
79

Q4.10 What if a striped bike lane was added to that major street referenced above? Very uncomfortable Somewhat uncomfortable Somewhat comfortable Very comfortable
Q4.11 What if it also had a bike lane separated from traffic by a raised curb or parked cars? Very uncomfortable Somewhat uncomfortable Somewhat comfortable Very comfortable
Q5.1 Were you able to use the e-bike as often as you would have liked? Yes No
Q5.2 What prevented you from using the e-bike as often as you would have liked? (Mark all that apply) Weather conditions I am concerned for my safety Work is too far away from my home I can't carry the things I need Other people rely on me to take my car (children, coworkers, etc.) I don't like to arrive sweaty to work The e-bike is uncomfortable to ride I have physical discomfort after riding (e.g., soreness) I have trouble storing or securing the bicycle Transit connections are not easy or convenient Other ____________________
Q5.3 Did people approach you and ask questions about the e-bike when you were using it? Yes (please describe) ____________________ No
Q5.4 AAA released information that stated the annual cost to own and operate a car is approximately $8,500. Given this information, do you think $2,000 for an e-bike is: Underpriced About right Overpriced Other ____________________
80

Q5.5 How much would you be willing to pay for an e-bike?Please slide the scale to the appropriate dollar amount.______ US Dollars ($)
Q5.6 About how far would an e-bike need to travel on a single charge in order to be useful to you? Up to 5 miles Between 5 and 10 miles Between 10 and 15 miles Between 15 and 20 miles Between 20 and 30 miles More than 30 miles
Q5.7 After using the e-bike for 10 weeks, would you consider purchasing your own? Yes, I would definitely consider purchasing my own. Maybe No, I probably wouldn't purchase my own.
Q5.8 What is the main reason you would not consider purchasing an e-bike? It's too expensive It's not convenient enough or easy enough to use It's not safe enough It doesn't meet my needs I don't enjoy using it I just don't want one Other ____________________
Q5.9 What is the main reason you would consider purchasing an e-bike? It's convenient It's fun It's a cost-effective form of transportation It's a good way to exercise Other ____________________
Q5.10 Should a driver's license be required to operate an e-bike? Yes (please explain): ____________________ No (please explain): ____________________ Not sure
81

Q5.11 After using the e-bike, are you more or less likely to use a standard bicycle for the following trips?
More likely Less likely Neither more nor less likely
Commuting to work/school
Personal errands
Visit family or friends
Entertainment, dining out, or socializing
Exercise or recreation
Q5.12 How often did you feel in conflict with the following traffic types?Never Rarely Sometimes Often All of the
TimeI don't know
Pedestrians
Bicycles
Cars
Bus or semi-truck
Q5.13 Have you ever had an incident or near-miss while riding the e-bike? A "near-miss" is a time when there was a high likelihood of crashing, but you didn't. (Mark all that apply.) Yes - an incident with another road user Yes - an incident with an object or myself No - no incidents at all
Q5.14 The next question(s) ask about incidents that might have occurred while riding your e-bike. For each type of crash, please indicate the severity of your crash(es) and provide information about the other involved road users and/or objects, if any.
82

Q5.15 This question asks about incidents with other road users.Who else was involved? Your injury severity
Motor vehicle
Another cyclist
Pedestrian
None of
theseNone Minor
(scrapes)
Moderate (Bleeding,
deep bruising)
Severe (Trip to
hospital)
Crash with another
road user
Near-miss or close call with another
road user
How many times?
1 2 3 or moreCrash with
another road user
Near-miss or close call with another road
user
Q5.16 Do you think the e-bike significantly contributed to the crash or near-miss with the other road user? Yes (please explain) ____________________ No I don't know
83

Q5.17 This question asks about incidents with objects or yourself.What else was involved?
A roadside object
(tree/pole/parked car/etc.)
A pothole or MAX/Streetcar
tracks
Loose gravel/sand or other
debris
Nothing - I lost control/fell
overNone of these
Crash with a pole, a tree,
or one in which you lost control of the
bike
Other near-miss or close
call
Your injury severity How many times?
None Minor (scrapes)
Moderate (Bleeding,
deep bruising)
Severe (Trip to hospital) 1 2 3 or more
Crash with a pole, a tree,
or one in which you lost control of the
bike
Other near-miss or close
call
Q5.18 Do you think the e-bike significantly contributed to the crash or near-miss with the object or yourself? Yes (please explain) ____________________ No I don't know
84

Q5.19 Do you think the e-bike helped you to avoid potential crashes? Yes (please explain) ____________________ No I don't know
85

Q5.20 How do you agree/disagree with each of the following statements? Consider these statements about a generic intersection. Each statement begins with the words "I might ride through a stop sign or red light if..."
Strongly disagree
Disagree Neither Agree nor Disagree
Agree Strongly Agree
I don't know
... I have stopped first and there is no cross traffic. (red light only)
... another cyclist also runs the red light. (red light only)
... it is raining/snowing and I am cold.
... I am riding with a group of other adults and one of them
does.
... it is dark out.
... I am running late or in a hurry.
... I have been waiting a long time and do not know when I will
receive a green light. (red light only)
... I have already had to stop at lights several times already. (red
light only)
... there is no one around to see me do it.
... I am going uphill or downhill and don't want to lose
momentum.
... I am turning right.
... I know the signal is about to turn green. (red light only)
... I am carrying a heavy backpack, pannier(s), or other load (not
including children).
Q78 Thank you for completing the survey! Now we ask you to provide information about your preferred gift. Please answer the question(s) below.
86

Q74 What type of gift would you like for completing the survey? $10 gift card to Starbucks (delivered to your KP mailbox) $10 gift card to Powell's Books (delivered to your KP mailbox) $10 gift credit on Amazon.com (delivered to your KP mailbox)
87