eprints.whiterose.ac.ukeprints.whiterose.ac.uk/110073/2/mottram_dec_2016... · web viewevaluation...
TRANSCRIPT
Evaluation of Antigens for Development of a Serological Test
for Human African Trypanosomiasis
Sylvain Biéler1*, Harald Waltenberger2, Michael P. Barrett3, Richard McCulloch3, Jeremy C. Mottram3,
Mark Carrington4, Wilhelm Schwaeble5, James McKerrow6,16, Margaret A. Phillips7, Paul A. Michels8,
Philippe Büscher9, Jean-Charles Sanchez10, Richard Bishop11, Derrick R. Robinson12, James Bangs13,17,
Michael Ferguson14, Barbara Nerima15, Audrey Albertini1, Gerd Michel1, Magdalena Radwandska1,18,
Joseph Mathu Ndung’u1
1 Foundation for Innovative New Diagnostics (FIND), Geneva, Switzerland2 Microcoat Biotechnologie GmbH, Bernried, Germany3 Wellcome Trust Centre for Molecular Parasitology, University of Glasgow, Glasgow, United Kingdom4 University of Cambridge, Cambridge, United Kingdom5 University of Leicester, Leicester, United Kingdom6 University of California, San Francisco, California, United States of America7 University of Texas Southwestern Medical Center, Dallas, Texas, United States of America8 Christian de Duve Institute, Brussels, Belgium9 Institute of Tropical Medicine, Antwerp, Belgium10 Biomedical Proteomics Research Group, University of Geneva, Geneva, Switzerland11 International Livestock Research Institute, Nairobi, Kenya12 CNRS UMR-5234, University of Bordeaux, Bordeaux, France13 University of Wisconsin-Madison, Madison, Wisconsin, United States of America14 University of Dundee, Dundee, United Kingdom15 University of Bern, Bern, Switzerland / Makerere University, Kampala, Uganda16 University of California San Diego, San Diego, United States of America (current address)17 University at Buffalo, Buffalo, New York, United States of America (current address)18 Ghent University Global Campus, Incheon, South Korea (current address)
* Corresponding author.
E-mail: [email protected] (SB)
Short title: Evaluation of Candidate Antigens for HAT Serological Test
Page 1 of 37
5
10
15
20
25
30
Abstract
Background
Control and elimination of human African trypanosomiasis (HAT) can be accelerated through the use of
diagnostic tests that are more accurate and easier to deploy. The goal of this work was to evaluate the
immuno-reactivity of antigens and identify candidates to be considered for development of a simple
serological test for the detection of Trypanosoma brucei gambiense or T. b. rhodesiense infections,
ideally both.
Methodology/Principal Findings
The reactivity of 35 antigens was independently evaluated by slot blot and ELISA against sera from both
T. b. gambiense and T. b. rhodesiense infected patients and controls. The antigens that were most
reactive by both tests to T. b. gambiense sera were the membrane proteins VSG LiTat 1.3, VSG LiTat 1.5
and ISG64. Reactivity to T. b. rhodesiense sera was highest with VSG LiTat 1.3, VSG LiTat 1.5 and SRA,
although much lower than with T. b. gambiense samples. The reactivity of all possible combinations of
antigens was also calculated. When the slot blot results of 2 antigens were paired, a VSG LiTat 1.3- ISG75
combination performed best on T. b. gambiense sera, while a VSG LiTat 1.3-VSG LiTat 1.5 combination
was the most reactive using ELISA. A combination of SRA and either VSG LiTat 1.3 or VSG LiTat 1.5 had
the highest reactivity on T. b. rhodesiense sera according to slot blot, while in ELISA, pairing SRA with
either GM6 or VSG LiTat 1.3 yielded the best results.
Conclusions
This study identified antigens that were highly reactive to T. b. gambiense sera, which could be
considered for developing a serological test for gambiense HAT, either individually or in combination.
Page 2 of 37
5
10
15
20
Antigens with potential for inclusion in a test for T. b. rhodesiense HAT were also identified, but because
their reactivity was comparatively lower, a search for additional antigens would be required before
developing a test for this form of the disease.
Introduction
Human African trypanosomiasis (HAT) is a neglected tropical disease targeted by the World Health
Organization (WHO) for elimination by 2020 [1]. Since the late 1990’s its global incidence has been
declining steadily, but it continues to plague impoverished populations in a number of sub-Saharan
African countries. Approximately 70 million people are estimated to be at risk of contracting the disease,
which is generally fatal in the absence of proper diagnosis and treatment [2]. Two parasite sub-species
are responsible for distinct forms of HAT. While Trypanosoma brucei gambiense causes a chronic disease
in central and western Africa, T. b. rhodesiense causes acute infections in eastern Africa.
Diagnosis of gambiense HAT is routinely performed following algorithms that include screening to
identify suspects, confirmation of disease, and staging to guide the choice of treatment [3]. Screening is
an important process, which ensures that relatively complex and labour-intensive parasitological tests for
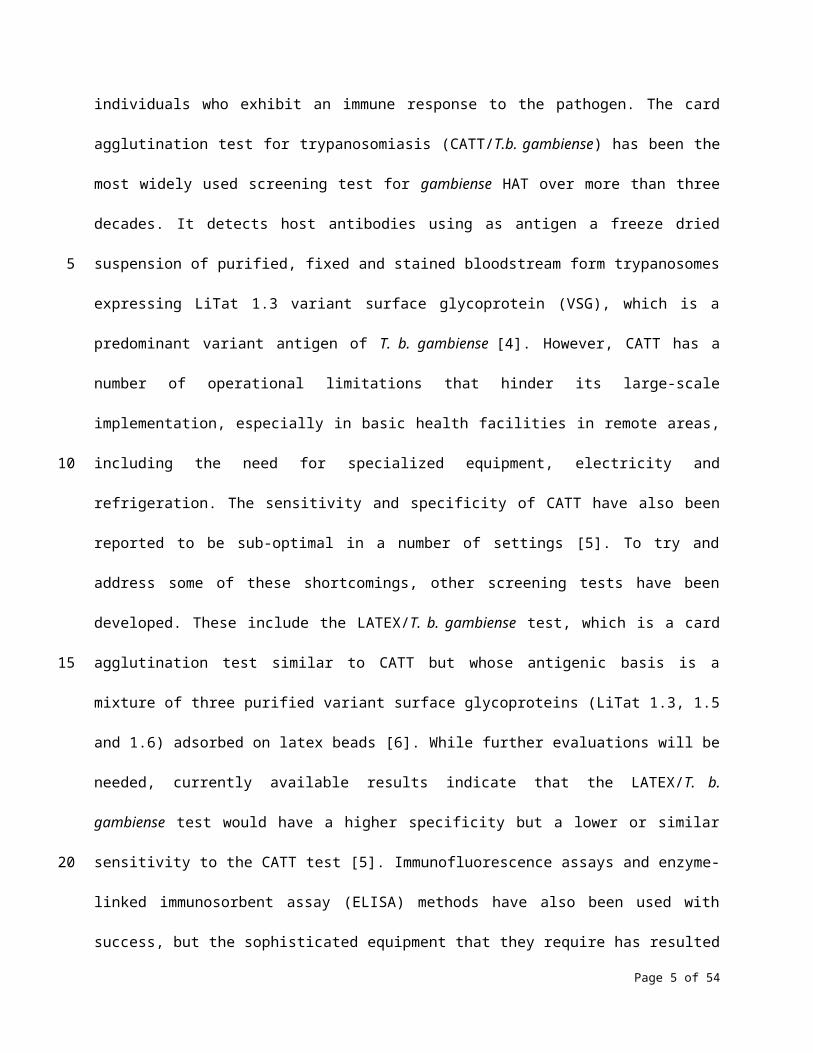
confirmation are only performed on individuals who exhibit an immune response to the pathogen. The
card agglutination test for trypanosomiasis (CATT/T.b. gambiense) has been the most widely used
screening test for gambiense HAT over more than three decades. It detects host antibodies using as
antigen a freeze dried suspension of purified, fixed and stained bloodstream form trypanosomes
expressing LiTat 1.3 variant surface glycoprotein (VSG), which is a predominant variant antigen of T. b.
gambiense [4]. However, CATT has a number of operational limitations that hinder its large-scale
implementation, especially in basic health facilities in remote areas, including the need for specialized
Page 3 of 37
5
10
15
20
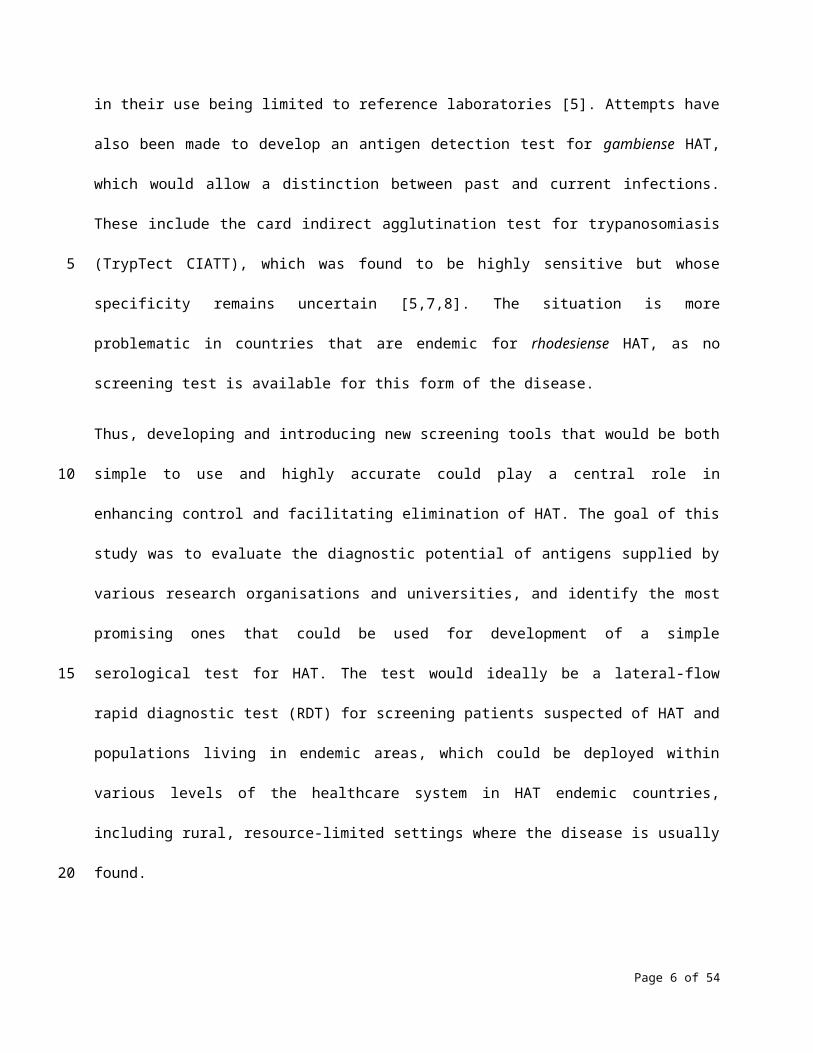
equipment, electricity and refrigeration. The sensitivity and specificity of CATT have also been reported
to be sub-optimal in a number of settings [5]. To try and address some of these shortcomings, other
screening tests have been developed. These include the LATEX/T. b. gambiense test, which is a card
agglutination test similar to CATT but whose antigenic basis is a mixture of three purified variant surface
glycoproteins (LiTat 1.3, 1.5 and 1.6) adsorbed on latex beads [6]. While further evaluations will be
needed, currently available results indicate that the LATEX/T. b. gambiense test would have a higher
specificity but a lower or similar sensitivity to the CATT test [5]. Immunofluorescence assays and enzyme-
linked immunosorbent assay (ELISA) methods have also been used with success, but the sophisticated
equipment that they require has resulted in their use being limited to reference laboratories [5].
Attempts have also been made to develop an antigen detection test for gambiense HAT, which would
allow a distinction between past and current infections. These include the card indirect agglutination test
for trypanosomiasis (TrypTect CIATT), which was found to be highly sensitive but whose specificity
remains uncertain [5,7,8]. The situation is more problematic in countries that are endemic for
rhodesiense HAT, as no screening test is available for this form of the disease.
Thus, developing and introducing new screening tools that would be both simple to use and highly
accurate could play a central role in enhancing control and facilitating elimination of HAT. The goal of this
study was to evaluate the diagnostic potential of antigens supplied by various research organisations and
universities, and identify the most promising ones that could be used for development of a simple
serological test for HAT. The test would ideally be a lateral-flow rapid diagnostic test (RDT) for screening
patients suspected of HAT and populations living in endemic areas, which could be deployed within
various levels of the healthcare system in HAT endemic countries, including rural, resource-limited
settings where the disease is usually found.
Page 4 of 37
5
10
15
20
Materials and Methods
Antigens
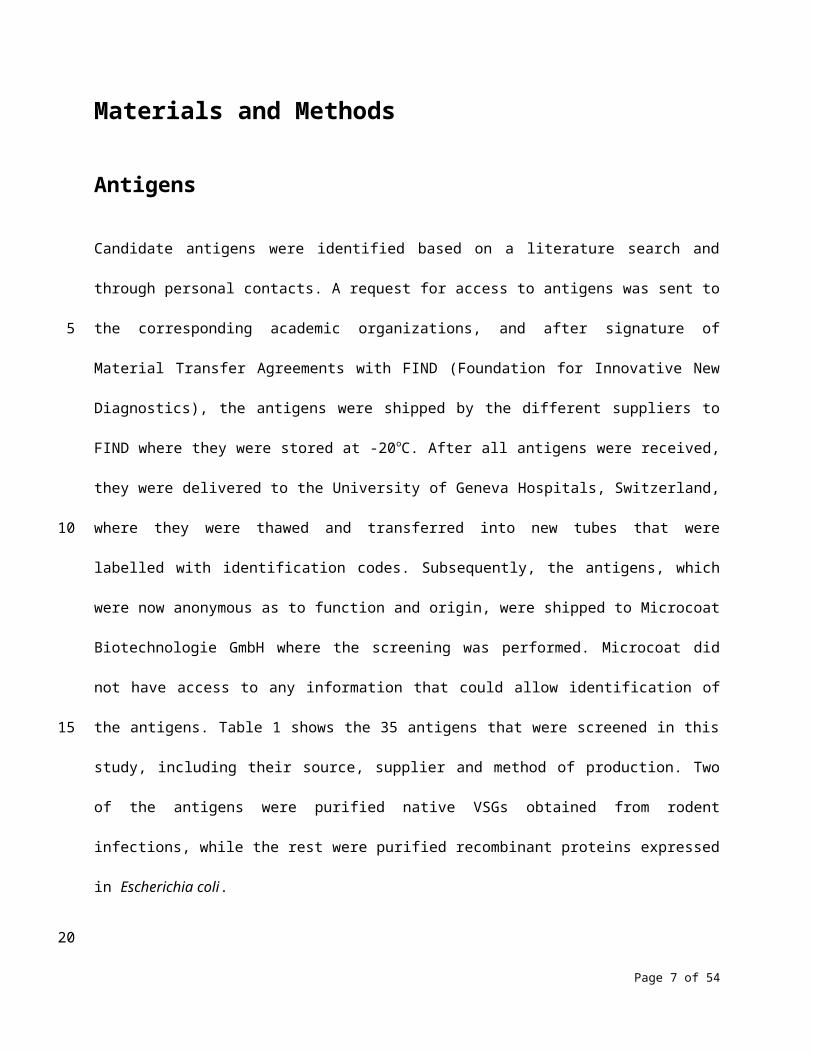
Candidate antigens were identified based on a literature search and through personal contacts. A
request for access to antigens was sent to the corresponding academic organizations, and after signature
of Material Transfer Agreements with FIND (Foundation for Innovative New Diagnostics), the antigens
were shipped by the different suppliers to FIND where they were stored at -20 oC. After all antigens were
received, they were delivered to the University of Geneva Hospitals, Switzerland, where they were
thawed and transferred into new tubes that were labelled with identification codes. Subsequently, the
antigens, which were now anonymous as to function and origin, were shipped to Microcoat
Biotechnologie GmbH where the screening was performed. Microcoat did not have access to any
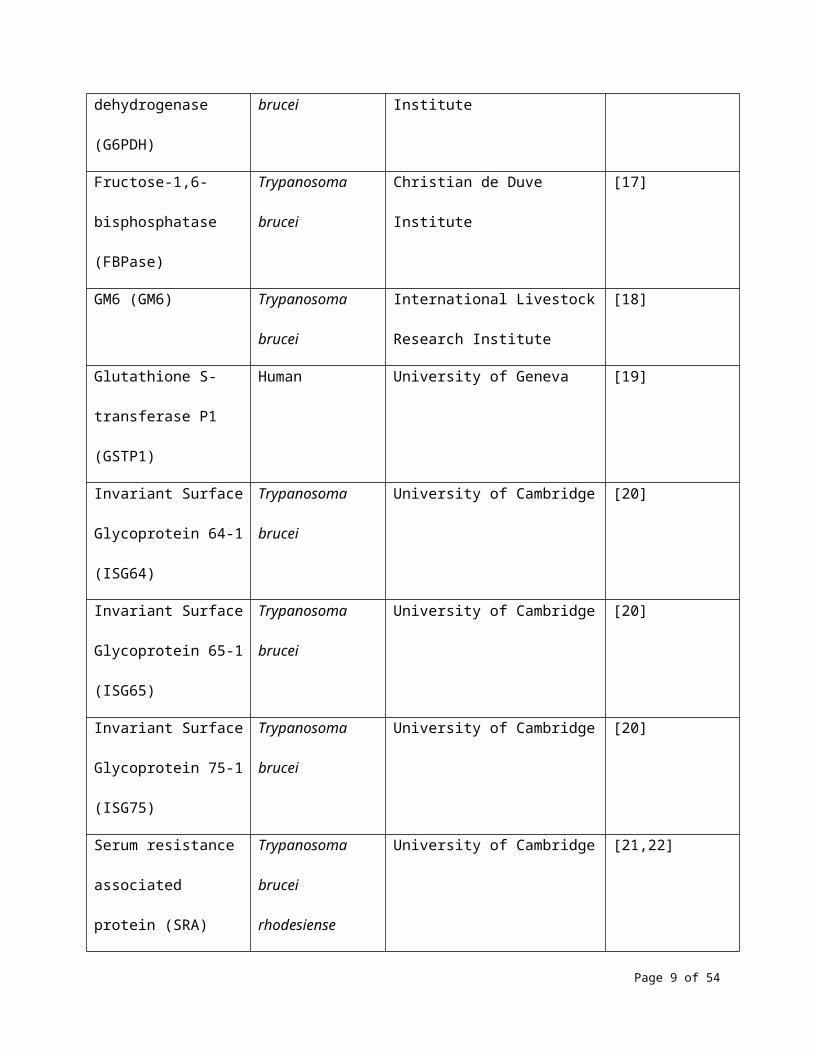
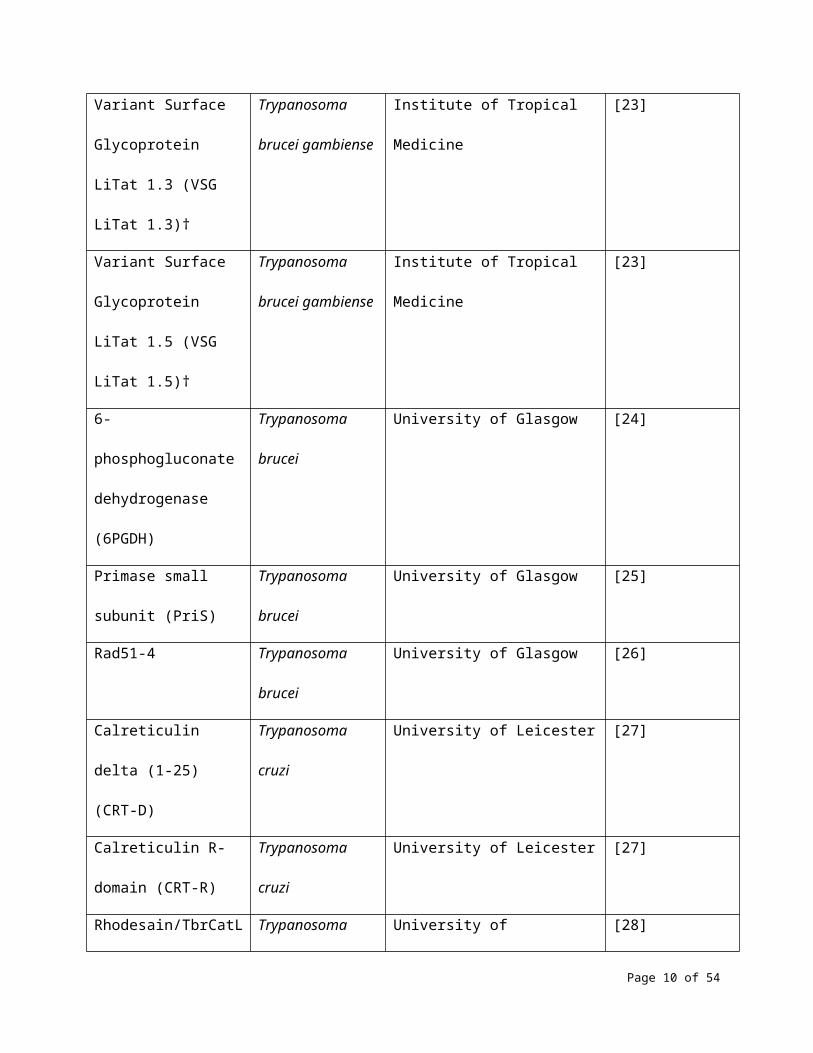
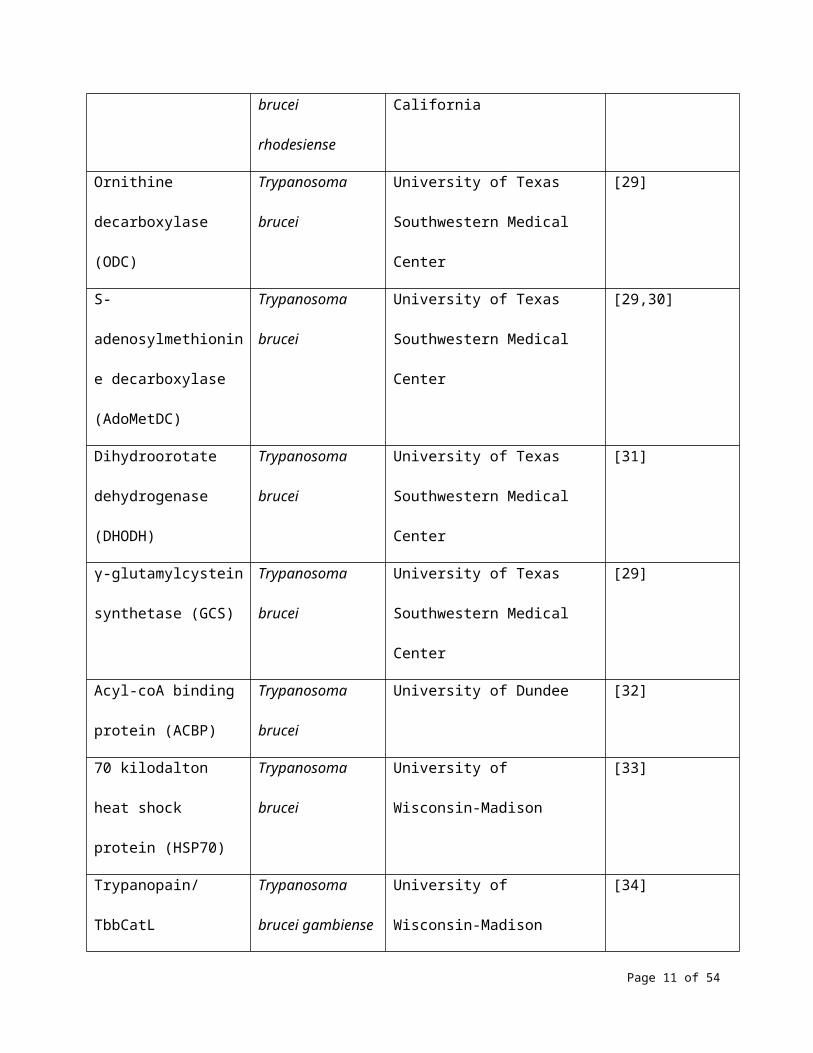
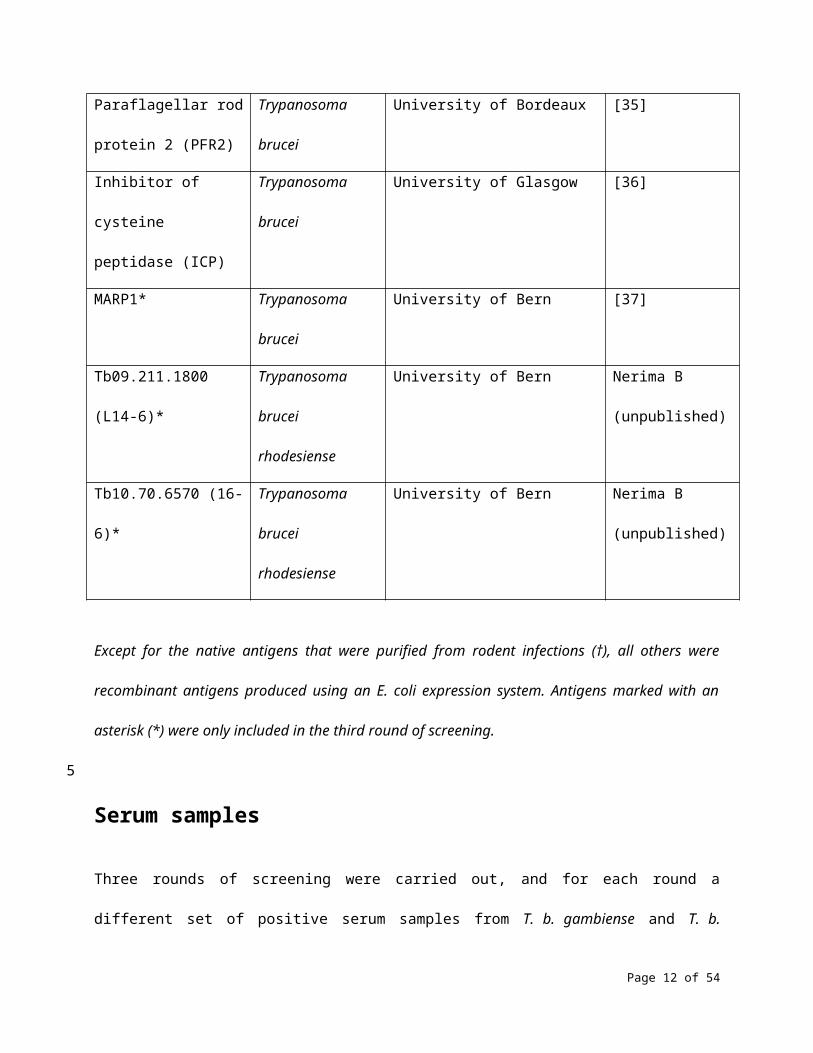
information that could allow identification of the antigens. Table 1 shows the 35 antigens that were
screened in this study, including their source, supplier and method of production. Two of the antigens
were purified native VSGs obtained from rodent infections, while the rest were purified recombinant
proteins expressed in Escherichia coli.
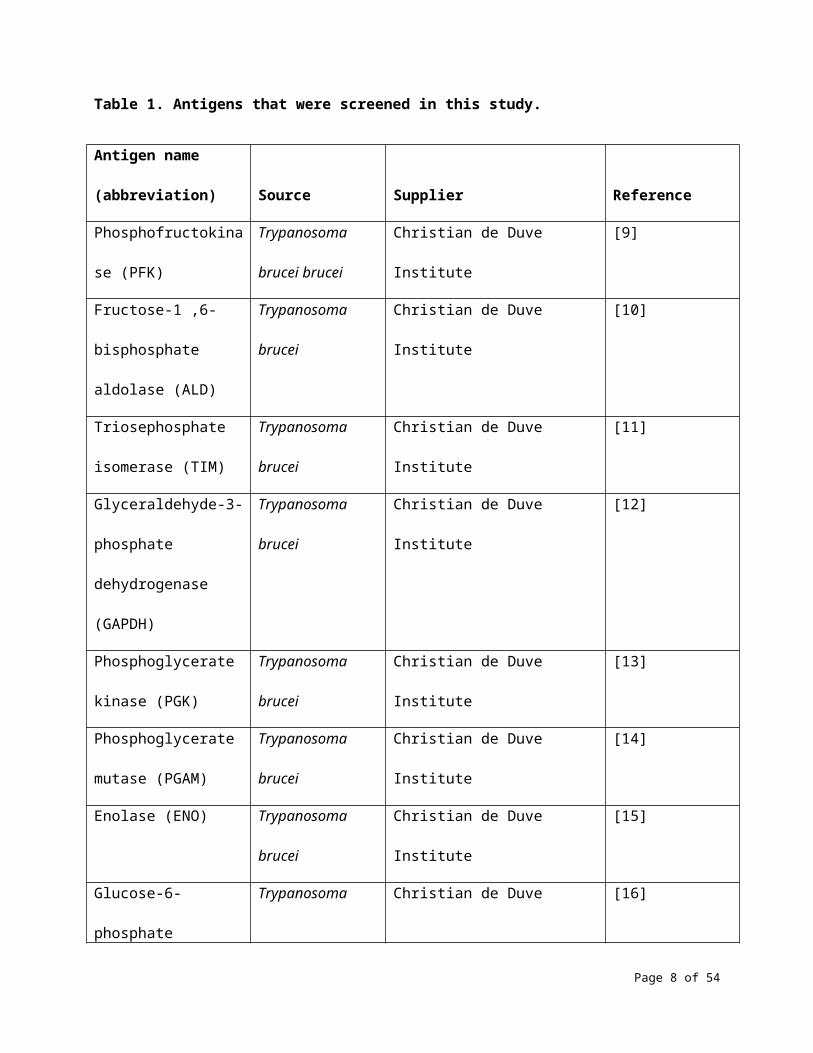
Table 1. Antigens that were screened in this study.
Antigen name
(abbreviation) Source Supplier Reference
Phosphofructokinase
(PFK)
Trypanosoma
brucei brucei
Christian de Duve Institute [9]
Fructose-1 ,6-
bisphosphate aldolase
Trypanosoma Christian de Duve Institute [10]
Page 5 of 37
5
10
15
(ALD) brucei
Triosephosphate
isomerase (TIM)
Trypanosoma
brucei
Christian de Duve Institute [11]
Glyceraldehyde-3-
phosphate
dehydrogenase (GAPDH)
Trypanosoma
brucei
Christian de Duve Institute [12]
Phosphoglycerate kinase
(PGK)
Trypanosoma
brucei
Christian de Duve Institute [13]
Phosphoglycerate
mutase (PGAM)
Trypanosoma
brucei
Christian de Duve Institute [14]
Enolase (ENO) Trypanosoma
brucei
Christian de Duve Institute [15]
Glucose-6-phosphate
dehydrogenase (G6PDH)
Trypanosoma
brucei
Christian de Duve Institute [16]
Fructose-1,6-
bisphosphatase (FBPase)
Trypanosoma
brucei
Christian de Duve Institute [17]
GM6 (GM6) Trypanosoma
brucei
International Livestock Research
Institute
[18]
Glutathione S-
transferase P1 (GSTP1)
Human University of Geneva [19]
Invariant Surface
Glycoprotein 64-1
(ISG64)
Trypanosoma
brucei
University of Cambridge [20]
Invariant Surface Trypanosoma University of Cambridge [20]
Page 6 of 37
Glycoprotein 65-1
(ISG65)
brucei
Invariant Surface
Glycoprotein 75-1
(ISG75)
Trypanosoma
brucei
University of Cambridge [20]
Serum resistance
associated protein (SRA)
Trypanosoma
brucei rhodesiense
University of Cambridge [21,22]
Variant Surface
Glycoprotein LiTat 1.3
(VSG LiTat 1.3)†
Trypanosoma
brucei gambiense
Institute of Tropical Medicine [23]
Variant Surface
Glycoprotein LiTat 1.5
(VSG LiTat 1.5)†
Trypanosoma
brucei gambiense
Institute of Tropical Medicine [23]
6-phosphogluconate
dehydrogenase (6PGDH)
Trypanosoma
brucei
University of Glasgow [24]
Primase small subunit
(PriS)
Trypanosoma
brucei
University of Glasgow [25]
Rad51-4 Trypanosoma
brucei
University of Glasgow [26]
Calreticulin delta (1-25)
(CRT-D)
Trypanosoma cruzi University of Leicester [27]
Calreticulin R-domain
(CRT-R)
Trypanosoma cruzi University of Leicester [27]
Rhodesain/TbrCatL Trypanosoma University of California [28]
Page 7 of 37
brucei rhodesiense
Ornithine decarboxylase
(ODC)
Trypanosoma
brucei
University of Texas Southwestern
Medical Center
[29]
S-adenosylmethionine
decarboxylase
(AdoMetDC)
Trypanosoma
brucei
University of Texas Southwestern
Medical Center
[29,30]
Dihydroorotate
dehydrogenase (DHODH)
Trypanosoma
brucei
University of Texas Southwestern
Medical Center
[31]
γ-glutamylcystein
synthetase (GCS)
Trypanosoma
brucei
University of Texas Southwestern
Medical Center
[29]
Acyl-coA binding protein
(ACBP)
Trypanosoma
brucei
University of Dundee [32]
70 kilodalton heat shock
protein (HSP70)
Trypanosoma
brucei
University of Wisconsin-Madison [33]
Trypanopain/TbbCatL Trypanosoma
brucei gambiense
University of Wisconsin-Madison [34]
Paraflagellar rod protein
2 (PFR2)
Trypanosoma
brucei
University of Bordeaux [35]
Inhibitor of cysteine
peptidase (ICP)
Trypanosoma
brucei
University of Glasgow [36]
MARP1* Trypanosoma
brucei
University of Bern [37]
Tb09.211.1800 (L14-6)* Trypanosoma
brucei rhodesiense
University of Bern Nerima B
(unpublished)
Page 8 of 37
Tb10.70.6570 (16-6)* Trypanosoma
brucei rhodesiense
University of Bern Nerima B
(unpublished)
Except for the native antigens that were purified from rodent infections (†), all others were recombinant
antigens produced using an E. coli expression system. Antigens marked with an asterisk (*) were only
included in the third round of screening.
Serum samples
Three rounds of screening were carried out, and for each round a different set of positive serum samples
from T. b. gambiense and T. b. rhodesiense HAT cases, and negative controls were used. T. b. gambiense
HAT cases were defined as patients who were positive by CATT and positive by any of the microscopy
methods in routine use. T. b. rhodesiense HAT cases were defined as positive by any of the microscopy
methods in routine use. Controls were negative by CATT (for samples collected in T. b. gambiense
endemic regions) and by microscopy.
For the first round of screening, serum samples from 40 T. b. gambiense HAT cases (collected between
2002 and 2004) and 60 controls (including 50 samples collected in 2004 from HAT endemic regions and
10 from European donors) were supplied by the Institute of Tropical Medicine (ITM, Antwerp, Belgium).
Serum samples from 10 T. b. rhodesiense HAT cases collected between 1990 and 2003 in Uganda were
supplied by the National Livestock Resources Research Institute (NALIRRI, Tororo, Uganda); due to
logistical challenges, these samples were thawed during transport and arrived at Microcoat at room
temperature. For the second round, the same controls were used as in the first round, while NALIRRI
supplied new sera from 35 T. b. gambiense HAT (collected in Uganda between 1998 and 2006) and 20 T.
b. rhodesiense HAT cases (collected in Uganda between 2003 and 2008). Western blot and probing with
Page 9 of 37
5
10
15
20
an anti-human IgG conjugate revealed that nine of the T. b. gambiense HAT samples that were obtained
from NALIRRI for the second round were significantly degraded, but these were kept in the study. The
third round of screening was carried out using serum samples that were collected in 2008 and 2009 from
150 T. b. gambiense HAT cases, 33 T. b. rhodesiense HAT cases and 143 controls from a T. b. gambiense
endemic region, which were obtained from the HAT Specimen Bank of the WHO.
Serum samples from the HAT Specimen Bank of the WHO were collected after approval by the WHO
Research Ethics Review Committee and written informed consent from all participants. The samples from
HAT endemic countries supplied by ITM were collected in 2004 during routine screening of patients by
the national HAT control programs of the Democratic Republic of the Congo (DRC) and of Benin, for
which ethical approval or informed consent was not required. The samples from European donors
supplied by ITM were obtained in 2002 from the Red Cross for development of an RDT, and no
information about ethical clearance could be found. The samples from NALIRRI were collected in Uganda
between 1990 and 2008, and information about ethical approval for their collection could not be found.
Slot blot
Slot blotting was used to test the reactivity of antigens as this method uses a matrix (nitrocellulose) that
is close to the membrane of an RDT and is therefore expected to provide information that is directly
related to the performance of an RDT. One μg of each antigen was transferred onto a 0.2 μm
nitrocellulose membrane (Protran BA 83, Schleicher & Schüll) using a filtration manifold system
(Whatman). The membrane was washed twice with Tris-buffered saline (TBS) pH 7.6 and incubated in
blocking buffer (TBS, 1% PVP, 0.1% Tween 20, 5% bovine serum albumin) for 1.5 hours at room
temperature. The serum sample was diluted 1:250 in phosphate buffered saline (PBS) supplemented
with 5 mg/ml E. coli lysate and left to stand for 30 minutes (15 minutes in the first round of screening) at
room temperature. The membrane was then incubated with the diluted serum for 1 hour at room
Page 10 of 37
5
10
15
20
temperature, and washed 3 times for 5 minutes in TBS-T (TBS supplemented with 0.1% Tween 20). This
was followed by incubation for 30 minutes at room temperature with a goat anti-human IgG (Jackson
Immuno Research Nr. 109-036-098) or IgM (Jackson Immuno Research Nr. 109-035-129) horseradish
peroxidase (HRP) conjugate diluted at 0.01 µg/ml (0.02 µg/ml in the first round of screening) in blocking
buffer. It was then washed 3 times for 5 minutes in TBS-T and 3 times for 5 minutes in water. Finally, the
membrane was incubated for 3 minutes at 21°C with precipitating tetramethylbenzidine (TMB) (Sigma)
and washed with water. The resulting reaction bands were analysed in duplicate using a flatbed scanner
and the Tina 2.09 software, and the ratio of the densitometric value (optical density/mm 2) of each
reactive band to the background calculated. The three rounds of testing were performed in 2007, 2008
and 2009, respectively.
ELISA
In addition to slot blot, ELISA testing was included as this method is more suitable in providing accurate
quantitative data. Polystyrene microplates (Nunc MaxiSorp) were coated by adding 120 µl of antigen at a
concentration of 10 µg/ml into each well and incubating for 16 hours at 20°C without shaking. They were
then washed with PBS and incubated with blocking buffer (2.5% bovine serum albumin, 2.5% casein in
PBS) for 1 hour at room temperature with shaking. After pre-incubating with E. coli lysate as described
above, 100 µl of a serum sample diluted 1:250 in PBS was added and incubated for 1 hour at room
temperature with shaking. The plates were washed three times with 300 µl/well of TBS-T, then 100 µl of
anti-human IgG HRP conjugate diluted 1:160,000 in blocking buffer was added and incubated for 30
minutes at room temperature with shaking. This was followed by three rounds of washing with TBS-T at
300 µl/well, then 100 µl of TMB was added and incubated for 10 minutes at room temperature with
shaking. The reaction was stopped by adding 50 µl of 1M H2SO4 and incubating for 1 minute at room
temperature with shaking. The optical density was measured at 450 and 690 nm. The antigens were
Page 11 of 37
5
10
15
20
evaluated based on the absolute value of the signal as long as the signal to noise ratio was above 5:1,
and otherwise were recorded as having no reactivity.
Data analysis
An individual cut-off for each antigen and for each method (slot blot or ELISA) was calculated as the
mean value obtained using all the control sera plus two standard deviations. The reactivity of each
antigen was expressed as the percentage of samples from HAT cases for which the value was above the
cut-off. Antigens were analyzed in duplicate, and the mean value recorded. In addition, Receiver
Operating Characteristic (ROC) analysis was performed using the MedCalc statistical software (MedCalc
Software bvba) to compute the sensitivity and specificity of each antigen by varying the cut-off. Youden’s
index was calculated to evaluate accuracy [38].
Results
The reactivity of 32 antigens against IgG and IgM in samples from HAT cases was evaluated by slot
blotting in the first round of screening (Fig 1). There was a significant difference in the IgG and IgM
reactivity of samples from T. b. gambiense cases. While the three most reactive antigens to IgG were
ISG64 (100%), ISG65 (100%) and VSG LiTat 1.3 (100%), IgM reactivity was highest to GSTP1 (90%), ALD
(85%) and Rad51-4 (85%). The three antigens that performed best with IgG (100%) only ranked 9 th, 19th
and 28th with IgM. When the 14 best antigens were compared, the percentage reactivity was higher with
IgG than with IgM (9% higher on average).
Page 12 of 37
5
10
15
20
Fig 1. Percentage IgG (A) and IgM (B) reactivity of 32 antigens on sera from T. b. gambiense HAT cases
(N=40) assessed by slot blot (first round of screening). Antigens are shown in descending order of
reactivity. Antigens marked with an asterisk (*) were only partially soluble.
The results of testing the antigens on T. b. rhodesiense HAT samples are shown in Fig 2. Two of the
antigens that performed best in reactivity to either IgG or IgM (ISG64 and ISG65, and GSTP1 and ALD,
respectively) were also the best on T. b. gambiense HAT samples. The performance of other less reactive
antigens exhibited some differences when the results of the two sets of HAT sera were compared,
although the overall ranking was quite similar. The reactivity was on average higher with T. b. gambiense
than with T. b. rhodesiense HAT samples (by 5.1% and 2.7% with IgG and IgM, respectively).
Fig 2. Percentage IgG (A) and IgM (B) reactivity of 32 antigens on sera from T. b. rhodesiense HAT cases
(N=10) assessed by slot blot (first round of screening). Antigens are shown in descending order of
reactivity. Antigens marked with an asterisk (*) were only partially soluble.
A new set of 18 antigens was included in the second round of screening. These included 14 that in the
first round of screening had an IgG reactivity higher than 50% on patient sera, and 4 that were only
partially soluble in the first round of screening. As the IgG reactivity to T. b. gambiense sera in the first
round of screening was higher than IgM reactivity, and given that IgG molecules are more stable and
therefore more suitable for developing a diagnostic test than IgM, subsequent rounds of screening
included testing for IgG only. It was also assumed that detection of IgG would be more suitable in
screening for T. b. gambiense HAT due to the chronic nature of this form of the disease. In addition to
Page 13 of 37
5
10
15
20
slot blots, antigens were also screened by ELISA in this second round in order to generate quantitative
results.
The reactivity of antigens to T. b. gambiense sera was higher using ELISA (Fig 3B) than by slot blot (Fig
3A), with an average difference of 14%. The three best antigens with both methods were VSG LiTat 1.3,
VSG LiTat 1.5 and ISG64, although their ranking was different. ISG64 performed best (71%) in ELISA
followed by VSG LiTat 1.3 (69%) and VSG LiTat 1.5 (69%), while VSG LiTat 1.3 was the best (60%) in slot
blot, followed by VSG LiTat 1.5 (49%) and ISG64 (40%). Significant differences were observed in the
ranking of the other antigens depending on the test method that was used. For example, while PFK was
the fifth best antigen by slot blot, it was only the 17th by ELISA.
Fig 3. Percentage IgG reactivity of 18 antigens on sera from T. b. gambiense HAT cases (N=35) assessed
by slot blot (A) and by ELISA (B) (second round of screening). Antigens are shown in descending order of
reactivity.
The results of screening antigens on T. b. rhodesiense sera are shown in Fig 4. As observed with T. b.
gambiense sera, the antigens performed differently depending on the test method used. Using slot
blotting, VSG LiTat 1.3 (80%) had the highest reactivity, followed by SRA (75%) and VSG LiTat 1.5 (65%).
By ELISA, SRA performed best (85%), followed by ISG65 (65%) and ISG64 (60%). The percentage reactivity
by slot blot was on average 16.6% higher with T. b. rhodesiense than with T. b. gambiense cases, which
was unlike the observations obtained in the first round of screening. By contrast, reactivity by ELISA was
on average 4.2% lower with T. b. rhodesiense than with T. b. gambiense sera. SRA was the antigen that
exhibited the greatest difference in reactivity between the two disease forms. While the reactivity of SRA
by slot blot was 75% with T. b. rhodesiense, it was only 17% with T. b. gambiense.
Page 14 of 37
5
10
15
20
Fig 4. Percentage IgG reactivity of 18 antigens on sera from T. b. rhodesiense HAT cases (N=10)
assessed by slot blot (A) and by ELISA (B) (second round of screening). Antigens are shown in
descending order of reactivity.
The third round of screening was carried out using a larger collection of clinical samples, in order to
generate more significant data on the most promising antigens using both slot blot and ELISA. Thirteen
antigens, including 10 that had the highest reactivity on patient sera in the second round (results of both
slot blot and ELISA combined), and 3 new ones (MARP1, L14-6 and 16-6) were screened in this round.
The 3 new antigens were supplied after the first two rounds of screening had been completed. Fig 5
illustrates that when the antigens were screened using T. b. gambiense sera, the three best antigens
using both tests were the same as in the second round. Using slot blot, VSG LiTat 1.3 performed best
(91%) followed by VSG LiTat 1.5 (81%) and ISG64 (70%), while by ELISA, VSG LiTat 1.5 was first (92%)
followed by VSG LiTat 1.3 (82%) and ISG64 (48%). The next three antigens behaved in a similar manner
with both tests, but in a different order. Using slot blot, ISG65 (37%) was followed by GM6 (28%) and
ISG75 (24%), while by ELISA, GM6 (28%) was followed by ISG65 (25%) and ISG75 (9%).
Fig 5. Percentage IgG reactivity of 13 antigens on sera from T. b. gambiense HAT cases (N=150)
assessed by slot blot (A) and by ELISA (B) (third round of screening). Antigens are shown in descending
order of reactivity.
When the antigens were screened using T. b. rhodesiense sera, the three best antigens were the same
ones irrespective of the test used (Fig 6). These were also the same antigens as observed in the second
Page 15 of 37
5
10
15
20
round of screening by slot blotting. According to slot blotting, VSG LiTat 1.5 (45%) was followed by VSG
LiTat 1.3 (39%) and SRA (39%). By ELISA, SRA performed best (39%), followed by VSG LiTat 1.3 (33%) and
VSG LiTat 1.5 (27%). In a similar manner to what was observed when the results of the first round of
screening were compared, the average percentage reactivity by slot blot and by ELISA was higher with T.
b. gambiense than with T. b. rhodesiense sera, with differences of 11.2% and 10.1%, respectively.
Fig 6. Percentage IgG reactivity of 13 antigens on sera from T. b. rhodesiense HAT cases (N=33)
assessed by slot blot (A) and by ELISA (B) (third round of screening). Antigens are shown in descending
order of reactivity.
ROC analysis of the results obtained by ELISA shows that among the 13 antigens in the third round of
screening, the highest accuracy for T. b. gambiense was achieved using VSG LiTat 1.5 (93%), followed by
VSG LiTat 1.3 (79%) and ISG64 (67%) (Table 2). This analysis also indicates that if a sensitivity of 90% is
considered to be acceptable, using VSG LiTat 1.5 would result in a specificity as high as 98%. Conversely,
if specificity is set at 90%, a sensitivity of 97% can be reached with this antigen. VSG LiTat 1.3 could also
be used to develop a test with a high specificity, but due to the lower accuracy of this antigen, there
would be a stronger trade-off in sensitivity. For example, a specificity of 97% could be achieved using VSG
LiTat 1.3 with a sensitivity of 70%. Using the less accurate ISG64 antigen would only result in a specificity
of 91% with a sensitivity of 70%.
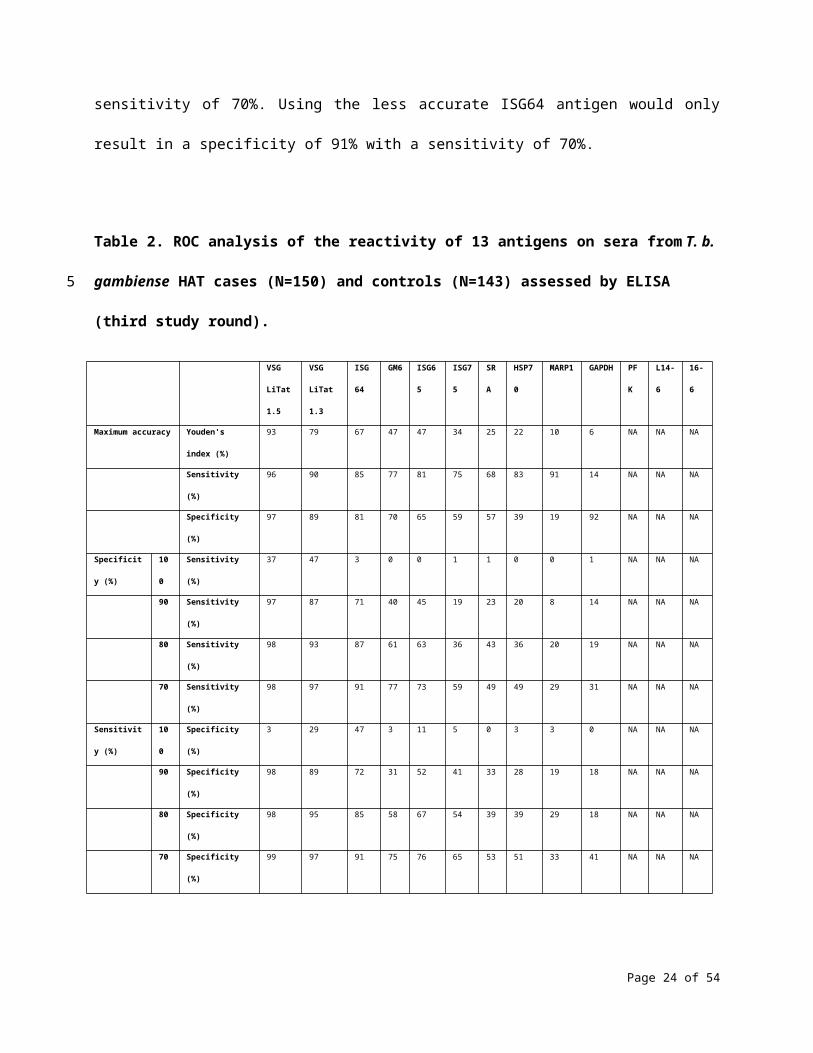
Table 2. ROC analysis of the reactivity of 13 antigens on sera from T. b. gambiense HAT cases (N=150)
and controls (N=143) assessed by ELISA (third study round).
Page 16 of 37
5
10
15
20
VSG
LiTat 1.5
VSG
LiTat 1.3
ISG64 GM
6
ISG65 ISG75 SRA HSP70 MARP1 GAPDH PFK L14-6 16-6
Maximum accuracy Youden's index (%) 93 79 67 47 47 34 25 22 10 6 NA NA NA
Sensitivity (%) 96 90 85 77 81 75 68 83 91 14 NA NA NA
Specificity (%) 97 89 81 70 65 59 57 39 19 92 NA NA NA
Specificity (%) 100 Sensitivity (%) 37 47 3 0 0 1 1 0 0 1 NA NA NA
90 Sensitivity (%) 97 87 71 40 45 19 23 20 8 14 NA NA NA
80 Sensitivity (%) 98 93 87 61 63 36 43 36 20 19 NA NA NA
70 Sensitivity (%) 98 97 91 77 73 59 49 49 29 31 NA NA NA
Sensitivity (%) 100 Specificity (%) 3 29 47 3 11 5 0 3 3 0 NA NA NA
90 Specificity (%) 98 89 72 31 52 41 33 28 19 18 NA NA NA
80 Specificity (%) 98 95 85 58 67 54 39 39 29 18 NA NA NA
70 Specificity (%) 99 97 91 75 76 65 53 51 33 41 NA NA NA
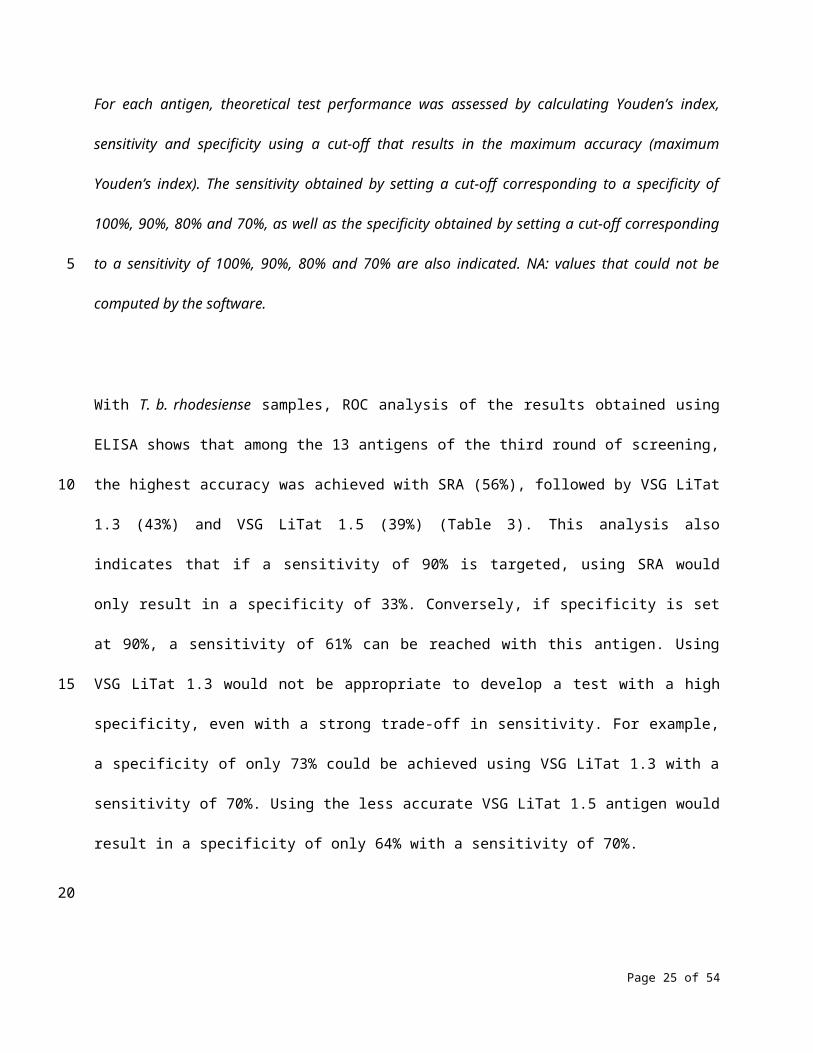
For each antigen, theoretical test performance was assessed by calculating Youden’s index, sensitivity and
specificity using a cut-off that results in the maximum accuracy (maximum Youden’s index). The
sensitivity obtained by setting a cut-off corresponding to a specificity of 100%, 90%, 80% and 70%, as well
as the specificity obtained by setting a cut-off corresponding to a sensitivity of 100%, 90%, 80% and 70%
are also indicated. NA: values that could not be computed by the software.
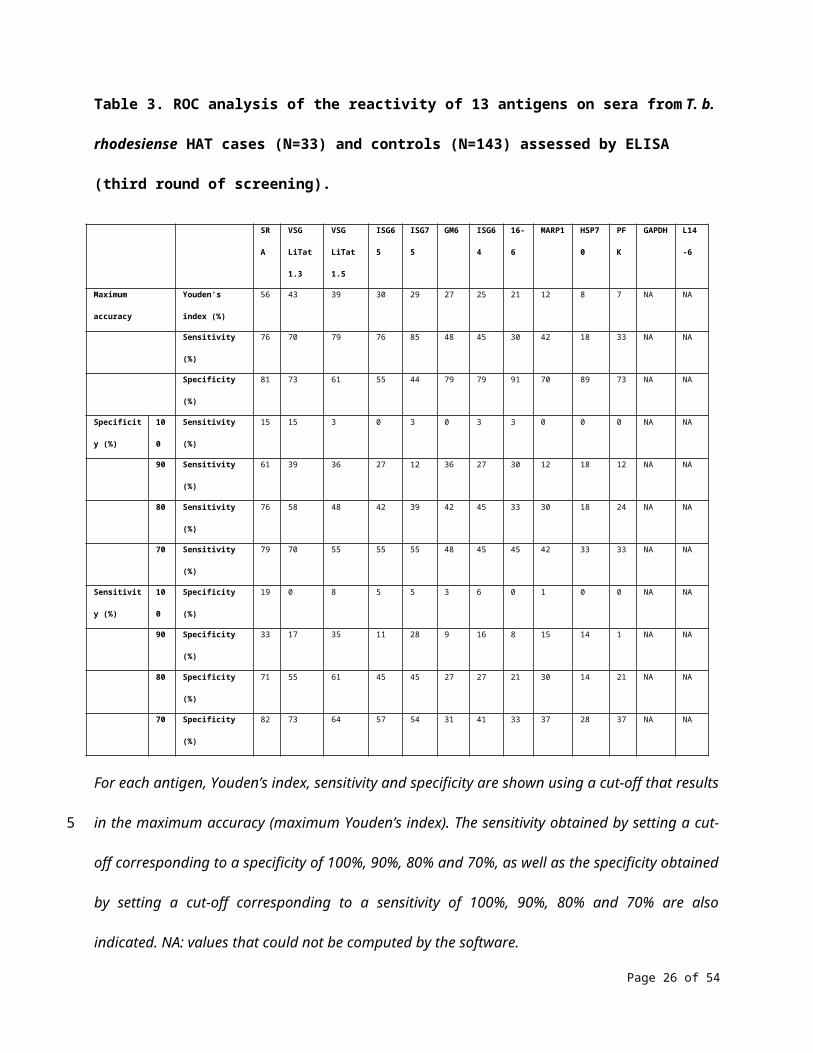
With T. b. rhodesiense samples, ROC analysis of the results obtained using ELISA shows that among the
13 antigens of the third round of screening, the highest accuracy was achieved with SRA (56%), followed
by VSG LiTat 1.3 (43%) and VSG LiTat 1.5 (39%) (Table 3). This analysis also indicates that if a sensitivity of
90% is targeted, using SRA would only result in a specificity of 33%. Conversely, if specificity is set at 90%,
a sensitivity of 61% can be reached with this antigen. Using VSG LiTat 1.3 would not be appropriate to
develop a test with a high specificity, even with a strong trade-off in sensitivity. For example, a specificity
Page 17 of 37
5
10
of only 73% could be achieved using VSG LiTat 1.3 with a sensitivity of 70%. Using the less accurate VSG
LiTat 1.5 antigen would result in a specificity of only 64% with a sensitivity of 70%.
Table 3. ROC analysis of the reactivity of 13 antigens on sera from T. b. rhodesiense HAT cases (N=33)
and controls (N=143) assessed by ELISA (third round of screening).
SRA VSG
LiTat 1.3
VSG
LiTat 1.5
ISG65 ISG75 GM6 ISG64 16-6 MARP1 HSP70 PFK GAPDH L14-6
Maximum accuracy Youden's index (%) 56 43 39 30 29 27 25 21 12 8 7 NA NA
Sensitivity (%) 76 70 79 76 85 48 45 30 42 18 33 NA NA
Specificity (%) 81 73 61 55 44 79 79 91 70 89 73 NA NA
Specificity (%) 100 Sensitivity (%) 15 15 3 0 3 0 3 3 0 0 0 NA NA
90 Sensitivity (%) 61 39 36 27 12 36 27 30 12 18 12 NA NA
80 Sensitivity (%) 76 58 48 42 39 42 45 33 30 18 24 NA NA
70 Sensitivity (%) 79 70 55 55 55 48 45 45 42 33 33 NA NA
Sensitivity (%) 100 Specificity (%) 19 0 8 5 5 3 6 0 1 0 0 NA NA
90 Specificity (%) 33 17 35 11 28 9 16 8 15 14 1 NA NA
80 Specificity (%) 71 55 61 45 45 27 27 21 30 14 21 NA NA
70 Specificity (%) 82 73 64 57 54 31 41 33 37 28 37 NA NA
For each antigen, Youden’s index, sensitivity and specificity are shown using a cut-off that results in the
maximum accuracy (maximum Youden’s index). The sensitivity obtained by setting a cut-off
corresponding to a specificity of 100%, 90%, 80% and 70%, as well as the specificity obtained by setting a
cut-off corresponding to a sensitivity of 100%, 90%, 80% and 70% are also indicated. NA: values that
could not be computed by the software.
Page 18 of 37
5
10
While the performance of some antigens in detecting T. b. gambiense HAT was very promising,
combining two antigens in one test could theoretically result in a diagnostic sensitivity that is even
higher. The results obtained in the third round of screening of 13 antigens were used to compute 78
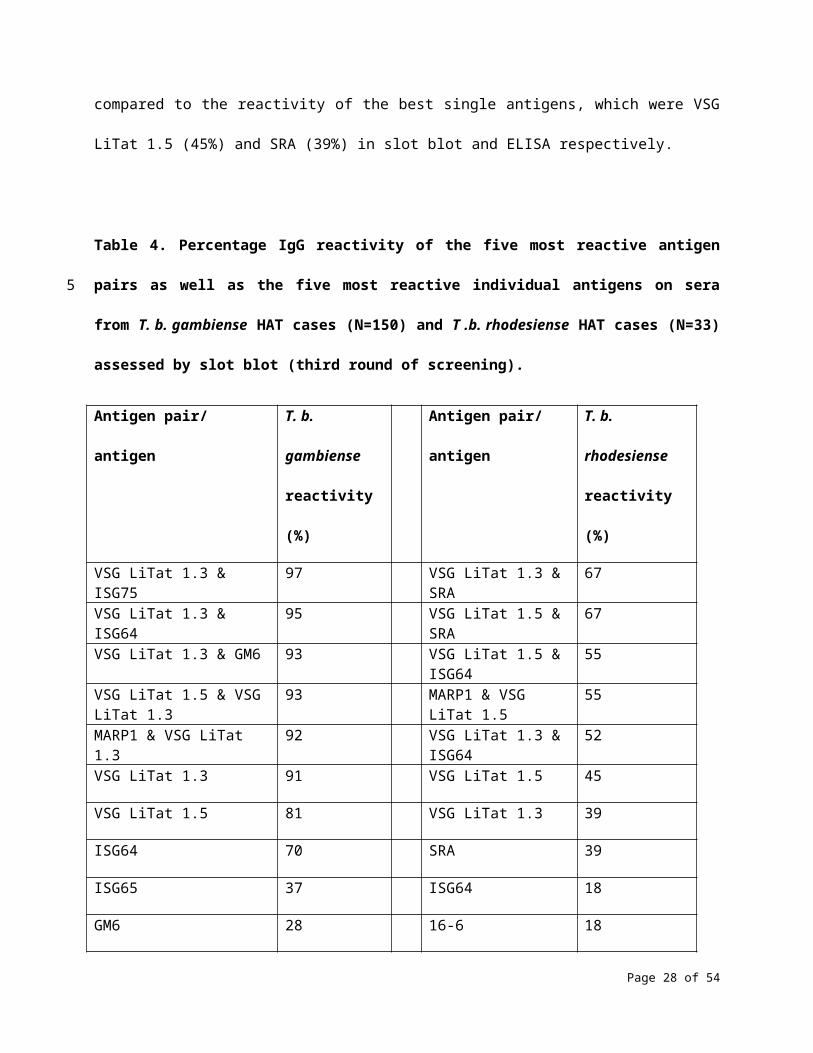
possible antigen pairs that could be used to develop hypothetical tests. A combination of VSG LiTat 1.3,
which detected 91% of the T. b. gambiense sera (Fig 3A) and ISG75 resulted in the highest reactivity
(97%) using slot blot (Table 4 and S1 Table). This was followed by VSG LiTat 1.3 combined with ISG64
(95%) and by VSG LiTat 1.3 combined with either GM6 or VSG LiTat 1.5 (93%). Using ELISA (S2 Table), the
best antigen pair to detect T. b. gambiense sera was VSG LiTat 1.5 and VSG LiTat 1.3 (95%), followed by
VSG LiTat 1.5 and 16-6 (94%), and by VSG LiTat 1.5 combined with either GM6 or ISG64 (93%). The
reactivity of these pairs in ELISA was higher than using VSG LiTat 1.5 alone (92%, Fig 3B).
A combination of antigens also resulted in a stronger reactivity on T. b. rhodesiense sera. Reactivity
increased to 67% when SRA was combined with either VSG LiTat 1.3 or VSG LiTat 1.5 in slot blot (Table 4
and S3 Table), and to 61% when SRA was combined with either GM6 or VSG LiTat 1.3 in ELISA (S4 Table).
These were significant improvements when compared to the reactivity of the best single antigens, which
were VSG LiTat 1.5 (45%) and SRA (39%) in slot blot and ELISA respectively.
Table 4. Percentage IgG reactivity of the five most reactive antigen pairs as well as the five most
reactive individual antigens on sera from T. b. gambiense HAT cases (N=150) and T .b. rhodesiense HAT
cases (N=33) assessed by slot blot (third round of screening).
Antigen pair/ antigen T. b. gambiense
reactivity (%)
Antigen pair/ antigen T. b. rhodesiense
reactivity (%)
Page 19 of 37
5
10
15
20
VSG LiTat 1.3 & ISG75 97 VSG LiTat 1.3 & SRA 67
VSG LiTat 1.3 & ISG64 95 VSG LiTat 1.5 & SRA 67
VSG LiTat 1.3 & GM6 93 VSG LiTat 1.5 & ISG64 55
VSG LiTat 1.5 & VSG LiTat 1.3 93 MARP1 & VSG LiTat 1.5 55
MARP1 & VSG LiTat 1.3 92 VSG LiTat 1.3 & ISG64 52
VSG LiTat 1.3 91 VSG LiTat 1.5 45
VSG LiTat 1.5 81 VSG LiTat 1.3 39
ISG64 70 SRA 39
ISG65 37 ISG64 18
GM6 28 16-6 18
Antigen pairs and individual antigens are shown in descending order of reactivity.
Discussion
This study comprised the first systematic, independent assessment of the diagnostic potential of a large
panel of antigens that could potentially be used for development of a rapid diagnostic test (RDT) for HAT.
Since this work was completed, a number of RDTs have actually been developed, and are briefly
discussed below. A number of very promising antigens were identified, both for gambiense and for
rhodesiense HAT. While there were many similarities in the results of the three rounds of screening,
there were also a number of important differences, both in the ranking of antigens and in their absolute
reactivity. The reactivity of the best antigens was significantly higher in the first and third rounds than in
the second round, and differences between antigens were also more pronounced in the third round.
These differences between study rounds might be explained by two factors. First, the sample size was
Page 20 of 37
5
10
significantly larger in the third round compared to other rounds, which enabled more accurate
measurements. Second, the clinical samples used in the first and second rounds had been stored for
lengthy periods, during which they could have gone through multiple unknown cycles of freezing and
thawing, which could have caused some loss of immunoreactivity. Significant degradation was in fact
observed in some of the samples that were supplied for the second round. This may have resulted in a
biased assessment of the reactivity of some antigens and possibly exclusion of some of them from
subsequent rounds. By contrast, samples used in the third round were collected recently, and subjected
to a maximum of two rounds of freezing and thawing. Therefore, results from the third round of testing
should be considered as a more reliable indicator of the reactivity of antigens. Also, results obtained with
gambiense samples are likely to be more reliable than those obtained with rhodesiense, as they were
based on a much larger sample set.
The antigens that were most reactive were proteins that are known to be localized extracellularly, on the
surface of parasites, which may explain why strong immunoreactivity was observed in plasma samples
from infected patients. In particular, VSG LiTat 1.3 and VSG LiTat 1.5, which belong to the group of VSGs
that cover the external surface of the bloodstream form of T. brucei [39], were found to be the two most
reactive antigens against gambiense samples, and among the three most reactive antigens against
rhodesiense samples. Noteworthy, T. b. gambiense clones expressing these VSGs were also among the
most sensitive for detecting gambiense patients using immune trypanolysis [40]. However, VSGs have
been reported to exhibit some heterogeneity in their expression among parasite isolates, and could
therefore present a risk in terms of sensitivity if they are included in a diagnostic test. In particular, the
gene encoding VSG LiTat 1.3 was found to be absent in some T. b. gambiense isolates from Cameroon
[41]. Other surface proteins such as ISG64, ISG65 and to a lesser extent ISG75 were also quite reactive,
especially to samples from gambiense patients. In contrast, proteins that are known to be intracellular,
and therefore less accessible to the host’s immune system, exhibited a very low reactivity. These include
Page 21 of 37
5
10
15
20
enzymes of the glycolytic pathway (GAPDH and PFK), a cytoskeleton-associated protein (MARP1), a
pyrimidine biosynthetic enzyme (DHODH) and a chaperone (HSP70). However, there were also
exceptions to this perhaps over-simplistic distinction. In particular, SRA exhibited a strong reactivity to
rhodesiense samples, although it has been shown to be an intracellular protein localized to the lysosome
and the endocytic pathway [42]. It is also possible that the observed reactivity of SRA would relate to
cross-reacting antibodies that were actually generated against VSGs, since SRA is closely related to VSGs
[43]. In addition, GM6, which is located on flagellum attachment zone fibres connecting microtubules to
the flagellum [18], was moderately reactive to gambiense samples. While they may not be very useful for
serodiagnosis, some of the intracellular proteins that were tested in this study might have utility as a
means to detect response to therapy when parasites are lysed after cidal effects of drug treatment. The
fact that the human protein GSTP1 exhibited significant reactivity to both gambiense and rhodesiense
samples might be explained by non-specific activation of B lymphocytes, which has been reported to
occur during trypanosomal infections in mice and in cattle [44-47]. This phenomenon might also be
responsible for the significant reactivity of SRA to gambiense samples that was found in this study.
The chronic nature of gambiense HAT could provide an explanation for the observation that IgG
reactivity was on average higher with gambiense than with rhodesiense samples, as patients infected
with T. b. gambiense are likely to have been diagnosed and sampled after a significantly longer infection
time than in the case of the more acute T. b. rhodesiense infections. On the other hand, rhodesiense
patients may not have had sufficient time to mount a strong IgG response comparable to that observed
in gambiense patients. The fact that the difference in reactivity between the two forms of the disease
was less pronounced in the case of IgM is consistent with this explanation, as IgM production occurs
earlier in infections, and large amounts of this class of antibody may be produced prior to diagnosis of
gambiense or rhodesiense patients. An alternative explanation for this less pronounced difference could
be the generally lower specificity of IgM in comparison to IgG antibodies.
Page 22 of 37
5
10
15
20
The reactivity values obtained in the three rounds using a fixed cut-off (mean reactivity of controls plus 2
standard deviations) correspond to sensitivity values that would theoretically be obtained with a test
that is calibrated as having a specificity of 95.4%, assuming a normal distribution [48]. The ROC analysis
that was performed in the third round allowed better appreciation of the full diagnostic potential of
antigens by calculating the accuracy and the relationship between sensitivity and specificity of each
antigen. Although the ranking of antigens according to accuracy (Youden’s index) was very similar to that
obtained with a fixed cut-off by ELISA, this ROC analysis provides additional information and shows that
using the same antigen, tests with very different diagnostic properties could be developed. For example,
using VSG LiTat 1.5 on gambiense samples, a test that is highly specific (98%) but moderately sensitive
(90%) could be developed, as well as a test that is highly sensitive (97%) but moderately specific (90%).
Therefore, information on the intended use of a test, including the target population, disease incidence,
setting, diagnostic algorithm as well as available treatments, will need to be considered carefully when
defining target specifications to be achieved in test development using these antigens.
As no single antigen assessed in this study reacted with all the positive sera, combining two or more
antigens might be necessary in order to develop a test with a sensitivity that would be sufficiently high
for effective disease control and elimination. An example is a combination of VSG LiTat 1.3 and VSG LiTat
1.5, which performed best by slot blot on T. b. gambiense sera. Since slot blot uses a nitrocellulose
matrix that is similar to that used in RDTs, these antigens were considered as the best candidates for
developing an RDT. Indeed, since this study was carried out, two RDTs for gambiense HAT have been
developed and commercialized, both using these two antigens. One is the HAT Sero-K-SeT manufactured
by Coris BioConcept (Belgium), with a reported sensitivity of 93.9% and a specificity of 99.0% using
archived sera [23], as well as a sensitivity of 98.5% and a specificity of 98.6% in a prospective passive
screening trial [49]. The other is the SD BIOLINE HAT produced by Alere/Standard Diagnostics (South
Korea). A study that compared the performance of these two RDTs on stored plasma originating from
Page 23 of 37
5
10
15
20
Guinea and Côte d’Ivoire reported sensitivities of 99.1% and 99.6%, and specificities of 88.3% and 87.9%
for the HAT Sero-K-SeT and the SD BIOLINE HAT, respectively [50]. A prototype version of the SD BIOLINE
HAT was also evaluated in a prospective study in Angola, the DRC and the Central African Republic [51],
without pre-selecting participants using CATT. This study concluded that the sensitivity of the RDT was
not statistically different from the sensitivity of CATT when performed on whole blood, while its
specificity was 1.3% lower than that of CATT. Taken together, these results demonstrate that the
methodology that we used in the present study was appropriate in identifying antigens with a high
potential for development of an RDT for HAT.
Most of the antigens were found to react to both gambiense and rhodesiense infections, and the
antigens that exhibited a strong reactivity with samples from one form of the disease were also reactive
to the other form. These results are consistent with the extremely high level of genomic similarity that
has been reported between T. b. gambiense and T. b. rhodesiense [52,53]. SRA was an exception, since
this antigen was much more reactive to rhodesiense than to gambiense samples. This finding is in
agreement with the fact that SRA is a protein that is only expressed by T. b. rhodesiense and not by T. b.
gambiense [21,22]. Although developing an RDT that would detect both forms of disease using some of
the antigens included in this panel could be considered, it seems that even if two antigens are combined,
the resulting sensitivity for rhodesiense would not be sufficiently high. Further research is therefore
necessary to identify other antigens for use in developing a test for rhodesiense HAT. One approach
might be to evaluate the diagnostic potential of the 254 proteins that were identified by Eyford et al. [54]
in the plasma from patients infected with T. b. rhodesiense. Although gambiense and rhodesiense HAT
are found in discrete geographical foci [55], there have been concerns that the two disease forms may
eventually coexist in the same region. In particular, outbreaks of rhodesiense HAT in previously
unaffected districts of Uganda resulted in a significant expansion of the rhodesiense HAT endemic region
from the southeast towards the northwestern region of the country, posing a risk of overlap with the
Page 24 of 37
5
10
15
20
other disease form [56]. In such an event, an RDT that would be specific for T. b. rhodesiense infections
would be very useful, since treatments differ between the two disease forms [57]. It would also be worth
testing samples from rhodesiense patients with the RDTs that have been developed for gambiense HAT,
as these tests might also prove useful as screening tools for this form of disease. Moreover, it would be
interesting to assess the diagnostic potential of the T. b. gambiense-specific TgsGP protein [58,59], which
was not available for inclusion in this study.
The results from the second and third rounds of screening were obtained using two different and
complementary methods. Assessment by slot blotting gives an indication of the performance of antigens
on a nitrocellulose membrane, which is a commonly used solid phase platform in lateral-flow RDTs. On
the other hand, ELISA relies on photometric measurements that should allow for a more precise
quantification of the reactivity of antigens. Although there were some differences in the ranking of
antigens using these two methods, the overall pattern of results for both slot blotting and ELISA was
remarkably similar, reinforcing the validity of the results generated in this study. However, some
differences in reactivity were found using these two methods. For instance, ISG75 and GAPDH exhibited
a much higher reactivity in slot blot than in ELISA. Although the reasons for such differences were not
investigated, binding properties of different antigens to the two matrices are likely to play a role, which
may result in distinct affinity as well as different orientation or denaturation of antigens. When
interpreting these results, it is therefore critical to also take into account the matrix on which the
antigens would eventually be applied in a serological test. In our case, the target was to develop an RDT
with a nitrocellulose matrix, and therefore the slot blot results were given higher consideration.
While efforts were made to be as comprehensive as possible and include all the antigens that had been
previously reported as having a diagnostic potential, this work only included 35 antigens. It is possible
that other antigens that were either not included or had not been identified at that time could perform
equally well or better than assessed in the present study. For example, the flagellar calcium-binding
Page 25 of 37
5
10
15
20
protein TB-17 [20,60], the Gene Related to Expression Site Associated Gene (GRESAG) 4, and transferrin
receptor subunits ESAG 6 and 7 have also been suggested as potential candidates [20]. Since the most
reactive antigens include the native VSG LiTat 1.3 and VSG LiTat 1.5 antigens, which are costly and
difficult to produce, one approach might be to generate recombinant versions of these proteins. This was
attempted by Rogé et al. [61], who expressed the immunogenic N-terminal part of these antigens in
Pichia pastoris, and by Rooney et al. [62], who expressed these antigens and ISG65 in Leishmania
tarentolae. While evaluation of these recombinant antigens by ELISA gave very promising results, their
diagnostic potential in an RDT format remains to be confirmed. Another approach has been to produce
synthetic peptide mimotopes corresponding to epitopes of VSG LiTat 1.3 and VSG LiTat 1.5; however, the
diagnostic accuracy of these peptides was found to be lower than that of full-length native antigens [63-
65].
An important limitation of this study was in the selection of the clinical samples that were used to screen
the antigens. All gambiense HAT cases were identified following screening using the CATT test. CATT
reagents consist of lyophilized bloodstream form T. b. gambiense parasites expressing VSG LiTat 1.3 [4].
This means that by definition, all samples from gambiense HAT cases were sero-reactive to VSG LiTat 1.3.
This selection bias could explain why this antigen performed so well in this study. In addition, it is
conceivable that samples from other gambiense HAT cases with a different serological profile and that
would potentially be more reactive to other antigens could have been missed during screening with
CATT. Similarly, all controls originating from gambiense endemic countries had to be negative with CATT.
This is likely to have introduced a bias resulting in an over-estimate of the specificity of antigens that are
related to CATT, such as VSG LiTat 1.3. It is therefore possible that the results of this study could have
been significantly different if samples had not been pre-selected using any serological test.
Unfortunately, we could not get access to samples that were not pre-selected by CATT, since virtually all
the prospective studies involving sample collection that have been conducted over the last few decades
Page 26 of 37
5
10
15
20
involved selection of participants on the basis of CATT results. Future attempts to evaluate antigens for
their potential in diagnosis of HAT would benefit from new prospective collections of clinical samples
whose selection would not rely on serological tests, but which could take advantage of new diagnostic
tools, such as the molecular detection tests that have recently been made available [66].
Acknowledgments
We would like to thank the National Livestock Resources Research Institute (NALIRRI, Tororo, Uganda),
the Institute of Tropical Medicine (ITM, Antwerp, Belgium) and the World Health Organization (WHO) for
supplying clinical samples. We also acknowledge the participation of FIND management and technical
teams, the WHO HAT team, Dr. Veerle Lejon (ITM) and Prof. Sanjeev Krishna (St George's, University of
London, United Kingdom) for participating in monthly meetings to review and manage this work. We are
grateful to Dr. Robert Skilton (ILRI) for donation of the recombinant GM6 antigen. Finally, we thank Dr.
Patrice François’ team (University of Geneva Hospitals, Switzerland) for blinding antigen samples and
Nora Champouillon (FIND) for logistical support.
References
1. Franco JR, Simarro PP, Diarra A, Ruiz-Postigo JA, Jannin JG. The journey towards elimination of
gambiense human African trypanosomiasis: not far, nor easy. Parasitology. 2014;141(6):748-60.
2. Simarro PP, Cecchi G, Franco JR, Paone M, Diarra A, Ruiz-Postigo JA et al. Estimating and mapping
the population at risk of sleeping sickness. PLoS Negl Trop Dis. 2012;6(10):e1859.
Page 27 of 37
5
10
15
20
3. Malvy D, Chappuis F. Sleeping sickness. Clin Microbiol Infect. 2011;17(7):986-95.
4. Magnus E, Vervoort T, Van Meirvenne N. A card agglutination test with stained trypanosomes
(CATT) for the serological diagnosis of T. b. gambiense trypanosomiasis. Ann Soc Belg Med Trop.
1978;58: 169-176.
5. Chappuis F, Loutan L, Simarro P, Lejon V, Büscher P. Options for field diagnosis of human African
trypanosomiasis. Clin Microbiol Rev. 2005;18(1):133-46.
6. Jamonneau V, Truc P, Garcia A, Magnus E, Büscher P. Preliminary evaluation of LATEX/T. b.
gambiense and alternative versions of CATT/T. b. gambiense for the serodiagnosis of human
African trypanosomiasis of a population at risk in Côte d'Ivoire: considerations for mass-
screening. Acta Trop. 2000;76(2):175-83.
7. Nantulya VM. TrypTect CIATT-a card indirect agglutination trypanosomiasis test for diagnosis of
Trypanosoma brucei gambiense and T. b. rhodesiense infections. Trans R Soc Trop Med Hyg.
1997;91(5):551-3.
8. Asonganyi T, Doua F, Kibona SN, Nyasulu YM, Masake R, Kuzoe F. A multi-centre evaluation of
the card indirect agglutination test for trypanosomiasis (TrypTect CIATT). Ann Trop Med
Parasitol. 1998;92(8):837-44.
9. McNae IW, Martinez-Oyanedel J, Keillor JW, Michels PA, Fothergill-Gilmore LA, Walkinshaw MD.
The crystal structure of ATP-bound phosphofructokinase from Trypanosoma brucei reveals
conformational transitions different from those of other phosphofructokinases. J Mol Biol.
2009;385(5):1519-33.
10. Bakker BM, Michels PA, Opperdoes FR, Westerhoff HV. What controls glycolysis in bloodstream
form Trypanosoma brucei? J Biol Chem. 1999;274(21):14551-9.
Page 28 of 37
5
10
15
20
11. Malabanan MM, Go MK, Amyes TL, Richard JP. Wildtype and engineered monomeric
triosephosphate isomerase from Trypanosoma brucei: partitioning of reaction intermediates in
D2O and activation by phosphite dianion. Biochemistry. 2011;50(25):5767-79.
12. Cáceres AJ, Michels PA, Hannaert V. Genetic validation of aldolase and glyceraldehyde-3-
phosphate dehydrogenase as drug targets in Trypanosoma brucei. Mol Biochem Parasitol.
2010;169(1):50-4.
13. Haanstra JR, Stewart M, Luu VD, van Tuijl A, Westerhoff HV, Clayton C et al. Control and
regulation of gene expression: quantitative analysis of the expression of phosphoglycerate kinase
in bloodstream form Trypanosoma brucei. J Biol Chem. 2008;283(5):2495-507.
14. Mercaldi GF, Pereira HM, Cordeiro AT, Michels PA, Thiemann OH. Structural role of the active-
site metal in the conformation of Trypanosoma brucei phosphoglycerate mutase. FEBS J.
2012;279(11):2012-21.
15. de A S Navarro MV, Gomes Dias SM, Mello LV, da Silva Giotto MT, Gavalda S, Blonski C et al.
Structural flexibility in Trypanosoma brucei enolase revealed by X-ray crystallography and
molecular dynamics. FEBS J. 2007;274(19):5077-89.
16. Cordeiro AT, Thiemann OH, Michels PA. Inhibition of Trypanosoma brucei glucose-6-phosphate
dehydrogenase by human steroids and their effects on the viability of cultured parasites. Bioorg
Med Chem. 2009;17(6):2483-9.
17. Gualdrón-López M, Chevalier N, Van Der Smissen P, Courtoy PJ, Rigden DJ, Michels PA.
Ubiquitination of the glycosomal matrix protein receptor PEX5 in Trypanosoma brucei by PEX4
displays novel features. Biochim Biophys Acta. 2013;1833(12):3076-92.
Page 29 of 37
5
10
15
20
18. Müller N, Hemphill A, Imboden M, Duvallet G, Dwinger RH, Seebeck T. Identification and
characterization of two repetitive non-variable antigens from African trypanosomes which are
recognized early during infection. Parasitology. 1992;104(1):111-20.
19. Schnekenburger M, Karius T, Diederich M. Regulation of epigenetic traits of the glutathione S-
transferase P1 gene: from detoxification toward cancer prevention and diagnosis. Front
Pharmacol. 2014;16;5:170.Arakaki TL, Buckner FS, Gillespie JR, Malmquist NA, Phillips MA,
Kalyuzhniy O et al. Characterization of Trypanosoma brucei dihydroorotate dehydrogenase as a
possible drug target; structural, kinetic and RNAi studies. Mol Microbiol. 2008;68(1):37-50.
20. Sullivan L, Wall SJ, Carrington M, Ferguson MA. Proteomic selection of immunodiagnostic
antigens for human African trypanosomiasis and generation of a prototype lateral flow
immunodiagnostic device. PLoS Negl Trop Dis. 2013;7(2):e2087.
21. De Greef C, Imberechts H, Matthyssens G, Van Meirvenne N, Hamers R. A gene expressed only in
serum-resistant variants of Trypanosoma brucei rhodesiense. Mol Biochem Parasitol.
1989;36(2):169-76.
22. Capewell P, Cooper A, Clucas C, Weir W, Macleod A. A co-evolutionary arms race: trypanosomes
shaping the human genome, humans shaping the trypanosome genome. Parasitology. 2015;142
Suppl 1:S108-19.
23. Büscher P, Gilleman Q, Lejon V. Rapid diagnostic test for sleeping sickness. N Engl J Med.
2013;368(11):1069-70.
24. Ruda GF, Campbell G, Alibu VP, Barrett MP, Brenk R, Gilbert IH. Virtual fragment screening for
novel inhibitors of 6-phosphogluconate dehydrogenase. Bioorg Med Chem. 2010;18(14):5056-
62.
Page 30 of 37
5
10
15
20
25. Rudd SG, Glover L, Jozwiakowski SK, Horn D, Doherty AJ. PPL2 translesion polymerase is essential
for the completion of chromosomal DNA replication in the African trypanosome. Mol Cell.
2013;52(4):554-65.
26. Dobson R, Stockdale C, Lapsley C, Wilkes J, McCulloch R. Interactions among Trypanosoma brucei
RAD51 paralogues in DNA repair and antigenic variation. Molecular Microbiology.
2011;81(2):434-456.
27. Lynch NJ, Schneider H, Sim RB, Bickel U, Schwaeble WJ. In vivo pharmacokinetics of calreticulin S-
domain, an inhibitor of the classical complement pathway. Int Immunopharmacol.
2002;2(4):415-22.
28. Mackey ZB, O'Brien TC, Greenbaum DC, Blank RB, McKerrow JH. A cathepsin B-like protease is
required for host protein degradation in Trypanosoma brucei. J Biol Chem. 2004;279(46):48426-
33.
29. Huynh TT, Huynh VT, Harmon MA, Phillips MA. Gene knockdown of γ-glutamylcysteine
synthetase by RNAi in the parasitic protozoa Trypanosoma brucei demonstrates that it is an
essential enzyme. J Biol Chem. 2003;278(41):39794-800.
30. Willert EK, Fitzpatrick R, Phillips MA. Allosteric regulation of an essential trypanosome polyamine
biosynthetic enzyme by a catalytically dead homolog. Proc Natl Acad Sci USA.
2007;104(20):8275-80.
31. Arakaki TL, Buckner FS, Gillespie JR, Malmquist NA, Phillips MA, Kalyuzhniy O et al.
Characterization of Trypanosoma brucei dihydroorotate dehydrogenase as a possible drug target;
structural, kinetic and RNAi studies. Mol Microbiol. 2008;68(1):37-50.
32. Milne KG, Güther ML, Ferguson MA. Acyl-CoA binding protein is essential in bloodstream form
Trypanosoma brucei. Mol Biochem Parasitol. 2001;112(2):301-4.
Page 31 of 37
5
10
15
20
33. McDowell MA, Ransom DM, Bangs JD. Glycosylphosphatidylinositol-dependent secretory
transport in Trypanosoma brucei. Biochem J. 1998;335:681-9.
34. Peck RF, Shiflett AM, Schwartz KJ, McCann A, Hajduk SL, Bangs JD. The LAMP-like protein p67
plays an essential role in the lysosome of African trypanosomes. Mol Microbiol. 2008;68(4):933-
46.
35. Schlaeppi K, Deflorin J, Seebeck T. The major component of the paraflagellar rod of Trypanosoma
brucei is a helical protein that is encoded by two identical, tandemly linked genes. J Cell Biol.
1989;109(4 Pt 1):1695-709.
36. Sanderson SJ, Westrop GD, Scharfstein J, Mottram JC, Coombs GH. Functional conservation of a
natural cysteine peptidase inhibitor in protozoan and bacterial pathogens. FEBS Lett.
2003;8;542(1-3):12-6.
37. Müller N, Imboden M, Detmer E, Mansfield JM, Seebeck T. Cytoskeleton-associated antigens
from African trypanosomes are recognized by self-reactive antibodies of uninfected mice.
Parasitology. 1993;107 (Pt 4):411-7.
38. Eisenhart C, Rosenblatt JR. W. J. Youden, 1900–1971. The Annals of Mathematical Statistics.
1972;43(4):1035-40.
39. Schwede A, Macleod OJ, MacGregor P, Carrington M. How does the VSG coat of bloodstream
form African trypanosomes interact with external proteins?. PLoS Pathog.
2015;11(12):e1005259.
40. Van Meirvenne N, Magnus E, Buscher P. Evaluation of variant specific trypanolysis tests for
serodiagnosis of human infections with Trypanosoma brucei gambiense. Acta Trop.
1995;60(3):189-99.
Page 32 of 37
5
10
15
20
41. Dukes P, Gibson WC, Gashumba JK, Hudson KM, Bromidge TJ, Kaukus A et al. Absence of the
LiTat 1.3 (CATT antigen) gene in Trypanosoma brucei gambiense stocks from Cameroon. Acta
Trop. 1992;51(2):123-34.
42. Bart JM, Cordon-Obras C, Vidal I, Reed J, Perez-Pastrana E, Cuevas L et al. Localization of serum
resistance-associated protein in Trypanosoma brucei rhodesiense and transgenic Trypanosoma
brucei brucei. Cell Microbiol. 2015;17(10):1523-35.
43. De Greef C, Hamers R. The serum resistance-associated (SRA) gene of Trypanosoma brucei
rhodesiense encodes a variant surface glycoprotein-like protein. Mol Biochem Parasitol
.1994;68(2):277-84.
44. Diffley P. Trypanosomal surface coat variant antigen causes polyclonal lymphocyte activation. J
Immunol. 1983;131(4):1983-6.
45. Oka M, Yabu Y, Ito Y, Takayanagi T. Polyclonal B-cell stimulative and immunosuppressive
activities at different developmental stages of Trypanosoma gambiense. Microbiol Immunol.
1988;32(11):1175-7.
46. Buza J, Naessens J. Trypanosome non-specific IgM antibodies detected in serum of Trypanosoma
congolense-infected cattle are polyreactive. Vet Immunol Immunopathol. 1999;69(1):1-9.
47. Radwanska M, Magez S, Michel A, Stijlemans B, Geuskens M, Pays E. Comparative analysis of
antibody responses against HSP60, invariant surface glycoprotein 70, and variant surface
glycoprotein reveals a complex antigen-specific pattern of immunoglobulin isotype switching
during infection by Trypanosoma brucei. Infect Immun. 2000;68(2):848-60.
48. Whitley E, Ball J. Statistics review 2: samples and populations. Crit Care. 2002;6(2):143-8.
Page 33 of 37
5
10
15
20
49. Büscher P, Mertens P, Leclipteux T, Gilleman Q, Jacquet D, Mumba-Ngoyi D et al. Sensitivity and
specificity of HAT Sero-K-SeT, a rapid diagnostic test for serodiagnosis of sleeping sickness caused
by Trypanosoma brucei gambiense: a case-control study. Lancet Glob Health. 2014;2(6):e359-63.
50. Jamonneau V, Camara O, Ilboudo H, Peylhard M, Koffi M, Sakande H et al. Accuracy of individual
rapid tests for serodiagnosis of gambiense sleeping sickness in West Africa. PLoS Negl Trop Dis.
2015;9(2):e0003480.
51. Bisser S, Lumbala C, Nguertoum E, Kande V, Flevaud L, Vatunga G, Boelaert M, Büscher P,
Josenando T, Bessell PR, Biéler S, Ndung'u JM. Sensitivity and specificity of a prototype rapid
diagnostic test for the detection of Trypanosoma brucei gambiense infection: A multi-centric
prospective study. PLoS Negl Trop Dis. 2016;10(4):e0004608.
52. Sistrom M, Evans B, Bjornson R, Gibson W, Balmer O, Mäser P et al. Comparative genomics
reveals multiple genetic backgrounds of human pathogenicity in the Trypanosoma brucei
complex. Genome Biol Evol. 2014;6(10):2811-9.
53. Sistrom M, Evans B, Benoit J, Balmer O, Aksoy S, Caccone A. De novo genome assembly shows
genome wide similarity between Trypanosoma brucei brucei and Trypanosoma brucei
rhodesiense. PLoS One. 2016;11(2):e0147660.
54. Eyford BA, Ahmad R, Enyaru JC, Carr SA, Pearson TW. Identification of trypanosome proteins in
plasma from African sleeping sickness patients infected with T. b. rhodesiense. PLoS One.
2013;8(8):e71463.
55. Simarro PP, Cecchi G, Paone M, Franco JR, Diarra A, Ruiz JA et al. The Atlas of human African
trypanosomiasis: a contribution to global mapping of neglected tropical diseases. Int J Health
Geogr. 2010;9:57.
Page 34 of 37
5
10
15
20
56. Fyfe J, Picozzi K, Waiswa C, Bardosh KL, Welburn SC. Impact of mass chemotherapy in domestic
livestock for control of zoonotic T. b. rhodesiense human African trypanosomiasis in Eastern
Uganda. Acta Trop. 2016;pii:S0001-706X(16)30644-1.
57. Brun R, Blum J, Chappuis F, Burri C. Human African trypanosomiasis. Lancet.
2010 ;375(9709):148-59.
58. Berberof M, Pérez-Morga D, Pays E. A receptor-like flagellar pocket glycoprotein specific to
Trypanosoma brucei gambiense. Mol Biochem Parasitol. 2001;113(1):127-38.
59. Capewell P, Clucas C, DeJesus E, Kieft R, Hajduk S, Veitch N et al. The TgsGP gene is essential for
resistance to human serum in Trypanosoma brucei gambiense. PLoS Pathog.
2013;9(10):e1003686.
60. Nzou SM, Fujii Y, Miura M, Mwau M, Mwangi AW, Itoh M, Salam MA, Hamano S, Hirayama K,
Kaneko S. Development of multiplex serological assay for the detection of human African
trypanosomiasis. Parasitol Int. 2015;65(2):121-127.
61. Rogé S, Van Nieuwenhove L, Meul M, Heykers A, Brouwer de Koning A, Bebronne N et al.
Recombinant antigens expressed in Pichia pastoris for the diagnosis of sleeping sickness caused
by Trypanosoma brucei gambiense. PLoS Negl Trop Dis. 2014;8(7):e3006.
62. Rooney B, Piening T, Büscher P, Rogé S, Smales CM. Expression of Trypanosoma brucei
gambiense antigens in Leishmania tarentolae. Potential for use in rapid serodiagnostic tests
(RDTs). PLoS Negl Trop Dis. 2015;9(12):e0004271.
63. Van Nieuwenhove LC, Rogé S, Balharbi F, Dieltjens T, Laurent T, Guisez Y et al. Identification of
peptide mimotopes of Trypanosoma brucei gambiense variant surface glycoproteins. PLoS Negl
Trop Dis. 2011;5(6):e1189.
Page 35 of 37
5
10
15
20
64. Van Nieuwenhove L, Büscher P, Balharbi F, Humbert M, Dieltjens T, Guisez Y et al. Identification
of mimotopes with diagnostic potential for Trypanosoma brucei gambiense variant surface
glycoproteins using human antibody fractions. PLoS Negl Trop Dis. 2012;6(6):e1682.
65. Van Nieuwenhove L, Büscher P, Balharbi F, Humbert M, Guisez Y, Lejon V. A LiTat 1.5 variant
surface glycoprotein-derived peptide with diagnostic potential for Trypanosoma brucei
gambiense. Trop Med Int Health. 2013;18(4):461-5.
66. Büscher P, Deborggraeve S. How can molecular diagnostics contribute to the elimination of
human African trypanosomiasis? Expert Rev Mol Diagn. 2015;15(5):607-15.
Supporting Information
S1 Table. Percentage IgG reactivity of antigen pairs on sera from T. b. gambiense HAT cases assessed
by slot blot. The 78 possible antigen pairs computed with the 13 antigens from the third round of
screening are shown in descending order of reactivity.
S2 Table. Percentage IgG reactivity of antigen pairs on sera from T. b. gambiense HAT cases assessed
by ELISA. The 78 possible antigen pairs computed with the 13 antigens from the third round of screening
are shown in descending order of reactivity.
S3 Table. Percentage IgG reactivity of antigen pairs on sera from T. b. rhodesiense HAT cases assessed
by slot blot. The 78 possible antigen pairs computed with the 13 antigens from the third round of
screening are shown in descending order of reactivity.
Page 36 of 37
5
10
15
S4 Table. Percentage IgG reactivity of antigen pairs on sera from T. b. rhodesiense HAT cases assessed
by ELISA. The 78 possible antigen pairs computed with the 13 antigens from the third round of screening
are shown in descending order of reactivity.
Page 37 of 37