brand valuation models
TRANSCRIPT
8/3/2019 Brand Valuation Models
http://slidepdf.com/reader/full/brand-valuation-models 1/12
This article was downloaded by: [218.248.16.202]On: 16 October 2011, At: 00:14Publisher: Taylor & FrancisInforma Ltd Registered in England and Wales Registered Number: 1072954 Registered office: MortimerHouse, 37-41 Mortimer Street, London W1T 3JH, UK
Journal of Business Economics and ManagementPublication details, including instructions for authors and subscription information:http://www.tandfonline.com/loi/tbem20
Brand valuation modelRomualdas Ginevičius a & Darius Gudačiauskas b
aEnterprise economics and business management department, Vilnius Gediminas
Technical University, Saulètekio al. Il, Vilnius, LT ‐ 10223, Lithuania E-mail:[email protected]
Enterprise economics and business management department, Vilnius GediminasTechnical University, Saulètekio al. Il, Vilnius, LT ‐ 10223, Lithuania E-mail:[email protected]
Available online: 14 Oct 2010
To cite this article: Romualdas Ginevičius & Darius Gudačiauskas (2004): Brand valuation model, Journal of BusinessEconomics and Management, 5:3, 143-153
To link to this article: http://dx.doi.org/10.1080/16111699.2004.9636078
PLEASE SCROLL DOWN FOR ARTICLE
Full terms and conditions of use: http://www.tandfonline.com/page/terms-and-conditions
This article may be used for research, teaching, and private study purposes. Any substantial or systematicreproduction, redistribution, reselling, loan, sub-licensing, systematic supply, or distribution in any form toanyone is expressly forbidden.
The publisher does not give any warranty express or implied or make any representation that the contentswill be complete or accurate or up to date. The accuracy of any instructions, formulae, and drug dosesshould be independently verified with primary sources. The publisher shall not be liable for any loss, actions,claims, proceedings, demand, or costs or damages whatsoever or howsoever caused arising directly orindirectly in connection with or arising out of the use of this material.
8/3/2019 Brand Valuation Models
http://slidepdf.com/reader/full/brand-valuation-models 2/12
143
BRAND VALUATION MODEL
Romualdas Ginevièius, Darius Gudaèiauskas
Enterprise economics and business management department, Vilnius Gediminas Technical University,
Saulëtekio al. 11, LT � 10223 Vilnius, Lithuania.
E-mail:[email protected]; [email protected]
Received 27 February 2004; accepted 29 April 2004
Abstract. Brand valuation technique is a core problem in a company value creation process. It has been done a lot of
researches on the issue since brand valuation hit the headlines in 1988. The main task in brand valuation is to distinguish brand earnings from the earnings attributable to another assets: patents, intellectual property, and tangible assets. Thisseems to be an undisputable must, but not the only task for brand valuator. Another task is to estimate probability thatthe brand will generate these earnings in the future. Aim of our article is to propose brand earnings calculation, brandindex calculation and brand risk assessment models, which are the results of the final doctoral dissertation. We believethat we have developed an ideal brand valuation model for emerging markets with low share liquidity.
Keywords: brand value, brand value index, brand equity, brand earnings, and brand valuation
1. Introduction
Fundamental changes initiated by globalisation, newtechnologies, intensive competition, volatile consumer demand, changes of economic and political systems
become new challenges for business companies. Theseevolutionary changes encourage companies to learnfaster, react adequately, adapt actively to the environ-
ment and change themselves. This situation prompted business companies to look for sources of competitiveedge distinguishing the companies from their closestcompetitors.
The end of the last century observed a significantchange in the company value components. Not longago, shareholders� equity was mainly described bytangible assets, such as buildings, land, equipment andinventories. Recently, intangible assets, such as brandnames, patents, intellectual property, became prevailingelements of the company value. The difference between
the market capitalisation and net shareholders� equity became particularly significant. For instance, theresearch made in the United Kingdom in 1998 showedthat only 28 per cent of the market capitalisation can
be explained by net book value, and the remaining 78 per cent were attributable to other intangible assets, themajor part of which, as a rule, is represented by brandvalue [1]. Thus, such proportion of the company valueforces to look for ways how to evaluate the brand valuecreated in the company as precise as possible.
As calculations of brand values are based on the projection of future profitability and are dependent on
a lot of assumptions related to consumption and coststructure, one can state that an absolute brand valuedoes not exist in practice. While addressing the problemof evaluation of the brand financial value, we had tosolve a number of problems: reliability of assumptions,risk and separability (how to separate beer fromÐvyturys brand). How difficult so ever the process of measuring the brand financial value is, thanks to our research the measurement of the brand financial valueand application thereof in the industry of consumer commodities became possible in Lithuania as well.
Scientific problem
A brand is a psychological concept, measuring of theeconomic value of which is one of the most interesting
Journal of Business Economics and Management ISSN 1611-1699
2004, Vol V, No 3, 143�153
8/3/2019 Brand Valuation Models
http://slidepdf.com/reader/full/brand-valuation-models 3/12
144
Romualdas Ginevièius, Darius Gudaèiauskas
tasks for economic and management sciences and
business practise. Although this problem has been
investigated worldwide for several decades already, it
is practically untouched in Lithuania. Until now no
single measurement of brand economic value created
in the company is made in Lithuania. The investigation
of this scientific problem by employing the results of
scientific research made in foreign countries presup-
poses creation of the measurement model for brand
value adapted for the Lithuanian market, by addressing
a lot of specific economic, psychological and
management issues.
Objective of the study
To develop a model for measuring the brand economic
value, which would allow for measuring the brand
values created within the company in Lithuania.
Tasks of the study
The objective of the study was achieved by addressing
the following tasks:
1. Disclosure of importance of the brand economic
value in the activities of the company;
2. Analysis of the methodologies to measure the
brand economic value used worldwide and
disclosure of the main components of the brand
valuation process;
3. Development of a measurement model for brand
economic value in the Lithuanian environment by
creating new methods, in order to:
a. Define earnings generated by intangible assets;
b. Calculate the brand value coefficient;
c. Calculate the size of the profit generated
by the brand;
d. Calculate the discount rate of the cash flow
generated by the brand;
e. Calculate the economic value of the brand.
4. By calculating the economic value of the cigarette brand.
Methods of the study
The basis for the methodology of the study consists
of the principles of systemic analysis, in order to
disclose the formation of the brand value. The
methodology of the study is focused on investigation
of the brand valuation methods as an object for scien-
tific research, formation of the theory, and analysis in
the environment of the contemporary market in
Lithuania. The addressing of the objectives set by the
study involved the knowledge from areas of finance,
economics, statistics, mathematics, management,
psychology, sociology and other sciences.
While performing the study, the following methods
were employed:
a) Studying of archives;
b) Analytical analysis;
c) Systemic analysis;
d) Comparative analysis;
e) Conceptual simulation;
f) Quantitative consumer survey.
The following sources of theoretical and practical
knowledge have been analysed and employed: scien-
tific thesis defended in USA, periodic publications on
the subject, review of quantitative and qualitative
surveys made by the companies selling cigarettes,
methodologies of scientific studies of the European
Association of Sociological and Marketing Surveys,
various publications on measurement of the company
value and intangible assets, as well as publications on
brand phenomenon.
Academic novelty
Implementation of the main objective � development
of the model for calculation of brand economic value
and its application in the Lithuanian market neces-
sitated innovative solutions in order to ensure the
theoretical justification of the model developed by the
author and compliance thereof with main provisions
of international brand valuation practice.
The academic novelty of the study is revealed at both
theoretical and practical levels. First of all, the study
presents a uniform terminology of Lithuanian defi-
nitions of the brand. In order to develop a model of
measuring of brand economic value applicable in
Lithuania, a number of solutions which are absolutely
new from the scientific point of view were developed:
1. Methodology for calculation of brand equity;
2. Brand risk calculation methodology;
3. Brand value index calculation methodology.
The research covered the analysis and summary of
studies on brand valuation and management, as well
as the foreign experience of practical application of
brand value. The results of the representative survey
on cigarette consumers are of not less importance, and
helped in revealing a psychological value of a brand.
2. Brand value index calculation methodology
Scope of the study and consumer survey using �in�
hall test� approach.
In order to define a consumer index of Brand X or,in other words, a probability that, given a specific
price, a consumer will choose this alternative and not
the other, a survey was carried out in Vilnius on 28 �
8/3/2019 Brand Valuation Models
http://slidepdf.com/reader/full/brand-valuation-models 4/12
145
BRAND VALUATION MODEL
29 April 2004. Prior to the survey, a check
questionnaire and a cigarette test questionnaire were
developed. The survey was carried out in the form of
a direct interview, using �in�hall test� approach [2].
As questions in the survey were pre-formulated, thisinterview may be classified as a formalised interview.
During the survey 100 respondents were interviewed.
The age of the respondents varies from 18 to 44 years,
as the consumers of this age represent the major part
(86 %) of smokers within the segment under survey.
The age of fifty respondents was within 18 and 24
years, and the remaining fifty � from 25 to 44 years.
The survey covered 70 men and 30 women, who
smoke at least five cigarettes a day. The proportion
of males and females in the survey corresponds to the
composition of smokers in Lithuania by gender.
Therefore, the study results are considered to be
representative as they reflect the distribution of the
active smokers by age and gender in the segment and
in the market in the best way.
At the beginning of the survey the first questionnaire
was presented to the respondents. This questionnaire
included nine questions, and the respondents who had
answered them, were invited to the further survey.
As at the beginning of the survey the questions and
the entire procedure were planned in advance, so inorder to get reliable answers, the first questionnaire
contained fixed answers, allowing the respondent to
choose one from two or more options. The advantage
of such questions lies also in that the pre�formulated
answers are easy to encode. The second questionnaire
included not only questions with fixed answers but
also open questions and requests to score cigarette
quality.
In the beginning of the first questionnaire a gender of
the respondents is determined, as 70 % of men and
30 % of women were interviewed, as mentioned
above. In addition, it is important to find out the age
of the respondent. If the respondent is under 18, the
interview is terminated, as selling of cigarettes to
persons of this age is restricted by law. As the objec-
tive set at the beginning of the survey was to interview
persons under 44 years old, so in case the respondent
is above this age limitation, the interview was
terminated as well.
The questionnaire includes a question aimed at
determining the area in which the respondent and his/her family members are employed. If the occupation
of the respondent or his/her family members is related
to marketing, advertising, manufacturing and selling
of tobacco products, market surveys and journalism,
the interview is terminated, as the said areas may have
an impact on the results of the survey [3].
Also, if it appears that the respondent does not smoke,
the interview is terminated. As the objective set at the beginning of the survey was to interview persons who
smoke at least five cigarettes a day and smoke the
cigarettes of brand X, i. e. the brand under survey, the
respondents were asked to show a packet of cigarettes.
If it appears that the respondent smokes fewer
cigarettes or prefer cigarettes of other brands or
currently has no packet of cigarettes of brand X, which
would clearly prove the answers of the respondents,
the interview is terminated. It should be stressed the
only those respondents who did not participate in a
cigarette test during last six months were selected for the survey.
The persons who met the aforementioned criteria were
invited to the further survey on cigarette brand.
The respondents who agreed to participate in the
further survey were given questions from the second
questionnaire. At the beginning the interviewer
indicates the beginning of the interview and the gender
of the respondent. Then introductory questions related
to the age, smoking habits of the respondent and the
preferred brands of cigarettes are presented. Also, theyare asked to specify what cigarette brands the
respondent smokes regularly during the month.
After answering to the introductory questions, the
respondents were given to smoke cigarettes of three
types. The first packet is presented with the identi-
fication of brand X, the second bears no identification
of brand X, the third is marked with brand Y and the
fourth bears brand Z. Cigarettes with brand Z were not
smoked, due to too big quantity of cigarettes smoked
at the same time, which could distort the results of the
survey. Therefore, the consumers described the preferences of this brand hypothetically. The testing
procedure of the cigarettes was changed in such a way
that all three types of cigarettes were tested in the first,
second and third position the same number of times.
Smoking of two cigarettes was separated by a break
of about 10 minutes, and the respondents were allowed
to drink some water.
The respondent who had smoked the first cigarette was
asked to assess the cigarette quality in ten score scale,
where �1� means �very poor quality� and �10� � �very
high quality�. After a ten minutes break the respondent
is offered a second cigarette, the quality of which he/
she assesses in ten score scale. Later, again after ten
8/3/2019 Brand Valuation Models
http://slidepdf.com/reader/full/brand-valuation-models 5/12
146
Romualdas Ginevièius, Darius Gudaèiauskas
minutes, he/she is offered a third cigarette, the quality
of which he/she also scores. Then the respondent is
asked to assess the quality of cigarettes of one more
brand Z. A difference of perceived quality between a
brand and a product without a brand is one of theevidences about the existence of brand value, however,
let us remind you that the major proof of its value is
an ability to set a higher price than that one of
analogous products or to gain higher preferences of
the consumers given the same price.
After the completion of the cigarette test, there are
four cards with the names of cigarettes placed in front
of the respondent, followed by piles of eight price
sheets (3,75; 3,85; 3,95; 4,05; 4,15; 4,25; 4,35; 4,45).
The price sheets are placed in ascending order, i. e.
the lowest price on the top, and the highest price atthe bottom. The respondent is asked to imagine a
situation that currently only these cigarette brands are
available in the shop, and the price is the same for all
of them � LTL 3,75. Then the interviewer asks which
brand the respondent will prefer. After the respondent
names the type of cigarettes, the interviewer marks the
first choice with �1�. In case the respondent does not
indicate anything, general questions about education,
income of the respondent are asked and the interview
is terminated.
If the respondent indicates a type of cigarettes, thesurvey is continued. The interviewer raises the price
of the chosen cigarettes by ten cents, i. e. takes one
price sheet away and asks what brand the respondent
will prefer this time. This test is continued until the
respondent chooses some type eight times or answers
that he made no choice. After the respondent answers
the questions, he/she is asked to indicate his/her edu-
cation and income. Then the interview is completed
and the interviewer notes the end, duration and date
of the interview.
The maximum bias of the survey is calculated accor-ding to the formula [4]:
,100**
n
QPS = (1)
,1=+PQ (2)
where: S � maximum statistical bias; P � probability
that the variable will take one value; Q � probability
that the variable will take another value; n � scope of
the survey.
Maximum calculated statistical bias of the survey date
is � 9,8 %.
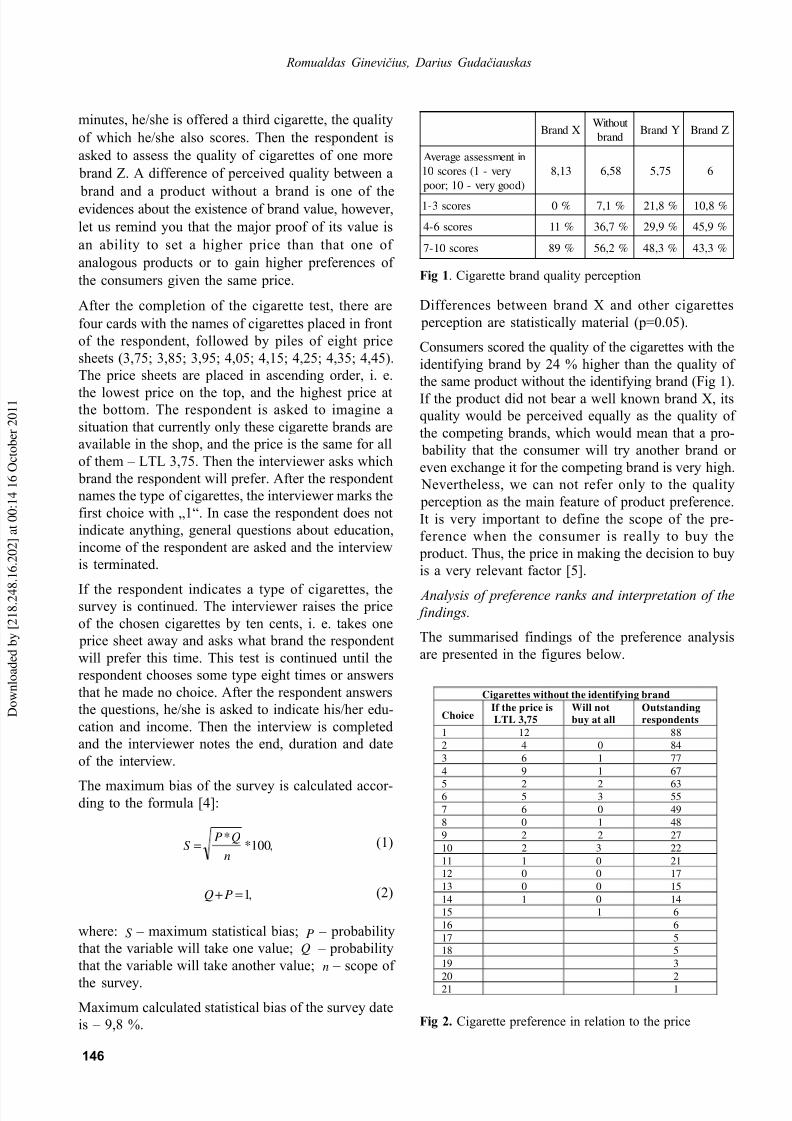
XdnarBtuohtiW
dnarbYdnarB ZdnarB
nitnemssessaegarevA
yrev-1(serocs01
)doogyrev-01;roop
31,8 85,6 57,5 6
serocs3-1 %0 %1,7 %8,12 %8,01
serocs6-4 %11 %7,63 %9,92 %9,54
serocs01-7 %98 %2,65 %3,84 %3,34
Fig 1. Cigarette brand quality perception
Differences between brand X and other cigarettes
perception are statistically material (p=0.05).
Consumers scored the quality of the cigarettes with the
identifying brand by 24 % higher than the quality of
the same product without the identifying brand (Fig 1).
If the product did not bear a well known brand X, its
quality would be perceived equally as the quality of
the competing brands, which would mean that a pro-
bability that the consumer will try another brand or
even exchange it for the competing brand is very high.
Nevertheless, we can not refer only to the quality
perception as the main feature of product preference.
It is very important to define the scope of the pre-
ference when the consumer is really to buy the
product. Thus, the price in making the decision to buy
is a very relevant factor [5].
Analysis of preference ranks and interpretation of the
findings.
The summarised findings of the preference analysis
are presented in the figures below.
Cigarettes without the identifying brand
ChoiceIf the price is
LTL 3,75
Will not
buy at all
Outstanding
respondents
1 12 88
2 4 0 84
3 6 1 77
4 9 1 67
5 2 2 636 5 3 55
7 6 0 49
8 0 1 48
9 2 2 27
10 2 3 22
11 1 0 21
12 0 0 17
13 0 0 15
14 1 0 14
15 1 6
16 6
17 5
18 5
19 3
20 2
21 1
Fig 2. Cigarette preference in relation to the price

8/3/2019 Brand Valuation Models
http://slidepdf.com/reader/full/brand-valuation-models 6/12
147
BRAND VALUATION MODEL
Cigarettes without the identifying brand at a current
market price of LTL 3,75 would be the first priority
for twelve respondents (Fig 2). Thus, we can see that
out of one hundred respondents the preference for the
product without the identifying brand in relation to
other brands would be twelve per cent. This is the
number of respondents whose first choice would be
this product. The remaining 88 % of preferences are
divided among other brands under survey.
Cigarettes brand X at a current market price of LTL
3,75 would be the first priority for eighty-four
respondents (Fig 3). Thus, we can see that out of one
hundred respondents the preference for the product
with brand X in relation to other brands would be
eighty�four per cent. This is the number of res-
pondents whose first choice would be this product.
The remaining 16 % of preferences are divided among
other brands under survey.
Cigarettes brand Y at a current market price of LTL
3,75 would be the first priority only for one respondent
(Fig 4). Thus, we can see that out of one hundred
respondents the preference for the product with brand
Y in relation to other brands would be one per cent.
This is the number of respondents whose first choice
would be this product. The remaining 99 % of pre-
ferences are divided among other brands under survey.
Cigarettes brand Z at a current market price of LTL3,75 would be the first priority only for three
respondents (Fig 5). Thus, we can see that out of one
hundred respondents the preference for the product
Cigarettes brand Y
Price, in LTLChoice
3,75 3,85 3,95 4,05 4,15 4,25 4,35 4,45
1 1
2 4
3 6 1
4 7 2
5 3 7 1
6 2 6 6
7 3 3 1 1
8 0 2 1 2
9 0 1 4 1 1
10 1 0 1 1 1
11 1 1 2 0 0 1
12 1 1 0 0 1
13 1 2 1 0 1
14 1 0 0
15 0 1 0 1
16 1 1 0
17 1 0
18 1
19 120
21
Cigarettes with brand X
Price, in LTLChoice
3,75 3,85 3,95 4,05 4,15 4,25 4,35 4,45
1 84
2 3 68
3 1 7 53
4 3 8 32
5 4 3 25
6 2 7 0 19
7 3 8 2 0 18
8 2 12 2 0 18
9 3 3 5 0 0
10 1 3 2 5 0
11 0 4 0 4
12 3 2 5 1
13 2 3 1
14 1 2 5
15 1 0 0
16 1 0 0
17 3 0
18 1 2
19 1 1
20 1
21
Fig 3. Cigarette brand X preference in relation to the price
Fig 4. Cigarette brand Y preference in relation to the price
with brand Z in relation to other brands would be three
per cent. This is the number of respondents whose first
choice would be this product. The remaining 97 % of
preferences are divided among other brands under
survey. Let us remind you that the other prices were
presented with the aim to distract the consumer from
real service prices and avoid simulation of responses
based on the reality.
Cigarettes brand Z
Price, in LTLChoice
3,75 3,85 3,95 4,05 4,15 4,25 4,35 4,45
1 3
2 8 1
3 9 0
4 10 5
5 5 14 1
6 3 5 5
7 3 2 5
8 2 6 1
9 3 6
10 0 3 4
11 1 2 4 1
12 2 0 1
13 0 0 4
14 1 3 0 1
15 2 1 0
16 1 1 0
17 1 0
18 1
19 0
20 1
21 1
Fig 5. Cigarette brand Z preference in relation to the price
8/3/2019 Brand Valuation Models
http://slidepdf.com/reader/full/brand-valuation-models 7/12
148
Romualdas Ginevièius, Darius Gudaèiauskas
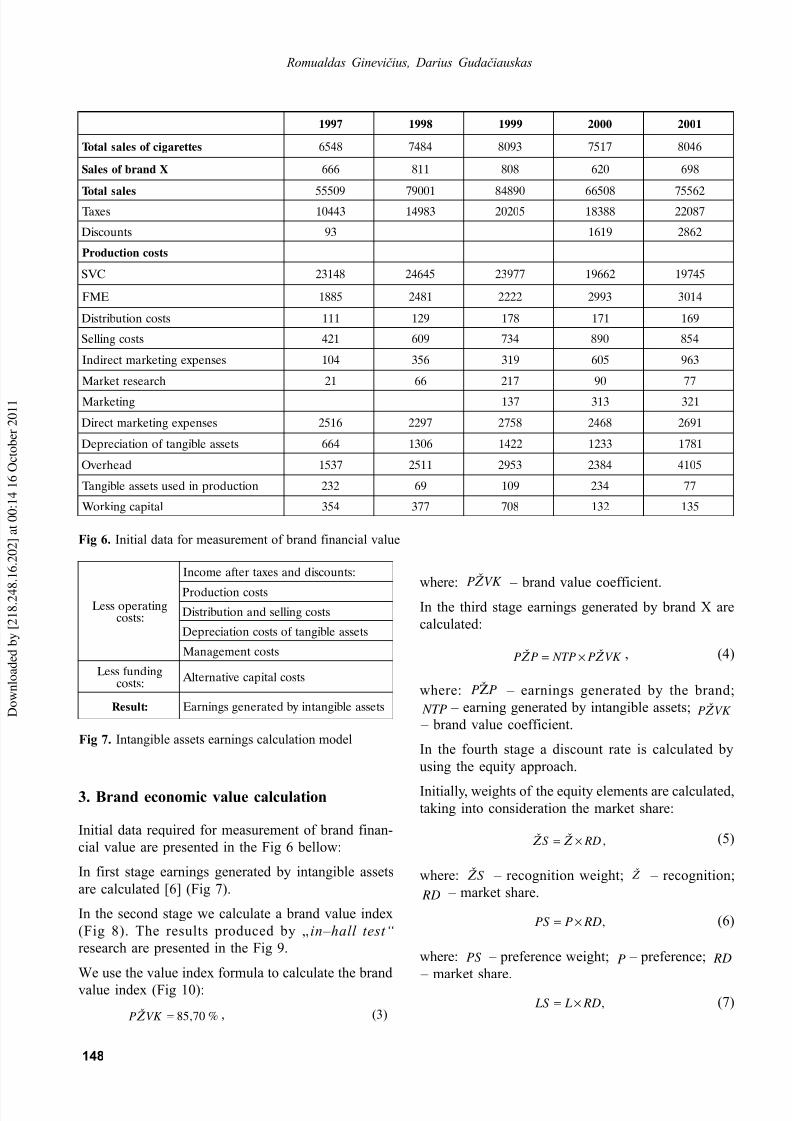
Fig 6. Initial data for measurement of brand financial value
7991 8991 9991 0002 1002
setteragicf oselaslatoT 8456 4847 3908 7157 6408
Xdnarbf oselaS 666 118 808 026 896
selaslatoT 90555 10097 09848 80566 26557se x aT 34401 38941 50202 88381 78022
stnuocsiD 39 9161 2682
stsocnoitcudorP
CVS 84132 54642 77932 26691 54791
EMF 5881 1842 2222 3992 4103
stsocnoitubirtsiD 111 921 871 171 961
stsocgnilleS 124 906 437 098 458
sesnep x egnitekramtceridnI 401 653 913 506 369
hcraesertekraM 12 66 712 09 77
gnitekraM 731 313 123
sesnep x egnitekramtceriD 6152 7922 8572 8642 1962
stessaelbignatf onoitaicerpeD 466 6031 2241 3321 1871
daehre vO 7351 1152 3592 4832 5014
noitcudorpnidesustessaelbignaT 232 96 901 432 77
latipacgnikroW 453 773 807 231 531
gnitareposseL :stsoc
:stnuocsiddnase x atretf aemocnI
stsocnoitcudorP
stsocgnillesdnanoitubirtsiD
stessaelbignatf ostsocnoitaicerpeD
stsoctnemeganaM
gnidnuf sseL :stsoc
stsoclatipace vitanretl A
:tluseR stessaelbignatni ybdetarenegsgninraE
Fig 7. Intangible assets earnings calculation model
where:VK P Þ
� brand value coefficient.In the third stage earnings generated by brand X are
calculated:
VK P NTPPP Þ Þ ×= , (4)
where: PPÞ � earnings generated by the brand;
NTP � earning generated by intangible assets; VK P Þ
� brand value coefficient.
In the fourth stage a discount rate is calculated by
using the equity approach.
Initially, weights of the equity elements are calculated,
taking into consideration the market share:
, RDS ×= Þ Þ (5)
where: S Þ � recognition weight; Þ � recognition;
RD � market share.
, RDPPS ×= (6)
where: PS � preference weight; P � preference; RD � market share.
, RD L LS ×= (7)
3. Brand economic value calculation
Initial data required for measurement of brand finan-
cial value are presented in the Fig 6 bellow:
In first stage earnings generated by intangible assets
are calculated [6] (Fig 7).
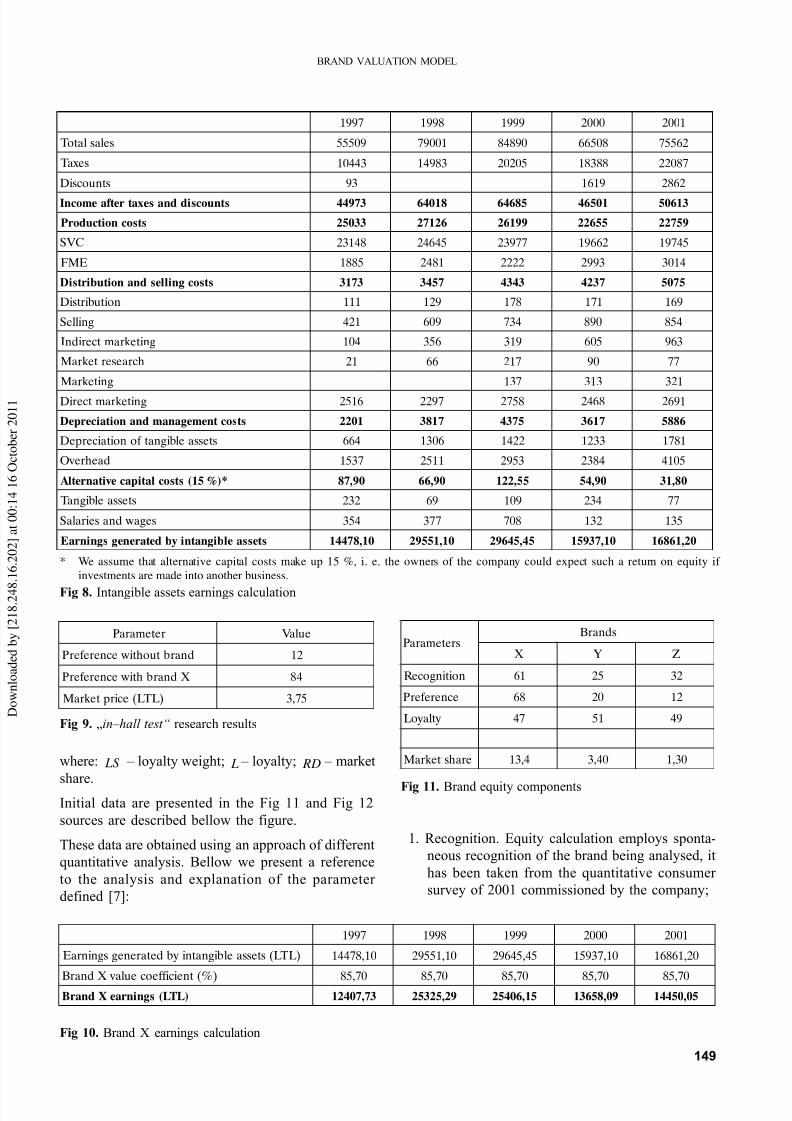
In the second stage we calculate a brand value index
(Fig 8). The results produced by � in�hall test�
research are presented in the Fig 9.
We use the value index formula to calculate the brand
value index (Fig 10):
%70,85=VK P Þ , (3)
8/3/2019 Brand Valuation Models
http://slidepdf.com/reader/full/brand-valuation-models 8/12
149
BRAND VALUATION MODEL
Fig 8. Intangible assets earnings calculation
* We assume that alternative capital costs make up 15 %, i. e. the owners of the company could expect such a return on equity if
investments are made into another business.
where: LS � loyalty weight; L � loyalty; RD � market
share.Initial data are presented in the Fig 11 and Fig 12
sources are described bellow the figure.
These data are obtained using an approach of different
quantitative analysis. Bellow we present a reference
to the analysis and explanation of the parameter
defined [7]:
Fig 9. �in�hall test� research results
7991 8991 9991 0002 1002
selaslatoT 90555 10097 09848 80566 26557
se x aT 34401 38941 50202 88381 78022
stnuocsiD 39 9161 2682
stnuocsiddnasexatretf aemocnI 37944 81046 58646 10564 31605
stsocnoitcudorP 33052 62172 99162 55622 95722
CVS 84132 54642 77932 26691 54791
EMF 5881 1842 2222 3992 4103
stsocgnillesdnanoitubirtsiD 3713 7543 3434 7324 5705
noitubirtsiD 111 921 871 171 961
gnilleS 124 906 437 098 458
gnitekramtceridnI 401 653 913 506 369
hcraesertekraM 12 66 712 09 77
gnitekraM 731 313 123
gnitekramtceriD 6152 7922 8572 8642 1962
stsoctnemeganamdnanoitaicerpeD 1022 7183 5734 7163 6885
stessaelbignatf onoitaicerpeD 466 6031 2241 3321 1871
daehre vO 7351 1152 3592 4832 5014
*)%51(stsoclatipace vitanretl A 09,78 09,66 55,221 09,45 08,13
stessaelbignaT 232 96 901 432 77
sega wdnaseiralaS 453 773 807 231 531
stessaelbignatni ybdetarenegsgninraE 01,87441 01,15592 54,54692 01,73951 02,16861
retemaraP eulaV
dnarbtuohti wecneref erP 21
Xdnarbhti wecneref erP 48
)L TL (ecirptekraM 57,3
Fig 10. Brand X earnings calculation
7991 8991 9991 0002 1002
)L TL (stessaelbignatni ybdetarenegsgninraE 01,87441 01,15592 54,54692 01,73951 02,16861
)%(tneicif f eoceula vXdnarB 07,58 07,58 07,58 07,58 07,58)LTL(sgninraeXdnarB 37,70421 92,52352 51,60452 90,85631 50,05441
sretemaraPsdnarB
X Y Z
noitingoceR 16 52 23
ecneref erP 86 02 21
ytla yoL 74 15 94
erahstekraM 4,31 04,3 03,1
Fig 11. Brand equity components
1. Recognition. Equity calculation employs sponta-
neous recognition of the brand being analysed, it
has been taken from the quantitative consumer
survey of 2001 commissioned by the company;
8/3/2019 Brand Valuation Models
http://slidepdf.com/reader/full/brand-valuation-models 9/12
150
Romualdas Ginevièius, Darius Gudaèiauskas
2. Brand preference. Brand preference is a function
of a number of qualitative and quantitative
parameters. Nevertheless, its essence lies in that
consumers, being aware of the aforementioned
parameters, choose one or another brand.
Therefore, preference may be calculated as a
percentage of consumers who have chosen one or
another brand within the same segment. The data
of the quantitative consumer survey of 2001
commissioned by the company are used;
3. Loyalty. The essence of this parameter is in that
in spite of active efforts of competitors to offer
analogous or even more advantaged from the
functionality point of view products, consumers
continue using the same brand. Therefore, the
loyalty may be calculated as a percentage of
consumers who did not change their brand over
the last 12 months. The data of the quantitative
consumer survey of 2001 commissioned by the
company are used;
4. Market share. It is a ratio of sales volumes of the
cigarette brands being analysed to the entire
market of legally sold cigarettes. The data of the
quantitative market audit of 2001 commissioned
by the company are used.
By applying formulas 5, 6, 7, we calculate weighted
equity components. The results are presented in theFig 12.
Fig 12. Weighted brand equity components
sretemaraPsdnarB
X Y Z
noitingoceR 4,718 58 06,14
ecneref erP 2,119 86 6,51
ytla yoL 8,926 4,371 7,36
After having calculated equity weights, we can calcu-
late brand X equity:
0574,84= X VV %, (8)
where: X VV � brand X equity.
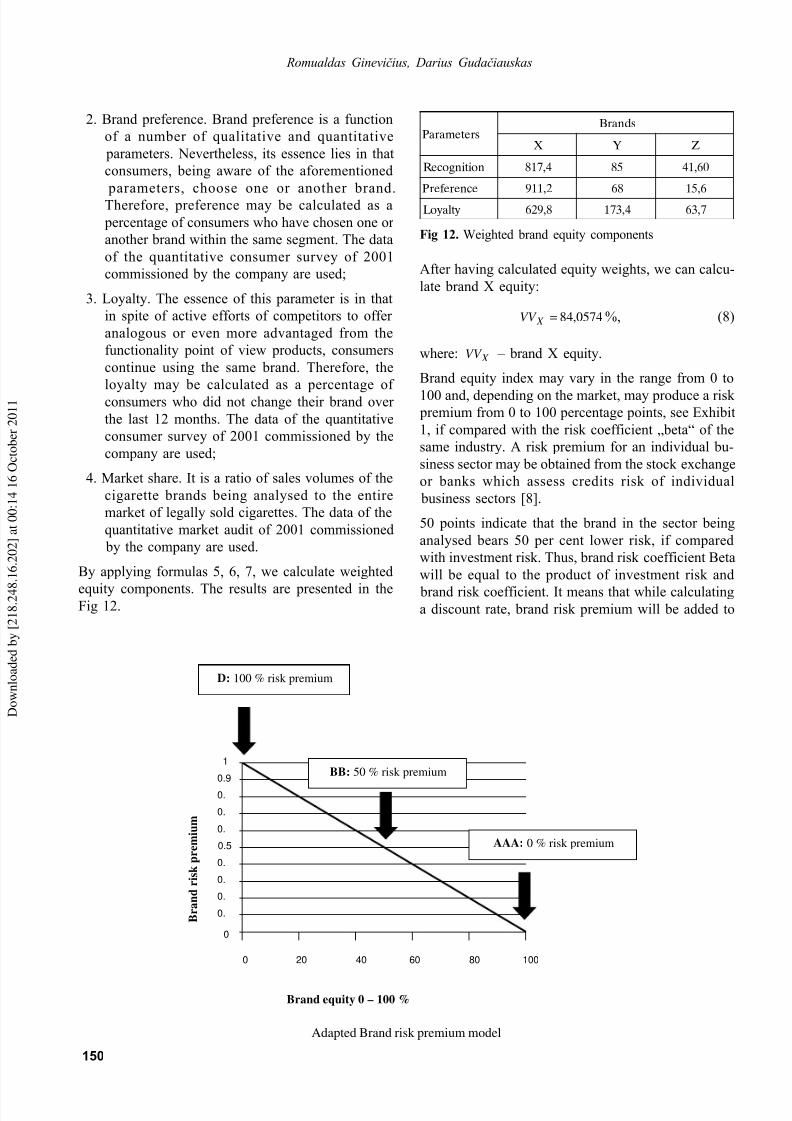
Brand equity index may vary in the range from 0 to
100 and, depending on the market, may produce a risk premium from 0 to 100 percentage points, see Exhibit
1, if compared with the risk coefficient �beta� of the
same industry. A risk premium for an individual bu-
siness sector may be obtained from the stock exchange
or banks which assess credits risk of individual
business sectors [8].
50 points indicate that the brand in the sector being
analysed bears 50 per cent lower risk, if compared
with investment risk. Thus, brand risk coefficient Beta
will be equal to the product of investment risk and
brand risk coefficient. It means that while calculatinga discount rate, brand risk premium will be added to
B r a n d r i s k p r e m i u m
0 20 40 60 80 100
0
0.
0.
0.
0.5
0.
0.
0.
0.
1
0.9
Brand equity 0 – 100 %
AAA: 0 % risk premium
D: 100 % risk premium
BB: 50 % risk premium
Adapted Brand risk premium model
8/3/2019 Brand Valuation Models
http://slidepdf.com/reader/full/brand-valuation-models 10/12
151
BRAND VALUATION MODEL
the average market risk rate. It should be noted that
in such a way the risk of brand popularity decrease is
eliminated [9].
Based on the suggested approach, the equity equal to
84,0574 corresponds to brand risk premium of 0,15.
Discount rate is calculated in the following way:
Discount rate = (βrandβeta adjusted equity cost) x(equity funding share) + (debt cost*) x (debt fundingshare). (9)
* Debt cost is equal to interest rate payable by the company to the
bank. In our case the company pays the annual interest of 5 %.
Calculations use the following funding proportions: 70 % equity
and 30 % debt funding share in the company.
Brandβeta adjusted equity cost is calculated in accor-
dance with the adapted Brand Finance formula:
Brandβeta adjusted equity cost = (equity risk premium)+ (equity risk premium) x (βrandβeta). (10)
First, we calculate Brandβeta adjusted equity cost using
formula (9):
Brandβeta adjusted equity cost = 0,09 + (0,09 x 0,15) =
0,1035.
According to the data of „Hansa Markets“ experts, a non-
risky borrowing rate is 6 % and 3 % is maximum liquidity
premium, therefore, equity risk premium is 9 %,
βrandβeta value according to the suggested model is 0,15.
After having calculated βeta adjusted equity costs
according to formula (9), we can calculate a discount
rate:
Discount rate = (0,1035x0,7)+(0,05x0,3)=0,0874.
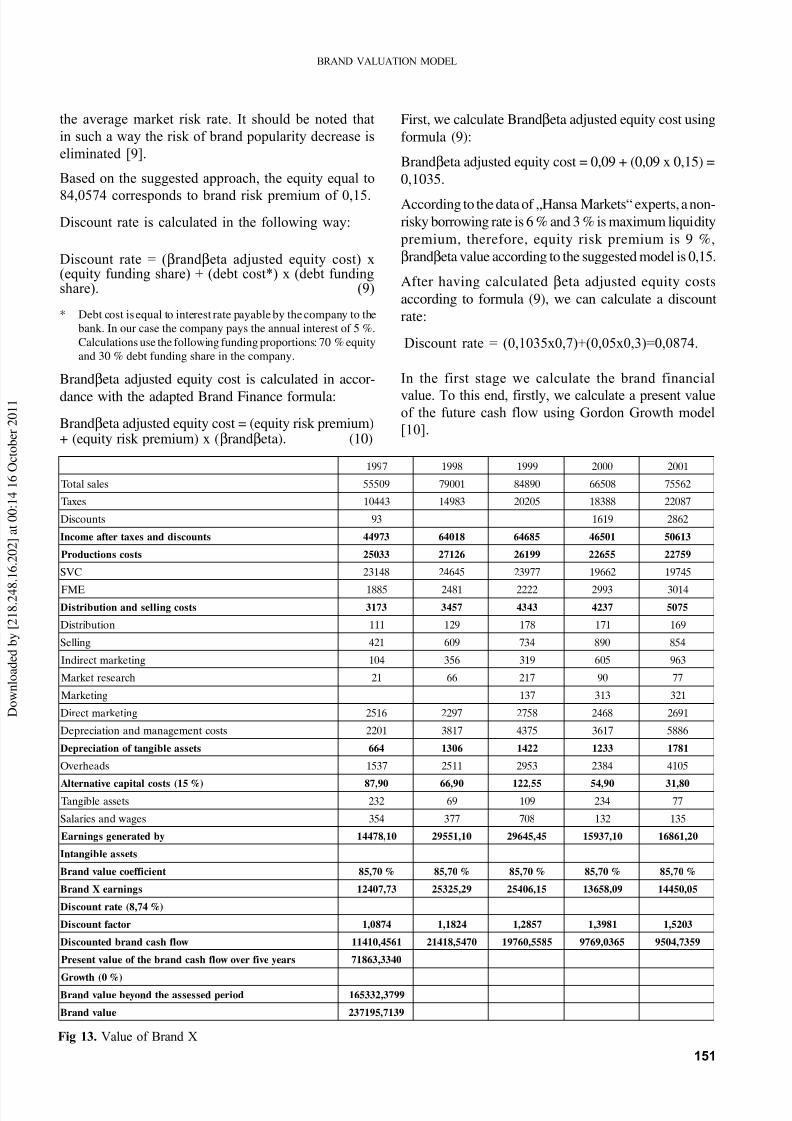
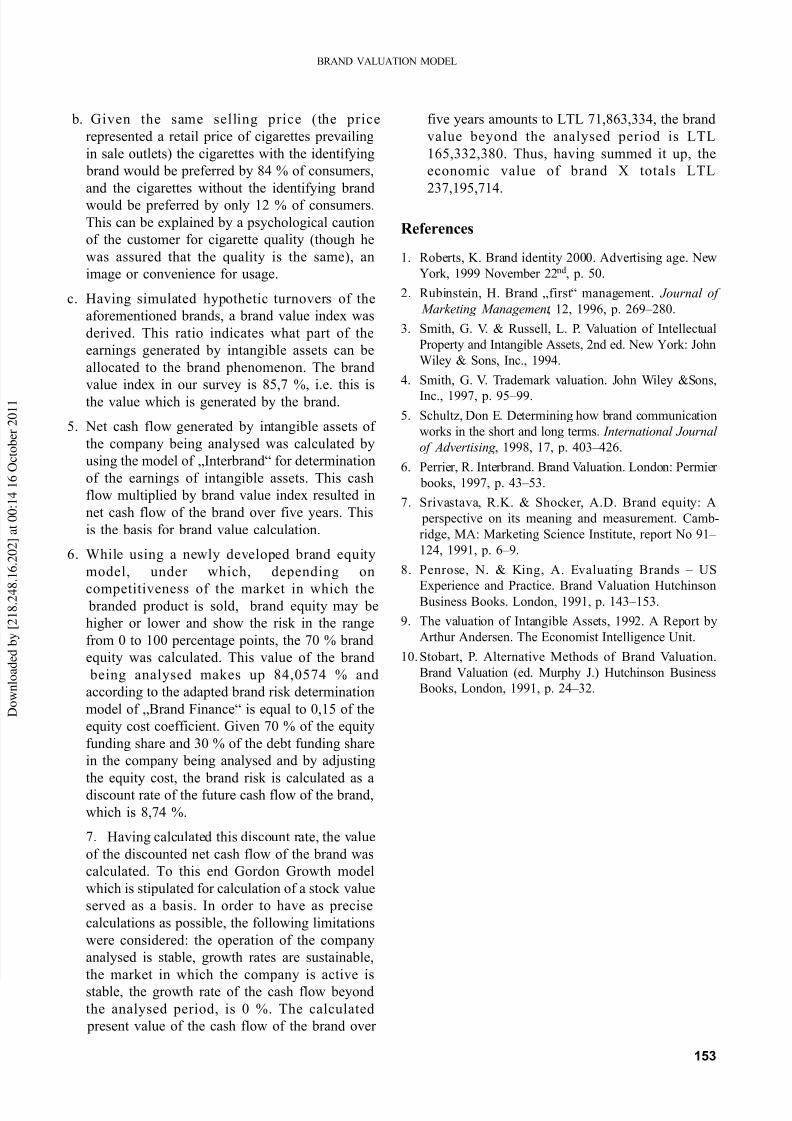
In the first stage we calculate the brand financial
value. To this end, firstly, we calculate a present valueof the future cash flow using Gordon Growth model
[10].
7991 8991 9991 0002 1002
selaslatoT 90555 10097 09848 80566 26557
se x aT 34401 38941 50202 88381 78022
stnuocsiD 39 9161 2682
stnuocsiddnasexatretf aemocnI 37944 81046 58646 10564 31605
stsocsnoitcudorP 33052 62172 99162 55622 95722
CVS 84132 54642 77932 26691 54791
EMF 5881 1842 2222 3992 4103
stsocgnillesdnanoitubirtsiD 3713 7543 3434 7324 5705
noitubirtsiD 111 921 871 171 961
gnilleS 124 906 437 098 458
gnitekramtceridnI 401 653 913 506 369
hcraesertekraM 12 66 712 09 77
gnitekraM 731 313 123
gnitekramtceriD 6152 7922 8572 8642 1962
stsoctnemeganamdnanoitaicerpeD 1022 7183 5734 7163 6885
stessaelbignatf onoitaicerpeD 466 6031 2241 3321 1871
sdaehre vO 7351 1152 3592 4832 5014
)%51(stsoclatipace vitanretl A 09,78 09,66 55,221 09,45 08,13stessaelbignaT 232 96 901 432 77
sega wdnaseiralaS 453 773 807 231 531
ybdetarenegsgninraE 01,87441 01,15592 54,54692 01,73951 02,16861
stessaelbignatnI
tneicif f eoceula vdnarB %07,58 %07,58 %07,58 %07,58 %07,58
sgninraeXdnarB 37,70421 92,52352 51,60452 90,85631 50,05441
)%47,8(etartnuocsiD
rotcaf tnuocsiD 4780,1 4281,1 7582,1 1893,1 3025,1
w olf hsacdnarbdetnuocsiD 1654,01411 0745,81412 5855,06791 5630,9679 9537,4059
srae ye vif re vo w olf hsacdnarbehtf oeula vtneserP 0433,36817
)%0(ht w orGdoirepdessessaehtdno yebeula vdnarB 9973,233561
eula vdnarB 9317,591732
Fig 13. Value of Brand X
8/3/2019 Brand Valuation Models
http://slidepdf.com/reader/full/brand-valuation-models 11/12
152
Romualdas Ginevièius, Darius Gudaèiauskas
52)1(
5...
)1(
2
1
1
DN
PS years
DN
PS years
DN
PS year PV
+
++
+
++
= , (11)
where: PV � present value of the cash flow; PS �
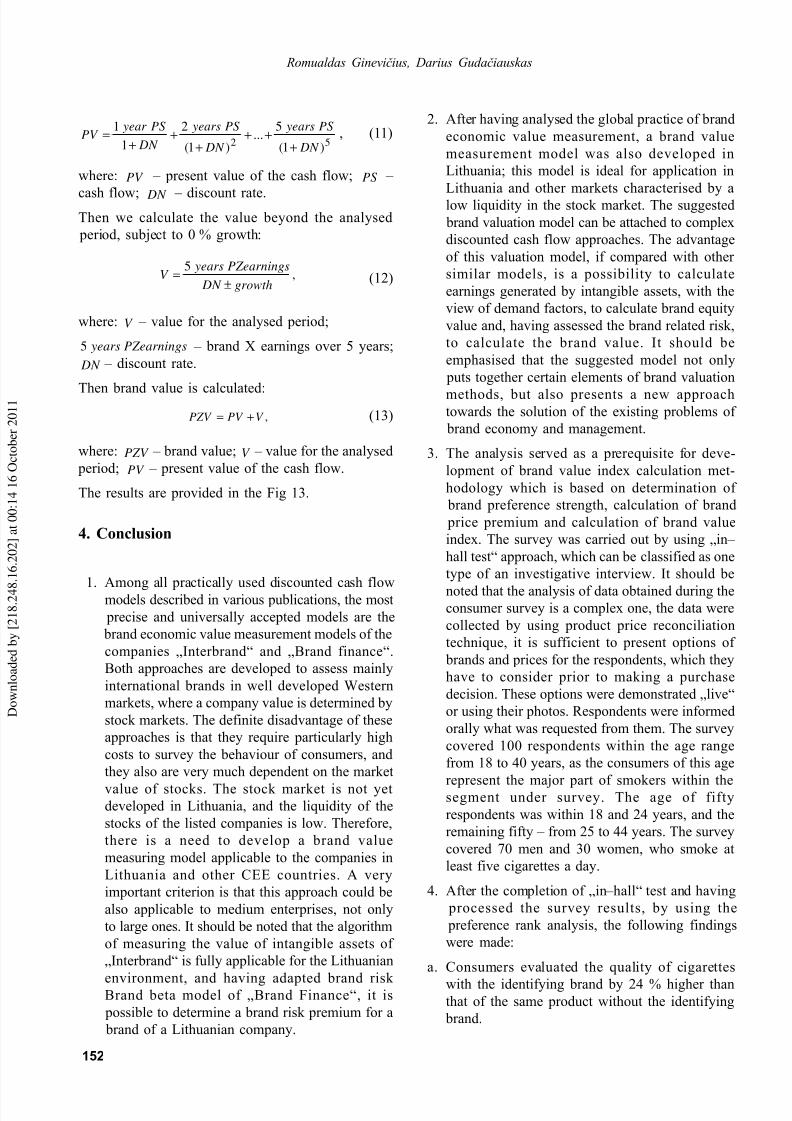
cash flow; DN � discount rate.Then we calculate the value beyond the analysed
period, subject to 0 % growth:
,5
growth DN
PZearnings yearsV
±= (12)
where: V � value for the analysed period;
PZearnings years5 � brand X earnings over 5 years;
DN � discount rate.
Then brand value is calculated:
,V PV PZV += (13)
where: PZV � brand value; V � value for the analysed
period; PV � present value of the cash flow.
The results are provided in the Fig 13.
4. Conclusion
1. Among all practically used discounted cash flowmodels described in various publications, the most
precise and universally accepted models are the
brand economic value measurement models of the
companies �Interbrand� and �Brand finance�.
Both approaches are developed to assess mainly
international brands in well developed Western
markets, where a company value is determined by
stock markets. The definite disadvantage of these
approaches is that they require particularly high
costs to survey the behaviour of consumers, and
they also are very much dependent on the market
value of stocks. The stock market is not yetdeveloped in Lithuania, and the liquidity of the
stocks of the listed companies is low. Therefore,
there is a need to develop a brand value
measuring model applicable to the companies in
Lithuania and other CEE countries. A very
important criterion is that this approach could be
also applicable to medium enterprises, not only
to large ones. It should be noted that the algorithm
of measuring the value of intangible assets of
�Interbrand� is fully applicable for the Lithuanian
environment, and having adapted brand risk Brand beta model of �Brand Finance�, it is
possible to determine a brand risk premium for a
brand of a Lithuanian company.
2. After having analysed the global practice of brand
economic value measurement, a brand value
measurement model was also developed in
Lithuania; this model is ideal for application in
Lithuania and other markets characterised by a
low liquidity in the stock market. The suggested
brand valuation model can be attached to complex
discounted cash flow approaches. The advantage
of this valuation model, if compared with other
similar models, is a possibility to calculate
earnings generated by intangible assets, with the
view of demand factors, to calculate brand equity
value and, having assessed the brand related risk,
to calculate the brand value. It should be
emphasised that the suggested model not only
puts together certain elements of brand valuation
methods, but also presents a new approachtowards the solution of the existing problems of
brand economy and management.
3. The analysis served as a prerequisite for deve-
lopment of brand value index calculation met-
hodology which is based on determination of
brand preference strength, calculation of brand
price premium and calculation of brand value
index. The survey was carried out by using �in�
hall test� approach, which can be classified as one
type of an investigative interview. It should be
noted that the analysis of data obtained during theconsumer survey is a complex one, the data were
collected by using product price reconciliation
technique, it is sufficient to present options of
brands and prices for the respondents, which they
have to consider prior to making a purchase
decision. These options were demonstrated �live�
or using their photos. Respondents were informed
orally what was requested from them. The survey
covered 100 respondents within the age range
from 18 to 40 years, as the consumers of this age
represent the major part of smokers within thesegment under survey. The age of fifty
respondents was within 18 and 24 years, and the
remaining fifty � from 25 to 44 years. The survey
covered 70 men and 30 women, who smoke at
least five cigarettes a day.
4. After the completion of �in�hall� test and having
processed the survey results, by using the
preference rank analysis, the following findings
were made:
a. Consumers evaluated the quality of cigarettes
with the identifying brand by 24 % higher thanthat of the same product without the identifying
brand.
8/3/2019 Brand Valuation Models
http://slidepdf.com/reader/full/brand-valuation-models 12/12
153
BRAND VALUATION MODEL
b. Given the same selling price (the price
represented a retail price of cigarettes prevailing
in sale outlets) the cigarettes with the identifying
brand would be preferred by 84 % of consumers,
and the cigarettes without the identifying brand
would be preferred by only 12 % of consumers.
This can be explained by a psychological caution
of the customer for cigarette quality (though he
was assured that the quality is the same), an
image or convenience for usage.
c. Having simulated hypothetic turnovers of the
aforementioned brands, a brand value index was
derived. This ratio indicates what part of the
earnings generated by intangible assets can be
allocated to the brand phenomenon. The brand
value index in our survey is 85,7 %, i.e. this is
the value which is generated by the brand.
5. Net cash flow generated by intangible assets of
the company being analysed was calculated by
using the model of �Interbrand� for determination
of the earnings of intangible assets. This cash
flow multiplied by brand value index resulted in
net cash flow of the brand over five years. This
is the basis for brand value calculation.
6. While using a newly developed brand equity
model, under which, depending on
competitiveness of the market in which the branded product is sold, brand equity may be
higher or lower and show the risk in the range
from 0 to 100 percentage points, the 70 % brand
equity was calculated. This value of the brand
being analysed makes up 84,0574 % and
according to the adapted brand risk determination
model of �Brand Finance� is equal to 0,15 of the
equity cost coefficient. Given 70 % of the equity
funding share and 30 % of the debt funding share
in the company being analysed and by adjusting
the equity cost, the brand risk is calculated as a
discount rate of the future cash flow of the brand,
which is 8,74 %.
7. Having calculated this discount rate, the value
of the discounted net cash flow of the brand was
calculated. To this end Gordon Growth model
which is stipulated for calculation of a stock value
served as a basis. In order to have as precise
calculations as possible, the following limitations
were considered: the operation of the company
analysed is stable, growth rates are sustainable,
the market in which the company is active is
stable, the growth rate of the cash flow beyond
the analysed period, is 0 %. The calculated
present value of the cash flow of the brand over
five years amounts to LTL 71,863,334, the brand
value beyond the analysed period is LTL
165,332,380. Thus, having summed it up, the
economic value of brand X totals LTL
237,195,714.
References
1. Roberts, K. Brand identity 2000. Advertising age. New
York, 1999 November 22nd, p. 50.
2. Rubinstein, H. Brand �first� management. Journal of
Marketing Management , 12, 1996, p. 269�280.
3. Smith, G. V. & Russell, L. P. Valuation of Intellectual
Property and Intangible Assets, 2nd ed. New York: John
Wiley & Sons, Inc., 1994.
4. Smith, G. V. Trademark valuation. John Wiley &Sons,
Inc., 1997, p. 95�99.
5. Schultz, Don E. Determining how brand communication
works in the short and long terms. International Journal
of Advertising , 1998, 17, p. 403�426.
6. Perrier, R. Interbrand. Brand Valuation. London: Permier
books, 1997, p. 43�53.
7. Srivastava, R.K. & Shocker, A.D. Brand equity: A
perspective on its meaning and measurement. Camb-
ridge, MA: Marketing Science Institute, report No 91�
124, 1991, p. 6�9.
8. Penrose, N. & King, A. Evaluating Brands � US
Experience and Practice. Brand Valuation HutchinsonBusiness Books. London, 1991, p. 143�153.
9. The valuation of Intangible Assets, 1992. A Report by
Arthur Andersen. The Economist Intelligence Unit.
10. Stobart, P. Alternative Methods of Brand Valuation.
Brand Valuation (ed. Murphy J.) Hutchinson Business
Books, London, 1991, p. 24�32.