2016 brand valuation review
TRANSCRIPT
P1 Does Marketing Matter? January 2009
Brand Valuation: 2016 Results
Comparison of the 2016 League Tables from Interbrand, Millward Brown & Brand Finance
Analysis by Type 2 Consulting January 2017

P2
Brand Valuation: Major Providers
Three brand consultancies that have published annual brand value league tables since 2007: Interbrand “100 Best Global Brands” Published in October Millward Brown “Top 100 List” Published in May Brand Finance “The World’s 500 Most Valuable Brands” Published in February A fourth consultancy - the European Brand Institute – also published an annual league table from 2011 to 2015
P3
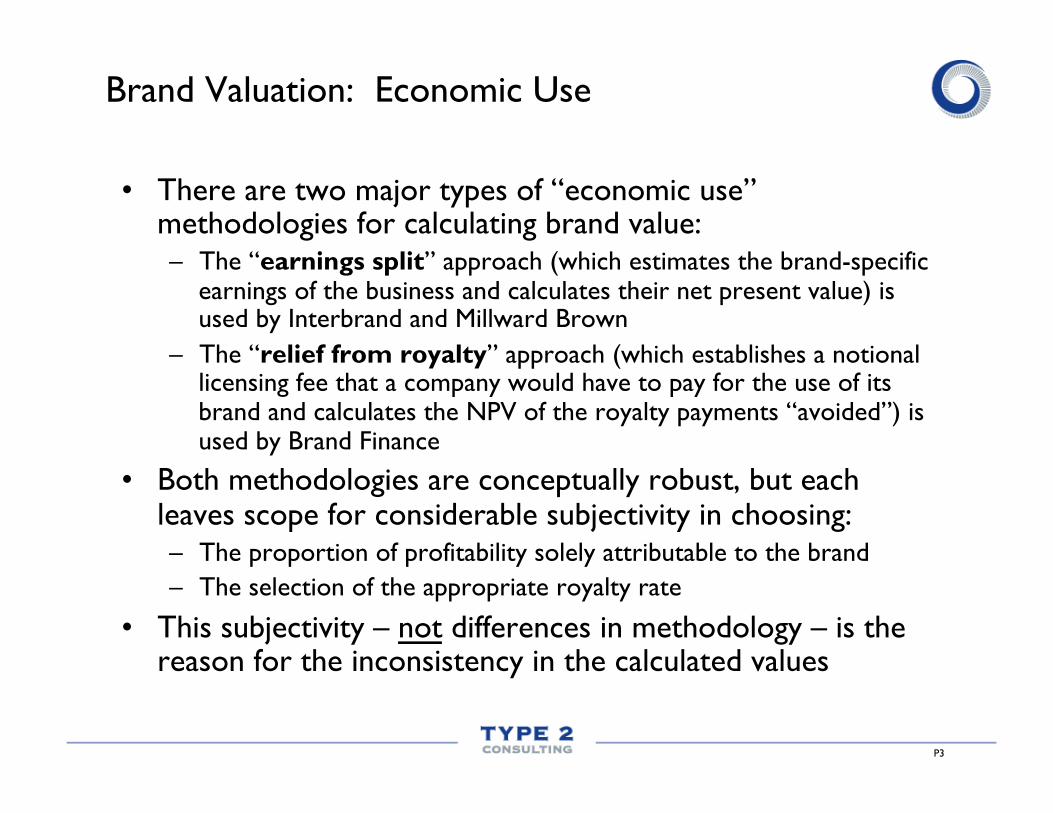
Brand Valuation: Economic Use
• There are two major types of “economic use” methodologies for calculating brand value: – The “earnings split” approach (which estimates the brand-specific
earnings of the business and calculates their net present value) is used by Interbrand and Millward Brown
– The “relief from royalty” approach (which establishes a notional licensing fee that a company would have to pay for the use of its brand and calculates the NPV of the royalty payments “avoided”) is used by Brand Finance
• Both methodologies are conceptually robust, but each leaves scope for considerable subjectivity in choosing: – The proportion of profitability solely attributable to the brand – The selection of the appropriate royalty rate
• This subjectivity – not differences in methodology – is the reason for the inconsistency in the calculated values
P4
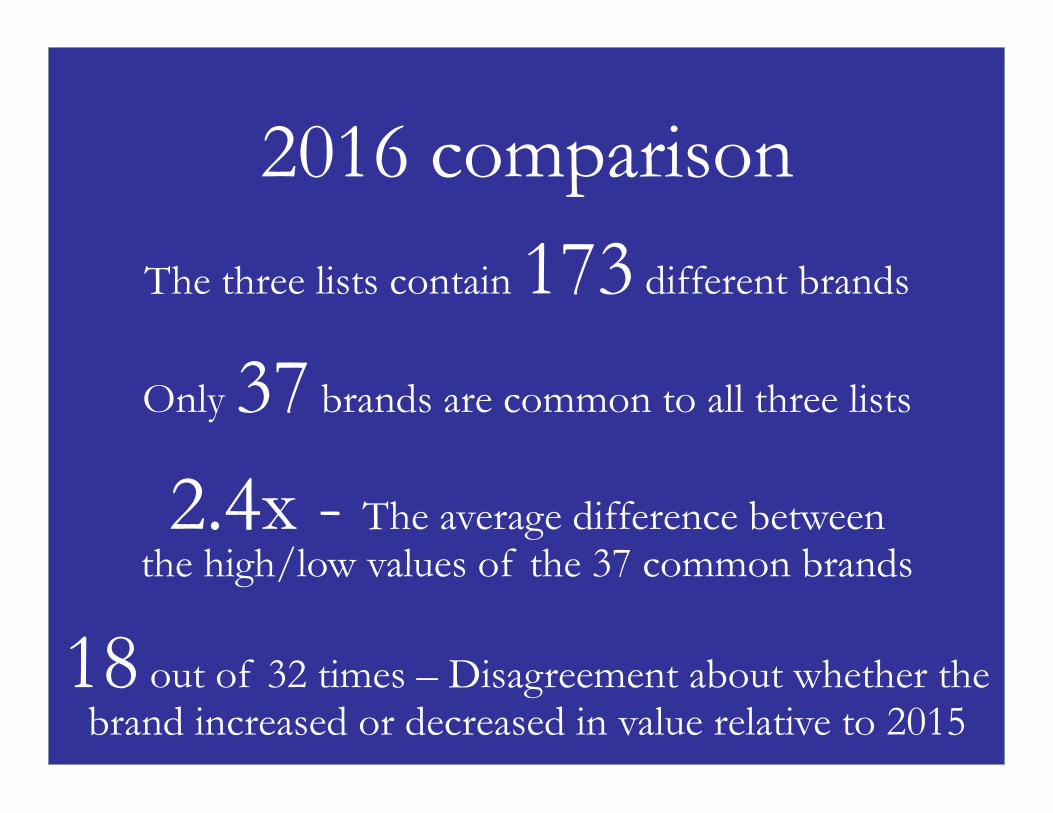
2016 comparison
The three lists contain 173 different brands
Only 37 brands are common to all three lists
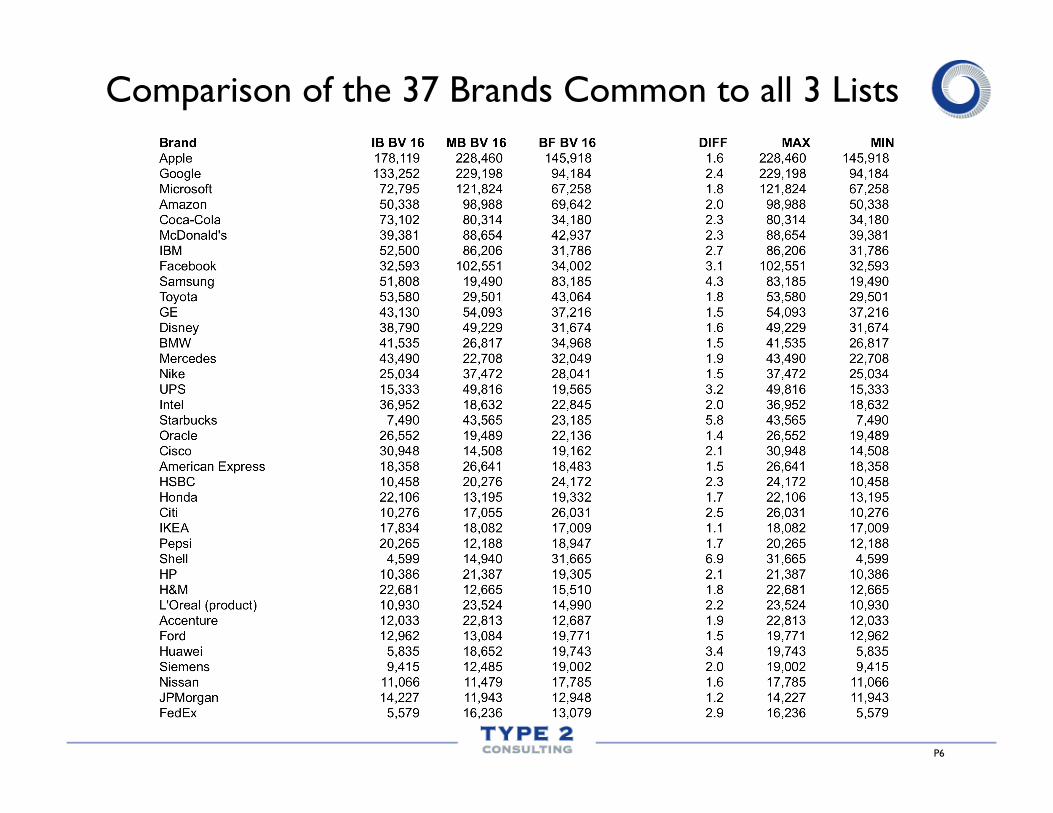
2.4x - The average difference between the high/low values of the 37 common brands
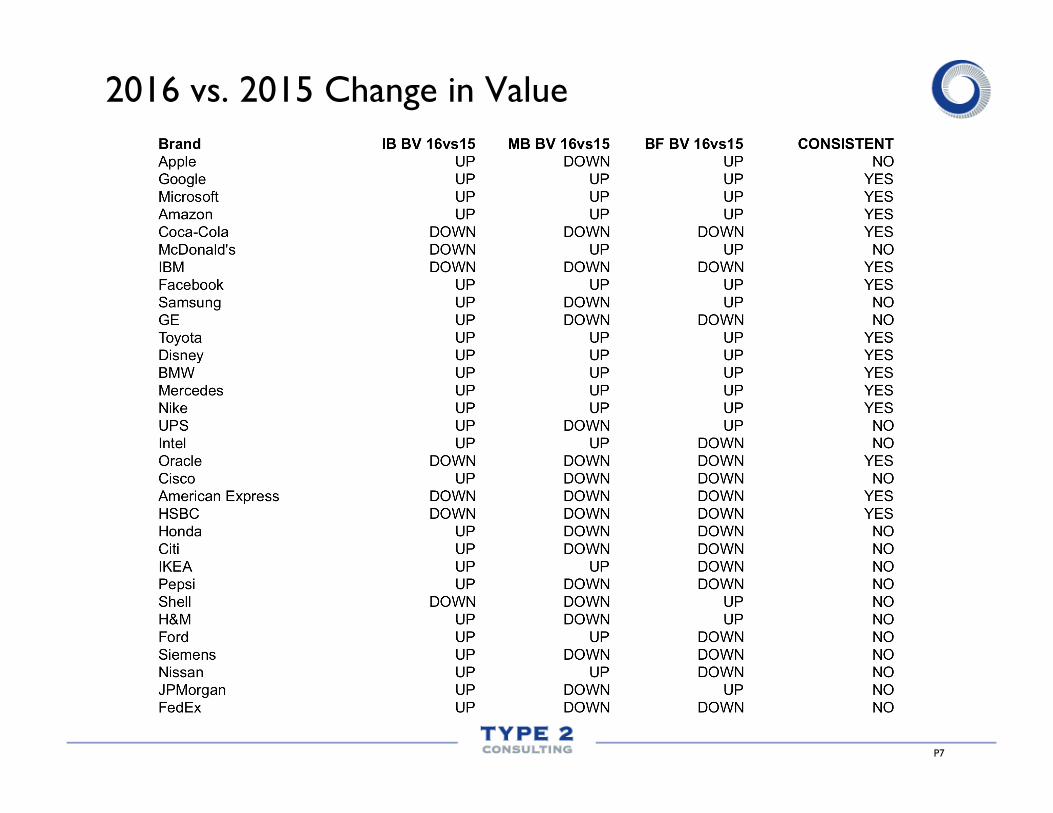
18 out of 32 times – Disagreement about whether the brand increased or decreased in value relative to 2015
P5
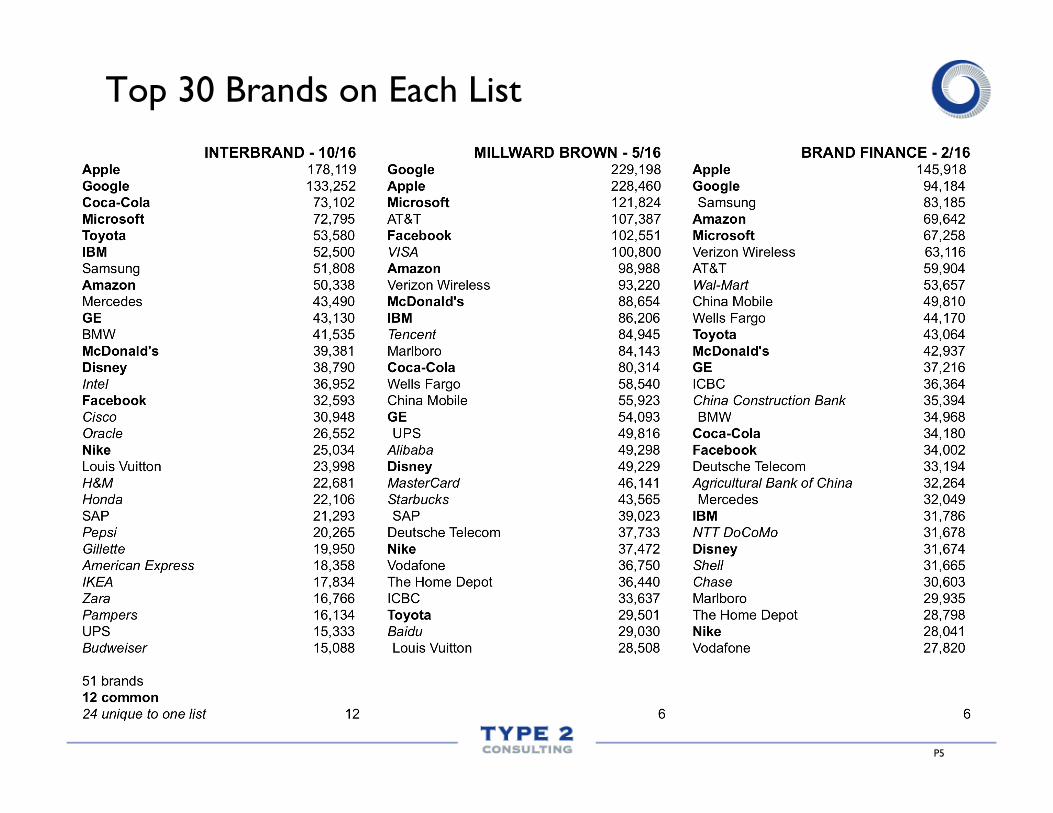
Top 30 Brands on Each List
P6
Comparison of the 37 Brands Common to all 3 Lists
P7
2016 vs. 2015 Change in Value
P8
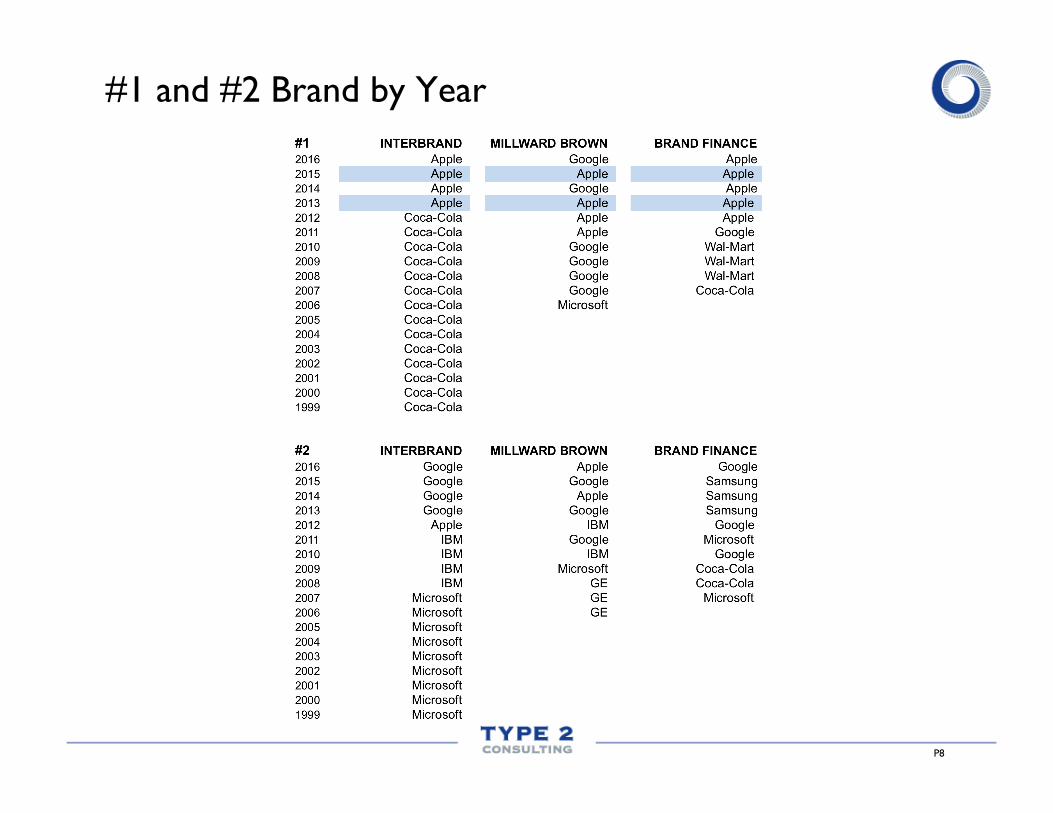
#1 and #2 Brand by Year
P9
Are the Results Converging?
• The answer is “not obviously”: – The number of brands appearing in the three top 100 lists in 2016
was 173 (versus 176, 176, 181, and 185 in the previous four years) – The number of brands common to the three top 100 lists was 37 in
2016 (compared to 36, 37, 34 and 33 in the previous four years) – The high/low valuations of the same brand each year differ by an
average multiple of 2.4 (compared with 2.2x in previous years) – 56% of the time (18 out of 32 times), there was disagreement
between the lists about whether the same brand had increased or decreased in value versus 2015 (for previous years, there had been disagreement 53%, 33%, 41% and 38% of the time)
– The top 30 list from each consultancy contains almost as many brands that are unique to that list (an average of 8) as they include brands that are common to all three lists (12 in 2016)
P10
What Should We Conclude from this Inconsistency?
• Brand valuation is in its infancy as a discipline: – There is no GAAP-equivalent standard for how to measure the strength of a
brand, leaving room for considerable subjectivity in the assumptions included in the various valuation models
– There is no consensus on the definition of a brand, and therefore no consensus about how to assess the relative importance of communication versus other factors (NPD, distribution weight, customer service and other important determinants of the customer experience)
• It is a mistake for marketers to view brand valuation as a “silver bullet” for proving the business value of marketing: – The wide variation in the published valuations undermines the credibility of
brand valuation among business audiences – Brand valuation involves treating the brand as if it were a standalone asset that
is the sole responsibility of marketing, and this creates a “zero sum” dynamic between marketing and other functions of the business about what is driving the distinctiveness of the customer experience (and this is, after all, what the brand represents)

P11
Brand as a Proportion of Market Value
• The inconsistency between the results suggests it is unwise to rely on the data of the consultancies at the individual company level
• However, the aggregation of these data points provides an indication of the relative importance of brands across different industries
• The following slides contains Type 2 Consulting’s analysis of the proportion of market capitalization in different industry sectors that is represented by brands (it uses the 2010 to 2014 data published by Brand Finance, Eurobrand, Interbrand and Millward Brown)
P12
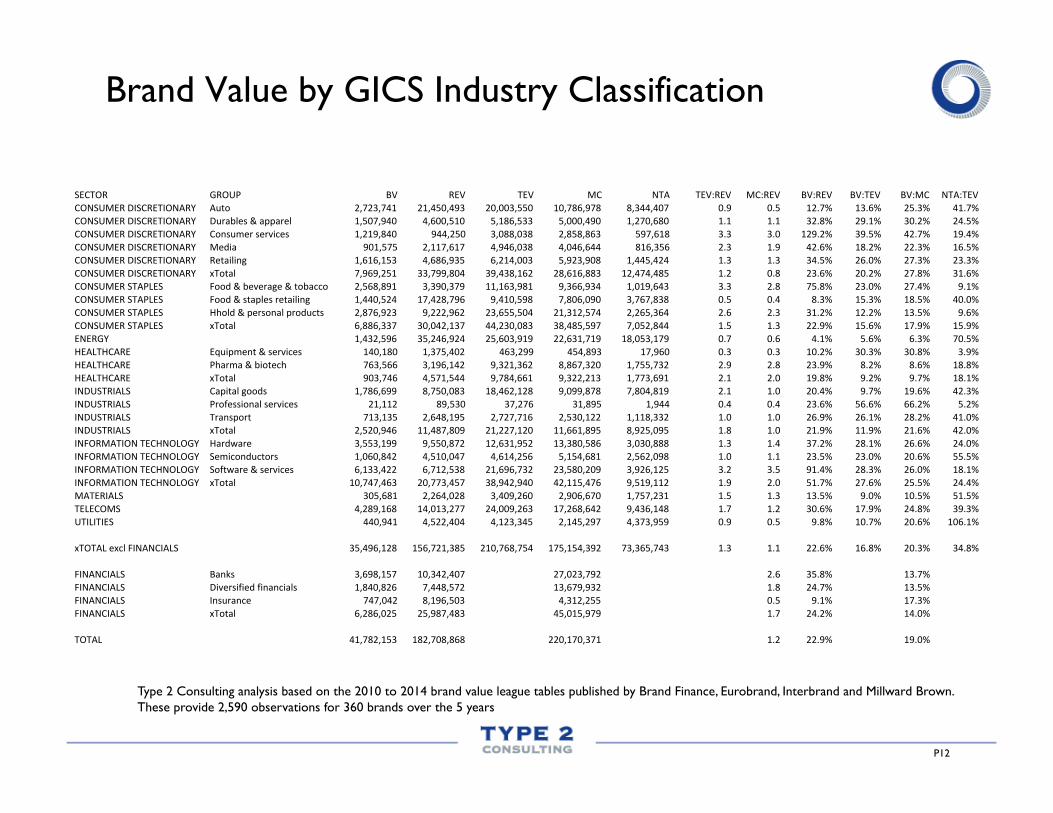
Brand Value by GICS Industry Classification
Type 2 Consulting analysis based on the 2010 to 2014 brand value league tables published by Brand Finance, Eurobrand, Interbrand and Millward Brown. These provide 2,590 observations for 360 brands over the 5 years
SECTOR GROUP BV REV TEV MC NTA TEV:REV MC:REV BV:REV BV:TEV BV:MC NTA:TEVCONSUMER0DISCRETIONARY Auto 2,723,7410000000 21,450,49300000 20,003,55000000 10,786,97800000 8,344,4070000000 0.900000000000 0.500000000000 12.7% 13.6% 25.3% 41.7%CONSUMER0DISCRETIONARY Durables0&0apparel 1,507,9400000000 4,600,5100000000 5,186,5330000000 5,000,4900000000 1,270,6800000000 1.100000000000 1.100000000000 32.8% 29.1% 30.2% 24.5%CONSUMER0DISCRETIONARY Consumer0services 1,219,8400000000 944,2500000000000 3,088,0380000000 2,858,8630000000 597,6180000000000 3.300000000000 3.000000000000 129.2% 39.5% 42.7% 19.4%CONSUMER0DISCRETIONARY Media 901,5750000000000 2,117,6170000000 4,946,0380000000 4,046,6440000000 816,3560000000000 2.300000000000 1.900000000000 42.6% 18.2% 22.3% 16.5%CONSUMER0DISCRETIONARY Retailing 1,616,1530000000 4,686,9350000000 6,214,0030000000 5,923,9080000000 1,445,4240000000 1.300000000000 1.300000000000 34.5% 26.0% 27.3% 23.3%CONSUMER0DISCRETIONARY xTotal 7,969,2510000000 33,799,80400000 39,438,16200000 28,616,88300000 12,474,48500000 1.200000000000 0.800000000000 23.6% 20.2% 27.8% 31.6%CONSUMER0STAPLES Food0&0beverage0&0tobacco 2,568,8910000000 3,390,3790000000 11,163,98100000 9,366,9340000000 1,019,6430000000 3.300000000000 2.800000000000 75.8% 23.0% 27.4% 9.1%CONSUMER0STAPLES Food0&0staples0retailing 1,440,5240000000 17,428,79600000 9,410,5980000000 7,806,0900000000 3,767,8380000000 0.500000000000 0.400000000000 8.3% 15.3% 18.5% 40.0%CONSUMER0STAPLES Hhold0&0personal0products 2,876,9230000000 9,222,9620000000 23,655,50400000 21,312,57400000 2,265,3640000000 2.600000000000 2.300000000000 31.2% 12.2% 13.5% 9.6%CONSUMER0STAPLES xTotal 6,886,3370000000 30,042,13700000 44,230,08300000 38,485,59700000 7,052,8440000000 1.500000000000 1.300000000000 22.9% 15.6% 17.9% 15.9%ENERGY 1,432,5960000000 35,246,92400000 25,603,91900000 22,631,71900000 18,053,17900000 0.700000000000 0.600000000000 4.1% 5.6% 6.3% 70.5%HEALTHCARE Equipment0&0services 140,1800000000000 1,375,4020000000 463,2990000000000 454,8930000000000 17,960000000000000 0.300000000000 0.300000000000 10.2% 30.3% 30.8% 3.9%HEALTHCARE Pharma0&0biotech 763,5660000000000 3,196,1420000000 9,321,3620000000 8,867,3200000000 1,755,7320000000 2.900000000000 2.800000000000 23.9% 8.2% 8.6% 18.8%HEALTHCARE xTotal 903,7460000000000 4,571,5440000000 9,784,6610000000 9,322,2130000000 1,773,6910000000 2.100000000000 2.000000000000 19.8% 9.2% 9.7% 18.1%INDUSTRIALS Capital0goods 1,786,6990000000 8,750,0830000000 18,462,12800000 9,099,8780000000 7,804,8190000000 2.100000000000 1.000000000000 20.4% 9.7% 19.6% 42.3%INDUSTRIALS Professional0services 21,112000000000000 89,530000000000000 37,276000000000000 31,895000000000000 1,94400000000000000 0.400000000000 0.400000000000 23.6% 56.6% 66.2% 5.2%INDUSTRIALS Transport 713,1350000000000 2,648,1950000000 2,727,7160000000 2,530,1220000000 1,118,3320000000 1.000000000000 1.000000000000 26.9% 26.1% 28.2% 41.0%INDUSTRIALS xTotal 2,520,9460000000 11,487,80900000 21,227,12000000 11,661,89500000 8,925,0950000000 1.800000000000 1.000000000000 21.9% 11.9% 21.6% 42.0%INFORMATION0TECHNOLOGY Hardware 3,553,1990000000 9,550,8720000000 12,631,95200000 13,380,58600000 3,030,8880000000 1.300000000000 1.400000000000 37.2% 28.1% 26.6% 24.0%INFORMATION0TECHNOLOGY Semiconductors 1,060,8420000000 4,510,0470000000 4,614,2560000000 5,154,6810000000 2,562,0980000000 1.000000000000 1.100000000000 23.5% 23.0% 20.6% 55.5%INFORMATION0TECHNOLOGY Software0&0services 6,133,4220000000 6,712,5380000000 21,696,73200000 23,580,20900000 3,926,1250000000 3.200000000000 3.500000000000 91.4% 28.3% 26.0% 18.1%INFORMATION0TECHNOLOGY xTotal 10,747,46300000 20,773,45700000 38,942,94000000 42,115,47600000 9,519,1120000000 1.900000000000 2.000000000000 51.7% 27.6% 25.5% 24.4%MATERIALS 305,6810000000000 2,264,0280000000 3,409,2600000000 2,906,6700000000 1,757,2310000000 1.500000000000 1.300000000000 13.5% 9.0% 10.5% 51.5%TELECOMS 4,289,1680000000 14,013,27700000 24,009,26300000 17,268,64200000 9,436,1480000000 1.700000000000 1.200000000000 30.6% 17.9% 24.8% 39.3%UTILITIES 440,9410000000000 4,522,4040000000 4,123,3450000000 2,145,2970000000 4,373,9590000000 0.900000000000 0.500000000000 9.8% 10.7% 20.6% 106.1%
xTOTAL0excl0FINANCIALS 35,496,12800000 156,721,38500 210,768,75400 175,154,39200 73,365,74300000 1.300000000000 1.100000000000 22.6% 16.8% 20.3% 34.8%
FINANCIALS Banks 3,698,1570000000 10,342,40700000 27,023,79200000 2.600000000000 35.8% 13.7%FINANCIALS Diversified0financials 1,840,8260000000 7,448,5720000000 13,679,93200000 1.800000000000 24.7% 13.5%FINANCIALS Insurance 747,0420000000000 8,196,5030000000 4,312,2550000000 0.500000000000 9.1% 17.3%FINANCIALS xTotal 6,286,0250000000 25,987,48300000 45,015,97900000 1.700000000000 24.2% 14.0%
TOTAL 41,782,15300000 182,708,86800 220,170,37100 1.200000000000 22.9% 19.0%
P13
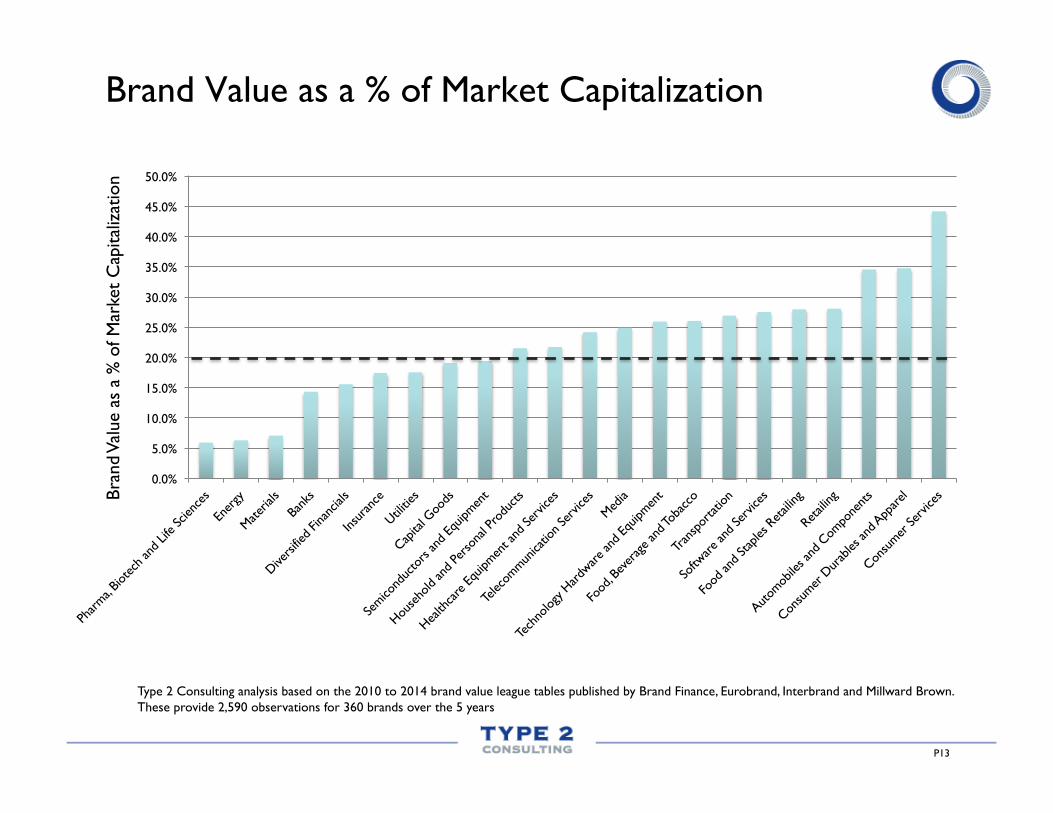
Brand Value as a % of Market Capitalization
0.0%
5.0%
10.0%
15.0%
20.0%
25.0%
30.0%
35.0%
40.0%
45.0%
50.0%
Type 2 Consulting analysis based on the 2010 to 2014 brand value league tables published by Brand Finance, Eurobrand, Interbrand and Millward Brown. These provide 2,590 observations for 360 brands over the 5 years
Bran
d Va
lue
as a
% o
f Mar
ket
Cap
italiz
atio
n

P14
16 East 40th Street 13th Floor Penthouse
New York NY 10016
C: 646 345 6782 T: 212 537 9200 F: 212 658 9869