bloomberg commodity index (bcom) tables & charts – april … · 2018-05-25 · bloomberg...
TRANSCRIPT

Bloomberg Commodity Index (BCOM) Tables & Charts – April 2017 Edition
A Month to Avoid Repeating - April Commodities - Industrial commodities, energy and industrial metals lead April decliners - Reflation story may be at risk if April commodity trends are sustained - Supply dominated energy remains a primary drag on index returns - Most would like to reverse April metals trends; copper weak, gold the stalwart - The big agriculture short, farmers plant the seeds as hedge funds drill the market with shorts - Lower commodity and higher bond prices are not supportive of further Fed tightening
Mike McGlone – BI Senior Analyst; Commodities. BI COMD (the commodity dashboard)
Reflation Story at Risk If April Commodity Trends Sustained Performance: April -1.5%, YTD -3.8%, Spot -1.6%. (returns are total return (TR) unless noted)
For the sake of the global economic outlook, it may be best if April's weak commodity-market nuances aren't sustained. Down 1.5% for the month and off 3.8% in 2017, the Bloomberg Commodity Index Total Return decline isn't severe, but occurs despite a weaker dollar and led by energy. In giving back about half of this year's gains in April and with gold up, industrial metals will be of concern if these trends continue. Oversupplied energy remains the primary broad commodity pressure factor.
Ending the month in the middle of the range, crude oil may need to probe support near $45 a barrel to cleanse overweight longs. Agriculture remained under planting-season pressure, but at high risk of a short-covering rally. If the dollar has peaked, precious metals should remain a leader.
Commodities vs. Bonds May Be Reversing Recovery
MACRO OUTLOOK
In Dollar-Commodity Tango, One Side Likely to Prevail in 2017. Coincident declines of about 4% this year in the Bloomberg Commodity and Dollar Spot indexes are unlikely to be sustained, since one side usually gives. Since 2004, BCOM's monthly beta to the value of the dollar is minus 1.6. If the dollar has ended its near-historic rally since 2013, commodities should be primary beneficiaries. The fact that the dollar is down about 1% in the current rate-hike cycle is a toppish indication, notably if rate expectations decline.
The dollar is showing signs of peaking while U.S. and China GDP, PMI and CPI are increasing, leaving crude oil as the primary remaining factor for a broad commodity recovery. If these trends are sustained and crude oil stabilizes, the BCOM index is likely to resume 2016's recovery.
Dollar, Commodities Both on the Bottom Is Rare
If This Fed Indicator Trend Is Sustained, Bias May Tilt to Ease. If the 2017 trend of lower commodities and higher bond prices continues, rate-hike expectations may shift to cuts. Although distorted a bit by the 2008 financial crisis, a good proxy for Federal Reserve rate cycles are trends in the spot Bloomberg Commodity Index vs. the BC U.S. Treasury 20+ Year index. Commodities are down slightly in 2017, but leadership by precious rather than industrial metals isn't a good indication for more tightening, coincident with a 3% gain in Treasuries with
Market Commentary 1 Energy 3 Metals 6 Agriculture 10
DATAPERFORMANCE: 14 Overview, Commodity TR, Prices, Volatility CURVE ANALYSIS: 18Contango/Backwardation, Roll Yields, Forwards/Forecasts MARKET FLOWS: 21 Open Interest, Volume, COT, ETFs
1

Bloomberg Commodity Index (BCOM) Tables & Charts – April 2017 Edition
durations of 20-plus years.
If the Fed were to shift to a black-box-type model, this ratio of commodities vs. Treasury bonds might be considered a primary contributor. In addition, the industrial metals vs. precious metals ratio (copper vs. gold), is a good proxy for interest-rate and bond-yield trends.
Reverse Soon or Tightening Trend May Stall -- Key Fed Indicators. Were Federal Reserve moves systematic rather than people decisions, a few prominent indicators would signal the central bank's done with interest-rate hikes. Correlations are good quantitative measures of historic relationships, but analyzing them on overlapping charts often is a better guide. The Bloomberg Industrial Metals Subindex vs. Precious index ratio bottomed before the start of the past three tightening cycles and peaked before easing cycles ensued. In the current cycle, the bottom lagged the initial hike.
Fed Funds: BCOM vs. Bonds, Industrial vs. Precious
To support the reflation story, industrial vs. precious metals and the Bloomberg Commodity Index vs. BC U.S. Treasury 20+ relationships should have bottomed. Both have strong histories of trending with the Fed, but trending down in 2017 appears disconcerting.
SECTOR PERFORMANCE
Energy Lower Crude Oil Helping to Drive Higher Gold - April Commodities. Crude-oil weakness is a dissuasive factor for Federal Reserve interest-rate tightening, and thus a pressure factor on the U.S. dollar and support for gold prices. Dominated by gold rallying and most other commodities declining, the Bloomberg Precious Metals Subindex ended April as 2017's leader, up 9.1%, bookended by energy, down 14.1%. Industrial metals'
3.4% retreat in the month was led by the sharp decline in China iron ore prices, but industrials appear to be in a tightening demand vs. supply condition.
2017 Performance Bookends: Gold Up, Crude Oil Down
Increasing exports, plus the potential for more from China, supported livestock as the best-performing sector in April and nudged it higher on the 2017 leader board. Near-record U.S. agriculture product exports, if sustained, should provide underlying price support, notably if the dollar has peaked.
ATTRIBUTION
BCOM Returns Through April: Metals Holding the Line on Declines. Gold's high weighting in the Bloomberg Commodity Index is showing its benefits in 2017, with precious metals contributing the most to BCOM total returns, adding 125 bps. The 14% decline in the Bloomberg Energy Subindex is the primary drag on index total returns, subtracting about 490 bps. Next is agriculture, taking away 140 bps, about half of which is from declining sugar. Base metals, despite their April decline, have been good for about 70 bps of contribution on the year, mostly from aluminum.
Metals the Primary Positive Contributors in 2017
Led by a recovery in long-depressed live cattle, and with a contribution near 40 bps, livestock is the new shining star that may have just started contributing again to positive returns.
2

Bloomberg Commodity Index (BCOM) Tables & Charts – April 2017 Edition
Energy (Index weight: 30.4% of BCOM.Performance: April -3.0%, YTD -14.1, Spot -9.2%) *Note index weights are the YTD average
Supply Dominated Markets Go Down Easier - Energy Apr
Keeping It Simple in Crude Oil: Supply-Dominated Markets Go Do. Focusing on a few supply cuts here and there can sometimes cause entrenched analysts to miss the macro element -- energy remains dominated by supply, which generally means lower prices. The theme was predominant in April, measured by the 3.0% decline in the Bloomberg Energy Subindex for a 2017 loss of 14.1%. On a spot basis, the decline is 9.2% but certainly not inflationary, and Federal Reserve tightening cycles rarely coincide with declining crude oil prices.
Macroeconomic implications of continued weakness in crude oil are unfavorable for further rate increases, notably when combined with declining bond yields. Still-elevated energy futures long positions and weak equities indicate the 2017 mean-reversion process in energy prices may have more to go.
PRICE – OUTLOOK
Crude Oil May Need to Purge a Few More Positions Before Recovery. Energy prices may remain under pressure until extended net-long positions are reduced. Since the sum of Bloomberg Energy Subindex constituent managed-money net positions reached a record above the 2014 peak in October, the index is unchanged, as open interest and net longs have remained elevated by historical comparison. This overabundance of long positions may need to be reduced to help clear a path to higher prices. Backwardation-trending futures curves indicate tightening demand vs. supply. Locked in a trading range, continued weakness to retest WTI crude oil support near $45 a barrel (the price before the November OPEC cut announcement) may be necessary to clean the slate a bit. Key resistance remains $53, the 2017 average before the March 8 breakdown.
Energy Remaining Capped With Extended Longs
Energy vs. Stocks Underperformance Harkens Back to Pre-Crisis. Crude oil and stock market decline risks are elevated if this relationship is a guide. July 2007-October 2008 was the last time the ratio of the S&P 500 Energy Sector Index vs. the spot Bloomberg Energy Subindex declined with a velocity similar to the current period. Energy equities underperformed the underlying commodities in 2007-08, as crude oil rallied rapidly to an all-time high at $145 a barrel in July 2008 and stocks fell as the financial crisis escalated.
Energy Equities Have Been Leading Crude Lower
Despite broad stock market strength in the current period, underperforming energy stocks could indicate that 2017's crude oil price decline may continue.
3

Bloomberg Commodity Index (BCOM) Tables & Charts – April 2017 Edition
PERFORMANCE DRIVERS
April Energy May Be Just a Double-Dog Dare for OPEC in May. Amid a supply glut, the 8.6% decline in April -- typically one of the best months for the Bloomberg Unleaded Gasoline Subindex -- was the worst since a 10% retreat in 2013. Unleaded gas surpassed natural gas as the leading energy decliner in 2017 on a total-return basis, down 19.7% through April 28. Bearish stock buildups, 9% above the five-year average, greet the summer driving season. Rolling into contango has played a role this year, but is also indicative of rapidly increasing U.S. liquid-fuels production.
Natural Gas Leads Energy Decliners in 1Q
Brent and WTI crude oil prices remained within March's ranges in April, indicating the potential for range extension in May. The path of least resistance remains down, unless OPEC can convince the oversupplied and overweight long-positioned market that it can put a floor under prices.
SUPPLY VS. DEMAND
Hey OPEC, Nice Try! Take a Look at U.S. Oil Production Now. U.S. oil volume of 9.2 million barrels a day is higher than in 2014, around the time OPEC initiated its strategy aimed at knocking off higher-cost output by maintaining elevated output and pressuring prices. While the equities of U.S. energy companies targeted by OPEC's initial decision have underperformed the S&P, OPEC members have suffered more profoundly, as budget pressures from lost oil revenue forced cuts to public subsidies. The abrupt retreat in its strategy signals OPEC's weaker financial position.
Crude Oil Prices, U.S. Oil Output & Equities
While oil prices are down more than 50% from 2014, U.S. output is rebounding more violently. Volume peaked at 9.6 million barrels a day in June 2015 and bottomed at just under 8.5 million in October. E&Ps such as Pioneer, Continental, Concho and EOG are re-igniting activity as prices have improved. Hey OPEC, Nice Try! Take a Look at U.S. Oil Production Now.. Vincent G Piazza - BI Senior Industry Analyst. Philipp Chladek - BI Senior Industry Analyst. {NSN OP0UG86JIJUP <GO>}
Front Energy Futures
Weaker Oil Implications: Less 'Transitory,' More Paradigm Shift. The weak crude oil prices dubbed in 2015 as "transitory" by Janet Yellen may be deemed less so in 2017. If the recent breakdown is sustained, global implications are increasingly disinflationary. Measured since the end of 1999, crude oil's price gain has diminished to 97%, bouncing above the 45% rate of CPI change and well below broad commodities, up 204%. Crude is increasingly significant in the global economy, but advancing technology is pressuring prices, shifting it to a deflationary factor since 2014.
4

Bloomberg Commodity Index (BCOM) Tables & Charts – April 2017 Edition
Crude Oil Back Near CPI, A Drag on Commodities
The paradigm shift that's pressuring oil prices appears to be a participant in the broader disinflation trend driven by technology and a maturing society. WTI averaged $48.70 a barrel in 2015, $43.50 in 2016 and $48.69 in 2017 as of April 31. Sustaining above $50 in 2017 may be an accomplishment.
Recipe for Lower Crude-Oil Prices: Flat Curve, Record Inventory. Unless the crude oil and liquid fuel market finds some new form of magic to rapidly reduce inventories or inflate consumption, historic trends paint a bleak picture for prices. Never in Department of Energy data history on U.S. liquid-fuel inventories have they been higher and the WTI crude oil one-year futures curve been in a flatter contango. The last year that the WTI futures curve was flatter than today's 2.6% was 2014; liquid-fuel inventories at that time were flatlined on the 60-month average.
Crude Oil One-Year Curve, Liquid-Fuel Inventories
With near-record inventories (more than 20% above the 2014 level), production ramping up and consumption stagnant, the path of least resistance is for the futures curve to move steeper into contango, led by lower front
prices. It appears something has to give in the crude curve vs. inventory tango.
It May Take Some Magic to Reduce Record Crude Oil Inventories. Despite OPEC cuts, the global glut of liquid fuels is unlikely to diminish, pressuring prices. Like paying off a credit-card balance with greater payments, the primary way to reduce elevated global fuel inventories is for consumption to exceed production. Analysis of recent DOE estimates to 2019 show production exceeding consumption and increasing inventories, despite the crude oil price rallying to $59, suggests some form of unknown magic. Such a scenario appears more likely to pressure prices.
Inventories Unlikely to Decline at This Pace
At the current pace, lower prices may be the primary force able to shift the disparity in excessive production vs. consumption, sufficient enough to reduce inventories. Despite the 2016 7% plunge in U.S. fossil fuels production, the sharpest in 60 years, renewable energy production increased 7%.
5

Bloomberg Commodity Index (BCOM) Tables & Charts – April 2017 Edition
Metals Industrial (Index weight: 18.0% of BCOM.Performance: April -3.4, YTD +4.0, Spot 4.7%)
Precious (Index weight: 15.6% of BCOM.Performance: April -0.6%, YTD +9.1%, Spot +9.6%)
April Metals Trends Most Would Like to Reverse
Reversing April Metals Trend Is Desirable for Economic Outlook. If the metals continue April's trend of gold up and everything else down, global economic implications would be quite disconcerting. On the brighter side, despite the monthly decline of 3.4% in the Bloomberg Industrial Metals Index, it remains up 4.0% in 2017. Precious metals are still the leader, up 9.1% in 2017 on the back of a 4% decline in the Bloomberg Dollar Spot index. If the dollar has finally peaked, metals should be primary beneficiaries, notably silver.
The sharp decline in iron ore seemed to lead most industrial commodities lower in April. Industrial metals' continued underperformance vs. precious metals isn't a good economic sign, but industrial metals prices may need some consolidation, notably due to still-extended copper positions.
PERFORMANCE DRIVERS
Continuing April's Metal Trend Could Be Negative for Economy. Declining iron ore prices in China have grabbed headlines on ample supplies, pressuring primary steel-alloying metals nickel and zinc. Copper, the most significantly traded industrial metal, remained under pressure in April, giving back about half of 2017's gains with a 2.2% decline for the month, also on supply issues and still-extended futures long positions. Ending April 28 with only a 3.1% gain in 2017, the Bloomberg Copper Index has slipped well behind gold, up 9.8%.
Aluminum moved to the status as the best-performing 2017 Bloomberg Commodity Index component in April, with a total return of 12.1% -- notably by basically declining less for the month. Aluminum prices appear to be catching up to favorable supply vs. demand conditions.
Gold Bucks the Bearish Metals Trend in April
INDUSTRIALS OUTLOOK
Industrial Metals Still on Recovery Road, But Not Without Bumps. Industrial metals' underperformance in April may be the pause that refreshes the bullish trend in place since the end of 2015. Giving back about half of 2017's gains in April, another similar month could have more serious economic reflation-related implications for the sector. Extended copper positions are signaling some correction, or more consolidation. Overall, the industrial metals appear to be catching-up to favorable supply vs. demand, evidenced by the flattening futures curves trend since 2013.
Metals Pulling Back Somewhat on Elevated Positions
Industrial metals appeared to jump on the road to recovery in 2013, when the futures-curve trend toward contango bottomed. On a narrower curves path since, the oil collapse in 2014-15 appears to have derailed metals. They may be just in the process of rejoining that recovery.
6

Bloomberg Commodity Index (BCOM) Tables & Charts – April 2017 Edition
Mean Reversion Appears a Primary Driver of Aluminum Recovery. China's reduced output is helping to boost aluminum prices, which appear to be just catching up to the flattening contango trend in the metal's futures curve. In 2014, aluminum was on the path to recovery amid a distinct flattening in the one-year curve, but topped out at almost $2,100 a ton as crude oil collapsed. The curve was almost 4% in contango then, compared with 1.6% at the end of April. Resistance at $2,100 may be unfinished business for aluminum as long as it isn't dragged lower by crude oil again.
Aluminum Price Catching-Up to Flatter Curve
Aluminum is up only 14% since its one-year curve bottomed in November 2013 at about 8%. The sharp divergence in the curve relative to front-futures prices suggests that aluminum may have plenty of room to run. Trending away from contango is a sign of demand exceeding supply.
PRECIOUS & MACRO
Extended Silver Longs Weigh on Prices, But May Get More Extended. If its response is similar to 2016, when future positions reached extended longs similar to April's, silver could decline another 18%. Or it could be setting up for continued recovery on the back of a dollar that may have peaked. The commodity with one of the highest negative correlations to the U.S. dollar, silver has kept close to its traditional relationship, up about 2.4x the rate of the Bloomberg Dollar Spot decline (4%) in 2017. In the past 10 years, the silver-to-dollar monthly beta has been negative 2.3.
Managed-money net positions revisiting the 2016 record highs increases long-liquidation risks. Pressure from industrial metals weighed on silver in April, but it appears to be marking time, riding the 52-week moving average
higher in an improved relative-value position compared with last year's peak.
Silver Longs Weighing on Prices
What Might It Take to Push Gold to $1,400? How About Bitcoin? Bitcoin has surpassed the price of an ounce of gold for a second time, though there may not be a chance for a third. The new kid on the block may not be as lustrous as old man gold, but it's versatile. In an environment where the U.S. dollar is declining in the only major economy that's raising its interest rates, Bitcoin's second assault on gold prices may be more sustainable, carrying strong implications for the demand for liquid alternatives, namely gold -- historically the benchmark.
Bitcoin Strength May Pull Gold Along
Gold should gain coincident support from rallying Bitcoin, notably due to the new world of exchange-traded funds -- a realm that the digital currency may join. Bitcoin's strength may also be in anticipation of an end to the four-year rally in the Bloomberg Dollar Spot index.
7
Bloomberg Commodity Index (BCOM) Tables & Charts – April 2017 Edition
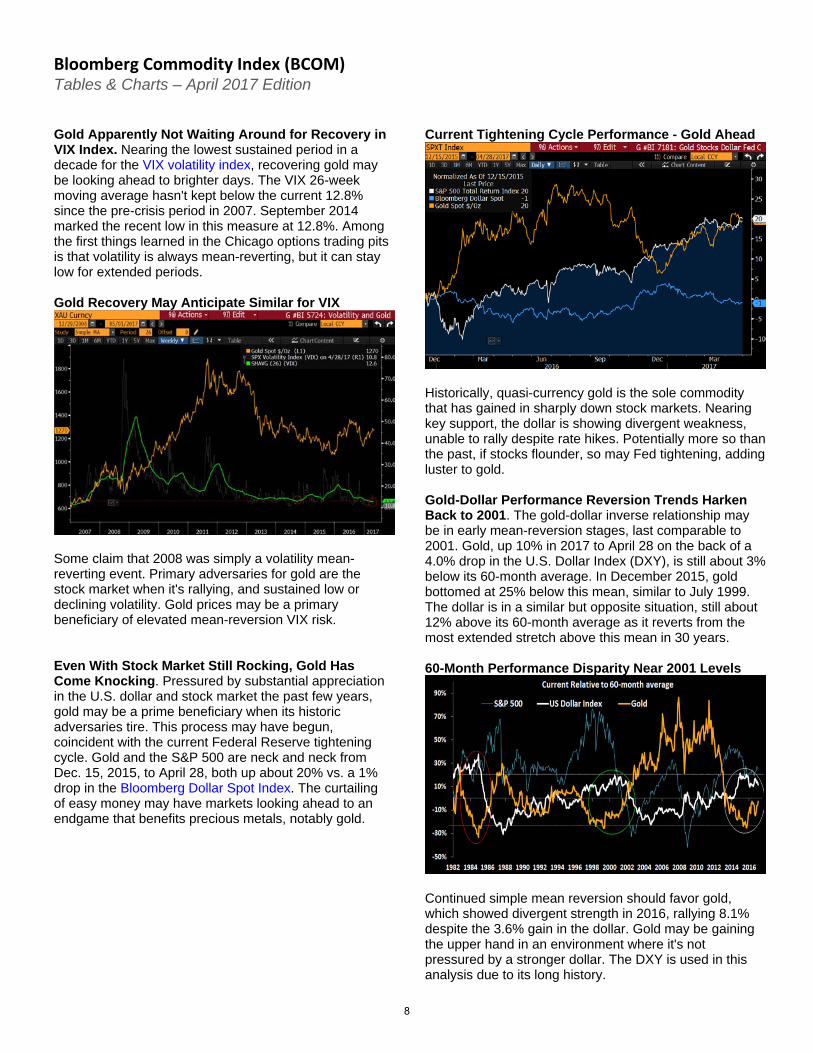
Gold Apparently Not Waiting Around for Recovery in VIX Index. Nearing the lowest sustained period in a decade for the VIX volatility index, recovering gold may be looking ahead to brighter days. The VIX 26-week moving average hasn't kept below the current 12.8% since the pre-crisis period in 2007. September 2014 marked the recent low in this measure at 12.8%. Among the first things learned in the Chicago options trading pits is that volatility is always mean-reverting, but it can stay low for extended periods.
Gold Recovery May Anticipate Similar for VIX
Some claim that 2008 was simply a volatility mean-reverting event. Primary adversaries for gold are the stock market when it's rallying, and sustained low or declining volatility. Gold prices may be a primary beneficiary of elevated mean-reversion VIX risk.
Even With Stock Market Still Rocking, Gold Has Come Knocking. Pressured by substantial appreciation in the U.S. dollar and stock market the past few years, gold may be a prime beneficiary when its historic adversaries tire. This process may have begun, coincident with the current Federal Reserve tightening cycle. Gold and the S&P 500 are neck and neck from Dec. 15, 2015, to April 28, both up about 20% vs. a 1% drop in the Bloomberg Dollar Spot Index. The curtailing of easy money may have markets looking ahead to an endgame that benefits precious metals, notably gold.
Current Tightening Cycle Performance - Gold Ahead
Historically, quasi-currency gold is the sole commodity that has gained in sharply down stock markets. Nearing key support, the dollar is showing divergent weakness, unable to rally despite rate hikes. Potentially more so than the past, if stocks flounder, so may Fed tightening, adding luster to gold.
Gold-Dollar Performance Reversion Trends Harken Back to 2001. The gold-dollar inverse relationship may be in early mean-reversion stages, last comparable to 2001. Gold, up 10% in 2017 to April 28 on the back of a 4.0% drop in the U.S. Dollar Index (DXY), is still about 3% below its 60-month average. In December 2015, gold bottomed at 25% below this mean, similar to July 1999. The dollar is in a similar but opposite situation, still about 12% above its 60-month average as it reverts from the most extended stretch above this mean in 30 years.
60-Month Performance Disparity Near 2001 Levels
Continued simple mean reversion should favor gold, which showed divergent strength in 2016, rallying 8.1% despite the 3.6% gain in the dollar. Gold may be gaining the upper hand in an environment where it's not pressured by a stronger dollar. The DXY is used in this analysis due to its long history.
8

Bloomberg Commodity Index (BCOM) Tables & Charts – April 2017 Edition
Gold-Copper Reversion Trend Still Favoring Gold, Bond Rallies. The 2017 disinflationary trend of gold outperforming copper -- by about 7% to April 28 -- has reverted most of the extreme from earlier in the year, but appears to have more to go. Copper-to-gold, a relationship with a high correlation to bond yields, has more downward reversion room if history is a guide. Copper managed-money net positions relative to gold are still overextended. In the past five years, copper has rarely outperformed gold for a prolonged period, with relative positions near current extremes.
Copper vs. Gold Managed Positions Still Elevated
Excessive long positions have limited copper's performance in 2017 relative to other metals. Combined CME and LME copper managed-money net positions and open interest, although off record highs, remain historically elevated. Gold stays in the opposite situation, with positions near five-year averages.
Stalled Gold Curve Could Signal Same From the Federal Reserve. Among the highest-correlated market indicators to the fed funds rate is the shape of the gold one-year futures curve, which has stalled in 2017. In 1H16, when increased volatility and the stock-market decline reduced Federal Reserve rate-tightening expectations, the steepening gold futures contango was one of the few leading indicators that held steadfast to further tightening -- it was right. Down slightly at 1.6% in 2017, the gold curve has flattened about 20 bps from 2017's peak on the day of the March rate hike.
If the curve continues to flatten, the indication would be Fed one-and-done in 2017. Since gold is a currency, its futures curve is priced off interest-rate expectations. In the last tightening cycle, the curve averaged 92 bps above the fed funds upper target. Currently, it's 43 bps.
Gold Curve Moving Away From Expecting Higher Rates
Reverse Soon or Tightening Trend May Stall -- Key Fed Indicators. Were Federal Reserve moves systematic rather than people decisions, a few prominent indicators would signal the central bank's done with interest-rate hikes. Correlations are good quantitative measures of historic relationships, but analyzing them on overlapping charts often is a better guide. The Bloomberg Industrial Metals Subindex vs. Precious index ratio bottomed before the start of the past three tightening cycles and peaked before easing cycles ensued. In the current cycle, the bottom lagged the initial hike. Fed Funds: BCOM vs. Bonds, Industrial vs. Precious
To support the reflation story, industrial vs. precious metals and the Bloomberg Commodity Index vs. BC U.S. Treasury 20+ relationships should have bottomed. Both have strong histories of trending with the Fed, but trending down in 2017 to April 28 appears disconcerting.
9

Bloomberg Commodity Index (BCOM) Tables & Charts – April 2017 Edition
Agriculture (Index weight: 30.4% of BCOM.Performance: April -1.2%, YTD -4.2%, Spot -1.3%)
Grains (Index Weight: 23.3% of BCOM.Performance: April -0.8%, YTD -2.2%, Spot +1.4%)
Softs (Weight: 7.1% of BCOM.Performance: April -3.5%, YTD -8.2%, Spot -6.5%)
Hedge Funds vs. Farmers - April Agriculture
Farmers Plant Seeds, Hedge Funds Drill the Market With Shorts. Slowly declining agricultural commodities are at elevated risk of a sharp short-covering rally or potential longer-term bottom on the back of near-record grain short positions and strong U.S. exports. April marked time, with North American producers drilling seeds and speculators building shorts. Grains are the majority of the agriculture sector and the U.S. growing season is predominant. Soft commodities have been this year's primary pressure factor, though sugar's decline may be excessive.
May should be more volatile for the Bloomberg Agriculture Subindex, down this year in terms of total return (4.2%) and spot (1.3%) through April 28. Rapid increases in U.S. grains, cotton and beef exports may continue if the dollar has finally peaked.
MACRO OUTLOOK
Extreme Hedge Fund Speculation May Benefit Midwest Farmers. The last time the grain markets had combined net-short positions similar to the end of April was a little over a year ago, just before a 21% rally in the Bloomberg Grains Subindex. March 2016 marked an all-time high in corn, soybean and wheat managed-money net short positions. At minus 420,000 contracts, positions now are about the same. Yet the distinct trend since the end of February of sharply increasing open interest as prices decline is a strong indication of new shorts.
Speculative shorts have been pressuring U.S. grain futures amid recovery in South American production, but U.S. output is the predominant factor. The rally was short-lived in 2016 due to bumper crops. Such extreme one-sided positions can be a foundation for a longer-term market bottom.
Extreme Shorts, Open Interest Up With Prices Down
Record U.S. Exports May Cause Corn, Beans and Wheat Price Spike. The highest combined U.S. corn, soybean and wheat export estimates ever from the USDA could boost grain prices by almost 50%, if history is a guide. U.S. grain exports are expected to be a record 140 million tons this year, well above the 2008 and 2011 peaks at 128 million. Both of those export rallies boosted grain prices, but coincided with a weaker dollar. Current records have been boosted by low prices and occurred in spite of the greenback's strength.
Grain Exports, New Records Despite Strong Dollar
Already-booming exports could be a set up for a sustained increase if the dollar has peaked, down 4.0% in 2017 based on the Bloomberg Dollar Index. Other than increased trade restrictions, higher grain prices may be the primary factor to bring exports back to more-normal levels.
10

Bloomberg Commodity Index (BCOM) Tables & Charts – April 2017 Edition
PERFORMANCE DRIVERS
Planting Remains in Full Force, Predominant Ag Pressure Point. As U.S. farmers hit full speed planting crops, concern over an even bigger supply glut remains the primary pressure factor on agriculture in 2017. Down 17.1% this year after a 3.7% monthly decline, sugar has been the biggest commodity drag. Live cattle jumped to 2017's leader, up 17.7%, supported by an 11.9% rally in April. President Donald Trump's meeting with China's president has helped to boost export optimism. Grains remain under pressure, with substantial short positions.
Sugar and Soybeans Lead 2017 Ag Decliners
Soybeans have led grain decliners in 2017, anticipating strong U.S. production following the recovery in South America and declining palm-oil prices. Yet April was subdued in the grains. Cotton is second on the leader board, supported by strong U.S. exports.
LOTS OF BEAN BEARS
Soybean Complex Speculative Shorts Highest Since 2006 Bottom. The soybean complex may have the greatest base of short positions since near its bottom in 2006 at $5.40 a bushel. Prices peaked two years later, rallying about 300%. Combined soybean, oil and bean meal managed-money net positions are the shortest since October 2006. Speculators appear to be expecting a bumper crop similar to 2016, following the recovery in South American supply. Short-covering risks are high, notably as the U.S. soybean stocks-to-use ratio appears to have peaked.
The 12-month average stocks-to-use is the lowest since July 2015 and contrarily trending down. Among USDA data sets since 2000, soybeans have the greatest negative correlation to U.S. production and stocks-to-use at 0.72. Covering risks are extreme if production disappoints.
Nearing Record Shorts Elevates Covering Risks
Malaysia's Peak Monthly Palm Oil Output to Exceed 2 Million Tons. Malaysia's monthly palm oil production could peak at 2.1 million metric tons this year, a record high. This is based on a 27-year median peak-to-trough production ratio of 1.67x (historical range 1.28x - 2.09x). Monthly production varies seasonally with usual troughs in February or March, and peaks in September or October. Palm output bottomed out at 1.26 million tons in February 2017. Given that rainfall is back to normal and production was very weak last year, this year's peak will be relatively higher. Malaysia's Monthly Palm Oil Output To Hit 2 Million. Alvin Tai - BI Industry Analyst. {NSN OOQJNO6JTSEV <GO>}
Peak-To-Trough Production Ratio
BIG CORN SHORT
Big Corn Short Harkens Back to Sharp Midseason 2015 Rally. Corn speculators appear to be betting on another bumper crop, which puts the market at elevated risk for a sharp short-covering rally. U.S. crop planting
11

Bloomberg Commodity Index (BCOM) Tables & Charts – April 2017 Edition
isn't halfway complete, yet managed-money net positions are nearing 2016's extreme shorts.
New Shorts Appear to Dominate Recent Decline
The indication is plenty of new shorts, similar to the situation just before the peak of the growing-season rally in 2015. Corn jumped almost 30% to about $4.50 a bushel, but it proved short-lived as the crop became a bumper.
HOW MUCH WORSE WHEAT
As Bad as It Gets, Extreme Scenario May Illuminate Wheat Prices. One of the best things for wheat is that conditions appear to be getting about as bad as possible, or as good as they get for lower food costs. Wheat is still above 2016's 10-year low, but barely. Global stocks-to-use is just off the peak reached in 2016, the highest in 18 years. Also, open interest has leaped to the highest ever on the recent price decline, indicating that new shorts and managed-money net positions are almost the shortest ever, near last year's low.
Since 2000, the highest annual positive wheat-price correlation has been to U.S. exports, at 0.62, based on USDA data. Exports in 2017 are estimated at the highest since 2014, notably if the dollar continues to decline. U.S. wheat-acres planted are the lowest ever in USDA tracking since 1965.
Extreme Short, Record Open Interest on Down Prices
HOW MUCH LOWER SUGAR
Sugar May Be Setting Up for Some Sweetening Similar to 2010. Raw-sugar futures, dipping in April to near the lowest price in about a year below 16 cents a pound, may be entering a relative-value zone last seen in 2010. Indicating greater demand vs. supply, global sugar stocks-to-use is trending down for the longest run since 2009-11. The last similar example of a significant price correction within a favorable supply-to-demand trend was 2010. Also, sugar managed-money net positions are near the lowest since the February 2016 bottom.
Sugar Entering Value Relative to Stocks-to-Use
Sugar declined 50% in January-June 2010, then rallied 150% to the 2011 peak. F.O. Licht notes that the surplus in 2017 has pressured prices vs. a deficit in 2016. Higher prices may be necessary to stunt the favorable stocks-to-use scenario.
12

Bloomberg Commodity Index (BCOM) Tables & Charts – April 2017 Edition
EXPORTS WARM COTTON
Cotton May Be in Early Catch-Up to Exports If History Is a Guide. Cotton prices may be in the early stages of catching up to the highest U.S. exports since 2011. The 52-week moving average of USDA export estimates has been on a substantial upswing since 2016's bottom, reaching 281,000 bales as of April 26. Unless exports suddenly collapse, cotton prices may be ripe to revisit 2011 levels near $1.40 a pound. At 80.7 cents, cotton is the second-best Bloomberg Commodity Index performer in 2017, up 7.9%.
Cotton Exports on a Tear, Prices Tagging Along
Among USDA data sets, U.S.-traded cotton futures have the highest correlation to exports. Despite a fourth-consecutive annual increase in the Bloomberg Dollar Spot Index in 2016, cotton exports have turned higher. If the 4% dollar decline is sustained in 2017, exports should get an additional boost.
LIVESTOCK– OUTLOOK
Live Cattle May Be on the Bullish Path With Increasing Exports. Live-cattle futures appear underpriced if global exports continue to recover, or don't. A reduction in meat from Brazil, the world's largest exporter, may distort the data, but is a support factor for U.S. CME-traded futures. In a market that can be distorted by a substantial amount of domestic production that isn't exported, live-cattle future prices have the highest correlation among USDA meat and beef data sets
to world exports, at 0.62 annually since 2000.
Live Cattle Appears at a Discount to World Exports
At the end of 2016, the two-year decline in meat and beef exports was 5.5%, but live-cattle prices declined 5.3x at 29%. With a two-year annual beta of 1.6x, the past few years' decline in cattle appears excessive. Brazil's tainted-beef issue may be the prod to get live cattle back on a bullish path.
13

Bloomberg Commodity Index (BCOM) Tables & Charts – April 2017 Edition
DATA on BI COMD
Performance - Overview Key Metrics
Historical
14

Bloomberg Commodity Index (BCOM) Tables & Charts – April 2017 Edition
Performance – Commodity Total Returns Key Metrics
Historical
15
Bloomberg Commodity Index (BCOM) Tables & Charts – April 2017 Edition
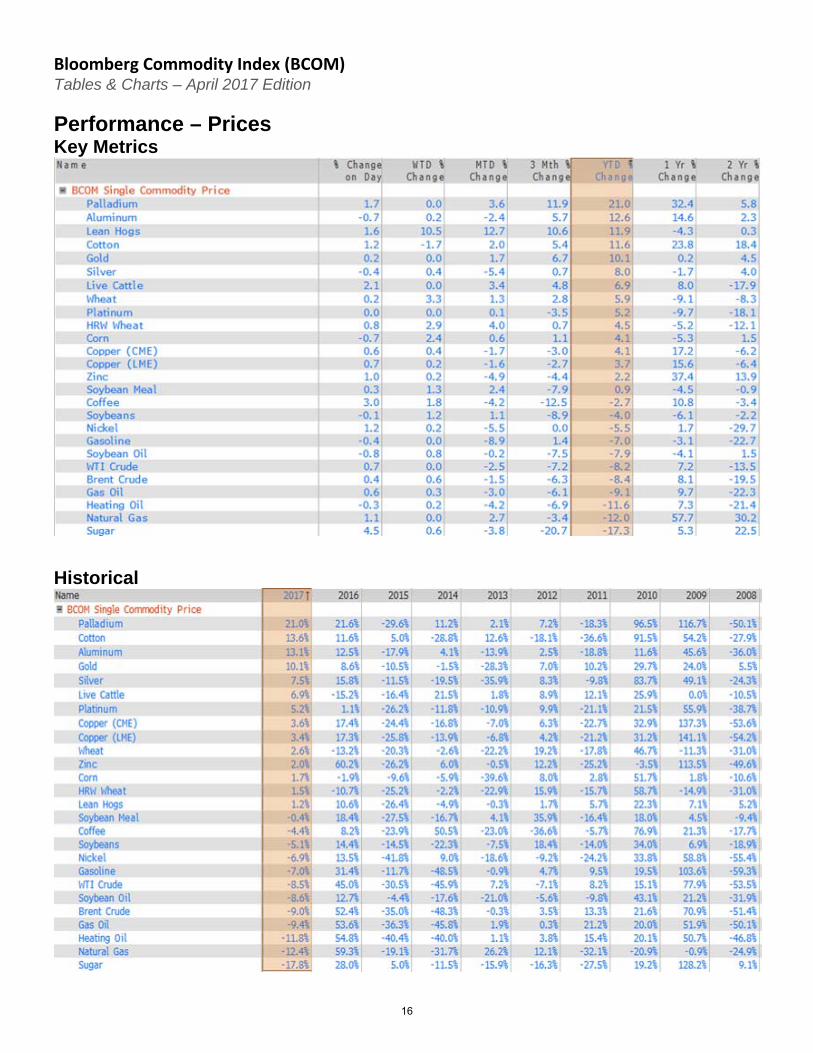
Performance – Prices Key Metrics
Historical
16

Bloomberg Commodity Index (BCOM) Tables & Charts – April 2017 Edition
Performance – Volatility
17

Bloomberg Commodity Index (BCOM) Tables & Charts – April 2017 Edition
Curve Analysis – Contango (-) | Backwardation (+) Key Metrics
Measured via the one-year futures spread as a percent of the first contract price. Negative means the one-year out future is higher (contango). Positive means the one-year out future is lower (backwardation.
Historical
18

Bloomberg Commodity Index (BCOM) Tables & Charts – April 2017 Edition
Curve Analysis – Gross Roll Yield Key Metrics
Measured on a gross roll yield basis; the 251 business day difference between the total return and spot change.
Historical
19

Bloomberg Commodity Index (BCOM) Tables & Charts – April 2017 Edition
Curve Analysis – Forwards / Forecasts Spread %
Data Set
20

Bloomberg Commodity Index (BCOM) Tables & Charts – April 2017 Edition
Market Flows – Open Interest Key Metrics
Historical
21

Bloomberg Commodity Index (BCOM) Tables & Charts – April 2017 Edition
Market Flows – Commitment of Traders Key Metrics
Historical
22

Bloomberg Commodity Index (BCOM) Tables & Charts – April 2017 Edition
Market Flows – ETF Flows (annual)
Monthly
23

BCOM Constituent Weights BCOM Index MEMB <GO> * Click hyperlinks to open in Bloomberg
Group Commodity TickerApr 2017 Contrib
to Return %
Apr 28 2017
Weight
Mar 31 2017
Weight
Mar 2017
Weight Change
2017 Target
Weight
Natural Gas NG 0.05 8.2% 7.8% 0.4% 8.0% WTI Crude CL ‐0.22 6.5% 6.6% ‐0.1% 7.2% Brent Crude CO ‐0.23 7.2% 7.4% ‐0.2% 7.8% ULS Diesel HO ‐0.17 3.4% 3.5% ‐0.1% 3.8% Gasoline XB ‐0.33 3.6% 3.9% ‐0.3% 3.8%Subtotal ‐0.90 28.9% 29.2% ‐0.3% 30.6% Corn C ‐0.10 7.6% 7.6% 0.1% 7.4%
Soybeans S ‐0.01 5.7% 5.6% 0.1% 5.8% Wheat W ‐0.06 3.4% 3.4% 0.1% 3.3%
Soybean Oil BO ‐0.02 2.6% 2.6% 0.0% 2.8% Soybean Meal SM 0.03 3.0% 2.9% 0.1% 2.9% HRW Wheat KW 0.01 1.2% 1.2% 0.1% 1.2%Subtotal ‐0.15 23.4% 23.0% 0.4% 23.5% Copper HG ‐0.17 7.8% 7.9% ‐0.1% 7.6%
Aluminum LA ‐0.15 5.1% 5.2% ‐0.1% 4.6% Zinc LX ‐0.16 2.7% 2.9% ‐0.1% 2.7% Nickel LN ‐0.14 2.4% 2.5% ‐0.1% 2.5%Subtotal ‐0.63 18.0% 18.5% ‐0.5% 17.4% Gold GC 0.16 12.2% 11.9% 0.2% 11.2% Silver SI ‐0.27 4.3% 4.6% ‐0.2% 4.1%
Subtotal ‐0.11 16.5% 16.5% 0.0% 15.3% Sugar SB ‐0.10 2.7% 2.8% ‐0.1% 3.4% Coffee KC ‐0.14 2.2% 2.3% ‐0.1% 2.4% Cotton CT 0.00 1.6% 1.5% 0.0% 1.4%Subtotal ‐0.24 6.4% 6.6% ‐0.2% 7.2% Live Cattle LC 0.45 4.3% 3.9% 0.5% 4.0% Lean Hogs LH 0.01 2.4% 2.4% 0.0% 2.1%Subtotal 0.46 6.8% 6.3% 0.5% 6.1%
Total ‐1.57 100% 100% 100%
Energy
Livestock
Softs
Precious
Metals
Industrial
Metals
Grains

BLOOMBERG INTELLIGENCE: COMMODITY DASHBOARDS BI <GO> * Click hyperlinks to open in Bloomberg
Crude Oil Production: BI OILS <GO> Natural Gas Production: BI NGAS <GO>
Precious Metal Mining: BI PMET <GO> Agricultural Chemicals: BI AGCH <GO>
Copper: BI COPP <GO> Aluminum: BI ALUM <GO>
BI provides analysis on several key drivers of BCOM performance; industrial and precious metals mining, oil and natural gas production, and agricultural chemicals. The dashboards include key macro data libraries and interactive charting and commentary from analysts with an average of seventeen years of experience.
30

COMMODITY CHEAT SHEET FOR THE BLOOMBERG PROFESSIONAL® SERVICE
* Click hyperlinks to open in Bloomberg
Broad Commodities EnergyTop commodity news CTOP Top energy news ETOPGlobal commodity prices GLCO Top oil news OTOP Commodity playbook CPLY Crude Oil Production Dashboard BI OILSCommitments of traders report COT First Word oil NI BFWOIL Calendar of commodity events ECO17 News on oil inventories TNI OIL INV Commodity arbitrage calculator CARC Oil Buyer's Guide newsletter NI OBGBRIEFCommodity fundamental data explorer FDM Pipes & Wires newsletter NI PAWSBRIEFCommodity futures overview CMBQ Oil market analysis BOILSecurity finder SECF Nat gas spot prices BGASCommodity data contributors & broker CDAT Forward European utility markets EUMContract table menu CTM News on oil markets NI OILMARKET Seasonality chart SEAG News on OPEC NI OPEC Commodity curve analysis CCRV OPEC production and prices OPECCommodity fair values CFVL Oil markets menu OIL Commodity price forecasts CPFC Crude stored in tankers NOONCommitments of Traders Report COT Refinery outages REFOCommodity maps BMAP Oil’s decline EXT5 Commodity options monitor OMON Oil versus inflation expectations SWIFCommodities charts COSYCommodity Investors menu CMNV MetalsUS exchange traded product fund flows ETF Top metal news METT
Precious metal dashboard BI PMETGBase metals dashboard BI BMET
Commodity Indices Metals prices and data MINE Index description BCOM Index DES Precious metals prices and rates MTL Index constituent weights BCOM Index MEMB Metals Bulletin MB Listed index futures BCOM Index CT COMEX inventories COMX Option volatility surface BCOM Index OVDV LME monitor LME Seasonality chart BCOMNG Index SEAG LME implied volatilities LMIV Commodity index futures movers FMV LME warehouse inventories LMEI Commodity index ranked returns CRR
AgricultureWeather Top agriculture news YTOP Global weather database WETR Agriculture calendar AGRI US snow monitor SNOW Agriculture spot prices AGGPEU weather & utility models EUMM Agriculture supply & demand AGSD
Crop calendar CCAL
BCOM QUICK FACTS Index Methodology
Weighting Bias 2/3 market liquidity and 1/3 world production No. of Commodities 20 Re-balancing Frequency Annual Roll Schedule Monthly (5 day roll) Caps/Limits Single commodity: max 15%
Single commodity and its derivatives: max 25%Related commodity groups: max 33%
First Value Date 30 December 1990
The data provided in this report can be easily accessed on the Bloomberg Professional® service along with numerous news and analytical tools to help you stay on top of the commodity markets.
31

BLOOMBERG, BLOOMBERG INDICES and BCOM are trademarks or service marks of Bloomberg Finance L.P.
Bloomberg Finance L.P. and its affiliates ("collectively, "Bloomberg") or Bloomberg's licensors own all proprietary
right in the BLOOMBERG INDICES or BCOM. Bloomberg does not guarantee the timeliness, accuracy or
completeness of any data or information relating to BLOOMBERG INDICES or BCOM. Bloomberg makes no
warranty, express or implied, as to the BLOOMBERG INDICES or BCOM or any data or values relating thereto or
results to be obtained therefrom, and expressly disclaims all warranties of merchantability and fitness for a particular
purpose with respect thereto. It is not possible to invest directly in an index. Back-tested performance is not actual
performance. Past performance is not an indication of future results. To the maximum extent allowed by law,
Bloomberg, its licensors, and its and their respective employees, contractors, agents, suppliers and vendors shall
have no liability or responsibility whatsoever for any injury or damages - whether direct, indirect, consequential,
incidental, punitive or otherwise - arising in connection with BLOOMBERG INDICES or BCOM or any data or
values relating thereto - whether arising from their negligence or otherwise. This document constitutes the provision
of factual information, rather than financial product advice. Nothing in the BLOOMBERG INDICES or BCOM
shall constitute or be construed as an offering of financial instruments or as investment advice or investment
recommendations (i.e., recommendations as to whether or not to “buy”, “sell”, “hold”, or to enter or not to enter into
any other transaction involving any specific interest or interests) by Bloomberg or its affiliates or a recommendation
as to an investment or other strategy by Bloomberg or its affiliates. Data and other information available via the
BLOOMBERG INDICES or BCOM should not be considered as information sufficient upon which to base an
investment decision. All information provided by the BLOOMBERG INDICES or BCOM is impersonal and not
tailored to the needs of any person, entity or group of persons. Bloomberg and its affiliates do not express an opinion
on the future or expected value of any security or other interest and do not explicitly or implicitly recommend or
suggest an investment strategy of any kind. Customers should consider obtaining independent advice before making
any financial decisions. © 2016 Bloomberg Finance L.P. All rights reserved. This document and its contents may
not be forwarded or redistributed without the prior consent of Bloomberg.
The BLOOMBERG PROFESSIONAL® service and BLOOMBERG Data (the “Services”) are owned and
distributed by Bloomberg Finance L.P. (“BFLP”) in all jurisdictions other than Argentina, Bermuda, China, India,
Japan, and Korea (the “BLP Countries”). BFLP is a wholly owned subsidiary of Bloomberg L.P. (“BLP”). BLP
provides BFLP with global marketing and operational support and service for the Services and distributes the
Services either directly or through a non-BFLP subsidiary in the BLP Countries. Certain functionalities distributed
via the Services are available only to sophisticated institutional investors and only where the necessary legal
clearance has been obtained. BFLP, BLP and their affiliates do not guarantee the accuracy of prices or information
in the Services. Nothing in the Services shall constitute or be construed as an offering of financial instruments by
BFLP, BLP or their affiliates, or as investment advice or recommendations by BFLP, BLP or their affiliates of an
investment strategy or whether or not to “buy”, “sell” or “hold” an investment. Information available via the
Services should not be considered as information sufficient upon which to base an investment decision.
BLOOMBERG, BLOOMBERG PROFESSIONAL, BLOOMBERG MARKETS, BLOOMBERG NEWS,
BLOOMBERG ANYWHERE, BLOOMBERG TRADEBOOK, BLOOMBERG TELEVISION, BLOOMBERG
RADIO, BLOOMBERG PRESS and BLOOMBERG.COM are trademarks and service marks of BFLP, a Delaware
limited partnership, or its subsidiaries. © 2016 Bloomberg Finance L.P. All rights reserved. This document and its
contents may not be forwarded or redistributed without the prior consent of Bloomberg.
Bloomberg Intelligence is a service provided by Bloomberg Finance L.P. and its affiliates. Bloomberg Intelligence
shall not constitute, nor be construed as, investment advice or investment recommendations (i.e., recommendations
as to whether or not to “buy”, “sell”, “hold”, or to enter or not to enter into any other transaction involving any
specific interest) or a recommendation as to an investment or other strategy. No aspect of the Bloomberg
Intelligence function is based on the consideration of a customer's individual circumstances. Bloomberg Intelligence
should not be considered as information sufficient upon which to base an investment decision. You should
determine on your own whether you agree with Bloomberg Intelligence.
Bloomberg Intelligence is offered where the necessary legal clearances have been obtained. Bloomberg Intelligence
should not be construed as tax or accounting advice or as a service designed to facilitate any Bloomberg Intelligence
subscriber's compliance with its tax, accounting, or other legal obligations. Employees involved in Bloomberg
Intelligence may hold positions in the securities analyzed or discussed on Bloomberg Intelligence.
32