bloomberg commodity index (bcom) tables & charts – …bloomberg commodity index (bcom) tables...
TRANSCRIPT
Bloomberg Commodity Index (BCOM) Tables & Charts – August 2017 Edition
Commodity Melt-Up Risks Increase in August - Cold and wet in the U.S. Corn Belt pressured ags, offsetting strong metals - The potential for peak U.S. dollar is a game changer for broad commodities - Metals, the most dollar sensitive, remain in the driver’s seat , but may be due for a pause - Energy is ripe to pick up some of the metals momentum sparked by hurricane Harvey - Lack of summer sizzle pressured ags, but if history is a guide, the grains bottom should be near - Favorable trends in demand vs. supply and the declining dollar support a strong year-end
Mike McGlone – BI Senior Analyst; Commodities. BI COMD (the commodity dashboard)
Cold and Wet August May Lead to Hotter Commodities Into Year-End Performance: August +.4%, YTD -2.7, Spot 1.1%. (returns are total return (TR) unless noted)
(Bloomberg Intelligence) -- Agricultural commodities on their backs, metals on a tear and energy ripe to follow with support from the 2017 plunge in the dollar paints a favorable picture for commodity prices. The potential for peak U.S. dollar is a game changer in the moribund commodity market, appearing a nascent bull. Energy may be next, on the back of metals, for potential melt-up.
IMPROVING MACRO OUTLOOK
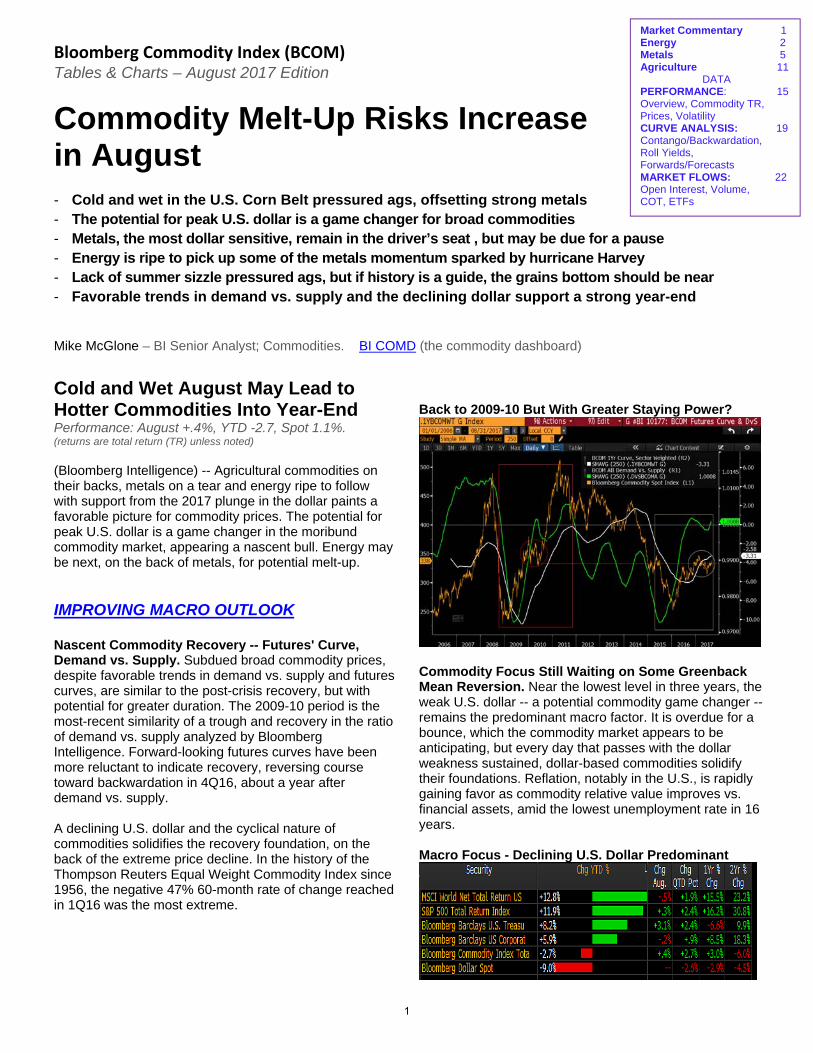
Nascent Commodity Recovery -- Futures' Curve, Demand vs. Supply. Subdued broad commodity prices, despite favorable trends in demand vs. supply and futures curves, are similar to the post-crisis recovery, but with potential for greater duration. The 2009-10 period is the most-recent similarity of a trough and recovery in the ratio of demand vs. supply analyzed by Bloomberg Intelligence. Forward-looking futures curves have been more reluctant to indicate recovery, reversing course toward backwardation in 4Q16, about a year after demand vs. supply.
A declining U.S. dollar and the cyclical nature of commodities solidifies the recovery foundation, on the back of the extreme price decline. In the history of the Thompson Reuters Equal Weight Commodity Index since 1956, the negative 47% 60-month rate of change reached in 1Q16 was the most extreme.
Back to 2009-10 But With Greater Staying Power?
Commodity Focus Still Waiting on Some Greenback Mean Reversion. Near the lowest level in three years, the weak U.S. dollar -- a potential commodity game changer -- remains the predominant macro factor. It is overdue for a bounce, which the commodity market appears to be anticipating, but every day that passes with the dollar weakness sustained, dollar-based commodities solidify their foundations. Reflation, notably in the U.S., is rapidly gaining favor as commodity relative value improves vs. financial assets, amid the lowest unemployment rate in 16 years.
Macro Focus - Declining U.S. Dollar Predominant
Market Commentary 1 Energy 2 Metals 5 Agriculture 11
DATAPERFORMANCE: 15 Overview, Commodity TR, Prices, Volatility CURVE ANALYSIS: 19Contango/Backwardation, Roll Yields, Forwards/Forecasts MARKET FLOWS: 22 Open Interest, Volume, COT, ETFs
1
Bloomberg Commodity Index (BCOM) Tables & Charts – August 2017 Edition
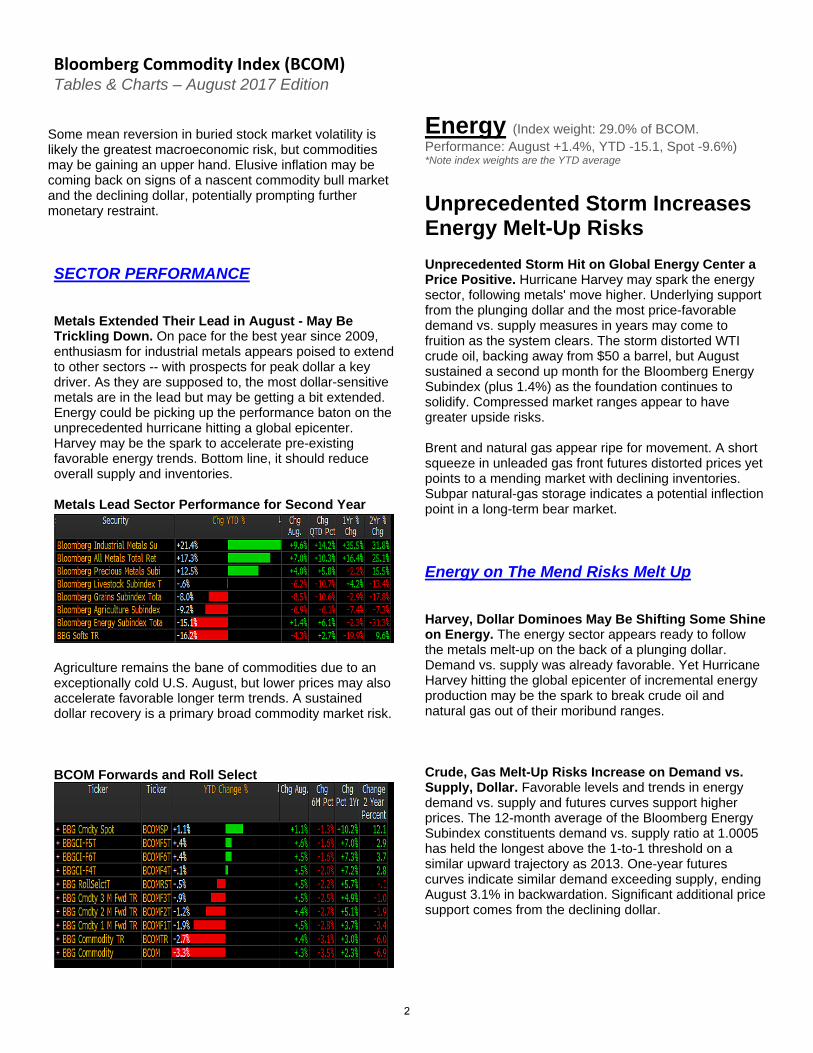
Some mean reversion in buried stock market volatility is likely the greatest macroeconomic risk, but commodities may be gaining an upper hand. Elusive inflation may be coming back on signs of a nascent commodity bull market and the declining dollar, potentially prompting further monetary restraint. SECTOR PERFORMANCE Metals Extended Their Lead in August - May Be Trickling Down. On pace for the best year since 2009, enthusiasm for industrial metals appears poised to extend to other sectors -- with prospects for peak dollar a key driver. As they are supposed to, the most dollar-sensitive metals are in the lead but may be getting a bit extended. Energy could be picking up the performance baton on the unprecedented hurricane hitting a global epicenter. Harvey may be the spark to accelerate pre-existing favorable energy trends. Bottom line, it should reduce overall supply and inventories. Metals Lead Sector Performance for Second Year
Agriculture remains the bane of commodities due to an exceptionally cold U.S. August, but lower prices may also accelerate favorable longer term trends. A sustained dollar recovery is a primary broad commodity market risk. BCOM Forwards and Roll Select
Energy (Index weight: 29.0% of BCOM. Performance: August +1.4%, YTD -15.1, Spot -9.6%) *Note index weights are the YTD average
Unprecedented Storm Increases Energy Melt-Up Risks Unprecedented Storm Hit on Global Energy Center a Price Positive. Hurricane Harvey may spark the energy sector, following metals' move higher. Underlying support from the plunging dollar and the most price-favorable demand vs. supply measures in years may come to fruition as the system clears. The storm distorted WTI crude oil, backing away from $50 a barrel, but August sustained a second up month for the Bloomberg Energy Subindex (plus 1.4%) as the foundation continues to solidify. Compressed market ranges appear to have greater upside risks. Brent and natural gas appear ripe for movement. A short squeeze in unleaded gas front futures distorted prices yet points to a mending market with declining inventories. Subpar natural-gas storage indicates a potential inflection point in a long-term bear market. Energy on The Mend Risks Melt Up Harvey, Dollar Dominoes May Be Shifting Some Shine on Energy. The energy sector appears ready to follow the metals melt-up on the back of a plunging dollar. Demand vs. supply was already favorable. Yet Hurricane Harvey hitting the global epicenter of incremental energy production may be the spark to break crude oil and natural gas out of their moribund ranges. Crude, Gas Melt-Up Risks Increase on Demand vs. Supply, Dollar. Favorable levels and trends in energy demand vs. supply and futures curves support higher prices. The 12-month average of the Bloomberg Energy Subindex constituents demand vs. supply ratio at 1.0005 has held the longest above the 1-to-1 threshold on a similar upward trajectory as 2013. One-year futures curves indicate similar demand exceeding supply, ending August 3.1% in backwardation. Significant additional price support comes from the declining dollar.
2
Bloomberg Commodity Index (BCOM) Tables & Charts – August 2017 Edition
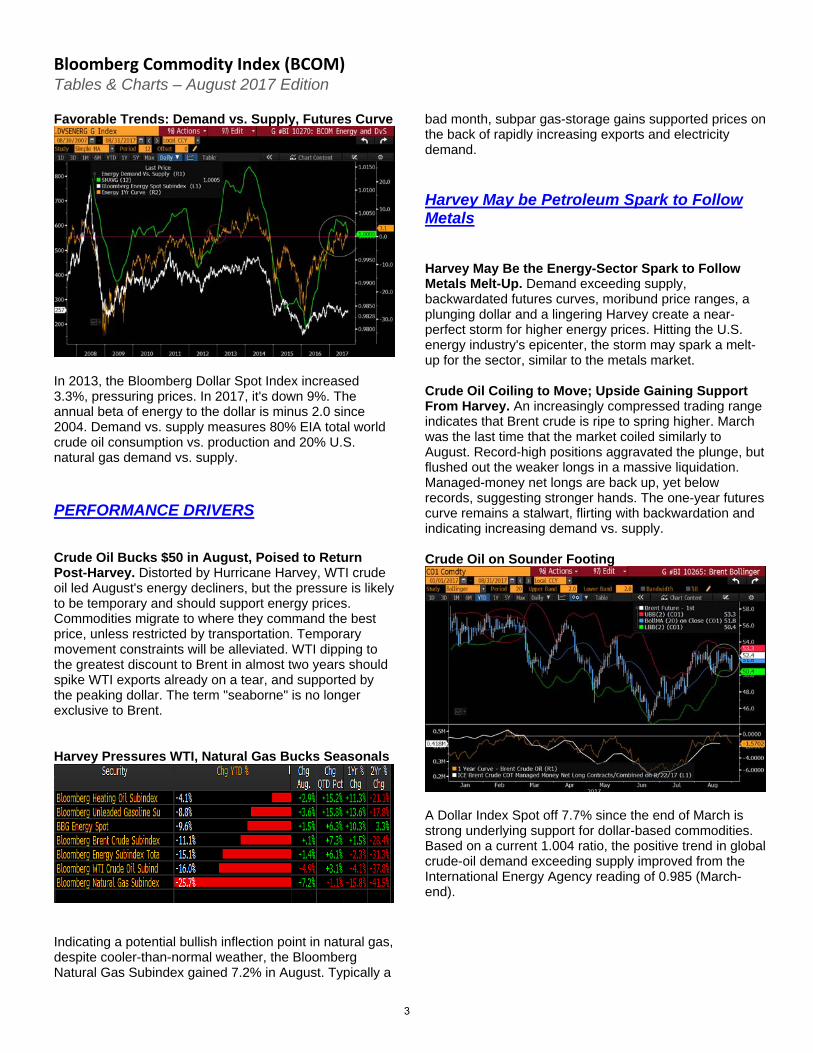
Favorable Trends: Demand vs. Supply, Futures Curve
In 2013, the Bloomberg Dollar Spot Index increased 3.3%, pressuring prices. In 2017, it's down 9%. The annual beta of energy to the dollar is minus 2.0 since 2004. Demand vs. supply measures 80% EIA total world crude oil consumption vs. production and 20% U.S. natural gas demand vs. supply.
PERFORMANCE DRIVERS Crude Oil Bucks $50 in August, Poised to Return Post-Harvey. Distorted by Hurricane Harvey, WTI crude oil led August's energy decliners, but the pressure is likely to be temporary and should support energy prices. Commodities migrate to where they command the best price, unless restricted by transportation. Temporary movement constraints will be alleviated. WTI dipping to the greatest discount to Brent in almost two years should spike WTI exports already on a tear, and supported by the peaking dollar. The term "seaborne" is no longer exclusive to Brent. Harvey Pressures WTI, Natural Gas Bucks Seasonals
Indicating a potential bullish inflection point in natural gas, despite cooler-than-normal weather, the Bloomberg Natural Gas Subindex gained 7.2% in August. Typically a
bad month, subpar gas-storage gains supported prices on the back of rapidly increasing exports and electricity demand.
Harvey May be Petroleum Spark to Follow Metals Harvey May Be the Energy-Sector Spark to Follow Metals Melt-Up. Demand exceeding supply, backwardated futures curves, moribund price ranges, a plunging dollar and a lingering Harvey create a near-perfect storm for higher energy prices. Hitting the U.S. energy industry's epicenter, the storm may spark a melt-up for the sector, similar to the metals market. Crude Oil Coiling to Move; Upside Gaining Support From Harvey. An increasingly compressed trading range indicates that Brent crude is ripe to spring higher. March was the last time that the market coiled similarly to August. Record-high positions aggravated the plunge, but flushed out the weaker longs in a massive liquidation. Managed-money net longs are back up, yet below records, suggesting stronger hands. The one-year futures curve remains a stalwart, flirting with backwardation and indicating increasing demand vs. supply. Crude Oil on Sounder Footing
A Dollar Index Spot off 7.7% since the end of March is strong underlying support for dollar-based commodities. Based on a current 1.004 ratio, the positive trend in global crude-oil demand exceeding supply improved from the International Energy Agency reading of 0.985 (March-end).
3
Bloomberg Commodity Index (BCOM) Tables & Charts – August 2017 Edition
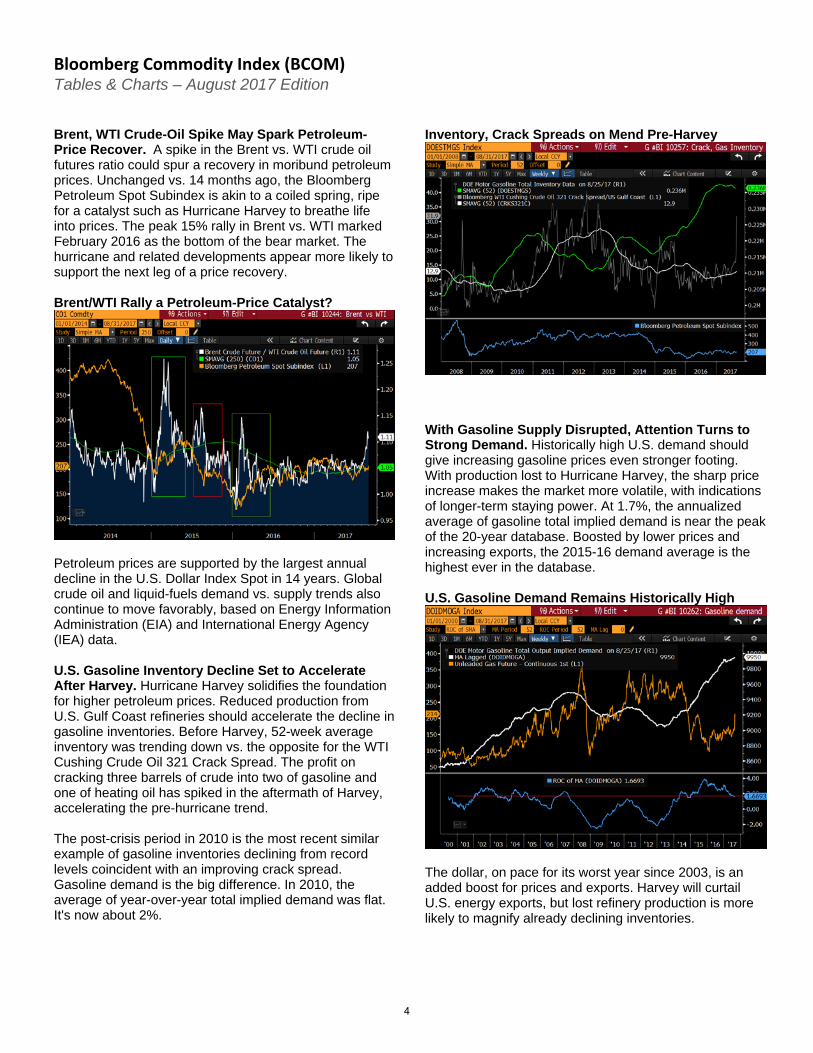
Brent, WTI Crude-Oil Spike May Spark Petroleum-Price Recover. A spike in the Brent vs. WTI crude oil futures ratio could spur a recovery in moribund petroleum prices. Unchanged vs. 14 months ago, the Bloomberg Petroleum Spot Subindex is akin to a coiled spring, ripe for a catalyst such as Hurricane Harvey to breathe life into prices. The peak 15% rally in Brent vs. WTI marked February 2016 as the bottom of the bear market. The hurricane and related developments appear more likely to support the next leg of a price recovery. Brent/WTI Rally a Petroleum-Price Catalyst?
Petroleum prices are supported by the largest annual decline in the U.S. Dollar Index Spot in 14 years. Global crude oil and liquid-fuels demand vs. supply trends also continue to move favorably, based on Energy Information Administration (EIA) and International Energy Agency (IEA) data. U.S. Gasoline Inventory Decline Set to Accelerate After Harvey. Hurricane Harvey solidifies the foundation for higher petroleum prices. Reduced production from U.S. Gulf Coast refineries should accelerate the decline in gasoline inventories. Before Harvey, 52-week average inventory was trending down vs. the opposite for the WTI Cushing Crude Oil 321 Crack Spread. The profit on cracking three barrels of crude into two of gasoline and one of heating oil has spiked in the aftermath of Harvey, accelerating the pre-hurricane trend. The post-crisis period in 2010 is the most recent similar example of gasoline inventories declining from record levels coincident with an improving crack spread. Gasoline demand is the big difference. In 2010, the average of year-over-year total implied demand was flat. It's now about 2%.
Inventory, Crack Spreads on Mend Pre-Harvey
With Gasoline Supply Disrupted, Attention Turns to Strong Demand. Historically high U.S. demand should give increasing gasoline prices even stronger footing. With production lost to Hurricane Harvey, the sharp price increase makes the market more volatile, with indications of longer-term staying power. At 1.7%, the annualized average of gasoline total implied demand is near the peak of the 20-year database. Boosted by lower prices and increasing exports, the 2015-16 demand average is the highest ever in the database. U.S. Gasoline Demand Remains Historically High
The dollar, on pace for its worst year since 2003, is an added boost for prices and exports. Harvey will curtail U.S. energy exports, but lost refinery production is more likely to magnify already declining inventories.
4
Bloomberg Commodity Index (BCOM) Tables & Charts – August 2017 Edition
September Gasoline-Futures Short Squeeze Is Underlying Support. The change in the front unleaded gas future will drop on Sept. 1 after being up about 30% on the year. Front September, which ends trading on the last day of August, has been caught in a historic short squeeze due to Hurricane Harvey. The first unleaded-gas future is up 30% in 2017 vs. about 6% for the second. A key takeaway is that the recent spike is consistent with the flattening futures-curve trend -- an indication of demand exceeding supply -- and price supportive. Positive Unleaded Gas Curve Trend Before Harvey
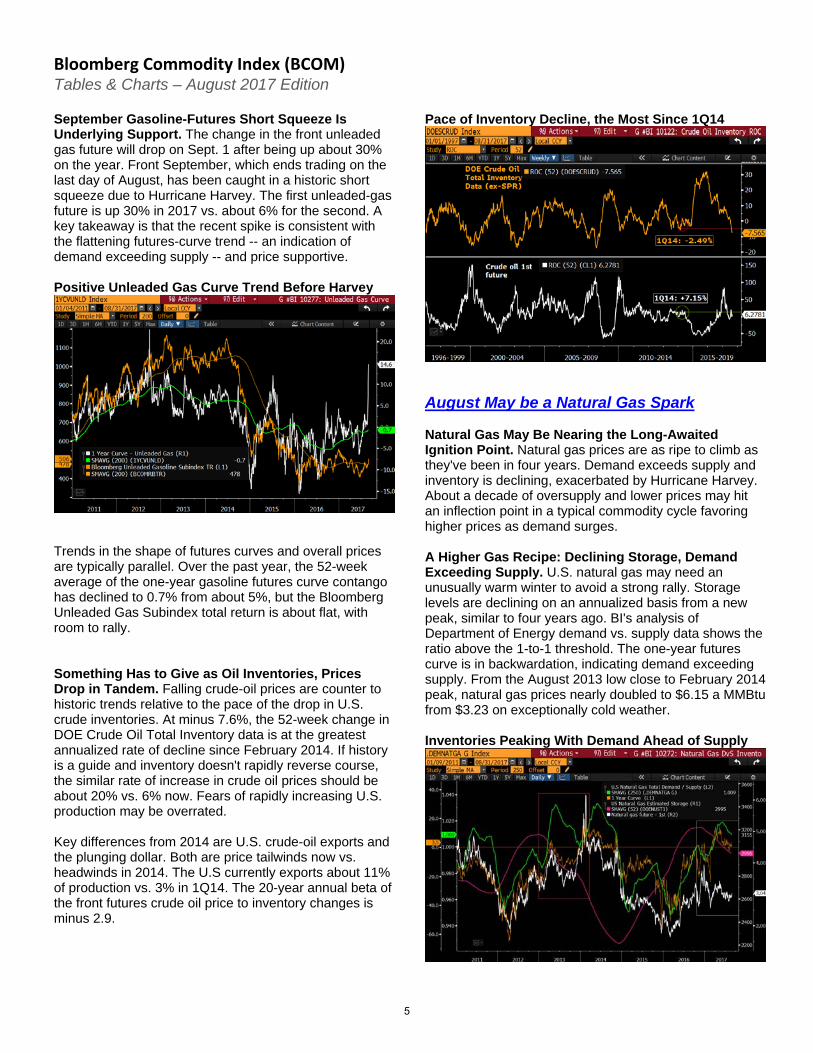
Trends in the shape of futures curves and overall prices are typically parallel. Over the past year, the 52-week average of the one-year gasoline futures curve contango has declined to 0.7% from about 5%, but the Bloomberg Unleaded Gas Subindex total return is about flat, with room to rally. Something Has to Give as Oil Inventories, Prices Drop in Tandem. Falling crude-oil prices are counter to historic trends relative to the pace of the drop in U.S. crude inventories. At minus 7.6%, the 52-week change in DOE Crude Oil Total Inventory data is at the greatest annualized rate of decline since February 2014. If history is a guide and inventory doesn't rapidly reverse course, the similar rate of increase in crude oil prices should be about 20% vs. 6% now. Fears of rapidly increasing U.S. production may be overrated. Key differences from 2014 are U.S. crude-oil exports and the plunging dollar. Both are price tailwinds now vs. headwinds in 2014. The U.S currently exports about 11% of production vs. 3% in 1Q14. The 20-year annual beta of the front futures crude oil price to inventory changes is minus 2.9.
Pace of Inventory Decline, the Most Since 1Q14
August May be a Natural Gas Spark Natural Gas May Be Nearing the Long-Awaited Ignition Point. Natural gas prices are as ripe to climb as they've been in four years. Demand exceeds supply and inventory is declining, exacerbated by Hurricane Harvey. About a decade of oversupply and lower prices may hit an inflection point in a typical commodity cycle favoring higher prices as demand surges. A Higher Gas Recipe: Declining Storage, Demand Exceeding Supply. U.S. natural gas may need an unusually warm winter to avoid a strong rally. Storage levels are declining on an annualized basis from a new peak, similar to four years ago. BI's analysis of Department of Energy demand vs. supply data shows the ratio above the 1-to-1 threshold. The one-year futures curve is in backwardation, indicating demand exceeding supply. From the August 2013 low close to February 2014 peak, natural gas prices nearly doubled to $6.15 a MMBtu from $3.23 on exceptionally cold weather. Inventories Peaking With Demand Ahead of Supply
5

Bloomberg Commodity Index (BCOM) Tables & Charts – August 2017 Edition
Ending August with front gas at $3.04 vs. $2.94 in the one-year-out future, the foundation for higher prices appears increasingly supported. Additional support comes from the declining dollar. The 10-year monthly natural gas futures beta to the Bloomberg Dollar Spot Index is negative 1.1. Natural Gas Trading Like It's 2013, Right Before the Double. Natural gas resembles a coiled spring that's ripe for movement, with up appearing to be the path of least resistance. For the past 52 weeks, natural-gas futures have traded within the narrowest range since 2013. Prices doubled from the 2013 low to 2014 high with an unusually cold winter. Indicating divergent strength, despite a cold summer lacking a spike in electricity demand, the Bloomberg Natural Gas Subindex total return was positive 7.2% in August, typically its worst month. Gas 52-Week Bollinger Bands Narrowest Since 2013
Oversupplied for most of the past decade, natural gas may be reaching the inflection point of lower prices driving demand to exceed supply on the back of increased heating, electricity and exports. The top and bottom Bollinger Bands of $2.59 and $3.59 a MMBtu are initial support and resistance levels. Front Energy Futures
Metals All (Index weight: 34.3% of BCOM. Performance: August +7.0, YTD +17.3) Industrial (Index weight: 18.2% of BCOM. Performance: August +9.6, YTD +21.4, Spot +22.9%) Precious (Index weight: 16.1% of BCOM. Performance: August +4.0%, YTD +12.5%, Spot +13.5%)
Metals Enter Dog Days Wagging Enthusiastically Dog Days Boost Metals; Increasing Volatility May Be Supportive. In a strong uptrend, metals may be primary beneficiaries when equity-market volatility recovers. Metals lead all commodities, as they should in a declining-dollar environment with demand exceeding supply, notably in industrials. A key industrial-metals risk may be when stock-market volatility resurfaces. Base metals, at steep discounts from historic highs, are gaining relative value vs. record-high financial assets. Gold has the most weight in the Bloomberg Commodity Index. Gold should be good support for the Bloomberg All Metals Subindex when market volatility picks up. Industrial metals reaching 50% retracement of the 2011-16 bear market increases the potential for some back and fill. Along with the dollar, precious metals have recouped a third of its bear market. All-Metals Rally Back on Pace With the Greenback's Decline. Metals' propensity to continue to rally should rest on the back of the declining dollar. The Bloomberg All Metals Subindex and Bloomberg Dollar Spot Index have returned to about one-third retracement of the 2011-16 bear market in metals and bull market for the greenback. Since 2004, the annual beta of the metals to the dollar is negative 2.9. The dollar, down 9% in 2017, is on pace for its worst year in index history, distorted a bit by the U.S. election.
6
Bloomberg Commodity Index (BCOM) Tables & Charts – August 2017 Edition
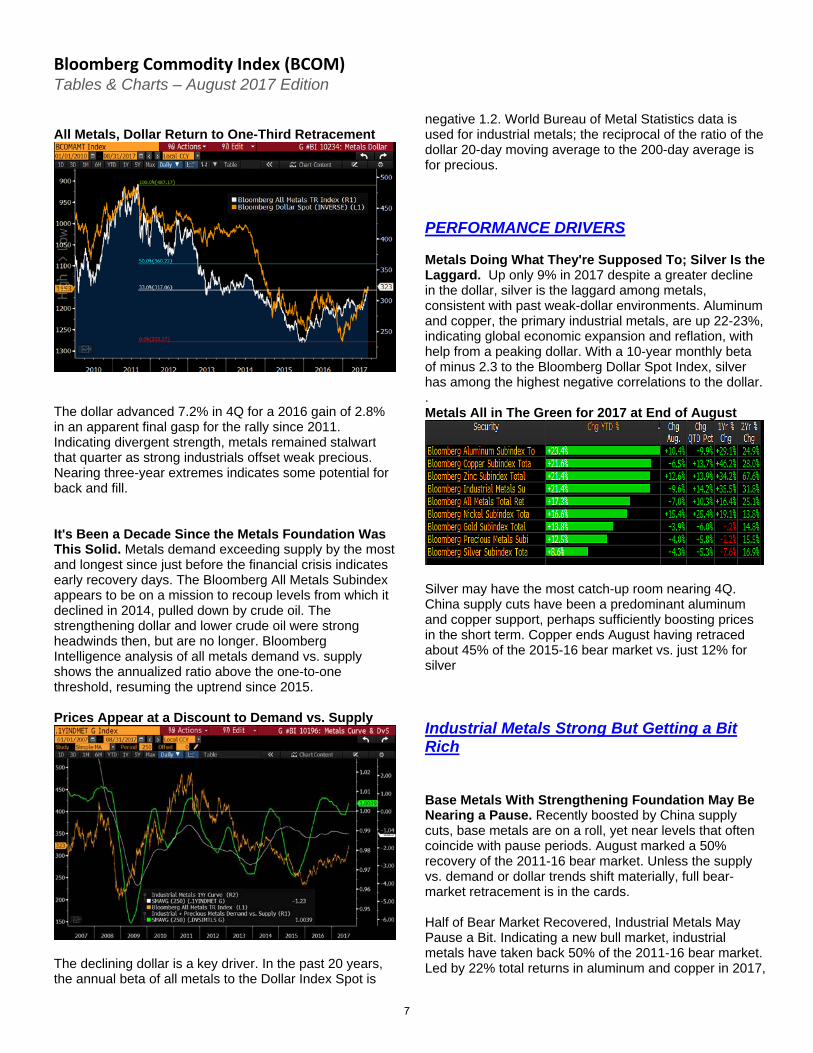
All Metals, Dollar Return to One-Third Retracement
The dollar advanced 7.2% in 4Q for a 2016 gain of 2.8% in an apparent final gasp for the rally since 2011. Indicating divergent strength, metals remained stalwart that quarter as strong industrials offset weak precious. Nearing three-year extremes indicates some potential for back and fill. It's Been a Decade Since the Metals Foundation Was This Solid. Metals demand exceeding supply by the most and longest since just before the financial crisis indicates early recovery days. The Bloomberg All Metals Subindex appears to be on a mission to recoup levels from which it declined in 2014, pulled down by crude oil. The strengthening dollar and lower crude oil were strong headwinds then, but are no longer. Bloomberg Intelligence analysis of all metals demand vs. supply shows the annualized ratio above the one-to-one threshold, resuming the uptrend since 2015. Prices Appear at a Discount to Demand vs. Supply
The declining dollar is a key driver. In the past 20 years, the annual beta of all metals to the Dollar Index Spot is
negative 1.2. World Bureau of Metal Statistics data is used for industrial metals; the reciprocal of the ratio of the dollar 20-day moving average to the 200-day average is for precious. PERFORMANCE DRIVERS Metals Doing What They're Supposed To; Silver Is the Laggard. Up only 9% in 2017 despite a greater decline in the dollar, silver is the laggard among metals, consistent with past weak-dollar environments. Aluminum and copper, the primary industrial metals, are up 22-23%, indicating global economic expansion and reflation, with help from a peaking dollar. With a 10-year monthly beta of minus 2.3 to the Bloomberg Dollar Spot Index, silver has among the highest negative correlations to the dollar. . Metals All in The Green for 2017 at End of August
Silver may have the most catch-up room nearing 4Q. China supply cuts have been a predominant aluminum and copper support, perhaps sufficiently boosting prices in the short term. Copper ends August having retraced about 45% of the 2015-16 bear market vs. just 12% for silver Industrial Metals Strong But Getting a Bit Rich Base Metals With Strengthening Foundation May Be Nearing a Pause. Recently boosted by China supply cuts, base metals are on a roll, yet near levels that often coincide with pause periods. August marked a 50% recovery of the 2011-16 bear market. Unless the supply vs. demand or dollar trends shift materially, full bear-market retracement is in the cards. Half of Bear Market Recovered, Industrial Metals May Pause a Bit. Indicating a new bull market, industrial metals have taken back 50% of the 2011-16 bear market. Led by 22% total returns in aluminum and copper in 2017,
7
Bloomberg Commodity Index (BCOM) Tables & Charts – August 2017 Edition
industrial metals are on a roll, supported by demand exceeding supply by the most in a decade. A weaker dollar also helps, but current levels should prompt caution. The 20% spurt from the June low to August peak matches the same in November; the index consolidated until June. Supply vs. demand analysis indicates early recovery days. Base Metals Supported by Demand Exceeding Supply
Technical patterns returning to the median of the bear market, plus the high-velocity decline in the dollar to three-year lows, elevates the market's risk of back and fill, similar to 1H. Copper open interest and managed-money net positions at new records heighten liquidation risks. Industrial Metals to the Stock Market: 'Good Luck With That One'. Industrial metals should be in early days of catching up to the stock market's bull run, if history is a guide. At a substantial discount from historic highs, metals have tailwinds from the longest sustained positive annual demand vs. supply ratio in 12 years. A key headwind for the record-high stock market is the lowest sustained VIX Volatility Index in its history. The Bloomberg Industrial Metals 2017 total return of 21.4% to Aug. 31, on the back of 19.9% in 2016, may mark the start of a new trend. Last year was the first since 2010 metals' annual total return beat stocks. The 12-month average of World Bureau of Metal Statistics measures of global copper, aluminum, nickel and zinc consumption vs. production at 1.010 -- above the one-to-one threshold since March 2016 -- may indicate a value shift.
Rising Metals Value vs. Extreme Complacent Stocks
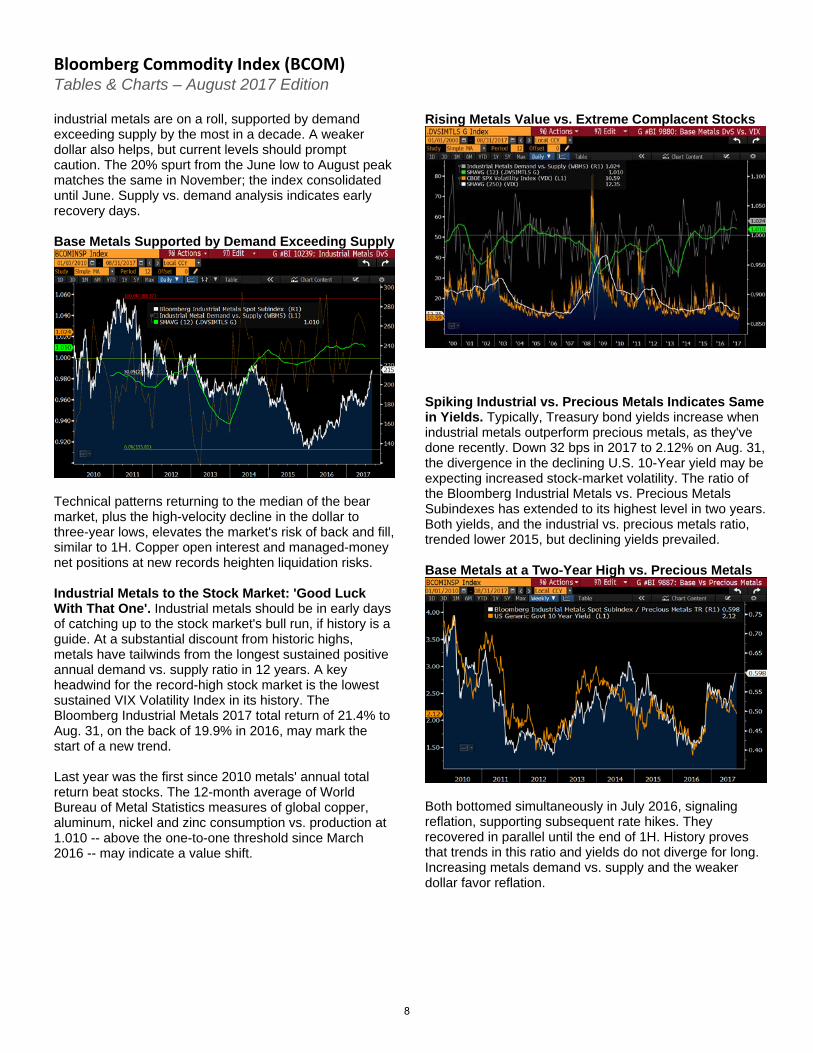
Spiking Industrial vs. Precious Metals Indicates Same in Yields. Typically, Treasury bond yields increase when industrial metals outperform precious metals, as they've done recently. Down 32 bps in 2017 to 2.12% on Aug. 31, the divergence in the declining U.S. 10-Year yield may be expecting increased stock-market volatility. The ratio of the Bloomberg Industrial Metals vs. Precious Metals Subindexes has extended to its highest level in two years. Both yields, and the industrial vs. precious metals ratio, trended lower 2015, but declining yields prevailed. Base Metals at a Two-Year High vs. Precious Metals
Both bottomed simultaneously in July 2016, signaling reflation, supporting subsequent rate hikes. They recovered in parallel until the end of 1H. History proves that trends in this ratio and yields do not diverge for long. Increasing metals demand vs. supply and the weaker dollar favor reflation.
8

Bloomberg Commodity Index (BCOM) Tables & Charts – August 2017 Edition
Copper in Good Stead; Positions Agree, Raising Liquidation Risk. Nearing good resistance, copper is due for some back and fill. Futures open interest and managed-money net positions are the highest ever on the most widely traded industrial metal. New records in the same measures early in 2017 were a prime pressure factor in the 10% peak-to-trough correction in February-May. An old traders' axiom could designate that run as the teenie within a broader positive trend, ending August about 5% below the 50% retracement of the 2011-16 bear market. Copper Appears Due for Another Consolidation Step
A correction spark could come from mean reversion in the plunging dollar. In the history of the Bloomberg Dollar Spot Index since 2004, the copper-to-dollar annual negative beta is minus 4.4. Open interest and volume continue to increase in CME-traded copper vs. the LME. Aluminum Nearing Good Resistance, Set for More Pause and Refresh. Aluminum, the best performer in the Bloomberg Commodity Index in 2017, is running into a potential wall of resistance that should instill caution. Up 24% in 2017, aluminum ended August at the extended extreme of 15% above the 52-week moving average ($2,100) and the 50% retracement of the 2012 peak to 2015 bottom. Subsequent to extending 15% above the 52-week mean in February, the market consolidated at that initial level near $1,900 a ton, until breaking out on Aug. 7. Increasing demand vs. supply supported by recent Chinese capacity closures is underlying support. A key support level is $1,900.
Aluminum May Be Nearing Top of Next Step in Rally
Well-Rested Precious Metals Begin to Shine Paused and Refreshed, Gold's Recovery Appears in Early Days. Gold's key supports -- a weaker dollar and rising volatility -- may be joining forces. As the summer enters dog days, a recovery in the record-low VIX could provide above-average support. Ending August above $1,300 an ounce for the first month in about a year, gold has had time to pause and refresh. Gold's Potential Upside Should Be Limited by the VIX's Downside. The 50% retracement of the 2011-15 gold bear market should be back in play. Aluminum is about 2% below the 50% mark of its similar-period plunge -- copper is about 6% away. About $1,475 an ounce is the halfway mark in the gold decline that bottomed with the 2015 initial U.S. interest-rate hike of this cycle. Primary supports are the declining U.S. dollar and the S&P 500 Volatility Index (VIX) potentially in early days of recovery. With the 200-day moving average the lowest ever, VIX downside is limited. If history is a guide, VIX mean reversion upside risks are quite elevated. At 11.6%, the previous low in the VIX 200-day mean was 12.1% from June 2007. From the 2011 low until the 2017 peak, the Bloomberg Dollar Spot Index rallied 40%. About 4.5% lower would take the dollar back to its 50% retracement.
9
Bloomberg Commodity Index (BCOM) Tables & Charts – August 2017 Edition
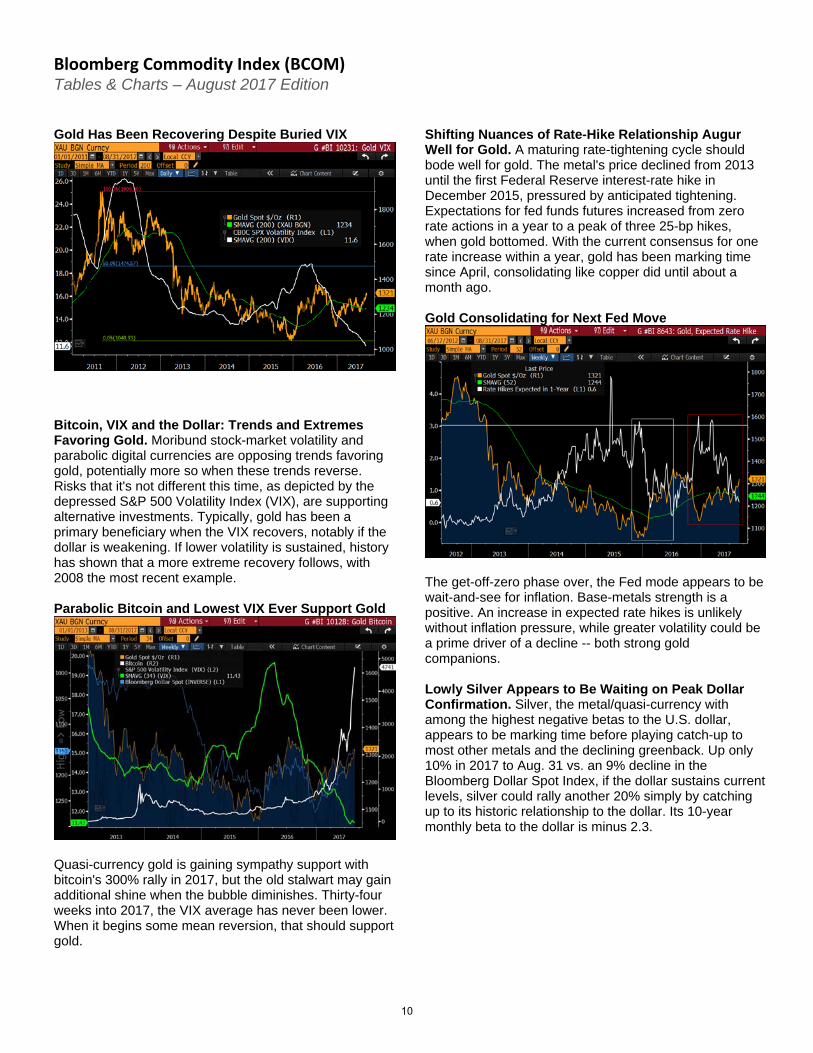
Gold Has Been Recovering Despite Buried VIX
Bitcoin, VIX and the Dollar: Trends and Extremes Favoring Gold. Moribund stock-market volatility and parabolic digital currencies are opposing trends favoring gold, potentially more so when these trends reverse. Risks that it's not different this time, as depicted by the depressed S&P 500 Volatility Index (VIX), are supporting alternative investments. Typically, gold has been a primary beneficiary when the VIX recovers, notably if the dollar is weakening. If lower volatility is sustained, history has shown that a more extreme recovery follows, with 2008 the most recent example. Parabolic Bitcoin and Lowest VIX Ever Support Gold
Quasi-currency gold is gaining sympathy support with bitcoin's 300% rally in 2017, but the old stalwart may gain additional shine when the bubble diminishes. Thirty-four weeks into 2017, the VIX average has never been lower. When it begins some mean reversion, that should support gold.
Shifting Nuances of Rate-Hike Relationship Augur Well for Gold. A maturing rate-tightening cycle should bode well for gold. The metal's price declined from 2013 until the first Federal Reserve interest-rate hike in December 2015, pressured by anticipated tightening. Expectations for fed funds futures increased from zero rate actions in a year to a peak of three 25-bp hikes, when gold bottomed. With the current consensus for one rate increase within a year, gold has been marking time since April, consolidating like copper did until about a month ago. Gold Consolidating for Next Fed Move
The get-off-zero phase over, the Fed mode appears to be wait-and-see for inflation. Base-metals strength is a positive. An increase in expected rate hikes is unlikely without inflation pressure, while greater volatility could be a prime driver of a decline -- both strong gold companions. Lowly Silver Appears to Be Waiting on Peak Dollar Confirmation. Silver, the metal/quasi-currency with among the highest negative betas to the U.S. dollar, appears to be marking time before playing catch-up to most other metals and the declining greenback. Up only 10% in 2017 to Aug. 31 vs. an 9% decline in the Bloomberg Dollar Spot Index, if the dollar sustains current levels, silver could rally another 20% simply by catching up to its historic relationship to the dollar. Its 10-year monthly beta to the dollar is minus 2.3.
10
Bloomberg Commodity Index (BCOM) Tables & Charts – August 2017 Edition
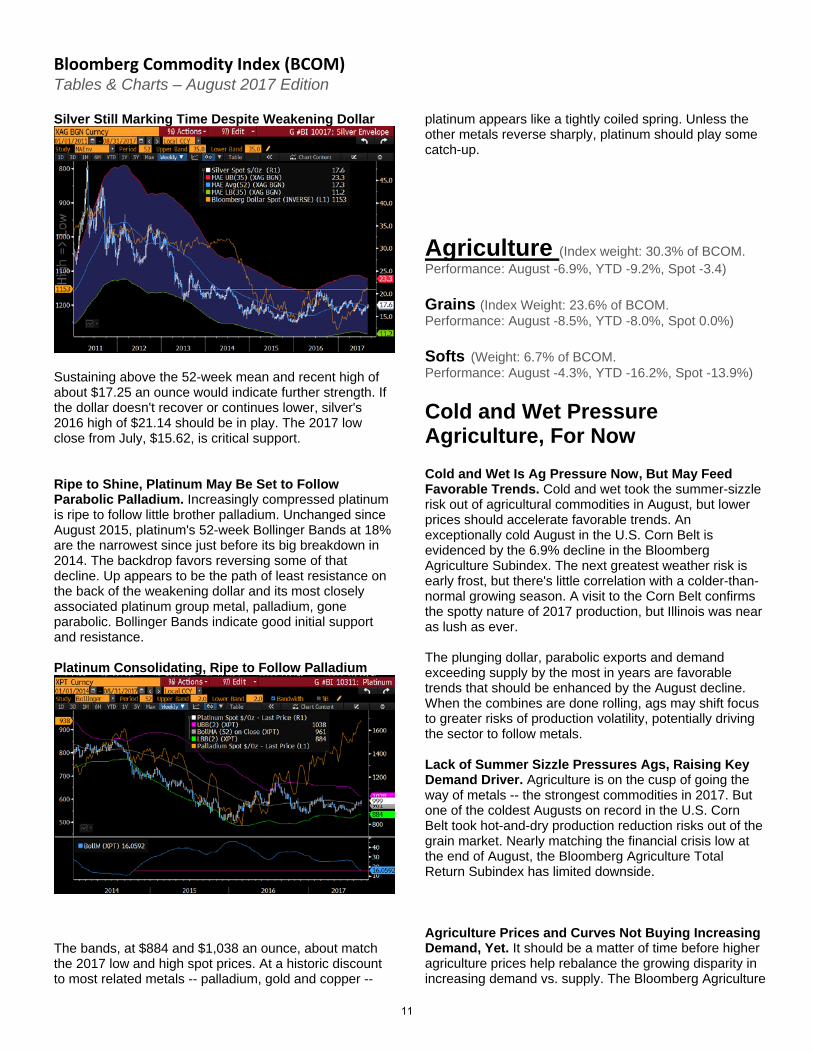
Silver Still Marking Time Despite Weakening Dollar
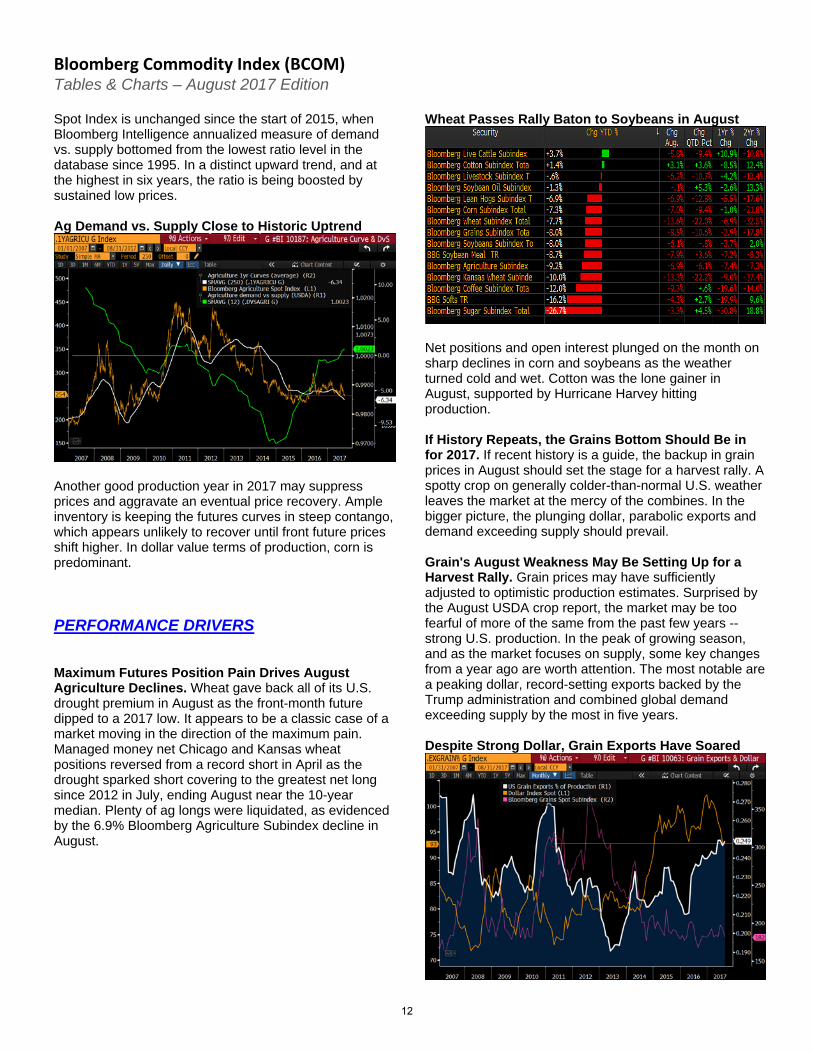
Sustaining above the 52-week mean and recent high of about $17.25 an ounce would indicate further strength. If the dollar doesn't recover or continues lower, silver's 2016 high of $21.14 should be in play. The 2017 low close from July, $15.62, is critical support. Ripe to Shine, Platinum May Be Set to Follow Parabolic Palladium. Increasingly compressed platinum is ripe to follow little brother palladium. Unchanged since August 2015, platinum's 52-week Bollinger Bands at 18% are the narrowest since just before its big breakdown in 2014. The backdrop favors reversing some of that decline. Up appears to be the path of least resistance on the back of the weakening dollar and its most closely associated platinum group metal, palladium, gone parabolic. Bollinger Bands indicate good initial support and resistance. Platinum Consolidating, Ripe to Follow Palladium
The bands, at $884 and $1,038 an ounce, about match the 2017 low and high spot prices. At a historic discount to most related metals -- palladium, gold and copper --
platinum appears like a tightly coiled spring. Unless the other metals reverse sharply, platinum should play some catch-up.
Agriculture (Index weight: 30.3% of BCOM. Performance: August -6.9%, YTD -9.2%, Spot -3.4) Grains (Index Weight: 23.6% of BCOM. Performance: August -8.5%, YTD -8.0%, Spot 0.0%) Softs (Weight: 6.7% of BCOM. Performance: August -4.3%, YTD -16.2%, Spot -13.9%)
Cold and Wet Pressure Agriculture, For Now Cold and Wet Is Ag Pressure Now, But May Feed Favorable Trends. Cold and wet took the summer-sizzle risk out of agricultural commodities in August, but lower prices should accelerate favorable trends. An exceptionally cold August in the U.S. Corn Belt is evidenced by the 6.9% decline in the Bloomberg Agriculture Subindex. The next greatest weather risk is early frost, but there's little correlation with a colder-than-normal growing season. A visit to the Corn Belt confirms the spotty nature of 2017 production, but Illinois was near as lush as ever. The plunging dollar, parabolic exports and demand exceeding supply by the most in years are favorable trends that should be enhanced by the August decline. When the combines are done rolling, ags may shift focus to greater risks of production volatility, potentially driving the sector to follow metals. Lack of Summer Sizzle Pressures Ags, Raising Key Demand Driver. Agriculture is on the cusp of going the way of metals -- the strongest commodities in 2017. But one of the coldest Augusts on record in the U.S. Corn Belt took hot-and-dry production reduction risks out of the grain market. Nearly matching the financial crisis low at the end of August, the Bloomberg Agriculture Total Return Subindex has limited downside. Agriculture Prices and Curves Not Buying Increasing Demand, Yet. It should be a matter of time before higher agriculture prices help rebalance the growing disparity in increasing demand vs. supply. The Bloomberg Agriculture
11
Bloomberg Commodity Index (BCOM) Tables & Charts – August 2017 Edition
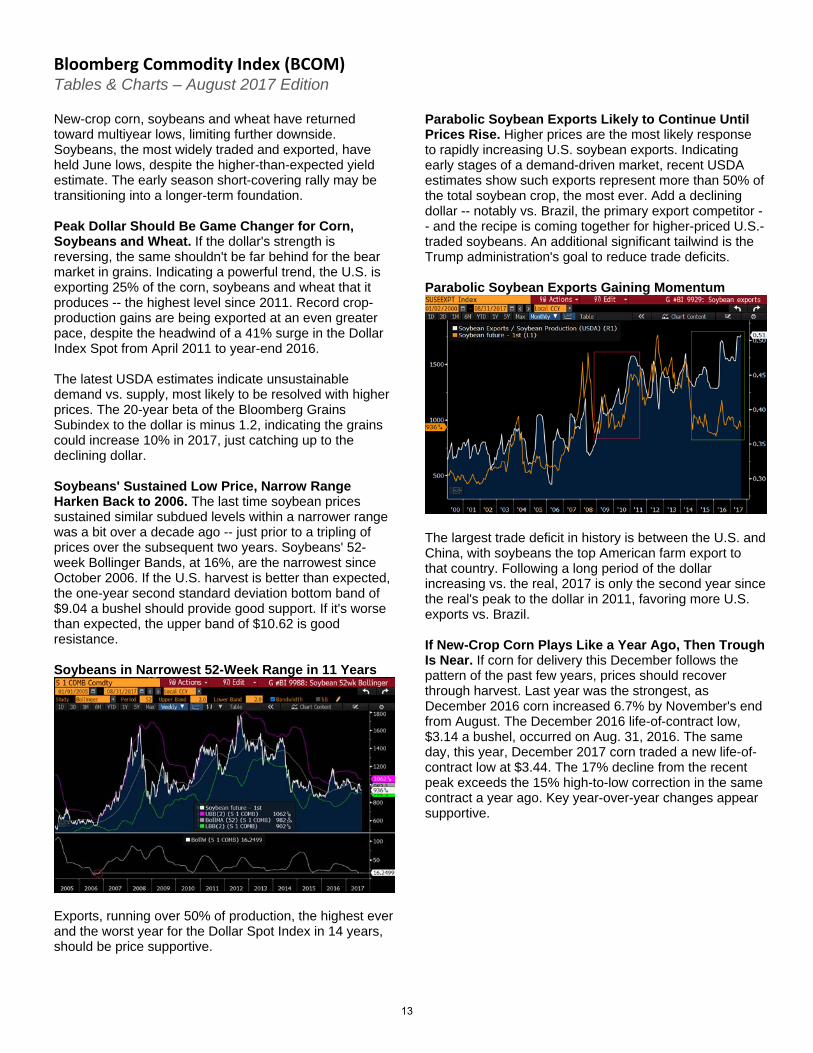
Spot Index is unchanged since the start of 2015, when Bloomberg Intelligence annualized measure of demand vs. supply bottomed from the lowest ratio level in the database since 1995. In a distinct upward trend, and at the highest in six years, the ratio is being boosted by sustained low prices. Ag Demand vs. Supply Close to Historic Uptrend
Another good production year in 2017 may suppress prices and aggravate an eventual price recovery. Ample inventory is keeping the futures curves in steep contango, which appears unlikely to recover until front future prices shift higher. In dollar value terms of production, corn is predominant. PERFORMANCE DRIVERS Maximum Futures Position Pain Drives August Agriculture Declines. Wheat gave back all of its U.S. drought premium in August as the front-month future dipped to a 2017 low. It appears to be a classic case of a market moving in the direction of the maximum pain. Managed money net Chicago and Kansas wheat positions reversed from a record short in April as the drought sparked short covering to the greatest net long since 2012 in July, ending August near the 10-year median. Plenty of ag longs were liquidated, as evidenced by the 6.9% Bloomberg Agriculture Subindex decline in August.
Wheat Passes Rally Baton to Soybeans in August
Net positions and open interest plunged on the month on sharp declines in corn and soybeans as the weather turned cold and wet. Cotton was the lone gainer in August, supported by Hurricane Harvey hitting production. If History Repeats, the Grains Bottom Should Be in for 2017. If recent history is a guide, the backup in grain prices in August should set the stage for a harvest rally. A spotty crop on generally colder-than-normal U.S. weather leaves the market at the mercy of the combines. In the bigger picture, the plunging dollar, parabolic exports and demand exceeding supply should prevail. Grain's August Weakness May Be Setting Up for a Harvest Rally. Grain prices may have sufficiently adjusted to optimistic production estimates. Surprised by the August USDA crop report, the market may be too fearful of more of the same from the past few years -- strong U.S. production. In the peak of growing season, and as the market focuses on supply, some key changes from a year ago are worth attention. The most notable are a peaking dollar, record-setting exports backed by the Trump administration and combined global demand exceeding supply by the most in five years. Despite Strong Dollar, Grain Exports Have Soared
12
Bloomberg Commodity Index (BCOM) Tables & Charts – August 2017 Edition
New-crop corn, soybeans and wheat have returned toward multiyear lows, limiting further downside. Soybeans, the most widely traded and exported, have held June lows, despite the higher-than-expected yield estimate. The early season short-covering rally may be transitioning into a longer-term foundation. Peak Dollar Should Be Game Changer for Corn, Soybeans and Wheat. If the dollar's strength is reversing, the same shouldn't be far behind for the bear market in grains. Indicating a powerful trend, the U.S. is exporting 25% of the corn, soybeans and wheat that it produces -- the highest level since 2011. Record crop-production gains are being exported at an even greater pace, despite the headwind of a 41% surge in the Dollar Index Spot from April 2011 to year-end 2016. The latest USDA estimates indicate unsustainable demand vs. supply, most likely to be resolved with higher prices. The 20-year beta of the Bloomberg Grains Subindex to the dollar is minus 1.2, indicating the grains could increase 10% in 2017, just catching up to the declining dollar. Soybeans' Sustained Low Price, Narrow Range Harken Back to 2006. The last time soybean prices sustained similar subdued levels within a narrower range was a bit over a decade ago -- just prior to a tripling of prices over the subsequent two years. Soybeans' 52-week Bollinger Bands, at 16%, are the narrowest since October 2006. If the U.S. harvest is better than expected, the one-year second standard deviation bottom band of $9.04 a bushel should provide good support. If it's worse than expected, the upper band of $10.62 is good resistance. Soybeans in Narrowest 52-Week Range in 11 Years
Exports, running over 50% of production, the highest ever and the worst year for the Dollar Spot Index in 14 years, should be price supportive.
Parabolic Soybean Exports Likely to Continue Until Prices Rise. Higher prices are the most likely response to rapidly increasing U.S. soybean exports. Indicating early stages of a demand-driven market, recent USDA estimates show such exports represent more than 50% of the total soybean crop, the most ever. Add a declining dollar -- notably vs. Brazil, the primary export competitor -- and the recipe is coming together for higher-priced U.S.-traded soybeans. An additional significant tailwind is the Trump administration's goal to reduce trade deficits. Parabolic Soybean Exports Gaining Momentum
The largest trade deficit in history is between the U.S. and China, with soybeans the top American farm export to that country. Following a long period of the dollar increasing vs. the real, 2017 is only the second year since the real's peak to the dollar in 2011, favoring more U.S. exports vs. Brazil. If New-Crop Corn Plays Like a Year Ago, Then Trough Is Near. If corn for delivery this December follows the pattern of the past few years, prices should recover through harvest. Last year was the strongest, as December 2016 corn increased 6.7% by November's end from August. The December 2016 life-of-contract low, $3.14 a bushel, occurred on Aug. 31, 2016. The same day, this year, December 2017 corn traded a new life-of-contract low at $3.44. The 17% decline from the recent peak exceeds the 15% high-to-low correction in the same contract a year ago. Key year-over-year changes appear supportive.
13
Bloomberg Commodity Index (BCOM) Tables & Charts – August 2017 Edition
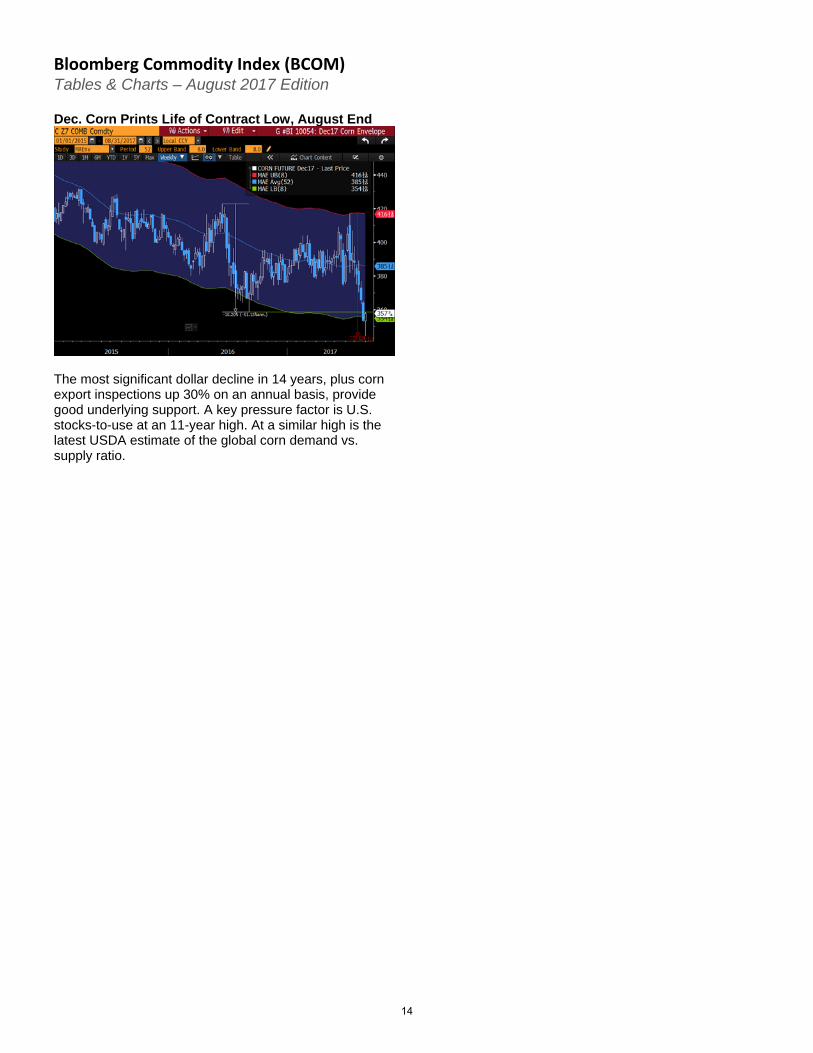
Dec. Corn Prints Life of Contract Low, August End
The most significant dollar decline in 14 years, plus corn export inspections up 30% on an annual basis, provide good underlying support. A key pressure factor is U.S. stocks-to-use at an 11-year high. At a similar high is the latest USDA estimate of the global corn demand vs. supply ratio.
14
Bloomberg Commodity Index (BCOM) Tables & Charts – August 2017 Edition
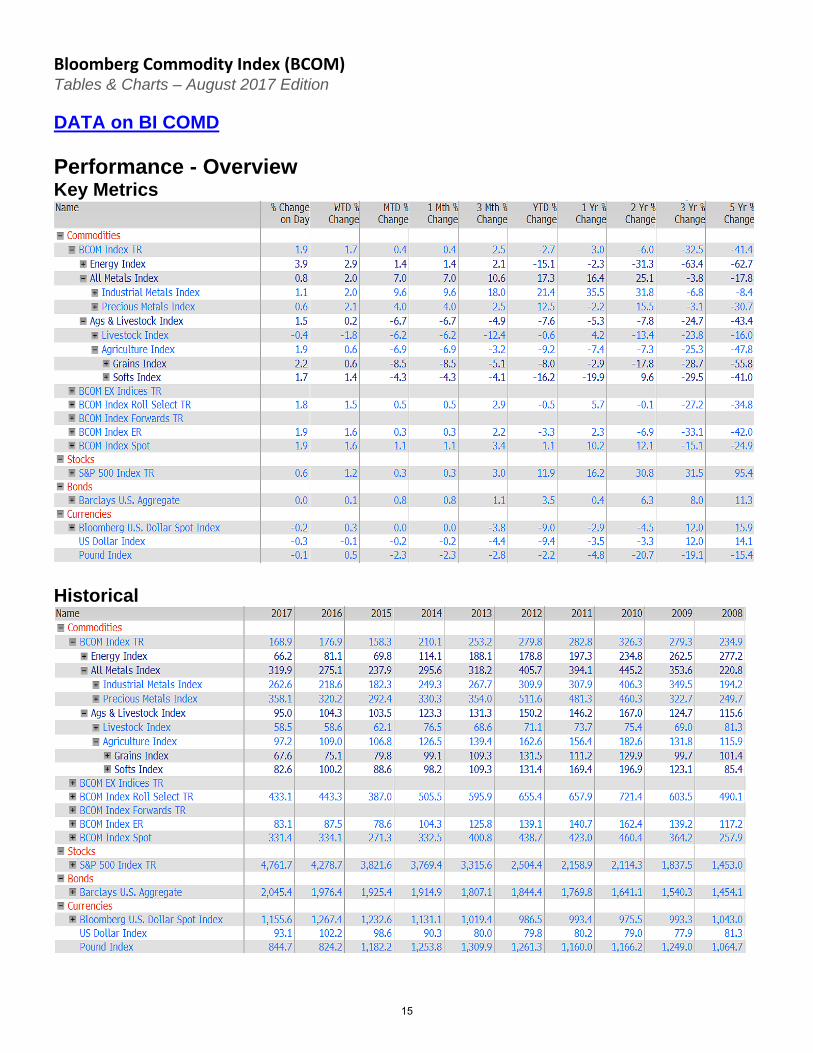
DATA on BI COMD Performance - Overview Key Metrics
Historical
15
Bloomberg Commodity Index (BCOM) Tables & Charts – August 2017 Edition
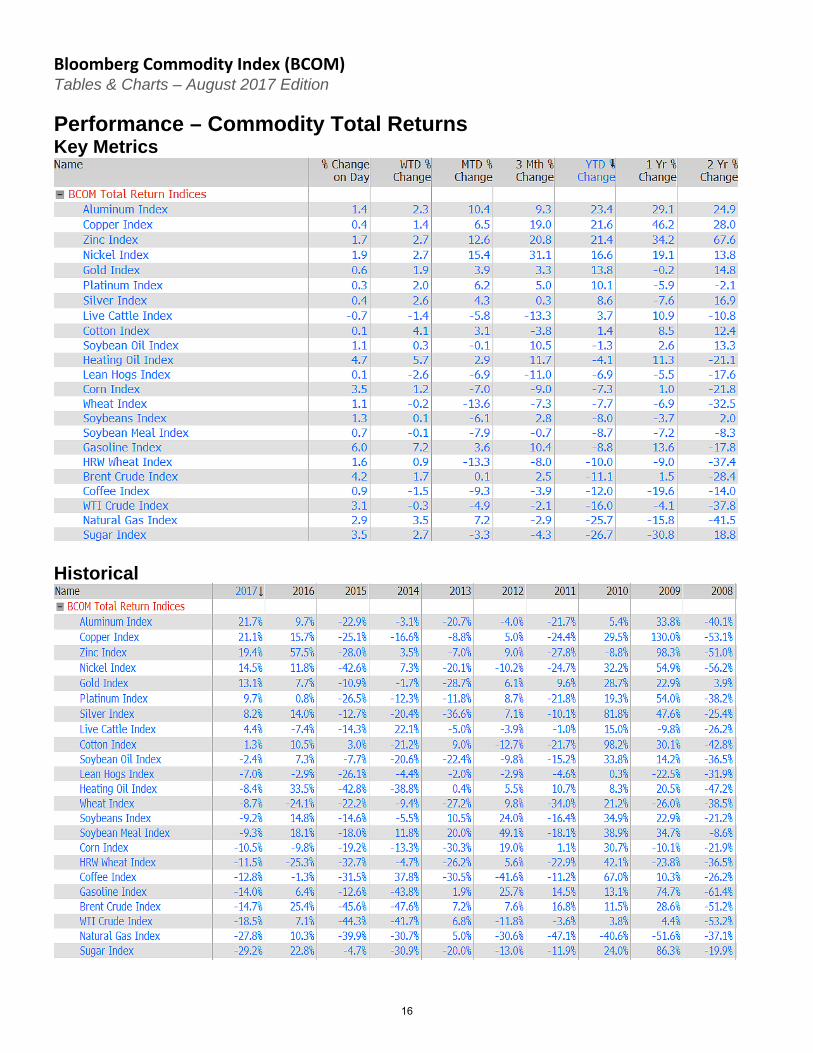
Performance – Commodity Total Returns Key Metrics
Historical
16
Bloomberg Commodity Index (BCOM) Tables & Charts – August 2017 Edition
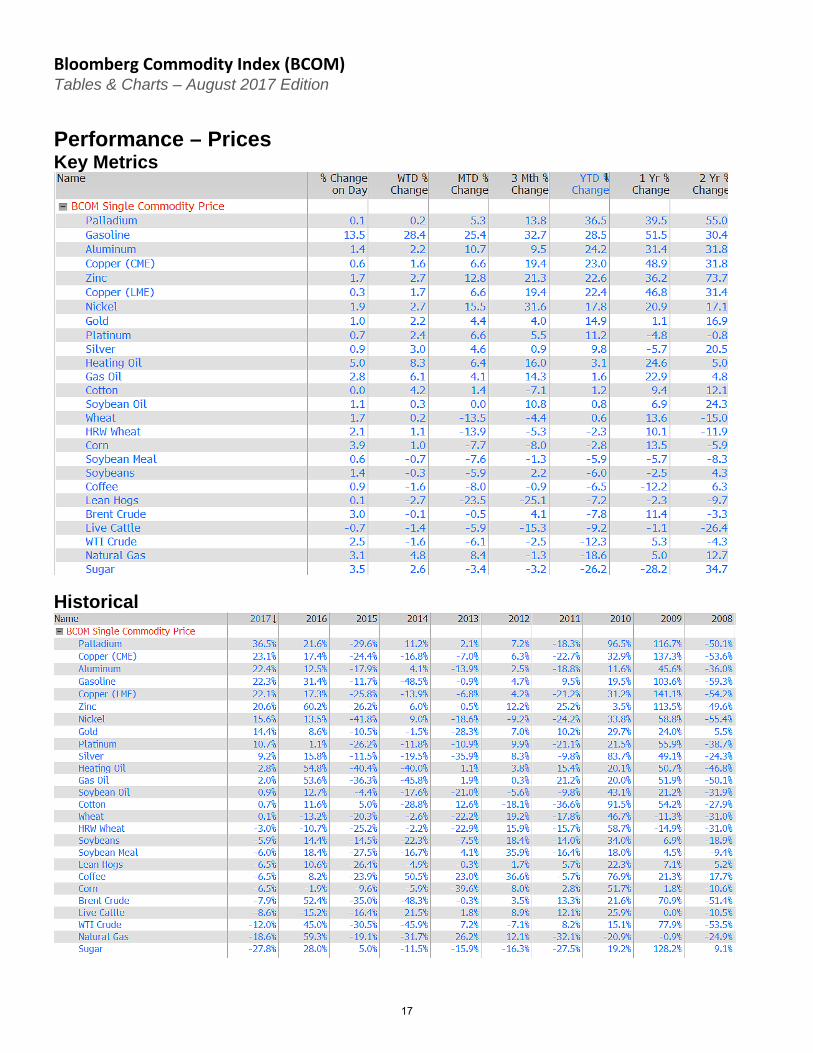
Performance – Prices Key Metrics
Historical
17
Bloomberg Commodity Index (BCOM) Tables & Charts – August 2017 Edition
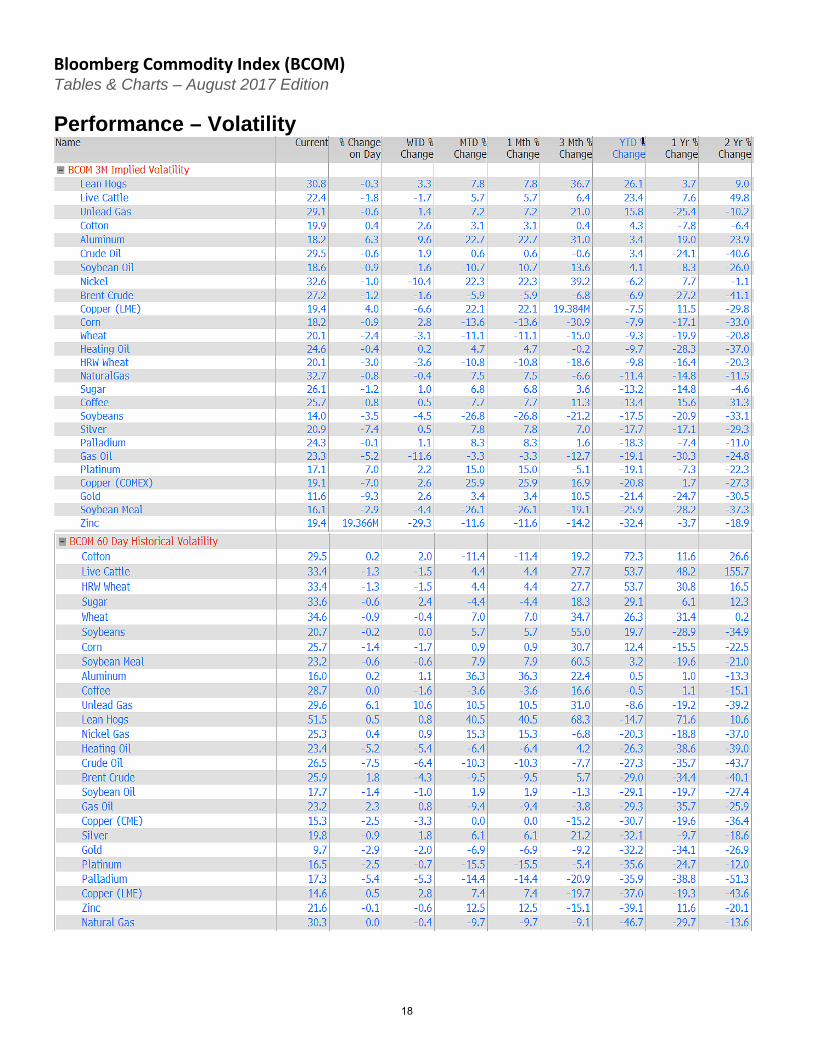
Performance – Volatility
18

Bloomberg Commodity Index (BCOM) Tables & Charts – August 2017 Edition
Curve Analysis – Contango (-) | Backwardation (+) Key Metrics
Measured via the one-year futures spread as a percent of the first contract price. Negative means the one-year out future is higher (contango). Positive means the one-year out future is lower (backwardation.
Historical
19
Bloomberg Commodity Index (BCOM) Tables & Charts – August 2017 Edition
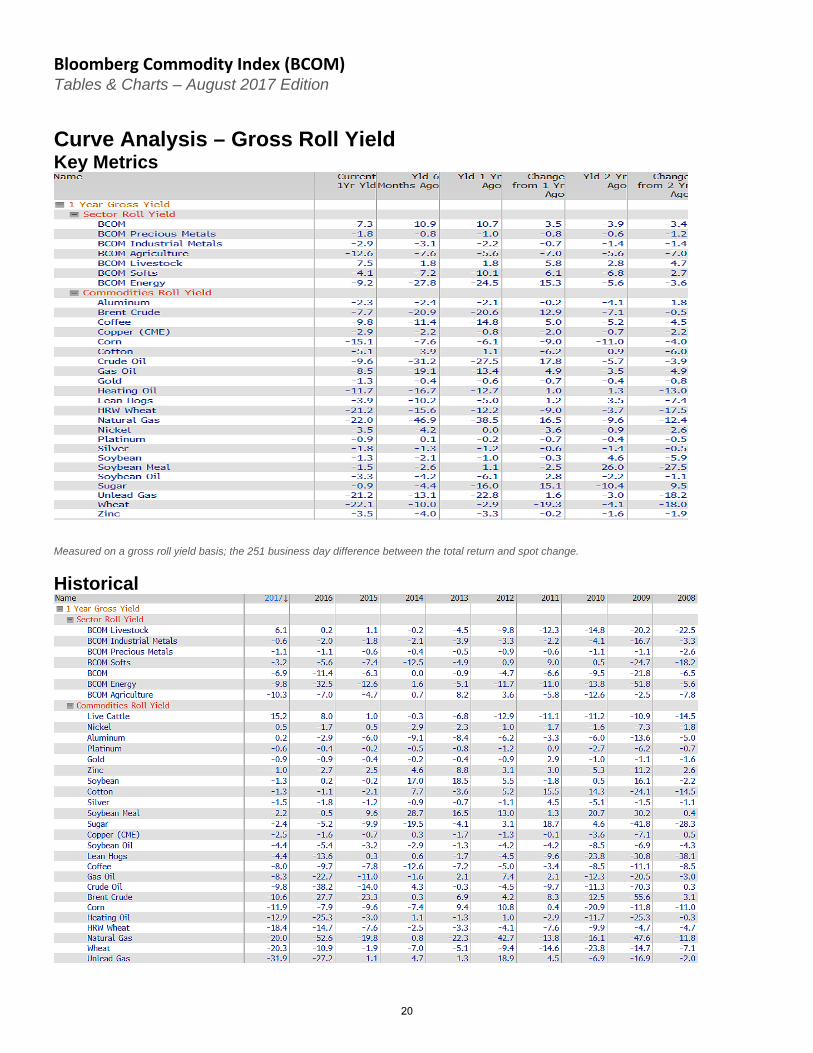
Curve Analysis – Gross Roll Yield Key Metrics
Measured on a gross roll yield basis; the 251 business day difference between the total return and spot change.
Historical
20
Bloomberg Commodity Index (BCOM) Tables & Charts – August 2017 Edition
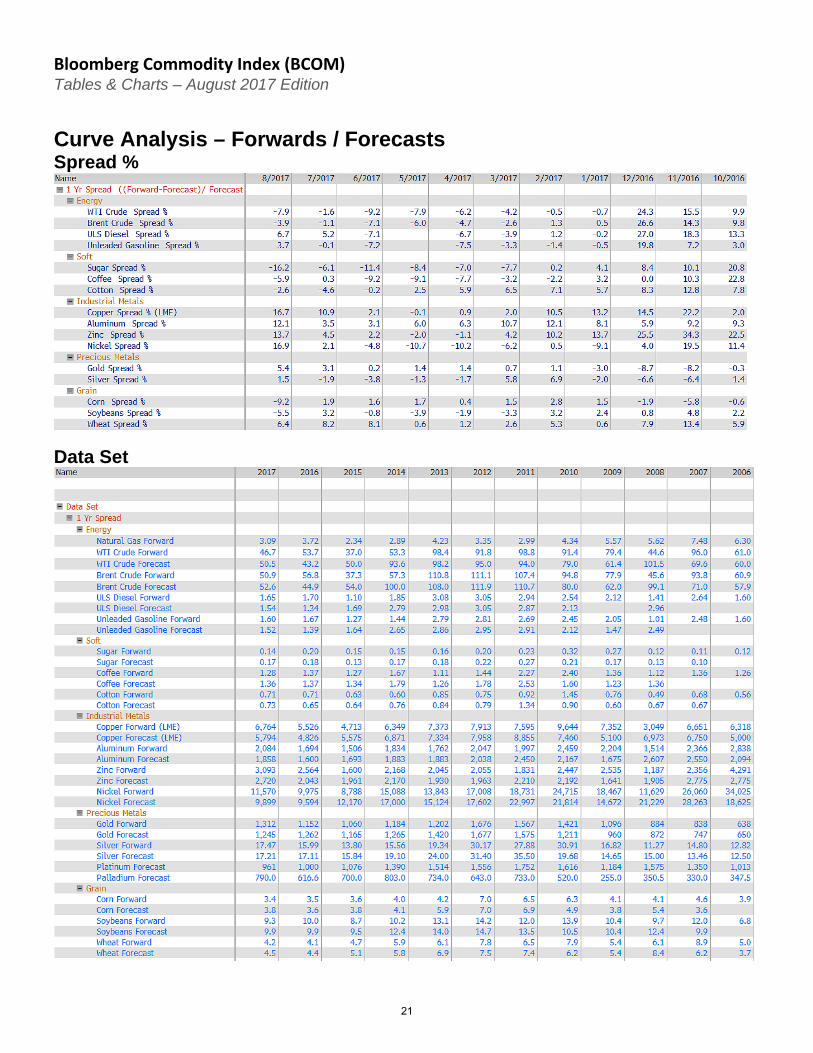
Curve Analysis – Forwards / Forecasts Spread %
Data Set
21
Bloomberg Commodity Index (BCOM) Tables & Charts – August 2017 Edition
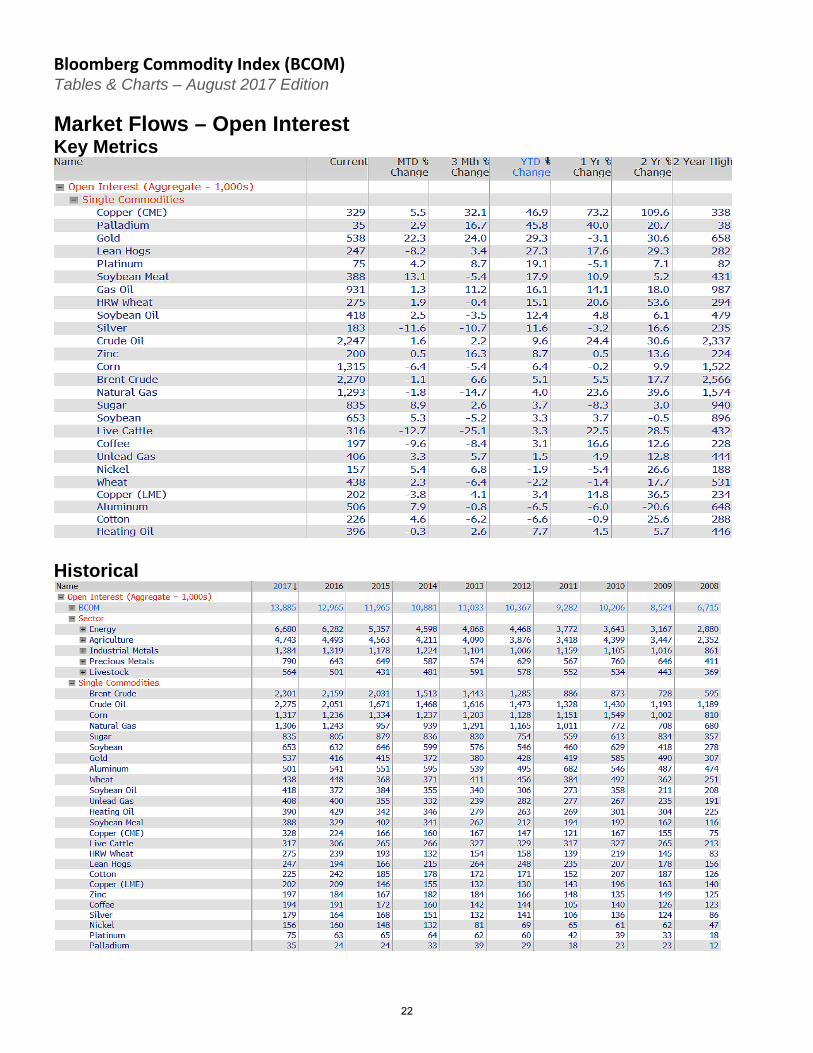
Market Flows – Open Interest Key Metrics
Historical
22
Bloomberg Commodity Index (BCOM) Tables & Charts – August 2017 Edition
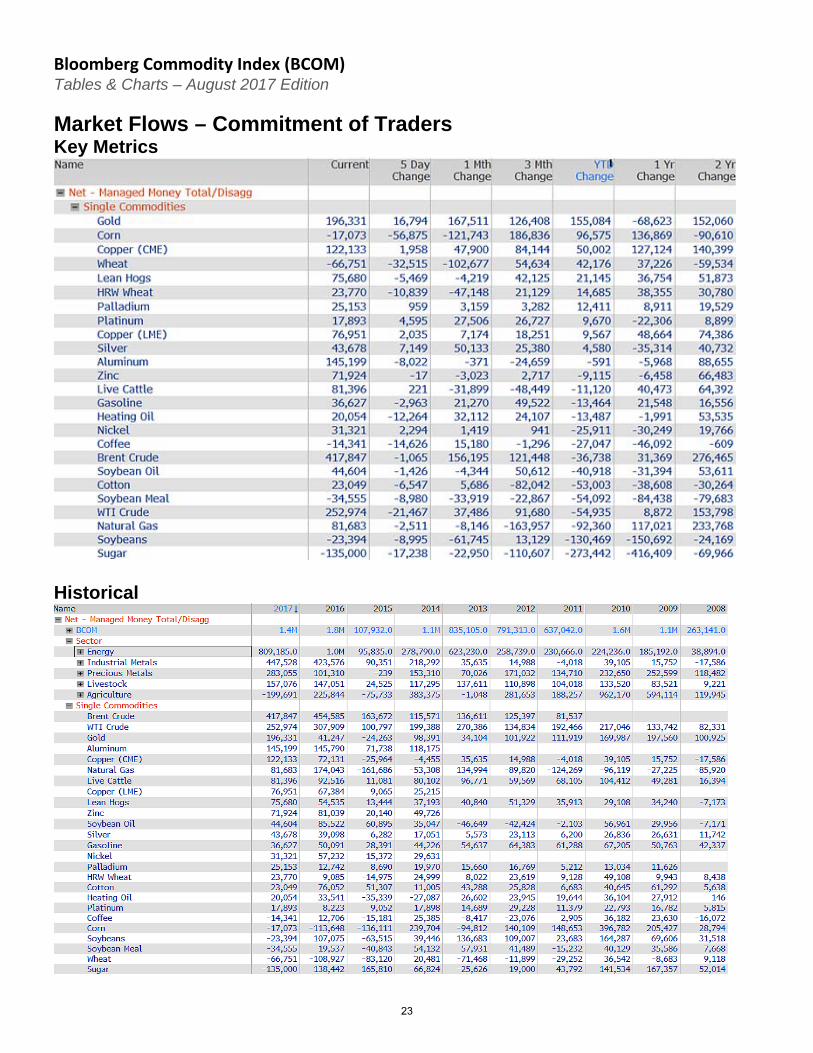
Market Flows – Commitment of Traders Key Metrics
Historical
23
Bloomberg Commodity Index (BCOM) Tables & Charts – August 2017 Edition
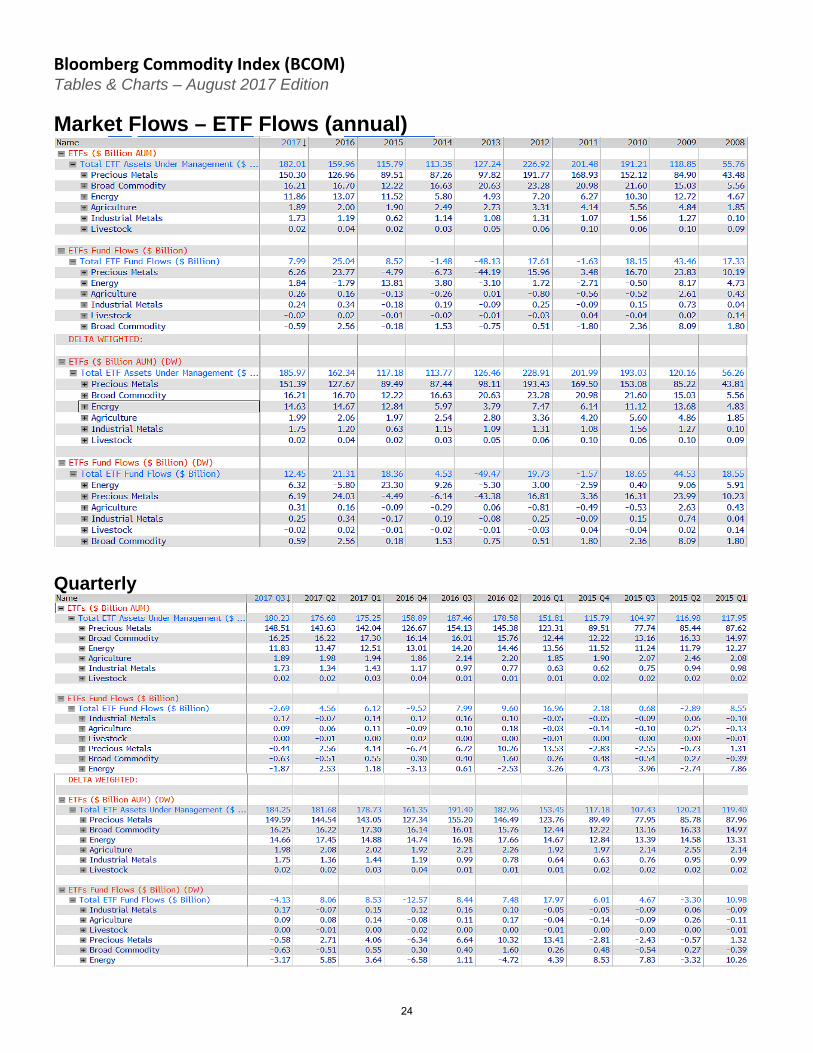
Market Flows – ETF Flows (annual)
Quarterly
24
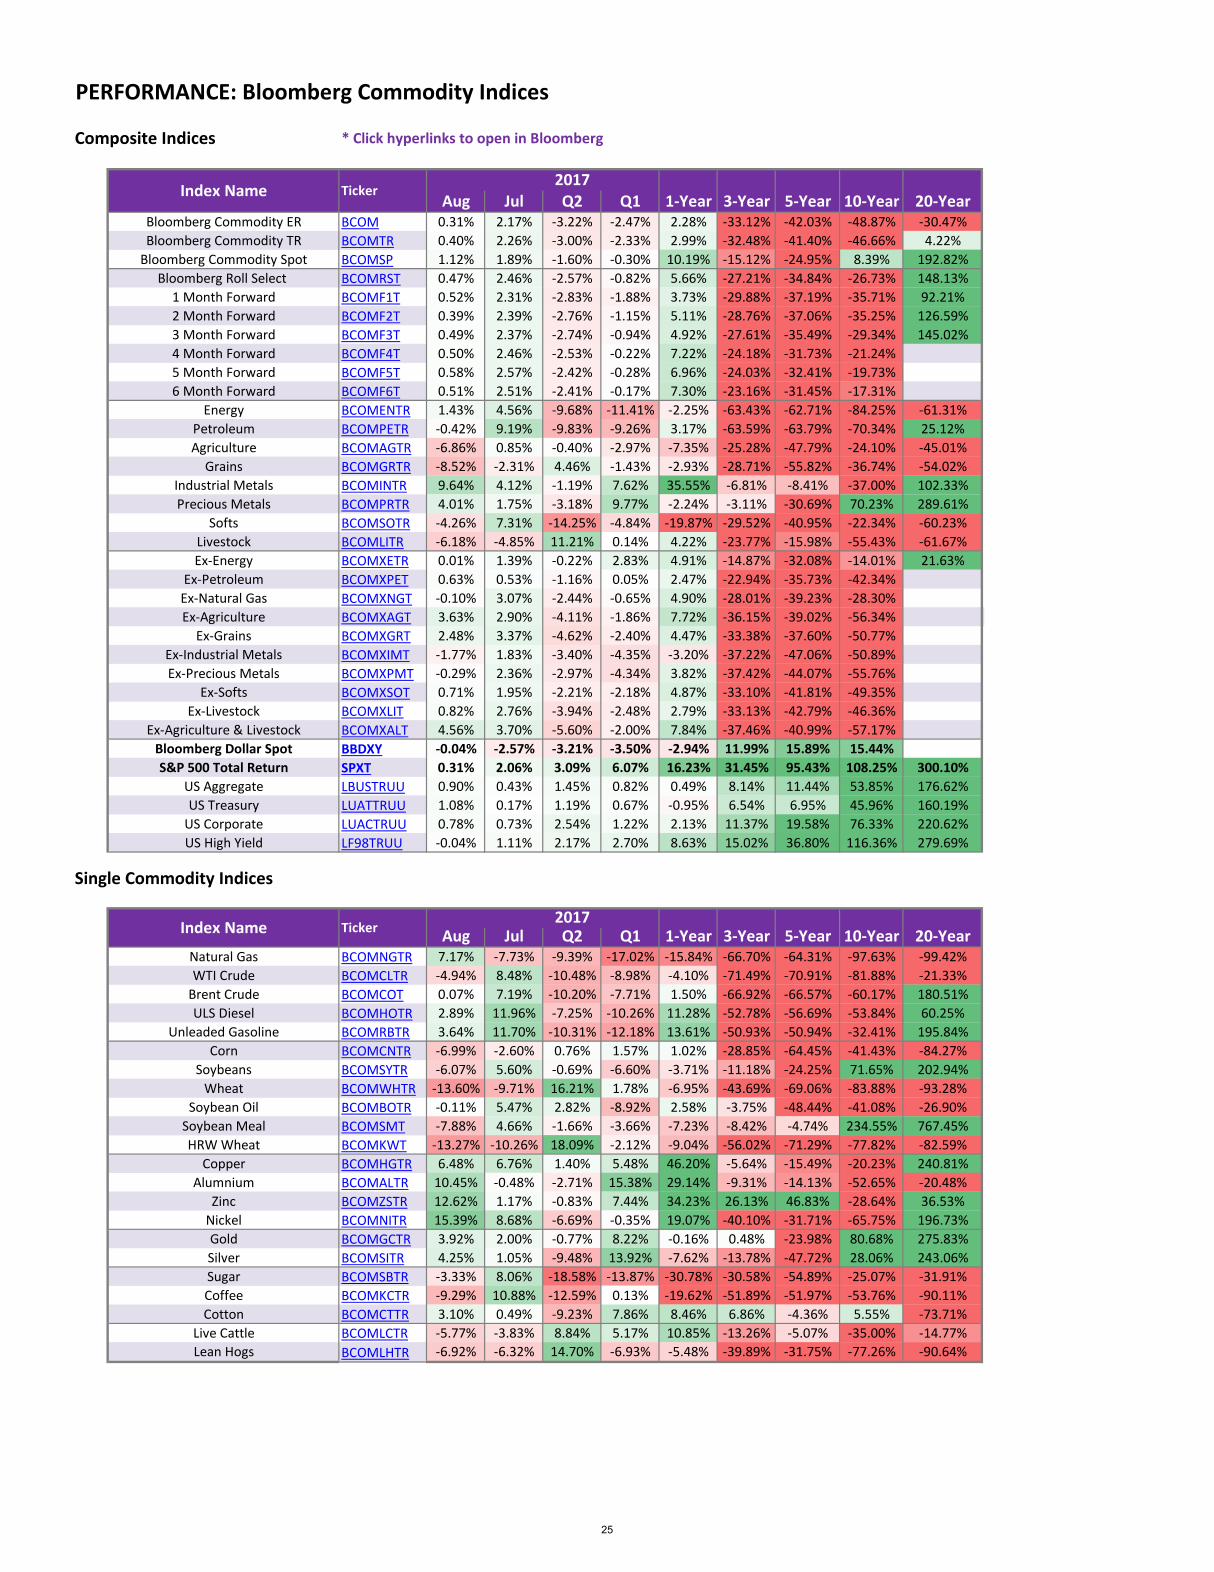
Composite Indices * Click hyperlinks to open in Bloomberg
2017Aug Jul Q2 Q1 1-Year 3-Year 5-Year 10-Year 20-Year
Bloomberg Commodity ER BCOM 0.31% 2.17% -3.22% -2.47% 2.28% -33.12% -42.03% -48.87% -30.47%Bloomberg Commodity TR BCOMTR 0.40% 2.26% -3.00% -2.33% 2.99% -32.48% -41.40% -46.66% 4.22%
Bloomberg Commodity Spot BCOMSP 1.12% 1.89% -1.60% -0.30% 10.19% -15.12% -24.95% 8.39% 192.82%Bloomberg Roll Select BCOMRST 0.47% 2.46% -2.57% -0.82% 5.66% -27.21% -34.84% -26.73% 148.13%
1 Month Forward BCOMF1T 0.52% 2.31% -2.83% -1.88% 3.73% -29.88% -37.19% -35.71% 92.21% 2 Month Forward BCOMF2T 0.39% 2.39% -2.76% -1.15% 5.11% -28.76% -37.06% -35.25% 126.59% 3 Month Forward BCOMF3T 0.49% 2.37% -2.74% -0.94% 4.92% -27.61% -35.49% -29.34% 145.02% 4 Month Forward BCOMF4T 0.50% 2.46% -2.53% -0.22% 7.22% -24.18% -31.73% -21.24% 5 Month Forward BCOMF5T 0.58% 2.57% -2.42% -0.28% 6.96% -24.03% -32.41% -19.73% 6 Month Forward BCOMF6T 0.51% 2.51% -2.41% -0.17% 7.30% -23.16% -31.45% -17.31%
Energy BCOMENTR 1.43% 4.56% -9.68% -11.41% -2.25% -63.43% -62.71% -84.25% -61.31%Petroleum BCOMPETR -0.42% 9.19% -9.83% -9.26% 3.17% -63.59% -63.79% -70.34% 25.12%Agriculture BCOMAGTR -6.86% 0.85% -0.40% -2.97% -7.35% -25.28% -47.79% -24.10% -45.01%
Grains BCOMGRTR -8.52% -2.31% 4.46% -1.43% -2.93% -28.71% -55.82% -36.74% -54.02%Industrial Metals BCOMINTR 9.64% 4.12% -1.19% 7.62% 35.55% -6.81% -8.41% -37.00% 102.33%Precious Metals BCOMPRTR 4.01% 1.75% -3.18% 9.77% -2.24% -3.11% -30.69% 70.23% 289.61%
Softs BCOMSOTR -4.26% 7.31% -14.25% -4.84% -19.87% -29.52% -40.95% -22.34% -60.23%Livestock BCOMLITR -6.18% -4.85% 11.21% 0.14% 4.22% -23.77% -15.98% -55.43% -61.67%Ex-Energy BCOMXETR 0.01% 1.39% -0.22% 2.83% 4.91% -14.87% -32.08% -14.01% 21.63%
Ex-Petroleum BCOMXPET 0.63% 0.53% -1.16% 0.05% 2.47% -22.94% -35.73% -42.34%Ex-Natural Gas BCOMXNGT -0.10% 3.07% -2.44% -0.65% 4.90% -28.01% -39.23% -28.30%Ex-Agriculture BCOMXAGT 3.63% 2.90% -4.11% -1.86% 7.72% -36.15% -39.02% -56.34%
Ex-Grains BCOMXGRT 2.48% 3.37% -4.62% -2.40% 4.47% -33.38% -37.60% -50.77%Ex-Industrial Metals BCOMXIMT -1.77% 1.83% -3.40% -4.35% -3.20% -37.22% -47.06% -50.89%Ex-Precious Metals BCOMXPMT -0.29% 2.36% -2.97% -4.34% 3.82% -37.42% -44.07% -55.76%
Ex-Softs BCOMXSOT 0.71% 1.95% -2.21% -2.18% 4.87% -33.10% -41.81% -49.35%Ex-Livestock BCOMXLIT 0.82% 2.76% -3.94% -2.48% 2.79% -33.13% -42.79% -46.36%
Ex-Agriculture & Livestock BCOMXALT 4.56% 3.70% -5.60% -2.00% 7.84% -37.46% -40.99% -57.17%Bloomberg Dollar Spot BBDXY -0.04% -2.57% -3.21% -3.50% -2.94% 11.99% 15.89% 15.44%S&P 500 Total Return SPXT 0.31% 2.06% 3.09% 6.07% 16.23% 31.45% 95.43% 108.25% 300.10%
US Aggregate LBUSTRUU 0.90% 0.43% 1.45% 0.82% 0.49% 8.14% 11.44% 53.85% 176.62%US Treasury LUATTRUU 1.08% 0.17% 1.19% 0.67% -0.95% 6.54% 6.95% 45.96% 160.19%
US Corporate LUACTRUU 0.78% 0.73% 2.54% 1.22% 2.13% 11.37% 19.58% 76.33% 220.62%US High Yield LF98TRUU -0.04% 1.11% 2.17% 2.70% 8.63% 15.02% 36.80% 116.36% 279.69%
Single Commodity Indices
2017Aug Jul Q2 Q1 1-Year 3-Year 5-Year 10-Year 20-Year
Natural Gas BCOMNGTR 7.17% -7.73% -9.39% -17.02% -15.84% -66.70% -64.31% -97.63% -99.42%WTI Crude BCOMCLTR -4.94% 8.48% -10.48% -8.98% -4.10% -71.49% -70.91% -81.88% -21.33%
Brent Crude BCOMCOT 0.07% 7.19% -10.20% -7.71% 1.50% -66.92% -66.57% -60.17% 180.51%ULS Diesel BCOMHOTR 2.89% 11.96% -7.25% -10.26% 11.28% -52.78% -56.69% -53.84% 60.25%
Unleaded Gasoline BCOMRBTR 3.64% 11.70% -10.31% -12.18% 13.61% -50.93% -50.94% -32.41% 195.84%Corn BCOMCNTR -6.99% -2.60% 0.76% 1.57% 1.02% -28.85% -64.45% -41.43% -84.27%
Soybeans BCOMSYTR -6.07% 5.60% -0.69% -6.60% -3.71% -11.18% -24.25% 71.65% 202.94%Wheat BCOMWHTR -13.60% -9.71% 16.21% 1.78% -6.95% -43.69% -69.06% -83.88% -93.28%
Soybean Oil BCOMBOTR -0.11% 5.47% 2.82% -8.92% 2.58% -3.75% -48.44% -41.08% -26.90%Soybean Meal BCOMSMT -7.88% 4.66% -1.66% -3.66% -7.23% -8.42% -4.74% 234.55% 767.45%HRW Wheat BCOMKWT -13.27% -10.26% 18.09% -2.12% -9.04% -56.02% -71.29% -77.82% -82.59%
Copper BCOMHGTR 6.48% 6.76% 1.40% 5.48% 46.20% -5.64% -15.49% -20.23% 240.81%Alumnium BCOMALTR 10.45% -0.48% -2.71% 15.38% 29.14% -9.31% -14.13% -52.65% -20.48%
Zinc BCOMZSTR 12.62% 1.17% -0.83% 7.44% 34.23% 26.13% 46.83% -28.64% 36.53%Nickel BCOMNITR 15.39% 8.68% -6.69% -0.35% 19.07% -40.10% -31.71% -65.75% 196.73%Gold BCOMGCTR 3.92% 2.00% -0.77% 8.22% -0.16% 0.48% -23.98% 80.68% 275.83%Silver BCOMSITR 4.25% 1.05% -9.48% 13.92% -7.62% -13.78% -47.72% 28.06% 243.06%Sugar BCOMSBTR -3.33% 8.06% -18.58% -13.87% -30.78% -30.58% -54.89% -25.07% -31.91%Coffee BCOMKCTR -9.29% 10.88% -12.59% 0.13% -19.62% -51.89% -51.97% -53.76% -90.11%Cotton BCOMCTTR 3.10% 0.49% -9.23% 7.86% 8.46% 6.86% -4.36% 5.55% -73.71%
Live Cattle BCOMLCTR -5.77% -3.83% 8.84% 5.17% 10.85% -13.26% -5.07% -35.00% -14.77%Lean Hogs BCOMLHTR -6.92% -6.32% 14.70% -6.93% -5.48% -39.89% -31.75% -77.26% -90.64%
Index Name Ticker
Index Name Ticker
PERFORMANCE: Bloomberg Commodity Indices
25
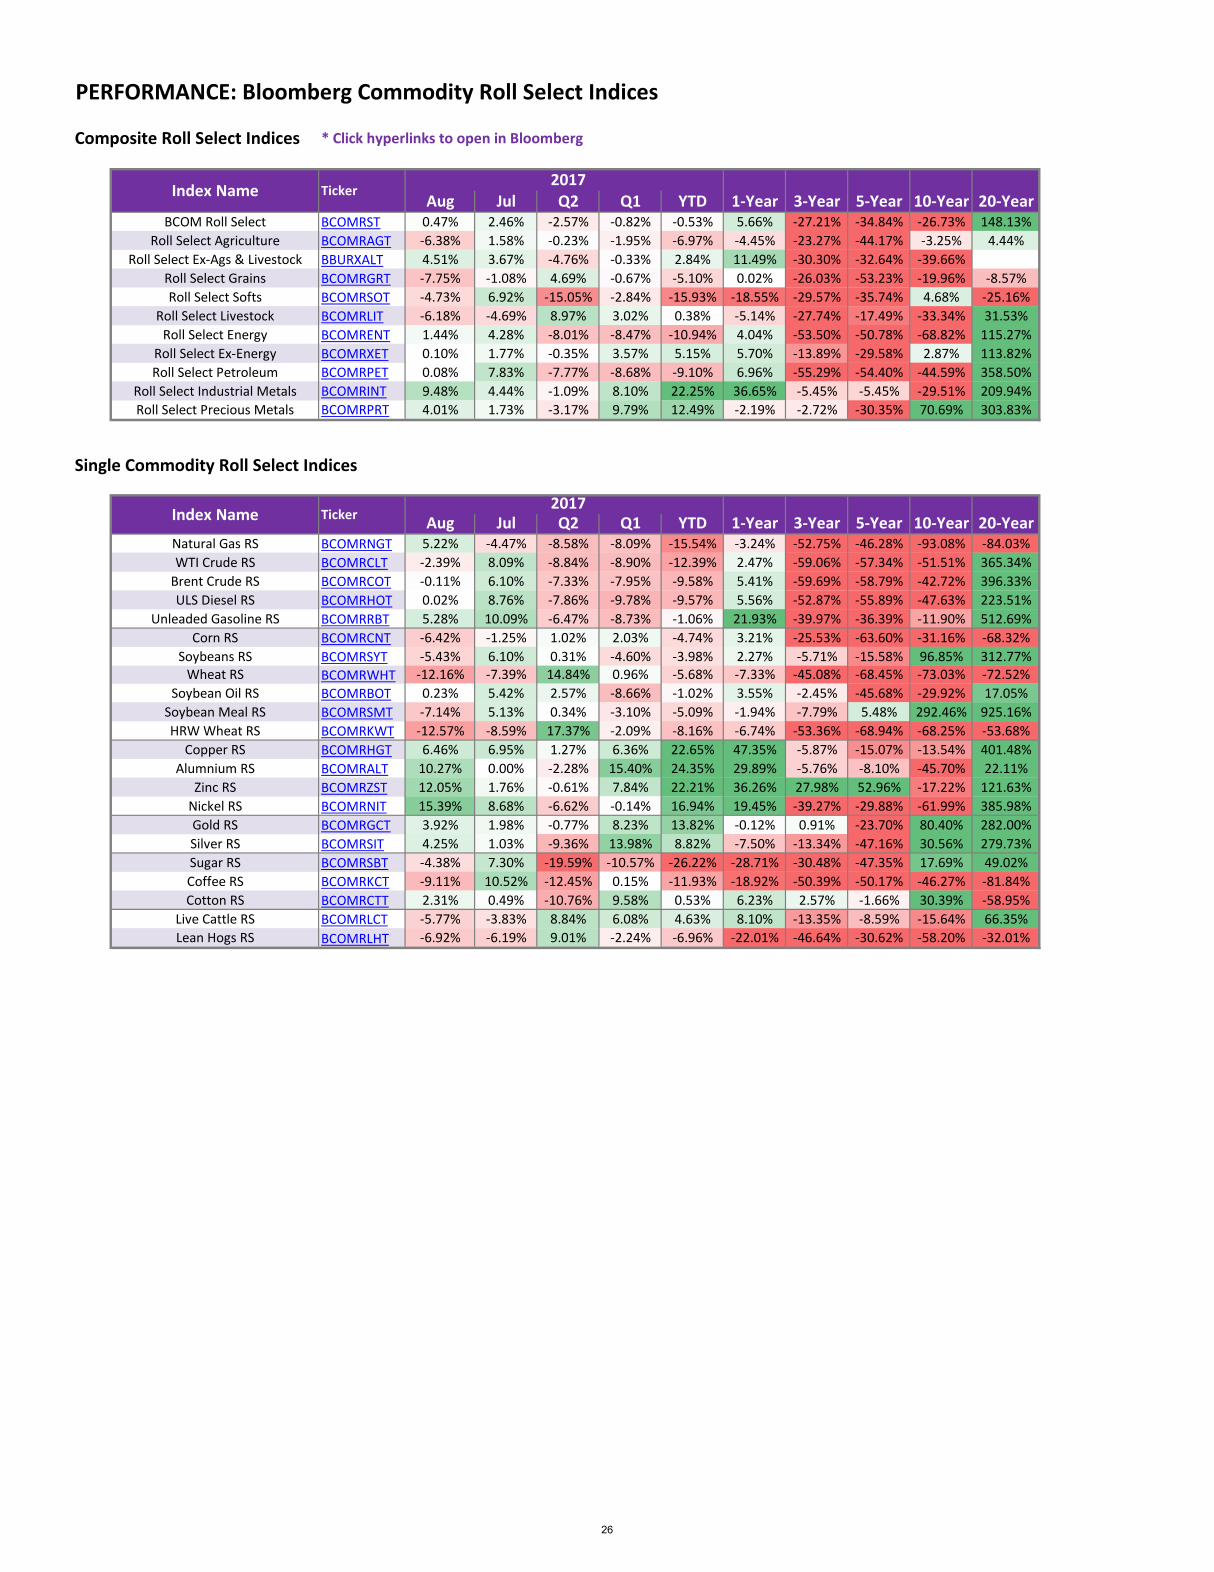
Composite Roll Select Indices * Click hyperlinks to open in Bloomberg
2017Aug Jul Q2 Q1 YTD 1-Year 3-Year 5-Year 10-Year 20-Year
BCOM Roll Select BCOMRST 0.47% 2.46% -2.57% -0.82% -0.53% 5.66% -27.21% -34.84% -26.73% 148.13%Roll Select Agriculture BCOMRAGT -6.38% 1.58% -0.23% -1.95% -6.97% -4.45% -23.27% -44.17% -3.25% 4.44%
Roll Select Ex-Ags & Livestock BBURXALT 4.51% 3.67% -4.76% -0.33% 2.84% 11.49% -30.30% -32.64% -39.66%Roll Select Grains BCOMRGRT -7.75% -1.08% 4.69% -0.67% -5.10% 0.02% -26.03% -53.23% -19.96% -8.57%Roll Select Softs BCOMRSOT -4.73% 6.92% -15.05% -2.84% -15.93% -18.55% -29.57% -35.74% 4.68% -25.16%
Roll Select Livestock BCOMRLIT -6.18% -4.69% 8.97% 3.02% 0.38% -5.14% -27.74% -17.49% -33.34% 31.53%Roll Select Energy BCOMRENT 1.44% 4.28% -8.01% -8.47% -10.94% 4.04% -53.50% -50.78% -68.82% 115.27%
Roll Select Ex-Energy BCOMRXET 0.10% 1.77% -0.35% 3.57% 5.15% 5.70% -13.89% -29.58% 2.87% 113.82%Roll Select Petroleum BCOMRPET 0.08% 7.83% -7.77% -8.68% -9.10% 6.96% -55.29% -54.40% -44.59% 358.50%
Roll Select Industrial Metals BCOMRINT 9.48% 4.44% -1.09% 8.10% 22.25% 36.65% -5.45% -5.45% -29.51% 209.94%Roll Select Precious Metals BCOMRPRT 4.01% 1.73% -3.17% 9.79% 12.49% -2.19% -2.72% -30.35% 70.69% 303.83%
Single Commodity Roll Select Indices
2017Aug Jul Q2 Q1 YTD 1-Year 3-Year 5-Year 10-Year 20-Year
Natural Gas RS BCOMRNGT 5.22% -4.47% -8.58% -8.09% -15.54% -3.24% -52.75% -46.28% -93.08% -84.03%WTI Crude RS BCOMRCLT -2.39% 8.09% -8.84% -8.90% -12.39% 2.47% -59.06% -57.34% -51.51% 365.34%
Brent Crude RS BCOMRCOT -0.11% 6.10% -7.33% -7.95% -9.58% 5.41% -59.69% -58.79% -42.72% 396.33%ULS Diesel RS BCOMRHOT 0.02% 8.76% -7.86% -9.78% -9.57% 5.56% -52.87% -55.89% -47.63% 223.51%
Unleaded Gasoline RS BCOMRRBT 5.28% 10.09% -6.47% -8.73% -1.06% 21.93% -39.97% -36.39% -11.90% 512.69%Corn RS BCOMRCNT -6.42% -1.25% 1.02% 2.03% -4.74% 3.21% -25.53% -63.60% -31.16% -68.32%
Soybeans RS BCOMRSYT -5.43% 6.10% 0.31% -4.60% -3.98% 2.27% -5.71% -15.58% 96.85% 312.77%Wheat RS BCOMRWHT -12.16% -7.39% 14.84% 0.96% -5.68% -7.33% -45.08% -68.45% -73.03% -72.52%
Soybean Oil RS BCOMRBOT 0.23% 5.42% 2.57% -8.66% -1.02% 3.55% -2.45% -45.68% -29.92% 17.05%Soybean Meal RS BCOMRSMT -7.14% 5.13% 0.34% -3.10% -5.09% -1.94% -7.79% 5.48% 292.46% 925.16%HRW Wheat RS BCOMRKWT -12.57% -8.59% 17.37% -2.09% -8.16% -6.74% -53.36% -68.94% -68.25% -53.68%
Copper RS BCOMRHGT 6.46% 6.95% 1.27% 6.36% 22.65% 47.35% -5.87% -15.07% -13.54% 401.48%Alumnium RS BCOMRALT 10.27% 0.00% -2.28% 15.40% 24.35% 29.89% -5.76% -8.10% -45.70% 22.11%
Zinc RS BCOMRZST 12.05% 1.76% -0.61% 7.84% 22.21% 36.26% 27.98% 52.96% -17.22% 121.63%Nickel RS BCOMRNIT 15.39% 8.68% -6.62% -0.14% 16.94% 19.45% -39.27% -29.88% -61.99% 385.98%Gold RS BCOMRGCT 3.92% 1.98% -0.77% 8.23% 13.82% -0.12% 0.91% -23.70% 80.40% 282.00%Silver RS BCOMRSIT 4.25% 1.03% -9.36% 13.98% 8.82% -7.50% -13.34% -47.16% 30.56% 279.73%Sugar RS BCOMRSBT -4.38% 7.30% -19.59% -10.57% -26.22% -28.71% -30.48% -47.35% 17.69% 49.02%Coffee RS BCOMRKCT -9.11% 10.52% -12.45% 0.15% -11.93% -18.92% -50.39% -50.17% -46.27% -81.84%Cotton RS BCOMRCTT 2.31% 0.49% -10.76% 9.58% 0.53% 6.23% 2.57% -1.66% 30.39% -58.95%
Live Cattle RS BCOMRLCT -5.77% -3.83% 8.84% 6.08% 4.63% 8.10% -13.35% -8.59% -15.64% 66.35%Lean Hogs RS BCOMRLHT -6.92% -6.19% 9.01% -2.24% -6.96% -22.01% -46.64% -30.62% -58.20% -32.01%
PERFORMANCE: Bloomberg Commodity Roll Select Indices
Index Name Ticker
Index Name Ticker
26
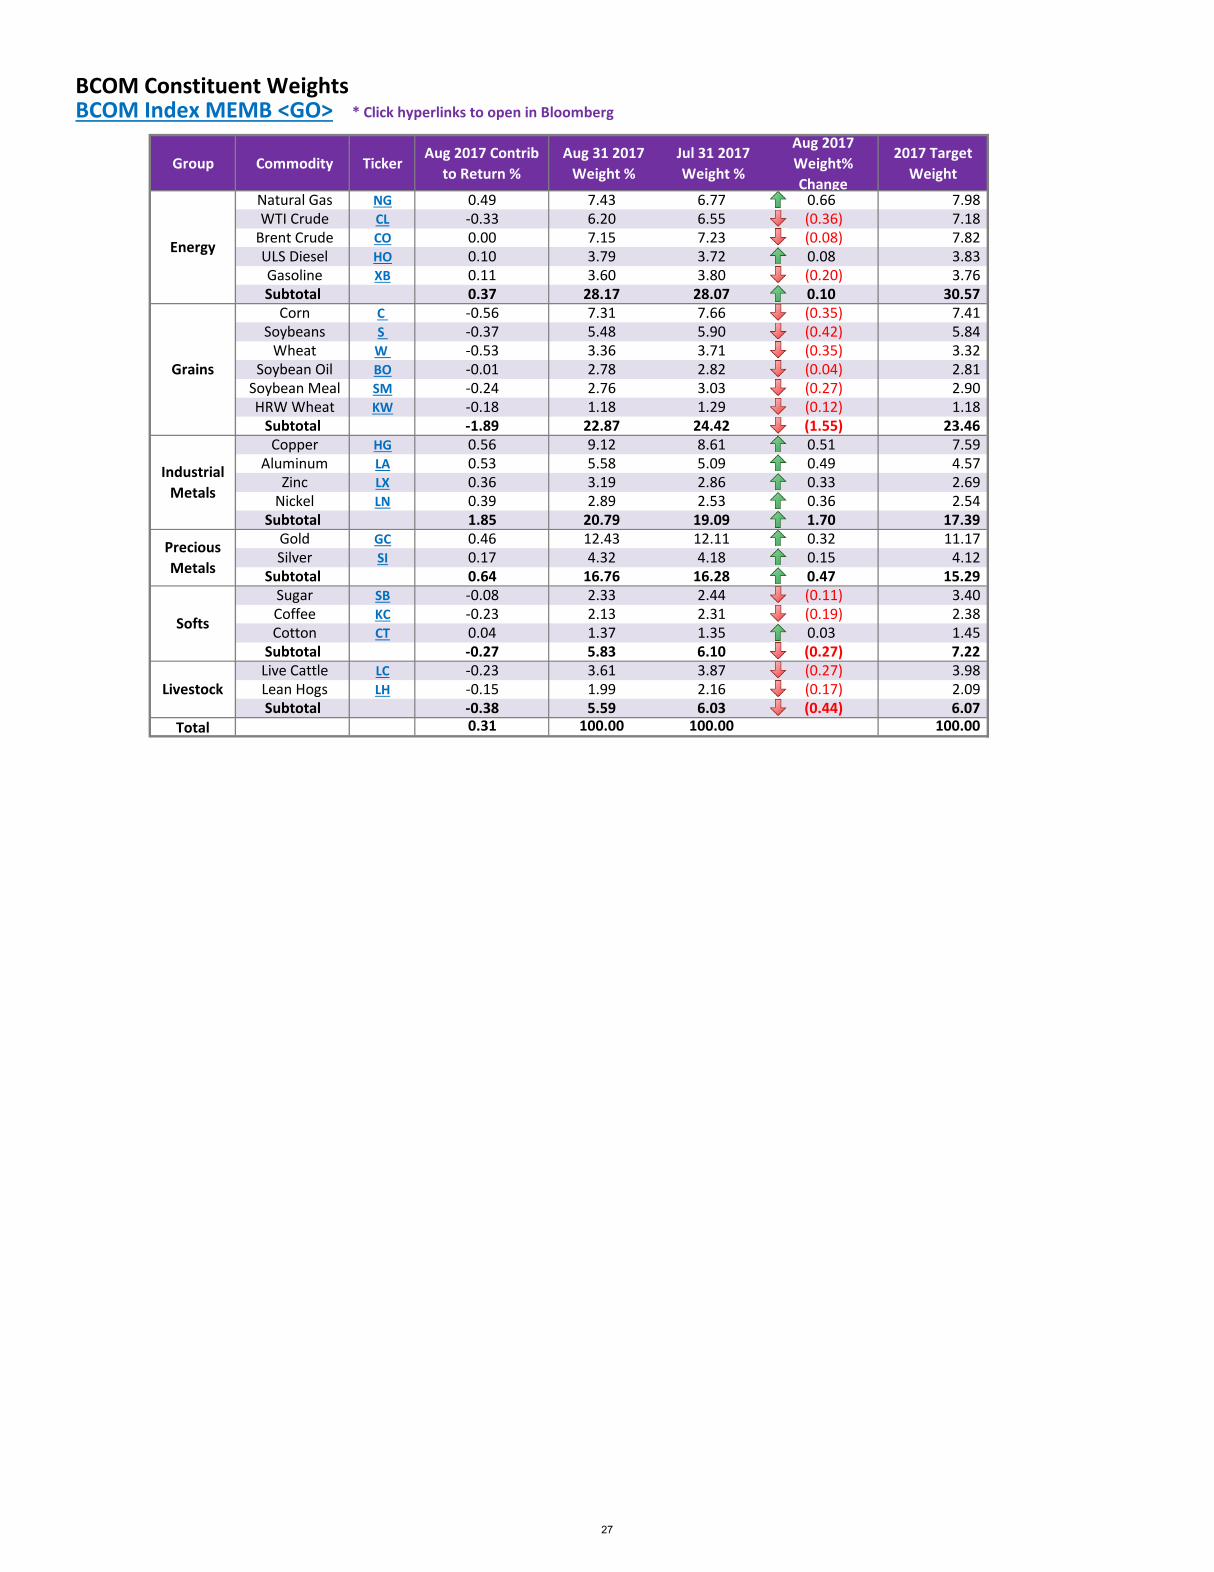
BCOM Constituent Weights BCOM Index MEMB <GO> * Click hyperlinks to open in Bloomberg
Group Commodity TickerAug 2017 Contrib
to Return %Aug 31 2017
Weight %Jul 31 2017 Weight %
Aug 2017 Weight% Change
2017 Target Weight
Natural Gas NG 0.49 7.43 6.77 0.66 7.98 WTI Crude CL -0.33 6.20 6.55 (0.36) 7.18
Brent Crude CO 0.00 7.15 7.23 (0.08) 7.82 ULS Diesel HO 0.10 3.79 3.72 0.08 3.83 Gasoline XB 0.11 3.60 3.80 (0.20) 3.76 Subtotal 0.37 28.17 28.07 0.10 30.57
Corn C -0.56 7.31 7.66 (0.35) 7.41 Soybeans S -0.37 5.48 5.90 (0.42) 5.84
Wheat W -0.53 3.36 3.71 (0.35) 3.32 Soybean Oil BO -0.01 2.78 2.82 (0.04) 2.81
Soybean Meal SM -0.24 2.76 3.03 (0.27) 2.90 HRW Wheat KW -0.18 1.18 1.29 (0.12) 1.18
Subtotal -1.89 22.87 24.42 (1.55) 23.46 Copper HG 0.56 9.12 8.61 0.51 7.59
Aluminum LA 0.53 5.58 5.09 0.49 4.57 Zinc LX 0.36 3.19 2.86 0.33 2.69
Nickel LN 0.39 2.89 2.53 0.36 2.54 Subtotal 1.85 20.79 19.09 1.70 17.39
Gold GC 0.46 12.43 12.11 0.32 11.17 Silver SI 0.17 4.32 4.18 0.15 4.12
Subtotal 0.64 16.76 16.28 0.47 15.29 Sugar SB -0.08 2.33 2.44 (0.11) 3.40 Coffee KC -0.23 2.13 2.31 (0.19) 2.38 Cotton CT 0.04 1.37 1.35 0.03 1.45
Subtotal -0.27 5.83 6.10 (0.27) 7.22 Live Cattle LC -0.23 3.61 3.87 (0.27) 3.98 Lean Hogs LH -0.15 1.99 2.16 (0.17) 2.09 Subtotal -0.38 5.59 6.03 (0.44) 6.07
Total 0.31 100.00 100.00 100.00
Energy
Livestock
Softs
Precious Metals
Industrial Metals
Grains
27
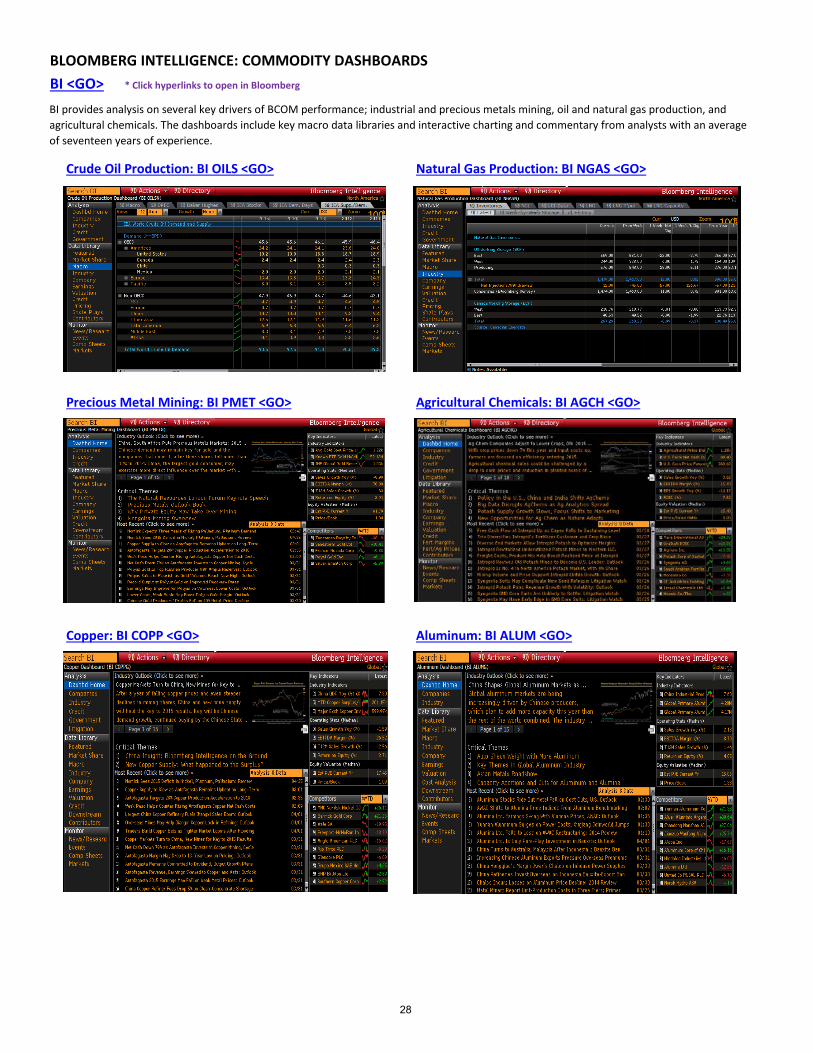
BLOOMBERG INTELLIGENCE: COMMODITY DASHBOARDS BI <GO> * Click hyperlinks to open in Bloomberg
Crude Oil Production: BI OILS <GO> Natural Gas Production: BI NGAS <GO>
Precious Metal Mining: BI PMET <GO> Agricultural Chemicals: BI AGCH <GO>
Copper: BI COPP <GO> Aluminum: BI ALUM <GO>
BI provides analysis on several key drivers of BCOM performance; industrial and precious metals mining, oil and natural gas production, and agricultural chemicals. The dashboards include key macro data libraries and interactive charting and commentary from analysts with an average of seventeen years of experience.
28

COMMODITY CHEAT SHEET FOR THE BLOOMBERG PROFESSIONAL® SERVICE
* Click hyperlinks to open in Bloomberg
Broad Commodities EnergyTop commodity news CTOP Top energy news ETOPGlobal commodity prices GLCO Top oil news OTOP Commodity playbook CPLY Crude Oil Production Dashboard BI OILSCommitments of traders report COT First Word oil NI BFWOIL Calendar of commodity events ECO17 News on oil inventories TNI OIL INV Commodity arbitrage calculator CARC Oil Buyer's Guide newsletter NI OBGBRIEFCommodity fundamental data explorer FDM Pipes & Wires newsletter NI PAWSBRIEFCommodity futures overview CMBQ Oil market analysis BOILSecurity finder SECF Nat gas spot prices BGASCommodity data contributors & broker CDAT Forward European utility markets EUMContract table menu CTM News on oil markets NI OILMARKET Seasonality chart SEAG News on OPEC NI OPEC Commodity curve analysis CCRV OPEC production and prices OPECCommodity fair values CFVL Oil markets menu OIL Commodity price forecasts CPFC Crude stored in tankers NOONCommitments of Traders Report COT Refinery outages REFOCommodity maps BMAP Oil’s decline EXT5 Commodity options monitor OMON Oil versus inflation expectations SWIFCommodities charts COSYCommodity Investors menu CMNV MetalsUS exchange traded product fund flows ETF Top metal news METT
Precious metal dashboard BI PMETGBase metals dashboard BI BMET
Commodity Indices Metals prices and data MINE Index description BCOM Index DES Precious metals prices and rates MTL Index constituent weights BCOM Index MEMB Metals Bulletin MB Listed index futures BCOM Index CT COMEX inventories COMX Option volatility surface BCOM Index OVDV LME monitor LME Seasonality chart BCOMNG Index SEAG LME implied volatilities LMIV Commodity index futures movers FMV LME warehouse inventories LMEI Commodity index ranked returns CRR
AgricultureWeather Top agriculture news YTOP Global weather database WETR Agriculture calendar AGRI US snow monitor SNOW Agriculture spot prices AGGPEU weather & utility models EUMM Agriculture supply & demand AGSD
Crop calendar CCAL
BCOM QUICK FACTS Index Methodology
Weighting Bias 2/3 market liquidity and 1/3 world production No. of Commodities 20 Re-balancing Frequency Annual Roll Schedule Monthly (5 day roll) Caps/Limits Single commodity: max 15%
Single commodity and its derivatives: max 25%Related commodity groups: max 33%
First Value Date 30 December 1990
The data provided in this report can be easily accessed on the Bloomberg Professional® service along with numerous news and analytical tools to help you stay on top of the commodity markets.
29
BLOOMBERG, BLOOMBERG INDICES and BCOM are trademarks or service marks of Bloomberg Finance L.P.
Bloomberg Finance L.P. and its affiliates ("collectively, "Bloomberg") or Bloomberg's licensors own all proprietary
right in the BLOOMBERG INDICES or BCOM. Bloomberg does not guarantee the timeliness, accuracy or
completeness of any data or information relating to BLOOMBERG INDICES or BCOM. Bloomberg makes no
warranty, express or implied, as to the BLOOMBERG INDICES or BCOM or any data or values relating thereto or
results to be obtained therefrom, and expressly disclaims all warranties of merchantability and fitness for a particular
purpose with respect thereto. It is not possible to invest directly in an index. Back-tested performance is not actual
performance. Past performance is not an indication of future results. To the maximum extent allowed by law,
Bloomberg, its licensors, and its and their respective employees, contractors, agents, suppliers and vendors shall
have no liability or responsibility whatsoever for any injury or damages - whether direct, indirect, consequential,
incidental, punitive or otherwise - arising in connection with BLOOMBERG INDICES or BCOM or any data or
values relating thereto - whether arising from their negligence or otherwise. This document constitutes the provision
of factual information, rather than financial product advice. Nothing in the BLOOMBERG INDICES or BCOM
shall constitute or be construed as an offering of financial instruments or as investment advice or investment
recommendations (i.e., recommendations as to whether or not to “buy”, “sell”, “hold”, or to enter or not to enter into
any other transaction involving any specific interest or interests) by Bloomberg or its affiliates or a recommendation
as to an investment or other strategy by Bloomberg or its affiliates. Data and other information available via the
BLOOMBERG INDICES or BCOM should not be considered as information sufficient upon which to base an
investment decision. All information provided by the BLOOMBERG INDICES or BCOM is impersonal and not
tailored to the needs of any person, entity or group of persons. Bloomberg and its affiliates do not express an opinion
on the future or expected value of any security or other interest and do not explicitly or implicitly recommend or
suggest an investment strategy of any kind. Customers should consider obtaining independent advice before making
any financial decisions. © 2016 Bloomberg Finance L.P. All rights reserved. This document and its contents may
not be forwarded or redistributed without the prior consent of Bloomberg.
The BLOOMBERG PROFESSIONAL® service and BLOOMBERG Data (the “Services”) are owned and
distributed by Bloomberg Finance L.P. (“BFLP”) in all jurisdictions other than Argentina, Bermuda, China, India,
Japan, and Korea (the “BLP Countries”). BFLP is a wholly owned subsidiary of Bloomberg L.P. (“BLP”). BLP
provides BFLP with global marketing and operational support and service for the Services and distributes the
Services either directly or through a non-BFLP subsidiary in the BLP Countries. Certain functionalities distributed
via the Services are available only to sophisticated institutional investors and only where the necessary legal
clearance has been obtained. BFLP, BLP and their affiliates do not guarantee the accuracy of prices or information
in the Services. Nothing in the Services shall constitute or be construed as an offering of financial instruments by
BFLP, BLP or their affiliates, or as investment advice or recommendations by BFLP, BLP or their affiliates of an
investment strategy or whether or not to “buy”, “sell” or “hold” an investment. Information available via the
Services should not be considered as information sufficient upon which to base an investment decision.
BLOOMBERG, BLOOMBERG PROFESSIONAL, BLOOMBERG MARKETS, BLOOMBERG NEWS,
BLOOMBERG ANYWHERE, BLOOMBERG TRADEBOOK, BLOOMBERG TELEVISION, BLOOMBERG
RADIO, BLOOMBERG PRESS and BLOOMBERG.COM are trademarks and service marks of BFLP, a Delaware
limited partnership, or its subsidiaries. © 2016 Bloomberg Finance L.P. All rights reserved. This document and its
contents may not be forwarded or redistributed without the prior consent of Bloomberg.
Bloomberg Intelligence is a service provided by Bloomberg Finance L.P. and its affiliates. Bloomberg Intelligence
shall not constitute, nor be construed as, investment advice or investment recommendations (i.e., recommendations
as to whether or not to “buy”, “sell”, “hold”, or to enter or not to enter into any other transaction involving any
specific interest) or a recommendation as to an investment or other strategy. No aspect of the Bloomberg
Intelligence function is based on the consideration of a customer's individual circumstances. Bloomberg Intelligence
should not be considered as information sufficient upon which to base an investment decision. You should
determine on your own whether you agree with Bloomberg Intelligence.
Bloomberg Intelligence is offered where the necessary legal clearances have been obtained. Bloomberg Intelligence
should not be construed as tax or accounting advice or as a service designed to facilitate any Bloomberg Intelligence
subscriber's compliance with its tax, accounting, or other legal obligations. Employees involved in Bloomberg
Intelligence may hold positions in the securities analyzed or discussed on Bloomberg Intelligence.
30