avoiding load shedding - ameu 2015 presentation… · avoiding load shedding using a “virtual”...
TRANSCRIPT

Avoiding Load Shedding using a “Virtual” Power Station
Avoid stage 1 and 2 load shedding through customer participation

Source: Business Tech, http://businesstech.co.za/news/general/87266/load-shedding-to-last-3-more-years/
South Africa can expect three more years of load shedding.
MINISTER OF PUBLIC ENTERPRISES, LYNNE BROWN 4 MAY 2015
Load shedding would not be necessary
if an additional 3 000 MW could be fed to the national grid.
ESKOM CEO, BRIAN MOLEFE
Source: Eye Witness News, http://ewn.co.za/2015/04/22/Load-shedding-could-be-over-by-the-end-of-the-year

Demand vs Supply and the Virtual Power Station
SUPPLY SIDEDEMAND SIDE
Unit 2
Unit 1
Generation
MW
Demand – Load
MW
Negawatt Generator
MW
Unit 1
Generation
MW
Demand – Load
MW

Typical Eskom Reserve Deployment Order IN
CR
EA
SIN
G T
IGH
TN
ES
S O
F S
UP
PLY
Curtailment (Stage 0)
Stage 4
Load Shedding and Curtailment (Stage 3)
Load Shedding and Curtailment (Stages 1 & 2) EM
ERG
ENC
Y
RED
UC
TIO
N
NR
S 0
48
-9
Demand Response – Supplemental DMP
RES
ERV
E M
AR
KET
Automatic Gen Control (AGC)
Demand Response – Instantaneous DMP O
per
atin
g
Demand Response – Customer Generation (high rate)
Open Cycle Gas Turbines
Pre
-Em
erge
ncy
Interruptible Load Agreements 2
Interruptible Load Agreements 1
Demand Response – Customer Self Generation
Source: Eskom IDM

NRS 048-9
To assist with managing demand, Eskom calls upon municipalities and large industry to reduce load during emergency periods, according to a defined set of rules.
Intended to support legislative and regulatory requirements when defining the roles of the various stakeholders. It is essentially a national code of practice for emergency load reduction and load restoration.
Demand > Supply especially during high
demand periods
ELECTRICITY in SA
Emergency Conditions Declared

Load Curtailment under Emergency Conditions
Load Shedding avoided through 10% to 20% load reduction

VPS Components
Inclusion of all sectors in the VPS mix

• SMS
• E-mails
• VOIP telephone system
• Web services messages
• GPRS
• Direct Radio/Electronic signals
• Social media etc.
VPS COMMUNICATIONS / TECHNOLOGY
• Smart Meter system interfacing
• Load Management including Ripple Control
• Customer Control Units
• SCADA Systems etc.
COMMUNICATIONS SUPPORT TECHNOLOGY
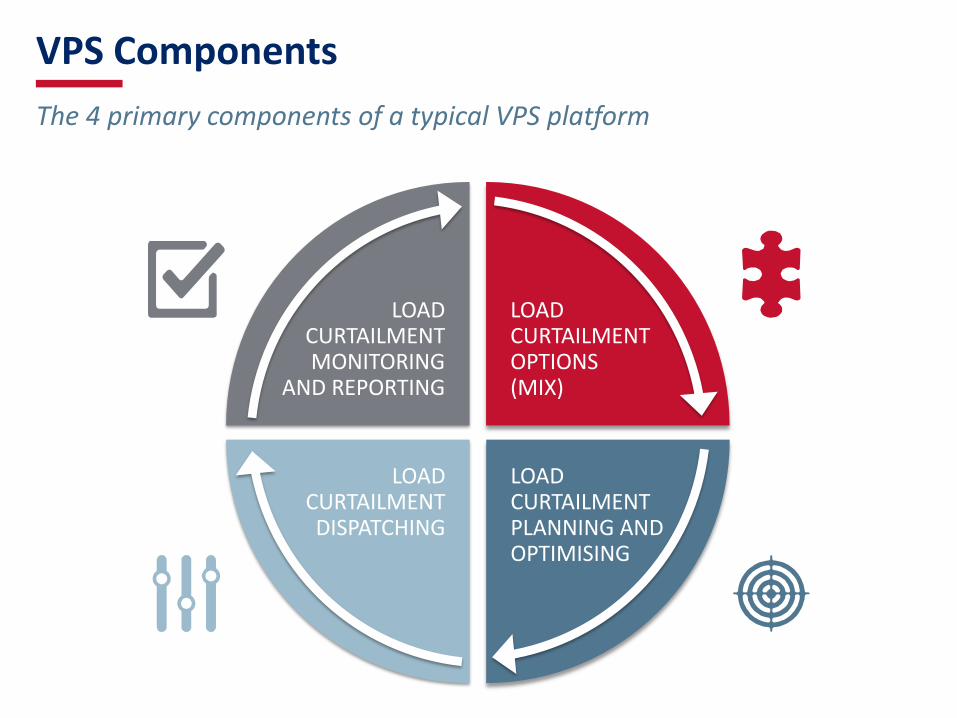
LOAD CURTAILMENT MONITORING
AND REPORTING
LOAD CURTAILMENT OPTIONS (MIX)
VPS Components
The 4 primary components of a typical VPS platform
LOAD CURTAILMENT DISPATCHING
LOAD CURTAILMENT PLANNING AND OPTIMISING

The VPS Approach
Municipal VPS Demand Response Operations Desk
Load Curtailment Customer #N Load Curtailment
Customer #1
Load Curtailment Customer #2
National System Operator
2
2
2
1
3 The VPS Operations team collects the metering data and measures and reports on the customers load curtailment.
2 The VPS Operations team dispatches the load curtailment customers for the emergency by SMS, e-mail or automatically if the technology is available.
1 The System Operator informs the Municipal Operations Desk of the emergency.
The VPS Operations Desk makes load curtailment easy to manage.

Example Customer Load Curtailment Report
Date Report: 2015/09/30
Report Start Date: 2015/09/01 Performance Report Version: V0001
Report End Date: 2015/09/30 VPS Reference: VDS0000014/Example
DATE OF EVENTSTART TIME OF
EVENT
STOP TIME OF
EVENT
ASSISTANCE
REQUESTED (MW)
PERFORMANCE
MARGIN
TOTAL ENERGY
SHED (MWh)
TOTAL LOAD
REDUCTION (MW)
PERFORMANCE
PERCENTAGEPERFORMANCE RATING
2015/09/01 17:00 20:00 30.0 90% 62.236 20.745 69.15% BELOW TARGET
2015/09/05 17:00 20:00 30.0 90% 82.489 27.496 91.65% ON TARGET
2015/09/10 15:00 17:00 15.0 90% 25.163 12.582 83.88% BELOW TARGET
2015/09/11 15:00 17:00 15.0 90% 25.163 12.582 83.88% BELOW TARGET
2015/09/12 19:00 22:00 30.0 90% 24.189 8.053 26.84% BELOW TARGET
2015/09/14 19:00 22:00 30.0 90% 24.189 8.053 26.84% BELOW TARGET
2015/09/16 17:00 20:00 15.0 90% 16.562 5.521 36.81% BELOW TARGET
2015/09/18 17:00 20:00 15.0 90% 21.125 7.042 46.95% BELOW TARGET
2015/09/19 17:00 20:00 30.0 90% 94.153 31.388 104.63% ON TARGET
2015/09/22 18:00 21:00 30.0 90% 72.878 24.293 80.98% BELOW TARGET
2015/09/24 15:00 17:00 15.0 90% 2.569 1.285 8.57% BELOW TARGET
2015/09/27 17:00 20:00 30.0 90% 67.569 33.785 112.62% ON TARGET
2015/09/28 15:00 17:00 15.0 90% 25.163 12.582 83.88% BELOW TARGET
2015/09/29 19:00 22:00 30.0 90% 24.189 8.063 26.88% BELOW TARGET
TOTALS 606.667 59.08%
NOTES:
1) Please refer to the individual event performance reports for further information.
VPS CONTACT DETAILS:
Contact Person 1 Contact Person 2
Telephone: 000 000 0000 Telephone: 000 000 0000
Cell: 9 999 999 999 Cell: 9 999 999 999
VPS DR Performance ReportLOAD CURTAILMENT
Customer Name
Logo

Baselines may be temperature sensitive
ACTUAL LOAD SCALED CBL LOAD
Scaled CBL is recommended

• Load Shedding is likely to continue for at least another 3 years
• Adopting a curtailment strategy based on NRS 048-9 can avoid stage 1 and stage 2 load shedding
• Customer participation can achieve 10% to 20% load reduction
• A Virtual Power Station (Demand Response) approach enables effective management of the curtailment program
Conclusion

Thank you.