august 2016 hero motocorp - business...
TRANSCRIPT

8 August 2016
1QFY17 Results Update | Sector: Automobiles
Hero MotoCorp
BSE SENSEX S&P CNX CMP: INR3,457 TP: INR3,666 (+6%) Downgrade to Neutral 28,183 8,711
Bloomberg HMCL IN Equity Shares (m) 199.7 M.Cap.(INRb)/(USDb) 690.3 / 10.3
52-Week Range (INR) 3,554/2,259 1, 6, 12 Rel. Per (%) 5/17/30 Avg Val, INRm/ Vol m 1101 Free float (%) 65.4
Financials & Valuations (INR b) Y/E Mar 2016 2017E 2018E Net Sales 284.4 314.6 360.0 EBITDA 44.6 51.3 59.4 PAT 31.6 36.6 42.9 EPS (INR) 158.3 183.0 214.7 Gr. (%) 26.6 15.6 17.3 BV/Sh (INR) 397.8 484.5 590.7 RoE (%) 43.6 41.5 39.9 RoCE (%) 42.9 40.5 39.1 P/E (x) 21.8 18.9 16.1 P/BV (x) 8.7 7.1 5.9
Estimate change
TP change Rating change
EBITDA margin in line at 16.6%, hits six-year high; Downgrading to Neutral given rich valuations Volume growth drives revenues; adverse mix drags realizations: Hero
MotoCorp’s (HMCL) net revenues grew 7% YoY to INR73.9b (est. of INR77.8b) due to strong volume growth of ~6% YoY (+1.4% QoQ). Realizations declined 3% QoQ (+1% YoY), impacted by adverse mix and lower spares sales of ~INR42.4k (est. of ~INR44.6k). EBITDA margins increased 70bp QoQ (+150bp YoY) to 16.6% (est. of 16.3%), led by lower marketing spend. Adj. PAT rose 18% YoY to INR8.8b (est. of ~INR9.1b).
Earnings call highlights: a) HMCL expects double-digit growth in 2QFY17 and high-single-digit growth in 2HFY17. b) Medium-term EBITDA margins guided at 14-16% (v/s 14-15% earlier). c) Gujarat plant expected to be commissioned in Sept-16 (v/s July-16 earlier). d) According to management, GST rate lower than 23-24% would be beneficial to the mass market segment. e) CBS/ABS to be mandatory from Apr-18 (Apr-17 for new products), which will result in cost increase of up to INR4,000/unit for motorcycles. Scooters would have relatively low impact as they already have CBS technology.
Valuation and view: Despite factoring in strong volume growth (8.5%/11.5% in FY17/18), stable EBITDA margins (at 16.5% for FY18E) and resultant strong EPS growth (~18% in FY18E), valuations at ~18.9x/16.1x FY17/18E appear fairly valued considering loss of excise benefit from FY19. We downgrade the stock to Neutral from Buy with a target price of INR3,666 (18x FY18E EPS adjusted for loss of excise benefit— at ~15% premium to LPA).
Quarterly Performance (Consolidated) (INR Million) Y/E March FY16 FY17 FY16 FY17E Var. 1Q 2Q 3Q 4Q 1Q 2Q 3Q 4Q 1Q (%) Total Volumes ('000 nos) 1,646 1,575 1,690 1,722 1,745 1,752 1,820 1,882 6,632 7,199 1,745 0.0 Growth YoY (%) -4.1 -7.0 2.5 9.3 6.1 11.3 7.7 9.3 0.0 8.5 6.1 Net Realization 41,960 43,414 43,159 43,595
42,391 43,895 44,391 44,085 42,886 43,706 44,551 -4.8
Growth YoY (%) 2.3 6.3 4.0 1.1 1.0 1.1 2.9 1.1 3.1 1.9 5.4 Net Op Revenues 69,048 68,371 72,948 75,052
73,989 76,910 80,792 82,948 284,427 314,639 77,758 -4.8
Change (%) -1.9 -1.1 6.7 10.5 7.2 12.5 10.8 10.5 3.1 10.6 11.8 RM Cost (% sales) 69.7 68.2 66.9 66.0
67.1 67.5 66.8 66.7 67.9 67.0 67.6 -50bp
Staff Cost (% sales) 4.5 4.5 4.7 4.7
4.5 4.5 4.8 4.9 4.6 4.7 4.4 10bp Other Exp (% sales) 10.7 11.4 12.7 13.4 11.7 11.4 12.5 12.3 11.8 12.0 11.7 0bp
EBITDA 10,420 10,834 11,399 11,919
12,301 12,742 12,889 13,376 44,603 51,308 12,659 -2.8 EBITDA Margins (%) 15.1 15.8 15.6 15.9 16.6 16.6 16.0 16.1 15.7 16.3 16.3 30bp
Other Income 1,044 1,026 842 1,168
1,204 1,200 1,150 1,196 4,229 4,750 1,050 14.6 Interest 12 5 6 12
15 5 6 4 49 30 6 150.0
Depreciation 1,030 1,091 1,139 1,155 1,152 1,200 1,400 1,401 4,414 5,153 1,160 -0.7 PBT 10,422 10,764 11,096 11,920
12,337 12,737 12,633 13,167 44,369 50,875 12,543 -1.6
Effective Tax Rate (%) 28.3 28.3 28.3 30.0 28.4 28.0 28.0 28.2 28.7 28.1 27.4 100bp Adj. PAT 7,475 7,721 7,958 8,347
8,831 9,171 9,096 9,457 31,615 36,555 9,104 -3.0
Growth (%) 32.8 1.1 36.5 32.2 18.1 18.8 14.3 13.3 24.4 15.6 21.3 -320bp
E: MOSL Estimates
Investors are advised to refer through important disclosures made at the last page of the Research Report. Motilal Oswal research is available on www.motilaloswal.com/Institutional-Equities, Bloomberg, Thomson Reuters, Factset and S&P Capital.
Jinesh Gandhi ([email protected]); +91 22 3982 5416 Venil Shah ([email protected]); +91 22 3982 5445 /Aditya Vora ([email protected]); +91 22 3078 4701
Motilal Oswal values your support in the Asiamoney Brokers Poll 2016 for
India Research, Sales and Trading team. We request your ballot.

Hero MotoCorp
8 August 2016 2
Higher sales volumes drive revenue growth; Realizations lend marginal support Strong volume growth of ~6% YoY (+1.4% QoQ), was driven by new launches in
the scooter segment. Besides motorcycle segment (~88% of total 2W volumes)too supported with a 3.4% YoY growth (+6% QoQ), while scooter sale volumesaccelerated by 30% YoY(-22% QoQ). Push in scooter volumes mainly came fromincremental sales of Duet in 1QFY17 (~97,000 units).
HMCL lost domestic 2W market share by 220bp QoQ (-270bp YoY) to 37.6% in1QFY17, pulled down by the scooter segment. Loss of 4.4pp respectively, inscooters as well as its stronghold executive segment led to erosion of domesticmarket share. Weak sales of Maestro QoQ led to fall in market share in thescooter segment. Besides, stiff competition led to decline in market share in theexecutive (-440bp) and economy segment (-370bp).
Realizations declined 3% (+1% YoY) impacted due to adverse mix and lowerspare sales to ~INR 42.4k (v/s est ~INR44.6k).
As a result, net revenues grew by 7% YoY to INR73.9b (est INR77.8b).
Exhibit 1: Overall growth driven by incremental scooter volumes
1,64
2 1,33
3 1,
573
1,52
7 1,
559
1,41
6 1,
681
1,58
9 1,
715
1,69
3 1,
649
1,57
6 1,
646
1,57
5 1,
690
1,72
2 1,
745
7.4
-13.7
-1.0 -2.8 -5.1 6.3
6.9 4.1 10.0
19.5
-1.9 -0.9 -4.1 -7.0
2.5 9.3 6.1
1Q 2Q 3Q 4Q 1Q 2Q 3Q 4Q 1Q 2Q 3Q 4Q 1Q 2Q 3Q 4Q 1Q
FY13 FY14 FY15 FY16 FY17
Volumes ('000 units) Growth (%)
Source: Company, MOSL
Exhibit 2: Realizations growth driven by price hikes and product mix
38,
040
38,
921
39,
333
40,
238
39,
502
40,
433
40,
910
40,
976
41,
028
40,
858
41,
486
43,
122
41,
960
43,
414
43,
159
43,
595
42,
391
1Q 2Q 3Q 4Q 1Q 2Q 3Q 4Q 1Q 2Q 3Q 4Q 1Q 2Q 3Q 4Q 1Q
FY13 FY14 FY15 FY16 FY17
Source: Company, MOSL
Exhibit 3: Trend in Segment Mix ('000 units) 1QFY17 1QFY16 YoY % 4QFY16 QoQ % FY16 FY15 YoY %
Total Motorcycles 1,527 1,477 3.4 1,441 6.0 5,736 5,800 -1.1% of total 87.5 89.7 83.7 86.5 87.5
Scooters 219 169 29.6 281 -22.0 896 832 7.7 % of total 12.5 10.3 16.3 13.5 12.5
Total 2Ws 1,745 1,646 6.0 1,721 1.4 6,632 6,632 0.0 Of which exports 39 45 (14) 54 -28.4 210 200 5
% of total 2.2 2.8 3.2 2.8 3.0 2.2 Source: Company, MOSL

Hero MotoCorp
8 August 2016 3
Exhibit 4: Share of Executive segment picks up as rural economy revives; Scooters decline as competition heats up
20 17 17 18 18 15 18 16 18 18 17 17 18 18 20 20
57 56 56 57 52 59 56 56 57 58 60 61 58 54 52 53
12 13 12 11 14 13 13 14 13 10 9 11 12 10 11 13 10 10 11 11 12 11 12 11 10 12 13 9 10 15 16 12
2QFY
13
3QFY
13
4QFY
13
1QFY
14
2QFY
14
3QFY
14
4QFY
14
1QFY
15
2QFY
15
3QFY
15
4QFY
15
1QFY
16
2QFY
16
3QFY
16
4QFY
16
1QFY
17
Economy Executive 100 Executive 125 Premium Scooters
Source: Company, MOSL
Exhibit 5: Scooters and Executive segments pull down domestic market share Segment 1QFY17 1QFY16 Chg YoY (BP) 4QFY16 Chg QoQ (BP) Economy 51.4 43.8 760 55.1 -370Executive - 100 81.3 86.3 -500 85.7 -440Executive - 125 45.6 38.5 710 43.9 170 Premium 3.3 4.9 -160 3.5 -20Dom. Motorcycles 50.6 53.5 -290 52.5 -180Dom. Scooters 15.4 13.8 160 19.8 -440Total 2W (Domestic) 37.6 40.3 -270 39.8 -220
Source: Company, MOSL
Lower other expenses, drive EBITDA margins to 16.6% Gross margins contracted 110bp QoQ (+260bp YoY) to 33% due to commodity
costs hardened QoQ (steel and aluminum) and adverse product mix. EBITDA at INR12.3b (v/s est. INR 12.6b) was up ~18% YoY (+3% QoQ). EBITDA margins came in at 16.6% (v/s est 16.3%), an increase of 70bp QoQ
(+150bp YoY) as other expenses declined 170bp on account of lower marketingspends. Besides higher RM costs QoQ (+110bp) limited upside in margins.
Higher depreciation and tax restricted adj PAT to INR8.8b (v/s est ~INR9.1b)increase of 18% YoY.
Exhibit 6: Lower other expenses boosts EBITDA margins
7,13
2
6,00
7
6,85
0
6,82
9
7,46
2
9,34
8
8,21
8
8,38
4
10,4
20
10,8
34
11,3
99
11,9
19
12,3
01
11.6 10.5 10.0 10.5 10.6 13.5
12.0 12.3 15.1 15.8 15.6 15.9 16.6
1Q 2Q 3Q 4Q 1Q 2Q 3Q 4Q 1Q 2Q 3Q 4Q 1Q
FY14 FY15 FY16 FY17
EBITDA (INR m) EBITDA Margins (%)
Source: Company, MOSL
Exhibit 7: EBITDA/unit improves by 18%
4,57
4
4,24
2
4,07
5
4,29
6
4,35
1
5,52
3
4,98
5
5,32
1
6,33
2
6,87
9
6,74
4
6,92
3 7,04
8
1Q 2Q 3Q 4Q 1Q 2Q 3Q 4Q 1Q 2Q 3Q 4Q 1Q
FY14 FY15 FY16 FY17
EBITDA (INR/unit)
Source: Company, MOSL

Hero MotoCorp
8 August 2016 4
Key takeaways from management interaction Outlook positive for 2HFY17: It expects double digit growth in 2QFY17 and
higher single digit growth in 2HFY17.Urban market is performing better atpresent but trend is likely to shift to rural growth during 2HFY17
Retails growth of ~6% was tad lower than dispatches. Rural growth was ~7%YTD. Sales in Northern and Central India were slightly weaker due to a weakmarriage season. Scooter retails stood at ~70k units, which was steady since thepast 4-5 months.
EBITDA margin guidance: Management has guided EBITDA margins to be in therange of 14-16% (v/s 14-15% earlier).
Commodity costs increased QoQ due to steel and aluminum price increase andmix impact. The management expects to see marginal cost pressure goingforward.
Gujarat Plant is expected to be commissioned in Sept-16 (v/s earliercommissioning date of July-16)
Price increase in the range of INR 200-675 to taken from 6 May 2016 on all themodels. No price increases taken post that.
HMCL’s dealer inventory stood at 4-4.5 weeks in July-16, with 1-1.5 weeks ofinventory in transit.
LEAP Cost Cutting Program has delivered savings of ~INR450m in 1QFY17. Haridwar plant contributed ~36% of total volumes in 1QFY17. Proportion of First time buyers was ~65% at present. Exports: Reviewing exports target of ~10% of volumes by FY20, as headwinds
are very strong in key target markets. Ongoing currency turmoil in countries likeNigeria, Argentina, Mexico etc has delayed HMCL’s export plans. Its plans toenter Argentina and Ghana in the next quarter and Mexico in 4QFY17.Depsiteweak environment, it has set a target of 300,000 units for FY17.
Capex: It is planning for capex of ~INR8-9b in FY17. Hero FinCorp (financing arm where it has ~48.5% stake) is the largest financier
of HMCL 2Ws. Average monthly run rate of 35-40k units/ month of financingdone by the company.
CBS/ABS to be mandatory from Apr-18(Apr-17 for new products). It estimatesan impact of ~INR4000/unit. Scooters are likely to have a relatively lower impactas most scooters already have CBS technology. This would in turn boostsccoterization in the future.
IND AS: Trade discounts given to dealers are netted from revenues as againstthe earlier practice of accounting in other expenses.
GST impact: As per the management, any GST rate lower than 23-24% would bebeneficial to the mass market segment.
Valuation and view Industry growth to rebound with pick up in 2HFY17: Domestic 2W industry is
expected to witness recovery in FY17 on assumption of a normal monsoon.2HFY17 is likely to be driven by rural growth. With ~ 50% of sales coming fromrural markets, we believe Hero is likely to benefit with strong brand equity in theeconomy and executive 100 and 125 segments along with increasing share inthe scooter segment.

Hero MotoCorp
8 August 2016 5
Cost cutting potential high, rising raw material costs possible hinderance:HMCL’s cost cutting initiative under project ‘Leap 20’ is focused at drivingsignificant improvements in cost structure, with simultaneous improvement inproduct quality and reliability. The management is targeting ~90bp savings inFY17, with further scope to save cost. However rising raw material costs couldhold further margin expansion. We estimate margins to remain stable at ~15.7%in FY18E.
Export market to offer huge headroom for growth, but scale-up would bechallenge: HMCL plans to double its target export markets from currently 20 to40 countries over next few years. While motorcycle exports to emerging marketis a huge opportunity (~2x of India market), HMCL being one of the last entrantcould find it difficult to compete against incumbents (especially Bajaj Auto) dueto limited scope to differently position its product. This coupled with turmoil incurrencies of these markets would make entry and ramp-up even more difficult.
Valuations fair, downgrade to Neutral: Despite factoring in for strong volumegrowth (8.5%/11.5% in FY17/18), stable EBITDA margins (at 16.5% for FY18E),and resultant strong EPS growth (~18% in FY18E), valuations at ~18.9x/16.1xFY17/18E appear fairly valued considering loss of excise benefit from FY19. Wedowngrade the stock to Neutral from Buy with a target price of INR3,666 (18xFY18E EPS adjusted for loss of excise benefit— at ~15% premium to LPA).
Exhibit 8: Valuations trading at historical average, reflecting improving fundamentals
Source: MOSL Source: MOSL
Exhibit 9: Comparative Valuation CMP Rating TP P/E (x) EV/EBITDA (x) RoE (%) RoCE (%)
Auto OEM's (INR)* (INR) FY17E FY18E FY17E FY18E FY17E FY18E FY17E FY18E Bajaj Auto 2,873 Buy 2,944 20.1 16.4 14.0 11.5 31.2 33.0 30.4 32.2 Hero MotoCorp 3,457 Neutral 3,666 18.9 16.1 12.3 10.4 41.5 39.9 40.5 39.1 TVS Motor 304 Buy 323 24.8 18.9 15.0 11.7 27.1 28.7 28.0 30.2 M&M 1,497 Buy 1,724 20.5 15.7 16.1 13.2 15.6 17.8 13.0 15.1 Maruti Suzuki 4,992 Buy 5,509 22.7 18.1 13.2 11.0 20.3 21.6 27.6 28.9 Tata Motors 514 Buy 558 14.0 9.1 4.5 3.6 14.5 19.2 12.2 14.2 Ashok Leyland 89 Buy 118 13.7 10.5 7.6 6.0 29.8 31.0 21.9 25.2 Eicher Motors 22,441 Buy 27,244 36.2 26.7 29.0 23.6 40.9 40.1 26.1 27.9 Auto Ancillaries Bharat Forge 826 Buy 921 30.1 22.4 15.1 12.3 16.9 20.0 11.6 14.5 Exide Industries 174 Buy 205 19.5 16.9 12.3 10.7 15.3 15.5 15.8 16.2 Amara Raja Batteries 928 Buy 1,032 25.8 21.1 15.6 13.1 26.0 25.6 24.7 24.6 BOSCH 25,430 Buy 24,766 46.2 36.2 31.6 26.6 19.3 21.2 27.6 28.2
# Nos. are on CY basis Source: Company, MOSL
16.6
14.0
17.2
15.5
0
10
20
30
Jul-0
1
Sep-
02
Nov
-03
Jan-
05
Mar
-06
May
-07
Jun-
08
Aug-
09
Oct
-10
Dec
-11
Jan-
13
Mar
-14
May
-15
Jul-1
6
P/E (x) 15 Yrs Avg(x)5 Yrs Avg(x) 10 Yrs Avg(x)
6.2
6.5
6.96.9
0.0
4.0
8.0
12.0
16.0
Jul-0
1
Sep-
02
Nov
-03
Jan-
05
Mar
-06
May
-07
Jun-
08
Aug-
09
Oct
-10
Dec
-11
Jan-
13
Mar
-14
May
-15
Jul-1
6
P/B (x) 15 Yrs Avg(x)5 Yrs Avg(x) 10 Yrs Avg(x)

Hero MotoCorp
8 August 2016 6
Story in charts: EPS CAGR of ~16% over FY16-18E
Exhibit 10: Adding capacity ahead of growth
4,73
0
5,50
0
6,25
0
6,30
0
6,50
0
7,55
0
7,70
0
8,45
0
8,45
0
97 98 100 96 96
88 86 85
95
FY10 FY11 FY12 FY13 FY14 FY15 FY16 FY17E FY18E
Capacity ('000 units) Cap. Utilization (%)
Source: Company, MOSL
Exhibit 11: Recovery in volumes driven by scooters and rural recovery
4,60
0
5,40
2
6,23
5
6,07
6
6,24
6
6,63
2
6,63
2
7,19
9
8,03
1
23.6
17.4 15.4
-2.6 2.8 6.2
0.0
8.5 11.6
FY10 FY11 FY12 FY13 FY14 FY15 FY16 FY17E FY18E
Volumes ('000 units) Volume growth (%)
Source: Company, MOSL
Exhibit 12: EBITDA margins to remain steady
26.6 26.1 36.2 32.8 35.4 35.4 44.6 51.3 59.4
16.9
12.5 11.8 10.2 10.6
12.1
15.7 16.3 16.5
FY10
FY11
FY12
FY13
FY14
FY15
FY16
FY17
E
FY18
E
EBITDA (INR b) EBITDA Margin (%)
Source: Company, MOSL
Exhibit 13: PAT to rise on robust growth
20
24
21
21
25
32
37
43
-10.8
19.4
-10.9
-0.4
18.4 26.6 15.6 17.3
FY11 FY12 FY13 FY14 FY15 FY16 FY17E FY18E
PAT (INR b) Growth (%)
Source: Company, MOSL
Exhibit 14: Return ratios to remain healthy…
41.4
36.5
38.3 41.1 42.9 40.5 39.1
65.6 45.6 39.8 41.1 43.6 41.5 39.9
FY12 FY13 FY14 FY15 FY16 FY17E FY18E
RoCE (%) RoE (%)
Source: Company, MOSL
Exhibit 15: …as cash levels rise further
23 35 42 33 44 57 73
37
64 74
50 54 58 61
FY12
FY13
FY14
FY15
FY16
FY17
E
FY18
ENet Cash (INR b) Net Cash (% of Cap Emp)
Source: Company, MOSL

Hero MotoCorp
8 August 2016 7
Exhibit 16: Snapshot of Revenue Model 000 units FY11 FY12 FY13 FY14 FY15 FY16E FY17E FY18E Total M/Cycles 5,041 5,780 5,501 5,538 5,800 5,736 6,079 6,742
Growth (%) 14.9 14.7 -4.8 0.7 4.7 -1.1 6.0 10.9 % of total volumes 93.3 92.7 90.5 88.7 87.5 86.5 84.4 84.0
Total Scooters 361 456 574 708 832 896 1,120 1,288 Growth (%) 68.7 26.0 26.1 23.2 1758.1 772.7 25.0 15.0 % of total volumes 6.7 7.3 9.5 11.3 12.5 13.5 15.6 16.0
Total volumes 5,402 6,235 6,076 6,246 6,632 6,632 7,199 8,031 Growth (%) 17.4 15.4 -2.6 2.8 6.2 0.0 8.5 11.6
- of which Exports 0 0 0 113 120 133 139 209 % of total volumes 0.0 0.0 0.0 2.0 2.0 2.2 2.1 2.9
Avg. Net Realn (INR/unit) 35,624 37,478 38,816 40,226 41,242 42,220 43,081 43,988 Growth (%) 4.0 5.2 3.6 3.6 2.5 2.4 2.0 2.1
Net Revenues (INR b) 192 234 236 251 274 280 310 353 Growth (%) 22.1 21.4 0.9 6.5 8.9 2.4 10.8 13.9
Source: Company, MOSL
Hero MotoCorp
8 August 2016 8
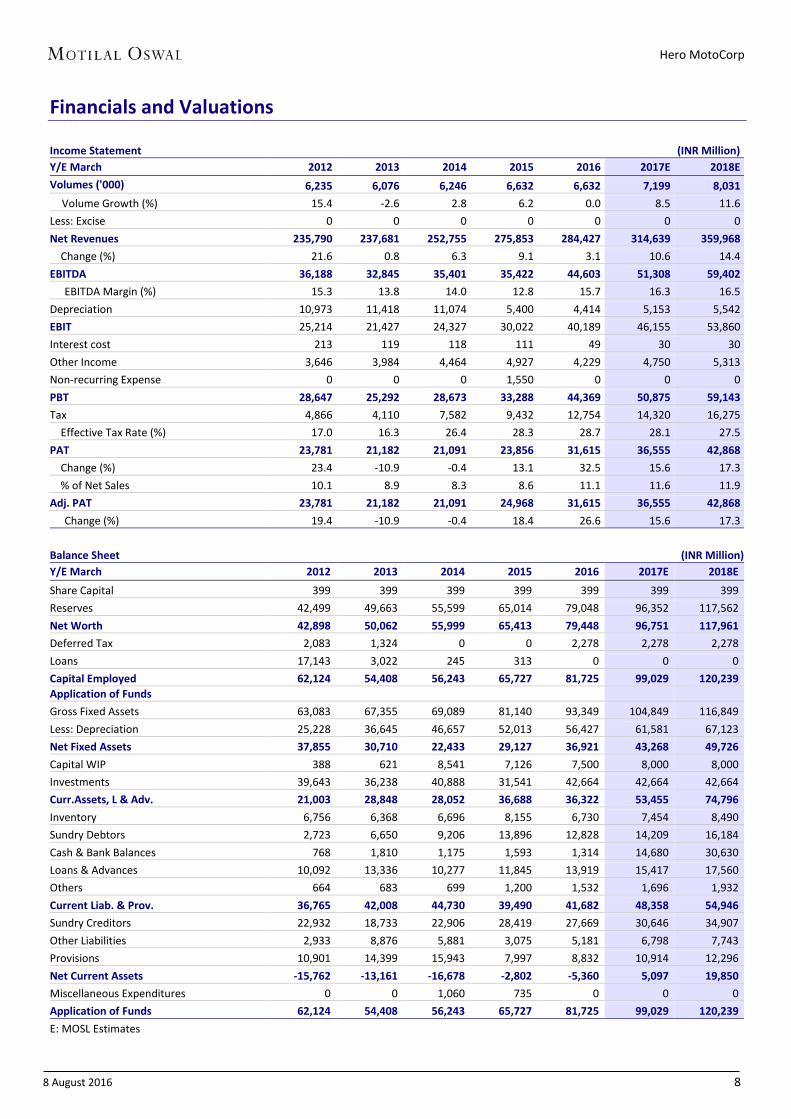
Financials and Valuations
Income Statement (INR Million) Y/E March 2012 2013 2014 2015 2016 2017E 2018E Volumes ('000) 6,235 6,076 6,246 6,632 6,632 7,199 8,031
Volume Growth (%) 15.4 -2.6 2.8 6.2 0.0 8.5 11.6 Less: Excise 0 0 0 0 0 0 0 Net Revenues 235,790 237,681 252,755 275,853 284,427 314,639 359,968 Change (%) 21.6 0.8 6.3 9.1 3.1 10.6 14.4 EBITDA 36,188 32,845 35,401 35,422 44,603 51,308 59,402
EBITDA Margin (%) 15.3 13.8 14.0 12.8 15.7 16.3 16.5 Depreciation 10,973 11,418 11,074 5,400 4,414 5,153 5,542 EBIT 25,214 21,427 24,327 30,022 40,189 46,155 53,860 Interest cost 213 119 118 111 49 30 30 Other Income 3,646 3,984 4,464 4,927 4,229 4,750 5,313 Non-recurring Expense 0 0 0 1,550 0 0 0 PBT 28,647 25,292 28,673 33,288 44,369 50,875 59,143 Tax 4,866 4,110 7,582 9,432 12,754 14,320 16,275 Effective Tax Rate (%) 17.0 16.3 26.4 28.3 28.7 28.1 27.5 PAT 23,781 21,182 21,091 23,856 31,615 36,555 42,868 Change (%) 23.4 -10.9 -0.4 13.1 32.5 15.6 17.3 % of Net Sales 10.1 8.9 8.3 8.6 11.1 11.6 11.9 Adj. PAT 23,781 21,182 21,091 24,968 31,615 36,555 42,868
Change (%) 19.4 -10.9 -0.4 18.4 26.6 15.6 17.3
Balance Sheet (INR Million) Y/E March 2012 2013 2014 2015 2016 2017E 2018E Share Capital 399 399 399 399 399 399 399 Reserves 42,499 49,663 55,599 65,014 79,048 96,352 117,562 Net Worth 42,898 50,062 55,999 65,413 79,448 96,751 117,961 Deferred Tax 2,083 1,324 0 0 2,278 2,278 2,278 Loans 17,143 3,022 245 313 0 0 0 Capital Employed 62,124 54,408 56,243 65,727 81,725 99,029 120,239 Application of Funds Gross Fixed Assets 63,083 67,355 69,089 81,140 93,349 104,849 116,849 Less: Depreciation 25,228 36,645 46,657 52,013 56,427 61,581 67,123 Net Fixed Assets 37,855 30,710 22,433 29,127 36,921 43,268 49,726 Capital WIP 388 621 8,541 7,126 7,500 8,000 8,000 Investments 39,643 36,238 40,888 31,541 42,664 42,664 42,664 Curr.Assets, L & Adv. 21,003 28,848 28,052 36,688 36,322 53,455 74,796 Inventory 6,756 6,368 6,696 8,155 6,730 7,454 8,490 Sundry Debtors 2,723 6,650 9,206 13,896 12,828 14,209 16,184 Cash & Bank Balances 768 1,810 1,175 1,593 1,314 14,680 30,630 Loans & Advances 10,092 13,336 10,277 11,845 13,919 15,417 17,560 Others 664 683 699 1,200 1,532 1,696 1,932 Current Liab. & Prov. 36,765 42,008 44,730 39,490 41,682 48,358 54,946 Sundry Creditors 22,932 18,733 22,906 28,419 27,669 30,646 34,907 Other Liabilities 2,933 8,876 5,881 3,075 5,181 6,798 7,743 Provisions 10,901 14,399 15,943 7,997 8,832 10,914 12,296 Net Current Assets -15,762 -13,161 -16,678 -2,802 -5,360 5,097 19,850 Miscellaneous Expenditures 0 0 1,060 735 0 0 0 Application of Funds 62,124 54,408 56,243 65,727 81,725 99,029 120,239 E: MOSL Estimates

Hero MotoCorp
8 August 2016 9
Financials and Valuations
Ratios Y/E March 2012 2013 2014 2015 2016 2017E 2018E Basic (INR) EPS 119.1 106.1 105.6 125.0 158.3 183.0 214.7 EPS Growth (%) 19.4 -10.9 -0.4 18.4 26.6 15.6 17.3 Cash EPS 132.0 120.2 118.1 146.5 180.4 208.9 242.4 Book Value per Share 214.8 250.7 280.4 327.6 397.8 484.5 590.7 DPS 45.0 60.0 65.0 60.0 72.0 80.0 90.0 Payout (Incl. Div. Tax) % 43.5 65.1 70.8 57.8 52.3 50.3 48.2
Valuation (x) P/E 27.6 21.8 18.9 16.1 EV/EBITDA 18.6 14.5 12.3 10.4 EV/Sales 2.4 2.3 2.0 1.7 Price to Book Value 10.6 8.7 7.1 5.9 Dividend Yield (%) 1.7 2.1 2.3 2.6 Profitability Ratios (%) RoE 65.6 45.6 39.8 41.1 43.6 41.5 39.9 RoCE 41.4 36.5 38.3 41.1 42.9 40.5 39.1 RoIC 187.2 96.8 167.4 138.3 102.8 103.7 107.5 Turnover Ratios Debtors (Days) 4 11 14 19 17 17 17 Inventory (Days) 11 10 10 11 9 9 9 Creditors (Days) 35 29 33 38 36 36 35 Working Capital (Days) -24 -20 -24 -4 -7 6 20 Asset Turnover (x) 3.8 4.4 4.5 4.2 3.5 3.2 3.0 Fixed Asset Turnover 4.0 3.6 3.7 3.7 3.3 3.2 3.2 Leverage Ratio Debt/Equity (x) 0.4 0.1 0.0 0.0 0.0 0.0 0.0
Cash Flow Statement (INR Million) Y/E March 2012 2013 2014 2015 2016 2017E 2018E Profit before Tax 28,647 25,292 28,673 33,288 44,369 50,875 59,143 Depreciation & Amort. 10,973 11,418 11,074 5,400 4,414 5,153 5,542 Direct Taxes Paid -5,827 -6,133 -6,495 -9,998 -12,754 -14,320 -16,275(Inc)/Dec in Working Capital -6,906 -7,872 545 -3,359 1,965 2,909 1,197 Interest/Div. Received -3,674 -4,002 -4,446 -4737Other Items 384 202 284 356 49 30 30 CF from Oper. Activity 23,598 18,904 29,634 20,950 38,043 44,647 49,637 Extra-ordinary Items 431 -5,943 511 2,163 0 0 0 CF after EO Items 24,029 12,961 30,145 23,113 38,043 44,647 49,637 (Inc)/Dec in FA+CWIP -5,034 -6,004 -9,328 -11,530 -12,583 -12,000 -12,000Free Cash Flow 18,564 12,900 20,307 9,420 25,460 32,647 37,637 (Pur)/Sale of Invest. 5,962 5,079 -6,866 11,651 -11,123 0 0 CF from Inv. Activity 928 -925 -16,193 121 -23,706 -12,000 -12,000Interest Paid -213 -119 -118 -111 -49 -30 -30Dividends Paid -24,369 -10,444 -14,031 -22,194 -17,326 -19,251 -21,657CF from Fin. Activity -24,582 -10,563 -14,149 -22,305 -17,375 -19,281 -21,687Inc/(Dec) in Cash 375 1,473 -197 928 -3,037 13,366 15,950 Add: Beginning Balance 393 337 1,373 664 1,593 1,314 14,680 Closing Balance 768 1,810 1,175 1,592 -1,445 14,680 30,630 E: MOSL Estimates

Hero MotoCorp
8 August 2016 10
Corporate profile Exhibit 1: Sensex rebased
Source: MOSL/Bloomberg
Exhibit 2: Shareholding pattern (%) Jun-16 Mar-16 Jun-15
Promoter 34.6 34.6 34.6
DII 15.3 16.4 13.4
FII 41.1 39.7 38.5
Others 9.0 9.3 13.5
Note: FII Includes depository receipts Source: Capitaline
Exhibit 3: Top holders Holder Name % Holding
LIC of India 5.4
Lathe Investment PTE Ltd 2.8
Oppenheimer International Growth Fund 2.7
Aberdeen Global Indian Equity Ltd. 1.7 Lazard Management LLC A/c Lazard Emerging Markets Portfolio 1.7
Source: Capitaline
Exhibit 4: Top management Name Designation
Pawan Munjal CMD & CEO
Sunil Kant Munjal Joint Managing Director
Ramni Sood Company Secretary
Source: Capitaline
Exhibit 5: Directors Name Name
Anand C Burman Meleveetil Damodaran
Paul Edgerley Pradeep Dinodia
Pritam Singh Ravi Nath
Shobana Kamineni Suman Kant Munjal
V P Malik
*Independent
Exhibit 6: Auditors Name Type
Deloitte Haskins & Sells Statutory
JRA & Associates Internal
KPMG Internal
PricewaterhouseCoopers Internal
Source: Capitaline
Exhibit 7: MOSL forecast v/s consensus EPS (INR)
MOSL forecast
Consensus forecast Variation (%)
FY17 183.0 173.8 5.3
FY18 214.7 193.5 10.9
Source: Bloomberg
Company description Hero MotoCorp (HMCL), erstwhile JV between Honda Corporation Japan and the Munjal family, is the leader in domestic 2W market with ~41% share, benefiting from a strong dealership network and high penetration in the rural areas (~45% of sales) as well. Post-split from Honda, Hero MotoCorp is free to tap global opportunity in 2W.

HERO MOTOCORP
Our recent reports on Auto Sector
Our recent reports on other Auto Companies
HERO MOTOCORP GALLERY

Hero MotoCorp
8 August 2016 12
Disclosures This document has been prepared by Motilal Oswal Securities Limited (hereinafter referred to as Most) to provide information about the company (ies) and/sector(s), if any, covered in the report and may be distributed by it and/or its affiliated company(ies). This report is for personal information of the selected recipient/s and does not construe to be any investment, legal or taxation advice to you. This research report does not constitute an offer, invitation or inducement to invest in securities or other investments and Motilal Oswal Securities Limited (hereinafter referred as MOSt) is not soliciting any action based upon it. This report is not for public distribution and has been furnished to you solely for your general information and should not be reproduced or redistributed to any other person in any form. This report does not constitute a personal recommendation or take into account the particular investment objectives, financial situations, or needs of individual clients. Before acting on any advice or recommendation in this material, investors should consider whether it is suitable for their particular circumstances and, if necessary, seek professional advice. The price and value of the investments referred to in this material and the income from them may go down as well as up, and investors may realize losses on any investments. Past performance is not a guide for future performance, future returns are not guaranteed and a loss of original capital may occur.
MOSt and its affiliates are a full-service, integrated investment banking, investment management, brokerage and financing group. We and our affiliates have investment banking and other business relationships with a some companies covered by our Research Department. Our research professionals may provide input into our investment banking and other business selection processes. Investors should assume that MOSt and/or its affiliates are seeking or will seek investment banking or other business from the company or companies that are the subject of this material and that the research professionals who were involved in preparing this material may educate investors on investments in such business . The research professionals responsible for the preparation of this document may interact with trading desk personnel, sales personnel and other parties for the purpose of gathering, applying and interpreting information. Our research professionals are paid on twin parameters of performance & profitability of MOSt.
MOSt generally prohibits its analysts, persons reporting to analysts, and members of their households from maintaining a financial interest in the securities or derivatives of any companies that the analysts cover. Additionally, MOSt generally prohibits its analysts and persons reporting to analysts from serving as an officer, director, or advisory board member of any companies that the analysts cover. Our salespeople, traders, and other professionals or affiliates may provide oral or written market commentary or trading strategies to our clients that reflect opinions that are contrary to the opinions expressed herein, and our proprietary trading and investing businesses may make investment decisions that are inconsistent with the recommendations expressed herein. In reviewing these materials, you should be aware that any or all of the foregoing among other things, may give rise to real or potential conflicts of interest. MOSt and its affiliated company(ies), their directors and employees and their relatives may; (a) from time to time, have a long or short position in, act as principal in, and buy or sell the securities or derivatives thereof of companies mentioned herein. (b) be engaged in any other transaction involving such securities and earn brokerage or other compensation or act as a market maker in the financial instruments of the company(ies) discussed herein or act as an advisor or lender/borrower to such company(ies) or may have any other potential conflict of interests with respect to any recommendation and other related information and opinions.; however the same shall have no bearing whatsoever on the specific recommendations made by the analyst(s), as the recommendations made by the analyst(s) are completely independent of the views of the affiliates of MOSt even though there might exist an inherent conflict of interest in some of the stocks mentioned in the research report
Reports based on technical and derivative analysis center on studying charts company's price movement, outstanding positions and trading volume, as opposed to focusing on a company's fundamentals and, as such, may not match with a report on a company's fundamental analysis. In addition MOST has different business segments / Divisions with independent research separated by Chinese walls catering to different set of customers having various objectives, risk profiles, investment horizon, etc, and therefore may at times have different contrary views on stocks sectors and markets. Unauthorized disclosure, use, dissemination or copying (either whole or partial) of this information, is prohibited. The person accessing this information specifically agrees to exempt MOSt or any of its affiliates or employees from, any and all responsibility/liability arising from such misuse and agrees not to hold MOSt or any of its affiliates or employees responsible for any such misuse and further agrees to hold MOSt or any of its affiliates or employees free and harmless from all losses, costs, damages, expenses that may be suffered by the person accessing this information due to any errors and delays. The information contained herein is based on publicly available data or other sources believed to be reliable. Any statements contained in this report attributed to a third party represent MOSt’s interpretation of the data, information and/or opinions provided by that third party either publicly or through a subscription service, and such use and interpretation have not been reviewed by the third party. This Report is not intended to be a complete statement or summary of the securities, markets or developments referred to in the document. While we would endeavor to update the information herein on reasonable basis, MOSt and/or its affiliates are under no obligation to update the information. Also there may be regulatory, compliance, or other reasons that may prevent MOSt and/or its affiliates from doing so. MOSt or any of its affiliates or employees shall not be in any way responsible and liable for any loss or damage that may arise to any person from any inadvertent error in the information contained in this report. MOSt or any of its affiliates or employees do not provide, at any time, any express or implied warranty of any kind, regarding any matter pertaining to this report, including without limitation the implied warranties of merchantability, fitness for a particular purpose, and non-infringement. The recipients of this report should rely on their own investigations.
This report is intended for distribution to institutional investors. Recipients who are not institutional investors should seek advice of their independent financial advisor prior to taking any investment decision based on this report or for any necessary explanation of its contents.
Most and it’s associates may have managed or co-managed public offering of securities, may have received compensation for investment banking or merchant banking or brokerage services, may have received any compensation for products or services other than investment banking or merchant banking or brokerage services from the subject company in the past 12 months. Most and it’s associates have not received any compensation or other benefits from the subject company or third party in connection with the research report. Subject Company may have been a client of Most or its associates during twelve months preceding the date of distribution of the research report MOSt and/or its affiliates and/or employees may have interests/positions, financial or otherwise of over 1 % at the end of the month immediately preceding the date of publication of the research in the securities mentioned in this report. To enhance transparency, MOSt has incorporated a Disclosure of Interest Statement in this document. This should, however, not be treated as endorsement of the views expressed in the report. Motilal Oswal Securities Limited is registered as a Research Analyst under SEBI (Research Analyst) Regulations, 2014. SEBI Reg. No. INH000000412
Pending Regulatory inspections against Motilal Oswal Securities Limited: SEBI pursuant to a complaint from client Shri C.R. Mohanraj alleging unauthorized trading, issued a letter dated 29th April 2014 to MOSL notifying appointment of an Adjudicating Officer as per SEBI regulations to hold inquiry and adjudge violation of SEBI Regulations; MOSL replied to the Show Cause Notice whereby SEBI granted us an opportunity of Inspection of Documents. Since all the documents requested by us were not covered we have requested to SEBI vide our letter dated June 23, 2015 to provide pending list of documents for inspection. List of associate companies of Motilal Oswal Securities Limited -Click here to access detailed report
Analyst Certification The views expressed in this research report accurately reflect the personal views of the analyst(s) about the subject securities or issues, and no part of the compensation of the research analyst(s) was, is, or will be directly or indirectly related to the specific recommendations and views expressed by research analyst(s) in this report. The research analysts, strategists, or research associates principally responsible for preparation of MOSt research receive compensation based upon various factors, including quality of research, investor client feedback, stock picking, competitive factors and firm revenues
Disclosure of Interest Statement HERO MOTOCORP Analyst ownership of the stock No Served as an officer, director or employee - No
A graph of daily closing prices of securities is available at www.nseindia.com and http://economictimes.indiatimes.com/markets/stocks/stock-quotes Regional Disclosures (outside India) This report is not directed or intended for distribution to or use by any person or entity resident in a state, country or any jurisdiction, where such distribution, publication, availability or use would be contrary to law, regulation or which would subject MOSt & its group companies to registration or licensing requirements within such jurisdictions. For Hong Kong: This report is distributed in Hong Kong by Motilal Oswal capital Markets (Hong Kong) Private Limited, a licensed corporation (CE AYY-301) licensed and regulated by the Hong Kong Securities and Futures Commission (SFC) pursuant to the Securities and Futures Ordinance (Chapter 571 of the Laws of Hong Kong) “SFO”. As per SEBI (Research Analyst Regulations) 2014 Motilal Oswal Securities (SEBI Reg No. INH000000412) has an agreement with Motilal Oswal capital Markets (Hong Kong) Private Limited for distribution of research report in Kong Kong. This report is intended for distribution only to “Professional Investors” as defined in Part I of Schedule 1 to SFO. Any investment or investment activity to which this document relates is only available to professional investor and will be engaged only with professional investors.” Nothing here is an offer or solicitation of these securities, products and services in any jurisdiction where their offer or sale is not qualified or exempt from registration. The Indian Analyst(s) who compile this report is/are not located in Hong Kong & are not conducting Research Analysis in Hong Kong.
For U.S. Motilal Oswal Securities Limited (MOSL) is not a registered broker - dealer under the U.S. Securities Exchange Act of 1934, as amended (the"1934 act") and under applicable state laws in the United States. In addition MOSL is not a registered investment adviser under the U.S. Investment Advisers Act of 1940, as amended (the "Advisers Act" and together with the 1934 Act, the "Acts), and under applicable state laws in the United States. Accordingly, in the absence of specific exemption under the Acts, any brokerage and investment services provided by MOSL, including the products and services described herein are not available to or intended for U.S. persons. This report is intended for distribution only to "Major Institutional Investors" as defined by Rule 15a-6(b)(4) of the Exchange Act and interpretations thereof by SEC (henceforth referred to as "major institutional investors"). This document must not be acted on or relied on by persons who are not major institutional investors. Any investment or investment activity to which this document relates is only available to major institutional investors and will be engaged in only with major institutional investors. In reliance on the exemption from registration provided by Rule 15a-6 of the U.S. Securities Exchange Act of 1934, as amended (the "Exchange Act") and interpretations thereof by the U.S. Securities and Exchange Commission ("SEC") in order to conduct business with Institutional Investors based in the U.S., MOSL has entered into a chaperoning agreement with a U.S. registered broker-dealer, Motilal Oswal Securities International Private Limited. ("MOSIPL"). Any business interaction pursuant to this report will have to be executed within the provisions of this chaperoning agreement. The Research Analysts contributing to the report may not be registered /qualified as research analyst with FINRA. Such research analyst may not be associated persons of the U.S. registered broker-dealer, MOSIPL, and therefore, may not be subject to NASD rule 2711 and NYSE Rule 472 restrictions on communication with a subject company, public appearances and trading securities held by a research analyst account.
For Singapore Motilal Oswal Capital Markets Singapore Pte Limited is acting as an exempt financial advisor under section 23(1)(f) of the Financial Advisers Act(FAA) read with regulation 17(1)(d) of the Financial Advisors Regulations and is a subsidiary of Motilal Oswal Securities Limited in India. This research is distributed in Singapore by Motilal Oswal Capital Markets Singapore Pte Limited and it is only directed in Singapore to accredited investors, as defined in the Financial Advisers Regulations and the Securities and Futures Act (Chapter 289), as amended from time to time. In respect of any matter arising from or in connection with the research you could contact the following representatives of Motilal Oswal Capital Markets Singapore Pte Limited:
Varun Kumar Kadambari Balachandran [email protected] [email protected] Contact : (+65) 68189232 (+65) 68189233 / 65249115 Office Address:21 (Suite 31),16 Collyer Quay,Singapore 04931
Motilal Oswal Securities Ltd Motilal Oswal Tower, Level 9, Sayani Road, Prabhadevi, Mumbai 400 025
Phone: +91 22 3982 5500 E-mail: [email protected]