art & equations are linked preflight good · art & equations are linked preflight good...
TRANSCRIPT
524
ART & EQUATIONS ARE LINKED PREFLIGHT GOOD
Information about the biology and population dynamics of rougheye rock-fish (S. aleutianus) and shortraker rockfish (S. borealis) is limited, and uncertainty exists about current stock abundance and long-term productiv-ity. As adults, these two species are similar in appearance, have the same zoogeography, and share the same habitat. They were classified as a single species, S. aleutianus (Jordan and Evermann, 1898), until Barsukov (1970) described S. borealis. Tsuyuki and Westrheim (1970) also described S. borealis that same year (initially as S. caenaematicus), using biochemical methods. The distribution of rough-eye rockfish is reported from Japan to southeastern Kamchatka (exclud-ing the Sea of Okhotsk), to Navarin Canyon in the Bering Sea, throughout the Aleutian Islands, and south to San Diego, California (Tokranov and Davy-dov, 1997). Shortraker rockfish has a similar distribution; however, this species is much more abundant than rougheye rockfish in Russia—eastern Russian Sebastes biomass was com-posed of more than 90% shortraker and less than 1% rougheye rockfish for most regions, excepting the Com-
Genetic variation of rougheye rockfish (Sebastes aleutianus) and shortraker rockfish (S. borealis) inferred from allozymes
Sharon L. Hawkins
Jonathan Heifetz
Christine M. Kondzela
John E. Pohl
Richard L. WilmotAuke Bay LaboratoryAlaska Fisheries Science Center National Marine Fisheries Service11305 Glacier HighwayJuneau, Alaska, 99801-8626E-mail address: [email protected]
Oleg N. Katugin
Vladimir N. TuponogovPacific Research Fisheries Centre (TINRO-Centre)4 Shevchenko AlleyVladivostok 690950, Russia
Manuscript submitted 24 November 2003 to the Scientific Editor’s Office.
Manuscript approved for publication 28 March 2005 by the Scientific Editor.
Fish. Bull. 103:524–535 (2005).
mander Islands (Tokranov and Davy-dov, 1997). Both species have been reported at depths to 875 m (Allen and Smith, 1988), although longline (Sigler and Zenger1) and trawl surveys (NMFS triennial groundfish survey) indicate they are most abundant on the upper continental slope at 300–400 m depths. Krieger and Ito (1999) found the two species difficult to dis-tinguish visually when viewed from a submersible but believed that the highly sedentary adults of both spe-cies share the same habitat, prefer-ring substrates of sand or mud and frequent boulders and steep slopes.
Rougheye and shortraker rockfish are highly prized commercially but are particularly sensitive to overex-ploitation because of slow growth, late maturation, and long life spans. Half of rougheye rockfish are mature at 20
Abstract—Rougheye rockfish (Sebas- tes aleutianus) and shortraker rock-fish (Sebastes borealis) were collected from the Washington coast, the Gulf of Alaska, the southern Bering Sea, and the eastern Kamchatka coast of Russia (areas encompassing most of their geographic distribution) for pop-ulation genetic analyses. Using starch gel electrophoresis, we analyzed 1027 rougheye rockfish and 615 shortraker rockfish for variation at 29 protein-coding loci. No genetic heterogeneity was found among shortraker rock-fish throughout the sampled regions, although shortraker in the Aleutian Islands region, captured at deeper depths, were found to be significantly smaller in size than the shortraker caught in shallower waters from Southeast Alaska. Genetic analysis of the rougheye rockfish revealed two evolutionary lineages that exist in sympatry with little or no gene f low between them. When analyzed as two distinct species, neither lin-eage exhibited heterogeneity among regions. Sebastes aleutianus seems to inhabit waters throughout the Gulf of Alaska and more southern waters, whereas S. sp. cf. aleutianus inhab-its waters throughout the Gulf of Alaska, Aleutian Islands, and Asia. The distribution of the two rougheye rockfish lineages may be related to depth where they are sympatric. The paler color morph, S. aleutianus, is found more abundantly in shallower waters and the darker color morph, Sebastes sp. cf. aleutianus, inhabits deeper waters. Sebastes sp. cf. aleu-tianus, also exhibited a significantly higher prevalence of two parasites, N. robusta and T. trituba, than did Sebastes aleutianus, in the 2001 samples, indicating a possible dif-ference in habitat and (or) resource use between the two lineages.
1 Sigler, M. F., and H. H. Zenger Jr. 1994. Relative abundance of Gulf of Alaska sablefish and other groundfish based on the domestic longline survey, 1989. U.S. Dep. Commer., NOAA Tech. Memo. NMFS-AFSC-40, 79 p. Auke Bay Labo-ratory, 11305 Glacier Hwy., Juneau, AK 99801.

525Hawkins et al.: Genetic variation of Sebastes aleutianus and S. borealis
ART & EQUATIONS ARE LINKED PREFLIGHT GOOD
2 Hawkins, S. L., J. Heifetz, J. Pohl, and R. Wilmot. 1997. Un-publ. data. Genetic population structure of rougheye rock-fish (Sebastes aleutianus) inferred from allozyme variation. Alaska Fisheries Science Center, Quarterly Report Feature, July–Aug.–Sept. Auke Bay Laboratory, 11305 Glacier Hwy., Juneau, AK 99801.
years of age (McDermott, 1994). Rougheye rockfish have been estimated to attain ages in excess of 200 years and shortraker rockfish in excess of 150 years (Munk, 2001). These two species are currently managed to-gether as the “shortraker-rougheye” assemblage within waters managed under a North Pacific Fishery Man-agement Council (NPFMC) fishery management plan. Commercial catch levels in NPFMC areas of the Bering Sea, the Aleutian Islands, and the Gulf of Alaska aver-aged 2400 t each year from 1999 to 2001 (Heifetz et al., 2002; Spencer and Reuter, 2002).
The annual catch quota for rockfish and most ground-fish managed by the NPFMC is apportioned among five relatively large geographic areas: the eastern, central, and western Gulf of Alaska, the Aleutian Islands, and the eastern Bering Sea. Previous work in the Gulf of Alaska has indicated geographical segregation of the two rougheye species (Moles et al., 1998; Hawkins et al.2). Based on earlier designations of the International North Pacific Fisheries Commission, area boundaries have little biological basis. If the population structure of a particular species has different geographic boundar-ies than the boundaries of the designated management areas for the species, there is risk of over-harvest. The objective of this study is to examine the population structure of rougheye and shortraker rockfish by using allozyme variation. This is the first population struc-ture study of these two species that encompasses all the North Pacific management areas and most of their biological ranges.
Methods
Collection
Adult rougheye rockfish were collected with bottom trawls from the Gulf of Alaska in 1993, the eastern Bering Sea in 1994, and from the Washington coast in 1998. They were also collected by longline from waters north of Unalaska Island in the Aleutian Islands in 1996, the central Gulf of Alaska and the northwestern Bering Sea near Russia in 1997, and north of Unalaska Island (Aleutian Islands) and in the eastern and cen-tral Gulf of Alaska in 2001. Shortraker rockfish were collected with bottom trawls from the Gulf of Alaska in 1993, the eastern Bering Sea in 1994, and by longline in the northwestern Bering Sea near Russia in 1997. Dates, locations, and sample sizes are reported in Table 1 and Figure 1.
Approximately 2–3 mL of liver, heart, and muscle were taken from each fish, temporarily stored in either a freezer (–20°C) or in liquid nitrogen, shipped to the
Auke Bay Laboratory, Alaska, and stored at –80°C. Eye tissue was taken from the 1993 Southeast Alaska sam-ples but was not collected during subsequent sampling efforts because initial experimentation yielded limited results from this tissue. Samples of heart tissue were sent to the University of Alaska for DNA analysis. Only liver tissue was taken from the Shumagin and Aleutian Islands rougheye rockfish samples in 2001 (regions 9b, 14a, and 16a). The right gill arch and a 4-inch section of the gut were sampled for parasite analysis from the rougheye rockfish 2001 Gulf of Alaska samples. These fish were also photographed, preserved in 10% formalin, and shipped to the Alaska Fisheries Science Center for future morphological studies.
Laboratory analysis
Protein enzymes from each sample were separated by horizontal starch-gel electrophoresis as described by Aebersold et al. (1987). Enzymes were screened by stain-ing eye, heart, liver, and muscle tissue on each of six buffer systems (Table 2) by using general staining pro-cedures (Harris and Hopkinson, 1976; Aebersold et al., 1987), and Sebastes-specific procedures (Seeb, 1986). Enzyme screening was designed to detect interspecific allelic mobility differences and to identify intraspecific multilocus enzymes by tissue. Therefore, each tissue type from both rougheye and shortraker rockfish were run together on each gel buffer. Of 47 enzymes screened, 23 enzymes representing 29 loci were resolved for all rougheye rockfish except the Russian collection, for which 25 loci were resolved, and the collections from regions 9b, 14a, and 16a, for which only liver samples were taken and 7 loci were resolved (data available from senior author). Twenty-nine loci were resolved for all shortraker rockfish collections except the Russian collection, for which 24 loci were resolved (data avail-able from senior author). The loci used in subsequent analyses and the level of variation are listed in Table 2. Nomenclature for identified loci were assigned according to the American Fisheries Society guidelines for stan-dardization (Shaklee et al., 1990).
Data analysis
Fish sampled from stations in close proximity were com-bined to form regional collections (Table 1 and Fig. 1). The software package GENEPOP (vers. 3.4, Montpellier University, Montpellier, France) was used to calculate genotypic frequencies for each region and to test for departure from expected Hardy-Weinberg equilibrium frequencies. Homogeneity of allele frequencies among regional collections was tested with log-likelihood ratio analysis (G-test; Sokal and Rohlf, 1981). Fis and Fst were calculated with FSTAT (Goudet, 1995).
Heterogeneity among the collections and within some of the collections of rougheye rockfish was such that the fish were easily divided into two distinct “types” accord-ing to their genotypes at five loci: ACP*, IDDH*, MPI*, PGM-2*, and XO* (Table 3 and data available from
526 Fishery Bulletin 103(3)
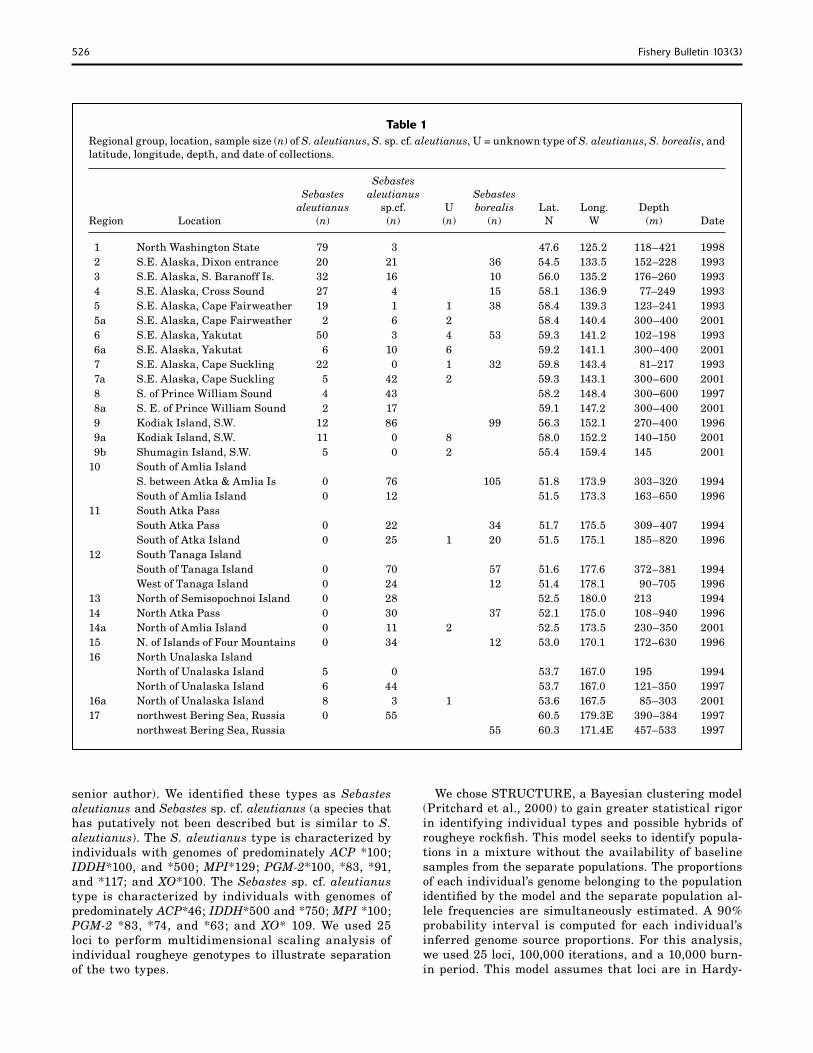
Table 1Regional group, location, sample size (n) of S. aleutianus, S. sp. cf. aleutianus, U = unknown type of S. aleutianus, S. borealis, and latitude, longitude, depth, and date of collections.
Sebastes Sebastes aleutianus Sebastes aleutianus sp.cf. U borealis Lat. Long. DepthRegion Location (n) (n) (n) (n) N W (m) Date
1 North Washington State 79 3 47.6 125.2 118–421 1998 2 S.E. Alaska, Dixon entrance 20 21 36 54.5 133.5 152–228 1993 3 S.E. Alaska, S. Baranoff Is. 32 16 10 56.0 135.2 176–260 1993 4 S.E. Alaska, Cross Sound 27 4 15 58.1 136.9 77–249 1993 5 S.E. Alaska, Cape Fairweather 19 1 1 38 58.4 139.3 123–241 1993 5a S.E. Alaska, Cape Fairweather 2 6 2 58.4 140.4 300–400 2001 6 S.E. Alaska, Yakutat 50 3 4 53 59.3 141.2 102–198 1993 6a S.E. Alaska, Yakutat 6 10 6 59.2 141.1 300–400 2001 7 S.E. Alaska, Cape Suckling 22 0 1 32 59.8 143.4 81–217 1993 7a S.E. Alaska, Cape Suckling 5 42 2 59.3 143.1 300–600 2001 8 S. of Prince William Sound 4 43 58.2 148.4 300–600 1997 8a S. E. of Prince William Sound 2 17 59.1 147.2 300–400 2001 9 Kodiak Island, S.W. 12 86 99 56.3 152.1 270–400 1996 9a Kodiak Island, S.W. 11 0 8 58.0 152.2 140–150 2001 9b Shumagin Island, S.W. 5 0 2 55.4 159.4 145 200110 South of Amlia Island S. between Atka & Amlia Is 0 76 105 51.8 173.9 303–320 1994 South of Amlia Island 0 12 51.5 173.3 163–650 199611 South Atka Pass South Atka Pass 0 22 34 51.7 175.5 309–407 1994 South of Atka Island 0 25 1 20 51.5 175.1 185–820 199612 South Tanaga Island South of Tanaga Island 0 70 57 51.6 177.6 372–381 1994 West of Tanaga Island 0 24 12 51.4 178.1 90–705 199613 North of Semisopochnoi Island 0 28 52.5 180.0 213 199414 North Atka Pass 0 30 37 52.1 175.0 108–940 199614a North of Amlia Island 0 11 2 52.5 173.5 230–350 200115 N. of Islands of Four Mountains 0 34 12 53.0 170.1 172–630 199616 North Unalaska Island North of Unalaska Island 5 0 53.7 167.0 195 1994 North of Unalaska Island 6 44 53.7 167.0 121–350 199716a North of Unalaska Island 8 3 1 53.6 167.5 85–303 200117 northwest Bering Sea, Russia 0 55 60.5 179.3E 390–384 1997 northwest Bering Sea, Russia 55 60.3 171.4E 457–533 1997
senior author). We identified these types as Sebastes aleutianus and Sebastes sp. cf. aleutianus (a species that has putatively not been described but is similar to S. aleutianus). The S. aleutianus type is characterized by individuals with genomes of predominately ACP *100; IDDH*100, and *500; MPI*129; PGM-2*100, *83, *91, and *117; and XO*100. The Sebastes sp. cf. aleutianus type is characterized by individuals with genomes of predominately ACP*46; IDDH*500 and *750; MPI *100; PGM-2 *83, *74, and *63; and XO* 109. We used 25 loci to perform multidimensional scaling analysis of individual rougheye genotypes to illustrate separation of the two types.
We chose STRUCTURE, a Bayesian clustering model (Pritchard et al., 2000) to gain greater statistical rigor in identifying individual types and possible hybrids of rougheye rockfish. This model seeks to identify popula-tions in a mixture without the availability of baseline samples from the separate populations. The proportions of each individual’s genome belonging to the population identified by the model and the separate population al-lele frequencies are simultaneously estimated. A 90% probability interval is computed for each individual’s inferred genome source proportions. For this analysis, we used 25 loci, 100,000 iterations, and a 10,000 burn-in period. This model assumes that loci are in Hardy-

527Hawkins et al.: Genetic variation of Sebastes aleutianus and S. borealis
Figure 1Location of rougheye (Sebastes aleutianus) and shortraker rockfish (Sebastes borealis) collection sites, which correspond to locations in Table 1.
Weinberg equilibrium within populations and in link-age equilibrium with one another within populations. These assumptions were tested with the PC program GENEPOP (vers. 3.4, Univ. Montpellier, Montpellier, France).
Regional groups were separated into two groups of rougheye rockfish types according to the multidimen-sional scaling analysis and Bayesian clustering model and were retested for Hardy-Weinberg equilibrium and homogeneity of allelic frequencies (G-test) among regions for each type. Chord distance (Cavalli-Sforza and Ed-wards, 1967) for 25 loci was used to assess the overall similarities of allelic frequencies for the two rougheye rockfish types with multidimensional scaling analysis (Rohlf, 2000). Only 25 loci were used because the Rus-sian collection was missing data at 4 loci. Regions 9b, 14a, and 16a were therefore not included in these analy-ses because of the limited number of loci available.
Because the two rougheye rockfish types exhib-ited a distinct yet puzzling pattern of distribution— nearly all S. sp. cf. aleutianus in the Aleutian Is-
lands, nearly all S. aleutianus in the central Gulf of Alaska, and both types in sympatry in Southeast Alaska—we collected rougheye rockfish at different depths in 2001 (regions 5a–9a, 9b, 16a). We ran a Mann-Whitney rank sum test (SigmaStat, vers. 2.0, SPSS, Chicago, IL) to test for significant differences of the mean, standard deviation, and range of depths between the two rougheye rockfish types. A single depth of 350 m was used to approximate depth of catch for the 2001 Southeast Alaska rougheye rockfish collections (re-gions 5a, 6a, and 7a) because depths were reported only as a range from 300 to 600 m. Had we chosen a deeper average depth in the range, the difference in depth be-tween the two rougheye rockfish types would have been (and in actuality may be) even greater. Because the two rougheye types were found in sympatry, we analyzed the length data to determine if size differences existed between the two types. Linear regressions were used to examine the relationships between length (tip of snout to fork of tail) and depth of capture of both shortraker rockfish and the two rougheye rockfish types.

528 Fishery Bulletin 103(3)
Table 2Enzymes with associated International Union of Biochemistry Numbers (IUBNC), locus name (Shaklee et al., 1990), tissue(s), buffer(s), and level of variability for Sebastes aleutianus. RE=both Sebastes sp. cf. aleutianus and Sebastes aleutianus, and SR=Sebastes borealis. Tissue: M=muscle; H=heart; and L=liver. Buffers: 1= R (Ridgway et al., 1970); 2 = MF (Markert and Faulhaber, 1965); 3=CA6.1 and 4- CA6.9 (Clayton and Tretiak, 1972, modified pH); 5 = TC (Shaw and Prasad, 1970); and 6 = CAME7.4 (modified from Clayton and Tretiak, 1972). Var. RE and Var. SR: 0 = monomorphic; 1 = frequency common allele >0.95; 2 = frequency common allele <0.95 for at least one region. — = Loci were not reliably scored in that species. + = loci were not reli-ably scored in all populations and were not used in most analyses.
Enzyme IUBNC no. Locus Tissue Buffer Var. RE Var. SR
Acid phosphatase 3.1.3.2 ACP* L 3 2 —
Aconitate hydratase 4.2.1.3 mAH* H 5,6 1 1
sAH* L 3,4 2 1
Adenosine deaminase 3.5.4.4 ADA-1* M,H 3,6 0 2
Adenylate kinase 2.7.4.3 AK* M,H,L 6 0 0
Alcohol dehydrogenase 1.1.1.1 ADH* L 3 21 2
Aspartate aminotransferase 2.6.1.1 sAAT* L 1 21 0
mAAT* M,H,L 3,4,6 1 1
beta-N-Acetylgalactosaminidase 3.2.1.53 bGALA* L 4 01 0
Creatine kinase 2.7.3.2 CK-1*+ H 3,6 1 0
Fumarate hydratase 4.2.1.2 FH* H,L 5 01 1
Glucose-6-phosphate isomerase 5.3.1.9 GPI-A* M,H,L 1,3 1 2
GPI-B* M,H 1,3 1 1
Glycerol-3-phosphate dehydrogenase 1.1.1.8 G3PDH* M 2 0 1
Iditol dehydrogenase 1.1.1.15 IDDH* L 1 2 —
Isocitrate dehydrogenase 1.1.1.42 IDHP-1*+ H 3 1 1
IDHP-2* L 3 1 1
Lactate dehydrogenase 1.1.1.27 LDH* M,H 3 0 0
Malate dehydrogenase 1.1.1.37 MDH-1* M,H 3,6 1 —
MDH-2* M,H,L 3,4,6 1 1
Malic enzyme 1.1.1.40 mMEP* M,H 3,6 21 2
Mannose-6-phosphate isomerase 5.3.1.8 MPI* H 6 2 2
Dipeptidase (glycyl-leucine) 3.4.-.- PEPA* M,H,L 2 2 1
Tripeptide aminopeptidase (leu-gly-gly) 3.4.-.- PEPB* M,H,L 1 0 0
PEPD*+ M,H 2 — 2
PEP-LT*+ M,H 2 — 1
Phosphoglucomutase 5.4.2.2 PGM-1* M,H,L 1,5 21 2
PGM-2* H 5 2 2
6-Phosphogluconate dehydrogenase 1.1.1.44 PGDH* M,H,L 3 21 0
Triose-phosphate isomerse 5.3.1.1 TPI-1* M,H 1,3 0 0
TPI-2* M,H 1,3 — 2
Xanthine Oxidase XO* L 2 21 0
1 Sebastes sp. cf. aleutianus level of variablity was 1.
Parasite analysis
Although not an objective of the study, parasites were opportunistically sampled from the 2001 Gulf of Alaska collections of rougheye rockfish to determine if depth or species subtype might have been a factor in the geographi-cal segregation noted by Moles et al. in 1998. This would also allow us to determine if the parasite data supported results of the current allozyme work. The rougheye rock-
fish were examined for the proportion of fish with the gill parasites Neobrachiella robusta, Trochopus trituba, or the visceral parasite Corynosoma sp. by using the procedures of Moles et. al. (1998). A categorical analysis of variance (SAS procedure, CATMOD: vers. 8.02. Cary, NC 1989) was used to test whether parasite prevalence differed among the two types of rougheye rockfish.

529Hawkins et al.: Genetic variation of Sebastes aleutianus and S. borealis
Table 3Allelic frequencies of five loci for all samples by type that best distinguish Sebastes aleutianus and Sebastes sp. cf. aleutianus.
Locus n Allele
ACP* 100 46 83
aleutianus 242 0.896 0.087 0.017sp. cf. aleutianus 486 0.094 0.905 0.001
IDDH* 100 500 750 999
aleutianus 287 0.73 0.268 0.002 0 sp. cf. aleutianus 658 0.03 0.507 0.462 0.001
MPI* 100 129 110
aleutianus 283 0.343 0.656 0.001sp. cf. aleutianus 540 0.74 0.26 0
PGM-2* 100 83 74 63/69/59** 80 91/117**
aleutianus 270 0.775 0.185 0.005 0 0.002 0.028sp. cf. aleutianus 586 0.003 0.333 0.508 0.147 0.009 0
XO* 100 109
aleutianus 295 0.844 0.156sp. cf. aleutianus 660 0.011 0.989
** indicates pooled alleles.
Results
Shortraker rockfish and rougheye rockfish had different common alleles (fixed) for 10 of 29 loci examined (sAH*, CK-A1*, GPI-A*, G3PDH*, IDHP-2*, PEPA*, PEPB*, PEP-LT*, PGM-2*, and SOD*). These are inexpensive markers that can be used to differentiate shortraker rockfish from rougheye rockfish when precise field iden-tification, particularly in younger fish, is necessary but difficult.
Shortraker rockfish
Nine loci (31%) were monomorphic for all regions, 11 loci (38%) were variable (with the frequency of the common allele greater than 0.95 for all regional groups), and 9 loci (31%) had a common allele frequency of less than 0.95 for at least one regional group. For the Russian collection, data were unavailable from five loci (FH*, mIDHP*, MPI*, PGM-2*, and TPI-2*). Average heterozy-gosity of each regional group fell within a narrow range of 0.09–0.11, and produced an overall average for 29 loci of 0.10. All regional genotypic proportions closely agreed with those expected under Hardy-Weinberg equilibrium; of 128 chi-square tests, only four (3%) differed sig-nificantly (P<0.05) from expected values. No significant (P<0.05) heterogeneity was detected with G-tests among
regional groups, and thus no subpopulations or stock structure was evident with this suite of allozymes.
Although no genetic differentiation was detected among shortraker rockfish throughout their geographic distribution, size of fish and depth of capture differed between shortraker rockfish from the Aleutian Islands and those from Southeast Alaska. Aleutian Island shortraker rockfish were significantly smaller (mean 43.6 cm [±SD 7.0], range: 24–70 cm) and were caught in deeper water (309–407 m) than Southeast Alaska shortraker rockfish (mean 66.5 cm [±SD 10.5], range: 45–101 cm at 138–260 m depths). A regression of fish length on depth of capture yielded a significant r2 value of 0.452 (P<0.001).
Rougheye rockfish
Significant departure from Hardy-Weinberg equilib-rium occurred in 37 out of 226 possible tests (16%); a value greater than the 11 that would be expected by chance alone at the P=0.05 level of probability (Table 4). Thirty-six of the departures were due to an absence of heterozygotes, a situation known as the Wahlund effect, which typically indicates the presence of a mixture of populations for presumably neutral genetic loci. Most of the departure from Hardy-Weinberg expectations occurred at ACP*, IDDH*, MPI*, PGM-2*, and XO*. Only

530 Fishery Bulletin 103(3)
Table 4Loci not in Hardy Weinberg equilibrium (P<0.05). N/A = insufficient sample size for analysis.
Location Mixture S. aleutianus1 S. sp. cf. aleutianus1
Dixon Entrance ACP, sAH, IDDH ACP, IDDH ACP, IDDH PGM-2, XOS. Baranof Island ACP, IDDH, XO ACP, PGM-1 None PGM-1, PGM-2Cross Sound ACP, IDDH, XO None N/ACape Fairweather ACP, PGM-2 ACP N/AYakutat ACP, MPI MPI N/A PGM-2, XO Cape Suckling None None N/APrince William Sound IDDH, PGM-2, XO N/A NoneKodiak ACP, IDDH None ACP PGM-2, XO Amlia Island None N/A NoneSouth Atka Pass MPI N/A MPISouth Tanaga Island PEPA, PGM-2 N/A PEPANorth Semisopochnoi Island IDDH N/A IDDHNorth Atka Pass None N/A NoneN. Is. Of Four Mountains None N/A NoneNorth Unalaska Island ACP, PGM-2, XO ACP, XO NoneWashington sAH, IDDH, MPI sAH, MPI N/A PGM-2 Russia None N/A None
1 As determined from the program STRUCTURE (Pritchard et al., 2000).
PGM-2* in the South Tanaga Island sample was due to an excess of heterozygotes.
Inbreeding coefficients (Fis) indicated deviation from panmixia. The values ranged from –0.050 for IDHP-1* to 0.772 for ACP*. The mean value over all loci in all collections was 0.140. Statistically significant Fis val-ues were found at ACP* (0.521), MPI* (0.135), PGM-2* (0.109), and XO* (0.524). All were the result of het-erozygote deficiencies. The mean Fis value for the S. aleutianus type collections dropped to 0.062 and for the S. sp. cf. aleutianus types, to 0.048.
Eight of the loci showed statistically significant Fst values: sAAT* (0.007), ACP* (0.572), sAH* (0.037), IDDH* (0.189), MDH-2* (0.007), MPI* (0.123), PGM-2* (0.206), and XO* (0.551). The mean Fst value for all loci in all collections was 0.215. When analyzed by pure S. aleutianus-type and S. sp. cf. aleutianus-type, the mean Fst values dropped to 0.013 and 0.012, respectively.
Two rougheye types
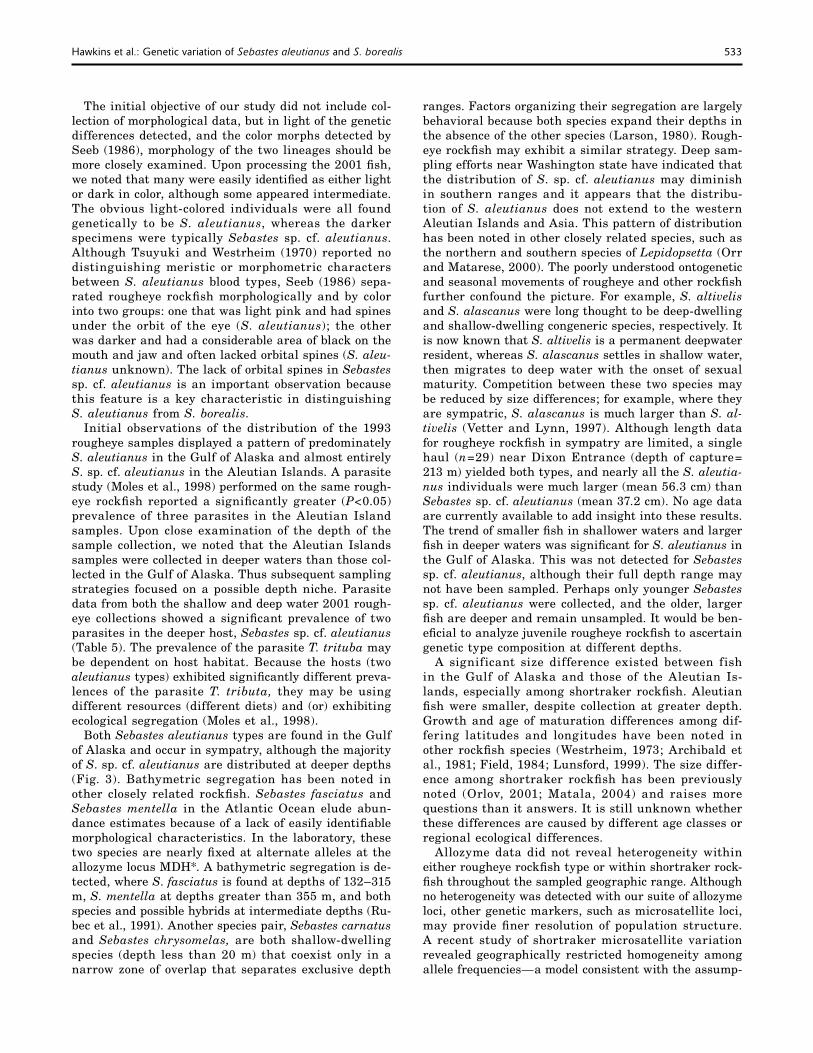
The results of the rougheye rockfish analyses allowed us to segregate rougheye rockfish individuals into two types: S. aleutianus and Sebastes sp. cf. aleutianus. Multidimensional scaling analysis with individual geno-types (Fig. 2) yielded two distinct clusters with little
overlap. This outcome was confirmed by the Bayesian clustering model in STRUCTURE (Pritchard et al., 2000), which identified two types. We calculated the inferred source proportions of genomes for 1027 indi-viduals using 25 loci that were scored in most individu-als. One hundred sixty-six individuals were missing data for more than 30% of the 25 loci used and were omitted from the analysis. Most of the individuals had a very high proportion of their genome from one type; for 851 individuals, the program assigned at least 0.80 of the individual’s genes to one of the two ancestral lines, and all had an upper 90% probability limit that included 1.0. These fish were likely all purebreds. Ten individuals had an inferred proportion of ancestry from one lineage of less than 0.80 and two did not include an upper probability interval of 1.0. These individuals were possibly hybrids. If any of these 10 individuals were actual hybrids of the two rougheye rockfish types, none were of the first generation (i.e., heterozygotes at all differentiating loci).
Signif icant differences of allele frequencies (G-test) were detected between the two types at 14 loci: P<0.001 for sAAT*, ACP*, ADH*, sAH*, IDDH*, MDH-2*, mMEP*, MPI*, PGDH*, PGM-1*, PGM-2*, and XO* ; and P<0.05 for mAAT* and GPI-B*. When the two types were analyzed independently by area (Table 4), all but two collections were in Hardy-Weinberg equilibrium

531Hawkins et al.: Genetic variation of Sebastes aleutianus and S. borealis
(South Tanaga Island Sebastes sp. cf. aleutianus type, P=0.042, and North Unalaska Island S. aleutianus type, P=0.023). The G-test analysis indicated no hetero-geneity among regions except for the Russian sample, which was significantly different from all other samples (P<0.05). Average heterozygosity was 0.09 for S. aleu-tianus and 0.08 for Sebastes sp. cf. aleutianus.
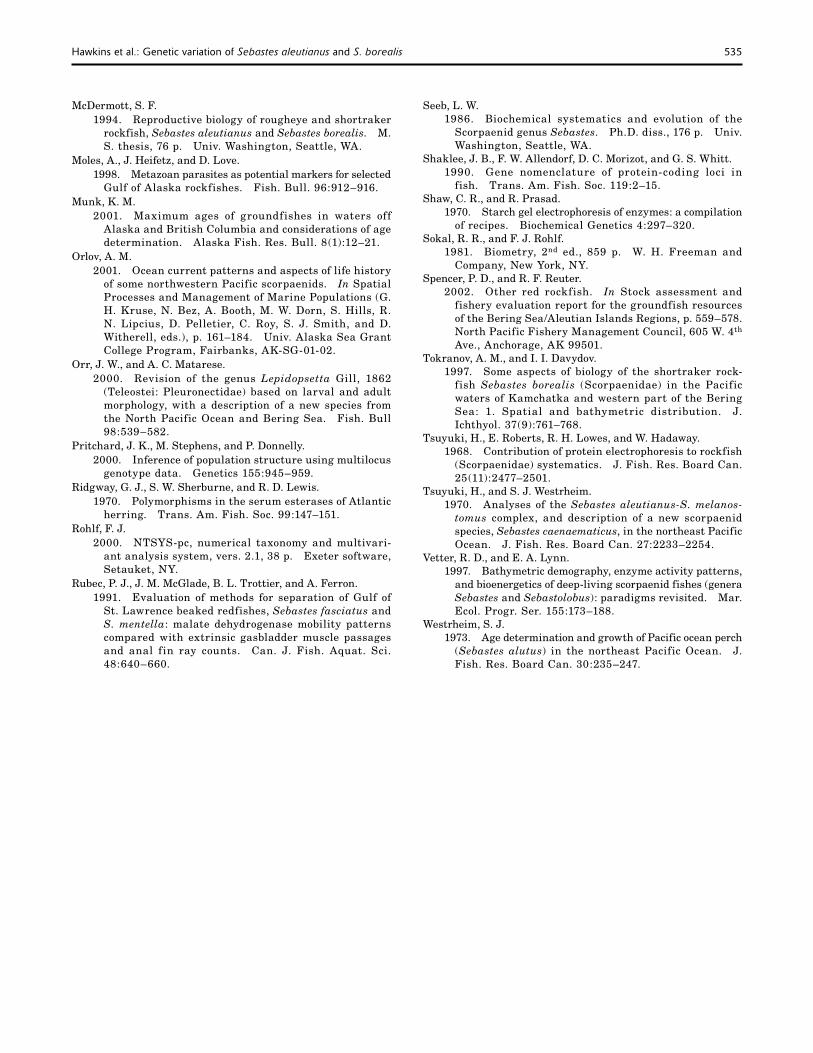
A significant difference in overall depth of capture (P<0.001) was detected between Sebastes sp. cf. aleu-tianus (mean 330+ m) and S. aleutianus (mean 208 m). We obtained both shallow and deep collections from the central Gulf of Alaska. The fish captured at shal-low depths, 77–249 m (regions 4–7, 9a, 9b, n=134), were nearly all (94%) S. aleutianus, whereas the deep-er dwelling fish, 270–600 m (regions 5a–7a, 8, 8a, 9, n=204), were mostly (87%) Sebastes sp. cf. aleutianus. Both types were captured, some within a single haul, in southern Southeast Alaska (regions 2 and 3, n=89) at depths of 150–260 m (Fig. 3).
A highly significant correlation of fish length (15– 65 cm) and depth of capture (77–260 m) was detected for S. aleutianus in Southeast Alaska, with smaller fish in shallower water and larger fish in deeper water (r2=0.415, P<0.001). No length-depth trend was noted for Sebastes sp. cf. aleutianus.
Results of the parasite analysis for the 2001 rougheye rockfish showed that Sebastes sp. cf. aleutianus had a significantly higher prevalence of both Neobrachiella robusta (P=0.003) and Trochopus trituba (P=0.022) than did S. aleutianus (Table 5).
Discussion
The most notable conclusion of our study was that two genetically distinct types of rougheye rockfish exist. This conclusion corroborates prior biochemical studies in which Tsuyuki et al. (1968) and Tsuyuki and Westrheim (1970) conducted hemoglobin electropherogram analyses on S. aleutianus and S. caenaematicus (=S. borealis) and detected four blood types. Three blood types character-ized S. aleutianus—two distinct types and a rare hybrid type. The fourth type characterized S. borealis. Seeb (1986) examined allozymes from several species of North Pacific rockfish and found two color morphs of rougheye rockfish fixed for alternate alleles at three loci. At one of the loci, ACP*, we detected a small percentage of a shared allele, likely because of our larger sample size. We were unable to resolve the other two loci, GAP* (IUBNC no. 1.2.1.12 Glyceraldehyde-3-phosphate dehydrogenase,) and GAM* (B-Galactosaminidase). Although we are unable to report fixed loci differences between the two rougheye rockfish types, we did detect significant allele frequency differences at nearly half of the loci examined. Allelic mobilities of Sebastes aleutianus were similar to those of Seeb’s “Sebastes aleutianus,” and allelic mobili-ties of Sebastes sp. cf. aleutianus were similar to Seeb’s “Sebastes aleutianus unknown.” Because simultaneous hemoglobin and allozyme studies have never been done, we are currently unable to correlate allozyme types with the blood types reported by Tsuyuki et al. (1968) and Tsuyuki and Westrheim (1970).
Figure 2Multidimensional scaling analysis of individual rougheye rockfish (Sebastes aleu-tianus) genotypes for 25 loci.
-1.5 -1.0 -0.5 0.0 0.5 1.0 1.5-3
-2
-1
0
1
2
3S. sp. cf. aleutianusS. aleutianus
Y
X

532 Fishery Bulletin 103(3)
Table 5Prevalence of parasites (percentage) in both rougheye rockfish types and results of categorical analysis of variance.
Parasite prevalence Significance probability
sp. cf. aleutianus (n=61) S. aleutianus (n=18) Type Size of fish
Neobrachiella robusta 0.57 0.11 0.003* 0.442
Trochopus trituba 0.49 0.17 0.022* 0.339
Corynosoma sp. 0.90 0.83 0.448 0.326
The Cavalli-Sforza-Edwards (CSE) chord distance (for 29 loci) between the two S. aleutianus types, 0.35 (SD=0.05), was a value comparable to that for other closely related rockfish species. Seeb (1986) reported CSE distances between rockfish species ranging from 0.07 to 0.75 for 28 loci. Identical mobilities at the ma-jority of loci indicated a close relationship between the two types, which probably existed as a single type at an earlier geologic time. Given that Tsuyuki and
Westrheim (1970) detected (2%) hybrids of the two blood types and we did not detect fixed differences be-tween the two rougheye rockfish types, some gene flow may be occurring. However, the low effective number of migrants and the sympatric distribution of the popu-lation indicate that the gene flow is limited. Because rockfish have internal fertilization, sibling species may co-occur and there is little chance of cross-fertilization of gametes.
Figure 3Proportions of Sebastes aleutianus and S. sp. cf. aleutianus in relation to depth of capture.
50°00'
50°00'
60°00'
60°00'
170°00' -180°00'
-170°00'
-170°00'
-160°00'
-160°00'
-150°00'
-150°00'
-140°00'
-140°00'
-130°00'
-130°00' -120°00' -110°00' -100°00'
S. sp. cf. aleutianus
S. aleutianus
152-261m
77-250m
300-600mReg. 2,3
Reg. 4-7
Reg. 5a-8a,8
Reg. 9a,9b145m
Reg.9270-400m
195mReg. 16
121-350m Reg. 16
213-350mReg. 13-15
303-407mReg.10-12
390-484m Reg. 17
250-421m Reg.1
118-250m Reg.1
N
533Hawkins et al.: Genetic variation of Sebastes aleutianus and S. borealis
The initial objective of our study did not include col-lection of morphological data, but in light of the genetic differences detected, and the color morphs detected by Seeb (1986), morphology of the two lineages should be more closely examined. Upon processing the 2001 fish, we noted that many were easily identified as either light or dark in color, although some appeared intermediate. The obvious light-colored individuals were all found genetically to be S. aleutianus, whereas the darker specimens were typically Sebastes sp. cf. aleutianus. Although Tsuyuki and Westrheim (1970) reported no distinguishing meristic or morphometric characters between S. aleutianus blood types, Seeb (1986) sepa-rated rougheye rockfish morphologically and by color into two groups: one that was light pink and had spines under the orbit of the eye (S. aleutianus); the other was darker and had a considerable area of black on the mouth and jaw and often lacked orbital spines (S. aleu-tianus unknown). The lack of orbital spines in Sebastes sp. cf. aleutianus is an important observation because this feature is a key characteristic in distinguishing S. aleutianus from S. borealis.
Initial observations of the distribution of the 1993 rougheye samples displayed a pattern of predominately S. aleutianus in the Gulf of Alaska and almost entirely S. sp. cf. aleutianus in the Aleutian Islands. A parasite study (Moles et al., 1998) performed on the same rough-eye rockfish reported a significantly greater (P<0.05) prevalence of three parasites in the Aleutian Island samples. Upon close examination of the depth of the sample collection, we noted that the Aleutian Islands samples were collected in deeper waters than those col-lected in the Gulf of Alaska. Thus subsequent sampling strategies focused on a possible depth niche. Parasite data from both the shallow and deep water 2001 rough-eye collections showed a significant prevalence of two parasites in the deeper host, Sebastes sp. cf. aleutianus (Table 5). The prevalence of the parasite T. trituba may be dependent on host habitat. Because the hosts (two aleutianus types) exhibited significantly different preva-lences of the parasite T. tributa, they may be using different resources (different diets) and (or) exhibiting ecological segregation (Moles et al., 1998).
Both Sebastes aleutianus types are found in the Gulf of Alaska and occur in sympatry, although the majority of S. sp. cf. aleutianus are distributed at deeper depths (Fig. 3). Bathymetric segregation has been noted in other closely related rockfish. Sebastes fasciatus and Sebastes mentella in the Atlantic Ocean elude abun-dance estimates because of a lack of easily identifiable morphological characteristics. In the laboratory, these two species are nearly fixed at alternate alleles at the allozyme locus MDH*. A bathymetric segregation is de-tected, where S. fasciatus is found at depths of 132–315 m, S. mentella at depths greater than 355 m, and both species and possible hybrids at intermediate depths (Ru-bec et al., 1991). Another species pair, Sebastes carnatus and Sebastes chrysomelas, are both shallow-dwelling species (depth less than 20 m) that coexist only in a narrow zone of overlap that separates exclusive depth
ranges. Factors organizing their segregation are largely behavioral because both species expand their depths in the absence of the other species (Larson, 1980). Rough-eye rockfish may exhibit a similar strategy. Deep sam-pling efforts near Washington state have indicated that the distribution of S. sp. cf. aleutianus may diminish in southern ranges and it appears that the distribu-tion of S. aleutianus does not extend to the western Aleutian Islands and Asia. This pattern of distribution has been noted in other closely related species, such as the northern and southern species of Lepidopsetta (Orr and Matarese, 2000). The poorly understood ontogenetic and seasonal movements of rougheye and other rockfish further confound the picture. For example, S. altivelis and S. alascanus were long thought to be deep-dwelling and shallow-dwelling congeneric species, respectively. It is now known that S. altivelis is a permanent deepwater resident, whereas S. alascanus settles in shallow water, then migrates to deep water with the onset of sexual maturity. Competition between these two species may be reduced by size differences; for example, where they are sympatric, S. alascanus is much larger than S. al-tivelis (Vetter and Lynn, 1997). Although length data for rougheye rockfish in sympatry are limited, a single haul (n=29) near Dixon Entrance (depth of capture= 213 m) yielded both types, and nearly all the S. aleutia-nus individuals were much larger (mean 56.3 cm) than Sebastes sp. cf. aleutianus (mean 37.2 cm). No age data are currently available to add insight into these results. The trend of smaller fish in shallower waters and larger fish in deeper waters was significant for S. aleutianus in the Gulf of Alaska. This was not detected for Sebastes sp. cf. aleutianus, although their full depth range may not have been sampled. Perhaps only younger Sebastes sp. cf. aleutianus were collected, and the older, larger fish are deeper and remain unsampled. It would be ben-eficial to analyze juvenile rougheye rockfish to ascertain genetic type composition at different depths.
A significant size difference existed between fish in the Gulf of Alaska and those of the Aleutian Is-lands, especially among shortraker rockfish. Aleutian fish were smaller, despite collection at greater depth. Growth and age of maturation differences among dif-fering latitudes and longitudes have been noted in other rockfish species (Westrheim, 1973; Archibald et al., 1981; Field, 1984; Lunsford, 1999). The size differ-ence among shortraker rockfish has been previously noted (Orlov, 2001; Matala, 2004) and raises more questions than it answers. It is still unknown whether these differences are caused by different age classes or regional ecological differences.
Allozyme data did not reveal heterogeneity within either rougheye rockfish type or within shortraker rock-fish throughout the sampled geographic range. Although no heterogeneity was detected with our suite of allozyme loci, other genetic markers, such as microsatellite loci, may provide finer resolution of population structure. A recent study of shortraker microsatellite variation revealed geographically restricted homogeneity among allele frequencies—a model consistent with the assump-

534 Fishery Bulletin 103(3)
tion of limited movement (Matala, 2004). Conversely, Orlov (2001) proposed a synopsis of horizontal adult migration (with increased size of shortraker rockfish at spawning grounds) and oceanic dispersal of larvae and juveniles.
In conclusion, it appears there are species-level differ-ences between the two rougheye rockfish types. We have considered the darker morph Sebastes sp. cf. aleutianus as the new type. The paler S. aleutianus morph con-forms more to the original S. aleutianus type descrip-tion, an individual of which was captured at a 55-m depth in the Gulf of Alaska. It is likely that the distri-bution of the new species S. sp cf aleutianus stretches from the Gulf of Alaska and west to Asia. The distri-bution of S. aleutianus encompasses the Gulf of Alaska and extends south to California, and the species is found in more shallow waters where it is sympatric with S. sp cf aleutianus. An understanding of the basic life history, distribution, and biomass of a species is critical for successful resource management. Ito (1999) suggest-ed that the major fisheries management survey effort is the NMFS Gulf of Alaska triennial trawl survey, which may be inadequate to assess the shortraker-rougheye rockfish assemblage because its multispecies sampling design covers mostly depths less than 200 m. This sur-vey may, therefore, be completely missing Sebastes sp. cf. aleutianus altogether. An important consideration for management is knowledge of exploitation rates. Given the sensitivity of long-lived rockfish species to over-ex-ploitation, basic biological studies should be undertaken of these species to understand characteristics such as growth, maturity, and natural mortality.
Acknowledgments
We dedicate this article in fond memory of H. R. Carlson. His research provided a highly significant contribution to our understanding of juvenile rockfish life history and homing in adult rockfish, and he was anxiously awaiting completion of our study. We thank Hanhvan Nguyen for her support in the laboratory, and we thank all partici-pants in the haul and longline surveys for providing the collections. We also thank James Orr, Jerry Pella, and Phillip Rigby for earlier reviews of the manuscript, and Adam Moles for the parasite determinations.
Literature cited
Aebersold, P. B., G. A. Winans, D. J. Teel, G. B. Milner, and F. M. Utter.
1987. Manual for starch gel electrophoresis: a method for the detection of genetic variation. NOAA Tech. Rep. NMFS 61, 20 p.
Allen, J. M., and B. G. Smith. 1988. Atlas and zoogeography of common fishes in the
Bering Sea and northeastern Pacific. NOAA Tech. Rep. NMFS 66, 151 p.
Archibald, C. P., W. Shaw, and B. M. Leaman. 1981. Growth and mortality estimates of rockfishes (Scor-
paenidae) from B.C. coastal waters 1977–1979. Can. Tech. Rep. Fish. Aquat. Sci. 1048, 61 p.
Barsukov, V. V. 1970. Species composition of the genus Sebastes in the
North Pacific. Description of a new species. Dokl. Acad. Nauk SSSR Ser. Biol. 195(4):994–997.
Cavalli-Sforza, L. L., and A. W. F. Edwards. 1967. Phylogenetic analysis: models and estimation
procedures. Evol. 21:550–570.Clayton, J. W., and D. N. Tretiak.
1972. Amine-citrate buffer for pH control in starch gel electrophoresis. J. Fish. Res. Board Can. 29:1167–1172.
Field, L. J. 1984. Bathymetric patterns of distribution and growth in
three species of nearshore rockfish from the southeastern Gulf of Alaska. M.S. thesis, 88 p. Univ. Washington, Seattle, WA.
Goudet, J.1995. FSTAT: Computer program to calculate F-statistics.
J. Hered. 86:485–486.Harris, H., and D. A. Hopkinson.
1976. Handbook of enzyme electrophoresis in human genetics, 120 p. American Elsevier, New York, NY.
Heifetz, J., D. L. Courtney, D. M. Clausen, D. Hanselman, J. T. Fujioka, and J. N. Ianelli.
2002. Slope rockfish. In Stock assessment and fishery evaluation report for the groundfish resources of the Gulf of Alaska, p. 296–382. North Pacific Fishery Management Council, 605 W. 4th Ave. Anchorage, AK 99501.
Ito, D.H. 1999. Assessing shortraker and rougheye rockfishes in
the Gulf of Alaska: addressing a problem of habitat specificity and sampling capability. Ph.D. diss., 205 p. Univ. Washington, Seattle, WA.
Jordan, D. S., and B. W. Evermann. 1898. The fishes of North and Middle America: a descrip-
tive catalogue of the species of fish-like vertebrates found in the waters of North America, north of the Isthmus of Panama, Part III. Bull. U.S. Natl. Mus. 47:2183–3136.
Krieger, K., and D. Ito. 1999. Distribution and abundance of shortraker rock-
fish, Sebastes borealis, and rougheye rockfish, S. aleu-tianus, determined from a manned submersible. Fish. Bull. 97:264–272.
Larson, R. J. 1980. Competition, habitat selection, and the bathymetric
segregation of two rockfish (Sebastes) species. Ecol. Monogr. 50(2):221–239.
Lunsford, C. 1999. Distribution patterns and reproductive aspects
of Pacific ocean perch (Sebastes alutus) in the Gulf of Alaska. M.S. thesis, 154 p. Univ. Alaska Fairbanks, Fairbanks, AK.
Markert, C. L., and I. Faulhaber. 1965. Lactate dehydrogenase isozyme patterns of fish.
J. Exp. Zool. 159:319–332.Matala, A. P., A. K. Gray, J. Heifetz, and A. J. Gharrett.
2004. Population structure of Alaskan shortraker rock-fish, Sebastes borealis, inferred from microsatellite variation. Environ. Biol. Fish. 69:201–210.
535Hawkins et al.: Genetic variation of Sebastes aleutianus and S. borealis
McDermott, S. F. 1994. Reproductive biology of rougheye and shortraker
rockfish, Sebastes aleutianus and Sebastes borealis. M.S. thesis, 76 p. Univ. Washington, Seattle, WA.
Moles, A., J. Heifetz, and D. Love. 1998. Metazoan parasites as potential markers for selected
Gulf of Alaska rockfishes. Fish. Bull. 96:912–916.Munk, K. M.
2001. Maximum ages of groundfishes in waters off Alaska and British Columbia and considerations of age determination. Alaska Fish. Res. Bull. 8(1):12–21.
Orlov, A. M. 2001. Ocean current patterns and aspects of life history
of some northwestern Pacific scorpaenids. In Spatial Processes and Management of Marine Populations (G. H. Kruse, N. Bez, A. Booth, M. W. Dorn, S. Hills, R. N. Lipcius, D. Pelletier, C. Roy, S. J. Smith, and D. Witherell, eds.), p. 161–184. Univ. Alaska Sea Grant College Program, Fairbanks, AK-SG-01-02.
Orr, J. W., and A. C. Matarese.2000. Revision of the genus Lepidopsetta Gill, 1862
(Teleostei: Pleuronectidae) based on larval and adult morphology, with a description of a new species from the North Pacific Ocean and Bering Sea. Fish. Bull 98:539–582.
Pritchard, J. K., M. Stephens, and P. Donnelly. 2000. Inference of population structure using multilocus
genotype data. Genetics 155:945–959.Ridgway, G. J., S. W. Sherburne, and R. D. Lewis.
1970. Polymorphisms in the serum esterases of Atlantic herring. Trans. Am. Fish. Soc. 99:147–151.
Rohlf, F. J. 2000. NTSYS-pc, numerical taxonomy and multivari-
ant analysis system, vers. 2.1, 38 p. Exeter software, Setauket, NY.
Rubec, P. J., J. M. McGlade, B. L. Trottier, and A. Ferron. 1991. Evaluation of methods for separation of Gulf of
St. Lawrence beaked redfishes, Sebastes fasciatus and S. mentella: malate dehydrogenase mobility patterns compared with extrinsic gasbladder muscle passages and anal fin ray counts. Can. J. Fish. Aquat. Sci. 48:640–660.
Seeb, L. W. 1986. Biochemical systematics and evolution of the
Scorpaenid genus Sebastes. Ph.D. diss., 176 p. Univ. Washington, Seattle, WA.
Shaklee, J. B., F. W. Allendorf, D. C. Morizot, and G. S. Whitt. 1990. Gene nomenclature of protein-coding loci in
fish. Trans. Am. Fish. Soc. 119:2–15.Shaw, C. R., and R. Prasad.
1970. Starch gel electrophoresis of enzymes: a compilation of recipes. Biochemical Genetics 4:297–320.
Sokal, R. R., and F. J. Rohlf. 1981. Biometry, 2nd ed., 859 p. W. H. Freeman and
Company, New York, NY. Spencer, P. D., and R. F. Reuter.
2002. Other red rockfish. In Stock assessment and fishery evaluation report for the groundfish resources of the Bering Sea/Aleutian Islands Regions, p. 559–578. North Pacific Fishery Management Council, 605 W. 4th Ave., Anchorage, AK 99501.
Tokranov, A. M., and I. I. Davydov. 1997. Some aspects of biology of the shortraker rock-
fish Sebastes borealis (Scorpaenidae) in the Pacific waters of Kamchatka and western part of the Bering Sea: 1. Spatial and bathymetric distribution. J. Ichthyol. 37(9):761–768.
Tsuyuki, H., E. Roberts, R. H. Lowes, and W. Hadaway. 1968. Contribution of protein electrophoresis to rockfish
(Scorpaenidae) systematics. J. Fish. Res. Board Can. 25(11):2477–2501.
Tsuyuki, H., and S. J. Westrheim. 1970. Analyses of the Sebastes aleutianus-S. melanos-
tomus complex, and description of a new scorpaenid species, Sebastes caenaematicus, in the northeast Pacific Ocean. J. Fish. Res. Board Can. 27:2233–2254.
Vetter, R. D., and E. A. Lynn. 1997. Bathymetric demography, enzyme activity patterns,
and bioenergetics of deep-living scorpaenid fishes (genera Sebastes and Sebastolobus): paradigms revisited. Mar. Ecol. Progr. Ser. 155:173–188.
Westrheim, S. J. 1973. Age determination and growth of Pacific ocean perch
(Sebastes alutus) in the northeast Pacific Ocean. J. Fish. Res. Board Can. 30:235–247.