arket definition in crude oil: estimating the effects of ... · arket definition in crude oil:...
TRANSCRIPT

THE ANTITRUST BULLETIN: Vol 52, No. 2ISummer2007 : 179
Market definition in crude
oil: Estimating the effects
of the BP/ARCO merger
BY JOHN HAYES,* CARL SHAPIRO/
AND ROBERT J. TOWN*"
I. INTRODUCTION
On March 31, 1999, Atlantic Richfield (ARCO) agreed to beacquired by British Petroleum (BP) for $27 billion. As originallyproposed, the merger would have created the largest private-sectoroil company in the world. The merger also raised a number ofpotential antitrust concerns, including whether the combined firmwould be able to exercise market power over the huge crude oilreserves on the Alaskan North Slope (ANS). This concern wasprompted by the substantial shares of ANS crude productioncontrolled by BP and ARCO. At the time the merger was announced,
* CRA International, Oakland California.
** Haas School of Business, University of California-Berkeley.
*** School of Public Health, University of Minnesota.
AUTHORS' NOTE: Vie authors would like to thank Dan McFadden and Miguel Hercefor their comments on this article and Bryan Patten for his research assistance. Theauthors were retained by BP and ARCO to provide expert economic advice on thecompetitive effects of this merger.
© 2007 fiy Federal Legat Piihlicatioiis. Inc.

180 : THE ANTITRUST BULLETIN: Vo/. 52, No. 2/Swmmt'r 2007
BP and ARCO were the two largest producers of ANS crude oil, withroughly 40% and 30% shares of production, respectively.
The potential economic significance of this transaction wasenormous. At $30 per barrel, ANS crude oil production is worth inexcess of $10 billion annually. In addition, ANS is an importantsource of crude oil to the western United States, which is relativelyisolated from the rest of the U.S. petroleum distribution system.Approximately 40% of the crude oil refined on the U.S. West Coast(USWC) is from the ANS.' Even a modest exercise of market powerover ANS crude oil prices is of concern in these circumstances, giventhe magnitude of the possible effects.
A traditional starting point for assessing whether a merger willcreate or enhance market power is to delineate the marketsrelevant for analysis of the transaction. In the BP-ARCO merger,the Federal Trade Commission (FTC) alleged a number of relevantmarkets, including a market for ANS.^ The FTC further allegedthat BP possessed monopoly market power over the price of ANSprior to its announced merger with ARCO, and it was concernedthat the merger would eliminate the firm most likely to eliminateor reduce BP's market power in the future.' Estimates of theelasticity of demand for ANS are plainly useful for evaluatingthese concerns.
In this article w e present econometric estimates of the demand forANS sold on the USWC. Given the unusually high quality of the dataavailable in the crude oil market, we believe our analysis is of generalinterest with respect to the exercise of market definition, as well as ofmore specific interest regarding the oil industry.
The logic behind our analysis is based on a simple model of crudeoil pricing for refineries located on the USWC. We heavily exploit the
' Throughout this article, we follow the industry convention andinclude the Petroleum Area of Defense District V (PADD V) states of Alaska,Hawaii, California, Arizona, Nevada, Oregon, and Washington in the regionwe refer to as the U.S. West Coast.
- Complaint, FTC v BP Amoco, p.l.c. No. 00-416 {N. D. Cal. filed Feb-ruary 4, 2000).
'Id.

MARKET DEFINITION IN CRUDE OIL : 181
fact that ANS production experienced a very significant, exogenousdecline during the 1990s, as the ANS fields passed their peakproductivity. As a direct result of declining ANS production, duringthe 1990s the USWC shifted from a net exporting region of crude oilto a net importing region of crude oil. Throughout the 1980s, totalcrude production on the USWC exceeded the quantity demanded inthat region, rendering the USWC a net surplus region. The price ofANS, and the prices of other crude oils produced in the region, werebelow the "world" crude price during this period, suggesting thatcrude oils produced on the USWC might trade in a distinct market.Further, as ANS production declined, its price increased, indicatingthat the ANS demand schedule was downward sloping over somerange. Clearly, if the demand for ANS is sufficiently inelastic over therelevant range, the BP-ARCO merger could create or enhance marketpower. On the other hand, simple economic reasoning suggests thatthe price of ANS is constrained by an arbitrage relationship betweenthe ANS price and world prices for other grades of crude oil. Whenthis arbitrage relationship is binding, the elasticity of demand forANS crude oil is extremely high, and ANS is not a relevant market.A key question for analysis of the effects of this merger, therefore, iswhich regime will govern ANS prices following the BP-ARCOmerger.
Our specification of the demand curve for ANS allows thedemand curve to have different slopes depending upon whether theimport arbitrage condition is binding. Our econometric resultsindicate that during the latter half of the 1990s, when fhe USWC wasa net importing region, the price of ANS was constrained by thedelivered price of imported crude oils. We draw several conclusionsfrom these results. First, ANS is not a relevant antitrust market underthe standard test articulated in the DOJ-FTC merger guidelines.*Second, BP does not possess measurable market power over the priceof ANS and did not possess such market power during the latter halfof the 1990s. Finally, the merger between BP and ARCO would not
* U.S. DEPARTMENT OF JUSTICE AND THE FEDERAL TRADE COMMISSION, HORI-ZONTAL MERGER GUIDELINES (1992, revised 1997).
^ We did not study whether BP possessed market power over the priceof ANS crude when the USWC was a net surplus region.

182 : THE ANTITRUST BULLETIN: Vol. 52. NO. 2/Summer 2007
cause the price of ANS crude oil to increase. The demand relationshipcoefficients are estimated using standard instrumental variables (IV)and time-series econometric techniques. , ,
On April 13, 2000, BP and ARCO entered into a consentagreement with the FTC that allowed the merger to proceed after theparties divested themselves of certain assets including ARCO'sholdings of ANS reserves.^ Our findings indicate that the ANSdivestiture was unnecessary to preserve a competitive price for ANScrude oil. Since a deal has already been struck between the FTC andBP/ARCO, our findings cannot affect policy in this matter.^Nevertheless, we believe the analysis we present here is of interestbeyond the BP/ARCO merger. First, consolidation appears to be anongoing trend in the oil industry. Within the last few years therehave been several large oil industry mergers, including BP's prioracquisition of Amoco, the Exxon-Mobil merger, the Phillips-Toscomerger, the combination of the refining and marketing businesses ofShell, Texaco, and Star Enterprises, and the acquisitions of Texaco byChevron, and UDS by Valero. In this environment, the antitrustauthorities are likely to revisit questions regarding the competitiveconsequences of petroleum mergers, and the methodology weoutline here is applicable to other oil industry mergers. Second, thisarticle characterizes the market process at work in this large andimportant industry. Finally, this article highlights the ability ofeconomic theory in conjunction with econometrics to providevaluable insights in antitrust analyses. Advances in economic theoryand econometrics increasingly contribute to antitrust analyses. Ourwork provides one example of such a contribution, and this articlecan inform similar analyses performed in other industries.
Over the last decade and a half economists have developedempirical methods to estimate demand parameters for marketdelineation and to estimate the price effect of a given merger
* Press Release, Federal Trade Commission, FTC Clears Merger of BPAmoco and Atlantic Ritchfield Company (April 13, 2000) (on file withauthors).
' The substance of the analysis contained in this article was presentedto the FTC during the merger review process.

MARKET DEFINITION IN CRUDE OIL : 183
directly.* Of this strain of research, the article most similar to our ownis by Spiller and Huang."* They estimate a reduced form, switchingmodel of U.S. East Coast gasoline prices to determine the geographicscope of the market for gasoline. Intercity arbitrage conditions boundthe prices in a given locale, and the econometric regimes aredetermined by whether the arbitrage conditions are binding. Twocities are considered in the same market if their arbitrage conditionsare sufficiently close that prices cannot (substantially) deviate fromone city to the other. Our work differs in a number of respects beyondthe physical product of interest. First, we estimate the demand forANS rather than a reduced-form relationship. Thus we useinstrumental variables estimation to correct for a possible biasintroduced by endogenous regressors. Second, the process thatdetermines when the arbitrage conditions are binding is exogenousand observable in our model. This fact allows us to avoid estimatingthe more complex switching model used in Spiller and Huang.
The next section of the article describes the USWC oil and refiningindustry. The theoretical model and implied econometric approachare outlined in section III. The results are presented in section IV, andsection V concludes.
IL INDUSTRY BACKGROUND
There are nearly 40 refineries in the USWC region. Many of theseare small refineries that produce specialized products or are locatednext to inland fields. The bulk of the crude oil processed in the
* For a review of this literature, see Jonathan Baker & Daniel Rubinfeld,Empirical Methods in Antitrust Litigation: Review and Critique, 1 AM. L. & ECON.REV. 386 (1999).
' Pablo Spiller & Cliff Huang, On the Extent of the Market: WlwlesaleGasoline in the Northeastern United States, 35 J. INDUS. ECON. 131 (1986). Anotherclosely related paper is by Margaret Slade, Exogeneity Tests of MarketBoundaries Applied to Petroleum Products, 34 AM. L. & ECON. REV. 291 (1985).She estimates the geographic scope of antitrust markets for wholesalegasoline by determining if prices in a pair of cities are causally (in the sense ofGranger) linked. (A time series variable X is said to Granger-cause anothertime series variable Y if the X values help to predict future values of Y aftercontrolling for the past values of Y.)
184 : THE ANTITRUST BULLETIN: Vo/. 52, Wo. 2/Swmmi?r 2007
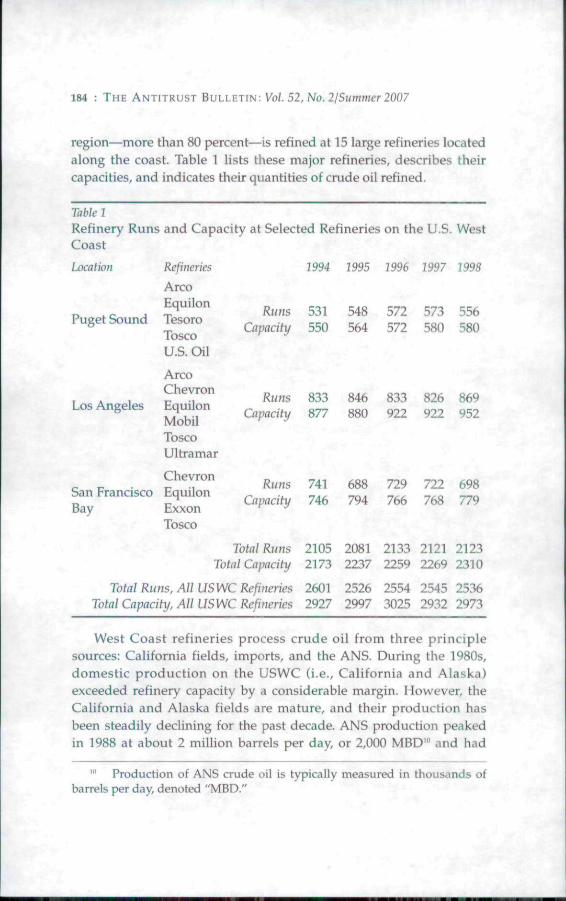
region—more than 80 percent—is refined at 15 large refineries locatedalong the coast. Table 1 lists these major refineries, describes theircapacities, and indicates their quantities of crude oil refined.
Table 1
Refinery Runs and Capacity at Selected Refineries on the U.S. WestCoast
Location Refineries
Arco'•-'••' ~ E q u i l o n
Puget Sound TesoroToscoU.S. Oil
1994 1995 1996 1997 1998
RunsCapacity
531550
548564
572572
573580
556580
Los Angeles
ArcoChevronEquilonMobilToscoUltramar
RunsCapacity
833877
846880
833922
826922
869952
RunsCapacity
741746
688794
729766
722768
698779
ChevronSan Francisco EquilonBay Exxon
Tosco
Total Runs 2105 2081 2133 2121 2123Total Capacity 2173 2237 2259 2269 2310
Total Runs, AU USWC Refineries 2601 2526 2554 2545 2536Total Capacity, All USWC Refineries 2927 2997 3025 2932 2973
West Coast refineries process crude oil from three principlesources: California fields, imports, and the ANS. During the 1980s,domestic production on the USWC (i.e., California and Alaska)exceeded refinery capacity by a considerable margin. However, theCalifornia and Alaska fields are mature, and their production hasbeen steadily declining for the past decade. ANS production peakedin 1988 at about 2 million barrels per day, or 2,000 MBD'" and had
'" Production of ANS crude oil is typically measured in thousands ofbarrels per day, denoted "MBD."

MARKET DEFINITION IN CRUDE OIL : 185
t30
I
a00
oUVi
itn
b
O
X
1
i!
9661
'iZ661
9661
|g66t
L
•
\ 1
• _ •
1
ceei
3661
1661
0661
6861
1
1
D
u. Z

186 : THE ANTITRUST BULLETIN: Vol. 52,No.2/Summer2007
declined to 1,200 MBD by 1998; California's crude production peakedin 1985 at 1,200 MBD and had declined to 900 MBD by 1998. Totalrefinery runs, on the other hand, have been roughly constant at about2,550 MBD on the USWC during the past decade (see table 1). As aconsequence of these trends, the USWC moved from net surplusproduction in the first part of the 1990s to net deficit in the latter partof the decade. Figure 1 illustrates this change and shove's that theUSWC produced more crude than it consumed until about 1992, wasapproximately balanced from 1992 tlirough 1996, and moved solidlyinto net deficit after 1996.
Imports of foreign crude oils filled the production shortfall on theUSWC and accounted for about one-quarter of crude oil consumed onthe USWC by the end of the decade. Figure 2 documents the decliningshare of ANS and California crude oils in USWC refineryconsumption and shove's the increasing share taken by importedcrude oils. One interesting feature of these data is that importscomprised nearly 10% of USWC consumption from 1989 through1992, even when USWC production exceeded consumption. Theseimports are largely "structural imports" that refineries consume inorder to achieve desired input characteristics. These imports are areminder that crude oils are somewhat differentiated, from light toheavy, sweet to sour. The growing import volumes since 1992comprise a range of crude types that refiners can substitute for ANSand California crude oils.
At the time the merger was announced, BP, ARCO, and Exxon-Mobil were by far the largest producers of ANS crude oil, accountingfor more than 90% of ANS production. Both ARCO and Exxon-Mobilare integrated producers, using the bulk of their ANS production intheir own refineries. Exxon-Mobil produces about 140 MBD moreANS than it consumes at its Benicia refinery." It sells this surplus ANSon the merchant market. ARCO became a net purchaser of ANS in the
" Exxon was required to divest its Benicia, California refinery as a con-dition of its merger with Mobil. Exxon signed a long term ANS supply agree-ment for the Benicia refinery with Valero, the acquiring company, as part ofthis sale. Agreement Containing Consent Orders, In the Matter of Exxon Cor-poration and Mobil Corporation, FTC File No. 991-0077, Docket No, C-3907(November 30,1999)

MARKET DEFINITION IN CRUDE OIL : 187
CO
00
innOU
cu•Bso
atnaoU
2?

188 : THE ANTITRUST BVIIETIN. Vol. 52, NO. 2/Summer 2007
mid-1990s as its production declined below its internal refiningneeds.'- BP owned no USWC refineries when the merger with ARCOwas announced, and it sold all of its ANS production on the merchantmarket.'^ Consequently, BP was by far the largest seller of ANS on themerchant market, selling approximately 60% of the merchant ANS.'*In addition, BP was the only firm that regularly shipped ANS off theUSWC, giving BP a unique role in determining the price of ANS.
in. CONCEPTUAL FRAMEWORK ANDECONOMETRIC METHODS
Both common sense and casual empirical observation suggest thatANS prices on the USWC must be closely related to prices in worldcrude markets. Figure 3 shows that, in fact, ANS prices closely trackprices for other widely traded crude oils. The correlation coefficientsfor ANS and the crude oils shown in figure 3 each exceed 0.95.
USWC refiners can substitute imported crude oils for ANS.Imported crude oils, such as those from Dubai, are available to USWCrefiners at "world prices/' i.e., the price struck in Dubai, plustransportation costs to the USWC. Likewise, ANS producers can sellANS to refiners outside the USWC if export prices justify theadditional transportation cost to reach export customers.'^ Thus worldmarket prices and transportation costs define both a price ceiling,above which West Coast refineries will not pay, and a price floor,below which ANS producers will not sell. The critical question foranalysis of the proposed merger, however, is whether the bounds
'- For this reason, the BP-ARCO merger raised some interesting eco-nomic issues about the proper analytical treatment of "captive capacity," i.e.,capacity used internally by a vertically integrated firm, as distinct from capac-ity used to sell to the merchant market. We do not explicitly explore theseissues in this article. ^
" BP has not owned any refinery assets on the USWC since 1993, whenit sold its Ferndale, Washington refinery to Tosco.
" Pursuant to its consent decree with the FTC, BP divested ARCO'sANS production and is no longer a net seller of ANS.
'' Prior to 1996, ANS producers were prohibited by federal law fromexporting ANS crude oil to foreign countries.

M A R K E T D E F I N I T I O N IN C R U D E O I L : 189
u'C
0)
IT3C

190 : THE ANTITRUST BULLETIN: Vol. 52, No. 2/Summer 2007
defined by the export and import arbitrage conditions are tightenough to prevent any meaningful exercise of market power.
We can represent the key features of ANS price determination in adominant-fringe model where BP is a dominant firm setting USWCprices for ANS within the arbitrage constraints imposed by worldcrude prices.'" This basic market relationship is depicted in figure 4,which plots the residual demand for ANS on the USWC along withthe import and export arbitrage conditions. The import arbitragecondition represents the fact that USWC refineries can and do importsubstitutes for ANS at the delivered price for imported crude oils, w.Similarly, ANS producers can and do export ANS to the Far East orother areas outside the USWC where they receive the world price, p^,minus transportation costs, t.^' BP prices on its residual demand curveat the profit maximizing quantity, given world market prices. Themarginal cost of selling ANS in USWC markets is the forgoneopportunity to sell at world market prices, less the transportation costof delivering the crude oil to foreign markets. Thus the profitmaximizing quantity sold on the USWC, q*, is given by theintersection of the export price, minus transportation costs, andthe marginal revenue curve. The difference between the fixedANS supply, O, and q* represents ANS that is exported to customersoutside the USWC. (See figure 4.)
The ANS supply curve in figure 4 is drawn as a vertical line. Thisrepresentation is consistent with the fact that, for various reasons,ANS is produced at the capacity of existing wells, and therefore ANS
"• The heuristic analysis that follows assumes refiners and BP face arbi-trage conditions that are functions of the same price and transportationcosts. This assumption is made only for convenience. The economic modelcan easily be extended to allow different sales and purchase prices on theworld market and different transportation costs to import and exportcrudes. These changes would not alter our econometric model or estimationprocedures.
'• ANS exports were prohibited by federal law until 19%. Prior to 1996,ANS producers "exported" ANS to mid-continental and other U.S. locations.As the transportation costs to these domestic locations are considerablygreater than the transportation costs to Far Fast locations, the export arbitrageprice was lower prior to 1996.

MARKET DEFINITION IN CRUDE OIL : 191
output does not vary with the price of ANS over the short andmedium run. The econometric implications of this vertical supplycurve are discussed further below. = .
Because refineries can substitute away from ANS, we will neverobserve the downward sloping ANS demand curve above the importarbitrage condition. Likewise, because ANS producers can sell toalternative markets, we will never observe the downward slopingANS demand curve at prices beiow the export arbitrage condition.Thus the effective residual demand for ANS on the USWC that BPperceives is represented by the heavy dotted line in figure 4. Thiseffective demand curve is what we propose to estimate.'"
FigureANS
Import Arbitrage
Export ArbitrageCondition
ResidualDemand
'" As described in detail below, we estimate the model using total salesof ANS crude oi! rather than BP-Amoco's sales. We are able to estimate BP-Amoco's residual demand curve directly from these data because the fringesupply, like BP-Amoco's supply of ANS, is unrelated to short run price varia-tions. Thus BP-Amoco's residual demand curve is equal to the marketdemand curve minus the observed fringe supply.

192 : THE ANTITRUST BULLETIN: Uo/. 52, No. 2/S«mm r 2007
The economic model depicted in figure 4 implies that the demandfor ANS has two distinct regimes. The first regime, characterized byobserved purchases along the downward sloping demand curve,corresponds with the time period when the USWC was a net exporterof crude oil. As the USWC moved into deficit, the observed prices andquantities moved up along the downward sloping portion of thedemand curve and then back along the horizontal effective demandcurve given by the refiners' import arbitrage condition.
The production and consumption data depicted in figure 1 showthat the USWC was no longer a surplus producer of crude oil afterabout 1992, and from 1996 on, the USWC was clearly a net importerof crude oil. Thus we believe the import arbitrage condition hasgoverned the price of ANS on the USWC since around 1996.
An important implication of our economic model is that if theUSWC is a net importer of crude oil, BP cannot exercise significantmarket power because it faces direct competition from importedcrude oils, competition wholly unaffected by its merger with ARCO.Estimation of the demand curve allows a direct and powerful test ofthis implication.
Our review of the existing literature on the demand for crude oilon the USWC did not uncover any previous attempts to directlyestimate the elasticity of demand for ANS crude oil. There is,however, a literature on the statistical properties of the price series forvarious types of crude oil. One question studied in this literature iswhether the prices of certain different crude oils are cointegrated.'^Two previous studies tested whether the price of ANS is cointegratedwith various other crude oils traded on the world market. GiircanGiilen'" and Rodriguez and Williams-' both found that ANS iscointegrated with other crude prices.
'" Cointegrated prices tend to move together. Formally, two nonstation-ary stochastic processes x, and y, are cointegrated if .Y, - q?y, + u, where u. is awhite noise process. The parameter q) is called the cointegrating factor.
^' S. Giircan Giilen, Rationalization in the World Crude Oil Market, 18ENERGY J. 109(1997).
-' Armando Rodriguez & Mark Williams, Is the World OH Market 'OneGreat Pool'? A Test, 5 ENERGY STUD. REV. 121 (1993).

MARKET DEFINITION IN CRUDE OIL : 193
These cointegration studies are relevant to our analysis for severalreasons. First, we are necessarily interested in the statistical propertiesof our data and have tested whether the price of ANS is cointegratedwith the prices of several widely traded crude oils. Second, evidencethat prices are cointegrated has been interpreted as an indication thatthe products in question trade in the same antitrust market.-^ Inparticular, the fact that the price of ANS is cointegrated with worldcrude prices indicates that ANS trades in a world market for crudeoil. ^ This latter point is relevant to our analysis because competitionfrom other crude oils would tend to increase the elasticity of demandfor ANS. Thus these prior studies are consistent with our conclusionthat the demand for ANS is highly elastic.
Based on our model of ANS prices, we examined the followingeconometric model of the (inverse) demand function for ANS:
p, = a,, + a^ANS, + «2M', + a^RUNS, +
The dependent variable is the price of ANS (p,). The quantitativeregressors are ANS sales on the USWC iANS,), world crude prices(iff), and the total quantity of all crude oil consumed in USWCrefineries (RUNS,), a demand shift variable. The RUNS, variable isincluded to capture variations in the total demand for crude oil on theUSWC. As RUNS, increase, we expect the price of ANS to be bid up ifANS is a distinct market. Equation (1) includes a dummy variable for theperiod when the USWC was a net importer of crude oil, 1996 to 1999,and an interaction term between this dummy variable and ANS sales. *
° Gregory Werden & Luke Froeb, Correlation, Causality, and All Tbat Jazz,8 REV. INDUS. ORG. 329 (1993), review the use of cointegration and other pricetests for antitrust market delineation.
" Rodriguez & Williams, supra note 21, at 121, claim to "show that arelevant antitrust product market is no narrower than crude oil and theappropriate geographic market is the world."
* Equation (1) allows both the slope and intercept of the ANS demandcurve to change as the USWC moves from surplus to deficit, as predicted bytheory. The dummy variable for the deficit period on the USWC is definedDEf96 = l[la 1966] where l[*l is an indicator function that takes the value 1when the indicated condition is true and 0 otherwise.
194 : THE ANTITRUST BULLETIN: Vo/. 52, No. 2/Sum;ncr 2007
The error term, £,, is assumed to be independent and identicallydistributed with £(£,) = 0. Starting from this basic econometric model,we explored several alternative specifications and estimation methods.^
The coefficients of particular interest are a, and a^. The coefficient«! is the slope of the residual demand curve for ANS prior to 1996,and the sum of a, and a^ measures the slope of the demand scheduleafter the USWC became a net importer of crude. It is our hypothesisthat the sum of these two coefficients is zero, i.e., that the price ofANS was not sensitive to ANS sales on the USWC during the periodwhen the USWC was a net importer of crude oil.
A standard problem encountered when estimating demand curvesis the presence of endogenous regressors. Two sources of endogenousregressors are of concern in this model. First, prices of competinggoods are often correlated with the contemporaneous errors.^'' Second,own quantity is typically correlated with the contemporaneous errors.In general, ordinary least squares (OLS) estimation is biased andinconsistent if regressors are correlated with contemporaneous errors.An obvious solution is to use instruments for the endogenousregressors. Our proposed regression model potentially coiitains bothof these typical sources of endogenous regressors.
The proposed model contains the world crude price as a regressorintended to measure the price of competing crude oil. Because ANScomprises less than 2% of the world crude market, we believe w iseffectively exogenous in this regression. It follows that iv does notraise any special econometric problems in our regression
^ Specifically, we examined both linear and log-log specifications withvarious regressors and both instrumental variables (IV) and ordinary leastsquares (OLS) estimation methods.
"• By "correlated with contemporaneous errors" we mean that the errorassociated with the f* observation is correlated with the f" period regressors.
-" The literature on residual demand estimation studies the generalproblem of estimating Marshallian demand curves where the prices ofcompeting goods are an endogenous explanatory variable. Luke Froeb &Gregory Werden, Residual Demand Estimation for Market Delineation: Complicationsami Limitations, 6 REV. INDUS. ORC. 33 (1991) contains a useful discussion ofthis issue. Because w is exogenous in our model, we do not encounter theproblems typically associated with estimating Marsliallian demand curves.

MARKET DEFINITION IN CRUDE OIL : 195
We followed Hamilton-" in testing the validity of this assumption byreplacing contemporaneous w with lagged values of w and byincluding leads and lags of the first difference of the w series asexplanatory variables. These tests supported our assumption that zv isexogenous.
To address the endogeneity of ANS sales we need a suitableinstrument for this regressor. Fortunately, we have an excellentinstrument available. We understand that ANS crude oil is effectivelyproduced at full capacity unless prices drop well below historicallevels.-'" Once wells are in place and operational, the marginal cost ofcontinued production is quite low. In addition, there is a danger thatreserves will be permanently lost if wells are temporarily shut down.Finally, ANS producers have commitments with the State of Alaskathat limit their ability to reduce output*' For all of these reasons, ANSproduction is not responsive to ANS prices in the short to mediumterm." These facts imply that ANS production is independent of theerror term in the den\and relationship.'^ Furthermore, total ANS
" JAMES HAMILTON, TIME SERIES ANALYSIS (1994).
^ The only exception to this general rule that we are aware of occurswhen ANS production is temporarily slowed because (exogenous) logisticalproblems prevent ANS from being transported to refinery customers. Thiscan occur, for example, if ships are unexpectedly taken out of service or if badweather limits ship movements. • '
"' The State of Alaska receives about one-quarter of its total revenuesfrom oil-related sources, and three-quarters of its discretionary revenues arefrom oil-related sources. ALASKA DEP'T OF REVENUE, FALL 1999 REVENUESOURCES BOOK (1999).
' The GAO concluded there was still no observable effect on ANSproduction three years after a sustained increase in the price of ANS. U.S.GEN. ACCOUNTING OFFICE, PUB. NO. C A O / R C E D - 9 9 - 1 9 1 , ALASKAN NORTHSLOPE OIL: LIMITED EFFECTS OF LIFTING EXPORT BAN ON OIL AND SHIPPINGINDUSTRIES AND CONSUMERS (1999).
" The independence between ANS production and the error termpotentially could be violated if ANS production capacity were a function ofthe price of ANS. We understand that ANS production capacity is notresponsive to the price of ANS (includinj^ both the price of ANS on the USWCand the price of ANS outside the USWC, e.g., the price of ANS in the FarEast). Instead, ANS production capacity is driven by well technology.

196 : THE ANTITRUST BULLETIN: Vo/. 52, No. 2/S»mm£?r 2007
production is likely to be highly correlated with ANS sales to USWCrefiners.
Another potentially endogenous variable is DEF96, whichindicates the time when the USWC switched from being a net exporterto net importer of crude oil. In our view it is unlikely this variable isendogenous since the path of ANS crude production is largelyexogenous. We address this issue by testing the robustness of thecoefficient estimates to different rules for defining the deficit period.
A second econometric issue is that our data are a time series ofobservations on prices and quantities that may not be stationary. Ifsome or all of the univariate time series are nonstationary, special caremust be taken in the specification and estimation of the model toinsure that the standard desirable statistical properties apply to thecoefficient estimates. Specifically, if the univariate series possess unitroots but are not cointegrated, then OLS (and IV) estimation of thecoefficients are biased." Thus, we perform both unit root andcointegration tests on the data.
• • I : : I •
• - > , - •
IV. DATA
We constructed a monthly data series on prices and quantitiesextending from January 1989 through January 1999, inclusive. We usedmonthly data for a number of reasons. First, the quantity data werenot available on a more frequent basis. Second, because only a limitednumber of ANS spot market transactions occur each month, the dailyANS price series may suffer from measurement error. Third, shippingtimes from foreign crude sources are about one to two months.^
We calculated the monthly average price for ANS from daily spotmarket prices as reported by Reuters. A real monthly price series was
" See HAMILTON, supra note 28.
^ Purchases of ANS crude typically take place approximately onemonth prior to delivery. Purchases of crudes from more distant sources, suchas Saudi Arabia, typically take place two or more months prior to delivery.However, crudes from all locations are sometimes available for delivery overshorter time spans, depending on transportation and storage logistics, shortrun fluctuations in refinery demand, and producer marketing decisions.
MARKET DEFINITION IN CRUDE OIL : 197
then constructed using the quarterly GDP deflator. These deflateddata were used to measure the price of ANS in our analyses.
The price of West Texas Intermediate (WTI) is our primary proxyfor the world price of crude oil, w. WTI is the benchmark crude oilwatched most closely in the United States. It is thickly traded on theNew York Mercantile Exchange (NYMEX), and the prices for manycrude oils, including ANS, are frequently quoted as deviations fromthe price of WTI. We calculated the monthly average price for WTIfrom NYMEX daily closing prices. These data were also deflatedusing the quarterly GDP deflator for our analyses. We also estimatedthe model using real monthly average prices for Arab Light, ArabMedium, West Texas Sour, and Brent as alternative proxies for theworld price of oil and found these alternative price measures did notsubstantively effect our results.
We also estimated the model including both w, and tt?f_i. Therationale for including a one-period lag of the world crude price inthe estimated equation is that because the reported ANS price isbased on only on a few transactions per month, the ANS pricepotentially could be better explained by the previous month's WTIprice, if ANS sales predominantly take place early in the month.Including ii?,_, in the regressors did not affect the qualitative results.
The quantity of ANS sold to USWC refiners can be accuratelymeasured from U.S. Maritime Administration data on shipments sinceall ANS that leaves Alaska does so by ship, and the ANS that does notleave the state is consumed by in-state refineries." Our ANS sales datameasure the volume of shipments departing Valdez for the USWC.
One issue to consider for the sales data is the timing of therelationship between ANS and p. In the spot market for ANS, theANS-WTl price differential is negotiated roughly one month prior todelivery, and the relationship between p and ANS is determined at thetime the differential is negotiated. In principle, one should attempt tomatch up ANS prices with the quantities that correspond to eachtransaction. We believe that the data on shipments leaving Valdezmatch the timing of the price data reasonably closely. To explore this
'•^ There is a small amount of pipeline loss that is also accounted for inthe data.
198 : THE ANTITRUST BULLETIN: Vol. 52, NO. 2/Summer 2007
issue, we estimated regressions run separately on both ANS, andANS,_i. Our results are not sensitive to the choice of ANS timing.
We used U.S. Department of Energy data on the total quantity ofcrude oil consumed on the USWC as a measure of the total demandfor crude oil on the USWC. If the total quantity of crude oil consumedeach month varies with the price of ANS, then this variable isendogenous. We understand, however, that USWC refineries have alimited output response to changes in the world price of crude oil andno response to changes in the price of ANS taken separately. Thus webelieve the RUNS, data are exogenous.
We used total ANS production as reported by the State of Alaskaas an instrument for ANS sales to USWC refineries. These twovariables are highly correlated (p = 0.796), suggesting that crudeproduction is a good instrument for sales. One- and two-period lagsof p, together with all of the exogenous variables, were also includedin the list of instruments.
We additionally note that our estimating equation contained adummy variable for the year 1991. The 1991 Iraq-Kuwait War was asingular event that had a profound influence on the world market forcrude oil. The war's effects were felt on both the supply and demandsides of the market. On the supply side, the war precipitated a shockdue to the loss of Kuw^aiti and Iraqi crude oils that caused crude oilprices to double in a few months time. On the demand side, the lossof the Kuw^aiti refineries reduced the demand for sour crude oilsrelative to sweet crude oils because the Kuwaiti refineries processedrelatively more sour crude than other refineries. Furthermore, theincreased demand for jet fuel further tipped world demand towardlight, sweet crude oils. This shift in demand was reflected in awidening of the sweet-sour price differential. The dummy variable for1991 is included to control for these unusual events.
V. RESULTS
The first task in the analysis is to test for the existence of unit rootsin the real price series for p and w.^ The Augmented Dickey-Fuller
'* Consider an AR(\) process x, = px,_i+ u,. This process is said to have a"unit root" if p= 1.

MARKET DEFINITION IN CRUDE O I L : 199
(ADF) test for a unit root fails to reject the null hypothesis of a unitroot for each price series at the 10% level. ^ An ADF test on the firstdifferences of each price series rejects the null at the 1% level. Thus,we treat each price series as integrated of order one.'" We alsoexamined the stationarity of ANS and concluded that it does not havea unit
We next tested whether p and iv are cointegrated. Unless thesenonstationary price series have a common cointegrating factor,standard estimation methods can generate spurious results.^" The testresults reject the hypothesis of no cointegration at the 5% level. ' Thecointegrating coefficient is approximately equal to one.
^ The test statistics are -3.427 and -3.372, and the 10% critical value is-3.510. We performed the test with an intercept term, a time trend, a break inthe series in 1996, and four lags. The test methods and critical values forstochastic processes with an exogenous break are described in P. PierrePerron, Tlte Great Crash, Tlie OH Price Shock, ami The Unit Root Hijpothesis, 57EcoNOMETRiCA 1361 (1989). We also performed the unit root tests without abreak in 1996. The test statistics are -3.046 and -2.929 for p and \NTl.respectively, and the 10% critical value is -3.149. We performed these testswith nn intercept term, a time trend, and four lags. Excluding the trend didnot change the conclusions regarding the null of a unit root.
^ A variable that is nonstationary in levels, but stationary in firstdifferences, is described as integrated of order one.
* The test statistic is -4.417, and the 1% critical value is -4.039. Weperformed this test with an intercept, a linear deterministic time trend, andfour lags.
*' See HAMILTON, supra note 28.
*' We used the johansen cointegration test and included an interceptand a linear trend in the cointegrating equation. For the full sample, January1989 through January 199'^, the test failed to reject the null of nocointegration at the 5% level. However, we believe that this failure to reject isdue to the presence of a break in the ANS price series in 1996. To explore thishypothesis, we performed cointegration tests on two subsamples of the data:1989-1995 and 1996-1999. The Johansen test on these two subsamplesrejected the nuil hypt>thesis of no cointegration at the 5% level. This result isconsistent with the previous studies that found the price of ANS wascointegrated with the price of WTI. Giilen, supra note 20, and Rodriguez &:Williams, supra note 21.

200 : THE ANTITRUST BULLETIN; Vb/. 52, No. 2/Suinmt'r 2007
It is also important to note that coefficient estimates fromcointegrating regressions may not have asymptotic distributions thatare Normal.^- This result has implications for hypothesis testing. Wediscuss this point further below.
Table 2 presents parameter estimates using TV and OLSestimation. The coefficient estimates on the variables of interest—a, and a^—are similar. Our comments will focus on the IV results,which are presented in column (1). The reported standard errors areNewey-West^^ heteroskedasticity and autocorrelation consistent(HAC) standard error estimates.
Table 2
IV and OLS Coefficient Estimates of the Inverse Demand for ANS
Variable
Constant
ANS,
DEF96
DEF96*ANS,
RUNS, - •
DEF96'*RUNS,
1991
R'N
Durbin-Watson
^ HAMILTON, supra note 28.
*^ Whitney Newey & Kenneth West, A Simple Positive Semi-Definite,Hcteroskedasticiti/ and Autocorrelation Consistent Covariance Matrix, 55ECONOMETRICA 703 (1987).
IV Estimates(standard errors)
(1)
2.875(4.760)-0.010(0.003)-7.364(6.006)0.012
(0.004)0.981
(0.029)0.003
(0.002)-0.003(0.002)-0.931(0.460)
0.951191.60
OLS Estimates(standard errors)
(2)
-2.310(3.427)-0.002(0.001)-3.448(5.136)0.007
(0.002)0.945
(0.023)0.001
(0.001)-0.002(0.002)-1.521(0.260)
0.971210.89

MARKET DEFINITION IN CRUDE OIL : 201
The specification in equation (1) produces two slope coefficientscorresponding to the pre- and postdeficit periods on the USWC. Thecoefficient estimate for the predeficit period, -0.010, is significantlydifferent from zero at the 1% level. This coefficient implies that themarket price elasticity of demand for ANS at a price of $16.85 perbarrel and ANS sales to USWC refiners of 1,356 MBD is -0.8 in thepredeficit period."" The coefficient estimate for the postdeficit periodis equal to the sum of the coefficient estimates for ANS, andDEF96*ANS,. This coefficient, 0.002, is insignificantly different fromzerc" Our interpretation of this coefficient estimate is that the importarbitrage condition holds in the postdeficit period, and consequently,the market elasticity of demand for ANS is exceptionally high. " Wealso examined alternative regressors that allowed the kink in thedemand curve to appear in early 1994, early 1995, and mid-1995, withno material effect on the results.^" The coefficient estimates also reflectthe long-run cointegrating relationship between p and w, as thecoefficient on w is close to one.
We can now readily calculate an estimate of the price elasticity ofdemand along BP's residual demand curve. It is easy to show, given ourassumption of an inelastic fringe supply, that BP's firm-specific elasticityis equal to the market elasticity multiplied by the inverse of BP's shareof ANS sales. At the time the merger was announced, BP's share of ANSsales was approximately 40%. Thus the elasticity of the residual demandfor ANS that BP observed at the time of the merger was more than twicethe (already highly elastic) market demand for ANS.**
*" The mean values of p and ANS are $16.85 and 1,356 MBD, respectively.
• The standard error estimate for this coefficient is 0.004; the ;?-value is0332.
** We also examined refinery specific substitution patterns and foundevidence that refiners on the USWC use a variety of imported crude oils andregularly substitute these for ANS when relative prices warrant the change.Our econometric findings were strongly supported by this detailed evidenceof import substitution.
*' Specifically, we replaced DEF96 with the following alternative dummyvariables DEF94 ^ 1 (f a 1994], DEF95 = 1 [(a 1995] and DEF955 = Uf a 1995K)6].
^ We also examined differences in the substitution patterns of firmswith captive ANS production, such as ARCO and Exxon, and firms with no
202 ; THE ANTITRUST BULLETIN: Vo/. 52, No. 2/Summt'r 2007
One important interpretative question is whether theparameter estimates from the regressions reported in table 1 arelong run or short run values. We are inclined to think of theestimates as long run elasticities because most of the variation inANS sales comes from the long run trend toward reduced ANSproduction." There are short run movements in ANS sales, butthese are small in comparison to the more than 40% decline in ANSproduction over the observation period.' " Furthermore, the longrun trend in ANS production was projected well in advance, andUSWC refiners made investment and crude oil purchase decisionswith the decline in mind. Thus the data are dominated by theadjustments refineries made in response to the anticipated declinein ANS production.
As mentioned above, the asymptotic distributions of thecoefficient estimates from a regression on cointegrated variablesmay not be Normal. Specifically, if the error terms in the univariateprocess of w, are correlated with the error term in the regressionequation, standard distribution theory may not hold. One can testfor the presence of such correlation by adding leads and lags ofAw, to the regression equation.°" This was done and the qualitativefindings were not affected. In addition, we examined tliecorrelations between the residuals from the regressions andthe residuals from autoregressions on zv, and ANS,. These
ANS production. These data showed that captive producers were slower tosubstitute than were merchant market customers. The estimates that wereport here do not account for these differences in substitution patterns. Sinceall of BP's sales went to merchant customers, the elasticity that BP actuallyobserved was in all likelihood greater than indicated by the estimates wereport here.
** See Luke Froeb & Gregory Werden, Market Delineation Under theMerger Guidelines: Tlie Role of Residual Demand Elasticities (U.S. Dep't of justice,EAG Working Paper No. 90-3, 1990) for a similar interpretation of elasticityestimates from a regression equation.
^ Alternatively, one could argue that since a cointegratingrelationship is a long run relationship, we should think of these as long runestimates.
' HAMILTON, supra note 28.

MARKET DEFINITION IN CRUDE OIL : 203
correlations were small, indicating that standard distributiontheory applies."
The results reported in table 2 are robust to alternative regressorsand specifications. As noted in our discussion of the data, weexamined a number of alternative regressors and found they did nothave a substantive effect on our results. In addition, we estimated a
Table 3IV Coefficient Estimates of ANS Demand(dependent variable is ANS shipped to USWC)
Variable ^ IV Estimates(standard errors)
n , , 5.63.79Constant (285.45)
-70.41P' (25.44)
(200.13)207.60
P' . (120.89)
^^^ ' (23.50)
D£F96*WT/,
RUNS,
^^^^ (53.86)
R' 0.53N 119
Durbin-Watson 1.80
^ Specifically, we examined corr(e,, /*,) and corr(e,, v,) where fi, and v,are the errors from the following autoregressions:
WTI, = xo + y, lVr/,_, + Y2^^h-2 + y3>Vn,_3 + ^ and
PROD, = Afl + A,PKOD,_i + h2PROD,_2 + h^PROD,^^ + v,
where PROD, is ANS production, the instrument for ANS,. The correlationswere -0.193 and 0.052, respectively.
204 : THE ANTITRUST BULLETIN: Vol. 52, No. 2/Summer 2007
log-log specification of the model which produced results that werenot materially different from those reported here.^'
Finally, we also estimated a demand relation (i.e., ANS quantity isthe dependent variable and ANS price is a regressor) as opposed tothe inverse demand relationship we report in table 2. Table 3 presentsIV estimates of this specification using ANS production as theinstrument for price. As with our other robustness tests, the estimateddemand elasticities are very close to those implied by the parameterestimates in table 2. In the predeficit regime, the estimated elasticityof demand is -0.9, and in the postdeficit period the estimatedrelationship is positive and insignificant.'^
VI. CONCLUSION
In this article we estimated the demand relation for ANS crude oilsold to refiners on the USWC. Our estimates show that the marketdemand for ANS crude oil was inelastic in the early part of the 1990s,when the region was a net exporter of crude oil, but demand becamehighly elastic in the latter half of the decade, when the region becamea net importer of crude oil. In the latter half of the 1990s, an importarbitrage condition has prevented the price of ANS from exceedingworld price levels. These estimates indicate that the proposedBP/ARCO merger would not have created or enhanced marketpower over ANS prices.
" Detailed results of these alternative estimates are available from theauthors.
• Monte Carlo studies have shown evidence of small sample bias incointegrated regressions, and further, the bias is inversely related to R'. Thisfact suggests we should put more fnith in the specification with the higher ROur analysis shows that the price regressions have much higher R- than thequantity regressions—0.95 for the price regression as compared to 0.53 for thequantity regression.
