are overweight and obese adolescents different from their peers?
TRANSCRIPT

ORIGINAL ARTICLE
Are overweight and obese adolescents different from their peers?
HELENA FONSECA1, MARGARIDA G. MATOS2, ANTONIO GUERRA3 &
J. GOMES PEDRO1
1Department of Paediatrics, Hospital de Santa Maria, Lisboa, Portugal, 2Faculty of Human Kinetics, Technical University of
Lisbon, Lisboa, Portugal, 3Department of Paediatrics, Hospital de Sao Joao, Porto, Portugal
AbstractObjective. To identify psychosocial and lifestyle indicators including alcohol consumption, that may distinguish overweightand obese adolescents from their peers, and align them with other adolescents with chronic conditions. Methods. The sampleincluded 6 131 6th, 8th, and 10th grade public school Portuguese students, aged 11�16 years, who participated in the HealthBehavior in School-Aged Children (HBSC)/WHO survey of adolescent health. Body mass index (BMI) was based on self-reported weight and height. Separate analyses of psychosocial and behavioral variables were conducted by gender, agegroup, and BMI, using Chi square, and ANOVA. Results. Obese and overweight teens when compared with non-overweightteens, were more likely to report a negative attitude towards their appearance; to believe that others made negativecomments about them; had a lower level of life satisfaction; had more difficulty in making new friends, and were more likelyto describe themselves as unhappy. Moreover, obese teens were significantly more likely than their non-obese peers todescribe themselves as having health problems, to report drinking alcohol daily, as well as having been drunk more than10 times. Conclusions. The present study provides further evidence regarding the association between overweight and obesityin adolescence, and body image dissatisfaction, poorer self-assessed health status, potential social isolation, decreased lifesatisfaction, and problematic alcohol consumption patterns. Overweight and obese adolescents should, where possible, bereached with appropriate interventions addressing the broad spectrum of their psychological needs, enhancing their skilldevelopment for behavioral change, and providing support for dealing with potentially harmful behaviors.
Key words: Obesity, overweight, adolescence, psychosocial indicators, alcohol use
Introduction
Adolescence has been considered a critical develop-
mental period when adolescents are adjusting to
physical changes, establishing their personal identity,
seeking greater independence and increasingly rely-
ing on peer groups. Obesity can be considered as a
chronic condition, which is highly prevalent among
adolescents. Its potentially serious psychosocial and
physical consequences have made overweight and
obesity one of the great contemporary public health
issues (1�3).
It has already been shown that a higher body mass
index (BMI) is associated with greater body image
dissatisfaction among adolescents, which may im-
pact their psychosocial development in a negative
way (4). In fact, being overweight may represent a
major psychosocial burden for an adolescent. Over-
weight adolescents have been described as more
likely to be socially isolated (5), and have difficulty in
making new friends (6). Social stigma and margin-
alisation may, in fact, be a substantial challenge to
their social and emotional wellbeing. A study of
obese children and adolescents showed lower health-
related quality of life compared with young people of
a similar age who had cancer (7), and showed the
large negative impact this chronic health condition
may have on the adolescent. However, the nature of
the relationship between obesity and mental health
conditions remains unclear.
Higher rates of health risk behaviors, including
smoking, among adolescents who diet (whether
obese or not), have been reported by some authors
Correspondence: Helena Fonseca, Hospital de Santa Maria, Department of Paediatrics Av. Prof Egas Moniz 1, 1649-028 Lisboa, Portugal. Fax:
351217805637. E-mail: [email protected]
International Journal of Pediatric Obesity. 2009; 4: 166�174
(Received 23 February 2008; accepted 4 September 2008)
ISSN Print 1747-7166 ISSN Online 1747-7174 # 2009 Informa UK Ltd
DOI: 10.1080/17477160802464495

(8�10). It has also been shown that overweight
adolescents are more likely to engage in behaviors,
such as chronic dieting and binge eating (11,12).
Growing evidence suggests that adolescents with
other chronic conditions are likely to engage in risky
behavior to at least similar, if not higher rates as their
healthy peers (13), and alcohol has been recognized
as the substance most frequently used by young
people with a variety of chronic conditions, with little
variation by diagnosis (14,15).
In order to identify psychosocial and lifestyle
indicators that may distinguish overweight and obese
adolescents from their peers, and to explore the
extent that overweight and obese adolescents, like
other adolescents with chronic conditions, may be
exposed to alcohol consumption patterns associated
with heightened risk of injury, we analyzed data from
the most detailed available Portuguese nationally
representative dataset.
Methods
The data for this study were derived from a WHO
collaborative cross-national survey, 2002 Health
Behaviour in School-Aged Children (HBSC).
From 1983 onwards, the study has been carried
out every fourth year. The survey is based on a self-
completed questionnaire that is administered in
public schools by teachers. The design of the study
is fully described elsewhere (16).
This study used a strict international protocol
following the Helsinki Declaration on human subject
testing, and was approved by an expert panel at the
University level, and by the School Teacher’s Board.
Informed consent was obtained both from parents
and students.
Data collection
The sample consisted of 6 131 students in the 6th,
8th, and 10th years, from 125 randomly chosen
Portuguese middle and high schools, representing
the entire country. The sampling unit used in this
survey was the class. The schools in the sample were
randomly selected from a national list of schools,
stratified by region (five Education Regional Divi-
sions). In each school, classes were randomly se-
lected in order to meet the required number of
students for each grade, which was proportional to
the number of same grade mates for each specific
region according to the numbers provided by the
Ministry of Education. This study over-sampled to
compensate for cluster sampling. Questionnaires
were administered by teachers in the classroom.
Teachers were asked to keep away from students
during the completion of the questionnaires, and
were only allowed to help with administrative
procedures. Students completed the questionnaires
on their own, and left their anonymous question-
naires in an envelope, which was sealed by the last
student. Participation was voluntary and anonymity
was assured. No instances of refusal were reported.
Students who were absent from school on the day of
the survey were not included. The overall response
rate was 87% relating to students, and 93% relating
to schools. The process of distribution and collection
of questionnaires in the entire country by mail was
co-ordinated by the national team.
The questionnaire included questions on demo-
graphics (age, gender, socio-demographics), school-
related variables, tobacco and alcohol use, physical
activity and leisure, nutrition, safety, perceived
weight and height, body image, aspects of psycho-
social health, general health symptoms, and social
competence. Each questionnaire required approxi-
mately 55 minutes to be completed.
Measures
Measures were defined as has been described in
previous analyses using the HBSC/WHO interna-
tional survey data. A complete picture of previous
uses of the items, their psychometric properties, and
measures validation, can be found in the interna-
tional study report (17).
BMI. BMI was calculated based on self-reported
weight (kg)/height (m2) using the questions: ‘‘How
much do you weigh without clothes?’’ and ‘‘How tall
are you without shoes?’’ Adolescents were categor-
ized according to their BMI, using the cut-off points
for age and gender defined by Cole and colleagues
(18). For the present study, three groups were
considered: a group of overweight, a group of obese,
and a third group including normal and under-
weight. Overweight and obese adolescents were
compared with their non-overweight peers.
Body image. Body image was assessed using three
items: a) an item measuring perception of body weight:
‘‘Do you think your body is (1) much too thin, (2) a
bit too thin, (3) about the right size, (4) a bit too fat,
(5) much too fat?’’ b) a question assessing other
people’s perceptions about one’s appearance. Response
options included: ‘‘they make positive comments’’,
‘‘they make negative comments’’, ‘‘they do not make
comments at all’’; and c) a 6-item scale question
assessing body satisfaction/attitude towards appearance:
‘‘Do you think you are: (1) very good looking, (2)
quite good looking, (3) about average, (4) not very
good looking, (5) not at all good looking, (6) don’t
Are obese adolescents different from their peers? 167

think about my looks?’’ Body satisfaction/positive
attitude towards appearance was considered when
options (1), (2) or (3) were chosen, and body
dissatisfaction was considered when options (4) or
(5) were chosen.
Dieting for weight loss. Dieting for weight loss
purposes was assessed using the question: ‘‘At
present are you on a diet or doing something else
to lose weight?’’ Response options included: ‘‘no, my
weight is fine’’, ‘‘no, but I should lose some weight’’,
‘‘no, because I need to put on weight’’, and ‘‘yes’’.
Life satisfaction. Life satisfaction was derived from
the measurement technique known as the Cantril
ladder with ten steps (19): the top of the ladder
indicates the best possible life, and the bottom, the
worst possible life. Adolescents were asked to
indicate the step of the ladder at which they would
place their lives at the moment, by answering the
question: ‘‘Here is the picture of a ladder: The top of
the ladder ‘10’ is the best possible life for you, and
the bottom ‘0’ is the worst possible life for you. In
general, where on the ladder do you feel you stand at
the moment?’’
Health perception. Health perception was assessed
with the question: ‘‘Do you have any health problem
that inhibits you from doing some of the things your
peers do?’’ There were two response options: ‘‘yes’’,
and ‘‘no’’.
Friendship and peer group involvement. Peer group
involvement was assessed with the question: ‘‘Is it
easy or difficult for you to make new friends?’’
Possible response options were: ‘‘very easy’’,
‘‘easy’’, ‘‘difficult’’, and ‘‘very difficult’’.
Happiness. The question on self-rated feelings of
happiness towards life was: ‘‘Would you say, in
general, your life is ‘very happy’, ‘happy’, ‘not very
happy’, or ‘unhappy’?’’
Irritability or bad temper, and nervousness. Irritability
or bad temper, and nervousness were assessed with
the question: ‘‘In the last 6 months how often have
you had irritability or bad temper/felt nervous?’’ In
both cases response options included: ‘‘about every
day’’, ‘‘more than once a week’’, ‘‘about every week’’,
‘‘about every month’’, and ‘‘rarely or never’’.
Alcohol use. Alcohol use was assessed by the ques-
tion: ‘‘How many times a week do you usually drink
any alcoholic drink?’’ Response options included:
‘‘never’’, ‘‘less than once a week’’, ‘‘once a week’’,
‘‘2�4 days a week’’, ‘‘5�6 days a week’’, ‘‘once a day’’,
‘‘every day’’, or ‘‘every day, more than once’’.
Alcohol abuse. Alcohol abuse was assessed with the
question: ‘‘Have you ever had so much alcohol that
you were really drunk?’’ Response options included:
‘‘no, never’’, ‘‘yes, once’’, ‘‘yes, 2�3 times’’, ‘‘yes,
4�10 times’’, or ‘‘yes, more than 10 times’’.
Analysis
SPSS version 15.0 for windows (SPSS, Chigaco IL
USA) was used for data management and statistical
analysis.
HBSC target age groups are 11, 13, and 15 year
olds. These three time periods are designed to
represent the onset of adolescence (age 11), the
challenge of physical and emotional changes (age
13), and the middle years when life and career
decisions are beginning to be made, and experimen-
tation is an increasingly important issue (age 15).
Because the study covers such a large age range, for
the purpose of this specific research project where
the objectives were to identify psychosocial and
lifestyle indicators, including exposure to alcohol
consumption that may distinguish overweight and
obese adolescents from their peers, separate analysis
of psychosocial variables were conducted by gender,
age group (B15 years/]15 years), and BMI score,
using Chi square, and ANOVA (life satisfaction).
In order to identify which of the three sub-samples
(non-overweight, overweight, and obese) differed on
the different items, adjusted residuals ]j1.9j were
considered significant. Variables used as moderators
are justified by literature review.
Results
Of the total 6 131 adolescents included in the sample
(M�14 years, SD�1.85), 51% were girls, 3.1%
(171) were classified as obese, and 14.8% (807) as
overweight. BMI could not be determined in 661
adolescents (10.8%) because they did not report
either their weight or height, or both.
In the obese group, mean BMI was 32.73
(SD�7.80), while in the overweight group, mean
BMI was 24.30 (SD�1.83).
Age, gender and BMI. Overweight and obesity were
more common among younger teens (x2�48.48;
pB0.001), and there were more obese and
168 H. Fonseca et al.

overweight boys compared with girls (x2�19.32;
pB0.001). Sample description of age and BMI by
age group and gender, is shown in Table I.
Body image: Perception of body weight, other people’s
perceptions, and body satisfaction/attitude towards
appearance. Gender and age differences were sig-
nificant with girls and older teens more likely than,
respectively, boys and younger teens to perceive
themselves as ‘a bit’ or ‘much too fat’, and to report
body dissatisfaction. Those who perceived them-
selves as ‘a bit too fat’ or ‘much too fat’, more often
were overweight or obese.
Obese and overweight teens were more likely to
believe other people used to make negative com-
ments about them.
Obese and overweight teens were also more likely
to report body dissatisfaction compared with their
non-overweight peers (Table II).
Dieting for weight loss. Girls were more likely than
boys to report dieting for weight loss, and boys were
more likely to report not being on a diet because of
wanting to gain weight. Older teens and overweight/
obese teens were more likely than their younger
and their non-overweight peers to report dieting
(Table II). Among those who were classified as
overweight and obese according to their self-re-
ported weight and height, 38.0% and 23.1%,
respectively, reported not being on a diet because
their weight was fine. On the other hand, among
those reporting being on a diet, 62.5% were classi-
fied as non-overweight.
Life satisfaction. Life satisfaction was higher among
boys (boys: X�7.43; s�1.86 vs. girls: X�7.30;
s�1.98) (F [1, 5942]�7.324, p�0.007),
decreased in the older group (B15 years: X�7.58;
s�1.92 vs.]15 years: X�6.94; s�1.88) (F [1,
5942]�148.295, p�0.000), and also decreased in
the groups with higher BMI (non-overweight:
X�7.41; s�1.85/overweight: X�7.17; s�2.01/
obese: X�6.90; s�2.22) (F [2, 5 317]�10.036,
p�0.000).
Health perception. Obese adolescents were signifi-
cantly more likely than their non-overweight peers
(18.8% vs.10.5%) to describe themselves as having a
health problem that inhibited them from doing some
of the things their peers do (Table III).
Friendship and peer group involvement. Obese and
overweight adolescents reported more than their
non-overweight peers that it was difficult or very
difficult for them to make new friends (12.9% and
12.7% vs. 10%, and 2.9% and 3.1% vs. 2.0%,
respectively) (Table III).
Happiness. Those classified as obese, and overweight
were significantly more likely to describe themselves
as unhappy compared with their non-overweight
peers (6.1 and 4.6% vs. 2.6%, respectively)
(Table III).
Irritability or bad temper, and nervousness. Obese
adolescents reported irritability or bad temper, and
feeling nervous everyday more frequently than their
Table I. Sample description: Age, weight, height and body mass index (BMI) across age group, gender, and total sample.
n
Age Mean
(min�max) s n
Weight Mean
(min�max) s
Age Group
B15 y 4 057 12.90 (10.33�14.92) 1.09 3 727 48.2 (20.0�144.0) 11.7
]15 y 2 074 16.17 (15.0�25.0) .88 1 973 59.9 (25.0�130.0) 10.5
Gender
Male 3 006 14.07 (10.33�21.25) 1.87 2 793 54.2 (20.0�130.0) 13.77
Female 3 125 13.94 (10.33�25.0) 1.83 2 907 50.4 (20.0�144.0) 11.06
Total 6 131 14.0 (10.33�25.0) 1.85 5 700 52.2 (20.0�144.0) 12.61
BMI
n
Height Mean
(min�max) s n
Overweight
(%)
Obesity
(%)
Age Group
B15 y 3 694 155.3 (120�199) 12.08 3 537 16.6 3.8
]15 y 1 991 167.9 (125�199) 9.16 1 933 11.3 1.8
Gender
Male 2 788 162.3 (120�199) 14.17 2 689 16.6 3.6
Female 2 897 157.3 (120�199) 10.48 2 781 12.9 2.7
Total 5 685 159.7 (120�199) 12.68 5 470 14.8 3.1
Are obese adolescents different from their peers? 169
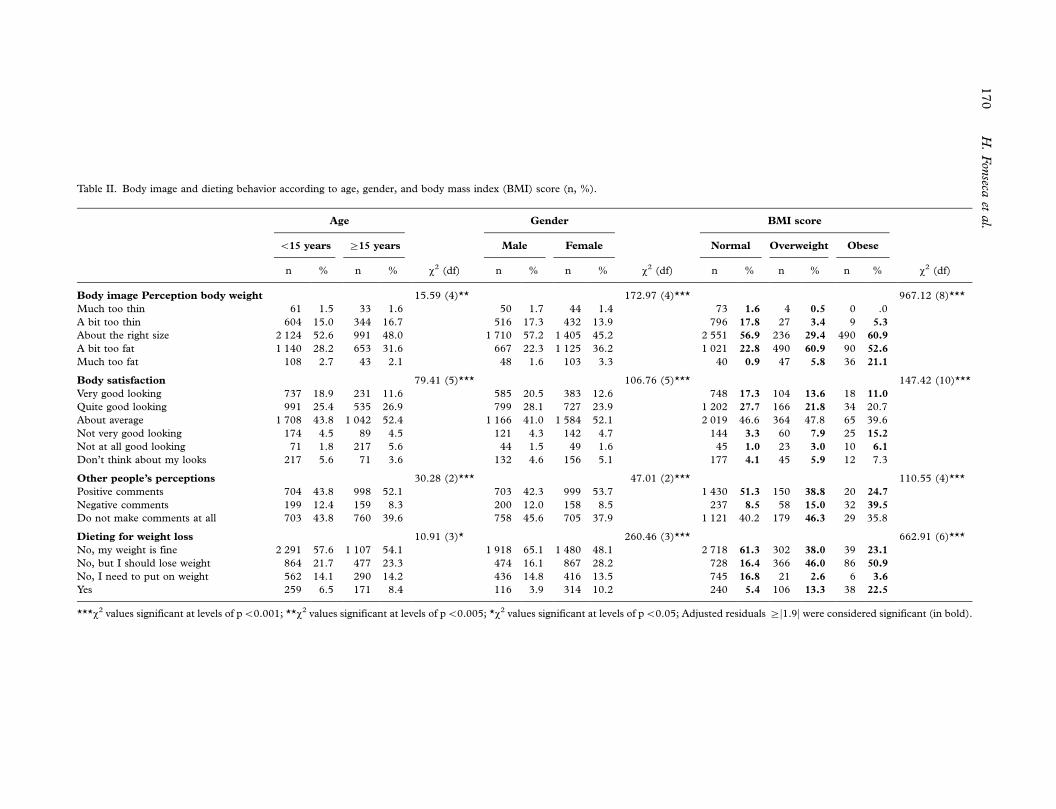
Table II. Body image and dieting behavior according to age, gender, and body mass index (BMI) score (n, %).
Age Gender BMI score
B15 years ]15 years Male Female Normal Overweight Obese
n % n % x2 (df) n % n % x2 (df) n % n % n % x2 (df)
Body image Perception body weight 15.59 (4)** 172.97 (4)*** 967.12 (8)***
Much too thin 61 1.5 33 1.6 50 1.7 44 1.4 73 1.6 4 0.5 0 .0
A bit too thin 604 15.0 344 16.7 516 17.3 432 13.9 796 17.8 27 3.4 9 5.3
About the right size 2 124 52.6 991 48.0 1 710 57.2 1 405 45.2 2 551 56.9 236 29.4 490 60.9
A bit too fat 1 140 28.2 653 31.6 667 22.3 1 125 36.2 1 021 22.8 490 60.9 90 52.6
Much too fat 108 2.7 43 2.1 48 1.6 103 3.3 40 0.9 47 5.8 36 21.1
Body satisfaction 79.41 (5)*** 106.76 (5)*** 147.42 (10)***
Very good looking 737 18.9 231 11.6 585 20.5 383 12.6 748 17.3 104 13.6 18 11.0
Quite good looking 991 25.4 535 26.9 799 28.1 727 23.9 1 202 27.7 166 21.8 34 20.7
About average 1 708 43.8 1 042 52.4 1 166 41.0 1 584 52.1 2 019 46.6 364 47.8 65 39.6
Not very good looking 174 4.5 89 4.5 121 4.3 142 4.7 144 3.3 60 7.9 25 15.2
Not at all good looking 71 1.8 217 5.6 44 1.5 49 1.6 45 1.0 23 3.0 10 6.1
Don’t think about my looks 217 5.6 71 3.6 132 4.6 156 5.1 177 4.1 45 5.9 12 7.3
Other people’s perceptions 30.28 (2)*** 47.01 (2)*** 110.55 (4)***
Positive comments 704 43.8 998 52.1 703 42.3 999 53.7 1 430 51.3 150 38.8 20 24.7
Negative comments 199 12.4 159 8.3 200 12.0 158 8.5 237 8.5 58 15.0 32 39.5
Do not make comments at all 703 43.8 760 39.6 758 45.6 705 37.9 1 121 40.2 179 46.3 29 35.8
Dieting for weight loss 10.91 (3)* 260.46 (3)*** 662.91 (6)***
No, my weight is fine 2 291 57.6 1 107 54.1 1 918 65.1 1 480 48.1 2 718 61.3 302 38.0 39 23.1
No, but I should lose weight 864 21.7 477 23.3 474 16.1 867 28.2 728 16.4 366 46.0 86 50.9
No, I need to put on weight 562 14.1 290 14.2 436 14.8 416 13.5 745 16.8 21 2.6 6 3.6
Yes 259 6.5 171 8.4 116 3.9 314 10.2 240 5.4 106 13.3 38 22.5
***x2 values significant at levels of pB0.001; **x2 values significant at levels of pB0.005; *x2 values significant at levels of pB0.05; Adjusted residuals ]j1.9j were considered significant (in bold).
170
H.
Fon
secaet
al.

non-overweight peers (12.5% vs. 5.2%, and 17.4%
vs. 10.5%, respectively) (Table III).
Alcohol use and abuse. Obese adolescents reported
more regular drinking (drinking alcohol every day
more than once) than their non-overweight peers
(3.6% vs. 1.2%). They also reported having got
drunk more than 10 times, significantly more often
than non-obese teens (5.3% vs. 2.4%) (Table III).
Discussion
Many papers have been published on specific
psychosocial factors associated with obesity in young
people. This paper develops the concepts of the
existing literature, but in doing so, proposes the
concept that obesity is similar to other chronic
conditions of adolescence, especially related to
alcohol use and abuse. The authors did not intend
an in depth study of psychological concepts, but
Table III. Psychosocial and behavioral variables according to body mass index (BMI) score (n, %).
BMI score
Non-overweight Overweight Obese
n % n % n % x2 (df)
Perception of health problem 11.96 (2)**
Yes 464 10.5 93 11.9 31 18.8
No 3952 89.5 690 88.1 134 81.2
Peer group involvement 13.07 (6)*
Very easy 1386 31.2 245 30.8 44 25.9
Easy 2522 56.8 425 53.4 99 58.2
Difficult 442 10.0 101 12.7 22 12.9
Very difficult 90 2.0 25 3.1 5 2.9
Happiness 15.60 (6)*
Very happy 1265 28.9 233 29.5 46 27.9
Happy 2392 54.6 417 52.8 83 50.3
Not very happy 609 13.9 104 13.2 26 15.8
Unhappy 114 2.6 36 4.6 10 6.1
Irritability or bad temper 23.28 (8)**
About every day 226 5.2 54 7.1 21 12.5
More than once a week 598 13.8 115 15.1 22 13.1
About every week 523 12.1 91 12.0 23 13.7
About every month 1024 23.6 159 20.9 31 18.5
Rarely or never 1965 45.3 342 44.9 71 42.3
Nervousness 26.32 (8)**
About every day 457 10.5 97 12.7 29 17.4
More than once a week 693 15.9 122 16.0 22 13.2
About every week 700 16.1 111 14.5 20 12.0
About every month 960 22.1 136 17.8 24 14.4
Rarely or never 1539 35.4 297 38.9 72 43.1
Alcohol use 26.84 (12)*
Never 3419 78.0 638 81.3 135 81.8
Less than once a week 547 12.5 70 8.9 12 7.3
Once a week 233 5.3 31 3.9 8 4.8
2�4 days a week 95 2.2 22 2.8 3 1.8
5�6 days a week 22 .5 6 .8 0 .0
Once a day, everyday 13 .3 5 .6 1 .6
Every day, more than once 53 1.2 13 1.7 6 3.6
Alcohol abuse 18.78 (8)*
Never 3289 74.3 627 78.2 130 76.9
Yes, once 540 12.2 80 10.0 22 13.0
Yes, 2�3 times 350 7.9 54 6.7 7 4.1
Yes, 4�10 times 141 3.2 20 2.5 1 .6
Yes, more than 10 times 104 2.4 21 2.6 9 5.3
**x2 values were significant at levels of pB0.005; *x2 values were significant at levels of pB0.05; Adjusted residuals]j1.9j were considered
significant (in bold).
Are obese adolescents different from their peers? 171

provide evidence on the health-related behaviors of
overweight young people instead.
Results showed that girls, as well as older teens,
were more likely than boys and younger teens to
report dieting for weight loss. They also seem at
increased risk regarding higher body dissatisfaction,
and lower satisfaction with life. In addition, results
suggest that overweight and obesity in adolescence
appear to be associated with increased dieting for
weight loss, poorer body image, and decreased life
satisfaction. Previous studies have already shown
dieting to be a more common behavior among
overweight compared with non-overweight adoles-
cents (20�22). However, the fact that a large
percentage of self-reported overweight and obese
adolescents have reported not being on a diet
because their weight was fine, was more surprising,
and has important clinical implications. Even more
striking was the percentage of non-overweight ado-
lescents reporting being on a diet. There is reason for
concern if non-overweight youth are attempting
weight loss, as the initiation of frequent dieting is a
known risk factor for disordered eating (23).
Our findings are also consistent with previous
research, which provided some evidence that a
variety of adverse psychosocial factors, including
low self-esteem, body dissatisfaction, and depressive
symptoms were more common among overweight
than among non-overweight teens (5,22). In the
same direction, Goodman has shown that depressed
adolescents are at increased risk for the development
and persistence of obesity during adolescence (24).
In the present study, overweight adolescents
reported more difficulty in making new friends
compared with their non-overweight peers. Being
attached and accepted by the peer group is crucial to
young people’s development, and those who are not
socially integrated are far more likely to exhibit
difficulties with their physical and emotional health.
Interaction with friends tends to improve social skills
and strengthen the ability to cope with stressful
events (25). On the contrary, isolation from peers
can lead to feelings of loneliness and poorer emo-
tional health (26). Interestingly, connection with
friends has already been reported as being a protec-
tive factor against extreme weight control behaviors
among boys (27).
According to our results, obese teens described
themselves as having a poorer health status, and
when they were compared with their non-obese
peers, they tended to have significantly lower levels
of emotional well-being measures, and reported
irritability, and feeling nervous, more frequently
than their peers. Both potential social isolation and
lower levels of emotional well-being may be detri-
mental to an optimal healthy development of over-
weight teens.
The current study is relatively unique in examin-
ing the exposure of obese adolescents to alcohol
consumption patterns associated with heightened
risk of injury. Weekly drinking increases substantially
between ages 13 and 15 (28), and alcohol has
already been recognized as the substance most
frequently used by young people with a variety of
chronic conditions (14,15). However, the fact that
obese adolescents both report more regular drinking
and having been drunk more times than their non-
obese counterparts has not yet been described.
A deeper understanding of the social aspects of
growing up and becoming an adult when being
overweight is needed. How does the experience of
being overweight as a teen impact one’s capacity of
engaging in age-appropriate social networks? Are
efforts to develop a robust personal identity affected
by the fact of being obese? Qualitative studies may
help provide some insight into these important
questions.
Strengths and limitations
There are several strengths to the current study,
including the large, representative national sample.
Measuring health through self-reporting in a ques-
tionnaire has both strengths and limitations. Among
the strengths, one should mention the fact of being
standard, enabling comparisons between individuals
and countries, non-invasive, and ensuring anonym-
ity. However, it limits the depth and coverage of
measurements, as compared with qualitative meth-
ods. Moreover, the cross-sectional nature of the
study design does not enable us to draw conclusions
about the direction of causality between overweight
and obesity, and the identified associated adverse
psychosocial factors.
A third limitation is the high percentage (10.8%)
of missing BMI values, which may introduce a
potential bias. The same authors have just examined,
using the same sample, associations between missing
BMI values and a range of demographic,
body image, and emotional well-being variables
(29).
Another limitation might be the fact that socio-
demographic factors have not been taken into
account. Indeed, in the national survey there is a
measure of socio-economic status (father and
mother’s occupation); however, initial bivariate
analysis reported no significant differences accord-
ing to either father or mother’s occupation (16,17),
which might be explained by the fact that more
than half of the Portuguese population have a low
or very low socio-economic status, and is thus
172 H. Fonseca et al.

homogenized. Finally, subjective indicators of
weight and height were used to obtain a BMI
score. Although some authors have suggested that
self-report could lead to a fairly good BMI rating
(30�31), slightly underestimating the proportion of
overweight adolescents, others have questioned the
reliability of this procedure (32�34). A national
validation of the procedure is currently being
carried out by this same team (submitted paper).
Implications and future directions
Some of the adverse psychosocial factors identified
in this study, may help us to be more aware of the
specific well-being concerns and behaviors among
overweight youth. More consistent and comprehen-
sive monitoring of health status, including life
satisfaction, mental health, and risk-taking beha-
viors, would provide stronger evidence for clinical
and preventive efforts that aim to mediate the effect
of obesity on the lives of adolescents. The finding
that overweight and obesity in adolescence appears
to be associated with decreased life satisfaction,
should inform pediatricians and health care planners
about intervention strategies and priorities.
Obesity prevention and treatment efforts might
benefit from addressing the broad spectrum of the
psychosocial implications of being overweight as a
teen, enhancing skill development for behavioral
change, and providing support for dealing with
potentially harmful behaviors, including exposure
to alcohol consumption.
Declaration of interest: The authors report no
conflicts of interest. The authors alone are respon-
sible for the content and writing of the paper.
This manuscript has only been submitted to this
Journal and is not published, in press, or submitted
elsewhere. The research meets the ethical guidelines,
including adherence to the legal requirements of the
study country. All the authors meet the requirements
for authorship.
References
1. Strauss RS, Pollock HA. Epidemic increase in childhood
overweight 1986�1998. JAMA. 1986;/286:/2845�8.
2. Ebbelling CB, Pawlak DB, Ludwig DS. Childhood obesity:
public health crisis common sense cure. Lancet. 2002;/360:/
473�82.
3. Lobstein T, Baur L, Uauy R. Obesity in children and young
people: a crisis in public health. Obes Rev. 2004;/5 (suppl 1):/
4�85.
4. Bogt TF, van Dorsselaer SA, Monshouwer K, Verdurmen JE,
Engels RC, Vollebergh WA. Body mass index and body weight
perception as risk factors for internalizing and externalizing
problem behaviour among adolescents. J Adol Health.
2006;39:27�34.
5. Strauss R, Pollack H. Social marginalization of overweight
children. Arch Pediatr Adolesc Med. 2003;/157:/746�52.
6. Fonseca H, Matos MG. Perception of overweight and obesity
among Portuguese adolescents: an overview of associated
factors. Eur J Pub Health. 2005;/15:/323�8.
7. Schwimmer JB, Burwinckle TM, Varni JW. Health-related
quality of life of severely obese children and adolescents.
JAMA. 2003;/289:/1813�9.
8. French SA, Perry CL, Leon GR, Fulkerson JA. Weight
concerns, dieting behaviour, and smoking initiation among
adolescents: A prospective study. Am J Public Health. 1994;/
84:/1818�20.
9. Strauss RS, Mir HM. Smoking and weight loss attempts in
overweight and normal-weight adolescents. Int J Obes Relat
Metab Disord. 2001;/25:/1381�5.
10. Austin SB, Gortmaker SL. Dieting and smoking initiation in
early adolescent girls and boys: A prospective study. Am J
Public Health. 2001;/91:/446�50.
11. Neumark-Sztainer D, Story M, French SA, Hannan PJ,
Resnick MD, Blum RW. Psychosocial concerns and health-
compromising behaviour among overweight and non-over-
weight adolescents. Obes Res. 1997;/5:/237�49.
12. Neumark-Sztainer D, Hannan PJ. Weight-related behaviors
among adolescent girls and boys. Results from a National
Survey. Arch Pediatr Adolesc Med. 2000;/154:/569�77.
13. Sawyer SM, Drew S, Yeo MS, Britto MT. Adolescents with a
chronic condition: challenges living, challenges treating.
Lancet. 2007;/369:/1481�9.
14. Stern RC, Byard PJ, Tomashefski JF, Doershuk CF. Recrea-
tional use of psychoactive drugs by patients with cystic
fibrosis. J Pediatr. 1987;/111:/293�9.
15. Brito MT, Garrett JM, Dugliss MA, Daeschner CW, Johnson
CA, Leigh MW, Majure JM, Schultz WH, Konrad TR. Risky
behavior in teens with cystic fibrosis or sickle cell disease: a
multicenter study. Pediatrics. 1998;/101:/250�6.
16. Matos M e equipa do Projecto Aventura Social e Saude,
editors. A Saude dos Adolescentes Portugueses (quatro anos
depois). FMH: Lisboa; 2003.
17. Currie C, Robets C, Morgan A, Smith R, Settertobulte W,
Samdal O, et al. Young people’s health in context. Health
Behaviour in School-aged Children (HBSC) study: interna-
tional report from the 2001/2002 survey. Copenhagen: WHO
Regional Office for Europe, 2004.
18. Cole T, Bellizzi M, Flegal K, Dietz W. Establishing a standard
definition for child overweight and obesity worldwide: inter-
national survey. BMJ. 2000;/320:/1240�3.
19. Cantril H. The pattern of human concerns. New Brunswick,
NJ, Rutgers University Press, 1965.
20. Boutelle K, Neumark-Sztainer D, Story M, Resnick M.
Weight control behaviours among obese, overweight, and
nonoverweight adolescents. J Pediatr Psychol. 2002;/27:/
531�40.
21. Mellin AE, Neumark-Sztainer D, Story M, Ireland M,
Resnick M. Unhealthy behaviours and psychosocial difficul-
ties among overweight adolescents: The potential impact of
familial factors. J Adol Health. 2002;/31:/145�53.
22. Story M, Neumark-Sztainer D, Sherwood N, Stang J, Murray
D. Dieting status and its relationship to eating and physical
activity behaviours in a representative sample of US adoles-
cents. J Am Diet Assoc. 1998;/98:/1127�32.
23. Patton GC, Johnson-Sabine E, Wood K. Abnormal eating
attitudes in London schoolgirls: a prospective epidemiological
study: outcome at twelve-months follow-up. Psychol Med.
1990;/20:/383�94.
24. Goodman E, Whitaker RC. A prospective study of the role of
depression in the development and persistence of adolescent
obesity. Pediatrics. 2002;/109:/497�504.
Are obese adolescents different from their peers? 173

25. Berndt TJ. Friendship and friend’s influence in adolescence.
Current Directions in Psychological Science. 1992;1(5):
156�9.
26. Muuss R, Porton H. Adolescent behaviour and society.
Boston, MacGraw-Hill, 1999.
27. Fonseca H, Ireland M, Resnick M. Familial correlates of
extreme weight control behaviours among adolescents. Int J
Eat Disord. 2002;/32:/441�8.
28. Currie C, Gabhainn SN, Godeau E, Roberts C, Smith R,
Currie D, et al. editors. Inequalities in young people’s health.
Health Behaviour in School-aged Children international
report from the 2005/2006 survey. Copenhagen, WHO
Regional Office for Europe, 2008 (Health Policy for Children
and Adolescents, No. 5). http://www.euro.who.int/document/
E91416.pdf. Accessed June 17, 2008.
29. Fonseca H, Matos MG, Guerra A, Gomes-pedro J. Emo-
tional, behavioural and social correlates of missing values for
BMI. Arch Dis Child. 2008 (published online first on
September 18).
30. Davis H, Gergen PJ. The weights and heights of Mexican-
American adolescents: the accuracy of self-reports. Am J
Public Health. 1994;84:459�62.
31. Goodman E, Hinden B, Khandelwal S. Accuracy of teen and
parental reports of obesity and body mass index. Pediatrics.
2000;106:52�8.
32. Elgar FJ, Roberts C, Tudor-Smith C, Moore L. Validity of
self-reported height and weight and predictors of bias in
adolescents. J Adolesc Health. 2005;37:371�5.
33. Wang Z, Patterson CM, Hills AP. A comparison of self-
reported and measured height, weight and BMI in Australian
adolescents. Aust N Z J Public Health. 2002;26:473�8.
34. Tokmakidis SP, Christodoulos AD, Mantzouranis NI. Validity
of self-reported anthropometric values used to assess body
mass index and estimate obesity in Greek school children.
J Adolesc Health. 2007;40:305�10.
174 H. Fonseca et al.