differences in running mechanics between overweight/obese
TRANSCRIPT
South Dakota State University South Dakota State University
Open PRAIRIE: Open Public Research Access Institutional Open PRAIRIE: Open Public Research Access Institutional
Repository and Information Exchange Repository and Information Exchange
Electronic Theses and Dissertations
2016
Differences in Running Mechanics Between Overweight/Obese Differences in Running Mechanics Between Overweight/Obese
and Healthy Weight Children and Healthy Weight Children
Kristen Roles South Dakota State University
Follow this and additional works at: https://openprairie.sdstate.edu/etd
Part of the Nutrition Commons, Sports Sciences Commons, and the Sports Studies Commons
Recommended Citation Recommended Citation Roles, Kristen, "Differences in Running Mechanics Between Overweight/Obese and Healthy Weight Children" (2016). Electronic Theses and Dissertations. 1056. https://openprairie.sdstate.edu/etd/1056
This Thesis - Open Access is brought to you for free and open access by Open PRAIRIE: Open Public Research Access Institutional Repository and Information Exchange. It has been accepted for inclusion in Electronic Theses and Dissertations by an authorized administrator of Open PRAIRIE: Open Public Research Access Institutional Repository and Information Exchange. For more information, please contact [email protected].
DIFFERENCES IN RUNNING MECHANICS BETWEEN OVERWEIGHT/OBESE
AND HEALTHY WEIGHT CHILDREN
BY
KRISTEN ROLES
A thesis submitted in partial fulfillment of the requirements for the
Master of Science
Major in Nutrition and Exercise Science
Specialization in Exercise Science
South Dakota State University
2016
P a g e | iii
ACKNOWLEDGEMENTS
This is for anyone who helped influence me in the biggest or smallest of ways. With
every passing day we encounter a number of people who will change our lives in one way or
another. While the life of a Master’s student is not always glorious, the people who helped me get
to this point have been glorious in their own special ways.
To my grad school friends: you have accepted and embraced me in a way that only a
family could, and through our experience, family is what we have become. You have
become some of the most important people in my life. Thank you for always knowing
when I need a good laugh, and a free cookie!
To my teachers, coaches, and mentors: there once was a time when I did not know if
college was for me. Looking back on my journey, I know that without your endless
encouragement and confidence my life would be completely different in so many ways. I
thank you for always pushing me to my limits and knowing that those limits are much
further than I know.
To Dr. Bowser: It is hard for me to even put into words the influence you have had on me
these past few years. You have exposed me to a whole new world and helped me become
someone that I can be proud of. You have always been someone I can count on and have
helped keep me stable through this process. First, I must thank you for understanding the
right moments of when to push me and when it was too much. Second, thank you for
being more than just an advisor to me academically. You have taught me so many life
lessons and helped me see through the bad in life, even when it felt like my world was
crashing down on me. Lastly, thank you for always believing in me, even when I did not
always believe in myself. I never could have done this without your support.
To my family: Near or far, you have always been there to encourage and support me. You
have always pushed me to follow my dreams, no matter how big or how far away.
Momma, you are my hero and my inspiration. Thank you for being so strong for me and
always showing me endless love. Papa bear, you are my strength. Because of you, I know
I can do or be anyone I want. Thank you for reminding me that life does not have to be
all work, but the fun is what is important too. Sarah, you are my motivation. You have
created such a beautiful family. I strive to have that someday. In the meantime, I will be
the best aunt I can be. Thank you for being the best big sister I could have ever asked for.
Jagger, you are my sanity. Getting you at the start of grad school may not have been the
smartest, but it was the best decision I could have ever made. Even on my worst days,
coming how to a loving puppy was all I could ask for. Thank you for being there to
accept my hugs, give me puppy kisses, and remind me that in the end, life will be just
fine as long as I have my pooch by my side.
Always remember to believe in yourself and dream big.
P a g e | iv
TABLE OF CONTENTS
LIST OF FIGURES .............................................................................................................v
LIST OF TABLES ............................................................................................................. vi
ABSTRACT ...................................................................................................................... vii
LITERATURE REVIEW ..............................................................................................1
CHILDHOOD OBESITY ................................................................................................1
WEIGHT MANAGEMENT ....................................................................................2
CHILDHOOD OBESITY INTO ADULTHOOD ..................................................5
CONSEQUENCES OF CHILDHOOD OBESITY ................................................7
ASSESSMENT OF OBESITY ...............................................................................8
BIOMECHANICAL CONSIDERATIONS .....................................................................9
ASSOCIATED RISKS .........................................................................................10
STATIC AND DYNAMIC SITUATIONS ...........................................................12
JOINT ANGLES AND MOMENTS ....................................................................17
GROUND AND JOINT REACTION FORCES ..................................................21
COLLECTING MOVEMENT DATA OF OBESE PARTICIPANTS ................23
SUMMARY ...................................................................................................................25
INTRODUCTION .............................................................................................................26
METHODS ........................................................................................................................29
RESULTS ..........................................................................................................................33
DISCUSSION ....................................................................................................................35
LIMITATIONS ..................................................................................................................39
FIGURES ...........................................................................................................................40
TABLES ............................................................................................................................43
REFERENCES ..................................................................................................................45
P a g e | v
LIST OF FIGURES
Figure 1: BMI Percentile Growth Chart for Boys ...............................................................9
Figure 2: (a) Normal alignment, (b) Genu Varum, and (c) Genu Valgum ........................12
Figure 3: Normal (Left) versus Slipped Capital Femoral Epiphysis (Right) .....................13
Figure 4: Modified Helen Hayes versus Obesity-Specific Marker Set..............................24
Figure 5: Example of reflective marker set placement ......................................................40
Figure 6: Sagittal (a, b, c) and frontal (d, e, f) plane joint excursion for ankle, knee, and
hip joints throughout stance ................................................................................41
Figure 7: Sagittal (a, b, c) and frontal (d, e, f) plane moments for ankle, knee, and hip
joints throughout stance ......................................................................................42
P a g e | vi
LIST OF TABLES
Table 1: Participant Demographics ....................................................................................43
Table 2: Mean±SD, p-values, and effect sizes (Cohen’s d) for ground reaction force
variables scaled to body weight (BW) for the healthy weight (HW) and
overweight/obese (OV/OB) groups ....................................................................43
Table 3: Mean±SD, p-values, and effect sizes (Cohen’s d) for absolute ground reaction
force variables for the healthy weight (HW) and overweight/obese (OV/OB)
groups ..................................................................................................................44
Table 4: Mean±SD, p-values, and effect sizes (Cohen’s d) for peak joint moments and
angular impulse variables for the HW and OV/OB groups ................................44
P a g e | vii
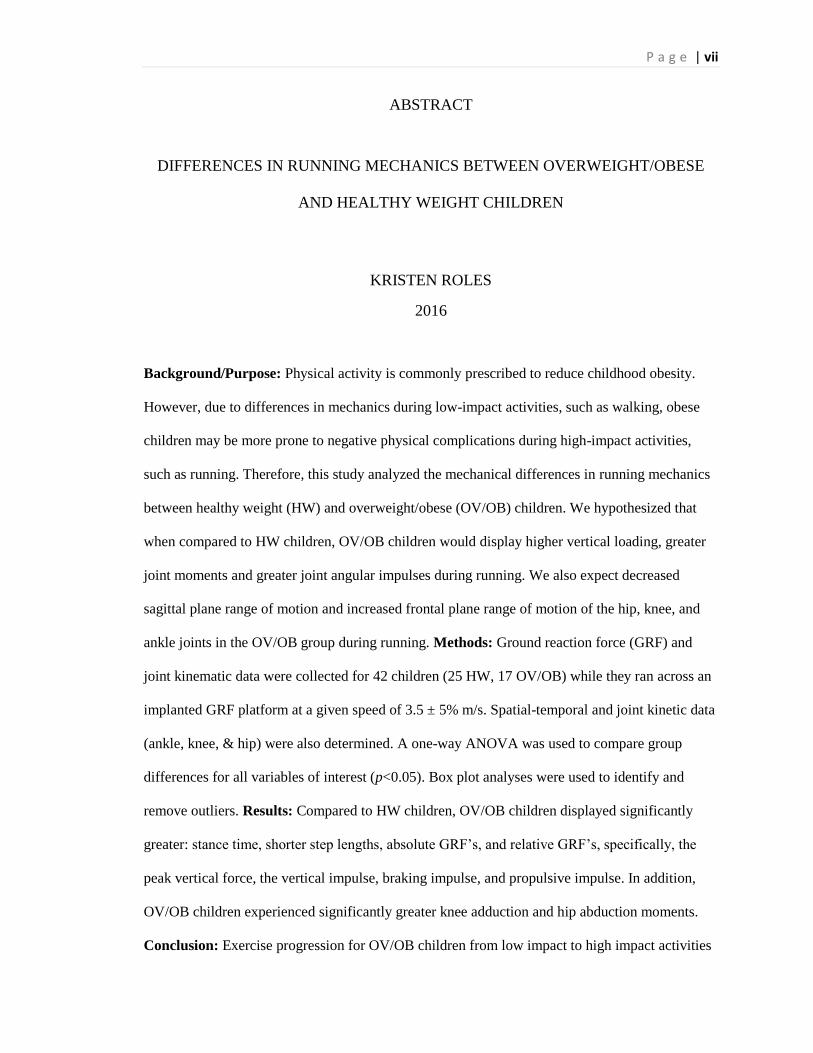
ABSTRACT
DIFFERENCES IN RUNNING MECHANICS BETWEEN OVERWEIGHT/OBESE
AND HEALTHY WEIGHT CHILDREN
KRISTEN ROLES
2016
Background/Purpose: Physical activity is commonly prescribed to reduce childhood obesity.
However, due to differences in mechanics during low-impact activities, such as walking, obese
children may be more prone to negative physical complications during high-impact activities,
such as running. Therefore, this study analyzed the mechanical differences in running mechanics
between healthy weight (HW) and overweight/obese (OV/OB) children. We hypothesized that
when compared to HW children, OV/OB children would display higher vertical loading, greater
joint moments and greater joint angular impulses during running. We also expect decreased
sagittal plane range of motion and increased frontal plane range of motion of the hip, knee, and
ankle joints in the OV/OB group during running. Methods: Ground reaction force (GRF) and
joint kinematic data were collected for 42 children (25 HW, 17 OV/OB) while they ran across an
implanted GRF platform at a given speed of 3.5 ± 5% m/s. Spatial-temporal and joint kinetic data
(ankle, knee, & hip) were also determined. A one-way ANOVA was used to compare group
differences for all variables of interest (p<0.05). Box plot analyses were used to identify and
remove outliers. Results: Compared to HW children, OV/OB children displayed significantly
greater: stance time, shorter step lengths, absolute GRF’s, and relative GRF’s, specifically, the
peak vertical force, the vertical impulse, braking impulse, and propulsive impulse. In addition,
OV/OB children experienced significantly greater knee adduction and hip abduction moments.
Conclusion: Exercise progression for OV/OB children from low impact to high impact activities
P a g e | viii
should be considered when prescribing exercise. This progression could allow the body to adapt
to the increased physical demand over time and decrease the child’s risk of pain or injury.
KEY WORDS:
Joint Kinematics, Joint Kinetics, Ground Reaction Forces, Physical Activity, Injury
P a g e | 1
LITERATURE REVIEW
This literature review looks to capture the findings on the topics of childhood obesity and
biomechanics as it relates to the proposed study. Throughout this review, the reader will obtain a
better understanding of the worldwide growth of obesity, weight management, the progression of
obesity from childhood to adulthood, the consequences of obesity, and how obesity is assessed. In
addition, an overview of the biomechanical considerations are presented. Biomechanical topics
include mechanical development and its effect on the body in static and dynamic situations, joint
angles and moments, ground reaction and joint reaction forces, associated risks, and methods to
collect data for obese participants. This literature review intends to critically analyze the
published information with regards to the proposed topic.
Childhood Obesity
From 1980 to 2010, obesity rates for children 6-11 years of age within the United States
have increased by 11%.1 Similar trends were reported for children 12-19 years of age recording a
13% increase throughout the same time frame.1,2
Spain, the United Kingdom, France, and Greece
have all reported increased childhood obesity rates over the last three decades.3,4
According to the
Organization for Economic Co-operation and Development (OECD), one in five children across
the countries of Brazil, Mexico, and Canada are overweight or obese.5 Similar to the United
States, Greece and Italy’s childhood obesity rates are nearly one in three children.5 While the
findings from Tambalis et al. suggest that childhood obesity levels have plateaued in recent years,
the number of children with excess body weight from adipose tissue remains high.1,6
Not only has
obesity increased the number of individuals suffering from long term health consequences such as
cardiovascular and metabolic diseases, obesity is also associated with an increased risk of
physical consequences including skeletal mal-alignments and joint degenerative diseases.7
P a g e | 2
Understanding obesity and its main causes may help clinicians and health professionals to reduce
childhood obesity rates worldwide.
Research suggests that increasing physical activity, decreasing sedentary time, and
improving diet are among the leading methods in decreasing childhood obesity rates.8-11
Children
who participate in regular physical activity and receive proper nutrition are better suited to reach
full growth and development.11
However, a lack of physical activity and poor eating patterns
makes children more susceptible to increases in body weight.12
Sustaining excess body weight
throughout childhood is associated with risks that can be detrimental to the child’s future. Excess
body weight may limit physical growth and increase their risk of injury and development of
negative health outcomes such as metabolic syndrome.13,14
Understanding the relationship
between these primary factors will help researchers combat childhood obesity by developing
preventative measures and treatments for our youth.15,16
By limiting the negative effects of
obesity, health professionals can help children to reach their full development and reduce the risk
of both injury and negative health consequences.
To fully comprehend the impact of childhood obesity, researchers must evaluate weight
gain and weight loss, the risks of becoming an obese adult, and obesity associated health
consequences. Weight management, particularly weight loss is increasingly important as children
accumulate excess body weight. As children sustain excess body weight, their likelihood of
maintaining that weight into adulthood increases resulting in a greater risk of both physical and
health complications.17
By understanding these consequences, we can help to educate OV/OB
individuals and promote healthier lifestyles. Without proper education children may continue to
add on body weight throughout their lifetime which may reduce their overall quality of life.18
Weight Management
An increase in body mass adiposity can be explained by an increase in caloric
consumption and/or a decrease in caloric expenditure.19-21
Increases in caloric consumption have
been related to increased portion sizes, increased snacking, and reduced consumption of food
P a g e | 3
made from within the home.19,22
Ford et al. found adjusted mean energy intake increases of
1,955 kcal/day from 1971-1975 to 2,195 kcal/day from 2009-2010.21
As food consumption
outside the home increases, individuals are consuming more calories per day with poorer food
quality when compared to food consumption made from within the home. Reducing caloric intake
may be one method to help OV/OB children decrease excess adipose tissue over time.
In addition to increased energy intake, decreased energy expenditure has been reported
due to decreased physical activity participation.19
According to the Center for Disease Control
and Prevention (CDCP), children and adolescents should engage in 60 minutes or more of
physical activity every day.23
Recommended physical activities should include aerobic, muscle-
strengthening, and bone-strengthening exercises with at least three days per week including
vigorous intensity exercise. Aerobic exercise varies by intensity with a brisk walk being a
moderate intensity and running a vigorous intensity.23
Common muscle and bone strengthening
activities such as push-ups, jumping jacks, and body-weight movements assist in muscle and
bone growth that is essential throughout life.23
Promotion of physical activity each day is essential
for the development of strong bones. Regular participation in weight-bearing activities assists in
building and maintaining bone and muscle which is highly important throughout the growing
stages of childhood.23
Approximately 90% of bone mass development occurs during
adolescents.24-26
Bailey et al, found a 9% and 17% increase in total body bone mineral density in
active boys and girls, respectively, compared to their inactive peers.24
Physically inactive children
decrease their odds of developing their bone to optimal growth levels which may make them
more susceptible to injuries during falls, collisions, and/or crashes.27
Unfortunately, many children do not meet physical activity guidelines.28
Research
collected using a self-report survey has shown that fewer than 50% of children reach the
recommended amount of physical activity of at least five days per week for at least 60 minutes.29
Other reports from the CDCP show the percentage not meeting guidelines closer to less than 30%
across the United States. This shows that throughout a child’s day, children are engaging in less
P a g e | 4
physical activity than ever before.30
This decrease in physical activity has been suggested to be a
result of less physical education and recess time, decreased participation in after school activities,
and decreased physical activity at home.30
In addition to physical inactivity, the amount of sedentary time a child accrues daily may
impact their overall energy expenditure. Developed countries such as the United States have
reported increased levels of sedentary time.31
Sedentary time refers to any activity characterized
by an energy expenditure ≤ 1.5 metabolic equivalents, typically in a sitting or reclined position;
excluding sleep.32
Berkey et al. found a significant relationship between increases in Body Mass
Index (BMI) and sedentary time, with sedentary time described as time spent watching television,
playing video games, or time on the computer. 15,33
34
Today, children in the United States have
higher levels of sedentary time than previous generations making sedentary time a major
concern.10,31
Due to these increases, the American Academy of Pediatrics recommends that youth
over two years of age spend no more than two hours each day with screens. Wethington et al,
conducted a study using the 2007 National Survey of Children’s Health data and found overall,
20.8% of 6-11 year olds and 26.1% of 12-17 year olds had excessive screen time (>2 hours per
day).10
In addition, for both age groups, children with a bedroom TV reported significantly
higher screen time at 27.6% compared to children without a bedroom TV at 14.7%.10
Maher et
al, found that high screen time was associated more strongly with obesity than the individual’s
amount of moderate-to-vigorous physical activity.31
The combination of increased BMI and
sedentary time may result in less bone mineral density for obese children resulting in a greater
risk of injury or joint degenerative diseases.35
In addition to physical concerns, increased
sedentary time has shown to produce negative long term health effects such as cardiovascular and
metabolic risk factors.33,36
Recent research indicates that sedentary time is considered as its own
independent risk factor for cardiovascular disease, all-cause mortality, and physiological and
psychological complications.9,36
P a g e | 5
While the primary reasoning for the increase in body mass in the United States remains
undetermined, a combination of increased energy intake and decreased energy expenditure are
key contributors.12
Exercise prescription targeting OV/OB children is important since these
children are already carrying excess adiposity. While in general, obese children have comparative
upper extremity strength when compared with non-obese peers, Riddiford-Harland et al. found
that during weight bearing activities, obese children’s lower limb function was significantly
hindered.37
The impact regular physical activity participation has on children’s vertical load rates
and other gait mechanics remains unclear. While a child’s body undergoes many physical
changes throughout adolescence, participation in regular physical activity has been shown to
increase bone density, which may influence the child’s ability to adapt to increased loading
during common physical activities when compared to a physically inactive child.11,38
If OV/OB
children experience increased load rates during high impact activities, such as running, they may
be increasing their risk of injury and joint degenerative diseases. While the benefits of increased
physical activity outweigh the risks of injury associated with physical activity participation,
exercise prescriptions for OV/OB children must consider the mechanical implications of high
impact exercise while promoting regular physical activity participation.9 Physical activity for
OV/OB children may need to be modified in order to reduce the potential for injuries associated
with increased obesity. 27,39
. Additionally, understanding the implications infrequent participation
in high-impact exercises may have for inactive children regardless of weight status is important.
To reduce obesity rates, focus must be placed on improving dietary habits and increasing
participation in physical activity. Providing OV/OB individuals with the knowledge to make
healthy dietary and exercises choices is essential to the reduction of obesity around the world for
individuals of all ages.29,40
Childhood Obesity into Adulthood
The positive association between childhood and adult obesity is not surprising given BMI
increases are positively associated with increasing age.4,7,17,40,41
Freedman et al. analyzed data
P a g e | 6
from a cross-sectional (n=10,099) and longitudinal (n=2,392) study of children ranging from ages
5 to 17 years (mean age of 11.4 years). Of children with a BMI between the 95th and 98
th
percentile, classified as obese, 84% became obese adults.7 All children with a BMI ≥ 99
th
percentile, classified as morbidly obese, became obese adults.7 After age six, the probability of an
obese child becoming an obese adult surpasses 50%, while non-obese children’s risk is
approximately 10%.17
To prevent obese children from becoming obese adults, additional
measures must be taken to promote healthy living at a young age.
Being an obese adult leads to negative health consequences including risk of
cardiovascular and metabolic diseases.14
At any age, obese and non-obese children are more
likely to become obese adults if even one of their parents is obese.17
Children born to obese
parents are more likely to be obese themselves.17
While an obese child has an increased risk of
becoming an obese adult, health strategies including exercise and diet can reduce these risks, thus
decreasing the prevalence of obesity among children.17
By decreasing the number of obese
children from becoming obese adults, health professionals can limit the chronic negative health
consequences experienced by the individual, therefore improving the overall quality of life of
children.40
In addition to negative health consequences, excess body weight sustained from
childhood into adulthood may increase a child’s risk of suffering from lower extremity injuries
and joint degenerative diseases.35,42,43
Lerner et al., found that during walking, obese children
have increased vertical ground reaction forces on their lower extremities when compared to non-
obese children.44
Increased vertical ground reaction forces are associated with an increased risk of
injury and joint degeneration.45
Depending on the child’s rate of development, their body may not
be able to accommodate the excess mass and therefore may not be able to adapt to the increased
forces.35
Previous research displayed that as body mass increases, the surface area of adjoining
bones does not increase proportionately.35
Without proper adaption of the lower extremity
skeletal structure, a child’s risk of injury and joint degeneration may be increased.46
Preventive
P a g e | 7
measures need to be taken to reduce the increased ground reaction forces experienced by OV/OB
children while decreasing the risk of becoming an obese adult.
Consequences of Childhood Obesity
In addition to injury and the potential risk of developing joint degenerative diseases,
childhood obesity has been reported to lead to a number of acute and chronic negative health
consequences. Evidence suggests that due to obesity, for the first time in over a century, life
expectancies in the United States are anticipated to decrease.11,47
Obese children are more prone
to acute cardiovascular risks such as hypertension and hypercholesterolemia than non-obese
children.7,15,48,49
Data collected from children with a BMI ≥ 95th percentile showed that 70% of
obese children have a minimum of one risk factor for cardiovascular disease.7,50
As expected, the
percentage of obese children suffering from at least one cardiovascular disease risk factor
increased as BMI increased toward the 99th percentile.
7 National data indicates that children
classified as OV/OB are approximately 10 times more likely to have at least two risk factors for
metabolic syndrome than those classified as non-obese.51
Developing strategies to reduce
childhood obesity may lessen these risk factors while increasing life expectancy.
However, as the duration of time spent being obese increases, the risk of susceptibility to
long term health issues increases.27
Chronic effects of childhood obesity have been reported in
association with heart disease, stroke, osteoarthritis, and certain cancers.49,52
Specifically,
vascular fatty streaks, raised lesions in the coronary arteries and aorta, increased left ventricular
mass, and premature mortality are prevalent with obese individuals.7,53
However, OV/OB
children who meet dietary and physical activity guidelines decrease their risk of suffering from
these negative health related issues.54
In addition to a child’s physical health, obesity impacts children in many other aspects of
life. Childhood obesity has been associated with symptoms of depression and reduced self-
esteem.9,55
Research indicates that severity of obesity is positively and negatively correlated to
the child’s level of depression and quality of life respectively.55
Regardless of a child’s mental
P a g e | 8
and weight status, children who meet physical activity guidelines set by the CDCP display
improved academic performance.54,56
Increased physical activity levels have also been shown to
improve children’s overall behavior in and out of the classroom.56
A strong positive association
was found between physical activity and improvements on measures of anxiety and depression
symptoms, dependent on mode of exercise.38,57
Reducing obesity during childhood may help
children to be more confident and successful throughout their lifetime.
As childhood obesity rates remain at an all-time high, strategies must be taken to treat,
inform, and prevent further occurrence of this epidemic. Arguably the most important strategy for
decreasing obesity rates is promoting physical activity. Although physical activity is an important
method used to reduce obesity, considerations must be given to the potential negative
consequences weight bearing activities, such as walking, running, and jumping may be having on
obese children.2,44
If obese children are experiencing increased joint loading during weight
bearing activities, health professionals may need to reevaluate how exercise is prescribed. Proper
reevaluation would include keeping children active through a combination of weight bearing and
non-weight bearing physical activities. Promotion of proper exercise prescription for obese
children is an important step to decreasing obesity rates while maintaining joint health.
Assessment of Obesity
A variety of options are available to determine a child’s body fat composition.
Commonly used methods include the dual-energy x-ray absorptiometry (DEXA), hydrostatic
weighing, bioelectrical impedance, BMI calculations, and skinfolds.58
While DEXA is
considered the gold standard for determining body fat percentage, a commonly used measure
developed by the CDCP incorporates the child’s date of birth, gender, height, and weight to
determine BMI for children specific to their demographics.59
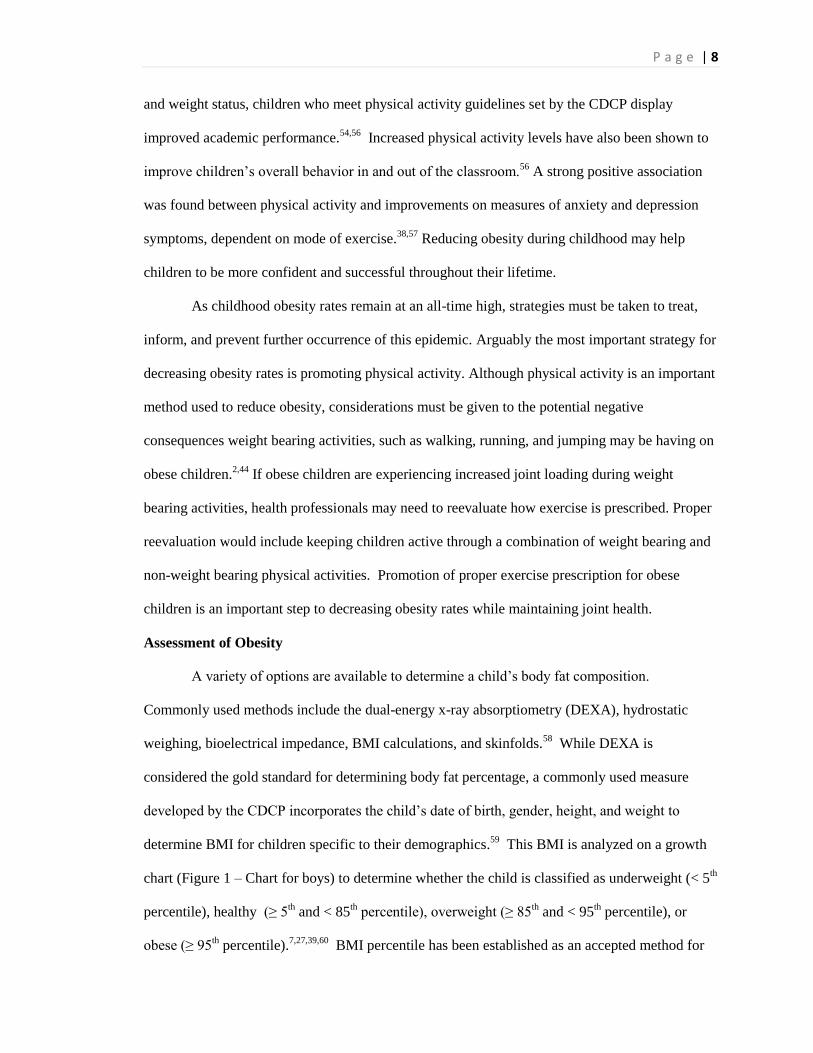
This BMI is analyzed on a growth
chart (Figure 1 – Chart for boys) to determine whether the child is classified as underweight (< 5th
percentile), healthy (≥ 5th and < 85
th percentile), overweight (≥ 85
th and < 95
th percentile), or
obese (≥ 95th percentile).
7,27,39,60 BMI percentile has been established as an accepted method for
P a g e | 9
determining body composition
for ages 2 through 19 years with
validation across many national
and international studies.7,59,61-65
Using BMI percentile is very
important for the 2-19 age group.
Throughout this time frame, a
child’s body can vary greatly,
depending on their maturation
level, thus accounting for age,
height, weight and sex can
provide a more accurate depiction
than using an absolute BMI
would. The BMI percentile
calculator also serves as an
efficient, reliable, and cost-effective Figure 1: BMI Percentile growth chart for boys1
measurement tool for evaluating body composition in children and provides researchers with the
necessary information to correctly categorize children’s BMI. CDCP’s BMI-for-children
calculations are a nationally accepted method that are easily operated and provides researchers
the necessary information to properly group the participants by weight status.
Biomechanical Considerations
While biomechanical analysis of human motion has allowed researchers to increase their
overall knowledge of human movement, research is still lacking regarding the impact obesity has
on the biomechanics of human movement. In 2012, more than one third of Americans were
classified as OV/OB.66
This trend has led to many concerns regarding the impact of obesity on the
P a g e | 10
body during activities of daily living and common physical activities. Some of these concerns
include increased frequency of lower extremity pain, injury, and joint degenerative diseases
experienced by obese individuals.27,67
Developmentally, early childhood (4 to 6 years) to early adolescence (12 years) may be
considered one of the most important developmental stages in life.68
Throughout early childhood
and adolescence, a child’s ability to develop fundamental motor skills is at an optimal level.69
An
important aspect in the progression of these motor skills includes physical activity. Participation
in physical activity helps teach children how to control their movements and how to interact with
their surroundings.70
In addition, participation in physical activities during childhood aids in
increasing bone density, potentially decreasing their risk of bone injury.71
Bonjour et al, found
that a major determinant of risk for fractures was reduced bone accrual during childhood and
adolescents.72
If an obese child is unable to adequately increase bone density, the lower extremity
bone structure may experience increased forces due to excess adiposity.46
The bones and joint
articulations of obese children have been reported to not grow proportionate to the amount of
weight gained.2,73
The increased weight without a proportionate increase in joint surface area will
increase the joint reaction forces occurring during physical activity. Failure to compensate for
these increased forces may result in an increased risk of pain, injury, and joint complications.74
The mechanical implications obesity has on the skeletal framework of a child’s body is
cause for major concern. Commonly experienced complications include increased risk of lower
extremity mal-alignments, slipped capital femoral epiphysis, and increased joint loading during
walking and landing tasks.2,35,75,76
Each of these complications may impact a child’s injury risk,
perception of physical activity, and overall willingness and capability to be physically active.
Associated Risks
Obesity causes many negative physiological and mechanical implications on the body.
Some of these negative effects include increased risk of cardiovascular and metabolic diseases
and development or progression of joint degenerative diseases. Not only is obesity an issue, but
P a g e | 11
the severity of the obesity also becomes a factor. As a child’s BMI increases the risk of
experiencing lower extremity pain or injury increases.27
In addition, as severity of obesity
increased, the risk of experiencing musculoskeletal pain increases.77
Of 135 children, 61%
reported musculoskeletal pain with the highest reported areas being the back (39%), the feet
(26%), and the knees (24%).77
Children who are moderately obese are 25% more likely, and
severely obese are 35% more likely, to experience a lower extremity injury than non-obese
children.27
Similarly, Kessler and colleagues found that overweight, moderately obese, and
extremely obese children were all at an increased risk of fractures to the foot, ankle, and knee
compared to non-obese children at all ages.78
Of these children, all had an increased odds ratio of
foot fractures of 1.14, 1.23, and 1.42, respectively. In addition, at the ankle, knee, and leg their
odds ratio was 1.27, 1.28 and 1.51 respectively. These findings suggest a relationship between
excess adiposity during childhood and risk of musculoskeletal injury.
Osteoarthritis, a degenerative disease of the movable joints, is a major risk factor
associated with obesity; particularly common in the knee and hip joints.74
Felson et al, found the
prevalence of osteoarthritis is dramatically increased in the obese population compared to the
non-obese population for both genders.74
Similarly, Cooper et al, found an increase in BMI is
related to an increased likelihood of suffering from osteoarthritis.79
Women were at a greater risk
than men at each given BMI for developing osteoarthritis.74
Individuals with a BMI > 28 (kg/m2)
were 1.7 times more likely to suffer from hip osteoarthritis compared to those with a BMI < 24.5
(kg/m2).
79 While the odds of an obese individual developing osteoarthritis is significantly higher
than those who are non-obese, their additional risk of injury may put them at an even greater odds
since prior injury also increases the risk.79
The best proven method for reducing the odds of suffering from these risks is decreasing
excess body weight.80
Participation in physical activity is the best method of losing this excess
weight, however exercise prescriptions must consider the loads placed on the body during
different types of exercise. It may be necessary to develop a progression from low- to high-impact
P a g e | 12
exercises to reduce the potential effects of increased vertical loading displayed during some
activities.
Static and Dynamic Situations
Static Situations
Obesity throughout adolescence has been shown to have adverse effects on bone
maturation and alignment.35,81
Overweight children report more orthopedic complaints including
musculoskeletal discomfort and lower-limb mal-alignment when compared to HW.35,42
Mal-
alignments experienced by OV/OB children appear to increase joint instability which may result
in further complications to an already vulnerable area.82
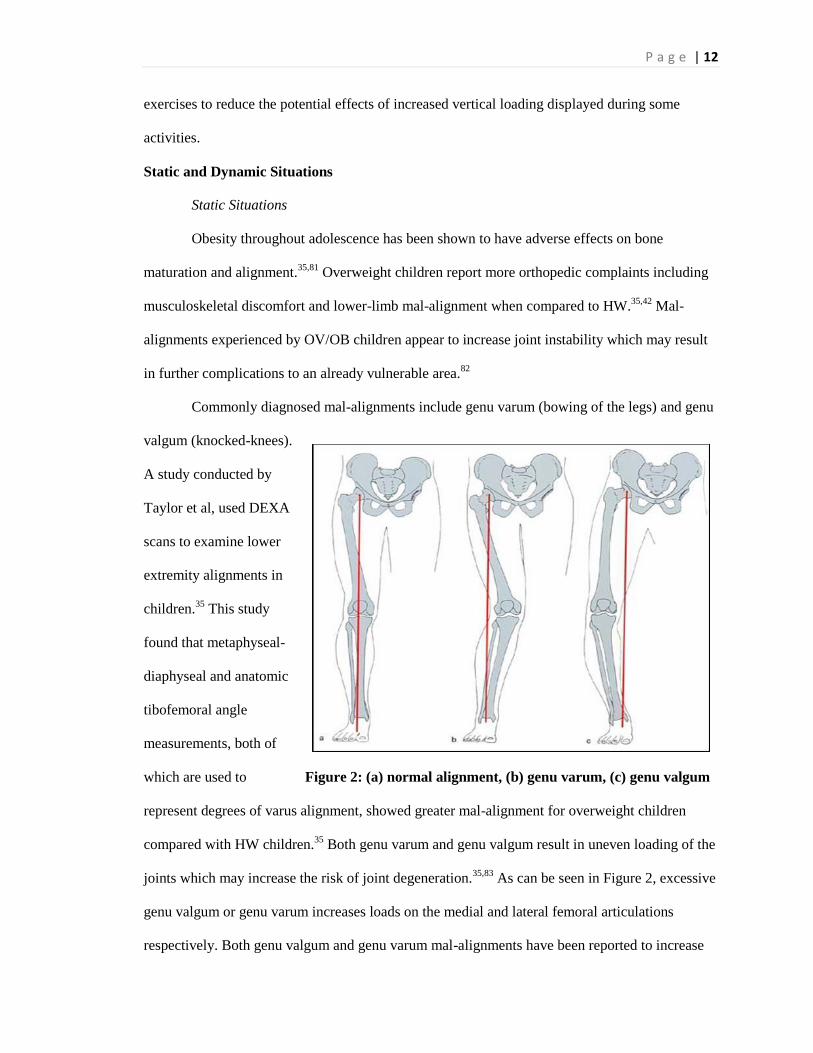
Commonly diagnosed mal-alignments include genu varum (bowing of the legs) and genu
valgum (knocked-knees).
A study conducted by
Taylor et al, used DEXA
scans to examine lower
extremity alignments in
children.35
This study
found that metaphyseal-
diaphyseal and anatomic
tibofemoral angle
measurements, both of
which are used to Figure 2: (a) normal alignment, (b) genu varum, (c) genu valgum
represent degrees of varus alignment, showed greater mal-alignment for overweight children
compared with HW children.35
Both genu varum and genu valgum result in uneven loading of the
joints which may increase the risk of joint degeneration.35,83
As can be seen in Figure 2, excessive
genu valgum or genu varum increases loads on the medial and lateral femoral articulations
respectively. Both genu valgum and genu varum mal-alignments have been reported to increase
P a g e | 13
the risk of developing knee osteoarthritis.83,84
Depending on the severity of the child’s obesity
and of their mal-alignment, immediate steps may need to be taken to correct the mal-alignment.
Pirpiris et al. found a clear association between increased BMI and children requiring surgery for
the treatment of Blount’s disease, a disease causing the lower leg to angle iHWard.85
Failure to
correct a mal-alignment may result in further damage to the lower extremity joints including a
commonly associated effect, osteoarthritis.42,82,86-88
The relationship between adult obesity, mal-alignments and the progression of
osteoarthritis has been well established.43
Schouten et al. found a five-fold increase in the
progression of osteoarthritis for adult patients who suffered from genu varum or genu valgum
throughout childhood.89
Similarly, Messier et al. showed a fourfold increase in knee joint
compressive forces for every pound increase in body weight.84,90
Not only does obesity increase
the likelihood of total joint replacement surgery among younger adults, but it has a clear impact
on the structural development, primarily at the knee, which may hinder the functionality of the
hip.91
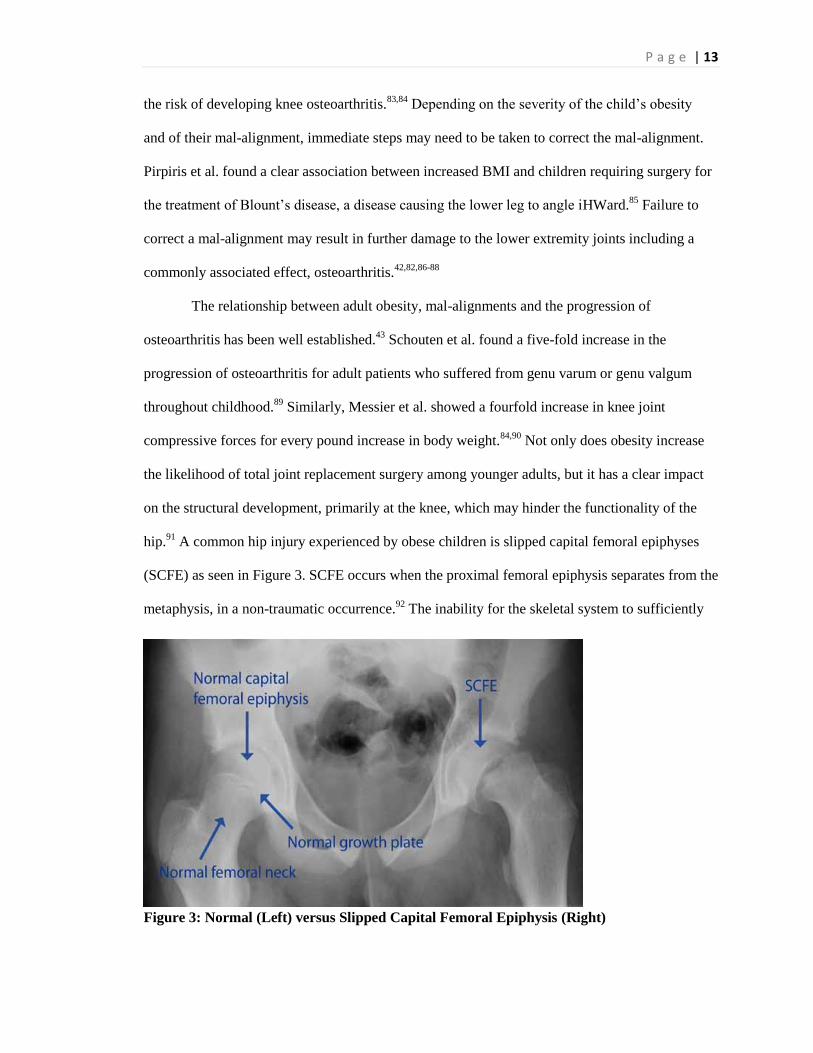
A common hip injury experienced by obese children is slipped capital femoral epiphyses
(SCFE) as seen in Figure 3. SCFE occurs when the proximal femoral epiphysis separates from the
metaphysis, in a non-traumatic occurrence.92
The inability for the skeletal system to sufficiently
Figure 3: Normal (Left) versus Slipped Capital Femoral Epiphysis (Right)
P a g e | 14
adapt to excessive body weight is reported to being the leading causes of SCFE.75,87,93
Manoff et
al., found that of 160 children who had suffered from SCFE, 81.1% of these individuals had a
BMI above the 95th percentile.
94 Furthermore, there appears to be an association between BMI
and the development of bilateral versus unilateral SCFE, with the mean BMI of patients suffering
from bilateral SCFE being significantly greater than that of patients with unilateral SCFE.93
While the main cause of SCFE is unknown, many researchers believe that mal-alignments
commonly found in OV/OB children combined with increased loading during walking and other
movements predispose OV/OB children to the development of SCFE.92
For OV/OB children suffering from a mal-alignment, increased forces on the knee joint
may result in force increases at the hip joint. Force increases at both the knee and hip joint may
result in a higher sensitivity to injury, especially during high-impact activities.94
While reducing a
child’s weight can help lower an OV/OB child’s risk of mal-alignment, if SCFE occurs, surgery
is needed to correct it.94
Undergoing surgery can result in extended periods of non-weight bearing
activity, further hindering bone growth and development.95
The negative effect of poor bone
mineral density during childhood is likely to have lasting effects that may have negative
consequences leading up to and throughout adulthood.24
To reduce the negative implications of obesity related mal-alignments, health
professionals need to consider methods to lessen or eliminate a child’s risk of suffering from a
mal-alignment. First, regular participation in physical activity should be considered to reduce the
child’s weight.
Weight reduction by an OV/OB child may alleviate stress experienced at the lower extremity
joints. While participation in physical activity is important for weight reduction, researchers must
prescribe activities that will protect OV/OB children from further harm. Exercise prescription
should consider a combination of weight bearing activities and non-weight bearing activities,
such as swimming, to reduce the child’s weight. Weight reduction is associated with a decreased
risk of mal-alignments and the negative consequences associated with mal-alignments.43
In
P a g e | 15
addition, preventative measures including brace treatments or surgery could be considered to
limit long term effects. If left untreated a mal-alignment may worsen and could result in increased
pain levels, further disruption to normal gait patterns, and/or deterioration of bone and tissue of
the lower extremities which may limit the child’s ability to participate in activities of daily
living.25
Dynamic Situations
The negative implications of mal-alignments displayed by OV/OB children in static
situations may be exacerbated during dynamic situations. Throughout adolescence, children
participate in walking, running, and many other weight bearing physical activities in various,
infrequent amounts every day.96
Weight-bearing activities such as walking, running, and jumping
help in the development of muscle and bone. These activities assist in the development of bone
mineral density which promotes the ability to perform proper movement techniques.97
However,
when compared to non-obese children, the physical demands of performing weight-bearing
activities by obese children is greater due to their increased mass.98
When an obese child
suffering from a mal-alignment participates in physical activities, there may be substantial
loading unevenly distributed at the knee.99
Uneven loading in addition to increased force due to
the excess mass may significantly increase the child’s risk of pain, injury, and joint degeneration
even in an everyday activity, such as walking.43
For most individuals, walking is an essential part of human movement. Walking can
improve health related risks by increasing physical activity and decreasing sedentary time.
However, the gait of an obese individual appears to differ from that of a non-obese individual.
McGraw et al. found that compared to non-obese prepubertal boys, obese prepubertal boys had
significantly greater dual stance and mediolateral sway areas during gait.100
Increased time in dual
stance may suggest decreased stability by obese individuals, while increased sway areas may be
due to excess adiposity located on the upper leg.100
Obese children also appear to walk more
rigidly, with less knee joint movement, and have a flatter food during ground contact.76,101,102
P a g e | 16
Decreased range of motion and increased rigidity during walking is associated with the force-time
relationship.103
Since the child has limited range of motion, there is limited time for the force to
be applied resulting in increased vertical forces.103
When obese children walk with a reduced
performance, they may be more susceptible to increased pain, injury, and joint degeneration
throughout life.104
Furthermore, the gait of obese adults during walking also appears to be
hindered.105
When compared to non-obese adults, obese adults land with a stiffer leg during self-
selected and given walking speeds.105
Walking with a stiff gait increases the amount of force
placed onto the lower extremities, which can compromise the surrounding bone and tissue.106
If
the bone and tissue surrounding the lower extremity joints is compromised, the person’s risk of
pain, injury, or joint degeneration may be further heightened.
Not only do obese adults display altered walking mechanics, but they are doing so less
efficiently. LaRouche et al. found that obese adults display a 62% greater absolute and 20%
greater relative cost of walking when compared to non-obese adults completing the same task.107
The extraneous work performed may cause obese individuals to fatigue faster than normal which
may worsen their mechanics creating a greater risk of injury.98
The negative implications of
obesity during walking are concerning given that when compared to other physical activities,
such as running and jumping, walking is a relatively low-impact activity.
Regardless of a child’s mass, as physical activity progresses from low-impact, such as
walking, to high-impact, such as jumping, the body will experience greater forces to the body
during impact.2,44
Furthermore, when body mass is accounted for, the total overall impact is even
greater. While jumping has been shown to have many positive effects such as significantly
improving bone density at the hip and lumbar spine in prepubescent children, obese children
appear to land differently than non-obese children.108
During landing, McMillian et al. found that
obese boys exhibited significant sagittal and frontal plane differences compared to non-obese
boys.2 These differences included peak hip adduction moment, timing of peak dorsiflexion and
knee flexion angles, and timing of peak knee extension and abduction moments which may
P a g e | 17
increase their risk for lower extremity injuries when participating in landing activities.2 McKay et
al. found that when comparing a drop jump, counter movement jump, and jumping jack, the drop
jump and counter movement jump performed by healthy children, resulted in 1.5 times more
body weights of force compared to a jumping jack performed by these same children.109
When
compared to obese children, HW children experience less force during low- and high-impact
activities.2 Therefore, it is presumed that if McKay et al.’s study were replicated comparing
obese children, we could anticipate even greater force differences between the different
movements.2 Thus McKay et al.’s findings suggests that if prescribing jumping exercises to obese
children, the best type of jump to incorporate is the jumping jack as it allows the child to obtain
the benefits of muscle and bone growth while reducing the force, thus reducing risk of developing
pain or sustaining an injury.96
While the mechanical differences between obese and non-obese children during walking
and jumping have been reported, there is limited information regarding the impacts of childhood
obesity on running mechanics. Running is a common, vigorous intensity physical activity
participated in by several individuals across the world. While running may be great
physiologically to reduce obesity, there are many mechanical concerns regarding the participation
of running by obese individuals. Increased forces experienced by obese individuals during
walking will likely be further increased during running tasks.44,76
In fact, in healthy individual’s
vertical loading rates experienced during walking increased from approximately 1.2 body weights
of force to 2.5 body weights when running.110
Furthermore, excessive vertical loading during
running is highly associated with several different running injuries including, stress fracture,
iliotibial band syndrome, plantar fasciitis, patella femoral pain syndrome and several others.111
In
order to determine if obese children are at an elevated risk for increased joint loading during
running a thorough investigation of the running mechanics of obese individuals is needed.
Joint Angles and Moments
P a g e | 18
To understand why OV/OB and HW individuals perform dynamic activities differently,
consideration must be given to the lower extremity joint angles and moments. Joint angles
provide researchers with an insight into joint motions occurring during dynamic activities. During
gait, researchers are often interested in the lower extremity joint angles and moments in the
sagittal and frontal plane across stance. An examination of the joint mechanics during the stance
phase of gait helps researchers understand if the movement is occurring correctly or incorrectly,
allowing researchers to pinpoint problem areas. While running mechanics for obese children have
yet to be analyzed, differences between OV/OB and HW children displayed during walking have
provided health professionals insight into some functional limitations and provide a theoretical
framework that can be used to make hypotheses about running mechanics.
Analysis of OV/OB individuals during walking indicates that OV/OB children display
different sagittal movement patterns than HW children. Researchers primarily observe decreased
hip and knee flexion during the stance phase of gait.112
Decreased hip and knee flexion during
gait is typically reported to be due to muscle weakness and/or injury of the hip.113
When
observing the hip during gait, obese adolescents display less hip flexion and significantly lower
hip extension moments than the HW adolescents.114
The reasons for these differences are likely
due to t the excess mass of OV/OB children without the accompanying musculature needed to
compensate.115
If the musculature is unable to compensate OV/OB children may not be able to
reach the optimal amount of flexion during gait, or their muscles may fatigue more quickly
resulting in decreased joint flexion.116
Furthermore, increased hip and knee flexion during stance
is associated with eccentric loading of the knee and hip extensors which would require greater
muscle force and a higher energy expenditure not preferred by OV/OB children.116
Another
reason obese children may land with decreased knee flexion may be due to the excess amount of
adipose tissue surrounding the lower extremity joints.44
Excess adiposity may be limiting the
child’s range of motion thus hindering their ability to achieve a greater degree of hip and/or knee
flexion during the stance phase of gait.44
It is possible that the muscle weakness and/or limited
P a g e | 19
range of motion causing decreased lower extremity flexion during stance, likely results in
increased vertical loading, thus leading to pain, injury, or joint degeneration.77
It stands to reason
that these characteristics will be exacerbated as OV/OB go from walking to a running movement.
Frontal plane hip kinematics have been inconsistent. Some researchers have reported
greater hip abduction angles during walking, which may be a result of increased leg
circumduction or increased pelvic tilt due to hip abductor weakness. However, others report no
differences between obese and non-obese individuals.101
If hip abduction angles are increased
during walking, the obese individual may be trying to compensate for increased adiposity
surrounding the lower extremities. To compensate, obese individuals may adjust their gait to
reduce knee joint loads. This gait adjustment may result in excess forces being unevenly
distributed to the bone and tissues surrounding the lower extremity joints. Excessive force
unevenly distributed could increase the risk of pain, injury, or joint degeneration of the hip for
obese children and adults.25,117
Obesity’s effect on joint kinematics appears to be greatest at the knee. In the sagittal
plane, obese children have lower peak knee flexion angles during initial foot strike and during the
late stance phase of walking compared to non-obese children.101
These findings are consistent
with findings from Ko et al., who reported decreased flexion throughout stance by obese adults
when comparing HW adults.118
In addition to decreased knee flexion, obese children experience
lower knee flexion moments at the knee during foot strike and late stance which may be a method
of compensation for potential weakness of the knee extensors or limited joint range of
motion.101,119
Muscle weakness and range of motion limitations may cause a disruption to normal
gait. This disruption may result in an increased risk of knee instability which could result in a
greater risk of pain or injury. If obese children are unable to produce enough knee flexion during
stance they may increase the amount of loading placed onto the knee joint which is associated
with many overuse running injuries such as, patellofemoral pain syndrome, tibial stress fractures,
and plantar fasciitis.76,120
P a g e | 20
Obese children also display significant differences in frontal plane kinematics at the knee.
Obese children report greater knee abduction during walking. These findings are not surprising
due to their higher susceptibility of mal-alignments.101
In addition, obese children display higher
knee adduction and abduction moments during walking compared to HW children.101
Atypical
gait patterns at the knee may be putting unevenly distributed, excess stress on the joint structures.
As seen with the mal-alignments genu varum and genu valgum, uneven loads are distributed to
one side of the femoral articulations. Repeated stress to these unilateral surface areas is linked to
further knee damage.121
A full understanding of what is occurring at the knee would be incomplete without
having knowledge of what is occurring at the ankle. Research examining the ankle joint angles
and moments of obese participants appear to be inconsistent. Gunther et al. report decreased
plantarflexion angles, greater dorsiflexion angles, greater plantarflexion motion, and higher ankle
moments by obese individuals when compared to non-obese.122
Browning et al. reported no
differences in ankle angles, but did find that obese individuals walked with lower muscle
moments at the ankle.123
Muscle weakness around the ankle joint may be attributed to the gait
variations between obese and non-obese individuals. Browning et al. explains that lower
plantarflexion moments exhibited by obese individuals during the stance phase of walking may
be due to a decreased push-off.123
The variation in findings may be due to differences in age of
participants or speed of the tasks since Browning’s participants were children performing tasks at
a walking speed while Gunther’s participants were adults, performing tasks at a running speed.
Obese children appear to adjust their gait to accommodate for their increases in weight
and/or lack of strength to eccentrically load, thus researchers must still consider the repercussions
of these accommodations. During stance, if an obese child lands with decreased hip, knee, and
ankle-dorsiflexion, they are landing with increased leg stiffness. Landing with increased stiffness
does not allow time for the lower extremity joints to absorb the shock being placed onto those
joint. Consequentially, the lack of shock absorption by the lower extremity joints results in a
P a g e | 21
greater amount of force. Increased force onto the lower extremity joints could lead to pain, injury,
and joint degeneration.
A connection can be made between the lower extremity joint kinematics and an obese
child’s risk of mal-alignment. If a child is adjusting their gait due to excess adiposity, there can be
repeated stressors placed onto the lower extremity joints, leading to a mal-alignment.121
However,
more importantly is the method of weight reduction. If health professionals want to reduce an
OV/OB child’s weight, they must also consider which activities can be performed without having
unintended negative consequences such as excessive joint loading. Correction of gait kinematics
may help OV/OB individuals to properly perform everyday tasks, such as walking while limiting
harm to their body.76
Since walking is considered a relatively low-impact exercise, we can
assume that a high-impact activity, such as running, would cause the findings here to be far more
pronounced.
Ground and Joint Reaction Forces
Mechanical loading during childhood plays a critical role in normal skeletal growth and
development. However, decreased physical activity time and increased sedentary time may
impact a child’s ability to reach full development while increasing their risk of developing
obesity. While Wolff’s Law states that bone will adapt to the loads under which they are placed,
it does not appear that the body of an obese child is able to adjust accordingly. This lack of
adjustment causes an increased amount of force to be placed onto a relatively smaller surface area
resulting in a greater risk of pain or injury. One method to reduce the amount of force placed onto
the surface area is by decreasing leg stiffness. Leg stiffness is described as the mechanical
characteristics of the spring-mass system, so when stiffness is increased the result is a greater
force being placed onto the lower extremities.124
In addition, leg stiffness is associated with the
quantity of muscle activity about each joint.124
By reducing leg stiffness, an OV/OB child may
reduce the loads placed onto their lower extremities which can reduce their risk of injury or joint
degeneration.
P a g e | 22
Another kinetic factor to consider effecting everyday activities is the influence of ground
reaction forces, primarily the vertical force. As an individual increases in mass, it is expected that
their vertical force will increase. During walking, obese children have been found to display
increased vertical loading including vertical impact peak and vertical load rates when compared
to non-obese children.2,73
Both obese children and obese adults display similar increases to
vertical loading when walking at a preferred and maximum walking speeds.118
Increased vertical
load rates have been associated with concomitant increases to joint loading at both the knee and
hip joints.122
In addition, increased vertical load rates have been linked to several overuse running
injuries such as, plantar fasciitis and tibial stress syndrome, and to an increased risk for joint
degenerative diseases including the risk and progression osteoarthritis.101,125
In addition to ground reaction forces, joint reaction forces are found using the net inertial
moments and net muscle moments for the two proximal segments surrounding a joint. According
to Newton’s third law, for every action there is always an opposite and equal reaction. Schulz et
al, found that overweight children displayed greater peak joint moments at the hip, knee, and
ankle.101
Specifically, the overweight children had significantly greater hip (flexor, extensor,
abductor, and external rotator), knee (flexor, extensor, abductor, adductor, internal rotator) and
ankle (plantarflexor, inverter, external and internal rotators) moments compared to HW children
during walking.101,121
These findings have been consistent in both self-selected and given walking
speeds.73,101
However, when normalized to body weight, many significant differences for peak
joint moments are eliminated which emphasizes the impact of excess mass on absolute joint force
during walking.101
Devita and Hortobagyi,’03 found that when scaled for body weight, knee joint
torque was significantly lower (46%), but ankle torque was significantly higher (89%) in the
obese group compared with the non-obese group during walking at a given speed. This may be
explained by an compensatory response by lower extremity joints when one joint has increased
localized force on it.126
Changes seen by obese children give researchers reason to believe that
BMI increases raise the risk of suffering from pain in the lower extremities77
. This increased
P a g e | 23
force and/or loading on obese children’s joints may leave them at a higher risk of lower extremity
injuries and joint degeneration27
.
Both ground reaction force and joint reaction force data have been fairly consistent when
comparing obese and non-obese participants, however joint power data has been conflicting.
DeVita et al, found no differences in joint power between obese and non-obese adults at a given
walking speed.127
Interestingly, at self-selected walking speeds obese adults displayed less knee
joint power.127
MeaHWhile, Shultz et al, found significant differences between obese and non-
obese children during walking for all power phases in the sagittal plane, hip and knee power
weight acceptance and hip power at propulsion in the frontal plane, and knee power during mid-
stance in the transverse plane.101
Larger joint powers in obese children would increase difficulty
in performing activities of daily living and may decrease willingness to exercise.101
If an OV/OB
child is producing greater force during running, they are at risk of experiencing a mal-alignment
and atypical gait which could increase the child’s risk of pain, injury, and/or joint degeneration.
Further research must be collected to determine the true impacts of obesity on lower extremity
joint power.
Collecting movement data of obese participants
Among the most important decisions in developing the methodology is determining
which marker set to use to best capture the motion of obese individuals. Due to the large amount
of subcutaneous adipose tissue on obese individuals, some marker set options could provide
inaccurate results due to increased movement artifact. Lerner et al, compared the Helen Hayes
marker set to an obesity-specific marker set as seen in Figure 4, which incorporated additional
lower extremity markers including: medial femoral epicondyle, medial malleoli, and metatarsal 1
and 5 markers, as well as, sacral, thigh, and shank cluster markers. In addition, a spring-loaded
digitized pointer was used to digitally mark the anterior superior iliac spines and iliac crests.
Analysis of the obesity-specific marker set demonstrated the ability to replicate results from the
modified Helen Hayes when no statistical differences were found for non-obese participants
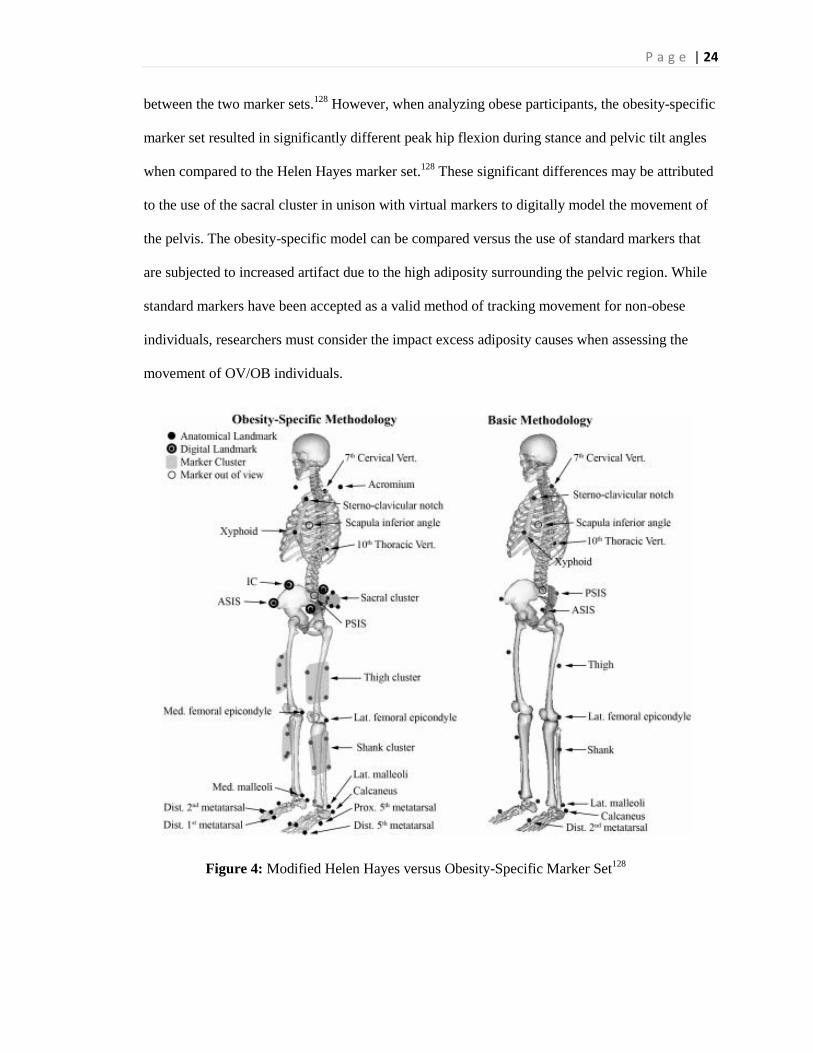
P a g e | 24
between the two marker sets.128
However, when analyzing obese participants, the obesity-specific
marker set resulted in significantly different peak hip flexion during stance and pelvic tilt angles
when compared to the Helen Hayes marker set.128
These significant differences may be attributed
to the use of the sacral cluster in unison with virtual markers to digitally model the movement of
the pelvis. The obesity-specific model can be compared versus the use of standard markers that
are subjected to increased artifact due to the high adiposity surrounding the pelvic region. While
standard markers have been accepted as a valid method of tracking movement for non-obese
individuals, researchers must consider the impact excess adiposity causes when assessing the
movement of OV/OB individuals.
...............................Figure 4: Modified Helen Hayes versus Obesity-Specific Marker Set128
P a g e | 25
Summary
Childhood obesity has rapidly progressed worldwide in the last three decades. 8,129,1,3,4,66
Physical activity is a key target for preventing and treating childhood obesity. Guidelines
provided by the CDCP recommend children engage in 60 minutes or more of physical activity
every day including aerobic, muscle-strengthening, and bone-strengthening with at least three
days per week of vigorous intensity aerobic exercise.23
However, commonly prescribed aerobic
activities such as running and jumping are considered high-impact activities. Pilot data has shown
that during running, obese children display increased leg stiffness, increased vertical loading, and
decreased lower extremity joint flexion. Activities of high-impact may cause harm to obese
children by increasing the forces placed onto the lower extremities resulting in a greater risk of
injuries and joint degeneration.60
In addition, obese adults have been shown to display less flexion
of the lower extremities and greater vertical forces during both walking and running tasks. While
it is likely that differences in running mechanics between OV/OB children and non OV/OB
children will result in similar findings to those found for the walking movement, research
conducted analyzing the obese children’s running mechanics is scarce. To our knowledge no
research has been completed analyzing the kinetic and kinematic variables of running between
obese and non-obese children.
In order to decrease childhood obesity rates we must get children involved in regular
physical activity. However, further research must be completed to fully understand the
implications high-impact exercises such as running and jumping may have on obese children’s
bodies. Understanding these variations may allow health professionals to individualize exercise
prescription for obese children which may decrease risk of injury, joint degeneration, and other
lower extremities complications. Improving the knowledge on obese children’s mechanics may
provide parents, educators, and researchers the proper insight to improve obese children’s quality
of life now and into the future.
P a g e | 26
INTRODUCTION
Within the United States, approximately one in three children is currently classified as
overweight or obese (OV/OB).19,129
To combat against obesity, the Center for Disease Control
and Prevention (CDCP) has suggested that children participate in a minimum of 60 minutes of
aerobic exercise per day.23
Regular participation in physical activity throughout a childhood is not
only important to reduce obesity, but also enables bone and muscle growth.130
While the
physiological benefits of increasing physical activity have shown positive results, evidence is
lacking regarding the mechanical loads placed on the body of an OV/OB child during many
physical activities recommended by the CDCP.131
During physical development children undergo a variety of changes including rapid
skeletal growth and muscle maturation.132
During this phase of rapid change, obese children
display different movement mechanics than non-obese children. During walking, these
differences include slower self-selected walking speeds and greater time spent in double
support.76,121
In addition, obese children walk with a more rigid posture, displaying less flexion at
the hip and knee.76
Decreases in range of motion at the hip and knee joints during gait are often
associated with increased vertical loading and leg stiffness. Stevens et al., reported increased
vertical load rates for obese children during walking when compared to non-obese children.83
In
addition, Hills and colleagues reported similar findings showing that obese children are exposed
to considerably high loads with joint reaction forces of approximately three to five times their
body weight during walking.103,119
Increased vertical loading displayed by obese children may
explain the significant association between childhood obesity and lower extremity injuries,
including the common injury, slipped capital femoral epiphysis.92
Although mechanical loading is necessary for proper bone growth and muscle
development in children, excessive loading may lead to joint injuries or joint degenerative
diseases. Research indicates that as body mass excessively increases, joint surface area does not
increase proportionally.35
Subsequently, the increased weight is distributed over a relatively
P a g e | 27
smaller surface area resulting in greater joint reaction forces to the lower extremity joints.101
The
additional joint stress has been suggested to lead to musculoskeletal mal-alignments in obese
children including slipped capital femoral epiphysis and Blount’s disease or tibia vara.35,92
These
mal-alignments combined with increased loading during dynamic activities may lead to joint
degenerative diseases, such as osteoarthritis, later in life. Both unilateral and bilateral knee
osteoarthritis has already been linked to excessive joint loading and mal-alignments in obese
adults.84,106
While obesity has been linked to increased vertical loading during low impact activities,
higher impact activities, such as running, may result in even greater loads acting on the lower
extremity joints. Although running mechanics have yet to be observed in obese children, greater
loading displayed by obese adults has been linked to the development of joint degenerative
diseases, such as osteoarthritis.67
Additionally, increased vertical loading experienced by healthy
runners (26 ± 2 years of age) has been linked to tibial stress syndrome, plantar fasciitis and has
also been suggested to lead to osteoarthritis.133
Considering the similarities in mechanics between
obese adults and obese children during walking, and the higher impacts associated with running
compared to walking, it is likely that obese children will also display increased vertical loading
during running. However, there is currently no known research that examines the running
mechanics of OV/OB children.
Due to the increased injury risk displayed by adult runners experiencing increased
vertical loading and the greater prevalence of knee osteoarthritis in obese adults, it is likely that
obese children will experience increased loading during running. While CDCP guidelines
recommend that children participate in a minimum of 60 minutes of aerobic exercise every day,
these guidelines also suggest participation in vigorous-intensity aerobic exercises, such as
running, a minimum of three days per week. It is undetermined if OV/OB children can safely
participate in high impact activities without increasing their risk of injury or joint degeneration.23
Therefore, the purpose of this study was to determine the mechanical differences between OV/OB
P a g e | 28
and HW children during running. Based on obese children and adult’s commonalities in walking
mechanics, we hypothesized that OV/OB children will display higher vertical loading during
running compared to HW children. Furthermore, we expected joint moments and joint angular
impulses to be higher for the OV/OB children compared to HW children. Lastly, we expected
decreased sagittal plane range of motion and increased frontal plane range of motion of the hip,
knee, and ankle joints in the OV/OB group during running.
Increasing physical activity among children is an essential component of reducing
childhood obesity rates.1 Equally important, is understanding the potential harmful risks of
increased vertical loading during high impact activities. By examining the running mechanics of
OV/OB children, greater insight can be provided on the potential risks that running may have for
these children. Furthermore, teachers, parents and other clinicians would be better equipped in
prescribing appropriate physical activities for OV/OB children that would still meet the CDCP
guidelines for physical activity for children.
P a g e | 29
METHODS
Participants
A Physical Activity Readiness Questionnaire, Injury History Questionnaire, and informed
assent and consent waivers as approved by the Institutional Human Subjects Review Board were
completed by the participant and participant’s guardian prior to participation. All participants had
to be deemed healthy and free of injury during the previous three months to be eligible. An a
priori power analysis using pilot data was used to determine the sample size needed to achieve
statistical significance. Based on the power analysis, 42 participants were needed to adequately
power this study (effect size =0.80, α =0.05, β = 0.20). Forty-two children between 8-12 years of
age were recruited to participate in this study. Participants included 17 OV/OB participants (BMI
≥85th percentile) and 25 HW participants (BMI < 85
th percentile). Participant demographics are
displayed in Table 1.
Instrumentation
Twenty-seven reflective markers and two cluster markers were used to identify
anatomical landmarks of the lower extremities using a modified Helen Hayes marker set.
Inclusion of iliac crest and greater trochanter markers, as well as, thigh and shank clusters were
used to limit artifact for the OV/OB children. Three-dimensional marker coordinates were
collected using an eight camera (Oqus-3) Qualisys motion capture system (Qualisys, Gothenburg,
Sweden) with a sampling frequency of 200 Hz to determine kinematic data. Ground reaction
forces (1000Hz) were collected using an AMTI force platform (AMTI, Newton, MA) embedded
in a 15 m ruHWay. Kinematic and kinetic data were synchronized using Qualisys Track Manager
(Qualisys, Gothenburg, Sweden).
Procedures
Participants underwent a single two hour testing session at a university biomechanics
laboratory. Following assent and consent, the participant’s name, date of birth, and sex was
recorded. Height (m) and weight (lbs) were measured using a stadiometer and AMTI force plate
P a g e | 30
(AMTI, Newton, MA) respectively. Both height and weight were used in calculating Body Mass
Index (BMI) percentile via the CDCP’s BMI percentile calculator which utilizes height, weight,
age, and gender in its calculations.59,134
All participants wore standardized footwear (Nike
Pegasus) to control for the effect of footwear on running mechanics. Participant’s leg length was
measured bilaterally from the anterior superior iliac spine to the medial malleolus. Markers were
placed on the anterior, posterior, and lateral portions of the shoe, lateral and medial malleolus,
midway point of the tibia and fibula located between the knee and ankle, lateral and medial
condyles of the knee, midway point of the femur location between the hip and knee, greater
trochanter, anterior superior iliac spine, superior border of the iliac crest, and lumbosacral section
of the spine (Figure 5). A five minute warm up that included light jogging and stretching was
performed following placement of reflective markers. A static calibration trial was then collected
while the participant stood on a single force platform in the center of the capture volume.
Following static calibration, anatomical markers were removed from the participant leaving only
the tracking markers on the participant during the movement trials. Next, participants ran across a
15 m ruHWay, embedded with a ground reaction force platform, at a given speed of 3.5 ± 5%
m/s. Participants repeated the run 8-10 times with a minimum of one-two minutes of rest between
trials. Trials were excluded and repeated if the participant: a) did not strike the force plate entirely
with their dominant foot, b) ran outside of the accepted speed range during the set speed trials, c)
adjusted their running mechanics based on force plate location, and/or d) sped up or slowed down
while crossing the forceplate. Running speed was monitored using a photocell timing system.
Data Reduction
The CDCP’s BMI percentile calculator was used to determine participant placement into
the OV/OB or HW groups.59
Participants classified ≥ 85th percentile were placed into the OV/OB
group, while participants ≥ 5th and < 85
th percentile were placed into the HW group.
Reflective markers were labeled then digitized using Qualisys Track Manager Software
(Qualisys, Gothenburg, Sweden). The digitized markers were used to calculate joint motion using
P a g e | 31
Visual 3-D (C-Motion, Inc., Germantown, MD). Kinematic data was filtered with a recursive 4th
order Butterworth filter at 5 Hz.135
Kinematic variables of interest included sagittal and frontal
plane joint excursions of the hip, knee and ankle joints. Excursions for early stance were
calculated from foot strike to the peak values for each movement. Total joint excursion was
calculated as the difference between the maximum and minimum joint angles during stance.
Customized software (LabVIEW 8.0; National Instruments, Austin, TX) was used to extract the
variables of interest from the motion files. The average of five trials was used for statistical
comparisons for both self-selected and given speeds.
Ground reaction force data was filtered with a recursive 4th order Butterworth filter with a
cutoff frequency of 50 Hz. Kinetic Variables of interest from the ground reaction force data
during running included vertical impact peak, average vertical load rate, instantaneous vertical
load rate, peak vertical force, and impulse. Ground reaction force variables are reported in both
absolute values as well as values scaled to body weight.
Three-dimensional joint and segment angles were calculated with Visual 3-D software
(C-Motion, Inc., Germantown, MD) using an X, Y, Z Euler angle rotation sequence.120,136
Segment
inertial properties were used to calculate internal joint moments and angular impulse.126,137
Peak
joint moments represents the max load at the joint, whereas angular impulse represents the total
load experienced during stance and was calculated by multiplying the load with the length of
time.138
Joint moments and angular impulses were averaged over 5 trials and scaled to body
weight. All variables of interest were calculated using a customized LabView™
(National
Instruments Corporation, Austin, TX, USA) program.
Statistical Analysis
A one-way ANOVA was used to compare group differences for all variables of interest
(with the exception of gender which a Chi-square test was used) using SPSS software (Version
22.0, IBM® SPSS® Statistics, Chicago, IL, USA). The 5 trials were averaged from each
condition and calculated for each variable. Effect sizes were calculated utilizing Cohen’s d with
P a g e | 32
0.2, 0.5 and 0.8 considered small, medium and large respectively.139
Box plot analyses were used
to identify and remove outliers. The level of significance was set at p < 0.05. Data were presented
as means and standard deviation.
P a g e | 33
RESULTS
Demographics
Participant’s gender, age, height, mass, and BMI percentile can be found in Table 1. The
OV/OB group displayed significantly greater mass (OV/OB=51.86±10.6kg, HW=36.40±7.4kg;
p<0.001) and BMI percentile (OV/OB=23.78±3.1, HW=17.25±1.7; p<0.001) when compared to
the HW group.
Spatial-Temporal Variables
All participants ran between the given speeds of 3.3 and 3.68 m/s (3.5±5%)
(OV/OB=3.47±0.04m/s, HW=3.49±0.04m/s; p=0.21). However, the time spent in stance was
24% longer for the OV/OB group compared to the HW group (OV/OB=0.37±0.13s,
HW=0.29±0.10s; p=0.03). In addition, the OV/OB group displayed significantly shorter step
lengths during running than the HW control group (OV/OB=0.74±0.07m, HW=0.79±0.07m;
p=0.026). Both of these differences were associated with a moderate effect (d=0.73 and 0.72
respectively).
Ground Reaction Forces
Results of the ground reaction force variables scaled to body weight can be found in Table 2.
Children classified as OV/OB displayed significantly greater peak vertical force when compared
to HW children (p=0.001; d=0.86). However, vertical impulse, braking impulse, and propulsive
impulse during the stance phase of running were significantly greater in the OV/OB group
compared to the HW group (p<0.05; d≥0.67). The OV/OB group displayed significantly greater
vertical and horizontal loading when the absolute values of each of the ground reaction force
variables are compared across the two groups. Absolute values of the ground reaction force
variables can be found in Table 3. No other significant group differences were detected for
ground reaction forces (p>0.05).
Joint Kinematics
P a g e | 34
Results of the sagittal and frontal plane joint excursion at the ankle, knee, and hip can be
found in Figure 6. In the sagittal plane the HW group displayed greater knee and hip flexion
excursions when compared to the OV/OB group (p<0.05; d>0.74). In the frontal plane, the HW
group also displayed greater knee adduction excursions compared to the OV/OB group (p=0.029;
d=0.86). However, the OV/OB group displayed significantly greater knee abduction excursions
during early stance and greater ankle eversion excursions than the HW group (p=0.035; d=0.71).
Furthermore, total ankle joint excursion in the frontal plane throughout stance was also
significantly greater in the OV/OB group compared to the HW group (p=0.038; d=0.70). No other
significant group differences were detected for the remaining joint kinematic variables of interest.
Joint Kinetics
Results of the peak joint moments and angular impulses can be found in Table 4. Results
of the sagittal and frontal plane moments at the ankle, knee, and hip can be found in Figure 7.The
results indicate that children who are classified as OV/OB display significantly greater max knee
adduction and hip abduction moments than HW children (p≤0.019; d>0.90). Hip abduction
impulse was also significantly greater in the OV/OB children compared to the HW children
(p<0.001; d=1.40). No other differences in peak moments or angular impulses were detected.
P a g e | 35
DISCUSSION
The purpose of this study was to compare running mechanics between children classified
as OV/OB and children classified as having HW. Based on our results, it is evident that several
kinematic and kinetic differences in running mechanics exist between these two groups of
children.
Spatio-temporal Differences.
Even with both groups running the trials at the same speed, the OV/OB children
displayed shorter step lengths and spent more time in the stance phase compared to the HW group
of children. These findings are consistent with the findings of previous researchers who reported
that obese children take shorter steps and spend more time in double support during walking.119
da Silva-Hamu and colleagues explain that obese participants who walk with shorter step lengths
do so in order to compensate for a reduction in joint range of motion.140
A limited joint range of
motion at the lower extremity joints during running would likely result in shorter step lengths.
Another possible reason for the shorter step lengths would be a reduction in energy expenditure
of the task. If less energy is expended per step when shorter steps are taken, then less muscle
torque is needed to complete each step. Regardless of the amount of energy expended, in order
for the runner to continue moving forward, they must create sufficient impulse on the ground to
propel the body forward. This idea may help to explain the longer stance time. By increasing the
time spent in stance, an OV/OB child would be able to create a larger impulse to the ground
without increasing maximum force. It is possible that the OV/OB children in this study completed
the running trials using shorter steps and spending more time in the stance phase in order to
reduce energy expenditure and to compensate for a reduction in joint range of motion. More
research is needed to definitively determine if this was the case for the OV/OB children in this
study.
Ground Reaction Force Differences
P a g e | 36
The most notable of difference in running mechanics between the OV/OB and HW
children are the absolute values for the ground reaction forces. Since OV/OB children have more
mass than HW children, it would be expected that OV/OB children would display significantly
greater absolute loading than HW children. However, by scaling ground reaction forces to body
weight one makes the assumption that as body mass increases there is a proportionate increase in
bone density, joint surface area and/or muscle mass to accommodate the increased load.
However, researchers have reported that these changes do not occur proportionately.35
In
particular, lower extremity joint surface area has been reported to not increase proportionately to
a child’s body mass suggesting that obese children have smaller joint surface areas relative to
their body weight. Greater absolute force distributed over a similar, or slightly larger joint surface
area, would likely result in greater overall stress at that joint. It is therefore necessary to examine
the absolute values of the ground reaction force variables when comparing OV/OB and MW
children. As expected, the absolute values for the ground reaction force variables were all
significantly greater for the OV/OB children compared to the HW children (Table 3). These data
suggest that the OV/OB children in this study may have disproportionately greater loading at their
joints.
Contrary to what we hypothesized no differences were detected for several of the ground
reaction force variables when scaled to body weight. However, vertical, braking and propulsive
impulses scaled to body weight were significantly greater for the OV/OB children. This was true
even with the peak vertical force being significantly greater for the HW group. While comparing
peak force gives researchers a good idea of how high the force is at a particular portion of stance,
investigating the children’s impulse throughout stance may provide researchers a better idea of
the impacts OV/OB children may be experiencing throughout the entirety of the stance phase of
the run. Subsequently, these data suggest that the OV/OB group require a greater impulse to
move their more massive body. The longer time spent in stance appears to be a major contributor
P a g e | 37
to the larger impulses displayed by the OV/OB children. Furthermore, the greater impulses also
suggest that although peak force is the same or higher in the HW children, the force is being
applied for a longer period of time in the OV/OB children potentially resulting in greater overall
force during the stance phase of running. The higher absolute vertical loading and the larger
impulses (both absolute and scaled to body weight) is further evidence of the greater vertical
loading displayed by the OV/OB children. Increased vertical loading during running has been
associated with several running related injuries including tibial stress fractures, iliotibial band
syndrome and patellofemaoral pain syndrome.111,120
Furthermore, increased vertical loading has
been associated with the development of joint degenerative diseases such as osteoarthritis.
Alternative exercises that have lower vertical loading may need to be recommended for children
classified as OV/OB.
Differences joint kinematics
The adjustments made by OV/OB children may be explained by the significantly
decreased amount of flexion excursion occurring at the knee. In addition, the OV/OB children are
running with significantly less flexion at the knee throughout stance (p=0.026) and at the hip
during early stance (p=0.015) when compared to HW children. The lack of flexion may be due to
a decreased range of motion at the lower extremity joints which may be related to the increased
amount of adiposity. If the children are unable to reach a higher degree of flexion during high
impact activities, such as running, their body may not absorb as much shock as the body of
someone who goes into greater flexion.
Differences in the frontal plane could have even greater implications. OV/OB children’s
significantly greater eversion at the ankle during early stance (p=0.035) and abduction at the knee
(p=0.029) may put the child at risk for greater issues. Given the increased loading experienced by
OV/OB children, if the loading is occurring unevenly at the joint, the child’s risk for lower
extremity mal-alignments may be increased. Furthermore, if a mal-alignment forms due to the
P a g e | 38
increased joint stress the obese child may start experiencing issues at the surrounding joints, such
as the hip, to counteract the uneven stress. This counteracting effect could be why obese children
have a higher prevalence of musculoskeletal problems, including slipped capital femoral
epiphysis.87,92
If a mal-alignment is left uncorrected, the obese child could have negative impacts
throughout life which includes a higher risk of suffering from a joint degenerative disease, such
as osteoarthritis, and/or needing surgery.
Differences in joint kinetics
One of the biggest indicators of the amount of joint loading is the net joint moment.
Greater net moments at a given joint have been associated with increased compressive stress at
that joint. Furthermore, higher than normal frontal plane joint moments at the hip and knee during
running have been linked to overuse running injuries as well as knee osteoarthritis.138,141,142
Both
peak knee adduction moments and peak hip abduction moments were significantly greater in the
OV/OB children compared to HW children. In addition, the OV/OB children also displayed
significantly greater hip abduction angular impulse suggesting that the overall joint loading at the
hip is much greater throughout the entire stance phase. The greater knee adduction moments, hip
abduction moments, and hip abduction angular impulse displayed by the OV/OB group in this
study provides further evidence of increased loading at the hip and knee joints for the OV/OB
children.
Conclusion
Several differences in running mechanics are present between OV/OB and HW children.
Among the most notable are the higher ground reaction forces and frontal plane joint moments
which may result in greater joint loading, mal-alignments, and potential joint pathologies.
Encouraging participation in physical activity is crucial in reducing childhood obesity rates.
Equally as important is prescribing appropriate exercise that do not place a child at an increased
risk for developing other types of injuries or pathologies associated with excessive loading or
P a g e | 39
mal-alignments. Progression from low- to high-impact activities may give the bone and muscle
time to adjust to the loads as they increase, potentially reducing and ideally eliminating the
OV/OB children’s increased risk of pain and injury. Creating a positive association with physical
activity is important at a young age. By reducing a child’s risk of pain and/or injury during
physical activity, we can increase the likelihood that they will enjoy and be willing to engage in
physical activity throughout their life.
LIMITATIONS
A study limitation was the lack of physical activity and sedentary time data from
participants. Since a child’s daily activity or lack thereof, can greatly influence how their body
adapts to daily loading, knowing the child’s activity level could give further insight into how
running, regardless of weight, may impact the lower extremity joints. A second limitation of the
study was the grouping of overweight and obese children into a single category. This grouping
method may be too diverse depending on if the children in the overweight group had a higher or
lower BMI within their given classification. A third limitation was the study did not determine
joint loading of the participants. Without joint loading, researchers cannot definitely say how the
differences in running mechanics between the HW and OV/OB group are influencing the lower
extremity joints. Lastly, the given running speed required by the children may have given an
advantage to the HW group, as these children were able to achieve the speed with more ease than
the OV/OB group was able to do so.
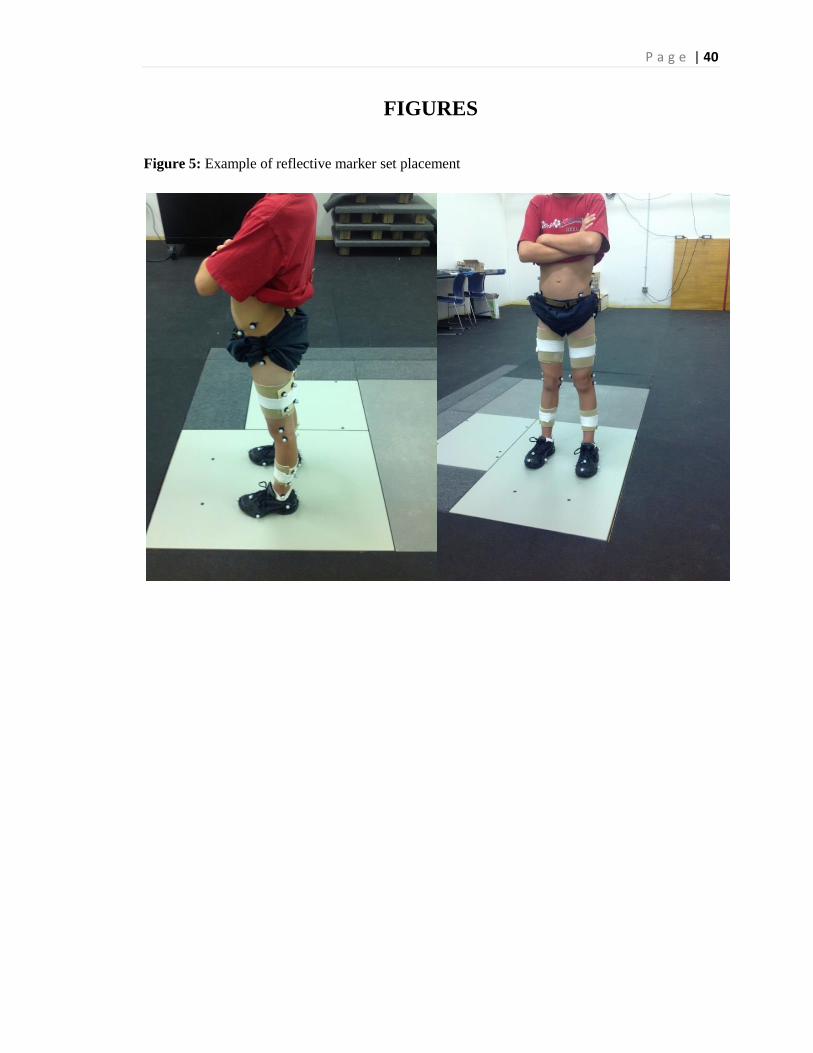
P a g e | 40
FIGURES
Figure 5: Example of reflective marker set placement
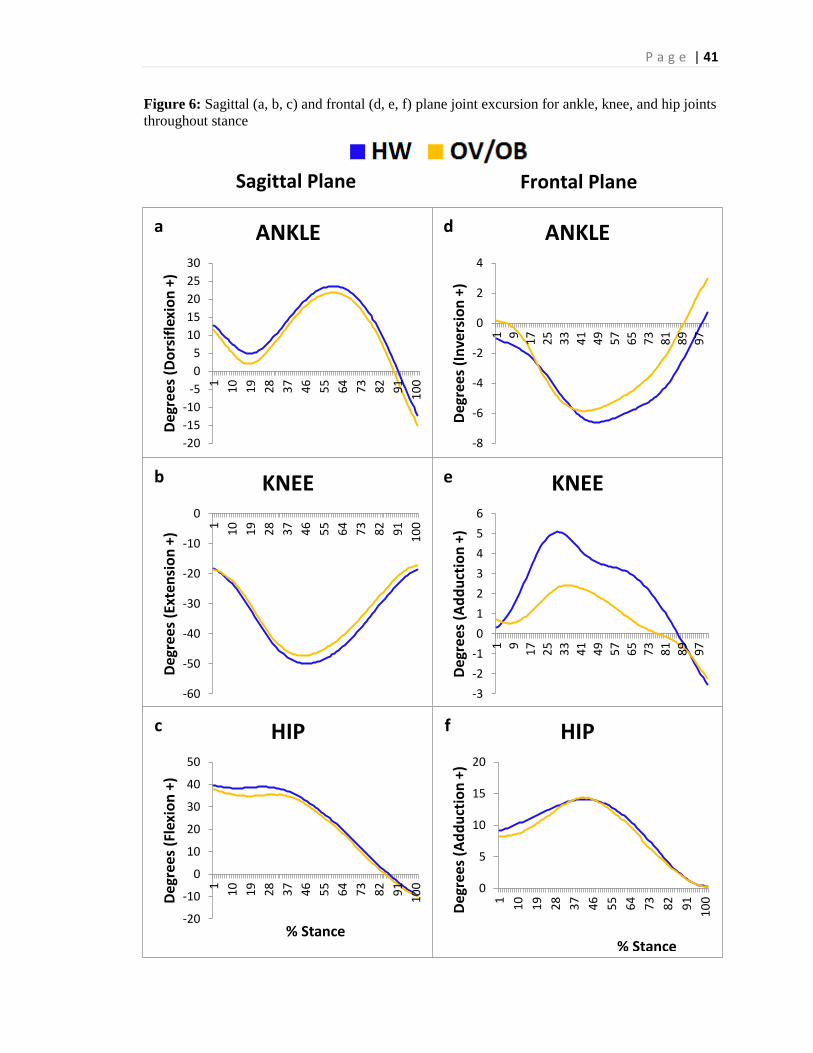
P a g e | 41
Figure 6: Sagittal (a, b, c) and frontal (d, e, f) plane joint excursion for ankle, knee, and hip joints
throughout stance
-20
-15
-10
-5
0
5
10
15
20
25
30
1
10
19
28
37
46
55
64
73
82
91
10
0
Deg
rees
(D
ors
ifle
xio
n +
)
ANKLE
-60
-50
-40
-30
-20
-10
0
1
10
19
28
37
46
55
64
73
82
91
10
0
Deg
rees
(Ex
ten
sio
n +
)
KNEE
-20
-10
0
10
20
30
40
50
1
10
19
28
37
46
55
64
73
82
91
10
0
Deg
rees
(Fl
exio
n +
)
% Stance
HIP
-8
-6
-4
-2
0
2
4
1 9
17
25
33
41
49
57
65
73
81
89
97
Deg
rees
(In
vers
ion
+)
ANKLE
-3
-2
-1
0
1
2
3
4
5
6
1 9
17
25
33
41
49
57
65
73
81
89
97
Deg
rees
(A
dd
uct
ion
+)
KNEE
0
5
10
15
20
1
10
19
28
37
46
55
64
73
82
91
10
0
Deg
rees
(A
dd
uct
ion
+)
HIP
a
.
b
.
c
.
d
.
e
.
f
.
% Stance
Sagittal Plane Frontal Plane
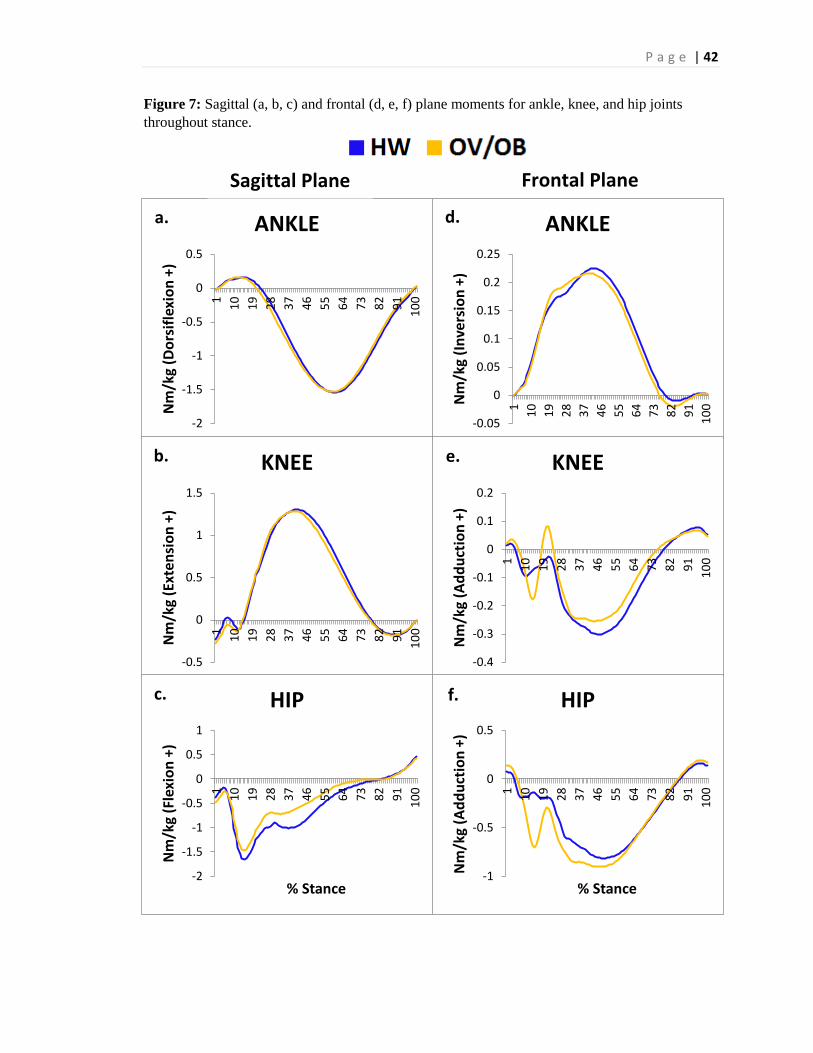
P a g e | 42
Figure 7: Sagittal (a, b, c) and frontal (d, e, f) plane moments for ankle, knee, and hip joints
throughout stance.
-2
-1.5
-1
-0.5
0
0.5
1
10
19
28
37
46
55
64
73
82
91
10
0
Nm
/kg
(Do
rsif
lexi
on
+)
ANKLE
-0.5
0
0.5
1
1.5
1
10
19
28
37
46
55
64
73
82
91
10
0
Nm
/kg
(Ext
ensi
on
+)
KNEE
-2
-1.5
-1
-0.5
0
0.5
1
1
10
19
28
37
46
55
64
73
82
91
10
0
Nm
/kg
(Fle
xio
n +
)
% Stance
HIP
-0.05
0
0.05
0.1
0.15
0.2
0.25
1
10
19
28
37
46
55
64
73
82
91
10
0Nm
/kg
(In
vers
ion
+)
ANKLE
-0.4
-0.3
-0.2
-0.1
0
0.1
0.21
10
19
28
37
46
55
64
73
82
91
10
0
Nm
/kg
(Ad
du
ctio
n +
) KNEE
-1
-0.5
0
0.5
1
10
19
28
37
46
55
64
73
82
91
10
0
Nm
/kg
(Ad
du
ctio
n +
)
% Stance
HIP
a.
b.
c. f.
e.
d.
Sagittal Plane Frontal Plane
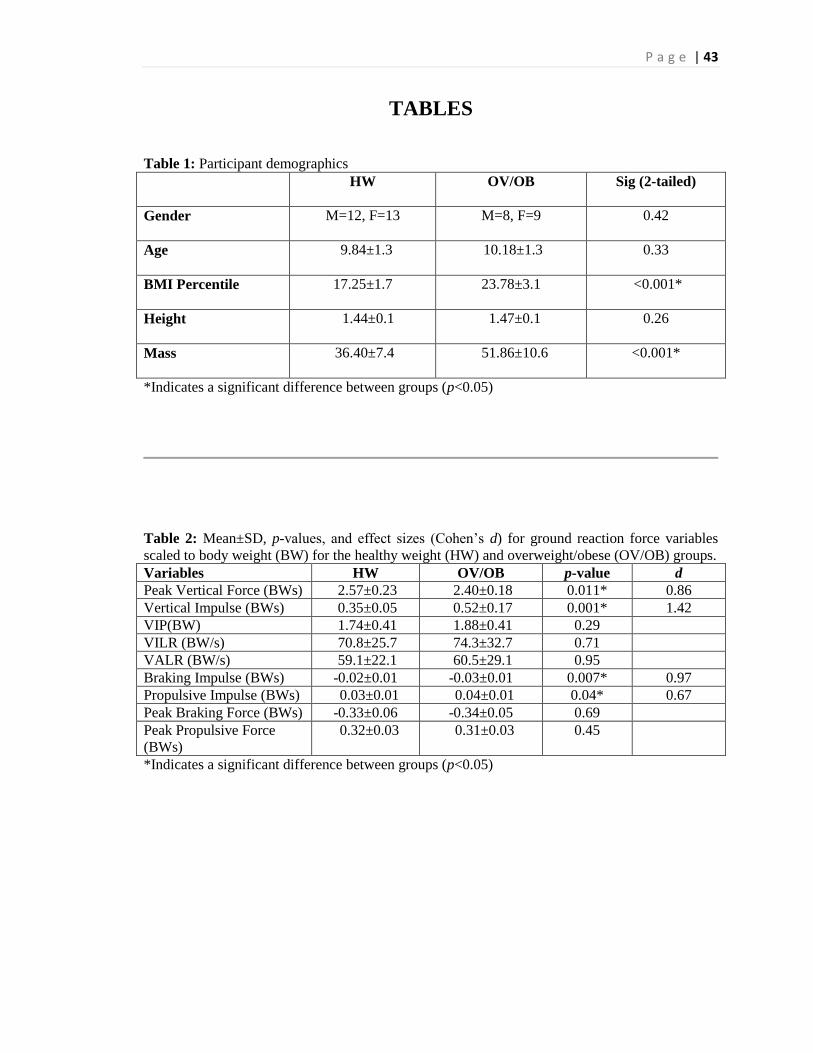
P a g e | 43
TABLES
Table 1: Participant demographics
HW OV/OB Sig (2-tailed)
Gender M=12, F=13 M=8, F=9 0.42
Age 9.84±1.3 10.18±1.3 0.33
BMI Percentile 17.25±1.7 23.78±3.1 <0.001*
Height 1.44±0.1 1.47±0.1 0.26
Mass 36.40±7.4 51.86±10.6 <0.001*
*Indicates a significant difference between groups (p<0.05)
Table 2: Mean±SD, p-values, and effect sizes (Cohen’s d) for ground reaction force variables
scaled to body weight (BW) for the healthy weight (HW) and overweight/obese (OV/OB) groups.
Variables HW OV/OB p-value d
Peak Vertical Force (BWs) 2.57±0.23 2.40±0.18 0.011* 0.86
Vertical Impulse (BWs) 0.35±0.05 0.52±0.17 0.001* 1.42
VIP(BW) 1.74±0.41 1.88±0.41 0.29
VILR (BW/s) 70.8±25.7 74.3±32.7 0.71
VALR (BW/s) 59.1±22.1 60.5±29.1 0.95
Braking Impulse (BWs) -0.02±0.01 -0.03±0.01 0.007* 0.97
Propulsive Impulse (BWs) 0.03±0.01 0.04±0.01 0.04* 0.67
Peak Braking Force (BWs) -0.33±0.06 -0.34±0.05 0.69
Peak Propulsive Force
(BWs)
0.32±0.03 0.31±0.03 0.45
*Indicates a significant difference between groups (p<0.05)
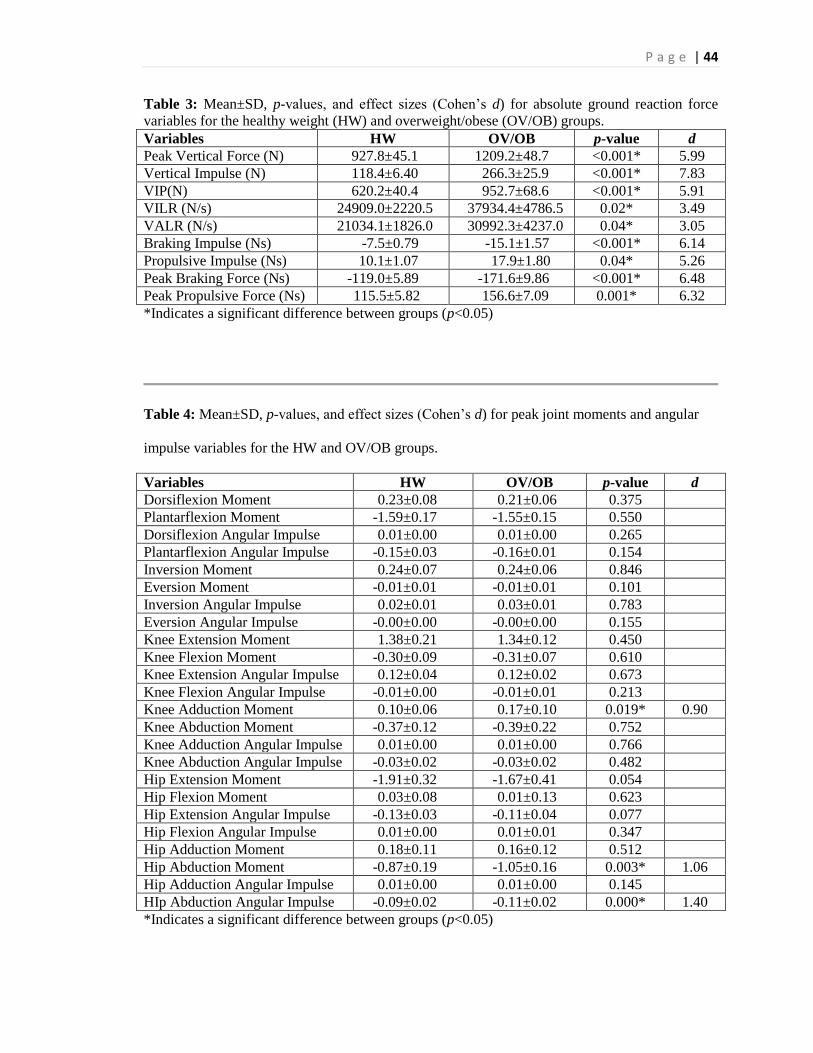
P a g e | 44
Table 3: Mean±SD, p-values, and effect sizes (Cohen’s d) for absolute ground reaction force
variables for the healthy weight (HW) and overweight/obese (OV/OB) groups.
Variables HW OV/OB p-value d
Peak Vertical Force (N) 927.8±45.1 1209.2±48.7 <0.001* 5.99
Vertical Impulse (N) 118.4±6.40 266.3±25.9 <0.001* 7.83
VIP(N) 620.2±40.4 952.7±68.6 <0.001* 5.91
VILR (N/s) 24909.0±2220.5 37934.4±4786.5 0.02* 3.49
VALR (N/s) 21034.1±1826.0 30992.3±4237.0 0.04* 3.05
Braking Impulse (Ns) -7.5±0.79 -15.1±1.57 <0.001* 6.14
Propulsive Impulse (Ns) 10.1±1.07 17.9±1.80 0.04* 5.26
Peak Braking Force (Ns) -119.0±5.89 -171.6±9.86 <0.001* 6.48
Peak Propulsive Force (Ns) 115.5±5.82 156.6±7.09 0.001* 6.32
*Indicates a significant difference between groups (p<0.05)
Table 4: Mean±SD, p-values, and effect sizes (Cohen’s d) for peak joint moments and angular
impulse variables for the HW and OV/OB groups.
Variables HW OV/OB p-value d
Dorsiflexion Moment 0.23±0.08 0.21±0.06 0.375
Plantarflexion Moment -1.59±0.17 -1.55±0.15 0.550
Dorsiflexion Angular Impulse 0.01±0.00 0.01±0.00 0.265
Plantarflexion Angular Impulse -0.15±0.03 -0.16±0.01 0.154
Inversion Moment 0.24±0.07 0.24±0.06 0.846
Eversion Moment -0.01±0.01 -0.01±0.01 0.101
Inversion Angular Impulse 0.02±0.01 0.03±0.01 0.783
Eversion Angular Impulse -0.00±0.00 -0.00±0.00 0.155
Knee Extension Moment 1.38±0.21 1.34±0.12 0.450
Knee Flexion Moment -0.30±0.09 -0.31±0.07 0.610
Knee Extension Angular Impulse 0.12±0.04 0.12±0.02 0.673
Knee Flexion Angular Impulse -0.01±0.00 -0.01±0.01 0.213
Knee Adduction Moment 0.10±0.06 0.17±0.10 0.019* 0.90
Knee Abduction Moment -0.37±0.12 -0.39±0.22 0.752
Knee Adduction Angular Impulse 0.01±0.00 0.01±0.00 0.766
Knee Abduction Angular Impulse -0.03±0.02 -0.03±0.02 0.482
Hip Extension Moment -1.91±0.32 -1.67±0.41 0.054
Hip Flexion Moment 0.03±0.08 0.01±0.13 0.623
Hip Extension Angular Impulse -0.13±0.03 -0.11±0.04 0.077
Hip Flexion Angular Impulse 0.01±0.00 0.01±0.01 0.347
Hip Adduction Moment 0.18±0.11 0.16±0.12 0.512
Hip Abduction Moment -0.87±0.19 -1.05±0.16 0.003* 1.06
Hip Adduction Angular Impulse 0.01±0.00 0.01±0.00 0.145
HIp Abduction Angular Impulse -0.09±0.02 -0.11±0.02 0.000* 1.40
*Indicates a significant difference between groups (p<0.05)
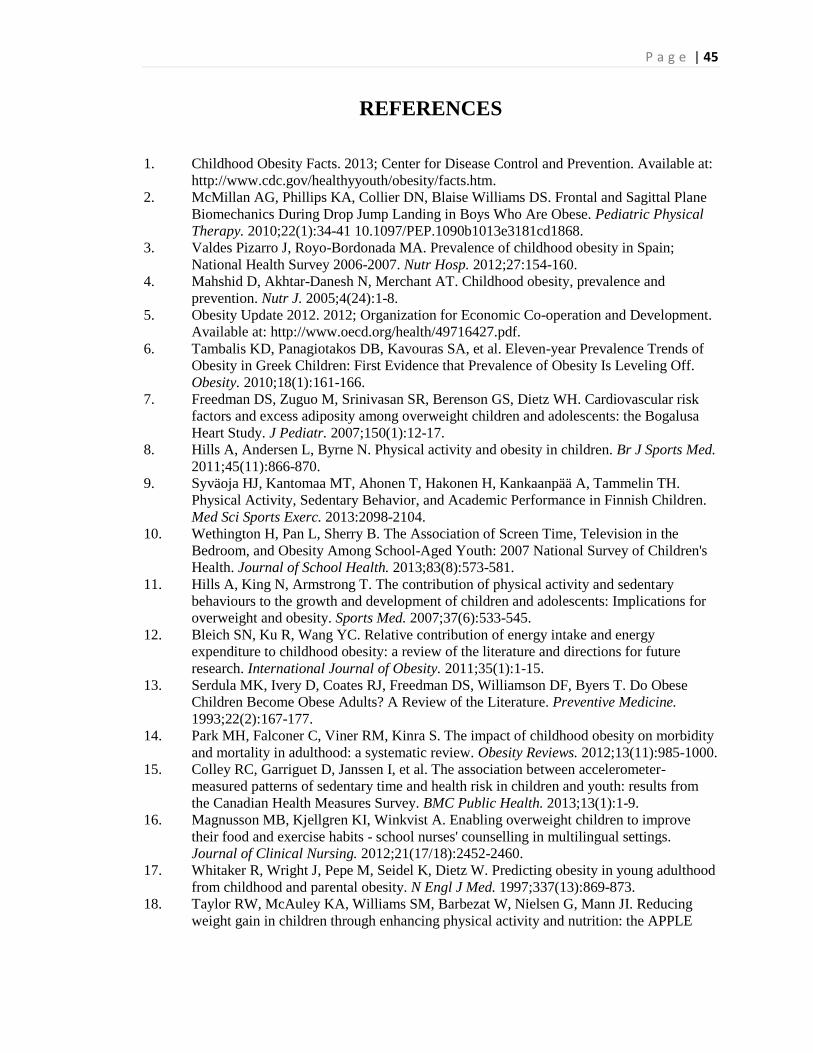
P a g e | 45
REFERENCES
1. Childhood Obesity Facts. 2013; Center for Disease Control and Prevention. Available at:
http://www.cdc.gov/healthyyouth/obesity/facts.htm.
2. McMillan AG, Phillips KA, Collier DN, Blaise Williams DS. Frontal and Sagittal Plane
Biomechanics During Drop Jump Landing in Boys Who Are Obese. Pediatric Physical
Therapy. 2010;22(1):34-41 10.1097/PEP.1090b1013e3181cd1868.
3. Valdes Pizarro J, Royo-Bordonada MA. Prevalence of childhood obesity in Spain;
National Health Survey 2006-2007. Nutr Hosp. 2012;27:154-160.
4. Mahshid D, Akhtar-Danesh N, Merchant AT. Childhood obesity, prevalence and
prevention. Nutr J. 2005;4(24):1-8.
5. Obesity Update 2012. 2012; Organization for Economic Co-operation and Development.
Available at: http://www.oecd.org/health/49716427.pdf.
6. Tambalis KD, Panagiotakos DB, Kavouras SA, et al. Eleven-year Prevalence Trends of
Obesity in Greek Children: First Evidence that Prevalence of Obesity Is Leveling Off.
Obesity. 2010;18(1):161-166.
7. Freedman DS, Zuguo M, Srinivasan SR, Berenson GS, Dietz WH. Cardiovascular risk
factors and excess adiposity among overweight children and adolescents: the Bogalusa
Heart Study. J Pediatr. 2007;150(1):12-17.
8. Hills A, Andersen L, Byrne N. Physical activity and obesity in children. Br J Sports Med.
2011;45(11):866-870.
9. Syväoja HJ, Kantomaa MT, Ahonen T, Hakonen H, Kankaanpää A, Tammelin TH.
Physical Activity, Sedentary Behavior, and Academic Performance in Finnish Children.
Med Sci Sports Exerc. 2013:2098-2104.
10. Wethington H, Pan L, Sherry B. The Association of Screen Time, Television in the
Bedroom, and Obesity Among School-Aged Youth: 2007 National Survey of Children's
Health. Journal of School Health. 2013;83(8):573-581.
11. Hills A, King N, Armstrong T. The contribution of physical activity and sedentary
behaviours to the growth and development of children and adolescents: Implications for
overweight and obesity. Sports Med. 2007;37(6):533-545.
12. Bleich SN, Ku R, Wang YC. Relative contribution of energy intake and energy
expenditure to childhood obesity: a review of the literature and directions for future
research. International Journal of Obesity. 2011;35(1):1-15.
13. Serdula MK, Ivery D, Coates RJ, Freedman DS, Williamson DF, Byers T. Do Obese
Children Become Obese Adults? A Review of the Literature. Preventive Medicine.
1993;22(2):167-177.
14. Park MH, Falconer C, Viner RM, Kinra S. The impact of childhood obesity on morbidity
and mortality in adulthood: a systematic review. Obesity Reviews. 2012;13(11):985-1000.
15. Colley RC, Garriguet D, Janssen I, et al. The association between accelerometer-
measured patterns of sedentary time and health risk in children and youth: results from
the Canadian Health Measures Survey. BMC Public Health. 2013;13(1):1-9.
16. Magnusson MB, Kjellgren KI, Winkvist A. Enabling overweight children to improve
their food and exercise habits - school nurses' counselling in multilingual settings.
Journal of Clinical Nursing. 2012;21(17/18):2452-2460.
17. Whitaker R, Wright J, Pepe M, Seidel K, Dietz W. Predicting obesity in young adulthood
from childhood and parental obesity. N Engl J Med. 1997;337(13):869-873.
18. Taylor RW, McAuley KA, Williams SM, Barbezat W, Nielsen G, Mann JI. Reducing
weight gain in children through enhancing physical activity and nutrition: the APPLE
P a g e | 46
project. International journal of pediatric obesity : IJPO : an official journal of the
International Association for the Study of Obesity. 2006;1(3):146-152.
19. Cutler D, Glaeser E, Shapiro J. Why Have Americans Become More Obese? Journal of
Economic Perspectives. 2003;17(3):93-118.
20. Ebbeling CB, Sinclair KB, Pereira MA, Garcia-Lago E, Feldman HA, Ludwig DS.
Compensation for energy intake from fast food among overweight and lean adolescents.
JAMA. 2004;291(23):2828-2833.
21. Ford ES, Bergmann MM, Boeing H, Li C, Capewell S. Healthy lifestyle behaviors and
all-cause mortality among adults in the United States. Preventive medicine.
2012;55(1):23-27.
22. Paeratakul S, Ferdinand DP, Champagne CM, Ryan DH, Bray GA. Fast-food
consumption among US adults and children: dietary and nutrient intake profile. Journal
of the American Dietetic Association. 2003;103(10):1332-1338.
23. Youth Physical Activity Guidelines Toolkit. 2013; Center for Disease Control and
Prevention. Available at:
http://www.cdc.gov/healthyyouth/physicalactivity/guidelines.htm. Accessed 10/15/2013,
2013.
24. Bailey DA, McKay HA, Mirwald RL, Crocker PRE, Faulkner RA. A Six-Year
Longitudinal Study of the Relationship of Physical Activity to Bone Mineral Accrual in
Growing Children: The University of Saskatchewan Bone Mineral Accrual Study.
Journal of Bone and Mineral Research. 1999;14(10):1672-1679.
25. Seeman E. Structural basis of growth-related gain and age-related loss of bone strength.
Rheumatology. 2008;47:2-8.
26. Twisk JW. Physical activity guidelines for children and adolescents: a critical review.
Sports Med. 2001;31(8):617-627.
27. Adams A, Kessler J, Deramerian K. Associations between childhood obesity and upper
and lower extremity injuries. Inj Prev. 2013;19(3):191-197.
28. 2008 Physical Activity Guidelines for Americans. 2008;
http://www.health.gov/paguidelines/pdf/paguide.pdf.
29. Janssen I, Katzmarzyk PT, Boyce WF, et al. Comparison of overweight and obesity
prevalence in school-aged youth from 34 countries and their relationships with physical
activity and dietary patterns. Obes Rev. 2005;6(2):123-132.
30. Francisco O, Konstabel K, Pasquali E, Ruiz J, al E. Objectively Measured Physical
Activity and Sedentary Time during Childhood, Adolescence and Young Adulthood: A
Cohort Study. 2013;8(4):1-8.
31. Maher C, Olds TS, Eisenmann JC, Dollman J. Screen time is more strongly associated
than physical activity with overweight and obesity in 9- to 16-year-old Australians. Acta
Paediatrica. 2012;101(11):1170-1174.
32. Network SBR. Standardized use of the terms “sedentary” and “sedentary behaviours”.
Appl Physiol Nutr Metab. 2012;37:540-542.
33. Parry S, Straker L. The contribution of office work to sedentary behaviour associated
risk. BMC Public Health. 2013;13(1):1-10.
34. Berkey CS, Rockett HR, Field AE, et al. Activity, dietary intake, and weight changes in a
longitudinal study of preadolescent and adolescent boys and girls. Pediatrics.
2000;105(4):e56-e56.
35. Taylor ED, Theim KR, Mirch MC, et al. Orthopedic complications of overweight in
children and adolescents. Pediatrics. 2006;117(6):2167-2174.
36. Tremblay MS, Leblanc AG, Kho ME, al. E. Systematic review of sedentary behaviour
and health indicators in school-aged children and youth. Int J Behav Nut Phys Act.
2008;9(98).
P a g e | 47
37. Riddiford-Harland DL, Steele JR, Baur LA. Upper and lower limb functionality: are
these compromised in obese children? International Journal of Pediatric Obesity.
2006;1(1):42-49.
38. Strong WB, Malina RM, Blimkie CJR, et al. Evidence Based Physical Activity for
School-age Youth. The Journal of pediatrics. 2005;146(6):732-737.
39. Castetbon K, Andreyeva T. Obesity and motor skills among 4 to 6-year-old children in
the united states: nationally-representative surverys. BMC Pediatr. 2012;12(28):1-9.
40. Parsons TJ, Powers C, Logan S, Summerbell CD. Childhood predictors of adult obesity:
a systematic review. International Journal of Obesity & Related Metabolic Disorders.
1999;23:S1-S107.
41. Craigie AL, Kelly SA, Adamson AJ, Mathers JC. Tracking of obesity-related behavior
from childhood to adulthood: A systematic review. Maturitas. 2011;70(3):266-284.
42. Han JC, Lawlor DA, Kimm S. Childhood Obesity - 2010 Progression and Challenges.
Lancet. 2010;375(9727):1737-1748.
43. Felson DT, Goggins J, Niu J, Zhang Y, Hunter DJ. The effect of body weight on
progression of knee osteoarthritis is dependent on alignment. Arthritis and rheumatism.
2004;50(12):3904-3909.
44. Lerner ZF, Shultz SP, Board WJ, Kung S, Browning RC. Does adiposity affect muscle
function during walking in children? Journal of biomechanics. 2014;47(12):2975-2982.
45. Butler RJ, Crowell III HP, Davis IM. Lower extremity stiffness: implications for
performance and injury. Clinical Biomechanics. 2003;18(6):511-517.
46. Rocher E, Chappard C, Jaffre C, Benhamou CL, Courteix D. Bone mineral density in
prepubertal obese and control children: relation to body weight, lean mass, and fat mass.
Journal of bone and mineral metabolism. 2008;26(1):73-78.
47. Olshansky SJ, Passaro DJ, Hershow RC, et al. A potential decline in life expectancy in
the United States in the 21st century. New England Journal of Medicine.
2005;352(11):1138-1145.
48. Jiménez-Pavón D, Konstabel K, Bergman P, et al. Physical activity and clustered
cardiovascular disease risk factors in young children:a cross-sectional study (the
IDEFICS study). BMC Medicine. 2013;11(1):1-11.
49. Tanha T, Wollmer P, Thorsson O, al E. Lack of physical activity in young children is
related to higher composite risk factor score for cardiovascular disease. Acta Paediatrica.
2011;100:717-721.
50. Adolescent and School Health. 2013; Centers for Disease Control and Prevention.
Available at: http://www.cdc.gov/healthyyouth/obesity/facts.htm. Accessed 11/1/2013.
51. Cook S, Weitzman M, Auinger P, Nguyen M, Dietz WH. Prevalence of a Metabolic
Syndrome Phenotype in Adolescents. Arch Pediatr Adolesc Med. 2003;157:821-827.
52. Must A, Spadano J, Coakley EH, Field AE, Colditz G, Dietz WH. The disease burden
associated with overweight and obesity. Jama. 1999;282(16):1523-1529.
53. Berenson GS, Srinivasan SR, Bao W, Newman WP, Tracy RE, Wattigney WA.
Association between multiple cardiovascular risk factors and atherosclerosis in children
and young adults. New England journal of medicine. 1998;338(23):1650-1656.
54. Davis C, Tomporowski P, McDowell J, et al. Exercise improves executive function and
achievement and alters brain activation in overweight children: a randomized controlled
trial. Health Psychol. 2011;30(1):91-98.
55. Preiss K, Brennan L, Clarke D. A systematic review of variables associated with the
relationship between obesity and depression. Obes Rev. 2013;14(11):906-918.
56. Tompkins CL, Hopkins J, Goddard L, Brock DW. The effect of an unstructured,
moderate to vigorous, before-school physical activity program in elementary school
children on academics, behavior, and health. BMC Public Health. 2012;12(1):300.
P a g e | 48
57. Norris R, Carroll D, Cochrane R. The effects of physical activity and exercise training on
psychological stress and well-being in an adolescent population. J Psychosom Res.
1992;36(1):55-65.
58. Thompson WR. ACSM's Guidelines for Exercise Testing and Prescription. Hubsta Ltd;
2009.
59. Healthy Weight: Assessing Your Weight: BMI: Child and Teen Calculator. Center for
Disease Control and Prevention. Available at: http://apps.nccd.cdc.gov/dnpabmi/.
Accessed October, 17, 2013.
60. Brooke HL, Corder K, Griffin SJ, Ekelund U, van Sluijs EMF. More of the same or a
change of scenery: an observational study of variety and frequency of physical activity in
British children. BMC Public Health. 2013;13(1):1-9.
61. Zuguo M, Grummer-Strawn LM, Pietrobelli A, Goulding A, Goran MI, Dietz WH.
Validity of body mass index compared with other body-composition screening indexes
for the assessment of body fatness in children and adolescents. AM J CLIN NUTR.
2002;75(6):978-985.
62. Kuczmarski RJ, Flegal KM. Criteria for definition of overweight in transition:
background and recommendations for the United States. The American journal of clinical
nutrition. 2000;72(5):1074-1081.
63. Pietrobelli A, Faith MS, Allison DB, Gallagher D, Chiumello G, Heymsfield SB. Body
mass index as a measure of adiposity among children and adolescents: A validation
study. The Journal of pediatrics. 1998;132(2):204-210.
64. Neovius MG, Linne YM, Barkeling BS, Rossner SO. Sensitivity and specificity of
classification systems for fatness in adolescents. Am J Clin Nutr. 2004;80(3):597-603.
65. Reilly J. Diagnostic accuracy of the BMI for age in paediatrics. Int J Obes 2006;30:595-
597.
66. Ogden CL, Carroll MD, Kit BK, Flegal KM. Prevalence of Obesity and Trends in Body
Mass Index Among US Children and Adolescents, 1999-2010. JAMA: Journal of the
American Medical Association. 2012;307(5):483-490.
67. Sharma L, Lou C, Cahue S, Dunlop DD. The mechanism of the effect of obesity in knee
osteoarthritis: the mediating role of malalignment. Arthritis & Rheumatism.
2000;43(3):568-575.
68. Collins AW. Development During Middle Childhood: The Years From Six to Twelve.
Washington DC: National Academy Press1984.
69. Gallahue DL, Ozmun JC, Goodway J. Understanding motor development: Infants,
children, adolescents, adults. Mcgraw-hill Boston; 2006.
70. Okely AD, Booth ML, Patterson JW. Relationship of physical activity to fundamental
movement skills among adolescents. Medicine and science in sports and exercise.
2001;33(11):1899-1904.
71. Okely AD, Booth ML, Chey T. Relationships between body composition and
fundamental movement skills among children and adolescents. Research quarterly for
exercise and sport. 2004;75(3):238-247.
72. Bonjour J, Rizzoli R. Bone acquisition in adolescence. San Diego, CA: Academic Press;
1996.
73. Nantel J, Brochu M, Prince F. Locomotor Strategies in Obese and Non-obese Children.
Obes. 2006;14(10):1789-1794.
74. Felson DT, Anderson JJ, Naimark A, Walker AM, Meenan RF. Obesity and Knee
OsteoarthritisThe Framingham Study. Annals of Internal Medicine. 1988;109(1):18-24.
75. Poussa M, Schlenzka D, Yrjonen T. Body mass index and slipped capital femoral
epiphysis. Journal of pediatric orthopedics. Part B. 2003;12(6):369-371.
76. Hills AP, Parker AW. Gait characteristics of obese children. Archives of physical
medicine and rehabilitation. 1991;72(6):403-407.
P a g e | 49
77. Stovitz SD, Pardee PE, Vazquez G, Duval S, Schwimmer JB. Musculoskeletal pain in
obese children and adolescents. Acta paediatrica (Oslo, Norway : 1992). 2008;97(4):489-
493.
78. Kessler J, Koebnick C, Smith N, Adams A. Childhood Obesity Is Associated With
Increased Risk of Most Lower Extremity Fractures. Clinical Orthopaedics & Related
Research. 2013;471(4):1199-1207.
79. Cooper C, Inskip H, Croft P, et al. Individual risk factors for hip osteoarthritis: obesity,
hip injury, and physical activity. American journal of epidemiology. 1998;147(6):516-
522.
80. Anandacoomarasamy A, Caterson I, Sambrook P, Fransen M, March L. The impact of
obesity on the musculoskeletal system. International journal of obesity (2005).
2008;32(2):211-222.
81. Denzer C, Weibel A, Muche R, Karges B, Sorgo W, Wabitsch M. Pubertal development
in obese children and adolescents. Int J Obes. 2007;31(10):1509-1519.
82. Shultz SP, D'Hondt E, Fink PW, Lenoir M, Hills AP. The effects of pediatric obesity on
dynamic joint malalignment during gait. Clinical Biomechanics. 2014;29(7):835-838.
83. Stevens PM, MacWilliams B, Mohr RA. Gait analysis of stapling for genu valgum.
Journal of pediatric orthopedics. 2004;24(1):70-74.
84. Messier SP. Osteoarthritis of the knee and associated factors of age and obesity: effects
on gait. Med Sci Sports Exerc. 1994;26(12):1446-1452.
85. Pirpiris M, Jackson KR, Farng E, Bowen RE, Otsuka NY. Body mass index and Blount
disease. Journal of Pediatric Orthopaedics. 2006;26(5):659-663.
86. Gordon J, Hughes M, Shepherd K, et al. Obstructive sleep apnoea syndrome in morbidly
obese children with tibia vara. Journal of Bone & Joint Surgery, British Volume.
2006;88(1):100-103.
87. Murray AW, Wilson NI. Changing incidence of slipped capital femoral epiphysis: a
relationship with obesity? The Journal of bone and joint surgery. British volume.
2008;90(1):92-94.
88. Brouwer GM, Tol AWV, Bergink AP, et al. Association between valgus and varus
alignment and the development and progression of radiographic osteoarthritis of the knee.
Arthritis & Rheumatism. 2007;56(4):1204-1211.
89. Schouten J, Van den Ouweland F, Valkenburg H. A 12 year follow up study in the
general population on prognostic factors of cartilage loss in osteoarthritis of the knee.
Annals of the rheumatic diseases. 1992;51(8):932-937.
90. Messier SP, Gutekunst DJ, Davis C, DeVita P. Weight loss reduces knee-joint loads in
overweight and obese older adults with knee osteoarthritis. Arthritis and rheumatism.
2005;52(7):2026-2032.
91. Harms S, Larson R, Sahmoun A, Beal J. Obesity increases the likelihood of total joint
replacement surgery among younger adults. International orthopaedics. 2007;31(1):23-
26.
92. Wabitsch M, Horn M, Esch U, et al. Silent slipped capital femoral epiphysis in
overweight and obese children and adolescents. Eur J Pediatr. 2012;171(10):1461-1465.
93. Bhatia NN, Pirpiris M, Otsuka NY. Body mass index in patients with slipped capital
femoral epiphysis. Journal of pediatric orthopedics. 2006;26(2):197-199.
94. Manoff EM, Banffy MB, Winell JJ. Relationship between Body Mass Index and slipped
capital femoral epiphysis. Journal of pediatric orthopedics. 2005;25(6):744-746.
95. Thawrani DP, Feldman DS, Sala DA. Current Practice in the Management of Slipped
Capital Femoral Epiphysis. Journal of pediatric orthopedics. 2015.
96. Wang L, Lin D, Huang C. Exercise Training in Obese Children and Adolescents: Current
Concepts. 2004;12(3):209-219.
P a g e | 50
97. Gutin B, Owens S, Okuyama T, Riggs S, Ferguson M, Litaker M. Effect of Physical
Training and Its Cessation on Percent Fat and Bone Density of Children with Obesity.
Obesity Research. 1999;7(2):208-214.
98. Maffeis C, Schutz Y, Schena F, Zaffanello M, Pinelli L. Energy expenditure during
walking and running in obese and nonobese prepubertal children. J Pediatr.
1993;123(2):193-199.
99. Hsu RWW, Himeno S, Coventry MB, Chao EY. Normal axial alignment of the lower
extremity and load-bearing distribution at the knee. Clinical Orthopaedics and Related
Research. 1990;255:215-227.
100. McGraw B, McClenaghan BA, Williams HG, Dickerson J, Ward DS. Gait and postural
stability in obese and nonobese prepubertal boys. Archives of physical medicine and
rehabilitation. 2000;81(4):484-489.
101. Shultz SP, Sitler MR, Tierney RT, Hillstrom HJ, Song J. Effects of pediatric obesity on
joint kinematics and kinetics during 2 walking cadences. Archives of physical medicine
and rehabilitation. 2009;90(12):2146-2154.
102. Mickle KJ, Steele JR, Munro BJ. The Feet of Overweight and Obese Young Children:
Are They Flat or Fat? Obesity. 2006;14(11):1949-1953.
103. Nordin M, Frankel V. Basic Biomechanics of the Musculoskeletal System.
Philadelphia1989.
104. Maffels C, Schutz Y, Schena F, Zaffanello M, Pinelli L. Energy expenditure during
walking and running in obese and nonobese prepubertal children. The Journal of
pediatrics. 1993;123(2):193-199.
105. Haight DJ, Lerner ZF, Board WJ, Browning RC. A comparison of slow, uphill and fast,
level walking on lower extremity biomechanics and tibiofemoral joint loading in obese
and nonobese adults. Journal of orthopaedic research : official publication of the
Orthopaedic Research Society. 2014;32(2):324-330.
106. Davis MA, Ettinger WH, Neuhaus JM. Obesity and osteoarthritis of the knee: evidence
from the National Health and Nutrition Examination Survey (NHANES I). Seminars in
arthritis and rheumatism. 1990;20(3 Suppl 1):34-41.
107. LaRoche DP, Marques NR, Shumila HN, Logan CR, St Laurent R, Goncalves M. Excess
Body Weight and Gait Influence Energy Cost of Walking in Older Adults. Med Sci
Sports Exerc. 2014.
108. Fuchs RK, Bauer JJ, Snow CM. Jumping improves hip and lumbar spine bone mass in
prepubescent children: a randomized controlled trial. Journal of bone and mineral
research : the official journal of the American Society for Bone and Mineral Research.
2001;16(1):148-156.
109. McKay HA, Tsang G, Heinonen A, MacKelvie K, Sanderson D, Khan K. Ground
reaction forces associated with an effective elementary school based jumping
intervention. British Journal of Sports 2003;39(1):10-14.
110. Keller TS, Weisberger AM, Ray JL, Hasan SS, Shiavi RG, Spengler DM. Relationship
between vertical ground reaction force and speed during walking, slow jogging, and
running. Clinical Biomechanics.11(5):253-259.
111. Milner CE, Ferber R, Pollard CD, Hamill J, Davis IS. Biomechanical factors associated
with tibial stress fracture in female runners. Medicine and Science in Sports and Exercise.
2006;38(2):323.
112. Devita P, Skelly WA. Effect of landing stiffness on joint kinetics and energetics in the
lower extremity. Med Sci Sports Exerc. 1992;24(1):108-115.
113. Goldberg EJ, Neptune RR. Compensatory strategies during normal walking in response
to muscle weakness and increased hip joint stiffness. Gait & Posture.25(3):360-367.
P a g e | 51
114. McMillan AG, Auman NL, Collier DN, Williams DSB. Frontal plane lower extremity
biomechanics during walking in boys who are overweight versus healthy weight.
Pediatric Physical Therapy. 2009;21(2):187-193.
115. Chan G, Chen CT. Musculoskeletal effects of obesity. Current opinion in pediatrics.
2009;21(1):65-70.
116. Gribble PA, Hertel J. Effect of lower-extremity muscle fatigue on postural control.
Archives of physical medicine and rehabilitation. 2004;85(4):589-592.
117. Browning RC, Kram R. Effects of obesity on the biomechanics of walking at different
speeds. Med Sci Sports Exerc. 2007;39(9):1632-1641.
118. Ko S, Stenholm S, Ferrucci L. Characteristic gait patterns in older adults with obesity—
Results from the Baltimore Longitudinal Study of Aging. Journal of biomechanics.
2010;43(6):1104-1110.
119. Hills AP, Hennig EM, Byrne NM, Steele JR. The biomechanics of adiposity–structural
and functional limitations of obesity and implications for movement. Obesity Reviews.
2002;3(1):35-43.
120. Willy RW, Manal KT, Witvrouw EE, Davis IS. Are mechanics different between male
and female runners with patellofemoral pain? Med Sci Sports Exerc. 2012;44(11):2165-
2171.
121. Gushue DL, Houck J, Lerner AL. Effects of childhood obesity on three-dimensional knee
joint biomechanics during walking. Journal of pediatric orthopedics. 2005;25(6):763-
768.
122. Michael Gunther RB. Joint stiffness of the ankle and the knee in running. J of
Biomechanics. 2002;35(2002):1459-1474.
123. Browning RC. Locomotion mechanics in obese adults and children. Current Obesity
Reports. 2012;1(3):152-159.
124. Enoka RM. Neuromechanical basis of kinesiology. Human Kinetics Champaign, IL;
1994.
125. Saragiotto BT, Yamato TP, Junior LCH, Rainbow MJ, Davis IS, Lopes AD. What are the
main risk factors for running-related injuries? Sports medicine. 2014;44(8):1153-1163.
126. Winter DA. Overall principle of lower limb support during stance phase of gait. Journal
of biomechanics. 1980;13(11):923-927.
127. DeVita P, Hortobágyi T. Obesity is not associated with increased knee joint torque and
power during level walking. Journal of biomechanics. 2003;36(9):1355-1362.
128. Lerner ZF, Board WJ, Browning RC. Effects of an Obesity-Specific Marker Set on
Estimated Muscle and Joint Forces in Walking. Medicine & Science in Sports &
Exercise. 2014;46(6):1261-1267.
129. Childhood Obesity. 2013; American Heart Association. Available at:
http://www.heart.org/HEARTORG/GettingHealthy/WeightManagement/Obesity/Childho
od-Obesity_UCM_304347_Article.jsp, 2013.
130. Janssen I, LeBlanc AG. Review Systematic review of the health benefits of physical
activity and fitness in school-aged children and youth. International Journal of
Behavioral Nutrition and Physical Activity. 2010;7(40):1-16.
131. Steele RM, Brage S, Corder K, Wareham NJ, Ekelund U. Physical activity,
cardiorespiratory fitness, and the metabolic syndrome in youth. Journal of applied
physiology (Bethesda, Md. : 1985). 2008;105(1):342-351.
132. Wheeler MD. Physical changes of puberty. Endocrinology and metabolism clinics of
North America. 1991;20(1):1-14.
133. Crowell HP, Milner CE, Hamill J, Davis IS. Reducing impact loading during running
with the use of real-time visual feedback. The Journal of orthopaedic and sports physical
therapy. 2010;40(4):206-213.
P a g e | 52
134. Medicine ACoS. ACSM's Guidelines for Exercise Testing and Prescription. Ninth ed:
Wolters Kluwer/Lippincott Williams & Wilkins Health; 2013.
135. Nagano A, Komura T, Himeno R, Fukashiro S. Optimal digital filter cutoff frequency of
jumping kinematics evaluated through computer simulation. International Journal of
Sport and Health Science. 2003;1(2):196-201.
136. Ounpuu S, Gage JR, Davis RB. Three-dimensional lower extremity joint kinetics in
normal pediatric gait. Journal of pediatric orthopedics. 1991;11(3):341-349.
137. Dempster WT, Gabel WC, Felts WJ. The anthropometry of the manual work space for
the seated subject. American journal of physical anthropology. 1959;17:289-317.
138. Stefanyshyn DJ, Stergiou P, Lun VM, Meeuwisse WH, Worobets JT. Knee angular
impulse as a predictor of patellofemoral pain in runners. The American journal of sports
medicine. 2006;34(11):1844-1851.
139. Cohen PA. Effectiveness of student-rating feedback for improving college instruction: A
meta-analysis of findings. Research in higher education. 1980;13(4):321-341.
140. da Silva-Hamu Tâ CD, Formiga C, Gervásio Fá M, Ribeiro DM, Christofoletti G, de
França Barros J. The impact of obesity in the kinematic parameters of gait in young
women. Int J Gen Med. 2013;6:507-513.
141. Willson JD, Binder-Macleod S, Davis IS. Lower extremity jumping mechanics of female
athletes with and without patellofemoral pain before and after exertion. The American
journal of sports medicine. 2008;36(8):1587-1596.
142. Miyazaki T, Wada M, Kawahara H, Sato M, Baba H, Shimada S. Dynamic load at
baseline can predict radiographic disease progression in medial compartment knee
osteoarthritis. Ann Rheum Dis. 2002;61(7):617-622.