comparison of body fat reduction in overweight and obese
TRANSCRIPT
Eastern Michigan UniversityDigitalCommons@EMU
Master's Theses and Doctoral Dissertations Master's Theses, and Doctoral Dissertations, andGraduate Capstone Projects
2008
Comparison of body fat reduction in overweightand obese subjects utilizing personalized low-fatmeal plans and non-personalized low-fat meal plansStacy Dawn Buzan
Follow this and additional works at: http://commons.emich.edu/theses
Part of the Nutrition Commons
This Open Access Thesis is brought to you for free and open access by the Master's Theses, and Doctoral Dissertations, and Graduate Capstone Projectsat DigitalCommons@EMU. It has been accepted for inclusion in Master's Theses and Doctoral Dissertations by an authorized administrator ofDigitalCommons@EMU. For more information, please contact [email protected].
Recommended CitationBuzan, Stacy Dawn, "Comparison of body fat reduction in overweight and obese subjects utilizing personalized low-fat meal plans andnon-personalized low-fat meal plans" (2008). Master's Theses and Doctoral Dissertations. 210.http://commons.emich.edu/theses/210

Comparison of Body Fat Reduction in Overweight and Obese Subjects Utilizing Personalized Low-fat Meal Plans and Non-Personalized Low-fat Meal Plans
By
Stacy Dawn Buzan
Thesis
Submitted to the School of Health Sciences
Eastern Michigan University
in partial fulfillment of the requirements
for the degree of
MASTER OF SCIENCE
in
Human Nutrition
Thesis Committee:
Judith Brooks, PhD, RD
Anahita M. Mistry, PhD
Christina Miller, MS, RD
May 06, 2008
Ypsilanti, Michigan
i
ACKNOWLEDGEMENTS
I would like to thank my chairperson, Dr. Judith Brooks, RD, and committee
members, Dr. Anahita M. Mistry and Christina Miller, MS, RD, for their supervision
and providing knowledge throughout the course of this thesis.
Finally, I would like to thank my husband, son, daughter, and mother for all their
patience, support, and encouragement during this process. You have been a
blessing in my life and helped me to make a difference in the health of others. Finally
and most of all, I would like to thank God for providing me with this opportunity and
the compassion, dietetic skills, ethics, patience, and perseverance needed to
complete this research study to enable me to help improve the lives of others.

ii
ABSTRACT
Background: Obesity is an epidemic and studies are needed to provide
recommendations for more effective strategies to increase self-efficacy and long-
term adoption of healthy nutritional habits in individuals who are obese.
Objective: To compare the use of personalized low-fat meal plans vs. non-
personalized low-fat meal plans and body fat reduction in overweight and obese
subjects 25 to 45 years of age.
Design: A 2-month comparative randomized block experimental study, in which
subjects were randomly assigned to either Treatment 1 Group, receiving non-
personalized low-fat meal plans, or Treatment 2 Group, receiving personalized low-
fat meal plans with two 30-minute dietetic consultations.
Subjects/Setting: Subjects were 17 men and women 25 to 45 years of age,
classified as overweight or obese (BMI=25 to 50), and limited to minor chronic health
conditions. A total of 87 individuals were interested, 73.02% (N=46) eligible, 36.96%
(N=17) enrolled, 47.06% (N=8) received treatment, and 41.176% (N=7) completed
the study.
Main Outcome Measures: Pre- and post-body fat measurements utilizing
bioelectrical impedance analyzers (BIA).

iii
Results: At the significance of P ≤ 0.05, the trend in the data appears to support the
use of personalized low-fat meal planning with two 30-minute dietetic consultations
( x 10=8.4053 or 7.718#) as more effective in reducing body fat than use of non-
personalized low-fat meal planning ( x 9=2.6825% or 2.049#) in females classified as
Obese II (BMI=35 to 39.9). Furthermore, at the significance of P ≤ 0.05, the trend in
the data seems to support the use of personalized low-fat meal planning with two
30-minute dietetic consultations ( x Tx2=8.3286% or 6.7299#) as more effective in
reducing body fat than use of non-personalized low-fat meal planning
( x Tx1=3.7077% or 3.7838#) in females and males in the BMI classification
categories of Overweight (BMI=25.0 to 29.9), Obese I (BMI=30.0 to 34.9), Obese II
(BMI=35 to 39.9), and Obese III (BMI=>40).
Conclusion: This study and others in this area may lead to the development of
more effective strategies in nutrition therapy to help reduce the prevalence of obesity
in adults.
iv
TABLE OF CONTENTS
ACKNOWLEDGEMENTS.����������������..������..i
ABSTRACT.����������������������..�����.�.ii
LISTS OF FIGURES�������������������������..v
LIST OF TABLES��������������������������..vi
CHAPTER 1: INTRODUCTION AND BACKGROUND.���.�������..1
CHAPTER 2: REVIEW OF LITERATURE..��������.�������...7
CHAPTER 3: RESEARCH DESIGN AND METHODOLOGY..�������..31
Subjects���������������.������������34
Treatment Process�����������������.�����..45
Statistical Analysis�����������������.�����..48
Main Outcome Measures���������������.����...51
CHAPTER 4: RESULTS AND DISCUSSION..���������.����...54
CHAPTER 5: CONCLUSIONS����������������.����..61
REFERENCES�������������������������.��64
APPENDIX A: Approval Letters and License��������������...73
APPENDIX B: Research Study Flowchart..���������������..81
APPENDIX C: Eligibility Questionnaire and Information Packet Forms ���.83
APPENDIX D: Nutrition Education Workshop��������������.97
APPENDIX E: Forms and Tools Common to All Treatment Groups����..109
APPENDIX F: Sample of Low-fat Meal Plans for Treatment Group 1���...116
APPENDIX G: Forms and Materials for Treatment Group 2�������...131

v
LIST OF FIGURES
Figure Page
1 Subject Eligibility������������������������..38
2 Subjects per BMI Block������������������.���...41
3 Subjects Assigned to Treatment 1 Group Across BMI Blocks�.���..�43
4 Subjects Assigned to Treatment 2 Group Across BMI Blocks�����...43
5 Workshop Attendance per Treatment Group���������.���...45
6 Mean Body Fat Reduction per Treatment Group����������.�57

vi
LIST OF TABLES
Table Page
1 Mean Changes in Body Weight, Body Fat Percentage, and Body
Fat Mass in Treatment Group 1������������������...52
2 Mean Changes in Body Weight, Body Fat Percentage, and Body
Fat Mass in Treatment Group 2�������������������53
1
CHAPTER ONE: INTRODUCTION AND BACKGROUND
Introduction
The most current statistics, as of the 2005, reveal that the percentage of
obese adults over 20 years of age was approximately 25.4%. This percentage
represents a 6% increase from the estimate of 19.4% in 1997 (1).
The American Obesity Association reported in their article �Obesity Research�
that in 2004 there were approximately 127 million adults in the United States
classified as overweight or obese. This is a staggering amount compared to the
following chronic disease rates: 800,000 to 900,000 adults with HIV, 9 million adults
with cancer, 16 million with diabetes, and 26 million with heart disease. Dietary
habits and lack of physical activity in adults who were obese accounted for 300,000
to 587,000 deaths annually, according to this article (2). Specifically in 2003, the
Behavioral Risk Factor Surveillance System showed that within the 50.0% to 64.9%
of overweight adults in America, the percentage of obese adults ranged from 16% to
28.4% (3).
These individuals who are overweight or obese are perplexed by the
overwhelming task of losing excess body weight. One major problem is the volume
of nutrition information available to the public regarding ways to lose excess body
weight. In addition, the amount and accessibility of information has grown in recent
years. According to the Federal Trade Commission, the number of times weight-loss
ads appeared in magazines more than doubled between 1992 and 2001. In 2001,
there was also an increase in the number of questionable health claims found in
weight-loss ads (4). As a result, individuals searching for solutions to their weight-
2
loss dilemmas find themselves trying everything to reach their goals, even if the
approach has not been scientifically validated.
Another major problem is that individuals providing weight management
services to the public may not be qualified in the field of nutrition. This study aimed
to prove to the public, as well as the wellness and fitness community, the
effectiveness of offering personalized low-fat diet meal plans compared to the non-
personalized/pre-planned (�cookie cutter� or �one size fits all� type) meal plans that
are offered by most wellness programs. These types of meal plans are defined in the
section titled Definition of Terms. Some non-certified personal trainers, non-degreed
nutritionists, and herbalists provide these meal plans to their clientele. These meal
plans may cause a decrease in the metabolism and result in nutritional deficiencies
for some individuals as a result of eliminating entire food groups.
Study Rationale This experiment on the effect that the use of personalized low-fat meal plans
had on body fat reduction was important for several reasons. First, the details of this
research study may equip the public with knowledge to select quality nutrition
programs for responsible weight loss. Second, it may encourage the wellness and
fitness community to reconsider the practice of providing clientele with non-
personalized meal plans for weight loss, which are not usually designed by
registered or licensed dietetic professionals. Third, this study may benefit dietetic
professionals by opening the lines of communication between the wellness
community and the dietetic community regarding standards of care.
To summarize, this problem is significant and needed to be studied to:

3
1. Build on nutritional counseling strategies in an effort to reduce the
percentage of overweight and obese individuals within the United States.
2. Influence the public to spend less money on erroneous weight-loss advice,
products, and services.
3. Convince and encourage national certifying wellness and fitness
organizations and associations to advise and establish rules in their code of
ethics to prevent the practice of providing nutritional services without formal
dietetics education and registration as dietetic professionals through the
American Dietetic Association (ADA). The American College of Sport
Medicine (ACSM) and the National Strength and Conditioning Association
(NSCA) are examples of powerful wellness and fitness associations.
The researcher selected to study this topic due to an overwhelming desire to
teach and provide proof about the importance of increasing clientele/patient self-
efficacy skills and promotion of long-term positive nutritional habits through the use
of nutrition therapy techniques.
Through education and experience in the field of dietetics, the researcher has
learned that most individuals resist adhering to their prescribed diet orders and/or
weight loss regimens if nutrition education is provided via generic handouts and in a
pre-planned, non-personalized manner. Personalized meal planning provided by
qualified registered dietetic professionals is a vital component to help overweight
and obese individuals lose weight and promote the adoption of long-term positive
healthy nutritional habits. Each individual�s food preferences and snack foods should
be included in their meal plans, with minimal exclusion of the foods they usually

4
consume. Exceptions are excessive alcohol and/or caffeine intake, which need to be
limited or modified.
Obesity is an epidemic that demands effective strategies for weight loss,
thereby improving the health status of the public. Dietetic professionals need to
research and provide recommendations for more effective strategies and methods to
increase self-efficacy and long-term adoption of healthy nutritional habits in
individuals who are overweight and obese.
The next section will provide insight into the background, past research,
current weight-loss diets, and justification for the study criteria and utilization of tools.
Purpose and Objectives
The purpose of this study was to compare the use of personalized low-fat
meal plans v. non-personalized low-fat meal plans and body fat reduction in
overweight and obese subjects 25 to 45 years of age.
This study�s objectives were:
1. Compare the effects of two nutritional meal-planning techniques on
body fat reduction.
2. Determine if usage of personalized meal plans resulted in a greater
reduction in body fat than the non-personalized meal plans.
Research Question
Over a 2-month period, did the use of personalized low-fat meal plans by
overweight and obese individuals 25 to 45 years of age result in a greater reduction
in overall body fat than the use of non-personalized low-fat meal plans?
5
Definitions of Terms
The following are definitions of terms utilized in this study.
1. Apoptosis is defined as programmed cell death (5).
2. Atherosclerosis is a condition where plaque formation narrows
blood flow through arteries (5, 6, 7).
3. Cookie cutter meal plans are defined as meal plans that are non-
personalized/pre-planned that do not account for individuals� food
preferences, health conditions, allergies, and other nutritionally and medically
relevant information.
4. Gout is defined as an acute arthritic condition caused by high uric acid
levels in the blood, which results in uric acid (urate) crystals settling in joint
tissues, causing pain and swelling (8).
5. Hydrodensitometry is defined as underwater weighing (9).
6. Hyperandrogenism in females is a state characterized by an excessive
secretion of andogens or male sex hormones by the adrenal cortex or
ovaries, which is often caused by either ovarian or adrenal diseases (10).
7. Metabolic syndrome represents a specific body phenotype along with a
group of metabolic abnormalities that are risk factors for coronary heart
disease (CHD). Medical conditions associated with this syndrome are
abdominal obesity, insulin-resistant glucose metabolism (hyperinsulinemia,
high fasting plasma glucose concentrations, impaired glucose tolerance),
dyslipidemia (hypertriglyceridemia, low serum HDL-cholesterol
concentration), and hypertension. Risk factors for this syndrome can be

6
decreased by reduction in body fat. This syndrome is also known as
the insulin resistance syndrome, dysmetabolic syndrome, and syndrome X
(11, 12).
8. Net carbohydrates are defined as the total carbohydrates that do not
include fiber (13).
9. Personalized meal plans account for individual food preferences and
choices, schedules, health conditions, and other nutritionally and medically
relevant information.
10. Prochaska and DiClemente�s Stages of Change Model is a framework for
understanding clients� readiness to change. This model operates on the
assumption that people do not change chronic behaviors discretely, but in
needing to make changes progress through six identified stages:
Precontemplation (no intention of changing in the next 6 months),
contemplation (intending to change but not soon), preparation (intending to
change in the next month), action (recent changes in choices), maintenance
(maintained changes for 6 months), and termination (changes maintained for
5 years) (14, 15).
11. Self-efficacy is defined as the degree to which one feels competent to
complete a given task (16).
12. Uric acid is a by-product of the breakdown of waste products. High
uric acid levels can be due to excess production of uric acid and/or
reduced kidney function (8).

7
CHAPTER TWO: REVIEW OF LITERATURE
Introduction
In addition to the statistics on the percentages of obese adults, the Centers
for Disease Control and Prevention (CDC) released data in 2002 that revealed that
an estimated 47 million Americans have metabolic syndrome. Medical conditions
that are exhibited in this syndrome are excess abdominal fat, insulin resistance,
obesity, high blood cholesterol, high blood pressure, high blood sugar, and high
triglycerides (5, 10).
The measurement called the body mass index (BMI) is used in many
research studies, including the studies discussed in this section, to determine
whether individuals are classified as underweight, normal weight, overweight, or
obese. The Body Mass Index is calculated using the following formula:
weight in pounds/ [height in inches] 2 x 703
This formula measures individual health risk through classification as
underweight (<18.5), normal weight (18.5 to 24.9), overweight (25.0 to 29.9), obese
class I (30.0 to 34.9), obese class II (35.0-39.9) and extremely obese class III
(>40.0) (3, 5).
The next sections will detail the benefits of dietary therapies utilized in weight
management.
Medical Benefits to Weight-loss
The medical benefits resulting from small reductions in body weight have
been studied extensively. The Framingham Offspring Study revealed that the risk of
coronary heart disease (CHD) was related to certain factors, such as high body

8
mass index and high cholesterol. These risk factors can be attributed to obesity. This
study also revealed that a 2.25 kg (4.95 lb.) weight reduction resulted in a 48%
reduction in the risk factor sum in men and 40% in women (17). The results of a 15-
week lifestyle intervention study in a Danish journal reported that physical activity,
dietary changes, and personal development lead to significant improvements in
several areas equivalent to those from surgical treatment for weight loss.
Specifically, significant reductions were reported in body mass index (BMI), body
weight, body fat, and total cholesterol in this study. Furthermore, subjects had
significant improvements in their oxygen uptake and oral glucose tolerance (18).
The results of a clinical trial on the effects of weight loss on insulin sensitivity
in individuals with Type II Diabetes Mellitus revealed that small reductions in body
weight resulted in significant increases in their insulin sensitivity. The fasting plasma
insulin concentration was used as a measure of insulin sensitivity. Decreases in the
concentration indicated that less insulin was needed to mobilize glucose into the
cells. The subjects were only treated with oral hypoglycemic agents during the
clinical trial (7). In the Journal of Metabolism the results from a study on obese
subjects who intentionally lost weight in the early development stage of Type II
Diabetes Mellitus revealed that weight loss could lead to decreased insulin release
and oppose the progression of diabetes (19).
There is a positive relationship between weight loss and blood pressure.
According to the 3-year study Trials of Hypertension Prevention, Phase II (TOHP II),
an average weight loss of 8.8 kg (19.36 lbs.) resulted in a reduction of 7 mm Hg in
diastolic blood pressure (DBP) and 5 mm Hg in systolic blood pressure (SBP) (5).

9
Bariatric surgery has been touted as the magic surgery for individuals who
are morbidly obese. According to the Swedish Obese Subjects Study, bariatric
surgery resulted in a reduction of blood pressure in approximately 66% of
participants for a 1- to 2-year period. Patients with resolved hypertension lost 89.3+/-
5.6 lbs. and those with persistent hypertension lost 66.0+/-8.3 lbs of weight, a
difference of 23.3+/-2.7 in the weight lost. Approximately 3 years after surgery,
participants experienced gradual increases and returned to their baseline blood
pressures (5).
Four research studies on the effects of weight loss on risk factors attributed to
the metabolic syndrome indicated a causal relationship between weight loss and
reduction of risk factors. Weight losses of 5% body weight resulted in significant
reductions in Hemoglobin A1c (HbA1c), blood pressure (BP), total cholesterol, and
increases in high-density lipoprotein (HDL) cholesterol concentrations. Furthermore,
weight losses of 5-10% also resulted in reduction of triglycerides (19). Most of the
conditions associated with metabolic syndrome, if not genetically related, can be
significantly helped by long-term implementation of positive healthy eating habits
and routine physical exercise (6, 11).
Both the Finnish Diabetes Prevention Study and the United States Prevention
Program Research Study provided evidence that modest weight loss can prevent
the development of Type II Diabetes Mellitus. In overweight and obese individuals
with impaired glucose tolerance, lifestyle changes associated with 5% weight losses
led to a 58% reduction in the 4-year cumulative incidence of diabetes. The lifestyle

10
changes were defined as increasing physical activity and reducing dietary intake
(19).
Dietary Therapy in Weight Loss
In traditional obesity treatment, caloric reduction to promote mobilization and
utilization of fat stores (i.e. endogenous triglycerides) results in increased energy
expenditure and an overall reduction in body weight. The loss of weight attributed to
dietary modification consists of approximately 75%-85% fat mass. It has been
suggested that long-term weight loss can lead to apoptosis of fat cells, resulting in a
reduction in the quantity of fat cells. This suggestion still requires further research,
specifically with obese subjects (5).
The Effects of Low-fat Diets on Weight Loss
Twelve controlled clinical trials studying the effect of low-fat diets in calorie
reduction revealed that diet modification from a baseline of 38% of calories from fat
to 27.2% of calories from fat resulted in a reduction of 272 calories per day. This
reduction of 272 calories per day is enough to promote approximately ½ pound
weight loss per week in healthy adults. In addition, consuming a low-fat diet
promotes the utilization of fat stores for energy (7).
In 37 diet-intervention studies that utilized The National Cholesterol Education
Program Step II and I, reduced fat diets revealed a direct cause and effect
relationship between reducing dietary fat intake and the reduction in body weight.
These diets provided 30% of total calories from fat. According to these studies, there
was a weight reduction of 0.28 kg (0.616 lb.) for every 1% reduction in dietary fat
intake (7).

11
Macronutrient Composition of Low-fat Diets
The appropriate dietary macronutrient composition in low-fat diets is important
in promoting weight loss. Randomized clinical trials revealed that low-fat diets
consisting of 28% of the calories from fat and 52% of the calories from complex
carbohydrates resulted in a greater reduction in weight than a low fat diet with 25%
of the calories from fat and 55% of the calories from simple carbohydrates (7).
Most Current Diets Available to the Public
Overweight and obese individuals have many sources of nutritional advice
and diets to choose from. Individuals without dietetic qualifications provide most of
this dietary information to the public. The following section will detail the most
popular weight-loss diets.
The Atkins Diet
One of the most popular weight loss diets is the Atkins Diet, developed by Dr.
Atkins. It is a low-carbohydrate, high-protein diet that is based upon the
misunderstanding that too many carbohydrates result in excess body weight. He
promises that using this diet will result in weight loss without hunger while promoting
heart health and memory function. Also, it states that this diet eventually leads to
decreased cholesterol and triglyceride levels with weight loss. The proposed
mechanism of this diet is to drastically reduce carbohydrates so the body uses more
of the stored body fat for energy, thereby promoting a state of ketosis that results in
decreasing the feeling of hunger. Ketones are utilized for fuel and only provide a
limited amount of sustained energy for the brain, kidneys, and other bodily functions.

12
The theory states that diets high in carbohydrates require increased insulin
secretion, eventually leading to risks for insulin resistance and/or diabetes.
The diet consists of a high percentage of protein from high fat sources, not to
mention the bacon, cheese, and cream sauces that are allowed. The initial two
weeks of this diet restricts net carbohydrates to 20 grams per day, primarily in the
form of green leafy vegetables. Furthermore, refined sugar, milk, white rice, and
white flour are not allowed on this diet. After the initial two-week period, individuals
are allowed to increase fiber-rich carbohydrates excluding white bread, potatoes,
and pasta made with white flour. Individuals are told to gradually raise their
carbohydrate consumption with a limit of 40 gram per day, while achieving their
weight loss goals. The use of vitamin supplements is urged to counteract the effects
of excluding many foods.
According to Gail Frank, PhD, spokeswoman for the American Dietetic
Association, the body requires at least 150 grams of carbohydrate to maintain
normal metabolism. The reason for the fast weight loss is that each molecule of
carbohydrate carries three H20 molecules and the restriction of carbohydrates leads
to weight-loss via water loss. This also increases the possibility of dehydration.
Glucose is the only source of fuel for efficient brain function and is available from
such food items as cereals, rice, and grains. The reported potential risks from long-
term adherence to the Atkins Diet may be heart disease, stroke, cancer, bone loss,
and liver and kidney problems. Best stated by nutrition expert, Barbara Rolls, PhD,
�In the end it�s not fat, it�s not protein, it�s not carbs, it�s calories. You can lose weight
on anything that helps you to eat less, but that doesn�t mean it�s good for you.� (13).

13
Body for Life
This exercise and diet regimen developed by Bill Phillips is very intense and
promises full results in 12 weeks. The diet involved in the plan contains 40% to 50%
calories from protein, 40% to 50% from carbohydrates, and ≤ 20% from fat. This
contradicts the professional weight loss diet recommendations of 20% to 25%
calories from protein, 50% to 60% from carbohydrates, and 20% to 25% from fat.
The Body for Life diet suggests that individuals eat six small meals per day with fist-
sized portions of protein and carbohydrates, and on one day out of the week
anything can be eaten.
Furthermore, it restricts dairy products and carbohydrates including bananas
and starchy vegetables. The only dairy product allowed on this diet is low-fat yogurt.
To meet the high protein needs required by this diet, protein supplements sold by Bill
Phillips are recommended. These protein supplements are extremely high in protein,
with isolated whey protein as the main protein source. In addition to these
supplements, this diet recommends ingesting up to 2 tablespoons of flaxseed oil, for
the omega-3 fatty acids, daily.
Experts in the fitness profession report that, though there is an element of
truth and science to this regimen, there is also a lot of hype. Many experts in the
dietetic and fitness professions disagree on whether the amount of protein
recommended by this program is higher than the daily needs for protein intake.
In individuals with kidney problems and individuals unaware of underlying
kidney disease, the long-term use of high protein diets could pose a major
disadvantage. Protein molecules from all sources are broken down into amino acids.

14
Normal functioning kidneys allow these amino acids to pass into the urine. The
consumption of excessive amounts of protein can cause excess pressure in the
kidneys. This excess pressure in the kidneys may damage and cause a reduction in
function of the nephrons, the functional units in the kidneys responsible for
purification and filtration of blood. The reduction in kidney function may result in
electrolyte imbalances and accumulation of excess amounts of amino acids in the
blood. This accumulation can lead to toxic levels of protein by-products in blood
including blood urea nitrogen (BUN), which can result in further damage and
reduction in function of the kidney�s nephrons (13).
Dr. Phil�s Ultimate Weight Solution
Dr. Phil�s Ultimate Weight Solution is based upon the premise that the use of
self-confidence and self-talk are very important elements to attain a comfortable,
healthy, and realistic weight loss. Methods stressed are counteracting emotional and
impulse eating, replacing unhealthy convenience foods with healthy non-
convenience foods, and meal planning and portion control. To help control
overeating, non-convenience, nutrient-dense foods that cannot be eaten quickly are
emphasized, such as fruits and vegetables, tofu, soy products, and soup. This diet
restricts processed foods and those containing additives, excess sugar, and fat.
Attention is also given to meal replacement drinks and bars when needed, but
cautions on reliance upon these for balanced dietary intake.
In addition, exercise, a positive support group, and addiction transference are
mentioned as key components involved in weight control. The theory of addiction
transference is used to explain how an unhealthy dietary or lifestyle habit can be

15
replaced by a healthy habit. An example would be an individual who overeats as a
reaction to stress transferring this unhealthy habit to a walk around the
neighborhood, which would provide more long-term health benefits.
The benefits of this weight loss regimen are primarily from usage of the
behavioral management and introspective techniques. Otherwise analysis of this diet
revealed many unnecessary deficits. The first unnecessary deficit is that starchy
vegetables are restricted to promote utilization of fat stores, even though they offer
nutritional value and fiber. Second, it limits individuals to two to three servings of fruit
per day, which is contrary to the USDA recommendation of five fruit and vegetables
servings per day. Third, dairy and milk are limited to two servings per day, which is
below the recommendation of three low-fat milk or dairy servings per day to help
achievement of weight loss goals. Enough calcium is needed to promote bone
formation and renewal and to maintain muscle function both during and after
exercise (13).
Eat Right for Your Type
The developer of the Eat Right for Your Type diet is a naturopathic doctor.
This diet is based upon the premise that individuals with specific blood types digest
food proteins called lectins differently, which directs whether individuals should
consume or avoid certain foods. According to this diet, individuals with type O blood
benefit from consuming lean meats, poultry, and fish. Conversely, this diet restricts
such individuals from consuming grains, breads, legumes, and beans. It is
mentioned that individuals with blood type A benefit from soy protein, grains, and
organic vegetables. What should blood type A avoid? Supposedly low-fat dairy,

16
meat, and produce are beneficial and wheat, corn, and lentils are harmful for
individuals with blood type B. If you have blood type AB, then consumption of
seafood, tofu, dairy, and produce provides the best benefits. Chicken, beef, and pork
are restricted for this blood type.
The Eat Right for Your Type diet offers false hope and appears easy to
individuals desperate to lose weight. According to David W. Grott, RD, LD, there is
no scientific evidence to support this proposed diet�s benefits and reasons for
restrictions (13).
Sugar Busters Diet
The Sugar Busters diet is based upon the premise that sugar is toxic to the
body and restricts any food source that contains sugar. Experts such as Maureen L.
Storey, PhD, says that the myth, that the body distinguishes sugars differently in
natural sources than from sugars in manufactured products, holds no basis in
scientific theory. According to Theresa Nicklas, PhD, the very high protein content of
this diet can increase calcium excretion and may exacerbate gout (8).
In addition, the amount of protein consumed can damage the kidneys and
liver and produce side effects of fatigue, weakness, and irritability. Similar to the
other fad diets, the main reason for weight loss is the severe reduction in calories
and water loss from limiting carbohydrates.
In addition to these negative attributes, the companies and individuals
promoting these diets recommend that individuals purchase additional supplements
from them. The cost of these supplements is usually more expensive than the food

17
cost to obtain the equivalent amounts of minerals, nutrients, vitamins, and protein
(13).
The 3-Hour Diet
Jorge Cruise, a fitness journalist, developed the 3-Hour diet, which is mainly
built around portion control and time of meals. The concepts of this diet are to
consume breakfast within one hour of waking; space meals out to every three hours,
cease consumption three hours prior to bedtime, and utilize portion control. Cruise
explains that this diet produces weight-loss results by raising an individual�s basal
metabolic rate and energy while reducing his or her appetite.
The concept of portion control is based upon visualizing the arrangement of
food on a 9-inch plate with the carbohydrate portion being equal to the size of a
Rubik�s cube at the three main meals, and portion size of fruits or vegetable equal to
a stack of three DVD cases, protein portion equal to a deck of cards, and the amount
of fat as the size of a water bottle cap at each meal. There is no mention about
specific types or healthier choices of these food items. Cruise claims that this diet
resets the body�s metabolism with each meal, lowers abdominal fat without muscle
loss, and results in weight-loss of 2 lbs. per week.
The daily caloric intake is 1,450 calories with the three main meals consisting
of 400 calories each, two snacks of 100 calories each, and an after dinner snack of
50 calories. Foods such as candy and cookie snack packs are mentioned as part of
the snack regimen, instead of fruit, vegetable, or dairy servings. It is essentially a
diet that claims to promote weight-loss based upon the concept of calories
consumed being less than calories expended. Dependent upon an individual�s

18
activity level, anthropometric measurements, and medical history, this diet can either
exceed or not meet their recommended estimated energy needs per day.
Analysis reveals that this diet excludes milk and dairy products, which contain
calcium needed for strong bones and heart and muscle function. Avoiding these
items is not recommended throughout the lifetime especially in persons with
osteoporosis, children and adolescents, women of childbearing years, seniors, and
the physically active.
Experts reported that individuals might find it difficult to schedule their meals
and may incidentally gain weight on this diet due to factors such as work constraints
and habits of overeating. Studies have shown no conclusive evidence that eating
frequency alone resulted in changes in basal metabolic rate (BMR). Most experts
agreed that exercise and promoting consumption of breakfast are equally important
in the promotion of long-term weight loss (13).
The New Beverly Hills Diet
This diet was developed by Judy Mazel, a dietary and lifestyle counselor
lacking dietetic professional credentials. The New Beverly Hills Diet touts a 10 to 15
pound weight loss in 35 days.
It is based upon consuming protein, carbohydrates, fats, and fruits separately
at the �right� time through the day. The beginning of the day allows for no limits on
fruit consumption with a one-hour wait in between each new fruit selection. Two
hours after this, individuals can consume carbohydrates, fats, or protein. No fruit is
allowed for the rest of the day. If protein is chosen, then the remainder of the day

19
should consist of 80% of food choices as protein. At one of the meals per day
individuals can combine carbohydrate and protein.
Experts such as David W. Grotto, RD/LD, agree that this diet would promote
weight loss along with nutritional deficiencies. In addition, there is no supporting
evidence of the theory that food combining leads to weight gain. The diet basically
emphasizes consumption of a high protein diet to promote short-term weight loss.
This weight loss is primarily due to reducing caloric intake (13).
The South Beach Diet
Arthur Agatston, MD and cardiologist, developed the South Beach Diet.
Similar to the Atkins diet, the South Beach Diet utilizes a high protein, low
carbohydrate diet. The first major difference is that the South Beach Diet
emphasized heart-healthy fats. Second, attention is focused on selection of
carbohydrates with low glycemic indexes, instead of counting carbohydrates.
Furthermore, this diet restricts consumption of potatoes, fruit, bread, cereal, rice,
pasta, beets, carrots, and corn.
According to nutrition expert Cindy Moore, RD, the induction phase of the
South Beach Diet results in excessive water loss due to carbohydrate reduction,
which can throw off an individual�s electrolyte balance. The maintenance phase of
the South Beach diet adds whole-grain breads, fruit, and pasta. Dairy products are
still discouraged in this final phase of the diet (13).
The next section details research on dietary therapies and calcium needs for
individuals who need to lose excess body weight.

20
Calcium Intake during Weight Loss
The reasons for including calcium intake while trying to lose excess body
weight are well researched. According to the Journal of Nutrition, there are potential
hormonal mechanisms regulating bone loss at any age during weight loss. These
mechanisms are decreases in estrogen, leptin, glucagon-like peptide-2, growth
hormone, and insulin-like growth factor-1, or an increase in cortisol. Given this
information, individuals should avoid diets that restrict dietary calcium intake (20).
Research on Low-carbohydrate Diets and Weight Loss
The findings of five randomized controlled trials that compared the effects of
the low-fat diet and the low-carbohydrate diet on weight loss revealed that the low-
carbohydrate diet did not result in long-term weight loss and failed to reduce serum
low-density lipoprotein (LDL) cholesterol concentrations (7). One of the risk factors
for developing atherosclerosis is having a high LDL cholesterol concentration in the
blood.
Research on Dietary Therapies
The U.S. Preventative Services Task Force statement in the American Family
Physician article in June 2003 addressed pertinent findings about using behavioral
counseling in combination with nutrition education. The results reported that routine
low-to-medium intensity behavioral dietary counseling for patients without an
increased risk of diet-related chronic disease resulted in small to medium
implementation of an overall healthy diet. Low intensity interventions in behavioral
dietetic counseling consist of primary care provider counseling lasting less than or
equal to 5 minutes, self-help materials, telephone counseling, and other interactive

21
health communications. On a more positive note, when patients with an increased
risk for diet-related chronic disease received combined interventions such as
medium-to-high intensity behavioral dietary counseling with nutrition education
provided by a nutritionist or dietitian, the result was medium-to-high implementation
of an overall healthy diet. Usually a dietitian or nutritionist, or a specially educated
primary care physician or nurse practitioner, provides the medium-intensity dietetic
counseling to patients and clients in 2- to 3-person groups and/or individual
sessions. High-intensity dietetic counseling intervention is delivered in the same
manner and lasts at least three months, with patients or clientele attending more
than 1 group and/or individual session per month. For reference, an overall healthy
diet involves increasing dietary intake of fiber, fruit, and vegetables, and limiting
dietary intake of saturated fat. Based upon these findings, the task force
recommended this combination intervention method to help patients alter food
preparation practices and daily eating habits through implementing skills, motivation,
and support. Interventions used to change unhealthy nutritional habits are self-
monitoring, overcoming barriers, setting goals, shopping and preparing healthy food,
role-playing, and social support. The U.S. Preventative Services Task Force
recommends that primary care providers utilize nutritional screening as a part of
their routine patient assessments to identify patients at risk, in order for them to
receive effective nutrition education and multiple medium-intensity private dietary
counseling sessions with each lasting at least 30 minutes (21).
Hopefully, more primary care health professionals will implement this
recommendation and refer patients to dietetic professionals for nutrition therapy.

22
This will result in all healthcare professionals working together to provide the best
care for their patients. If these practices are used for both preventative healthcare
and patients with an increased risk of diet-related disease, it could eventually lead to
a decrease in the United States� adult obesity statistics. The information on
combination patient behavioral-oriented counseling and nutrition education should
give dietetic professionals more incentive to continue using these and develop other
techniques in weight-management.
More specifically, in an American Dietetic Association (ADA) article the
technique of a 4-step goal-setting process in changing dietary behavior was
discussed. The steps within this process are as follows: 1) recognizing the need for
change, 2) establishing a goal, 3) adopting a goal-directed activity and self-
monitoring and 4) self-rewarding goal attainment.
There have been several studies involving adults regarding goal-setting in
changing dietary behavior. The first study, involving participants who set weekly
goals for six weeks, reported the pertinent findings of greater reductions in dietary fat
intake and greater self-efficacy when compared with the control group receiving
general nutrition curriculum. The second intervention study involved clinic
participants who reported a goal achievement of 90% at the end of Week One and
96% at the end of Week Two. During the third study, after three months, the
participants reported lower serum cholesterol levels, lower total fat and calorie
consumption, compared with the control group that did not use a goal-setting
program (21).

23
Self-efficacy Related to Weight Loss
A very important element involved in goal attainment is self-efficacy. Self-
efficacy is defined as the belief that one has the power to produce an effect, such as
the attainment of one�s goals. In the qualitative research study article titled, �The
Role of Self-Regulation Strategies and Self-Efficacy Perceptions in Successful
Weight Loss Maintenance,� Dr. Kitsantas reported that the results of this study
indicated that the participants with higher self-efficacy perceptions were more
successful in their weight loss and weight maintenance goals (16).
Dietetic Professionals and Weight Loss
With this in mind, it is important that the public consult qualified dietetic
professionals for dietetic advice. According to the American Dietetic Association�s
evidence-based guidelines, the most appropriate treatment strategy for obesity is
diet in combination with physical activity and behavior therapy. Individual weight loss
of 5% to 10% was achieved when dietetic professionals utilized the combination of
healthy eating plans along with meal replacements. Weight loss has been
significantly linked to reductions in individuals� body fat percentage. Obese
individuals with Diabetes Mellitus who received nutrition intervention services from
Registered Dietitians achieved increased metabolic control and reductions in body
weight, body fat, and the amount of prescription medications (22). The American
Dietetic Association (ADA) Evidence Analysis Library specifies the current
supporting recommendations for nutrition education. The main recommendation is
that nutrition education should be individualized and included as part of the diet
component of a comprehensive weight management program (23).

24
Meal Planning Related to Weight Loss
Meal planning is another important component to attaining weight loss goals.
According to the U.S. Food and Drug Administration (FDA), the single meal plan for
diabetes is no longer recommended. Instead, the FDA recommends that individuals
consult a Registered Dietitian to design a personalized meal plan that accounts for
their needs and medical conditions (24). According to an article in the Journal of
Sports Medicine, the foremost objective of a weight-loss trial has to be the reduction
in body fat leading to a decrease in risk factors for metabolic syndrome. Usually a
low-fat diet is utilized in diet intervention studies that have the aim of body fat
reduction. A decline in lean muscle mass is a frequent observation with weight loss,
which can decrease the resting metabolic rate (RMR) and limit further weight loss.
Individuals who have adopted an exercise regimen along with a low-fat diet need
more protein, approximately 20% of calories from protein per day to maintain and
increase their fat-free mass (12).
The following paragraphs explain variables that may affect weight loss and
measures of health risk.
Age Related to Weight Loss
Normally, metabolism decreases as one ages, regardless of gender. The
effects of age and the normal lifecycle on metabolism and obesity are well
documented in women. Specifically, post-menopause is associated with decreased
metabolism and potential weight gain. A study comparing various hormone levels
and body fat distribution in post-menopausal women revealed that differences in the
testosterone-estradiol ratio contributed to the higher percentage in body fat (25). In
25
addition, medications used to alleviate menopausal symptoms can affect
metabolism. According to a research article in the Journal of Diabetes Care,
postmenopausal women taking oral estrogen or those taking a combination of
estrogen and hormone replacement therapy (HRT) are more insulin-resistant than
women on HRT (26).
Furthermore, several studies have revealed information about the pattern of
body fat distribution and internal factors related to increases in body mass index
(BMI) in women in various menopausal periods. The Journal of Menopause detailed
a study that examined the relationship between body fat, physical function, and
potential disability in postmenopausal women younger than 75 years of age. It
revealed that increased body fat led to increased lean muscle mass in the legs and
decreased lean/fat ratio, which can affect physical function (27). A recent study on
serum leptin concentrations in pre- and postmenopausal women who received sex
hormone therapy revealed that leptin is related to their BMI, not body fat distribution
and the type of obesity (28).
Body Mass Index (BMI)
A research article in the Journal of Current Opinion in Clinical Nutrition
Metabolism Care revealed that bioelectrical impedance analysis equations
overestimate the percentage of body fat in morbidly obese individuals with severe
abdominal obesity. The main reason for this is that obese individuals have a high
amount of extra-cellular water and total body water, which may result in the
overestimation of fat-free mass and underestimation of fat mass. In addition,
abdominal or central body fat can result in the same errors when manual

26
calculations are performed utilizing the body fat prediction formulas developed in
normal weight individuals (29).
A study in the British Journal of Nutrition revealed that BMI calculations
would result in 5.6% of females being falsely classified as non-obese and 1.1% of
males falsely classified as obese. This research supports the use of body
composition measurements along with BMI calculations, in order to avoid any delay
in beneficial therapies (30).
According to the Journal of Endocrinology Investigation, morbidly obese
subjects have multiple endocrine abnormalities such as Growth Hormone Deficiency
(GHD) that affects differences in body composition, when compared with subjects of
normal weight. It further states that anthropometric variables such as BMI, waist
circumferences, and fat mass were major determinants for GHD (31). Other
research on obesity has found that excess abdominal adipose tissue can cause
increases in the release of free fatty acids. This can lead to insulin resistance
through increases in insulin signaling, diminished glucose uptake in the muscle,
increased triglyceride synthesis, and gluconeogenesis (32). The effects of insulin
resistance on metabolism will be described in the next section.
Food Frequency Questionnaire
There are many research studies that support and validate the usage of the
food frequency checklist and questionnaire in this research study. A study in the
adolescent population compared and evaluated a semi-quantitative food frequency
questionnaire (FFQ) to a 3-day dietary record. The results revealed that the nutrient
estimates from the semi-quantitative food questionnaire and the 3-day dietary record

27
were not statistically different with the alpha level of P>0.05. This supports the use of
the semi-quantitative food frequency questionnaire as a reliable and valid
measurement of food intake in this population (33). Furthermore, a study detailed in
the Journal of Human Nutrition and Dietetics validated the FFQ as an accurate tool
in adequately estimating nutrient intakes in the elderly population. The results of this
study revealed no significant difference between the mean energy intakes of the 4-
day weighted food record (1564.9 calories) and the FFQ (1641.3 calories/day) (34).
There are also research studies in other countries that provide support and validate
the use of the FFQ to accurately measure dietary intake. For example, a study
detailed in the Asia Pacific Journal of Clinical Nutrition assessed the agreement
between a 74-item semi-quantitative FFQ and 3-day weighted food records (WFR) in
a period of one month. The results supported the use of this semi-quantitative FFQ
to estimate intakes in a short-term period (35).
The following are some of the studies that validate the use of the FFQ in the
assessment of specific nutritional needs. For instance, a study in the Journal of
Clinical Nutrition validated a self-administered 20-item FFQ as a useful tool in
assessing dietary protein intakes, when compared with intakes reported on a 4-day
food diary and 24-hour recall (36). Furthermore, a study in the Journal of the
American College of Nutrition compared the reported dietary fiber intake from NIH-
NCI FFQ and 4-day food records. Results revealed that the fiber intakes were
significantly higher in the 4-day food record than the FFQ. This study also
acknowledged that variables such as education, gender, habits, and smoking might
affect the reporting of fiber intakes on the FFQ and 4-day food records (37).

28
The FFQ has been utilized in other ways to assess dietary intake. For
instance, a study detailed in the American Journal of Epidemiology supported the
validity of the Arizona FFQ (AFFQ) and 24-hour dietary recall in the assessment of
dietary change in a 1-year experimental study involving breast cancer survivors. The
AFFQ was completed at the beginning and at the end of the study (38). In addition,
the Asia Pacific Journal of Clinical Nutrition reviewed a study that supported the use
of the FFQ in ranking diet-related risk factors in Koreans, based upon the analysis of
the 314-items and the intake of 20 nutrients (39).
There is supporting evidence that it is vitally important to use both the FFQ
and food record to assess dietary intake in the following studies. As noted in the
Journal of Nutrition, Metabolism, and Cardiovascular Diseases, FFQ are one of the
most cost-effective tools for assessing usual intake, particularly for micronutrients
with high variability. This study explained that the FFQ is effective to assess the
usual intake of micronutrients and the food record for assessment of macronutrient
intake. Limitations in the questionnaire do exist in diverse populations (40). A study
in the Journal of Clinical Epidemiology revealed that the FFQ consisting of 128-items
is useful in the measurement of dietary intake in adults. The limitations were that
women 30 to 50 years of age and the overweight population reported higher mean
nutrient intakes on the FFQ when compared with food records (41).
Food Records
The use of food records to assess dietary intake accurately have been
validated in many research studies. Results of a study in the non-obese population
detailed in the Journal of Clinical Nutrition in Europe validated the accuracy of an

29
easy-to-use semi quantitative 4-day food record, when compared with total energy
expenditure estimated by the doubly labeled water technique (EE (DLW)) that was
taken for 14 days (42).
According to a study detailed in the Journal of Eating Disorders, the food
record must be utilized simultaneously with a diet history in obese women, due to
overreporting related to restrained eating and underreporting related to emotional
and external eating behaviors (43).
The Journal of Clinical Nutrition in Europe reviewed a study that researched a
fruit and vegetable questionnaire consisting of a 24-hour recall and a FFQ. Next,
participants completed a 7-day food record, which consisted of a 1-day weighted
food record (WFR) and a 6-day estimated food record. The results revealed that the
4-day food record correlated in a similar manner as the 7-day record when
compared to the FFQ (44).
Bioelectrical Impedance Analyzer
Bioelectrical impedance analyzers (BIA) are used to measure individual total
body fat and the measurements are population specific, unlike other body
composition methods such as external skin fold measurements. Specifically,
Omron�s BIA devices are highly correlated with hydrodensitometry (9).
BIA devices have been validated in several studies as accurate body
composition measurement devices. A comparative study revealed more accuracy in
body composition measurements with the multiple-frequency bioelectrical
impedance analyzers (MF-BIA) in individuals obese and athletic than with single-
frequency analyzers (SF-BIA). In this study, the reference measurement of Dual X-

30
Ray absorptiometry (DXA) was used to compare the accuracy and estimation errors
of these devices. It was found that single-frequency BIA devices resulted in
underreported percentages of body fat in obese individuals, because they utilized
calculations that assume that extra-cellular and intracellular water remain constant.
Individuals who are obese have increases in extra-cellular water (ECW), which
results in underreporting of increases in fat-free mass (FFM) and ECW and
decreases in intracellular water (ICW). Multi-frequency bioelectrical impedance
analyzers (MF-BIA) use different frequencies to measure ECW and ICW, thereby
providing more accuracy in both obese and athletic individuals (45). In addition, BIA
measurements are utilized as reference measurements in several studies. For
example, BIA measurements were utilized as the reference for comparison in a
study to determine the performance of the BMI for the diagnosis of obesity and
prediction of body fat in adult subjects (46).
Literature and research in this section has revealed that individuals who are
overweight and obese may reduce their health risk(s) if they lose weight. In
particular, research on dietary therapies have revealed that low-fat diets,
macronutrient composition of diets, calcium intake, meal planning, promoting self-
efficacy, and utilizing the services of dietetic professionals may increase an
individual�s chance to successfully lose weight and/or reduce their health risk(s). The
next chapter will detail the research design and methodology.

31
CHAPTER THREE: RESEARCH DESIGN AND METHODOLOGY
Experimental Design
A comparative randomized block experimental study was conducted for 2
months comparing the use of personalized low-fat meal plans vs. non-personalized
low-fat meal plans and the results in body fat reduction in overweight and obese
subjects 25 to 45 years of age.
Low-fat meal plans
The personalized low-fat meal plans were tailored to each subject�s eating
schedule, food preferences, and food choices, with consideration to their health
conditions and other nutritionally and medically relevant information. The subjects
who received the personalized low-fat meal plans received two 30-minute dietetic
consultations, whereas the subjects who received non-personalized low-fat meal
plans did not. The non-personalized meal plans were not tailored specifically to each
subject. The low-fat meal plan from the Hi-Tech Trainer software (47) was utilized to
provide each subject who received the non-personalized meal plans with the same
food selections. The personalized and non-personalized low-fat meal plans used in
this study included 7 days of food selections for breakfast, morning snack, lunch,
afternoon snack, dinner, and evening snack. All subjects were instructed to repeat
each 7-day meal plan for a total of four weeks. The low-fat meal plans utilized in this
study were developed by Registered Dietitians and obtained through the Hi-Tech
Trainer software (47). The low-fat meal plans were designed for various calorie
levels and serving sizes followed the American Diabetes Association�s diabetic
32
exchange format. The macronutrient composition of each personalized and non-
personalized low-fat meal plan was designed to provide the following percentages of
daily calories: 60% of calories from carbohydrates, 25% of calories from protein, and
15% from fat. The carbohydrates and protein were increased in order to decrease
the percentage of calories from fat and provided 10% less fat than the American
Diabetes Association�s diabetic meal plans. All subjects were provided with one low-
fat meal plan beginning on September 1, 2007, to use for the first month and another
beginning on September 29, 2007, for use in the second month, for a total of two
meal plans throughout the study.
Body Fat Analysis Measurements
On September 1 and again on October 27, 2007, at initiation and end of the
2-month treatment period, respectively, Michael J. Buzan, the Certified Personal
Trainer at Central FITT, Inc., performed body fat measurements using the Omron
model HBF-306 handheld bioelectrical impedance analysis (BIA) device on each
subject (48). This allowed for analysis and comparison of the percentage of body fat
reduction. According to the American College of Sports Medicine�s (ACSM)
Guidelines for Exercise Testing and Prescription Sixth Edition, subjects were
instructed to not eat 4 hours prior to, and not drink alcohol 2 days prior to,
performing each body fat measurement using this device (49). The measurement
procedure was not physically invasive. It involved programming the device with each
subject�s height, weight, age, and sex. Then, each subject was instructed to grip the
electrode handles on each side of the device in a candlestick fashion, while the
personal trainer pressed the start button to begin the analysis. The principle used

33
with a BIA device is that electrolytes conduct electricity and fat impedes electricity.
The Omron model HBF-306 BIA device measures the amount of resistance created
by a subject�s body fat and, after analysis, determines their body fat percentage (48).
Location of Study
The research study was conducted with the permission of the President at
Central FITT, Inc., Personal Training and Nutrition Studio located at 2010 S.
Broadway in Edmond, Oklahoma. Central FITT, Inc., has served the Edmond and
Greater Oklahoma City public for more than 4 years beginning in 2002 through
offering specialized and tailored personal training and nutrition consultation to
healthy individuals and those with various health conditions. In the research study,
Stacy D. Buzan, American Dietetic Association-Registered and Licensed Dietitian
(ADA-RD/LD) and Vice-President, served as the Researcher/Primary Investigator,
and Michael J. Buzan, National Strength and Conditioning Association-Certified
Personal Trainer (NSCA-CPT) and President, performed the body fat analysis
measurements. At Central FITT, Inc., Stacy D. Buzan, RD/LD, provided dietetic
consultation and Michael J. Buzan, NSCA-CPT, provided personal training to
clientele. The qualifications of the Dietetic Consultant include 14 years dietetic
experience; completion of an Associate�s Degree in Applied Science in Dietetic
Technology; Dietetic Technician Internship of 475 hours; Bachelor�s Degree in
Nutrition, Food Service Management, and Dietetics; Master�s Degree in Human
Nutrition coursework and Supervised Practice experience; and credentials as an
ADA Registered and Licensed Dietitian (RD/LD) and Dietetic Technician Registered
(DTR) in the State of Oklahoma. The qualifications of the Personal Trainer include
34
the completion of a Bachelor�s Degree in Kinesiology and 6 years experience in the
fitness field. In addition, refer to Appendix A for the letter that granted permission to
complete this research study in this facility. The researcher received approval from
the Eastern Michigan University College of Health and Human Services Human
Subjects Review Committee to initiate this research study on May 15, 2007
(Appendix A).
Preparation Process
This experimental research study consisted of a preparation process of 1
month, in which subject recruitment, determination of eligibility, completion of the
Information Packet forms, Nutrition Education Workshop, and assignment of
subjects to treatment groups took place. The Research Study Flowchart can be
found in Appendix B.
Subjects
The study population was proposed to be 16 to 32 overweight and obese
male and female subjects from various ethnicities and economic situations. The
sample population was designed to represent overweight to obese individuals who
were between 25 and 45 years of age and relatively healthy. Healthy is used in this
research study to imply that they were limited to minor health problems. Individuals
had to meet the following criteria to be eligible for participation: be between 25 and
45 years of age, classified as overweight or obese with BMI measurement between
25 and 50, and limited to minor chronic health problems (3, 6). The age range for
subjects helped to minimize the influence of age-related decrease in metabolism on
the study results.

35
Exclusion of Certain Medical Conditions
The exclusion criteria helped to protect, and minimized any potential risk to,
individuals who had the following health conditions: food allergies, food intolerances,
cancer, debilitating joint conditions (i.e., degenerative joint disease [DJD] and
degenerative disk disease [DDD]), Diabetes Mellitus that received insulin therapy,
kidney problems, menopause, polycystic ovarian syndrome (PCOS), were currently
pregnant or breast feeding and/or using diuretics, chromium, and/or diet pills. This
was to avoid imposing any potential harm and limited the effect of bias on the
results.
The exclusion of individuals with food allergies and/or food intolerances
avoided potential food allergic reactions. This was an especially important safety
concern since these individuals were randomly assigned to treatment groups, which
included assignment to the Treatment 1 Group where non-personalized low-fat meal
plans were provided.
Cancer and the therapies used to treat cancer can increase an individual�s
need for extra calories and protein to maintain lean muscle mass and overall health.
These needs can be met only through personalized meal planning and medical
nutrition therapy (MNT). Debilitating joint conditions such as DJD and DDD cause
pain and limit mobility. The activity factor used to calculate these individuals� calorie
needs would potentially influence the results of this study and would not be
representative of a normal active population. Active population here refers to
individuals consistently active in daily life activities.
36
Individuals with Diabetes Mellitus who use insulin therapy to help manage
their glucose levels were excluded based upon several factors. A study detailed in
the Journal of Diabetes, Obesity, and Metabolism found that patients receiving
insulin therapy who had Type II Diabetes Mellitus with normal and high BMI
measurements were at risk for weight gain and increased insulin requirements. The
addition of Metformin therapy, when combined with insulin therapy, reduced insulin
requirements, thereby decreasing the risk for weight gain (50). The hormonal effects
on metabolism excluded participation of individuals with menopause and polycystic
ovarian syndrome (PCOS), as the following studies indicate. A study revealed that
PCOS has been found to be the main reason for the occurrence of
hyperandrogenism in reproductive-age women. In addition, this syndrome is
associated with disorders in carbohydrate and adipose metabolism that can
influence weight loss efforts (32).
Individuals with kidney disease were excluded from participation in this study
due to the differences in hydration status. These differences in hydration status
could have resulted in significant differences between estimated and actual
percentages of body fat (9). For this same reason, individuals who were currently
using diet pills, weight loss supplements, and diuretics such as chromium picolinate
were also excluded from this study.
To protect special populations, individuals who were currently pregnant or
breast-feeding were excluded from participation in this study.
37
Modification in Exercise Regimen
Subjects did not modify, decrease, increase, and/or initiate an exercise
regimen while participating in the study, due to the effects of these changes on the
results.
Recruitment of Subjects
Subjects were recruited from approximately May 15 to August 30, 2007, in
order to obtain enough subjects for this study. Research study flyers were distributed
in Edmond, Oklahoma. An annual license to distribute flyers to neighborhoods and
businesses (Appendix A) was obtained from the City of Edmond. These flyers were
distributed to neighborhoods, community and civic groups, churches, physicians,
medical clinics, chiropractors, massage therapists, and businesses throughout
Edmond, Oklahoma. Individuals who were outside of Edmond, Oklahoma, were
recruited through placement of announcements in church bulletins, listings on
www.clinicaltrials.gov and www.postaroo.com, and the clinical trial listing and
recruitment services utilized through www.clinicalconnection.com. A total of 87
individuals were interested in participating in the research study, with 72.41% (N=63)
returning their Eligibility Questionnaires (Figure 1). Of the interested individuals,
93.65% (N=59) resided in Oklahoma and 6.35% (N=4) resided outside of Oklahoma
(Figure 1).
Eligibility Determination
In order to determine eligibility, individuals were required to complete the
Eligibility Questionnaire that screened for the study criteria. This questionnaire can
be found in Appendix C. At the end of the Eligibility Questionnaire, individuals were

38
asked to include their mailing address. If individuals were determined to be eligible
to participate, the Information Packet (Appendix C) was sent to that mailing address.
A total of 73.02% (N=46) of individuals met study criteria and were eligible to
participate in the study (Figure 1).
Information Packet Eligible subjects received the Information Packet to complete and return to
the researcher prior to attending the Nutrition Education Workshop. The Information
Packet consisted of the Informed Consent, HIPAA, and Medical and Nutritional Data
Form and is discussed briefly in the following paragraphs. The forms contained in
the Information Packet are located in Appendix C. Out of the Information Packets
sent to eligible individuals, 36.96% (N=17) were returned to the researcher, officially
Figure 1. Subject Eligibility

39
enrolling them as subjects in the research study (Figure 1). The original target
sample size (16 to 32 overweight and obese subjects) was achieved.
The Informed Consent and HIPAA Form
All subjects were required to sign the Informed Consent and Health Insurance
Portability and Accountability Act (HIPAA) forms that indicated their willingness to
participate in this study. They were allowed adequate time to read, ask questions,
comprehend, and sign the informed consent and the HIPAA form without being
coerced. The Informed Consent Form provided subjects with the purpose,
procedures, measurements, and treatments that were provided to subjects, and
names and contact information to ask questions. Also it stated that each subject�s
participation was voluntary and their participation could be withdrawn from the study
at any time without negative consequences or coercion. The Health Insurance
Portability and Accountability Act (HIPAA) Form provided details on the individual
information used; how it was to be used, kept confidential, and protected; and, at the
conclusion of the research study, how this information was collectively disseminated.
To participate in this research study, subjects agreed to travel to Oklahoma City and
Edmond, Oklahoma, from the following Oklahoma counties: Canadian, Cleveland,
Logan, Lincoln, Oklahoma, and Pottawatomie. Subjects were advised not to modify
and/or increase their exercise regimen. Modification in exercise regimen was defined
as any change in weight training or aerobic exercise as well as any change in the
amount of weight used and in the frequency, intensity, and/or duration of exercise.
For instance, if a subject�s weekly exercise regimen consisted of three 30-minute
walks and 1-hour segments of upper and lower body weight training three days a

40
week, he or she continued the same regimen without making any modifications. If a
subject did not exercise, he or she was advised not to initiate an exercise regimen
until after the completion of the research study. To decrease or increase their
exercise regimen at anytime throughout the study would have misrepresented the
body fat measurements resulting from the treatments in the Treatment 1 Group and
Treatment 2 Group. Subjects who refused to sign these forms were excluded from
the study.
Medical and Nutritional Data Form
The Medical and Nutritional Data Form (Appendix C) allowed the researcher
to gather the necessary medical and nutritional information, including the height,
weight, usual body weight, and specific medication regimen for each subject. This
form used questions from the Lifestyle Management Form 4.1--Client Assessment
Questionnaire (51). Information about their medication regimen is included, because
some medications can dramatically hinder weight loss attempts. For instance, in a
study detailed in the Journal of Neuropsychopharmacology, the atypical anti-
psychotics Olanzapine and Clozapine rapidly induced insulin resistance, which
explains the occurrences of hyperglycemia and ketoacidosis while using these
therapies (52).
Blocks
Prior to assignment of subjects to treatment groups they were separated into
blocks according to the following BMI classifications and gender: overweight females
(25.0 to 29.9), overweight males (25.0 to 29.9), obese class I females (30.0 to 34.9),
obese class I males (30.0 to 34.9), obese class II females (35.0 to 39.9), obese

41
class II males (35.0 to 39.9), extremely obese class III females (>40.0), and
extremely obese class III males (>40.0). Out of the enrolled subjects (N=17), female
subjects accounted for 88.235% (N=15) of the following BMI blocks: 17.647% (N=3)
Overweight, 5.88% (N=1) Obese I, 41.176% (N=7) Obese II, and 23.529% (N=4)
Obese III (Figure 2). The male subjects accounted for 11.765% (N=2) of the
following BMI blocks: Obese I 5.88% (N=1) and Obese II 5.88% (N=1) (Figure 2).
Separating subjects into these blocks allowed for accurate representation of
the differences in body fat reduction among these males and females within these
BMI classification categories. Statistically, these blocks helped to reduce chance
variation and improved validity of the study results.
Figure 2. Subjects per BMI Block
42
Assignment to Treatment Groups
The five-digit identification codes and the table of random digits were used to
randomly assign subjects to either the Treatment 1 Group or Treatment 2 Group.
The table of random digits can be found in The Basic Practice of Statistics (53).
Subsequently, subjects within each block were randomly assigned to either
the Treatment 1 Group, receiving non-personalized low-fat meal plans, or to the
Treatment 2 Group, receiving personalized low-fat meal plans along with two 30-
minute dietetic consultations. A total of 8 subjects were assigned to the Treatment 1
Group and 9 to the Treatment 2 Group. This helped to avoid bias and blinded the
researcher in the assignment of subjects to treatment groups.
In all Figures, Treatment will be abbreviated as Tx. The Treatment 1 Group
was composed of 12.50% (N=1) Overweight, 12.50% (N=1) Obese I, 37.50% (N=3)
Obese II, and 25.00% (N=2) Obese III female subjects, and 12.50% (N=1) Obese II
male subjects (Figure 3). The Treatment 2 Group was composed of 22.22% (N=2)
Overweight, 44.44% (N=4) Obese II, and 22.22% (N=2) Obese III female subjects,
and 11.11% (N=1) Obese I male subjects (Figure 4).

43
Figure 3. Subjects Assigned to Treatment 1 Group Across BMI Blocks
Figure 4. Subjects Assigned to Treatment 2 Group Across BMI Blocks

44
Both Treatment Groups
The use of equal percentages of calories from carbohydrates, protein, and fat
for both the personalized and non-personalized low-fat meal plans limited the
confounding variables related to macronutrient composition. Prior to providing the
low-fat meal plans, the estimated daily energy needs for each subject�s current body
weight and ideal body weight (IBW) were calculated based upon the information
obtained from the Medical and Nutritional Data Form that included height, current
body weight, usual body weight, age, and activity level. With the first meal plan
provided at month 1, the daily calorie level for each subject in both treatment groups
was reduced by 500 calories from their estimated daily energy needs. With the
second meal plan provided at month 2, the daily calorie level for subjects in both
treatment groups was reduced by an additional 500 calories. A reduction of 500
calories per day can result in an individual losing 1 pound of weight per week (54,
55).
Nutrition Education Workshop
Subjects attended the required 1-hour Nutrition Education Workshop taught
by the researcher. This ensured that each subject, regardless of treatment group,
had knowledge of basic nutrition. They were taught about the reasons for losing
excess body weight, goal setting, food guide pyramid, and reasons for meal
planning. The first step in the 4-step goal-setting process, previously discussed in
Chapter 2, was implemented in this workshop. This inspired subjects to examine and
recognize their needs and reasons for body fat and weight reduction. Setting their
own underlying reasons for weight-loss and goal attainment helps to remind them

45
that they are worth the change and effort when subjects enter their relapse period, a
period defined as when most individuals return to their previous unhealthy habits.
The instructional plan for the Nutrition Education Workshop is located in Appendix D.
Subjects had the choice of attending a weekend or evening workshop between
August 10 and September 29, 2007. Of these enrolled subjects, 52.94% (N=9)
attended one of the dates for the Nutrition Education Workshop. The following
Figure provides the workshop attendance per treatment group (Figure 5).
Treatment Process
Beginning on September 1, 2007, the 2-month treatment process began with
subjects receiving either the treatment provided in Treatment 1 Group or the
treatment provided in Treatment 2 Group. All subjects received a pre- and post-body
fat analysis.
Figure 5. Workshop Attendance per Treatment Group
46
Protection of Subjects from Harm
In addition to the exclusion criteria, the study procedures for protecting
against and minimizing any potential risk were the following. First, the study criteria
age range of 25 to 45 years protected against and minimized any potential risk
related to nutritional needs in the pediatric, adolescent, and senior populations.
Second, the criteria of BMI measurement between 25 and 50 limited the participation
and protected individuals who were classified as underweight by BMI of <18.5
against any potential risk. Third, the blocks of subjects allowed for the accurate
statistical representation of the differences in body fat reduction among males and
females in the BMI categories of overweight (BMI of 25.0 to 29.9), obese class I
(30.0 to 34.9), obese class II (35.0-39.9), and extremely obese class III (>40.0). In
addition, these blocks statistically helped to reduce chance variation and improved
validity of the research study results.
Treatment 1 Group
Each subject assigned to the Treatment 1 group received non-personalized
low-fat meal plans as treatment. Two non-personalized low-fat meal plans were
provided: one at the beginning of the study to use for the first month and another
one a month later to use for the second month. The subjects in the Treatment 1
group did not receive personal dietetic consultations. Each subject completed and
returned two 3-day Food Diaries during the study. The Food Diaries consisted of the
date, time, meal, place, with whom, food items, and amounts eaten, as well as
feelings and appetite. These Food Diaries revealed eating behaviors, consumption
patterns, and intake. Amounts were noted as teaspoons, tablespoons, cups, ounces,
47
and pounds on the forms. The 3-day Food Diary is located in Appendix E. Subjects
in the Treatment 1 group were asked to return their first completed 3-day Food Diary
to the researcher one week before receiving their second low-fat meal plan. This
allowed the researcher a week to note meal plan compliance. The second 3-day
Food Diary was turned in to the researcher at the completion of the study. The 3-day
Food Diary was used to make sure that subjects were following the meal plan
provided and not for individualized treatment. Please see Appendix F for an example
of one of the non-personalized meal low-fat meal plans.
Treatment 2 Group
Each subject assigned to the Treatment 2 group received personalized low-
fat meal plans and two 30-minute individual dietetic consultations. Two personalized
low-fat meal plans were provided: one at the beginning of the study to use for the
first month and another at the end of the first month to use for the second month.
Each subject received one 30-minute individual dietetic consultation per month for a
total of two consultations. The first individual dietetic consultation took place at the
beginning of the study. The second consultation took place approximately one-
month into the study. Prior to the first individual dietetic consultation, subjects were
asked to return two completed forms to the researcher. The first form was a Food
Frequency Questionnaire (FFQ) containing 122 food items (Appendix G). The FFQ
was utilized to estimate each subject�s dietary intake in the Treatment 2 group. The
second form was a 3-day Food Diary (Appendix E) that required subjects to note the
date, time, meal, place, with whom, food items, and amounts eaten, along with
feelings and appetite. The Food Diary revealed eating behaviors, consumption

48
patterns and intake. Amounts were noted as teaspoons, tablespoons, cups, ounces,
and pounds on this form. The researcher had one week from receipt of the forms
until the first individual dietetic consultation. This allowed the researcher time to
review the forms and analyze the data, providing a thorough estimate of each
subject�s dietary intake, including the calories, amount of carbohydrates, fruits and
vegetables, protein, dairy, and fat. The food selections on the low-fat meal plans
were personalized using the information obtained from the Medical and Nutritional
Data Form (Appendix C) and during the first individual dietetic consultation. In
addition, subjects were allowed to contact the researcher for additional help with the
meal plans throughout the research study. Subjects were also asked to return a
completed 3-day Food Diary to the researcher one month into the study. This
allowed the researcher a week to estimate meal plan compliance, prior to providing
subjects with the second low-fat meal plan. Subjects also completed a 3-day Food
Diary at the completion of the study. Subjects in the Treatment 2 group completed
three 3-day Food Diaries, one more 3-day Food Diary than Treatment 1 group
subjects.
Statistical Analysis
The statistical analysis used for this randomized comparative block
experiment is detailed in the following paragraphs. The quantitative variable to
compare the results of Treatment 1 and Treatment 2 was the reduction in body fat
percentage. Reductions in body fat percentage were derived from the pre- and post-
experiment body fat analysis measurements on each subject. The two-sample
independent t-statistic test was used to compare reductions in body fat percentage
49
that resulted from Treatment 1 and Treatment 2 in each block. The following were
the null hypotheses and alternative hypotheses for the overweight females,
overweight males, obese I females, obese I males, obese II females, obese II males,
obese class III females, and obese class III males blocks respectively: Ho: x 1= x 2,
Ha: x 1< x 2; Ho: x 3= x 4, Ha: x 3< x 4; Ho: x 5= x 6, Ha: x 5< x 6; Ho: x 7= x 8, Ha: x 7< x 8;
Ho: x 9= x 10, Ha: x 9< x 10; Ho: x 11= x 12, Ha: x 11< x 12; Ho: x 13= x 14, Ha: x 13< x 14;
and Ho: x 15= x 16, Ha: x 15< x 16. The alpha level and significance was set at P ≤ 0.05.
In Table 1, the mean or average of the pre- and post-body weight, body fat
percentage, body fat mass, and the changes for each BMI block and all BMI blocks
in Treatment Group 1 are noted. In Table 2, the mean or average of the pre- and
post-body weight, body fat percentage, body fat mass, and the changes for each
BMI block and all BMI blocks in Treatment Group 2 are noted.
The data in Table 1 and Table 2 and the SPSS software were used to
produce a case summary that included the standard deviation(s) for each block
within each treatment group (56). The two-sample t-statistic was used to find out if
there was a significant difference between the effect of Treatment 1 and Treatment 2
on body fat percentage reduction. The following were the t-statistic equations that
were utilized to compare Treatment 1 and Treatment 2 separately in the overweight
females, overweight males, obese I females, obese I males, obese II females, obese
II males, obese class III females, and obese class III males respectively:

50
t= x 1- x 2 t= x 3 - x 4
t= x 5 - x 6 t= x 7 - x 8
_______________ _______________ ______________ ______________
√¯¯¯¯¯¯¯¯¯ √¯¯¯¯¯¯¯¯¯ √¯¯¯¯¯¯¯¯¯ √¯¯¯¯¯¯¯¯¯ s1
2 + s22 s3
2 + s42 s5
2 + s62 s7
2 + s82
____ ____ ____ ____ ____ ____ ____ ____
n1 n1 n3 n4 n5 n6 n7 n8 t= x 9- x 10
t= x 11 - x 12 t= x 13 - x 14
t= x 15 - x 16
_______________ _______________ ______________ ______________
√¯¯¯¯¯¯¯¯¯ √¯¯¯¯¯¯¯¯¯ √¯¯¯¯¯¯¯¯¯ √¯¯¯¯¯¯¯¯¯ s9
2 + s102 s11
2 + s122 s13
2 + s142 s15
2 + s162
____ ____ ____ ____ ____ ____ ____ ____
n9 n10 n11 n12 n13 n14 n15 n16
The difference between the reductions in body fat percentage in each block
that resulted from Treatment 1 and Treatment 2 were calculated, using the following
equations: overweight females x 1- x 2, overweight males x 3 - x 4, obese I females x 5
- x 6, obese I males x 7 - x 8, obese II females x 9- x 10, obese II males x 11 - x 12, obese
III females x 13 - x 14, and obese III males x 15 - x 16. Data were analyzed and a case
summary generated using the SPSS software to find the mean, sum of mean,
standard deviations, and standard error of measure within each block and for both
treatments. Using the degrees of freedom for each block and the t-statistic, the P-
value was found by using the t-distribution critical values located in Table C in the
Basic Practice of Statistics Third Edition (57). The P-value was compared to the
alpha level of 0.05 to determine whether to accept the null hypothesis or if there was
a statistically significant difference in favor of Treatment 2 and the alternative
hypothesis.
The SPSS software was utilized to create a clustered bar graph to represent
the mean of body fat reduction that resulted from Treatment 1 and Treatment 2 in

51
the female and male blocks of subjects (56). This bar graph is in the Results and
Discussion section.
Main Outcome Measures
At the conclusion, reductions in body fat percentage resulting from the
Treatment 1 of non-personalized low-fat meal plans and the Treatment 2 of
personalized low-fat meal plans with two 30-minute dietetic consultations were
compared using statistical analysis to determine whether Treatment 2 resulted in a
statistical significant reduction in body fat percentage in overweight and obese
subjects. The pre- and post-experiment body fat percentages and statistical analysis
were utilized to analyze the result of this comparative randomized block experiment.

52
Ta
ble
1. M
ean
Cha
nges
in B
ody
Wei
ght,
Bod
y Fa
t Per
cent
age,
and
Bod
y Fa
t Mas
s in
Tre
atm
ent G
roup
1
* N s
tand
s fo
r Num
ber o
f Sub
ject
s **↓
stan
ds fo
r dec
reas
e/re
duct
ion
in th
e di
ffere
nce(
s) b
etw
een
pre-
and
pos
t-mea
sure
men
t(s)
*** ↑
sta
nds
for i
ncre
ase
in th
e di
ffere
nce(
s) b
etw
een
pre-
and
pos
t-mea
sure
men
t(s)
Blo
cks
N*
Mea
n B
efor
e A
fter
Cha
nge
Ove
rwei
ght F
emal
es
0 W
eigh
t (po
unds
)
Body
Fat
Per
cent
age
(%)
Bo
dy F
at M
ass
(pou
nds)
Obe
se I
Fem
ales
0
Wei
ght (
poun
ds)
Bo
dy F
at P
erce
ntag
e (%
)
Body
Fat
Mas
s (p
ound
s)
O
bese
II F
emal
es
1 W
eigh
t (po
unds
) 20
7.40
20
3.1
↓ 4
.3**
Body
Fat
Per
cent
age
(%)
36.
9 3
6.6
↓ 0
.3**
Body
Fat
Mas
s (p
ound
s)
76.
383
74.
334
↓ 2
.049
**
Obe
se II
Mal
es
1 W
eigh
t (po
unds
) 26
3.00
26
0.7
↓ 2
.3
Body
Fat
Per
cent
age
(%)
31.
2 3
2.5
↑ 1
.3**
*
Bo
dy F
at M
ass
(pou
nds)
8
2.00
8
4.72
75
↑ 2
.727
5***
Obe
se II
I Fem
ales
1
Wei
ght (
poun
ds)
301.
60
284
↓17.
6
Bo
dy F
at P
erce
ntag
e (%
) 4
9.0
47.
8 ↓
1.2
Bo
dy F
at M
ass
(pou
nds)
14
7.78
13
5.75
↓1
2.03
Al
l Blo
cks
3
Wei
ght (
poun
ds)
257.
33
249.
267
↓ 8
.067
**
Body
Fat
Per
cent
age
(%)
39.
033
38.
967
↓
.067
**
Body
Fat
Mas
s (p
ound
s)
102.
054
98.
2705
↓
3.7
8383
**

53
Tabl
e 2.
Mea
n C
hang
es in
Bod
y W
eigh
t, B
ody
Fat P
erce
ntag
e, a
nd B
ody
Fat M
ass
in T
reat
men
t Gro
up 2
* N s
tand
s fo
r Num
ber o
f Sub
ject
s **↓
stan
ds fo
r dec
reas
e/re
duct
ion
in th
e di
ffere
nce(
s) b
etw
een
pre-
and
pos
t-mea
sure
men
t(s)
*** ↑
sta
nds
for i
ncre
ase
in th
e di
ffere
nce(
s) b
etw
een
pre-
and
pos
t-mea
sure
men
t(s)
Blo
cks
N*
Mea
n B
efor
e A
fter
Cha
nge
Ove
rwei
ght F
emal
es
1 W
eigh
t (po
unds
) 14
1.7
134.
1 ↓
7.6
**
Body
Fat
Per
cent
age
(%)
33.
7 3
2.8
↓ 0
.9**
Body
Fat
Mas
s (p
ound
s)
47.
75
43.
9847
99
↓ 3
.765
**
Obe
se I
Fem
ales
0
Wei
ght (
poun
ds)
Bo
dy F
at P
erce
ntag
e (%
)
Body
Fat
Mas
s (p
ound
s)
O
bese
II F
emal
es
3 W
eigh
t (po
unds
) 21
7.23
20
5.33
↓1
1.9
Body
Fat
Per
cent
age
(%)
42.
1667
4
0.9
↓ 1
.267
Bo
dy F
at M
ass
(pou
nds)
9
1.82
26
84.
1046
↓
7.7
18
Obe
se II
Mal
es
0 W
eigh
t (po
unds
)
Body
Fat
Per
cent
age
(%)
Bo
dy F
at M
ass
(pou
nds)
Obe
se II
I Fem
ales
0
Wei
ght (
poun
ds)
Bo
dy F
at P
erce
ntag
e (%
)
Body
Fat
Mas
s (p
ound
s)
Al
l Blo
cks
4
Wei
ght (
poun
ds)
198.
35
187.
525
↓10.
825**
Bo
dy F
at P
erce
ntag
e (%
) 4
0.05
3
8.87
5 ↓
1.1
75**
Body
Fat
Mas
s (p
ound
s)
80.
8045
7
4.07
4649
5 ↓
6.7
2985
05**

54
CHAPTER FOUR: RESULTS AND DISCUSSION
The pre-body fat analysis was performed on the subjects who attended the
workshop (N=9). Body fat percentages ranged between 31.2 and 49.0%
(M=39.6143%) in both female and male subjects and 33.7 and 49.0% (M=41.016%)
in female subjects. For the Treatment 1 Group, the pre-body fat measurements were
the following: 36.9% in Obese II and 49.0% in the Obese III BMI block female
subjects, and 31.2% for the Obese II male subject. Within this treatment group, the
BMI blocks that did not receive a pre-body fat analysis due to non-attendance at the
workshop were Overweight female (N=1), Obese II female (N=2), and Obese I male
(N=1). There were no female subjects in the Obese I BMI group and no male
subjects in the Overweight and Obese III BMI groups. One female subject in the
Obese III BMI block attended the workshop, received her pre-body fat analysis and
two non-personalized low-fat meal plans, and did not attend the final meeting to
complete the research study. For the Treatment 2 Group, the pre-body fat
measurements were the following: 33.7% in Overweight and 40.4 to 43.7%
(M=42.167%) in the Obese II BMI block female subjects. Within this treatment group,
the subjects who did not receive a pre-body fat analysis due to non-attendance at
the workshop were in the Overweight female (N=1), Obese I female (N=1), Obese II
female (N=1), and Obese III female (N=1) BMI Blocks. One female subject in the
Obese III BMI block attended the workshop, received her pre-body fat analysis, and
did not complete the research study.
Post-body fat analysis was performed on subjects at their final visit. Body fat
percentages ranged from 32.5 to 47.8% (M=38.91%). In the Treatment 1 Group, the

55
post-body fat measurements were 36.6% for the female subjects in the Obese II BMI
block, 47.8% for the female subjects in the Obese III BMI block, and 32.5% for the
male subject in the Obese II BMI block. One Obese III female BMI block subject did
not attend the final visit to receive her post-body fat analysis. In the Treatment 2
Group, the post-body fat measurements were 32.8% for the female subject in the
Overweight BMI block and 40.2 to 41.9% (M=40.9%) for the female subjects in the
Obese II BMI block. No active subjects in the Obese III female BMI blocks reported
for their post-body fat measurements at the final visit.
The final body fat analyses revealed that subjects reduced their percentage of
body fat mass by �1.3 to 3.1% (M=4.9%), with reductions in body fat mass of -2.73
to 17.116# (M=5.47#) and reductions in body weight of 0.8745 to 10.80%, an actual
loss of 2.3 to 24.7# (M=4.31% or 9.64#). In addition to body fat loss, lean body mass
was also lost. Calculations revealed that subjects reduced their lean body mass by
0.42 to 5.89% (M=2.99%), which is 1.51 to 7.584# (M=4.12#).
More specifically, in Treatment 1 Group the body weight reduction ranged
from 0.8745 to 5.835% (2.3 to 17.6#), with a mean loss of 3.1347% of 257.33#, or
8.067#. This group also experienced reductions of body fat mass of 3.78% of
102.054#. By category this breaks down to 2.682% (2.049#) reduction in body fat
mass for the Obese II female BMI block, an 8.14% (12.03#) reduction in body fat
mass for the Obese III female BMI block, and an increase in body fat mass of
3.326% (2.7275#) in the Obese II male BMI block. One Obese III female BMI block
subject did not attend the final visit to receive her post-body fat analysis.

56
In the Treatment 2 Group, the body weight reduction ranged from 1.98 to
11.00% (4.6 to 24.7#) with a mean loss of 5.457% of 198.35# or 10.83#. This group
also experienced reductions of body fat mass of 7.885% of 47.75# in the Overweight
female BMI block and 3.139 to 17.126% (M=8.03%) of 2.9508 to 17.116#
(M=7.718#) in the Obese II female BMI block. Body fat mass reductions were not
reported in the Obese III female BMI block, due to lack of post-body fat analysis.
The SPSS software was utilized to create a bar graph to represent the mean
of the reduction in body fat percentage resulting from Treatment 1 and Treatment 2
in the female and male blocks of subjects (56). The study revealed that the body fat
reduction in the Obese II female BMI block was greater in subjects who received
Treatment 2 by 0.456 to 14.444% (M=5.347%), which is 0.902 to 15.067#
(M=5.931#) more than female subjects who received Treatment 1 (Figure 6). In
addition, the Treatment 2 Group Obese II female BMI block subjects had -0.095 to
8.727% or 0.3 to 20.4# (M=3.305 or 7.6#) more weight loss than those in the
Treatment 1 Group. The body fat reduction in the Obese II BMI block was greater in
those who received Treatment 2 by 4.172 to 14.444% (M=7.205%), which is 0.699 to
15.067# (M=7.657#) more when compared to subjects who received Treatment 1
(Figure 6). In addition, the Treatment 2 Group Obese II BMI block subjects had 1.11
to 8.727% or 2.3 to 20.4# (M=3.904% or 8.6#) more weight loss than those in the
Treatment 1 Group.
The study revealed that in all BMI blocks, the body fat reduction was greater
in female and male subjects who received Treatment 2 by 3.172 to 8.986%
(M=5.443%), which is 1.377 to 5.678# (M=2.946#) more than subjects who received

57
Treatment 1. In addition, in all BMI blocks in the Treatment 2 Group, female and
male subjects had 1.108 to 4.965% or 2.3 to 7.1# (M=2.447% or 2.759#) more
weight loss than those in the Treatment 1 Group.
In both Treatment Groups, the number of enrolled female and male subjects
who completed the research study in the Overweight, Obese I, and Obese III BMI
blocks were not balanced, therefore not allowing for comparison in each of these
BMI blocks separately. Therefore, the effects of Treatment 1 and Treatment 2 body
fat reductions were compared in the Obese II BMI Block and in all BMI blocks to
determine statistical significance. Comparison of the mean body fat reduction
percentages revealed that the Treatment 2, consisting of personalized meal planning
and two 30-minute dietetic consultations, resulted in a greater body fat reduction
Figure 6. Mean Body Fat Reduction per Treatment Group

58
( x 10=8.4053% or 7.718#) than the reduction ( x 9=2.6825% or 2.049#) from the
Treatment 1, consisting of non-personalized meal planning, in the Obese II female
BMI block. In addition, the comparison of the mean body fat reduction percentages
revealed that the Treatment 2, consisting of personalized meal planning and two 30-
minute dietetic consultations, resulted in a greater body fat reduction ( x Tx2
=8.3286% or 6.7299#) than the reduction ( x Tx1=3.7077% or 3.7838#) from the
Treatment 1, consisting of non-personalized meal planning, in all female and male
BMI blocks. The two-sample t-statistic test was calculated utilizing the following
equations to determine if there were significant differences between the effect of
Treatment 1 and Treatment 2 on body fat reduction in the Obese II female BMI block
and all BMI Blocks respectively:
The t statistic and p-value of the Obese II BMI Block was �1.2571 and of all
BMI blocks was 1.1897, and between .30 and .40 respectively. Table C, the t-
distribution of critical values in the Basic Practice of Statistics, Third Edition, was
utilized to find the p-value (57). The p-value of between .30 and .40 was greater than
the set alpha level and significance of P ≤ 0.05, which supports the alternative
hypotheses of Ha: x 9< x 10 and Ha: x Tx1< x Tx2. Simply put, this means that the body
fat reduction of the Obese II female BMI block ( x 10) and all BMI blocks in the
t= x 9 - x 10 ______________
√¯¯¯¯¯¯¯¯¯ s9
2 + s102
____ ____
n9 n10
t= x Tx1 - x Tx2
_______________
√¯¯¯¯¯¯¯¯¯ sTx1
2 + sTx22
______ ______
nTx1 nTx2

59
Treatment 2 Group ( x Tx2) was greater than the body fat reduction of the Obese II
female BMI block ( x 9) and all BMI blocks in the Treatment 1 Group ( x Tx1).
DISCUSSION
The original research question of whether the use of personalized low-fat
meal plans over a 2-month period among overweight and obese individuals 25 to 45
years of age would result in a greater increase in overall body fat reduction than the
use of non-personalized low-fat meal plans has been answered. According to the
study results, the trend in the data appears to support the hypothesis that Treatment
2 results in a greater body fat reduction than Treatment 1 in all BMI blocks. More
specifically, the trend in the data supports the use of personalized low-fat meal
planning with two 30-minute dietetic consultations as more effective in reducing body
fat than the use of non-personalized low-fat meal planning in females and males in
the BMI classification categories of Overweight (BMI=25.0 to 29.9), Obese I
(BMI=30.0 to 34.9), Obese II (BMI=35 to 39.9), and Obese III (BMI=>40).
The results of body fat reduction in both the Treatment 1 Group and
Treatment 2 Group BMI blocks confirm other studies noting the general effect from
the calorie reduction of low-fat diets resulting in approximately ½ pound of weight
loss per week (12). More specifically, the Treatment 1 Group BMI blocks had a
combined weight loss of 1.0084# per week while the Treatment 2 Group BMI blocks
had 1.3531# per week. Additionally, the Treatment 1 Group BMI blocks had a
combined loss in body fat mass of 0.4730# per week while the Treatment 2 Group
BMI blocks had 0.8412# per week. The results from this study revealed that the
personalized low-fat meal planning along with two 30-minute dietetic consultations

60
offered to the Treatment 2 Group resulted in 34.2% more weight loss and 77.8%
more body fat reduction per week. Both calorie reduction and personalized meal
planning with individualized dietetic consultations are needed to successfully
achieve weight loss and body fat reduction goals. The treatment in the Treatment 2
Group helped subjects increase their knowledge of, and build on previously
developed, self-efficacy skills, which helped to maintain perceived control over their
food selections. This provided a personal incentive to the subjects in the Treatment
2 Group in essence to own their weight loss, instead of crediting product(s) or fad
diet(s) for their success. Upon completion of this research study, all subjects in the
Treatment 2 Group freely expressed that they desired to continue their weight loss
goals and some subjects mentioned they wanted to start exercising to help with
reaching their goals.
The results also confirm the FDA recommendation that individuals consult a
Registered Dietitian to design a personalized meal plan that accounts for their needs
and medical conditions (24). Both treatment groups received low-fat meal plans that
provided 25% of calories from protein, which helped to limit the decline in each
subject�s lean muscle mass while they lost body weight (12).
Given that the percentage of obese adults over 20 years of age in 2005
estimates was approximately 25.4% and continues to grow, this study and future
research in this area will hopefully lead a trend to reduce the prevalence of obesity in
adults (1).

61
CHAPTER FIVE: CONCLUSIONS
Limitations
This research study could actually be termed a pilot study due to the small
number of enrolled subjects. Out of the enrolled subjects (N=17), 41.18% (N=7)
completed the study. The first limitation in this study was that, during the recruitment
process, the low number of Information Packets returned from eligible individuals in
turn affected the number of enrolled subjects. The reasons given by these
individuals for not returning the Information Packet were
1. The study did not provide full compensation for gas mileage,
2. Too much time was involved, and
3. Increased responsibilities at their workplace prohibited participation.
In addition, eligible subjects may have chosen not to enroll because they
were not in the appropriate stage of change needed in order to initiate and
implement the required changes to improve their health.
The second limitation was the dropout rate. The reasons enrolled subjects did
not complete the study included economic situations, a lack of commitment, and
relationship conflicts with other enrolled subjects. Another reason was that they did
not adhere to the meal plan and felt as if they had failed, even though they were
encouraged to continue. These reasons reveal that individuals need to be in the
appropriate stage of change to commit to lifestyle changes and, for some, money
and financial compensation is more important than improving their health. There
were more women subjects than men, so the results of this research study were
reported on females. Even though the number of subjects did not result in a

62
probability error in this study, the number of enrolled subjects completing the study
should be increased in future research studies in order to increase the power at an
alpha level of .05 (α=.05) and reduce the probability of a Type II error. A Type II error
is the probability of failure to reject the hypothesis H0 even though the alternative
hypothesis Ha is true.
Future Research
Future research studies should be expanded to many regions within the
United States in efforts to increase the number of enrolled subjects and allow for
greater representation of both the overweight and obese adult populations. This
expansion may also help to equalize distribution among treatment groups and limit
the effect of non-active enrolled subjects on comparative analysis within each
treatment group and BMI block.
Although this research study compared only quantitative data, future research
studies should include the comparison of both quantitative and qualitative variables.
For instance, the expansion of this study to many regions would allow for the
comparative analysis of body fat reduction in individuals from diverse cultures, ethnic
backgrounds, and socioeconomic status. Throughout this research study, economic
status, major life events, stress level, and work schedules of subjects were dynamic.
Future studies should analyze these qualitative variables and their effects on the
percentages of body fat reduction and weight lost. In future studies, the Prochaska
and DiClemente�s Stages of Change Model should be used in assessing readiness
to change in subjects. This would allow for the researcher to match the appropriate

63
intervention with a subject�s readiness for change, in order to ensure successful
nutrition counseling and education (14, 15).
The healthcare team can utilize these study results to justify referring
individuals who are obese to Registered Dietitians who individualize their nutritional
therapy, including personalized meal planning, to each client. The results of this
study and future research may benefit dietetic professionals by opening the lines of
communication between the wellness community and the dietetic community
regarding standards of care. Hopefully, professionals in the wellness community will
be encouraged to reconsider the practice of providing their clientele with non-
personalized meal plans for weight loss. This is one step toward protecting the
public through increasing their knowledge of harmful and inadequate nutritional
advice and services that may result in potential decreases in metabolism and
unintended nutritional deficiencies. The result of this research study will, hopefully,
allow the public to equip themselves with the knowledge to select quality nutrition
programs for responsible weight loss.

64
References
1. Centers for Disease Control. Early Release of Selected Estimates Based on
Data from the 2005 National Health Interview Survey. Available at:
http://www.cdc.gov/nchs/data/nhis/earlyrelease/earlyrelease200606/pdf.
Accessed July 5, 2006.
2. American Obesity Association. AOA Fact Sheet: Obesity Research. Available
at: http://www.obesity.org/subs/fastfacts/ObesityResearch.shtml. Accessed
June 10, 2006.
3. Centers for Disease Control. CDC-MMWR Surveillance Summaries.
Surveillance for Certain Health Behaviors among States and Selected Local
Areas--Behavioral Risk Factor Surveillance System, United States, 2003.
Available at: http://www.cdc.gov/mmwr/preview/mmwrhtml/ss5408a1.htm?
scid=ss5408a1e. Accessed July 3, 2006.
4. Federal Trade Commission. Consumer Features: Tipping the scales? Weight
Loss Ads Weigh Heavy on Deception. Available at: http://www.ftc.gov/bcp/
conline/features/wgtloss.htm. Accessed June 9, 2006.
5. North American Association for the Study of Obesity, NAASO: Obesity
Society-Baylor College of Medicine. The Trials of Hypertension Prevention II
slide 1: Relationship Between Change in Weight and Blood Pressure.
Available at: http://www.obesityonline.org/slides/slide01.cfm?q=tohp&dpg=1.
Accessed July 28, 2006.
6. National Center for Chronic Disease Prevention and Health Promotion.
Prevalence among U.S. Adults of a Metabolic Syndrome Associated with
65
Obesity, 2003. Available at: http://www.cdc.gov/nccdphp/dnpa/obesity/
trend/metabolic.htm. Accessed July 1, 2005.
7. North American Association for the Study of Obesity, NAASO: Obesity
Society-Baylor College of Medicine. Obesity and Dietary Therapy slide 3:
Decreasing Dietary Fat is Associated with a Decrease in Body Weight.
Available at: http://www.obesity online.org/slides/slide01.cfm?tk=38&dpg=3.
Accessed July 28, 2006.
8. Healthline. Gout Information. Available at: http://www.healthline.com/gale
content/gout. Accessed January 19, 2007.
9. Omron Healthcare Website. Omron Instruction Manual Body Fat Analyzer
Model HBF-306. Available at: http://www.omronhealthcare.com/enTouch
CMS/FileUplFolder/HBF_306imn.pdf. Assessed November 3, 2006.
10. Skalba P, Dabkowska-Huc A. The metabolic aspects of polycystic ovarian
syndrome. Endokrynol Pol. Nov-Dec 2005;56(6):960-963.
11. North American Association for the Study of Obesity, NAASO: Obesity
Society-Baylor College of Medicine. Metabolic Syndrome slide 8. Available at:
http://www.obesityonline.org/slides/slide01.cfm?q=metabolic+syndrome
&dpg=8. Accessed July 28, 2006.
12. Stiegler P, Cunliffe A. The role of diet and exercise for the maintenance of fat-
free mass and resting metabolic rate during weight loss. Sports Med.
2006;36(3):239-262.
13. WebMD. Evaluate the Latest Diets. Available at: http://www.webmd.com/
content/pages/11/39536.htm. Accessed July 20, 2006.

66
14. Holli BB, Calabrese RJ, Maillet JO. Communication and Education Skills for
Dietetics Professionals. Pennsylvania: Lippincott Williams & Wilkins; 2003:68-
91.
15. Green LW, Kreuter MW. Health Promotion Planning: an Educational and
Ecological Approach, 3rd Edition. California: Mayfield Publishing Company;
1991:299.
16. Kitsantas A. The role of self-regulation strategies and self-efficacy
perceptions in successful weight loss maintenance. Psychology & Health.
2000;15(6):811.
17. North American Association for the Study of Obesity, NAASO: Obesity
Society-Baylor College of Medicine. Medical Benefits to Modest Weight Loss
slide 2: Risk Factor Sum and 16-year Coronary Heart Disease Risk--
Framingham Offspring Study. Available at: http://www.obesityonline.org/slides
/slide01.cfm?tk=32&dpg=2. Accessed July 28, 2006.
18. Pedersen JO, Zimmermann E, Stallknecht BM, et al. Lifestyle intervention in
the treatment of severe obesity. Ugeskr Laeger. Jan 9 2006;168(2):167-172.
19. Yoshida Y, Hashimoto N, Tokuyama Y, et al. Effects of weight loss in obese
subjects with normal fasting plasma glucose or impaired glucose tolerance on
insulin release and insulin resistance according to a minimal model analysis.
Metabolism. Sep 2004;53(9):1095-1100.
20. Shapses SA, Riedt CS. Bone, body weight, and weight reduction: what are
the concerns? J Nutr. Jun 2006;136(6):1453-1456.

67
21. Cullen KW, Baranowski T, Smith SP. Using goal setting as a strategy for
dietary behavior change. Journal of the American Dietetic Association. May
2001;101(5):562-566.
22. American Dietetic Association. Evidence Supports Dietitian Effectiveness in
Obesity Treatment. Available at: http://www.eatright.org/cps/rde/xchg/ada/hs.
xsl/career_1691_ENU_HTML.htm. Accessed June 10, 2006.
23. American Dietetic Association Evidence Analysis Library. Type of evidence
supporting recommendations: Nutrition Education. Available at: http://www.
adaevidencelibrary.com/template.cfm?template=guidesummary&key=629.
Accessed June 9, 2006.
24. United States Food and Drug Administration. Diabetes Information-Food and
Meal Planning. Available at: http://www.fda.gov/diabetes/food.html. Accessed
July 28, 2006.
25. Carranza-Lira S, Velasco-Diaz G, Olivares A, Chán Verdugo R, Herrera J.
Correlation of Kupperman's index with estrogen and androgen levels,
according to weight and body fat distribution in postmenopausal women from
Mexico City. Int J Fertil Womens Med. Mar-Apr 2006;51(2):83-88.
26. Ryan AS, Nicklas BJ, Berman DM. Hormone replacement therapy, insulin
sensitivity, and abdominal obesity in postmenopausal women. Diabetes Care.
Jan 2002;25(1):127-133.
27. Lebrun CE, van der Schouw YT, de Jong FH, Grobbee DE, Lamberts SW.
Fat mass rather than muscle strength is the major determinant of physical

68
function and disability in postmenopausal women younger than 75 years of
age. Menopause. May-Jun 2006;13(3):474-481.
28. Bednarek-Tupikowska G, Filus A, Kuliczkowska-Plakseq J, Tupikowshi K,
Bohdanowicz-Pawlak A, Milewicz A. Serum leptin concentrations in pre- and
postmenopausal women on sex hormone therapy. Gynecol Endocrinol. Apr
2006:22(4):207-212.
29. Coppini LZ, Waitzberg DL, Campos AC. Limitations and validation of
bioelectrical impedance analysis in morbidly obese patients. Curr Opin Clin
Nutr Metab Care. May 2005;8(3):329-332.
30. Arroyo M, Rocandio AM, Ansotegui L, Herrera H, Salces I, Rebato E.
Comparison of predicted body fat percentage from anthropometric methods
and from impedance in university students. British Journal of Nutrition. Nov
2004:92(5):827-832.
31. Savastano S, Di Somma C, Belfiore A, et al. Growth hormone status in
morbidly obese subjects and correlation with body composition. J Endocrinol
Invest. June 2006:29(6):536-543.
32. Mlinar B, Marc J, Janez A, Pfeifer M. Molecular mechanisms of insulin
resistance and associated diseases. International Journal of Clinical
Chemistry. Jan 2007;375(1-2):20-35.
33. Perez-Cueto Evlert EJ, Roberfroid D, Kolsteren PW. Development and testing
of a semi-quantitative food frequency questionnaire for Bolivian adolescents.
Nutr Hosp. Sep-Oct 2006;21(5):573-580.

69
34. Dumartheray EW, Krieg MA, Cornuz J, et al. Validation and reproducibility of
a semi-quantitative Food Frequency Questionnaire for use in elderly Swiss
women. J Hum Nutr Diet. Oct 2006;19(5):321-330.
35. Xinying PX, Noakes M, Keogh J. Can a food frequency questionnaire be used
to capture dietary intake data in a 4-week clinical intervention trial? Asia Pac J
Clin Nutr. 2004;13(4):318-323.
36. Morin P, Herrmann F, Ammann P, Uebelhart B, Rizzoli R. A rapid self-
administered food frequency questionnaire for the evaluation of dietary
protein intake. Clin Nutr. Oct 2005;24(5):768-774.
37. Hudson TS, Forman MR, Cantwell MM, Schatzkin A, Albert PS, Lanza E.
Dietary fiber intake: assessing the degree of agreement between food
frequency questionnaires and 4-day food records. J Am Coll Nutr. Oct
2006;25(5):370-381.
38. Thomson CA, Giuliano A, Rock CL, et al. Measuring dietary change in a diet
intervention trial: comparing food frequency questionnaire and dietary recalls.
Am J Epidemiol. Apr 15 2003;157(8):754-762.
39. Kim J, Kim Y, Ahn YO, et al. Development of a food frequency questionnaire
in Koreans. Asia Pac J Clin Nutr. 2003;12(3):243-250.
40. Tucker KL. Assessment of usual dietary intake in population studies of gene-
Diet interaction. Nutr Metab Cardiovasc Dis. Feb 2007;17(2):74-81.
41. Paalanen L, Männistő S, Virtanen MJ, et al. Validity of a food frequency
questionnaire varied by age and body mass index. J Clin Epidemiol. Sep
2006;59(9):994-1001.

70
42. Koebnick C, Wagner K, Thielecke F, et al. An easy-to-use semiquantitative
food record validated for energy intake by using doubly labeled water
technique. Eur J Clin Nutr. Sep 2005;59(9):989-995.
43. Vansant G, Hulens M. The assessment of dietary habits in obese women:
influence of eating behavior patterns. Eat Disord. Mar-Apr 2006;14(2):121-
129.
44. Kristjansdottir AG, Andersen LF, Haraldsdottir J, de Almeida MD, Thorsdottir
I. Validity of a questionnaire to assess fruit and vegetable intake in adults. Eur
J Clin Nutr. Mar 2006;60(3):408-415.
45. Demura S, Sato S, Kitabayashi T. Percentage of total body fat as estimated
by three automatic bioelectrical impedance analyzers. J Physiol Anthropol
Appl Human Sci. May 2004;23(3):93-99.
46. Carrasco F, Reyes E, Rimler O, Rios F. Predictive accuracy of body mass
index in estimating body fatness measured by bioelectrical impedance. Arch
Latinoam Nutr. Sep 2004;54(3):280-286.
47. Keuilian, B. 2005. HiTech Trainer. Available at: http://www.hitechtrainer.com/.
Accessed June 10, 2006.
48. Omron Healthcare Inc. Weight Management: Body Fat Analyzer. Available at:
http://www.omronhealthcare.com/enTouchCMS/app/viewDocument?docID=4
5 &parntCatgld=35. Accessed June 14, 2006.
49. American College of Sports Medicine�s (ACSM). ACSM Guidelines for
Exercise Testing and Prescription, Sixth Edition. Pennsylvania: Lippincott
Williams & Wilkins; 2000.

71
50. Biesenbach G, Raml A, Alsaraji N. Weight gain and insulin requirement in
type 2 diabetic patients during the first year after initiating insulin therapy
dependent on baseline BMI. Diabetes Obes Metab. Nov 2006;8(6):669-673.
51. Bauer KD, Sokolik CA. Basic Nutrition Counseling Skill Development: A
Guideline for Lifestyle Management. Lifestyle Management Form 4.1�Client
Assessment Questionnaire. Belmont, CA: Wadsworth/Thomson Learning;
2002:254-256.
52. Houseknecht KL, Robertson AS, Zavadoski W, Gibbs EM, Johnson DE,
Rollema H. Acute effects of atypical antipsychotics on whole-body insulin
resistance in rats: implications for adverse metabolic effects.
Neuropsychopharmacology. Feb 2007;32(2):289-297.
53. Moore, DS. The Basic Practice of Statistics, 3rd edition. Table B Random
Digits. New York: W.H. Freeman and Company; 2004:166.
54. Harris JA, Benedict FG. A biometric study of basal metabolism in man.
Washington: Carnegie institution of Washington; 1919.
55. American Dietetic Association Evidence Analysis Library. Adult Weight
Management (AWM) Reduced Calorie Diets: Recommendations Summary
Page. Available at: http://www.adaevidencelibrary.com/template.cfm?
template=guidesummary&key=622#supportevidence. Accessed March 16,
2008.
56. Moore, DS, McCabe, GP. The Basic Practice of Statistics 3rd edition: CD-
ROM, Upgrade Study Pack and SPSS Guide. New York: W.H. Freeman and
Company; 2005.

72
57. Moore, DS. The Basic Practice of Statistics, 3rd edition. Table C t distribution
critical values. New York: W.H. Freeman and Company; 2004;166.

73
APPENDIX A: Approval Letters and License

74

75
Central FITT, Inc. Personal Training and Nutrition Studio
Edmond Oklahoma July 9, 2008 Eastern Michigan University Starkweather Hall, 2nd Floor Ypsilanti, MI 48197
Dear Human Subjects Review Board:
I, Michael J. Buzan, President of Central FITT, Inc Personal Training and Nutrition Studio grant approval and permission for Stacy D. Buzan to utilize this facility, staff, and supplies to conduct the thesis research study titled, �Comparison of Body Fat Reduction Utilizing Personalized Low-fat Meal Plans vs. Non-Personalized/Pre-planned Low-fat Meal Plans�. I agree with study criteria and approve the study procedures as detailed in the following paragraphs. This research study will allow Stacy D. Buzan to complete the thesis component in the Eastern Michigan University-Masters of Science program in Human Nutrition. Study criteria: Individuals are determined eligible to participate in this study if they are between the ages of 25 and 45, classified as overweight or obese with a body mass index (BMI) measurement between 25 and 50, and limited to minor chronic health problems. The BMI formula of weight in pounds/ [height in inches] 2 x 703 measures individual health risk through classification of individuals into the following categories: underweight (<18.5), normal weight (18.5 to 24.9), overweight (25.0 to 29.9), and obese class I (30.0 to 34.9), class II (35.0-39.9) and extremely obese class III (>40.0). The exclusion criteria of the following protects against and minimizes any potential risk to individuals with the following health conditions: food allergies or food intolerances, cancer, debilitating joint conditions such as Degenerative Joint Disease (DJD) and Degenerative Disk Disease (DDD), Diabetes Mellitus receiving insulin therapy, kidney problems, menopause, polycystic ovarian syndrome (PCOS), and/or are currently pregnant or breast feeding, using diuretics, chromium, and/or diet pills. To participate in this research study subjects must agree to travel to Oklahoma City and Edmond, Oklahoma and must reside in the following Oklahoma counties: Canadian, Cleveland, Logan, Lincoln, Oklahoma, and Pottawatomie. Subjects will be advised not to modify and/or increase their exercise regimen. Modifications in exercise regimen include changes in weight training and aerobic exercises and the amount of weight used, frequency, intensity, and/or duration. Decreasing or increasing their exercise regimen at time throughout the study could result in misrepresentation of the body fat measurements that result from the treatments in the treatment 1 group and treatment 2 groups. Study procedures: This comparative randomized block experimental study will be conducted for 3-months. The purpose of this study is to compare the use of non-personalized low-fat meal plans vs. personalized low-fat meal plans and results in body fat reduction in overweight and obese subjects 25 to 45 years of age. The study population is 16 to 32 overweight and obese, male and female subjects from various ethnicities and economic situations. Low-fat meal plans: The personalized low-fat meal plans are tailored to each subject�s food preferences and food choices, eating schedules, with consideration to their health conditions and other nutritionally and medically relevant information. The subjects that receive the personalized low-fat meal plans will receive individualized dietetic consultation, whereas the subjects that receive non-personalized low-fat meal plans will not. The non-personalized meal plans are not tailored specifically to each subject. The Hi-Tech Trainer software low-fat meal plan will be utilized to provide each subject receiving the non-personalized meal plans with the same food selections. The personalized
76
and non-personalized low-fat meal plans used in this study will include 7 days of food selections for Breakfast, morning snack, Lunch, afternoon snack, Dinner, and evening snack. All subjects will be instructed to repeat each 7-day meal plan for a total of four weeks. The low-fat meal plans that will be utilized in this study are developed by Registered Dietitians and provided through the Hi-Tech Trainer software. The low-fat meal plans are designed for various calorie levels and serving sizes follow the American Diabetic Association diabetic exchange format. The macronutrient composition of each personalized and non-personalized low-fat meal plans are designed to provide the following percentages of daily calories: 60% of calories from carbohydrates, 25% of calories from protein, and 15% from fat. The carbohydrates and protein were increased in order to decrease the percentage of calories from fat and provide 10% less fat than the American Diabetes Association diabetic meal plans. All subjects will be provided with one low-fat meal plan on June 12, 2007 to use for the first month and another on July 12, 2007 for use in the second month, for a total of two meal plans throughout the study. Body Fat Analysis Measurements: On June 12 and August 24, 2007 at initiation and end of the 2-month treatment period respectively Michael J. Buzan, the Certified Personal Trainer at Central FITT, Inc. will perform body fat measurements via the Omron model HBF-306 handheld bioelectrical impedance analysis (BIA) device on each subject. This will allow for analysis and comparison of the percentage of body fat reduction. According to the American College of Sports Medicine�s (ACSM) Guidelines for Exercise Testing and Prescription Sixth Edition, subjects will be instructed to not eat 4 hours prior to and not drink alcohol 2 days prior to performing each body fat measurement using this device. The measurement procedure is not physically invasive. It involves programming the device by inputting each subject�s height, weight, age, and sex. Then, each subject will be instructed to grip the electrode handles on each side of the device in a candlestick fashion, while the personal trainer presses the start button to begin the analysis. The principle used is that electrolytes conduct electricity and fat impedes electricity. The Omron model HBF-306 BIA device measures the amount of resistance created by a subject�s body fat and after analysis determines their body fat percentage. Preparation process: This experimental research study will consist of a preparation process of 1-month, in which subject recruitment, determination of eligibility, completion of the Information Packet forms, Nutrition Education Workshop, and assignment of subjects to treatment groups will take place respectively.
Recruitment of Subjects: Subjects will be recruited at during the first month of this research study from May 14 to May 31, 2007. Research study flyers will be distributed in Edmond, Oklahoma. An annual license to distribute flyers to neighborhoods and businesses in Edmond, Oklahoma was obtained from the City of Edmond, which is located in Appendix A of the thesis proposal. These flyers will be distributed to neighborhoods, community and civic groups, Churches, Physicians, medical clinics, Chiropractors, Massage Therapists, and businesses throughout Edmond, Oklahoma. To help recruit subjects that are outside of Edmond, Oklahoma announcements will be placed in Church bulletins, listings on www.postaroo.com, and the clinical trial listing and recruitment services will be utilized through www.clinicalconnection.com. Eligibility Determination: In order to determine eligibility, individuals are required to complete the Eligibility Questionnaire that screens if study criteria are met. Located at the end of the Eligibility Questionnaire, individuals are asked to include the mailing address. If individuals are determined to be eligible to participate, the Information Packet will be sent to that mailing address.
Information Packet: Eligible subjects will receive the Information Packet to complete and return
to the researcher prior to attending the Nutrition Education Workshop. The Information Packet consists of the Informed Consent, HIPAA, and Medical and Nutritional Data Form and is discussed briefly in the following. The Informed Consent Form provides subjects with the purpose, procedures, the measurements and treatments to be provided to subjects, and names and contact information to ask questions. Also, it states that each subject�s participation is

77
voluntary and their participation can be withdrawn from the study at any time without negative consequences or coercion. The Health Information Portability Act (HIPAA) Form provides details on the individual information to be used, how it will be used, kept confidential and protected, and at the conclusion of the research study how this information will be collectively disseminated.
The Informed Consent and HIPAA Form: The Informed Consent Form provides subjects with
the purpose, procedures, the measurements and treatments to be provided to subjects, and names and contact information to ask questions. Also, it states that each subject�s participation is voluntary and their participation can be withdrawn from the study at any time without negative consequences or coercion. The Health Insurance Portability and Accountability Act (HIPAA) Form provides details on the individual information to be used, how it will be used, kept confidential and protected, and at the conclusion of the research study how this information will be collectively disseminated. The Medical and Nutritional Data Form will allow the research to gather the necessary medical and nutritional information, including the height, weight, usual body weight, and specific medication regimen on each subject.
Nutrition Education Workshop: Subjects will attend the required 1-hour Nutrition Education
Workshop taught by the researcher. This will ensure that each subject has knowledge of basic nutrition. The instructional plan for the Nutrition Education Workshop is attached to Appendix D of the thesis proposal. Subjects will have the choice of attending a weekend or evening workshop in the week of June 3, 2007. For the workshop, a small conference room will be reserved at St. Elijah�s Orthodox Church located at 15000 N. May in Oklahoma City, Oklahoma.
Treatment Groups: Subsequently subjects will be randomly assigned to either the treatment 1 group that receives the treatment of non-personalized low-fat meal plans or to treatment 2 group that receives the treatment of personalized low-fat meal plans along with two 30-minute sessions of individual dietetic consultation.
Both Treatment Groups: The use of equal percentages of calories from carbohydrates, from protein, and fat on both the personalized and non-personalized low-fat meal plans limits the confounding variables related to macronutrient composition. Prior to providing the low-fat meal plans, the estimated daily energy needs will be calculated for each subject based upon the information obtained from the Medical and Nutritional Data Form that includes height, weight, age, and activity level. Each subject�s calorie level on the first low-fat meal plan is designed to provide a reduction in 500 calories from their estimated daily energy needs. The calorie level on the second low-fat meal plan is designed to provide an additional reduction in 500 calories from the estimated daily energy needs. The two low-fat meal plans will provide a combined reduction in 1,000 calories in order to promote weight reduction. A reduction in 500 calories per day can result in an individual losing 1 pound of weight per week. Treatment 1 Group: Each subject assigned to the treatment 1 group will receive non-personalized low-fat meal plans as treatment. One non-personalized low-fat meal plan will be provided on June 12, 2007 to use for the first month and another on July 12, 2007 for the second month, for a total of two meal plans. The subjects in the treatment 1 group will not receive personal dietetic consultation. A 3-day Food Diary that requires subjects to note the date, time, meal, place, with whom, food items and amounts eaten along with feelings and appetite prior to meals to reveal eating behaviors, consumption patterns and intake. Amounts may be noted as teaspoons, tablespoons, cups, ounces, and pounds on this form. The 3-day Food Diary is located in Appendix E. On both July 5 and August 24, 2007, subjects in the treatment 1 group are required to return a completed 3-day Food Diary to the researcher. This will allow the researcher a week to note meal plan compliance, prior to providing subjects with the second low-fat meal plan on July 12 and the completion of the research study on August 28, 2007 respectively. The 3-day Food Diary will only be used to make sure that subjects are following the meal plan provided and not for individualized treatment.

78
Treatment 2 Group: Each subject assigned to the treatment 2 group will receive personalized low-fat meal plans and individual dietetic consultation. One non-personalized low-fat meal plan will be provided on June 12, 2007 to use for the first month and another on July 12, 2007 for the second month, for a total of two low-fat meal plans. Also, subjects will receive one 30-minute individual dietetic consultation per month for a total of two consultations. The first individual dietetic consultation will take place the week of June 12, 2007 and the second consultation in the week of July 12, 2007. On June 7, 2007 prior to the first individual dietetic consultation, subjects are required to return two completed forms to the researcher. The first form is a Food Frequency Questionnaire, which contains 122 food items that will be utilized to provide an accurate estimate of each subject�s dietary intake in the treatment 2 group. The Food Frequency Questionnaire is located in Appendix F. The second form is a 3-day Food Diary that requires subjects to note the date, time, meal, place, with whom, food items and amounts eaten along with feelings and appetite prior to meals to reveal eating behaviors, consumption patterns and intake. Amounts may be noted as teaspoons, tablespoons, cups, ounces, and pounds on this form. The 3-day Food Diary is located in Appendix E. This will allow the researcher ten days to analyze this data and provide a thorough estimate of each subject�s dietary intake, including the calories, and amount of carbohydrates, fruits and vegetables, protein, dairy, and fat consumed daily prior to the first individualized dietetic consultation on June 12, 2007. The food selections on the low-fat meal plans will be personalized using this information, information obtained in the Medical and Nutritional Data Form, and during the first individual dietetic consultation. In addition, subjects will be allowed to assess the researcher for additional help with the meal plans throughout the research study. On July 5 and August 24, 2007, subjects are also required to return a completed 3-day Food Diary to the researcher. This will allow the researcher a week to estimate meal plan compliance prior to providing subjects with the second low-fat meal plan on July 12, 2007 and four days prior to the completion of the research study on August 28, 2007 respectively. Subjects in the treatment 2 group are required to provide one additional 3-day Food Diary, when compared the 3-day Food Diary requirement of the Treatment 1 Group subjects.
Blocks: Prior to assignment of subjects to treatment groups they will be separated into blocks according to the following BMI classification categories and sex: overweight females (25.0 to 29.9), overweight males (25.0 to 29.9), obese class I females (30.0 to 34.9), obese class I males (30.0 to 34.9), obese class II females (35.0 to 39.9), obese class II males (35.0 to 39.9), extremely obese class III females (>40.0), and extremely obese class III males (>40.0). Out of the 16 to 32 subjects in this study, each block will contain an approximate range of between 2 and 4 subjects. By separating subjects into these blocks, it will allow for accurate representation of the differences in body fat reduction among these males and females in these BMI classification categories. Statistically, these blocks will help to reduce chance variation and improve validity of the study results.
Assignment to Treatment Groups: The five-digit identification codes and the table of random digits will be used to randomly assign subjects to either the treatment 1 group or treatment 2 group. The table of random digits can be found in The Basic Practice of Statistics. The subjects within each block will be randomly assigned with half of subjects assigned to the treatment 1 group and half to the treatment 2 group. Each treatment group will contain a total of between 8 and 16 subjects. This will help to avoid bias and to blind the researcher in the assignment of subjects to treatment groups. On June 7, 2007, the 2-month treatment process will begin in which subjects will receive either treatment in the treatment 1 group or treatment 2 group. Protection of Subjects from Harm: In addition to the exclusion criteria, the study criteria for protecting against and minimizing any potential risk are the following. First, the study criteria age range of 25 to 45 years protects against and minimizes any potential risk related to nutritional needs in the pediatric, adolescent, and senior populations. Second, the criteria of BMI measurement between 25 and 50 limit the participation and protect individuals that are classified as underweight by body mass index (BMI) against any potential risk. Third, the blocks of subjects will allow for the accurate statistically representation of the differences in body fat reduction among males and females in the following BMI classification categories of overweight (BMI of 25.0 to 29.9), obese class I (30.0 to 34.9), obese class II (35.0-39.9), and extremely obese class III (>40.0). In addition, these blocks

79
statistically help to reduce chance variation and improve validity of the research study results. These classification categories help to measure individual health risk. The subjects within each block will be randomly assigned with half of subjects assigned to the treatment 1 group and half to the treatment 2 group.
Involvement of Staff in Research Study: Stacy D. Buzan, graduate student in the MS program in Human Nutrition at Eastern Michigan University and Dietetic Consultant at Central FITT, Inc. will serve as the Researcher/Primary Investigator. The NSCA-Certified Personal Trainer at Central FITT, Inc. will complete the body fat analysis measurements on subjects throughout this research study. Staff qualifications are discussed later. Company Information: Central FITT, Inc. Personal Training and Nutrition Studio is located at 2010 S. Broadway in Edmond, Oklahoma. It has served the Edmond and Greater Oklahoma City public for over 4 years beginning in 2002 through offering specialized and tailored personal training and nutrition consultation to healthy individuals and those with various health conditions. Staff and qualifications:
Central FITT, Inc. President and Certified Personal Trainer: Michael J. Buzan provides personal training to clientele and is a National Strength and Conditioning Association-Certified Personal Trainer with a Bachelor Degree in Exercise and Fitness Management from the Department of Kinesiology and Health Studies at the University of Central Oklahoma, and 6 years experience in the fitness field. Central FITT, Inc. Vice-President and Dietetic Consultant: Stacy D. Buzan provides the dietetic consultation to clientele. The Dietetic Consultant is American Dietetic Association- Registered Dietitian (ADA-DTR) with14 years of dietetic experience including the completion of an Associate Degree in Applied Science in Dietetic Technology with Dietetic Technician Internship of 475 hours; Bachelor Degree in Nutrition, Food Service Management, and Dietetics; and Master Degree in Human Nutrition coursework and Supervised Practice experience leading to RD eligibility.
If you have any questions, please contact me at (405) 330-9921 or (405) 503-2758. Sincerely,
Michael J. Buzan, NSCA-CPT President of Central FITT, Inc Personal Training and Nutrition Studio NSCA-Certified Personal Trainer

80

81
APPENDIX B: Research Study Flowchart
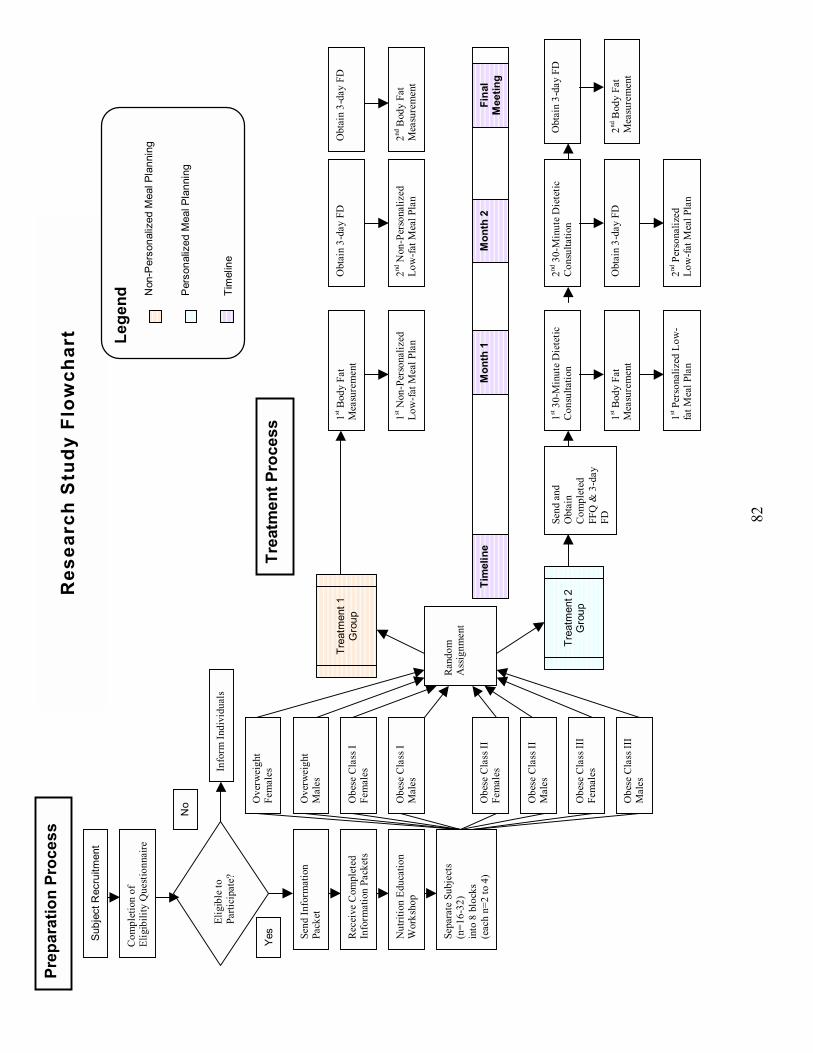
82
Prep
arat
ion
Proc
ess
Sub
ject
Rec
ruitm
ent
Com
plet
ion
of
Elig
ibili
ty Q
uest
ionn
aire
Send
Info
rmat
ion
Pack
et
Elig
ible
to
Parti
cipa
te?
Rec
eive
Com
plet
ed
Info
rmat
ion
Pack
ets
Nut
ritio
n Ed
ucat
ion
Wor
ksho
p
Sepa
rate
Sub
ject
s (n
=16-
32)
into
8 b
lock
s (e
ach
n=2
to 4
)
Ove
rwei
ght
Fem
ales
Obe
se C
lass
I Fe
mal
es
Obe
se C
lass
II
Fem
ales
Obe
se C
lass
III
Fem
ales
Trea
tmen
t 1
Gro
up
Info
rm In
divi
dual
s
No
Yes
Tr
eatm
ent 2
G
roup
Trea
tmen
t Pro
cess
Send
and
O
btai
n C
ompl
eted
FF
Q &
3-d
ay
FD
1st 3
0-M
inut
e D
iete
tic
Con
sulta
tion
2nd 3
0-M
inut
e D
iete
tic
Con
sulta
tion
1st B
ody
Fat
Mea
sure
men
t O
btai
n 3-
day
FD
Obt
ain
3-da
y FD
2nd N
on-P
erso
naliz
ed
Low
-fat M
eal P
lan
2nd B
ody
Fat
Mea
sure
men
t 1st
Non
-Per
sona
lized
Lo
w-fa
t Mea
l Pla
n
1st B
ody
Fat
Mea
sure
men
t O
btai
n 3-
day
FD
Obt
ain
3-da
y FD
2nd B
ody
Fat
Mea
sure
men
t
1st P
erso
naliz
ed L
ow-
fat M
eal P
lan
2nd P
erso
naliz
ed
Low
-fat M
eal P
lan
Tim
elin
eM
onth
2M
onth
1Fi
nal
Mee
ting
Res
earc
h S
tudy
Flo
wch
art Le
gend
N
on-P
erso
naliz
ed M
eal P
lann
ing
P
erso
naliz
ed M
eal P
lann
ing
Ti
mel
ine
Ran
dom
A
ssig
nmen
t
Ove
rwei
ght
Mal
es
Obe
se C
lass
I M
ales
Obe
se C
lass
II
Mal
es
Obe
se C
lass
III
Mal
es

83
APPENDIX C: Eligibility Questionnaire and Information Packet Forms
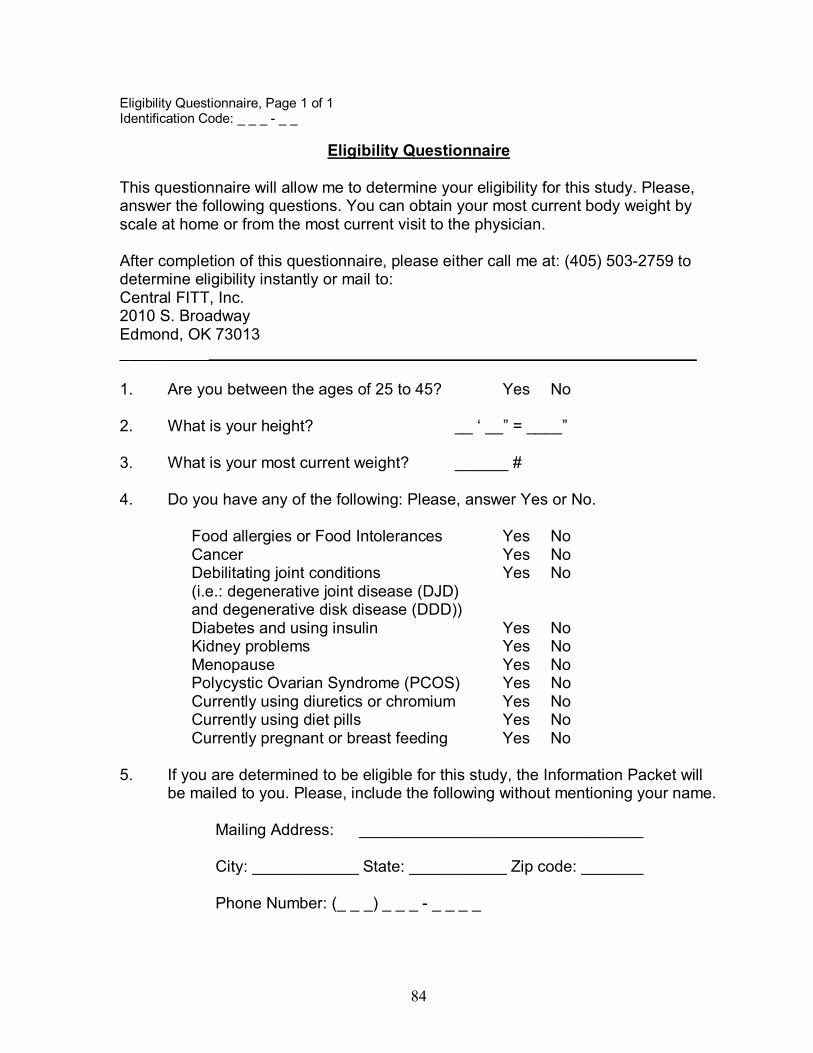
84
Eligibility Questionnaire, Page 1 of 1 Identification Code: _ _ _ - _ _
Eligibility Questionnaire
This questionnaire will allow me to determine your eligibility for this study. Please, answer the following questions. You can obtain your most current body weight by scale at home or from the most current visit to the physician. After completion of this questionnaire, please either call me at: (405) 503-2759 to determine eligibility instantly or mail to: Central FITT, Inc. 2010 S. Broadway Edmond, OK 73013 _________________________________________________________________ 1. Are you between the ages of 25 to 45? Yes No 2. What is your height? __ � __� = ____� 3. What is your most current weight? ______ #
4. Do you have any of the following: Please, answer Yes or No.
Food allergies or Food Intolerances Yes No Cancer Yes No Debilitating joint conditions Yes No (i.e.: degenerative joint disease (DJD) and degenerative disk disease (DDD)) Diabetes and using insulin Yes No Kidney problems Yes No Menopause Yes No Polycystic Ovarian Syndrome (PCOS) Yes No Currently using diuretics or chromium Yes No Currently using diet pills Yes No Currently pregnant or breast feeding Yes No
5. If you are determined to be eligible for this study, the Information Packet will
be mailed to you. Please, include the following without mentioning your name. Mailing Address: ________________________________
City: ____________ State: ___________ Zip code: _______ Phone Number: (_ _ _) _ _ _ - _ _ _ _

85
Informed Consent Form, Page 1 of 3 Identification Code: _ _ _ - _ _
Informed Consent
Project Title: Comparison of Body Fat Reduction in Overweight and Obese Subjects Utilizing Personalized Low-fat Meal Plans vs. Non-personalized Low-fat Meal Plans. This is a 3-month randomized research study. Location of Study: The study will be conducted at Central FITT, Inc. at 2010 S. Broadway in Edmond, Oklahoma. The principal investigator will explain this research study to you. Investigator: Stacy D. Buzan, Graduate Student at Eastern Michigan University Co-Investigators: Dr. Judith Brooks, Associate Professor and Dr. Anahita Mistry, Assistant Professor of Dietetics and Human Nutrition in the Eastern Michigan University�School of Health Sciences Purpose of the Study: The purpose of this study is to compare the use of personalized low-fat meal plans vs. non-personalized low-fat meal plans and the results in body fat reduction in overweight and obese subjects 25 to 45 years of age. Low-Fat Meal Plans and Body Fat Analysis Measurements: The 7-day personalized low-fat meal plans with three meals snacks are tailored to each subject�s food preferences, schedules, and nutritionally and medically information, whereas the non-personalized meal plans are not tailored. Individualized dietetic consultation will be provided to subjects receiving the personalized low-fat meal plans. You will receive two meal plans during the research study. The first meal plan you will follow for the first month and the second meal plan for the second month. At the initiation and end of the treatment period respectively the personal trainer will perform non-physically invasive body fat measurements on subjects. You cannot eat 4 hours prior to and not drink alcohol 2 days prior to each measurement. Procedures: The researcher will be available to explain the study and answer questions, and witness your signature on this consent form upon receipt. The 1-month preparation process in this study includes recruitment, eligibility determination, and Information Packet forms, Nutrition Education Workshop, and assignment to treatment group. Subjects and Study Criteria: This study is limited to between 16 and 32 overweight and obese, male and female subjects from various ethnicities and economic situations residing in Canadian, Cleveland, Logan, Lincoln, Oklahoma, and Pottawatomie counties. The study criteria are the following: 25 to 45 years of age, overweight or obese with body mass index (BMI) between 25 and 50, and limited to minor chronic health conditions. Conditions excluded are: food allergies, food intolerances, cancer, debilitating joint conditions (i.e., degenerative joint

86
Informed Consent Form, Page 2 of 3 Identification Code: _ _ _ - _ _ disease and degenerative disk disease), Diabetes Mellitus receiving insulin therapy, kidney problems, menopause, polycystic ovarian syndrome, pregnancy or breast-feeding, using diuretics, chromium, and/or diet pills. You should not modify, decrease, increase, and/or initiate an exercise regimen while participating in the study. Eligibility Determination and Information Packet: You are required to complete the Eligibility Questionnaire to determine eligibility. If you are determined eligible, you will receive the Information Packet to complete and return to the researcher prior to attending the Nutrition Education Workshop. The Information Packet consists of the Informed Consent, Health Insurance Portability and Accountability Act (HIPAA), and Medical and Nutritional Data Forms. The HIPAA Form provides details on your information to be used, how it will be used, kept confidential and protected, and at the conclusion how this information will be collectively disseminated. The Medical and Nutritional Data Form will allow the research to gather the necessary medical and nutritional information, including the height, weight, usual body weight, and specific medication regimen on all subjects. Nutrition Education Workshop and Assignment to Treatment Groups: You will attend the required 1-hour Nutrition Education Workshop taught by the researcher, to ensure that each subject has knowledge of basic nutrition. You will have the choice of attending a weekend or evening workshop. The workshop is at St. Elijah�s Orthodox Church at 15000 N. May Oklahoma City, Oklahoma. Subsequently you will be randomly assigned to either the treatment 1 group that receives two non-personalized low-fat meals plans or the treatment 2 group that receives two personalized low-fat meal plans along with two 30-minute individual dietetic consultations as treatment. After you are assigned to a treatment group, the 2-month treatment process will begin.
Treatment 1 Group: If you are assigned to the treatment 1 group you will receive non-personalized low-fat meal plans as treatment. Subjects in this group will not receive personal dietetic consultation. Subjects are required to return a 3-day Food Diary twice during the study to note their daily food intake and amounts with details on the place, with whom, feelings and appetite prior to meals. Treatment 2 Group: If you are assigned to the treatment 2 group you will receive personalized low-fat meal plans and two 30-minute individual dietetic consultations. At the beginning of the first month and second month subjects will receive the first and second 30-minute individual dietetic consultations, respectively. Subjects are required to return a Food Frequency Questionnaire and 3-day Food Diary to the researcher prior to attending the first 30-minute individual dietetic consultation. The Food Frequency Questionnaire provides an estimate of dietary intake. Subjects are required to return a 3-day Food Diary prior to the second dietetic consultation and the end of the research study.

87
Informed Consent Form, Page 3 of 3 Identification Code: _ _ _ - _ _ Confidentiality and Voluntary Participation: Only a five-digit code number will identify your responses and results will be stored separately in locked file cabinets from the consent form. At no time will your name be associated with your responses to the forms and questionnaires. Your participation in this study is voluntary and you may choose not to participate. If can change your mind at any time and withdraw from the study without negative consequences. The results will be presented in aggregate form only, revealing no names or individually identifying information. Results may be presented in research meetings, conferences, scientific publications, and as part of a master�s thesis conducted by the researcher/principal investigator. Expected Risks and Benefits: There are no foreseeable risks in this study. The excepted benefits may be body fat reduction, which may be different for each subject in this study. The method of meal planning studied may be no better than or be inferior to the standard method of meal planning or have no therapeutic effect. Future Questions: If you have any questions concerning your participation in this study now or in the future, you can contact Dr. Judith Brooks at (734) 487-7862 or [email protected], or Dr. Anahita M. Mistry at (734) 487-5079 or [email protected]. Human Subjects Review Board: This study is approved by the Eastern Michigan University CHHS Human Subjects Review Committee. If you have any questions about the approval process, you may contact them at (734) 487-1238. Consent to Participate: I have read the above information about this research study, including procedures, possible risks, and the likelihood of any benefits. The content and meaning of this information has been explained and I understand. All my questions at this time have been answered. I hereby consent and do voluntarily offer to follow the requirements and take part in the study. PRINT NAME: ___________________________________________ Signatures: ______________________________ _________________ Participant (your signature) Date _____________________________ _________________ Researcher/Primary Investigator Date or Specified Designee

88
HIPAA Authorization Form, Page 1 of 4 Identification Code: _ _ _ - _ _
HIPAA Authorization Form Throughout this document, �you� refers to you, the research subject. The federal government has issued a regulation to provide safeguards for privacy and security of health information that may identify you. This rule was issued under a law called the Health Insurance Portability and Accountability Act of 1996 (HIPAA). This document, call an �Authorization,� describes your rights and explains how your health information will be used and disclosed for the study identified below:
Section A: Protocol Information Protocol Title: Comparison of Body Fat Reduction in Overweight and Obese Subjects Utilizing Personalized Low-fat Meal Plans vs. Non-personalized Low-fat Meal Plans Sponsors/Co-Investigators: Dr. Judith Brooks, Associate Professor of Dietetics and Human Nutrition at the Eastern Michigan University�School of Health Sciences; Dr. Anahita Mistry, Assistant Professor of Dietetics and Human Nutrition at the Eastern Michigan University�School of Health Sciences Principal Investigators: Dr. Judith Brooks, RD Associate Professor of Dietetics and Human Nutrition
Address: Eastern Michigan University-School of Health Sciences 308 Marshall Building Ypsilanti, MI 48197
Telephone Number: (734) 487-7862 You have agreed to participate in the study mentioned above and have signed a separate informed consent that explained the procedures and the information that will be collected as part of the research project. If you are not willing to authorize the use and disclosure of your Protected Health Information (PHI) by the research team, you will not be eligible to take part in the above mentioned research project. This Authorization Form gives more detailed information about how your health information will be protected. By signing this document you are permitting Eastern Michigan University (EMU) and the Principal Investigator to use Protected Health Information (PHI) collected about you, for research purposes. You are also allowing EMU and the Principal Investigator to disclose that PHI to outside organizations or people involved with the research project.

89
HIPAA Authorization Form, Page 2 of 4 Identification Code: _ _ _ - _ _ Section B: Protected Health Information 1. What Protected Health Information (PHI) is collected and used in this study, and might also be shared (disclosed)?
The following PHI items that have been checked below will be collected, used for research and/or may be disclosed or released during your involvement with this research project:
Use Disclosure Protected Health Information Name *
Address *
-Street Address *
-City, State, and Zip*
E-mail address *
Age, height, and weight**
Health History**
Socioeconomic History, for nutrition reasons only**
Medication History**
Diet/Nutrition History**
Family Medical History (if needed)
Bioelectrical Impedance Analysis Measurements** (Body Fat Measurements)
* Items for mailing and sending research items only ** Items for therapy purposes and will only be disclosed in the statistical summary of research study results
2. Why is your Protected Health Information (PHI) being collected? The purpose of this research study is to compare the use of non-personalized low-fat meal plans vs. personalized low-fat meal plans and the results in body fat

90
HIPAA Authorization Form, Page 3 of 4 Identification Code: _ _ _ - _ _ reduction in overweight and obese subjects 25 to 45 years of age. Your PHI is important in order to contact you during the study. Your health information and results of analysis measurements are being collected as part of this research study. 3. Which Research Project personnel may use or disclose your Protected Health Information (PHI)? The following individuals and organizations may use or disclose your Protected Health Information for this research project:
X The Principal Investigator, the Co-Investigators, and Key Personnel of Eastern Michigan University associated with the research project
X
Eastern Michigan University�s Human Investigation Committee and the Institutional Review Boards
X
Authorized members of Eastern Michigan University workforce who may need to access your information in the performance of their duties (for example: to ensure integrity of the research)
4. Who, outside of the Researcher and Eastern Michigan University might
receive your Protected Health Information (PHI)? Office of Human Research Protection, Food & Drug Administration
(OHRP) and other regulatory agencies*
*OHRP has access to PHI for all studies involving human participants. FDA has access to PHI if the study falls under FDA oversight. The Principal Investigator, co investigators, and/or key personnel will inform you if there are any changes to the list above during your active participation in the trial. Once information is disclosed to others outside Eastern Michigan University, and the Principal Investigator information may no longer be covered by the federal protection regulations. 5. How long will Eastern Michigan University and the Researcher be able to use or disclose your Protected Health Information (PHI)? Your authorization for use of your PHI for this specific study does not expire. This information may be maintained in a research repository (database). However, Eastern Michigan University and the Researcher may not re-use or re-disclose you PHI collected in the research project for another purpose other than the research described in this document unless you have given written permission for the Principal Investigator to do so. Nonetheless, Eastern Michigan University Institutional Review Board may grant permission to the Principal Investigator or

91
HIPAA Authorization Form, Page 4 of 4 Identification Code: _ _ _ - _ _ others to use your information for another purpose after ensuring that appropriate privacy safeguards are in place including your signed permission. Option A�for open label studies and other studies for which access WILL NOT be denied During your participation in this study you will have access to
information in your study record. The researcher is not required to release research information that is not part of your study record.
Option B�for blinded studies or other studies where access Will be denied During your participation in this study you will not be able to access
information in your study record. This will be done to prevent the knowledge of research results from affecting the reliability of the project. Your will have access to your study record when the study is completed, if requested in writing. The researcher is not required to release research information that is not part of your study record.
• You will be able to request assess to your study record when the study is complete.
6. Can you change your mind? You may withdraw your permission for the use and disclosure of your PHI for research, but you must do so in writing to the Researcher at the following address: Central FITT, Inc., 2010 S. Broadway Avenue, Edmond, Oklahoma 73013. After receiving the request to withdraw from the research project, the Researcher will contact you concerning a plan for withdrawing you from the project. Even if you withdraw your permission, the Researcher for the research project may still use your PHI that was collected prior to your written request if that information is necessary to the study. If you withdraw your permission to use PHI, you will also be withdrawn from the research project. You will be given a signed copy of this Research Subject Authorization Form describing your confidentiality and privacy rights for this study. By signing this document you are authorizing Eastern Michigan University, the Principal Investigator, and Researcher to use and disclose Protect Health Information collected about you for research purposes as described above. Subject�s Name Subject�s Signature Date [Print or Type] Investigator/Person Investigator�s Signature Date Obtaining Authorization

92
Medical and Nutritional Data Form, Page 1 of 5 Identification Code: _ _ _ - _ _
Medical and Nutritional Data Form
Date: __/__/__ Date of last medical checkup: __/__/__ Age: ______ Sex: M F Height: __ �__� Weight: ______ pounds Usual weight: _____ pounds E-mail address: ______________________
Health History: Please, check the boxes and describe any of the health concerns or conditions below.
1. Have you been told that you have any of the following:
Cancer Diabetes
Food allergies or Food intolerances, please describe: ________________
Gastrointestinal (GI) disorders, such as acid reflux or any condition related to the stomach and intestines Hardening of arteries Heart disease High Cholesterol
HIV/AIDS Joint or spinal problems: _________________ Kidney disease Liver disease Lung disease Ulcers Other ________________________________
2. Do you have complaints about any of the following:
Constipation Diarrhea Difficulty chewing or swallowing Edema Fever Indigestion Lack of appetite Menstrual difficulties Nausea
Vomiting Other: ________________________________

93
Medical and Nutritional Data Form, Page 2 of 5 Identification Code: _ _ _ - _ _
3. For females, please answer:
Are you currently pregnant? Yes or No If you have a child or children, when was your last child born, year? _______ Are your menstrual periods and cycles normal? Yes or No Have you ever been had the following conditions, received medical care for any of the following: Ovarian cyst Polycystic syndrome Menopause
Pre-menopause Medication for birth control, whether pills or injection
Socioeconomic History: The following information will only be used to help with
meeting your needs for your specific goals.
1. Last grade of school/education completed ___________________________ Are you currently in school or college? Yes or No 2. Are you employed? Yes or No Occupation _______________________ 3. Does someone else live with you? Yes or No Who? ________________ 4. Do you use tobacco in any form (specify)? ________ How often? _______ 5. Where do you eat most of your meals? ___________________________ 6. Do you have a refrigerator? Yes or No Stove? Yes or No 7. How often do you shop for food? ________________________________ 8. Do you ever lack money to get the food you need? Yes or No

94
Medical and Nutritional Data Form, Page 3 of 5 Identification Code: _ _ _ - _ _
Medication History:
1. Please, list all your prescription medication(s).
Name of
Medication Reason for
taking Dose
Frequency (How often)
Duration of intake
Have you ever noticed any side effects from taking these medications? Yes or No If so, please explain: ________________________________________________ 2. Please, list all over-the-counter medications you currently take. A Physician does not prescribe these medications.
Name of Medication
Reason for taking
Dose
Frequency (How often)
Duration of intake
Have you ever noticed any side effects from taking these over-the-counter medications? Yes or No If so, please explain: ________________________________________________

95
Medical and Nutritional Data Form, Page 4 of 5 Identification Code: _ _ _ - _ _ 3. Please, list all vitamins, minerals, herbal pills, natural remedies, nutritional supplements, or meal replacement products you currently take?
Brand & Name
Reason for taking
Dose and Preparation
Frequency (How often)
Duration of intake
Have you ever noticed any side effects from taking these items? Yes or No If so, please explain: ___________________________________________
Diet/Nutrition History
1. What type of professionals and/or weight loss programs have you tried in the past to lose weight?
______________________________________________________________
2. Have you lost or gained more than 10 pounds of weight? Yes or No
If yes, explain the surrounding circumstances including associated illnesses, dietary changes, and time frame.
_______________________________________________________________
Was this weight loss or gain intentional? Yes or No
3. Do you eat at regular times each day? Yes or No
How many times per day and the meal size? ______________________ Snacks? ___________________ When? _________________________
4. What foods do you particularly like? _____________________________ Foods disliked? _____________________________
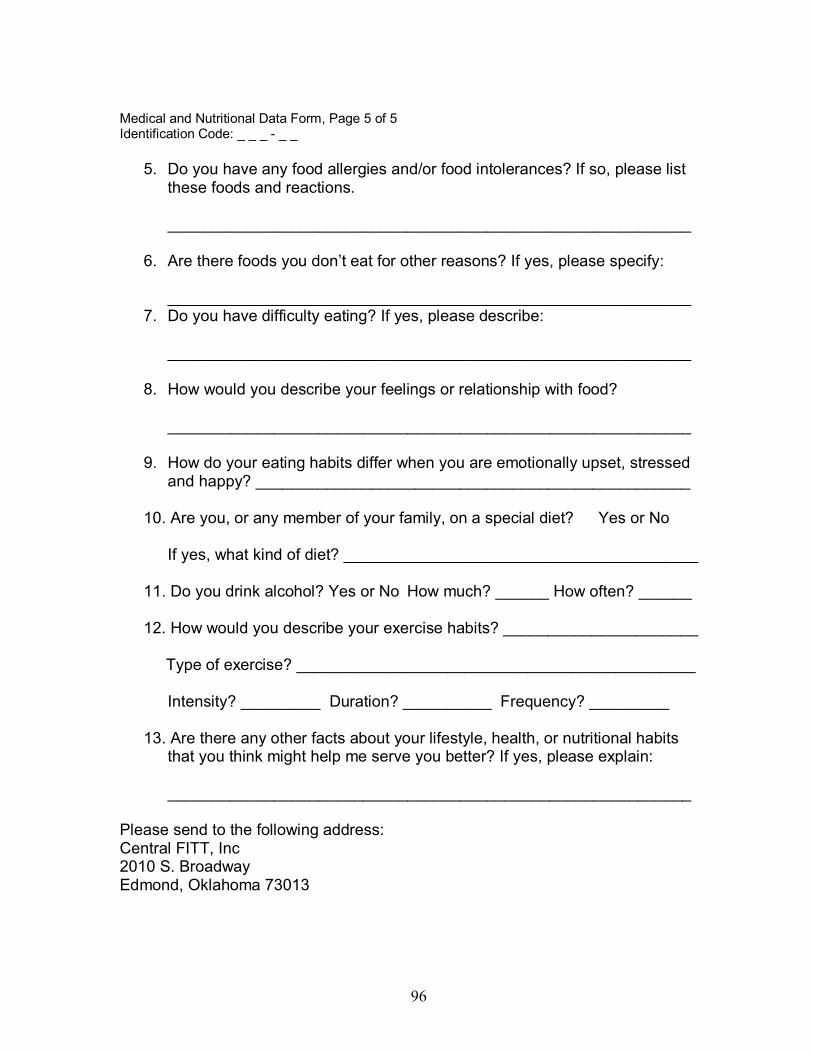
96
Medical and Nutritional Data Form, Page 5 of 5 Identification Code: _ _ _ - _ _
5. Do you have any food allergies and/or food intolerances? If so, please list these foods and reactions. ___________________________________________________________ 6. Are there foods you don�t eat for other reasons? If yes, please specify: ___________________________________________________________ 7. Do you have difficulty eating? If yes, please describe: ___________________________________________________________ 8. How would you describe your feelings or relationship with food? ___________________________________________________________ 9. How do your eating habits differ when you are emotionally upset, stressed
and happy? _________________________________________________
10. Are you, or any member of your family, on a special diet? Yes or No If yes, what kind of diet? ________________________________________ 11. Do you drink alcohol? Yes or No How much? ______ How often? ______ 12. How would you describe your exercise habits? ______________________ Type of exercise? _____________________________________________
Intensity? _________ Duration? __________ Frequency? _________
13. Are there any other facts about your lifestyle, health, or nutritional habits that you think might help me serve you better? If yes, please explain: ___________________________________________________________
Please send to the following address: Central FITT, Inc 2010 S. Broadway Edmond, Oklahoma 73013

97
APPENDIX D: Nutrition Education Workshop

98
Research Study: Comparison of Body Fat Reduction Utilizing Meal Planning Methods
Unit of Instruction: Nutrition Education Workshop

99
Unit of Instruction: Nutrition Education Workshop Page 1 of 10
Unit of Instruction
Introduction to Evaluator
This consists of the Unit of Instruction for the Nutrition Education Workshop
that was a part of this Research Study. This workshop was tailored to educate
subjects about basic nutrition education. Upon completion of this workshop subjects
were able to identify complications of health problems, establish one short-term goal,
and note the necessity for a meal plan. This is a simple explanation of the Nutrition
Education Workshop. The following consists of the objectives, information,
references, and summary pages.
NUTRITION EDUCATION WORKSHOP Lesson Objective/Enabling objectives Nutrition Education Workshop Objective: Upon completion of the Nutrition Education Workshop, each subject will identify complications of health problems; establish one short-term health goals, and state the necessity for a meal plan. Enabling Objectives:
1. Recognize excess nutritional intake and its relation with certain health
conditions
2. Recognize complications of health conditions, diseases, and/or health risk
factors
3. Set the first reachable short-term health goal
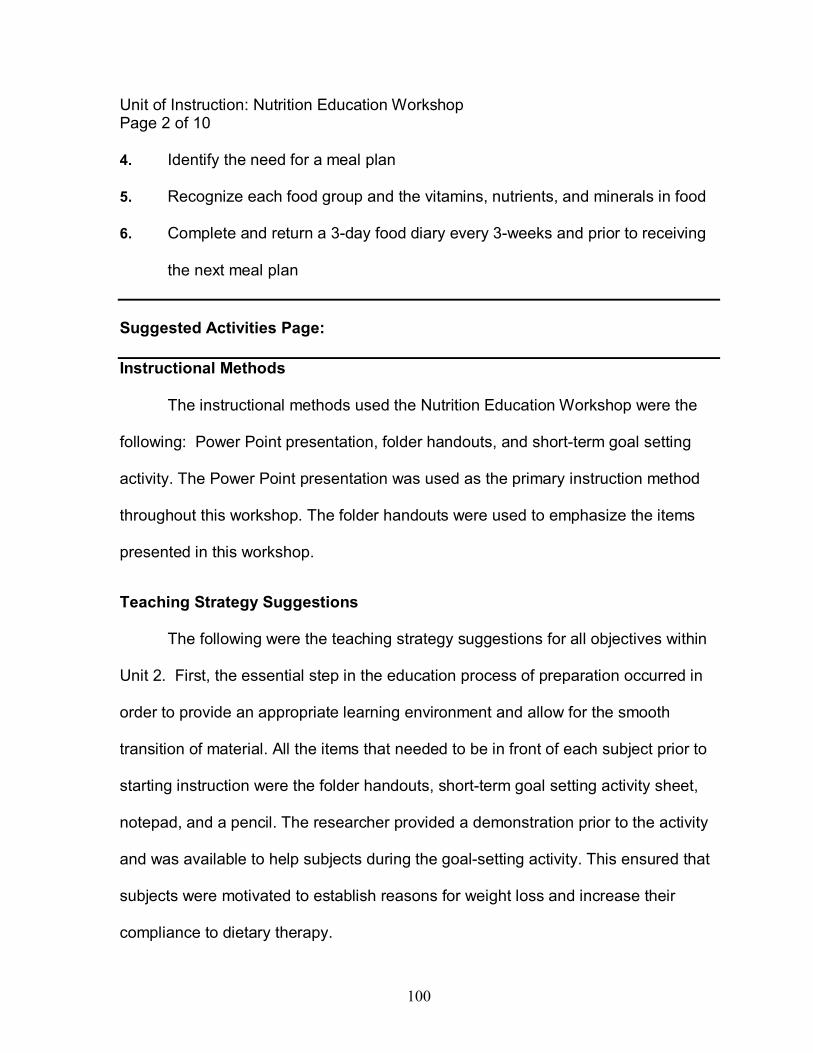
100
Unit of Instruction: Nutrition Education Workshop Page 2 of 10 4. Identify the need for a meal plan
5. Recognize each food group and the vitamins, nutrients, and minerals in food
6. Complete and return a 3-day food diary every 3-weeks and prior to receiving
the next meal plan
Suggested Activities Page: Instructional Methods The instructional methods used the Nutrition Education Workshop were the
following: Power Point presentation, folder handouts, and short-term goal setting
activity. The Power Point presentation was used as the primary instruction method
throughout this workshop. The folder handouts were used to emphasize the items
presented in this workshop.
Teaching Strategy Suggestions
The following were the teaching strategy suggestions for all objectives within
Unit 2. First, the essential step in the education process of preparation occurred in
order to provide an appropriate learning environment and allow for the smooth
transition of material. All the items that needed to be in front of each subject prior to
starting instruction were the folder handouts, short-term goal setting activity sheet,
notepad, and a pencil. The researcher provided a demonstration prior to the activity
and was available to help subjects during the goal-setting activity. This ensured that
subjects were motivated to establish reasons for weight loss and increase their
compliance to dietary therapy.

101
Unit of Instruction: Nutrition Education Workshop Page 3 of 10 Enabling Objective #1 The following provides teaching strategies suggestions used to accomplish
the enabling objective #1, which was to recognize excess nutritional intake and its
relation with certain health conditions. The power point presentation handouts were
used throughout this education process. Subjects were shown the difference
between the actual calories needed/day and the calculated calories from the
example 3-day food diary. Then, the researcher described what happened to the
excess calories not used by the body. Emphasis was placed on informing subjects
that excess calories can be stored as fat.
Enabling Objective #2
The following provides teaching strategies suggestions used to accomplish
the enabling objective #2, which was to recognize complications of health conditions,
diseases, and/or health risk factors. Slides 3 through 5 of the Power Point
presentation were used to accomplish this objective. First, the researcher used the
handouts on health conditions and complications provided in subjects� folders. When
covering the topic of obesity the researcher emphasized that obesity can cause joint
damage and exerts pressure of the blood vessels. Other results of obesity were
addressed such as the increased potential of other life-threatening conditions and
diseases. When covering the topic of Diabetes emphasis was placed on the results
of blood vessel scarring, adhesion of glucose to the inside of blood vessels, kidney
filtration unit damage, high blood pressure, rupture of blood vessels, and nerve
damage. When the topic of heart disease was presented emphasis was placed

102
Unit of Instruction: Nutrition Education Workshop Page 4 of 10
on how excess calories result in excess fat storage leading to high lipid levels that
can result in cholesterol plaques inside artery walls and high-blood pressure.
Enabling Objective #3
The following provides teaching strategies suggestions used to accomplish
the enabling objective #3, which was to set one reachable short-term health goal.
Slide 6 of the Power Point presentation was used to accomplish this objective. The
Personal Warranty Plan for Your Body handout located in each subject�s folder was
used to complete this activity. Each subject wrote one short-term goal in section 7,
titled Be Sensible Basic Maintenance Step. (1) Section 3 of this handout, titled the
Personal Health Goals was not used in this activity. (1)
Enabling Objective #4
The following provides teaching strategies suggestions used to accomplish
the enabling objective #4, which was to identify the need for a meal plan. The Power
Point presentation Slide 7 was used to teach this objective. First, the researcher
showed each subject an example of a meal plan. Second, emphasis was placed on
the importance of eating a variety of foods. Third, the researcher emphasized that
spreading food out throughout the day into 3 small meals and at least 2 small snacks
per day can increase metabolism and limit overeating. Fourth, the reason why
starvation and skipping meals are the primary reasons for weight loss failure was
explained. Fifth, the researcher emphasized that following the meal plan will
minimize nutritional deficiencies that may result from reduced dietary intake.
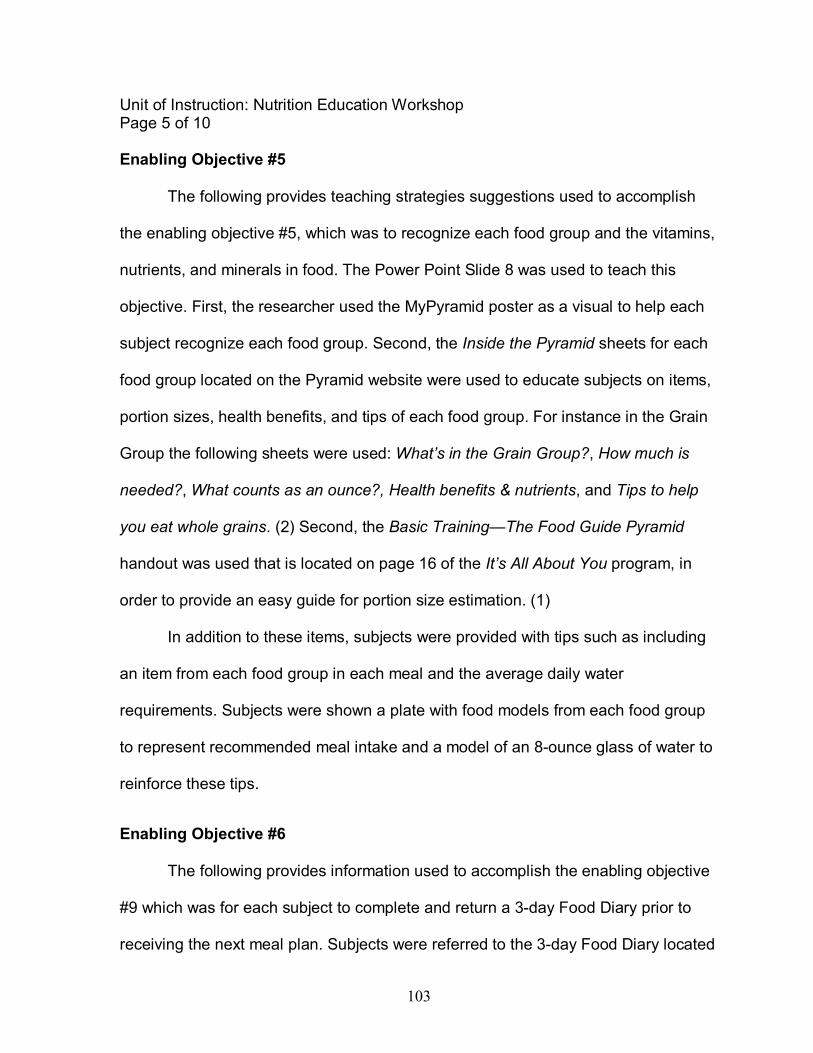
103
Unit of Instruction: Nutrition Education Workshop Page 5 of 10
Enabling Objective #5 The following provides teaching strategies suggestions used to accomplish
the enabling objective #5, which was to recognize each food group and the vitamins,
nutrients, and minerals in food. The Power Point Slide 8 was used to teach this
objective. First, the researcher used the MyPyramid poster as a visual to help each
subject recognize each food group. Second, the Inside the Pyramid sheets for each
food group located on the Pyramid website were used to educate subjects on items,
portion sizes, health benefits, and tips of each food group. For instance in the Grain
Group the following sheets were used: What�s in the Grain Group?, How much is
needed?, What counts as an ounce?, Health benefits & nutrients, and Tips to help
you eat whole grains. (2) Second, the Basic Training�The Food Guide Pyramid
handout was used that is located on page 16 of the It�s All About You program, in
order to provide an easy guide for portion size estimation. (1)
In addition to these items, subjects were provided with tips such as including
an item from each food group in each meal and the average daily water
requirements. Subjects were shown a plate with food models from each food group
to represent recommended meal intake and a model of an 8-ounce glass of water to
reinforce these tips.
Enabling Objective #6 The following provides information used to accomplish the enabling objective
#9 which was for each subject to complete and return a 3-day Food Diary prior to
receiving the next meal plan. Subjects were referred to the 3-day Food Diary located

104
Unit of Instruction: Nutrition Education Workshop Page 6 of 10
in the folder and the researcher stated the directions. Second, the key components
of the food diary were mentioned that were time of day, meal, food item, portion size,
cooking methods, and emotional state. Any misunderstandings or questions about
the 3-day food diary were addressed during this workshop and throughout this study.
Lesson references 1. The Dietary Guidelines Alliance. It�s All About You. National Cattlemen�s Beef
Association and Cattlemen�s Board; 2003.
2. MyPyramid. Inside the pyramid. Available at: http://www.mypyramid.gov/
pyramid/index.html. Accessed December 10, 2006.
3. American Dietetic Association, Piechota T. Real Solutions Weight Loss
Workbook. Chicago, Illinois: Diana Faulhaber; 2004.
Equipment/supplies needed The following equipment and supplies were used for the Nutrition Education
Workshop: Power Point floppy-disk, portable laptop computer, Slide projector, food
models, and plates; and 16 to 32 subject folders with handouts, short-term goal
setting activity sheets, notepads, and pencils.
Preparation by instructor
Prior to this workshop, subjects returned their completed information packet
materials. Next, the subject folders were made and divided into sections for each
enabling objective, starting with section #1 for enabling objective #1. The section #1
contained the health conditions and complications handouts. The section #2
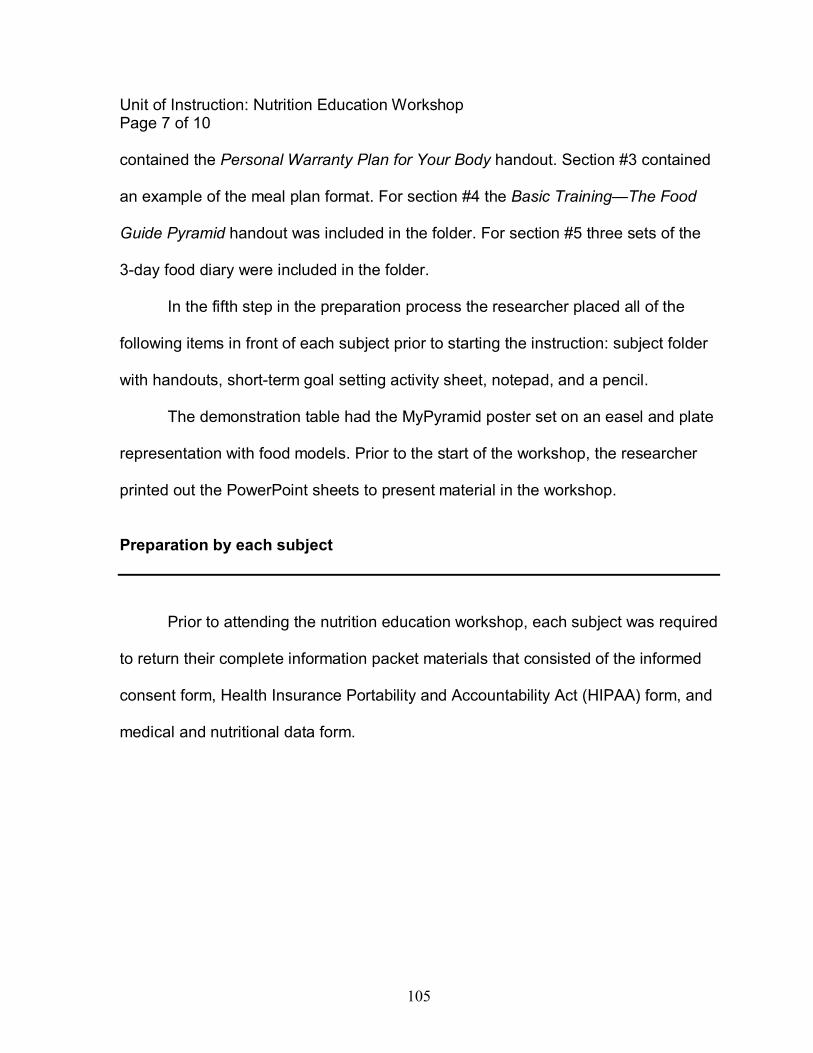
105
Unit of Instruction: Nutrition Education Workshop Page 7 of 10
contained the Personal Warranty Plan for Your Body handout. Section #3 contained
an example of the meal plan format. For section #4 the Basic Training�The Food
Guide Pyramid handout was included in the folder. For section #5 three sets of the
3-day food diary were included in the folder.
In the fifth step in the preparation process the researcher placed all of the
following items in front of each subject prior to starting the instruction: subject folder
with handouts, short-term goal setting activity sheet, notepad, and a pencil.
The demonstration table had the MyPyramid poster set on an easel and plate
representation with food models. Prior to the start of the workshop, the researcher
printed out the PowerPoint sheets to present material in the workshop.
Preparation by each subject
Prior to attending the nutrition education workshop, each subject was required
to return their complete information packet materials that consisted of the informed
consent form, Health Insurance Portability and Accountability Act (HIPAA) form, and
medical and nutritional data form.

106
Unit of Instruction: Nutrition Education Workshop Pages 8-9 of 10
Information Pages
BODY Information in outline format Key
Points Suggested activity you will use to
stress the key points Enabling Objective #1:
Recognize excess nutritional intake and its relation
with certain health conditions
Content outline:
I. What is excess nutritional intake?
A. Exceeds needed amount for body
process and activity level
Enabling Objective #2:
Recognize complications of health conditions,
diseases, and/or health risk factors
Content outline:
I. What health problems and complications?
A. Obesity
1. Health Risks
2. Joint damage
3. Diabetes
1. Blood vessels and Heart
2. Kidneys
3. Eyes
4. Nerves
5. Insulin Shots and medication
B. Heart Disease
1. Heart attack
2. Stroke
Power Point Presentation: Slide 2 Show each subject the difference between the calculated needed calories/day and the calculated calories from the 3-day food diary. Describe what happens to excess calories not used by the body. Use Power Point--Slides 3-5
Use handouts on health conditions
and complications to provide a visual
to the subject. Obesity (Slide 3), Emphasize:
1. Pressure on joints and blood vessels
2. Lead to other life-threatening conditions
and diseases. Diabetes (Slide 4), High blood sugar:
I. Scars and adheres to blood vessels
II. Damages the filtration units of
the kidneys 1. Increases blood pressure & rupture of blood vessels 2. High blood sugar=High Acid content=Nerve damage

107
3. High blood pressure
Enabling Objective #3:
Set the first reachable short-term health goal
Content outline:
I. Take precautions and plan to be healthy
A. Are you committed?
B. Personal reasons for action
C. Short-term goal
Enabling Objective #4:
Identify the need for a meal plan
Content outline:
I. The need
a. Variety
b. Food is spread out
c. Increases Metabolism
d. Limits overeating
e. No nutritional deficiencies
C. Cholesterol plaques on arteries and high-blood pressure Use Power Point--Slide 6 Use the Personal Warranty Plan for Your Body handout of page 9 in the �It�s All About You� Owner�s Manual. • Short-term goals=Be Sensible Basic Maintenance Step (7th section) Show subject the personalized Meal Plan. Emphasis the importance of: a. Eating a variety of foods b. 3 small meals and at least 2 small snacks/day c. Why starvation and skipping meals are the #1 reasons for weight loss failure
108
Unit of Instruction: Nutrition Education Workshop Page 10 of 10
References 1. The Dietary Guidelines Alliance. It�s All About You. National Cattlemen�s Beef
Association and Cattlemen�s Board; 2003.
2. MyPyramid. Inside the pyramid. Available at: http://www.mypyramid.gov/
pyramid/index.html. Accessed December 10, 2006.
3. American Dietetic Association, Piechota T. Real Solutions Weight Loss
Workbook. Chicago, Illinois: Diana Faulhaber; 2004.

109
APPENDIX E: Forms and Tools Common to All Treatment Groups

110
3-day Food Diary, Page 1 of 6 Identification Code: _ _ _ - _ _
Food Diary: Day 1
Please, fill out this food diary accurately for three days. Write family, friends, or alone in the �with whom� column. Write happy, sad, mad, or fearful in the �feelings� column. Write yes or no in the �hungry� column. Write down the amounts by noting: teaspoons, tablespoons, cups, ounces, and pounds. Meal: Breakfast Date: __ /__ /____ Time: _________ Place With whom Feelings Hungry Food Eaten and Amounts
Snack Time: _________ Place With whom Feelings Hungry Food Eaten and Amounts
Meal: Lunch Time: _________ Place With whom Feelings Hungry Food Eaten and Amounts
Snack Time: _________ Place With whom Feelings Hungry Food Eaten and Amounts
Meal: Dinner Time: _________ Place With whom Feelings Hungry Food Eaten and Amounts

111
3-day Food Diary, Page 2 of 6 Identification Code: _ _ _ - _ _
Food Diary: Day 1
Snack Date: __ /__ /____ Time: _________ Place With whom Feelings Hungry Food Eaten and Amounts

112
3-day Food Diary Page 3 of 6 Identification Code: _ _ _ - _ _
Food Diary: Day 2
Please, fill out this food diary accurately for three days. Write family, friends, or alone in the �with whom� column. Write happy, sad, mad, or fearful in the �feelings� column. Write yes or no in the �hungry� column. Write down the amounts by noting: teaspoons, tablespoons, cups, ounces, and pounds. Meal: Breakfast Date: __ /__ /____ Time: _________ Place With whom Feelings Hungry Food Eaten and Amounts
Snack Time: _________ Place With whom Feelings Hungry Food Eaten and Amounts
Meal: Lunch Time: _________ Place With whom Feelings Hungry Food Eaten and Amounts
Snack Time: _________ Place With whom Feelings Hungry Food Eaten and Amounts
Meal: Dinner Time: _________ Place With whom Feelings Hungry Food Eaten and Amounts

113
3-day Food Diary Page 4 of 6 Identification Code: _ _ _ - _ _
Food Diary: Day 2 Snack Date: __ /__ /____ Time: _________ Place With whom Feelings Hungry Food Eaten and Amounts

114
3-day Food Diary Page 5 of 6 Identification Code: _ _ _ - _ _
Food Diary: Day 3
Please, fill out this food diary accurately for three days. Write family, friends, or alone in the �with whom� column. Write happy, sad, mad, or fearful in the �feelings� column. Write yes or no in the �hungry� column. Write down the amounts by noting: teaspoons, tablespoons, cups, ounces, and pounds. Meal: Breakfast Date: __ /__ /____ Time: _________ Place With whom Feelings Hungry Food Eaten and Amounts
Snack Time: _________ Place With whom Feelings Hungry Food Eaten and Amounts
Meal: Lunch Time: _________ Place With whom Feelings Hungry Food Eaten and Amounts
Snack Time: _________ Place With whom Feelings Hungry Food Eaten and Amounts
Meal: Dinner Time: _________ Place With whom Feelings Hungry Food Eaten and Amounts

115
3-day Food Diary Page 6 of 6 Identification Code: _ _ _ - _ _
Food Diary: Day 3 Snack Date: __ /__ /____ Time: _________ Place With whom Feelings Hungry Food Eaten and Amounts

116
APPENDIX F: Sample of Low-fat Meal Plans for Treatment Group 1
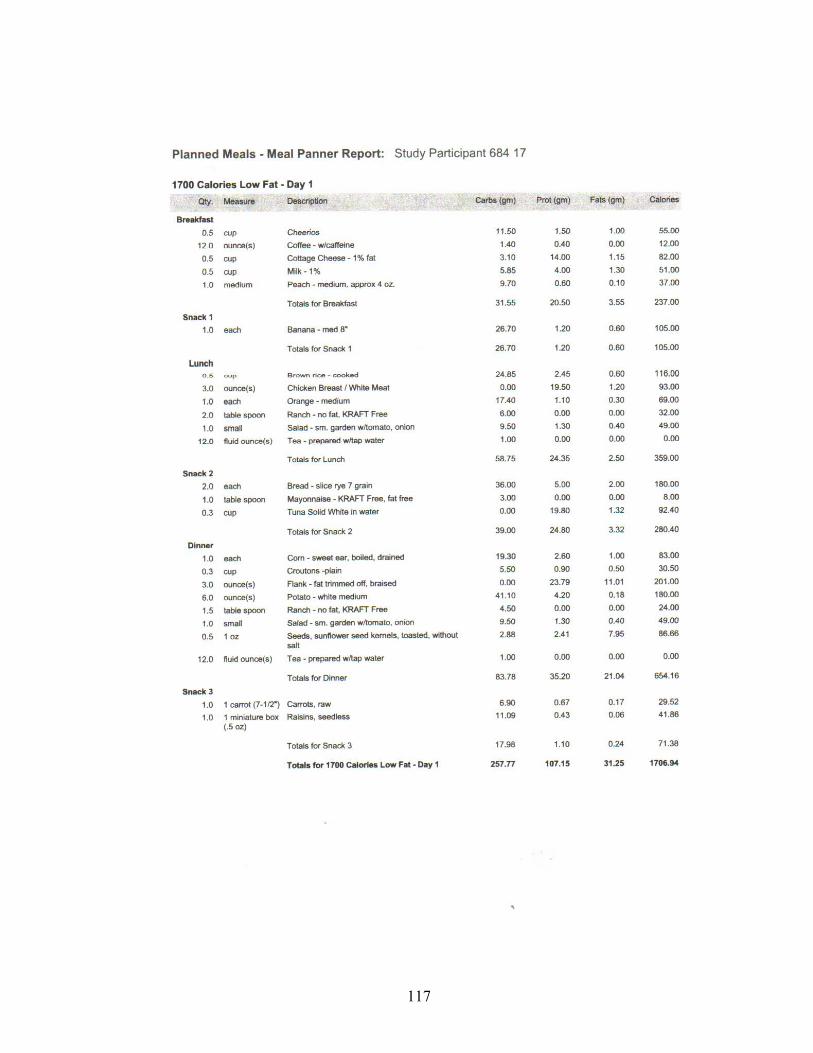
117

118

119

120

121

122

123

124

125

126

127

128

129

130

131
APPENDIX G: Forms and Materials for Treatment Group 2
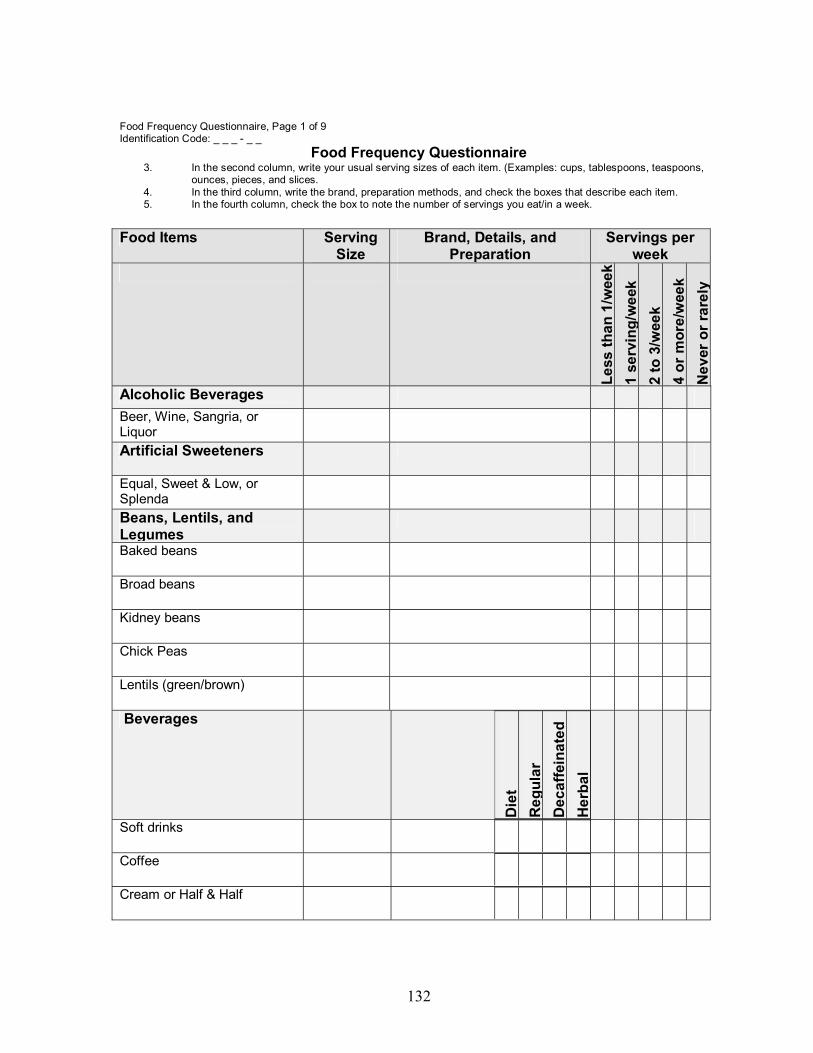
132
Food Frequency Questionnaire, Page 1 of 9 Identification Code: _ _ _ - _ _
Food Frequency Questionnaire 3. In the second column, write your usual serving sizes of each item. (Examples: cups, tablespoons, teaspoons,
ounces, pieces, and slices. 4. In the third column, write the brand, preparation methods, and check the boxes that describe each item. 5. In the fourth column, check the box to note the number of servings you eat/in a week.
Food Items Serving Size
Brand, Details, and Preparation
Servings per week
Less
than
1/w
eek
1 se
rvin
g/w
eek
2 to
3/w
eek
4 or
mor
e/w
eek
Nev
er o
r rar
ely
Alcoholic Beverages
Beer, Wine, Sangria, or Liquor
Artificial Sweeteners
Equal, Sweet & Low, or Splenda
Beans, Lentils, and Legumes
Baked beans
Broad beans
Kidney beans
Chick Peas Lentils (green/brown) Beverages
Die
t R
egul
ar
Dec
affe
inat
ed
Her
bal
Soft drinks
Coffee
Cream or Half & Half

133
Food Items Serving Size
Brand, Details, and Preparation
Servings per week
Die
t R
egul
ar
Dec
affe
inat
ed
Her
bal
Less
than
1/w
eek
1 se
rvin
g/w
eek
2 to
3/w
eek
4 or
mor
e/w
eek
Nev
er o
r rar
ely
Hot Cocoa
Non-diary creamer
Tea
Breads and Grains
But
tere
d Li
ght
Red
uced
Fat
R
egul
ar
Breads
Bread, white
Bread, whole wheat
Pita Bread
Grains
Couscous Pasta
Rice, brown or white steamed
Rice, fried
Rice mixes
Tortillas, corn or flour
Snack Foods
Chips, potato or tortilla
Flaky crackers

134
Food Items Serving Size
Brand, Details, and Preparation
Servings per week
But
tere
d Li
ght
Red
uced
Fat
R
egul
ar
Less
than
1/w
eek
1 se
rvin
g/w
eek
2 to
3/w
eek
4 or
mor
e/w
eek
Nev
er o
r rar
ely
Granola bars, chewy or hard
Popcorn
Saltine crackers
Breakfast Pastries and Cereals
Biscuits
Croissants
Pancakes and/or Waffles
Dry or Hot Sweetened Cereals
Dry or Hot Unsweetened Cereals
Grits
Condiments
Fat F
ree
Low
cal
orie
R
educ
ed F
at
Reg
ular
Cocoa or Chocolate to items
Honey, Jelly, or Jam
Mayonnaise
Molasses
Mustard, soy sauce, or tabasco sauce
Salad dressing, creamy or vinegar type
Sugar to foods

135
Food Items Serving Size
Brand, Details, and Preparation
Servings per week
Fat F
ree
Low
cal
orie
R
educ
ed F
at
Reg
ular
Le
ss th
an 1
/wee
k 1
serv
ing/
wee
k 2
to 3
/wee
k 4
or m
ore/
wee
k N
ever
or r
arel
y
Syrup
Fats and Oils
Rec
ipes
Fo
od it
ems
Margarine or butter
Vegetable or olive oil
Peanut, safflower, or sunflower oil
Fruit items 10
0% ju
ice
In H
eavy
syr
up
In L
ight
syr
up, J
uice
s W
ith p
eel
Canned fruit Fruit drinks, artificially flavored
Fruit juices
Apples
Bananas and plantains
Dried fruit (apricots, raisins, or currants)
Grapefruit
Grapes

136
Food Items Serving Size
Brand, Details, and Preparation
Servings per week
100%
juic
e In
Hea
vy s
yrup
In
Lig
ht s
yrup
, Jui
ces
With
pee
l Le
ss th
an 1
/wee
k 1
serv
ing/
wee
k 2
to 3
/wee
k 4
or m
ore/
wee
k N
ever
or r
arel
y
Kiwi fruit
Mangoes
Oranges
Peaches
Pears
Plums
Strawberries
Meat
Bak
ed
Fast
food
H
omem
ade
Lean
/Red
uced
fat
Beef Corned beef
Ground Beef
Hamburgers
Roast beef
Steaks, various cuts
Ham and Pork
Ham

137
Food Items Serving Size
Brand, Details, and Preparation
Servings per week
Bak
ed
Fast
food
H
omem
ade
Lean
/Red
uced
fat
Less
than
1/w
eek
1 se
rvin
g/w
eek
2 to
3/w
eek
4 or
mor
e/w
eek
Nev
er o
r rar
ely
Sausage
Bacon, pork
Bologna
Pork chops and other cuts
Lamb or Veal
Lamb
Veal
Organ meats
Liver
Kidney
Pepperoni
Poultry Chicken, with skin Chicken, without skin
Turkey
Turkey bacon
Processed meats
Hot dogs
Spam

138
Food Items Serving
Size Brand, Details, and
Preparation Servings per
week
Bak
ed
Fast
food
H
omem
ade
Lean
/Red
uced
fat
Less
than
1/w
eek
1 se
rvin
g/w
eek
2 to
3/w
eek
4 or
mor
e/w
eek
Nev
er o
r rar
ely
Meat pastries
Meat pies/pastries
Meat free, Vegetarian, or Soybean
Meat free/vegetarian meals
Tofu, plain or light
Soy milk, plain or light
Nuts and/or Nut Products
R
egul
ar
Red
uced
fat
Almonds
Cashews
Peanut butter
Peanuts
Macadamia nuts
Walnuts
Sauces and Spreads
Che
ese
Cre
am
Ligh
t
Spaghetti sauce
Mayonnaise side orders (tuna, potato, or macaroni

139
Food Items Serving Size
Brand, Details, and Preparation
Servings per week
Che
ese
Cre
am
Ligh
t
Less
than
1/w
eek
1 se
rvin
g/w
eek
2 to
3/w
eek
4 or
mor
e/w
eek
Nev
er o
r rar
ely
Other Sauces or Spreads
Seafood and Shellfish
Frie
d In
oil
In w
ater
Fish
Shrimp
Salmon
Tuna
Soups B
roth
bas
ed
Cre
am b
ased
Lo
w s
odiu
m
Red
uced
fat
Soups with Vegetables
Soups with Meat and Vegetables
Vegetables
Bak
ed o
r boi
led
Can
ned
Frie
d M
arga
rine/
butte
r
Avocado
Broccoli
Cabbage
Carrots

140
Food Items Serving Size
Brand, Details, and Preparation
Servings per week
Bak
ed o
r boi
led
Can
ned
Frie
d M
arga
rine/
butte
r
Less
than
1/w
eek
1 se
rvin
g/w
eek
2 to
3/w
eek
4 or
mor
e/w
eek
Nev
er o
r rar
ely
Cauliflower
Corn
Green beans
Olives, black or green
Peas, English or Snow peas
Peppers (green, red, or yellow)
Potatoes, French fries
Potatoes, hash browns
Potatoes, mashed
Potatoes, red
Potatoes, white
Salad or lettuce
Spinach
Soy Beans
Tomatoes
Tomato products
Other Food Items, Please specify below

141
Research Study: Comparison of Body Fat Reduction Utilizing Meal Planning Methods
Unit of Instruction: Treatment Group 2--Dietetic Consultations

142
Unit of Instruction: Treatment 2 Group Dietetic Consults, Page 1 of 23
Unit of Instruction
Introduction to Evaluator
This consists of the Unit of Instruction for the Treatment 2 group dietetic
consultations. These dietetic consultations provided nutrition intervention techniques
in order to develop positive healthy long-term nutrition and lifestyle habits to promote
healthy weight-loss and weight maintenance.
In the initial dietetic consultation all the medical and nutritional relevant
information was retrieved from each subject. Upon completion of these dietetic
consultations subjects were able to identify and state the need for portion sizes
within the bread, cereal, and grain food group evidenced by demonstrating how to
use the nutrition facts label along with portion size information and the meal plan.
The dietetic consultations involved learning opportunities for subjects that had
visual, auditory, and/or kinetic learning styles. Throughout this study, each subject in
the Treatment 2 group learned to become more self-reliant, which was achieved by
covering the cognitive, psychomotor, and affective domains. Encouragement was
provided to help subjects reach their goals and achieve success.
The duration of all the dietetic consultations were equal to 60 minutes, which
is equivalent to 2-30 minutes consultations. A non-formal evaluation of each
subject�s success was based upon if they reached moderate to successful

143
Unit of Instruction: Treatment 2 Group Dietetic Consults, Page 2 of 23
expected nutritional compliance of these dietetic consultations evidenced by the
completion of 85-100% of the total content including the enabling objectives,
activities, and assignment sheets.
This is a simple explanation of the content provided in these consultations.
The following consists of the objectives, suggested activities, power point
presentation materials, information, assignment sheet(s), procedure sheet(s), non-
formal knowledge-based test and/or performance test, references, and summary
pages.
TREATMENT 2 GROUP: DIETETIC CONSULTATIONS Lesson Objective/Enabling objectives Dietetic Consultations Objective: Upon completion of the dietetic consultations, each subject will establish long-term health goals, and identify and state the need for portion sizes within the bread, cereal, and grain food group evidenced by demonstrating how to use the nutrition facts label along with portion size information and meal plan. Enabling Objectives:
1. Set the first long-term health goal
2. Recognize and state the need for portion sizes within each food group
3. Locate and indicate ways to utilize portion size information and the meal plan
4. Locate and indicate ways to utilize the Nutrition-Facts Label
5. Apply items learned about nutrition in this unit to life
6. Complete and return a 3-day food diary for at each consultation

144
Unit of Instruction: Treatment 2 Group Dietetic Consults, Page 3 of 23 Suggested Activities Page: Instructional Methods The instructional methods used in Unit 2 were the following: Power Point presentation sheets, folder handouts, activities, and assignment sheets. The Power Point presentation and the MyPyramid sheets on each food group were used as the primary instruction method throughout the educational process of Unit 2. (2) The folder handouts were used to emphasize the items presented to the subject. In addition to these activities, assignment sheets were included in this folder to allow each subject to practice items and for the researcher to evaluate the subject�s comprehension of Unit 2. Teaching Strategy Suggestions The following were the teaching strategy suggestions for all objectives within Unit 2. First, the essential step in the education process of preparation had to occur in order to provide an appropriate learning environment and allow for the smooth transition of material. All the items that needed to be on the table for the subject�s use before instruction were dry-erase markers, food product boxes, measuring cups, utensils, and pencils. Prior to each activity and/or assignment, the researcher provided a demonstration and always was available to help the subject. The instructor evaluated their performance and if needed offered additional information to clear up any misunderstandings immediately after completion.
Enabling Objective #1 The following provides teaching strategies suggestions used to accomplish
the enabling objective #1, which was to set one long-term health goal. Slide 6 of the
Power Point presentation was used to accomplish this objective. The Personal
Warranty Plan for Your Body handout located in each subject�s folder was used to
complete this activity. (1) Subjects wrote one long-term health goal in section 3 of
this handout, titled the Personal Health Goals. (1)

145
Unit of Instruction: Treatment 2 Group Dietetic Consults, Page 4 of 23
Enabling Objective #2 The following provides teaching strategies suggestions used to accomplish
the enabling objective #5, which was recognize and state the need for portion sizes
within the bread, cereal, and grains food group. Power Point Slide 8 was used for
this objective. First, the MyPyramid poster was used as a visual to help the subject
locate and to represent the bread, cereal, and grain food group. Second, the portion
size handout for starches was used to help the subject identify the portion sizes for
various food items within this food group. Third, the Basic Training�The Food Guide
Pyramid handout of page 16 from the It�s All About You program was used. (1)
Lastly, but not least it was imperative to inform the subject that 50-60% of calories
per day needed to come from the Bread, Cereal, and Grains (Starch) food group.
Enabling Objective #3 The following provides teaching strategies suggestions used to accomplish the
enabling objective #6, which was to locate and indicate ways to utilize the portion
size information and meal plan. Power Point slide 10 was used for this objective.
First, a dry-erase marker was provided to complete the third step on the Assignment
Sheet #1. Second, when the Assignment Sheet #1 in the subject�s folder was used
the directions and time limit of 5 minutes was stated, and the researcher was
available if the subject needed help. Third, the researcher had the subject complete
Assignment Sheet #1. The first step of Assignment Sheet #1 was to select a
regularly eaten food item. The second step was for the subject to state the portion
size of the food items, by referring to the starches portion sizes handout. The third

146
Unit of Instruction: Treatment 2 Group Dietetic Consults, Page 5 of 23
step was for the subject to locate where they might use this food item in its portion
size on the meal plan. After the subject completed Assignment Sheet #1 the
researcher evaluated it in order to determine the subject�s comprehension of the
covered material. Further explanation was provided to the subject, if they needed.
Enabling Objective #4 The following provides teaching strategies suggestions used to accomplish
the enabling objective #7, which was to locate and indicate ways to utilize the
Nutrition-Facts Label. The first teaching strategy suggestion for this objective was for
the instructor to describe and provide an example of the Nutrition-Facts Label. The
Nutrition-Facts Label handout from page 18 of the It�s All About You Owner�s Manual
was used to provide an excellent example. (1) In addition to this, a Nutrition-Facts
Label from a food item box was used to allow for transfer of learned items. Second,
the researcher informed the subject of its purpose. The third was for the instructor to
demonstrate how the subject could utilize the Nutrition-Facts Label in combination
with the portion size information and meal plan.
Enabling Objective #5
The following provides information used to accomplish the enabling objective
#8, which was to apply items learned about nutrition in this unit to life. The first
teaching strategy suggestion for this objective was for the subject to perform the
activity on Assignment Sheet #2. Second, the researcher made sure that the food
product boxes, measuring cups, utensils, dry-erase markers, and pencils were
provided for the subject on the table. Third, when the Assignment Sheet #2 in the
147
Unit of Instruction: Treatment 2 Group Dietetic Consults, Page 6 of 23
subject�s folder was used the directions and time limit of 5 minutes was stated, and
the researcher was available if subject needed help. The first step of Assignment
Sheet #2 was for the subject to select and list one food product that belonged to the
bread, cereal, and grains food group. The second step was for the subject to identify
and use the dry-erase marker to circle the location of carbohydrates on the Nutrition-
Facts Label of the box they selected. The third step was for the subject to write down
the amount of carbohydrates in the product. The fourth step was for the subject to
calculate how many servings of carbohydrate were stated on the serving size
information at the top of the Nutrition-Facts Label. The fifth step was for the subject
to refer to the Dinner section of the meal plan and use a dry-erase marker to circle
the location where they would use this food product and/or item. The last step was
for the subject to measure out the portion size of this food item. After this activity
was completed, the researcher evaluated Assignment Sheet #2 to determine
comprehension of items taught. Further explanation was provided if the subject
needed.
After evaluation, the fourth teaching strategy was provided to the subject that
included tips such as eat a food item from each food group, use a salad plate for
food, drink at least 1-8 oz. glass of water per meal, eat small healthy snacks, and to
drink water in between meals. To reinforce these tips each subject was shown an
example of a salad plate and 8-ounce glass. The researcher mentioned eating
healthy snacks such as carrots, salad, raisins, and fresh fruits.

148
Unit of Instruction: Treatment 2 Group Dietetic Consults, Page 7 of 23 Enabling Objective #6 The following provides information used to accomplish the enabling objective
#9, which was to complete and return a 3-day Food Diary at the next dietetic
consultation. The first strategy suggestion for this objective was to refer each subject
to the 3-day Food Diary in their folder and to ensure that they understood the
directions. The second was to mention the key components of the food diary, which
were the time, meal, food item, portion size, cooking methods, and emotional state.
The second was for the instructor to state that the subject�s application will be based
on the analysis of the 3-day Food Diary returned at the next dietetic consultation.

149
Unit of Instruction: Treatment 2 Group Dietetic Consults, Page 8 of 23
Assignment Sheet #1 Dietetic Consultation #1
Assignment Sheet #1-- Portion Sizes and Meal Plan Activity Code: ______________________________ Date: __________________ Directions: Complete this activity sheet in the first week after the first dietetic consultation. Based on the information presented on portion sizes and the meal plan accomplish the following activity. Time: Each section of this activity sheet will require 5 minutes. Section1: Bread, Cereal, Rice, and Grain Food Group Step 1: List one of your regularly eaten food items in the bread, cereal, and grain food group Step 2: Refer to portion size handouts and state the portion size of the food items listed. Step 3: Using the meal plan and portion size handouts, locate where you might use the food portion size on the meal plan ________________________________________________ Step 4: List other items that could be replaced for this food items on the meal plan at Lunch.

150
Unit of Instruction: Treatment 2 Group Dietetic Consults, Page 9 of 23 _________________________________________________________________ Section 2: Fruit Food Group Step 1: List one of your regularly eaten food items in the fruit food group Step 2: Refer to portion size handouts and state the portion size of the food items listed. Step 3: Using the meal plan and portion size handouts, locate where you might use the food portion size on the meal plan ________________________________________________ Step 4: List other items that could be replaced for this food items on the meal plan at Lunch. _________________________________________________________________
Section 3: Vegetable Food Group Step 1: List one of your regularly eaten food items in the vegetable food group Step 2: Refer to portion size handouts and state the portion size of the food items listed.
151
Unit of Instruction: Treatment 2 Group Dietetic Consults, Page 10 of 23 Step 3: Using the meal plan and portion size handouts, locate where you might use the food portion size on the meal plan ________________________________________________ Step 4: List other items that could be replaced for this food items on the meal plan at Lunch. _________________________________________________________________
Section 4: Protein Food Group Step 1: List one of your regularly eaten food items in the protein food group Step 2: Refer to portion size handouts and state the portion size of the food items listed. Step 3: Using the meal plan and portion size handouts, locate where you might use the food portion size on the meal plan ________________________________________________ Step 4: List other items that could be replaced for this food items on the meal plan at Lunch. ________________________________________________

152
Unit of Instruction: Treatment 2 Group Dietetic Consults, Page 11 of 23
Section 5: Diary Food Group Step 1: List one of your regularly eaten food items in the diary food group Step 2: Refer to portion size handouts and state the portion size of the food items listed. Step 3: Using the meal plan and portion size handouts, locate where you might use the food portion size on the meal plan ________________________________________________ Step 4: List other items that could be replaced for this food items on the meal plan at Lunch. _________________________________________________________________
153
Unit of Instruction: Treatment 2 Group Dietetic Consults, Page 12 of 23
Assignment Sheet #2
Dietetic Consultation #2 Assignment Sheet #2�Nutrition-Facts Label Activity Code: ______________________________ Date: __________________ Directions: Complete this activity sheet in the first week after the second dietetic consultation. Based on the information presented on portion sizes, the meal plan, and Nutrition-Facts Label accomplish the following activity. Time: Each section of this activity will take 5 minutes to complete. Section 1: Bread, Cereal, Rice, and Grains Food Group Step 1: Select and list one product from the table belonging to the Bread,
Cereal, and Grains food group. Step 2: Identify and circle the location of carbohydrates on the product
Nutrition-Facts Label. Write down the amount of carbohydrates in the product.
Step 3: Using the following: 1 portion size/serving of this group = 15 grams of
carbohydrate. Write down the amount written in Step 2 and divide it by 15 grams of carbohydrate. Write down the calculation and solve below.
________________________________________________

154
Unit of Instruction: Treatment 2 Group Dietetic Consults, Page 13 of 23 Step 4: Refer to the Dinner section of the meal plan and circle the location
where you would use this product. _________________________________________________________________
Step 5: Measure out the portion size of this food item that you would eat for
Dinner, using a measuring cup located on the table. Section 2: Vegetable and Fruit Food Groups Step 1: Select and list one product from the table belonging to the Vegetable
and Fruit food group. Step 2: Identify and circle the location of fiber on the product Nutrition-Facts
Label. Write down the amount of fiber in the product. Step 3: Refer to the Dinner section of the meal plan and circle the location
where you would use this product. _________________________________________________________________

155
Unit of Instruction: Treatment 2 Group Dietetic Consults, Page 14 of 23 Step 4: Measure out the portion size of this food item that you would eat for
Dinner, using a measuring cup located on the table.
Tips: • ½ cup of canned vegetables or 1 cup of fresh vegetables or
salad equals one serving of vegetables • ½ cup of canned fruit or 1 small to medium fresh fruit, or 1/3 cup
of 100% fruit juice Section 3: Protein Food Group Step 1: Select and list one product from the table belonging to the Protein food
group. Step 2: Identify and circle the location of protein on the product Nutrition-Facts
Label. Write down the amount of protein in the product. Step 3: Using the following: 1 portion size/serving of this group = 7 to 8 grams
of protein. Write down the amount written in Step 2 and divide it by 7 to 8 grams of protein. Write down the calculation and solve below.
_________________________________________________________________ Step 4: Refer to the Dinner section of the meal plan and circle the location
where you would use this product. _________________________________________________________________
156
Unit of Instruction: Treatment 2 Group Dietetic Consults, Page 15 of 23 Step 5: Measure out the portion size of 3 ounces of this food item that you
would eat for Dinner, using the calculation from Step 5.
Tip:
• 3 ounces of protein such as beef, chicken, lamb, pork, and turkey is the size of a deck of playing cards
Section 5: Diary Food Group Step 1: Select and list one product from the table belonging to the Diary food
group. Step 2: Identify and circle the location of protein on the product Nutrition-Facts
Label. Write down the amount of protein in the product. Step 3: Using the following: 1 portion size/serving of this group = 8 grams of
protein. Write down the amount written in Step 2 and divide it by 8 grams of protein. Write down the calculation and solve below.
________________________________________________ Step 4: Refer to the Breakfast section of the meal plan and circle the location
where you would use this product. _________________________________________________________________

157
Unit of Instruction: Treatment 2 Group Dietetic Consults, Page 16 of 23 Step 5: Measure out the portion size of this food item that you would eat for
Dinner, using a measuring cup located on the table. Tips:
• 1 serving of milk is equal to 1 cup or 8 ounces • 1 serving of cheese is equal to 1 ounce

158
Unit of Instruction: Treatment 2 Group Dietetic Consults, Page 17 of 23
Lesson references
1. The Dietary Guidelines Alliance. It�s All About You. National Cattlemen�s Beef
Association and Cattlemen�s Board; 2003.
2. MyPyramid. Inside the pyramid. Available at: http://www.mypyramid.gov/
pyramid/index.html. Accessed December 10, 2006.
3. American Dietetic Association, Piechota T. Real Solutions Weight Loss
Workbook. Chicago, Illinois: Diana Faulhaber; 2004.
Equipment/supplies needed The following equipment and supplies were needed in unit 2: Unit 2 Power Point floppy-disk and note sheets, Notebook portable computer, Slide projector, black ink ball-point pens, 2 dry-erase markers, calculator, measuring cups, boxes of food items that contain carbohydrates, and the Healthy Weight Loss Program and Learning Activity folder. Preparation by instructor required? Prior to the first dietetic consultation, the researcher needed to complete the
nutrition assessment process, which included calculation of each subject�s daily
nutritional needs, and a comparison of their actual and desired nutritional intake.
This was based upon the data gathered from each subject�s Medical and Nutritional
Data Form, Food Frequency Questionnaire, and the 3-day Food Diary.
Second, the dietetic consultation folder was made and divided into sections
for each enabling objective, starting with section #1 for enabling objective #1.

159
Unit of Instruction: Treatment 2 Group Dietetic Consults, Page 18 of 23
The section #1 contained the initial Food Frequency Questionnaire and 3-day
Food Diary. Section #2 contained the Personal Warranty Plan for Your Body
handout to complete the long-term goal setting activity. (1) The Section #3
contained each subject�s first personalized meal plan. For Section #4 the portion
size handouts and the Basic Training�The Food Guide Pyramid handout was
included in the each subject�s folder. (1) In Section #5 of the folder the Assignment
Sheet #1 was included. Section #6 contained the Nutrition-Facts Label handout,
Assignment Sheet #2, and the 3-day Food Diary. For section #6 another 3-day food
diary was included in the folder.
In the third step the laptop computer and the Unit 2 floppy disk was used to
set up the instructional media to educate each subject. The lap computer and note
sheets will be used for the Power Point presentation.
The fourth step in the preparation process was for the instructor to provide
each subject with the following items to complete assignments: dry-erase markers,
laminated meal plan example, and laminated food product boxes labels. Subjects
were able to use their own measuring cups, utensils, and pencils.
Preparation by the subject (of any) required?
First, the subject had to complete and return their Food Frequency
Questionnaire and 3-day Food Diary prior to the first dietetic consultation.

160
Unit of Instruction: Treatment 2 Group Dietetic Consults, Page 19-22 of 23 Information Pages
BODY Information in outline format Key
Points Suggested activity you will use to
stress the key points Enabling Objective #1:
Set the first long-term health goal
Content outline:
IV. Take precautions and plan to be healthy
D. Are you committed?
E. Personal reasons for action
F. Short-term goals and Long-term
goal
Enabling Objective #2:
Recognize and state the need for portion sizes
within each food group
Content outline:
III. What are portion sizes?
IV. Why use portion sizes?
A. Decrease excess body weight
B. Seeing is believing
C. Limits overeating
D. Allows for variety of foods
V. Portion sizes for each food group
Enabling Objective #3:
Locate and indicate ways to utilize portion size
information and the meal plan
Content outline:
Use Power Point--Slide 6 Use the Personal Warranty Plan for Your Body handout of page 9 in the �It�s All About You� Owner�s Manual. (59)
• Long-term goal=Personal Health
Goals
(3rd section) Use the following: • Food guide pyramid poster
• Point to this food group
• Portion size handouts • Turn to the Starches portion size handout
• Handout of page 16 �It�s All About You� (59)
• The 50-60% of calories need to come
from the Bread, Cereal, and Grains (Starch) food group.
Provide dry-erase marker Use Assignment Sheet #1 in subject�s folder, state directions, and time for this objective. Be available if subject needs help and check Assignment sheet #1.

161
I. Select a regularly eaten food item
II. State the portion size of the food
III. Locate where the subject might use this food item in its portion size on the meal plan
Enabling Objective #4:
Locate and indicate ways to utilize the Nutrition-
Facts Label
Content outline:
I. What is the Nutrition-Facts-Label?
II. What is its purpose?
III. How to utilize it in combination with
portion sizes and the meal plan
Enabling Objective #5:
Apply items learned about nutrition in this unit
to life
Content outline:
I. Select and list one food product
belonging to this food group
II. Identify and circle the location of
carbohydrates and other items directed
by the Assignment Sheet #2 on the
Nutrition-Facts Label on the box
selected.
III. Amount of carbohydrates and other
items directed by the Assignment Sheet
#2 in the product
IV. Calculate the servings of carbohydrate
Use the Nutrition-Facts Label handout (Page 18 of the �It�s All About You� Owner�s Manual) (59) Use Assignment Sheet #2 in subject�s folder, state directions, and time for this objective. Make sure subject has the following: • Food product boxes • Measuring cups • Utensils • Pencils Show subject an examples of: • Salad plate • 8 oz glass Mention healthy snacks such as: • Carrots

162
and other items directed by the
Assignment Sheet #2 stated on the
serving size information of the Nutrition-
Facts Label
V. Dinner section of the meal plan and the
subject to circle where to use this food
product
VI. Subject to measure out the portion size
of this food item
VII. Give tips
A. Eat a food item from each food
group
B. Use salad plate for food
C. Drink 1-8 oz. glass of water per
meal
D. Eat small healthy snacks and drink
water in between meals
Enabling Objective #9:
Complete and return a 3-day food diary for next
dietetic consultation.
Content outline:
I. Subject to journal nutritional intake for
3-days in a food diary
A. Indicate time
B. Meal
C. Food items
D. Portion size
E. Cooking methods
• Salad • Raisins • Fresh fruit Refer each subject to the 3-day food diary and make sure they understand directions.

163
F. Emotional state
II. Return completed 3-day food diary at
each dietetic consultation

164
Unit of Instruction: Treatment 2 Group Dietetic Consults, Page 23 of 23
Assignment Sheet(s) • Applies meaningful and motivational activities • Back with resources to support cognitive information acquisition • Relates to each objective • Provides instructions • Utilizes creativity
Due Assignment Name Unit 2 Assignment #1: Nutritional Assessment Forms Activity #1: I Do�Dieting and Commitment (3)
Activity #2: The Battle of the Bulge--Are Your Weapons Drawn? (3)
Activity #3: Personal Warranty Plan for Your Body (1) Unit 3 Assignment #2: 3-Day Food Diary Activity #4: The Devil Made Me Do It Worksheet (3)
Activity #5: Gaining Support Worksheet (3)
References 1. The Dietary Guidelines Alliance. It�s All About You. National Cattlemen�s Beef
Association and Cattlemen�s Board; 2003.
2. MyPyramid. Inside the pyramid. Available at: http://www.mypyramid.gov/
pyramid/index.html. Accessed December 10, 2006.
3. American Dietetic Association, Piechota T. Real Solutions Weight Loss
Workbook. Chicago, Illinois: Diana Faulhaber; 2004.

165