dietary patterns among overweight/obese mayra arias gastélum
TRANSCRIPT

Dietary Patterns among Overweight/Obese
Hispanic Women at High Risk for Type 2 Diabetes
by
Mayra Arias Gastélum
A Dissertation Presented in Partial Fulfillment
of the Requirements for the Degree
Doctor of Philosophy
Approved May 2018 by the
Graduate Supervisory Committee:
Sonia Vega-López, Chair
Cheryl Der Ananian
Corrie Whisner
Meg Bruening
Steven Hooker
ARIZONA STATE UNIVERSITY
August 2018

i
ABSTRACT
Background: Hispanic women are at high risk for Type 2 Diabetes (T2D), in part
due to their high prevalence of obesity, which may influence the development of insulin
resistance and disease onset. Unhealthy eating contributes to T2D risk. Dietary patterns
are the combination of total foods and beverages among individual’s over time, but there
is limited information regarding its role on T2D risk factors among Hispanic women.
Objective: To identify a posteriori dietary patterns and their associations with diabetes
risk factors (age, BMI, abdominal obesity, elevated fasting blood glucose, and
hemoglobin A1c) among overweight/obese Hispanic women. Design: Cross-sectional
dietary data were collected among 191 women with or at risk for T2D using the
Southwestern Food Frequency Questionnaire capturing the prior three months of intake.
Dietary patterns were derived using exploratory factor analysis. Regression scores were
used to explore associations between dietary patterns and diabetes risk factors. Results:
The patterns derived were: 1) “sugar and fat-laden”, with high loads of sweets, drinks,
pastries, and fats; 2) “plant foods and fish”, with high loads of vegetables, fruits, fish, and
beans; 3) “soups and starchy dishes”, with high loads of soups, starchy foods, and mixed
dishes; 4) “meats and snacks”, with high loads of red meat, salty snacks, and condiments;
5) “beans and grains”, with high loads of beans and seeds, whole-wheat and refined grain
foods, fish, and alcohol; and 6) “eggs and dairy”, with high loads of eggs, dairy, and fats.
The “sugar and fat-laden” and “meats and snacks” patterns were negatively associated
with age (r= -0.230, p= 0.001 and r= -0.298, p<0.001, respectively). Scores for “plant
foods and fish” were associated with fasting blood glucose (r= 0.152, p= 0.037). There
were no other statistically significant relationships between the dietary patterns and risk

ii
factors for T2D. Conclusions: A variety of patterns with healthy and unhealthy traits
among Hispanic women were observed. Being younger may play an important role in
adhering to a dietary pattern rich in sugary and high-fat foods and highlights the
importance of assessing dietary patterns among young women to early identify dietary
traits detrimental for their health.

iii
DEDICATION
This doctoral dissertation is dedicated to my family who has been always
supportive and has always provided the ground for me to grow as a person and as a
professional. To the best and most loving parents in the world, Roman and Gloria, thanks
for always giving me your love and for making me laugh so much. To my sister Lorena,
you have always been a model of honesty and maturity for me and for our family. Thanks
for being always there for me. To my brother, for always being with me even when you
are not on earth anymore. To the little kids of the family, Larissa, Román Elías, and Iker,
your love always gave me the strength to continue. To Stevens, you make me want to be
a better person. Thanks for your words of encouragement and support.

iv
ACKNOWLEDGMENTS
Many instances made this doctoral dissertation possible. I would like to express
my total appreciation for their support.
I would like to acknowledge the dedication and support provided by my mentor
Dr. Sonia Vega-López. Your critical thinking and goal-oriented personality motivates me
to become a better researcher. I will be infinitely grateful for all your support.
I would like to thank my dissertation committee members Meg Bruening, Cheryl
Der Ananian, Steven Hooker, and Corrie Whisner for their significant contribution and
support for completing this dissertation.
I am very thankful to Nangel Lindberg for trusting on me to write this
dissertation. I would like to give special thanks to the De Por Vida research team, for all
the hard work to take the study to completion. Also, I would like to thank all the women
who participated in the study.
I feel deeply thankful to my Ph.D. classmates for their friendship, support and
company. I would like to thank Ana María, Karen, Sayali, and Jane, who made these last
four years a better experience.
Services in support of the research project were generated by the University of
Arizona Cancer Center Behavioral Measurement and Interventions Shared Resource,
supported, in part, with funding from NIH-NCI Cancer Center Support Grant P30
CA023074.
This work was supported by the National Institutes of Health and the National
Institute of Diabetes and Digestive Kidney Diseases, grant 1R01DK099277.

v
I would like to acknowledge the scholarship provided by PRODEP at the
Universidad Autónoma de Sinaloa with funding from the Federal Government of Mexico.

vi
TABLE OF CONTENTS
Page
LIST OF TABLES ............................................................................................................. xi
LIST OF ABBREVIATIONS............................................................................................ xii
CHAPTER
1 INTRODUCTION ...................................................................................................1
1.1 Diabetes ............................................................................................1
1.1.1 Hispanics and Type 2 Diabetes ......................................................2
1.1.1.1 Type 2 Diabetes and Cardiovascular Disease ..............................3
1.1.1.2 Type 2 Diabetes Among Women ................................................5
1.2 Metabolic Syndrome .........................................................................6
1.2.1 Hispanics and Metabolic Syndrome ...............................................7
1.2.2 Strategies to Decrease Metabolic Syndrome ..................................8
1.2.2.1 Diet as Lifestyle Factor for Metabolic Syndrome and
Type 2 Diabetes ......................................................................................9
1.4 Purpose of Research ........................................................................ 12
2 LITERATURE REVIEW ..................................................................................... 14
2.1 Metabolic Syndrome ....................................................................... 14
2.2 Prediabetes ...................................................................................... 17
2.2.1 Glucose Regulation ...................................................................... 17
2.2.1.1 Pathophysiology of Prediabetes ................................................ 19
2.2.2 Burden of Prediabetes .................................................................. 20
2.3 Diabetes .......................................................................................... 21

vii
CHAPTER Page
2.3.1 Pathophysiology of Diabetes ........................................................ 23
2.4 Lifestyle Management of Diabetes .................................................. 24
2.4.1 Weight Control............................................................................. 24
2.4.2 Diabetes Nutrition Therapy .......................................................... 26
2.4.2.1 Nutrition Recommendations...................................................... 28
2.4.2.1.1 Energy Balance ...................................................................... 28
2.4.2.1.2 Macronutrient Distribution ..................................................... 29
2.4.2.1.3 Carbohydrates ........................................................................ 30
2.4.2.1.3.1 Dietary Fiber and Whole Grains ..........................................33
2.4.2.1.4 Protein .................................................................................... 34
2.4.2.1.5 Total Fat ................................................................................. 35
2.4.2.1.6 Alcohol................................................................................... 37
2.4.2.1.7 Sodium ................................................................................... 37
2.5 Dietary Patterns and Health Outcomes ............................................38
2.5.1 Dietary Approaches to Stop Hypertension ................................... 38
2.5.2 Vegetarian Diets ........................................................................... 39
2.5.3 Mediterranean Diets ..................................................................... 40
2.5.4 Mexican Diets .............................................................................. 41
2.5.5 Dietary Patterns Analysis Methods .............................................. 43
2.5.5.1 A posteriori Dietary Patterns Studies ........................................ 45
2.5.6 Dietary Patterns: Strenghts and Limitations ................................. 47
2.6 Dietary Assessment ......................................................................... 49

viii
CHAPTER Page
2.6.1 Subjective Methods ...................................................................... 49
2.6.1.1 Twenty-Four Hour Dietary Recall ............................................. 49
2.6.1.2 Dietary Record .......................................................................... 50
2.6.1.3 Diet History ............................................................................... 50
2.6.1.4 Food Frequency Questionnaire.................................................. 51
2.6.1.5 Diet Quality Indices .................................................................. 51
2.6.2 Objective Methods ....................................................................... 55
2.6.2.1 Biomarkers ................................................................................ 55
2.6.2.1.1 Biomarkers of Fatty Acid Intake ............................................ 56
2.6.2.1.2 Biomarkers of Fruit and Vegetable Intake .............................. 56
2.6.2.2 Objective Methods: Strenghts and Limitations .......................... 57
2.7 Conclusion ......................................................................................58
3 METHODOLOGY ................................................................................................. 60
3.1 Study Design ................................................................................... 60
3.2 Recruitment ..................................................................................... 60
3.3 Participants...................................................................................... 61
3.4 Data Collection ............................................................................... 62
3.5 Measurements ................................................................................. 62
3.5.1 Anthropometric Measurements .................................................... 62
3.5.2 Biochemical Assessments ............................................................ 63
3.5.3 Dietary Assessment ...................................................................... 63
3.6 Sample Size .................................................................................... 65

ix
CHAPTER Page
3.7 Dietary Pattern Analysis ................................................................. 66
3.8 Statistical Analyses ......................................................................... 68
4 RESULTS .......................................................................................................... 71
4.1 Descriptive Characteristics of Participants ...................................... 71
4.2 Macronutrient Intake ....................................................................... 71
4.3 Dietary Patterns ............................................................................... 73
4.4 Associations of Dietary Patterns with Risk Factors ......................... 74
5 DISCUSSION ......................................................................................................... 77
5.1 Dietary Patterns ............................................................................... 77
5.2 Associations of Dietary Patterns with Risk Factors ......................... 83
5.3 Strenghts and Limitations................................................................ 88
5.4 Future Research .............................................................................. 90
6 CONCLUSION ...................................................................................................... 92
REFERENCES ................................................................................................................... 94
APPPENDIX
A INSTITUTIONAL REVIEW BOARD APPROVAL FOR KAISER
PERMANENTE CENTER FOR HEALTH RESEARCH .................................... 125
B INSTITUTIONAL REVIEW BOARD APPROVAL FOR
ARIZONA STATE UNIVERSITY ..................................................................... 128
C CONSENT FORM IN ENGLISH ........................................................................ 131
D CONSENT FORM IN SPANISH ........................................................................ 138
E SOUTHWESTERN FOOD FREQUENCY QUESTIONNAIRE ........................ 147

x
CHAPTER Page
F ADDITIONAL RESULTS ................................................................................... 168
G DATA SHEETS................................................................................................... 170

xi
LIST OF TABLES
Table Page
1. Food Groupings Assessed with the Southwestern Food Frequency
Questionnaire ..................................................................................................... 70
2. Anthropometric, Diabetes Risk Factors and Risk Categories Among
Overweight/Obese Hispanic Women Participating in De Por Vida .................... 72
3. Energy and Macronutrient Intake among 191 Overweight/Obese Hispanic
Women Participating in De Por Vida .................................................................. 73
4. Factor Loadings from Exploratory Factor Analysis of Food Frequency
Questionnaires Among 191 Overweight/Obese Hispanic Women Participating
in De Por Vida .................................................................................................... 75
5. Associations Between Dietary Patterns and Diabetes Risk Factors Among
Overweight/Obese Hispanic Women Participating in De Por Vida .................... 76

xii
LIST OF ABBREVIATIONS
2hPG: Two hours post oral plasma glucose
24HR: Twenty four hour dietary recall
AD: anno Domini (in the year of the Lord)
ADA: American Diabetes Association
AHEI: Alternate Healthy Eating Index
AIDS: Acquired immunodeficiency syndrome
AMD: Acceptable macronutrient distribution
ARIC: Atherosclerosis Risk in Communities
ATP III: Adult Treatment Panel III
BC: Before Christ
BMI: Body mass index
BPRHS: Boston Puerto Rican Health Study
CHD: Coronary heart disease
CI: Confidence interval
CRP: C reactive protein
Cm: Centimeters
CoA: Coenzyme A
CVD: Cardiovascular disease
DASH: Dietary Approaches to Stop Hypertension
DPP: Diabetes prevention program
DPS: Diabetes prevention study
EASD: European Association for the Study of Diabetes

xiii
E.g.: Example given
EGP: Endogenous glucose production
FBG: Fasting blood glucose
FID: Food items
FFQ: Food frequency questionnaire
FPG: Fasting plasma glucose
G: gram
G/d: Gram per day
GIP: Glucose-dependent insulinotropic peptide
GLP-1: Glucagon-like peptide 1
HbA1c: Hemoglobin A1c
HC: High carbohydrate
HCHS/SOL: Hispanic Community Health Study/Study of Latinos
HDL-C: High density lipoprotein-cholesterol
HEI: Healthy Eating Index
HIS: Indian Health Services
HIV: Human immunodeficiency virus
HOMA-IR: Homeostatic Model Assessment for Insulin Resistance
ICD: International Classification of Diseases
IFG: Impaired fasting glucose
IGT: Impaired glucose tolerance
IL-6: Interleucine-6
IOM: Institute of Medicine

xiv
Kcal: Kilocalories
Kg: Kilogram
Kg/m2: Kilograms per square meter
LC: Low carbohydrate
LDL-C: Low density lipoprotein-cholesterol
MedD: Mediterranean Diet
Mg: Milligrams
Min: Minute
Mg/dL: Milligrams/deciliter
MmHg: Millimeter of mercury
Mmol/L: Millimoles per litre
Mmol/mol: Millimoles per mol
MNT: Medical nutrition therapy
MODY: Maturity-onset diabetes of the young
MUFA: Monounsaturated fatty acid
NCEP: National Cholesterol Education Program
NFG: Normal fasting glucose
NGT: Normal glucose tolerance
NHANES: National Health and Nutrition Examination Survey
NHIS: National Health Interview Survey
NS: Non-significant
OGTT: Oral glucose tolerance test
OR: Odds ratio

xv
PAR: Population-attributable risk
Pmol: Picomoles
PUFA: polyunsaturated fatty acid
RR: Relative risk
SD: Standard Deviation
SE: Standard error
SFA: Saturated fatty acid
SWFFQ: Southwestern Food Frequency Questionnaire
T2D: Type 2 diabetes
U.S.: Unites States
UK: United Kingdom
USDA: U.S. Department of Agriculture
VCAM-1: Vascular cell adhesion protein-1
VGMHC: Virginia Garcia Memorial Health Center
WHO: World Health Organization

1
CHAPTER 1
INTRODUCTION
1.1 Diabetes
Type 2 diabetes mellitus (T2D) accounts roughly for 90-95% of all the types of
diabetes.1 T2D is a serious chronic disease characterized by hyperglycemia resulting from
defects in insulin secretion, insulin action, or both. Sustained and chronic hyperglycemia
of T2D is associated with damage to, and failure of different organs, particularly the eyes,
kidneys, nerves, heart, and blood vessels.2 Prevalence of T2D has risen to epidemic levels
in the last decades affecting more than 29 million people in the U.S. and 420 million
worldwide with a projected worldwide prevalence of 642 million by 2040.3
In the U.S., 29.1 million people or 9.3% of the population have diabetes and it is the
6th disease leading cause of death. However, it is estimated that 27.8% of people with
diabetes remain undiagnosed. Estimates from 2009-2012 based on fasting glucose and
hemoglobin A1c (HbA1c) indicated 37% of U.S. adults aged 20-64 years and 51% of
adults aged 65 and older had prediabetes,3 which is the term used for individual with
impaired fasting glucose and/or impaired glucose tolerance.1
It has been reported that T2D imposes a considerable economic burden on individuals
with the condition. The estimated lifetime direct medical costs of treating T2D is
$124,700 in men and $130,800 in women with age 25-44 years at diagnosis.4 T2D is not
only expensive but also affects the quality of life of individuals affected. The presence of
diabetes nearly doubles the likelihood of depressive disorders; on the other hand, the
presence of a depressive disorder increases the likelihood of developing diabetes by 37%.
Studies indicated that depression, both clinical and subclinical symptoms, is considered a

2
reliable predictor for poor adherence to medical regimens among those with T2D, and
severity of depression has been shown to be associated with poorer quality of life.5
Epidemiological studies have shown that obesity and weight gain are the most
important risk factors for T2D, which may influence the development of insulin
resistance and disease onset.6 T2D is derived from a complex interaction of heritable
genetic risk factors (family history), gut metagenome, and lifestyle factors such as
sedentary lifestyle, physical inactivity, smoking, and alcohol consumption.6 Diet is also
considered an important independent risk factor for diabetes.7 For instance, diets low in
fiber and rich in simple carbohydrates, deficiency of nutrients such as vitamin D and
vitamin K,8 9,10 and specific dietary fatty acids have been associated with increased risk of
T2D.11 The aspect of diet and T2D is discussed in more detail in a further section.
1.1.1 Hispanics and Type 2 Diabetes
Health disparities have been reported among Latinos. Health disparities are
defined as differences in health, and are considered avoidable, unfair and unjust.12 Factors
contributing to disparities and poor diabetes quality of care and health outcomes among
socially disadvantaged and patients from minority groups are lack of access to health
system, poor health literacy and numeracy, language barriers, financial disadvantage, lack
of trust, and perceived discrimination by health care providers.13 Adults with diabetes
with no insurance receive fewer if any recommended processes of care, have worse
glycemic control, and develop more diabetes complications. Particularly among Latinos
with T2D, uninsured individuals have higher rates of microvascular complications than
those who are insured.14

3
Hispanic/Latinos show higher prevalence of T2D and at a younger age compared
to non-Hispanic whites.3 According to 2009-2012 National Health and Nutrition
Examination Survey (NHANES), 2010-2012 National Health Interview Survey (NHIS),
2012 Indian Health Services and 2012 U.S. resident population estimates, a high
percentage of Hispanics have been diagnosed with diabetes (12.8%), just after American
Indians/Alaska Natives (15.9%) and Non-Hispanic blacks (13.2%).3 (Mexican-Americans
often represent Hispanic group in a majority. The prevalence of T2D has been noted to be
different by Hispanic/Latino background, which perhaps fail to distinguish the
heterogeneity in diabetes prevalence across subgroups within the Hispanic population.15
Estimated prevalence of self-reported diabetes among across subgroups of Hispanics
including Puerto Rican, Mexican, Mexican-American, Cuban, Dominican, Central/South
American and other Hispanics subgroups, have shown that Puerto Rican (11%), Mexican-
Americans (10.2%), and non-Hispanic blacks (10.2%) have the highest prevalence of
self-reported T2D of all groups, as opposed Central/South Americans (4%) with the
lowest self-reported prevalence.15
1.1.1.1 Type 2 Diabetes and Cardiovascular Disease
T2D is a risk factor for cardiovascular disease (CVD).16 CVD encompasses
coronary heart, cerebrovascular, peripheral arterial, rheumatic heart, and congenital heart
diseases, as well as deep vein thrombosis and pulmonary embolism.17 Besides T2D, other
important risk factors for CVD include an unhealthy diet, physical inactivity, tobacco use
and excessive alcohol consumption. The effects of these behaviors can manifest in
individuals as high blood pressure, increased blood glucose, impairment in blood lipids,

4
and overweight and obesity.17 According to the World Health Organization (WHO), CVD
is the number one cause of death globally.17 However, based on 2009-2013 NHIS and
2009-2012 NHANES data, overall Hispanic all-cause mortality rate was 24% lower than
for non-Hispanic whites, and Hispanics overall had lower rates than whites for most
leading causes of death. This is consistent with previous reports where the phenomenon is
called “Hispanic Paradox”18 to describe Hispanics’ projected longer life expectancy, and
lower overall mortality, despite multiple potential barriers to health including lack of
medical insurance and worse environmental conditions in the places they live, work, and
age.19 Although the “Hispanic Paradox” has been reported, in comparison rates are
substantially higher among Hispanics for diabetes (>51%), essential hypertension and
hypertensive renal disease (>8%), and two out of five deaths (>41%) among Hispanics
were the result of cancer and CVD.20 Furthermore, it has been reported that overall, U.S.-
born Hispanics show a higher prevalence of risk factors and worse health outcomes than
foreign-born Hispanics. For instance, U.S. born Hispanics had a greater prevalence of
cancer, heart disease, smoking, hypertension, and obesity than foreign-born Hispanics
(93%, 89%, 72%, 40%, and 30%, respectively).20
CVD is one the leading causes of mortality among Hispanics/Latinos21 with a
high burden of CVD risk factors among Mexican-Americans, who comprised the largest
and most studied Hispanic/Latino group in the U.S.21 The prevalence of cardiovascular
risk factors differs by Hispanic background and it has been observed to differ by degree
of acculturation.22 According to baseline data from 2008-2011 from the Hispanic
Community Health Study/Study of Latinos (HCHS/SOL) which included Cuban,
Dominican, Mexican, Puerto Rican, Central American and South American

5
Hispanic/Latino backgrounds,23 there is a marked variability in CVD risk factor
prevalence within the Hispanic/Latino population, with those with Puerto Rican
background undergoing remarkably high rates of individual CVD risk factors and overall
risk factor burden compared with the other groups. However, Mexicans also showed a
high prevalence of cardiovascular risk factors as well including hypertension (19.5% vs.
21.4%), hypercholesterolemia (36.2% vs. 53.9%), obesity (41.5% vs. 36.8%), T2D
(18.5% vs. 19.3%), and smoking (10% vs. 23.1%) for women and men, respectively.23
Across all ethnic backgrounds, hypertension and diabetes were strongly associated with
prevalent stroke in men and women, and hypercholesterolemia and obesity were
significantly associated with prevalent stroke only among women.23
1.1.1.2 Type 2 Diabetes Among Women
The risk of T2D has been reported to differ by sex and it has been suggested that
endogenous sex hormones may play a role in T2D onset.24 For instance, in some studies,
hyperandrogenic conditions (e.g., polycystic ovarian syndrome) have been strongly
associated with glucose intolerance and insulin resistance in women.25,26 Other studies
have reported associations of hypoandrogenism with adiposity and insulin resistance in
men.27 Also, sex-dependent relationships have been reported for the risk of T2D and
estradiol, which is a form of the primary female sex hormone estrogen. Although there
have been reports suggesting a positive association between estradiol and insulin
resistance in women,28 these findings have been inconsistent.29 Furthermore, T2D is
considered a more powerful risk factor for coronary heart disease (CHD) mortality in
women than in men, with women with T2D having risk for CHD mortality 3.5-fold, but

6
only 2-fold in men (p=0.008 for sex difference).24 A systematic review and meta-analysis
evaluating the association of plasma levels of testosterone, estradiol, and sex-hormone-
binding globulin with risk of T2D found that men with higher testosterone levels had
42% lower risk of T2D; while there was indication that testosterone increased risk of
T2D in women. Higher levels of sex-hormone binding globulin were protective in women
with 80% lower risk, but only 50% lower risk in men. Also, estradiol levels were higher
in men and postmenopausal women with T2D compared with controls without T2D.30
1.2 Metabolic Syndrome
Metabolic Syndrome is characterized by a group of metabolic risk factors and is
strongly associated with T2D or the risk of this disease.31,32 According to the National
Cholesterol Education Program (NCEP) Adult Treatment Panel III (ATP III), Metabolic
Syndrome diagnostic criteria include at least three of the following conditions: elevated
triglycerides (150 mg/dL), low High Density Lipoprotein-Cholesterol (HDL-C) (<40
mg/dL in men, <50 mg/dL in women), hypertension (high systolic 130 mmHg or high
diastolic blood pressure 85 mmHg), high fasting glucose (100 mg/dL), and abdominal
obesity (102 cm in men, 88 cm in women).33
The overall prevalence of Metabolic Syndrome in the U.S. population increased from
25.3% in 1988-1994 to 34.2% in 2007-2012 according to NHANES data.34 Findings from
this study indicated that compared to non-Hispanic white men, non-Hispanic black men
were less likely to have Metabolic Syndrome (OR, 0.77, 95%CI, 0.66-0.89); but non-
Hispanic black women were more likely than non-Hispanic white women to have
Metabolic Syndrome (OR, 1.20, 95%CI, 1.02-1.40). Low education level (OR, 0.77,

7
95%CI, 0.66-0.89) and older age (OR, 0.77, 95%CI, 0.66-0.89) were independently
associated with increased likelihood of having Metabolic Syndrome.34 The Metabolic
Syndrome also affects younger individuals. There has been reported increase in the
prevalence of risk factors and Metabolic Syndrome children35 and adolescents.36 Based
on the findings of a systematic review, for whole populations, the estimated overall
prevalence of Metabolic Syndrome in children ranged from 1-3% using the ATP III, and
for populations of overweight/obese children, the prevalence range from 10-36%.35 In
youth, it has been reported that one in 10 adolescents has Metabolic Syndrome with an
estimated prevalence 10.1%, and 73.2% of the participants had at least one risk factor for
Metabolic Syndrome.36 These findings have important health public implications due to
the established cardiovascular disease risk factors related to Metabolic Syndrome
affecting younger populations.36
1.2.1 Hispanics and Metabolic Syndrome
According to the National Health and Nutrition Examination Survey (NHANES),
the prevalence of Metabolic Syndrome is consistently higher in racial/ethnic minority
groups, such as Hispanic/Latinos compared to non-Hispanic whites.37 Prevalence of
Metabolic Syndrome increases with age and in a sex-specific manner. For instance, when
stratified by race/ethnicity and age group, Metabolic Syndrome prevalence increased
from 10% among those aged 18-29 years including all racial/ethnic groups to almost 70%
among those aged 70 or older between 2007-2012.37 Sex differences in the prevalence of
Metabolic Syndrome may result in different cardiovascular risk for men and women.38
Hispanics/Latinos are at high risk for cardiometabolic disease, with higher levels of

8
insulin resistance,39 and higher rates of conversion to T2D than non-Hispanic whites.40
Particularly, the prevalence of diagnosed diabetes by age and sex in Mexican-Americans
is approximately twice (12%) as in non-Hispanic whites (6.3%).41 Mexican-American
men and women are more likely to have elevated fasting glucose, and Mexican-American
women are more likely to have abdominal obesity, elevated triglycerides and reduced
HDL-C than their non-Hispanic whites counterparts.34
1.2.2 Strategies to Decrease Metabolic Syndrome
The Metabolic Syndrome and prediabetes are strongly associated with obesity.42
Although the mechanisms of obesity predisposition to Metabolic Syndrome and
prediabetes are not completely understood, insulin resistance and systemic inflammation
are considered common factors in their development. Insulin resistance is thought to be a
mediator of all metabolic risk factors of Metabolic Syndrome.43 44 In the context of
increased adipose tissue, prior work suggests that adipose tissue releases excess free fatty
acids and a variety of adipokines, 44 which appear to underlie a proinflammatory state.43
The increased adipose tissue-derived free fatty acids induce insulin resistance at a
muscular level, which causes an elevation of plasma glucose.43 Increased plasma free
fatty acids over time may affect beta-cell function mediated by lipotoxicity,45 increased
hepatic glucose production, higher glucose concentration, hyperglycemia,46 and
hypertriglyceridemia in plasma that results in lower HDL-C concentrations.47
Reduction of abdominal obesity has been reported to improve glucose tolerance in
subjects at risk for Metabolic Syndrome.48 Also, energy restriction is known as an
effective strategy to promote weight loss and to improve Metabolic Syndrome status.49

9
Further reported benefits from energy restriction have been improved immunity and
prolonged lifespan.50 A restriction of 500 kcal/day among subjects with Metabolic
Syndrome following either a diet with whole grains or refined grains showed an
improved body composition regardless of the type of grains consumed. However, those
consuming whole grains showed greater decreases in C-reactive protein (inflammation
biomarker) and waist circumference.49 Additionally, whole grain consumption was
significantly associated with greater intakes of fiber and magnesium, which have been
associated with protection against Metabolic Syndrome.49 Calorie restriction has been
also associated with reduction of plasma triglycerides and Low Density Lipoprotein-
Cholesterol (LDL-C), but concerns arise due to calorie-restricted diets have shown to
reduce HDL-C as well, which may impact the risk among individuals with already low
HDL-C concentrations.51 Since calorie restricted diets required long-term adherence,
these have reported to be more difficult to follow when compared with diets based on
food groups and dietary patterns, such as diets focusing on Mediterranean-style foods or
carbohydrate restriction (restricting food groups high in carbohydrates).52
1.2.2.1 Diet as Lifestyle Factor for Metabolic Syndrome and Type 2 Diabetes
A poor diet contributes to poor health and is a well-established modifiable risk
factor for the development of non-communicable diseases such as T2D and CVD.53
Intake and combination of foods that induce minimal postprandial glucose and insulin
response is thought to prevent or delay T2D onset,54 and healthy diets have been
repeatedly associated with decreased risk of all-cause mortality, T2D and CVD.55
However, the study of diet and T2D has been focused on individual nutrients (e.g.,

10
carbohydrates, dietary fiber)56,57 or food items consumed (e.g., sugar, sweetened drinks,
whole grains, fruits and vegetables)56,58 rather than focusing on the diet as a whole.59
Nutrients are not consumed in isolation, and it is the synergy of nutrients within
the context of a healthy diet that is frequently associated with a reduced risk of disease
such as CVD.60 Mixed meals contain several nutrients that may interact with each other,
for this reason is difficult to separate the specific effects of nutrients or foods on health
outcomes (e.g., blood pressure) or disease risk.61 For instance, diets high in fiber are
usually also high in vitamin C, folate, carotenoids, potassium and magnesium; making
difficult to ascertain that the associations observed between fiber and disease risk are not
a consequence of folate or carotenoid intake.61 Therefore, interactions between nutrients
may confound results from studies that looked at the effects of individual foods or
nutrients. In this scenario, the study of healthy dietary patterns has been proposed as a
better approach to examining the components of dietary patterns with disease risk and
health outcomes.61 Dietary pattern, often referred as “eating pattern”, is defined as the
combination of foods and beverages that constitute an individual’s complete dietary
intake over time, and may describe a way of eating including proportions, variety of
combinations of different foods and beverages, and also the frequency with which they
are habitually consumed.62 Examples of dietary patterns include the U.S. Department of
Agriculture (USDA) Food Patterns and the Dietary Approaches to Stop Hypertension
(DASH) eating plan.62 Particularly, it has been suggested that shifting from a Western
(e.g., rich in processed meats, high fat dairy products and refined grains) to a healthier
dietary pattern (e.g., rich in vegetables, fruit, fiber, whole grains, fish and poultry) may
reduce the risk of T2D.63,64 The influence of the overall diet on health outcomes (e.g.,

11
CDV, diabetes, cancer) instead of single foods and nutrients can be studied with dietary
patterns analysis.65 For instance, a systematic review and meta-analysis including 15
cohort studies indicated that healthy dietary patterns might be associated with the risk of
T2D.66
Hispanic women’s diet may impact their risk of weight gain, obesity, Metabolic
Syndrome, and T2D onset.67 Traditional Mexican foods are considered healthy, however,
higher acculturation among adults of Mexican descent living in the U.S. has been
associated with lower intake of these foods, adhering more to a typical U.S. or Western
diet, usually low in fruits and vegetables and high in refined grains and added sugar.68 It
has been reported that when compared to Mexicans, Mexican-Americans consume more
saturated fat, sugar, desserts, snacks high in sodium, pizza, and French fries, and have
higher intakes of low-fiber bread, high-fat milk, corn tortillas, and Mexican fast food.69
Additionally, Mexican-Americans are prone to consume insufficient amounts of fiber and
to be deficient in key nutrients such as iron70 and vitamin D.71
Exploratory factor analysis has emerged as a useful technique to derive dietary
patterns. Exploratory factor analysis is a variable reduction technique that captures the
primary sources of variation in a set of variables. When assessing dietary patterns, these
variables (foods consumed) and the identification of major sources of dietary variation,
make possible describing the main dietary patterns in a given study population.72
Assessing diet and dietary patterns among specifics ethnic/racial groups can help to
understand the associations between the diet as whole, and coexisting risk factors for
T2D. This would allow creating targeted strategies to improve their diet and decrease risk
factors for metabolic diseases.

12
There is still a gap in the literature regarding dietary quality and dietary patterns
among specific ethnic groups, including Mexican-Americans. Aside from having less
favorable risk factor profiles,23 there may be important traits in the diet of Mexican-
Americans that can further impact T2D risk such as higher intakes of fatty acids that have
an influence on insulin response (e.g., saturated fatty acid [SFA] such as palmitic acid),
or they might include dietary components that are protective against cardiometabolic
diseases (e.g., foods characteristic of the Mediterranean diet).
In view of the overwhelming prevalence of Metabolic Syndrome and T2D among
Hispanics, the study of distinct dietary patterns and their association with diabetes is
crucial. This would help to provide informed advice on which elements of the diet should
be modified with the goal of controlling and preventing T2D onset. To the best of our
knowledge, there are no published studies regarding dietary patterns and associations
with risk factors for T2D among Hispanic women with predominant Mexican
background.
1.4 Purpose of research
The goal of this dissertation is to explore the association between dietary patterns
and metabolic risk factors among overweight/obese Hispanic women with or at risk for
T2D. The specific aims are:
(1) to identify a posteriori-derived dietary patterns among overweight/obese
Hispanic women enrolled in a behavioral intervention for weight loss and diabetes risk
reduction using exploratory factor analysis, and

13
(2) to explore associations of the derived dietary patterns with risk factors
including BMI, abdominal obesity, hyperglycemia, and higher HbA1c. The working
hypothesis is that dietary patterns with greater loads of unhealthy foods will be associated
with greater diabetes risk.

14
CHAPTER 2
LITERATURE REVIEW
In this chapter, Metabolic Syndrome, T2D, research of different dietary
approaches to prevent and control T2D, the different methodologies to evaluate diet, and
purpose of research of the current study are included.
2.1 Metabolic Syndrome
Metabolic Syndrome consists of five cardiometabolic risk factors including
abdominal obesity (≥ 102 cm in males, ≥ 88 cm in females), elevated triglycerides (≥ 150
mg/dL or ≥ 1.7 mmol/L) or drug treatment for elevated triglycerides, reduced HDL-C (<
40 mg/dL or < 1.0 mmol/L in males, < 50 mg/dL or < 1.3 mmol/L in females), elevated
blood pressure (systolic ≥ 130 mmHg and/or diastolic ≥ 85 mmHg), and elevated fasting
glucose (≥ 100 mg/dL or ≥ 5.5 mmol/L).42 The diagnosis of the Metabolic Syndrome is
considered when at least 3 out of the 5 risk factors are present.32
Metabolic Syndrome has been consistently associated with T2D and CVD.73-75 A
cross-sectional study with a sample composed of patients with T2D (n=201) reported that
the prevalence of the Metabolic Syndrome among them was higher than 50%, and the
prevalence of Metabolic Syndrome components was 8%, 15.4%, 25.8%, 27.4%, 17.4%,
and 6%, for the presence of none, 1, 2, 3, 4, and 5 risk factors, respectively, fasting blood
glucose (FBG) being the component most frequently reported.31 The presence of the
Metabolic Syndrome components among individuals with T2D needs monitoring, as the
presence of such components are associated with an increase in the number of micro and
macrovascular complications, yielding to higher rates of morbidity and mortality.31

15
A cohort study composed by members of the Framingham Offspring Study
followed for 8 years men and women (aged 22-81 years) with a baseline between 1989-
1993, aimed to investigate the relation between the number of Metabolic Syndrome risk
factors and relative risk for incident CVD and T2D. The findings in men showed the age-
adjusted relative risk (RR) due to Metabolic Syndrome was increased for CVD
(RR=2.88; 95% CI 1.99-4.16), total CHD (RR=2.54; 95% CI 1.62-3.98), and myocardial
infarction /CHD death (RR=2.58; 95% CI 11.46-4.57).32 The age-adjusted population-
attributable risk (PAR) was 33% for CVD and close to 30% for CHD, which points to the
proportion of vascular events that could be attributed to the presence of Metabolic
Syndrome at the baseline evaluation. At follow up, the age-adjusted RR for T2D was
noticeably increased in men (RR=6.92; 95% CI 4.47-10.81), and the age-adjusted PAR
was 62%.32 At follow up in women, the age-adjusted RR for CVD (RR=2.25; 95% CI
1.31-3.88), total CHD (RR=1.54; 95% CI 0.68-3.53), and for myocardial infarction/CHD
death (RR=2.50; 95% CI) were moderately increased.32
The overall prevalence of Metabolic Syndrome in the U.S. population increased
from 25.3% (1988-1994) to 34.2% (2007-2012), and by 2012, more than a third of all
U.S. adults met the criteria for Metabolic Syndrome.34 Aguilar et al. (2015) evaluated the
Metabolic Syndrome trends among adults (aged ≥ 20 years) using 2003-2012 NHANES
data and reported a prevalence of 33% (95% CI, 32.5%-33.5%) with significantly higher
prevalence in women compared with men (35.6% vs. 30.3%, respectively, p<0.001).76
Mexican-Americans represent a minority group at high risk for T2D and CVD
with a high number of subjects with Metabolic Syndrome that later develop T2D.40
Stratified results by race/ethnicity in the period of 2003-2012 NHANES data showed the

16
highest prevalence of Metabolic Syndrome among Hispanics (35.4; 95% CI, 34.2-
36.6%), followed by non-Hispanic whites (33.4%; 95% CI, 32.6%-34.2%), and blacks
(32.7%; 95% CI, 31.5%-33.9%).76
Components of Metabolic Syndrome are associated with increased risk of CVD
and T2D regardless of sex.32 However Mexican-Americans show increased prevalence of
Metabolic Syndrome components when compared to non-Hispanic whites. According to
the National Health and Nutrition Examination Survey (NHANES) from 2007-2012,34
compared to non-Hispanic whites, Mexican-American men had higher prevalence of
fasting hyperglycemia (32.3% vs. 30.0%). Compared to non-Hispanic white women,
Mexican-American women had higher prevalence of elevated waist circumference
(66.8%, SE=1.58 vs. 58.8%, SE=1.29), reduced HDL-C (51.6%, SE=1.95 vs. 46.2%,
SE=1.38), and elevated fasting glucose (32.3%, SE=1.58 vs. 30.0%, SE=1.04).34
However, non-Hispanic white men and women had higher prevalence and were more
likely to have high blood pressure when compared to their Mexican-American
counterparts.34
In summary, Metabolic Syndrome components are associated with an increased
T2D and CVD risk. Although these components affect a high percentage of both women
and men regardless of race/ethnicity, Mexican American men and women are more likely
to have fasting hyperglycemia that their non-Hispanic white counterparts. However,
Mexican American women show a less favorable cardiometabolic profile because in
addition to fasting hyperglycemia risk, they are more likely to have elevated waist
circumference, elevated triglycerides, and reduced HDL-C than their non-Hispanic white
counterparts.

17
2.2 Prediabetes
Prediabetes is defined as an intermediate state of plasma glucose levels ranging
between normoglycemia and diabetes.77 Prediabetes or increased risk of diabetes mellitus
is the term used to refer to early stages of abnormal glucose homeostasis including
impaired fasting glucose (IFG), and/or impaired glucose tolerance (IGT), and/or high
HbA1c.2 Prediabetes or IFG is defined based on fasting plasma glucose (FPG)
concentration of 100-125 mg/dL, and/or impaired glucose tolerance (IGT) based on a 2-
hour postprandial glucose concentration of 140-199 mg/dL during an oral glucose
tolerance test (OGTT), and/or HbA1c of 5.7%-6.4% (39-47 mmol/mol).78 IGT reflects
inadequate postprandial insulin secretion and is considered the earliest irregularity in
glucose homeostasis related to the progression to T2D.79 The OGTT detects IGT and is
considered the “gold standard” test to detect diabetes mellitus. IFG denotes augmented
hepatic glucose production, which results in fasting hyperglycemia and can be assessed
by FPG.80 HbA1c represents the 2-3 month-mean plasma glucose concentrations and has
been shown to be elevated during states of intermediate hyperglycemia.79,80 Prediabetes is
associated with obesity, particularly abdominal or visceral obesity, and dyslipidemia,78
and although prediabetes denotes impairment in glucose metabolism, it should not be
handled as an isolated clinical condition, but rather as a risk factor for CVD and T2D.78
2.2.1 Glucose Regulation
The normal physiology of plasma glucose concentrations depends on the rate of
glucose entering to the circulation, which is termed “glucose appearance”, balanced by
the rate of glucose cleared or removed from the circulation, called “glucose

18
disappearance”.81 Glucose regulation requires the interplay of many hormones (gut and
pancreatic), which cause effect on multiple target tissues including muscle, brain, liver,
and adipocyte.82 Circulating glucose is provided from three sources: intestinal absorption
during the fed state, glycogenolysis, and gluconeogenesis. The rate of gastric emptying is
the main factor determining how fast glucose appears in the circulation during the fed
state.82 Other sources of glucose are derived from hepatic processes: glycogenolysis,
which is the breakdown of glycogen (storage form of glucose), and gluconeogenesis
(formation of glucose from lactate and amino acids during fasting state) facilitated by
glucagon.81 Hormones regulating glucose are: insulin and amylin, derived from beta-cells
of the pancreas; glucagon from the alpha-cells of the pancreas; glucagon-like peptide 1
(GLP-1) and glucose-dependent insulinotropic peptide (GIP) from the L-cells of the
intestine; and epinephrine, cortisol, and growth hormone.83 Glucoregulatory hormones
maintain circulating glucose concentrations in a narrow range. During the fasting state,
glucose is cleared from the circulation at a constant rate, and endogenous production of
glucose occurs to keep pace along with glucose disappearance. Although glucose-6-
phosphatase, the enzyme necessary to release glucose into the circulation, is present in
both the liver and the kidneys, the liver is the sole source of endogenous glucose
production because renal gluconeogenesis occurs only during periods of extreme
starvation.82
Glucagon is a major regulator of glucose appearance, and insulin is the key
regulatory hormone for glucose disappearance. Blood glucose slowly decreases during
the next hours after reaching a post-meal peak, and blood glucose returns to fasting
levels.81 During the immediate post-feeding state, insulin acts to remove glucose into

19
adipose tissue and skeletal muscle. Simultaneously, endogenous glucose production is
suppressed by (1) insulin action, delivered via the portal vein on the liver, and (2) the
paracrine effect (direct communication) in the pancreas between the alpha- and beta-cells,
resulting in glucagon suppression.81 Amylin complements the effects of insulin on
circulating glucose concentrations by suppressing postprandial glucagon secretion, which
decreases glucagon-stimulated hepatic glucose output after food ingestion. Additionally,
amylin slows the rate of gastric emptying and the rate at which nutrients are delivered
from the stomach to the small intestine for absorption.84 GIP stimulates insulin secretion
and regulates fat metabolism, but does not inhibit glucagon secretion or gastric emptying,
and its levels are either normal or slightly elevated in people with T2D. GLP-1 is more
physiologically relevant in humans; it stimulates glucose dependent insulin secretion but
is significantly reduced in the postprandial state in people with T2D or IFG.85
2.2.1.1 Pathophysiology of Prediabetes
There is heterogeneity in most glucose intolerance disorders, including diabetes
mellitus syndromes. In individuals with prediabetes (IFG and/or IGT), glucose
concentrations start to increase when glucose appearance exceeds glucose disappearance
and continues to increase until the two rates become equal again.86 During fasting state,
glucose appearance is the result of the rate of glucose released from the liver with perhaps
a minor contribution by the kidney. However, it has been observed that most individuals
with IFG also have IGT or frank diabetes, but some have normal glucose tolerance
(NGT), and some individuals with normal fasting glucose (NFG) have IGT.86
20
2.2.2 Burden of Prediabetes
Prediabetes estimates from 2009-2012 based on fasting glucose and HbA1c test
from the 2009-2012 NHANES survey indicated that 37% of U.S. adults aged 20-64 years
and 51% of adults aged 65 and older had prediabetes.3 Based on this data, it was
estimated that by 2012, 86 million Americans 20 years or older were affected by
prediabetes. The percentage of U.S. adults with prediabetes based on IFG or HbA1c and
after adjustment for age between 2009-2012 was similar for non-Hispanic white (35%),
Hispanics (38%), and non-Hispanic blacks (39%).3 Individuals with prediabetes have a
1.5-fold increased risk of CVD compared to people with normal glucose concentrations,
and individuals with T2D diagnosis have between 2- to 4-fold increased risk for CVD.40
Results from a population-based analysis with participants from the
Atherosclerosis Risk in Communities (ARIC) study and a subpopulation from NHANES
III aimed to assess the test performance of HbA1c against single and repeated glucose
measurements for diagnosis of prevalent diabetes and prediction of incident diabetes.
Fasting glucose and HbA1c both strongly predicted subsequent risk of diagnosed
diabetes.87 88
Cross-sectional studies including Hispanic/Latinos have observed a higher
prevalence of IFG among men, and a higher prevalence of IGT among women.89-91 A
cross-sectional study aimed to compare the ability of FPG, two hours post oral plasma
glucose (2hPG) (obtained during an OGTT), and HbA1c to detect U.S. Hispanic/Latino
individuals with prediabetes using baseline data from 15,507 adults free of diabetes
mellitus, enrolled in the Hispanic Community Health Study/Study of Latinos, and
including women and men with Central American, Cuban, Dominican, Mexican, Puerto

21
Rican and South American backgrounds.92 Results showed that 36.3% Hispanic/Latinos
from all the heritage groups met at least one criterion for prediabetes based on the
American Diabetes Association (ADA) diagnostic criteria. Using 2hPG-OGTT as the
gold standard, the combination of FPG + HbA1c was more sensitive 62% [95% CI, 59.2-
65.1], but less specific 70.1% [95% CI, 68.7-71.4] to detect prediabetes when compared
with sensitivity and specificity of isolated HbA1c 45.6% [95% CI, 42.5-48.7] and 80.7%
[95% CI, 79.5-81.8], or FPG 40.1% [95% CI, 37.3-43.0] and 82.8% [95% CI, 81.6-84],
respectively.92 Therefore, screening for prediabetes or IFG using more than one test (e.g.,
FPG + HbA1c vs. either test alone) would increase the chances of identifying individuals
at higher risk for prediabetes.92
In summary, prediabetes represents the prior stage to diabetes onset. Its early
detection is an opportunity to prevent its onset through lifestyle changes to improve
glucose homeostasis in both fasting and postprandial state. Prediabetes affects a high
percentage of Hispanics, thus, is necessary to continue screening in primary level.
2.3 Diabetes
Diabetes is a group of metabolic diseases depicted by hyperglycemia as a result of
defects in insulin secretion and action, or both.78 Symptoms of hyperglycemia can include
polyuria, weight loss, sometimes presence of polyphagia, polydipsia, and impaired vision.
Hyperglycemia can also affect growth, and susceptibility to certain infections. Lack of
adequate control of diabetes can lead to acute, life threatening consequences like
hyperglycemia accompanied by ketoacidosis and non-ketonic hyperosmolar syndrome.2

22
Complications of diabetes at long-term include retinopathy and potential loss of
vision, nephropathy leading to renal failure, peripheral neuropathy and risk of foot ulcers,
amputations, and autonomic neuropathy which can cause sexual dysfunction, and
gastrointestinal, genitourinary, and cardiovascular symptoms.2
Different types of diabetes include: type 1 diabetes, T2D, gestational diabetes, and
specific types of diabetes due to other causes. For instance, monogenic diabetes
syndromes (e.g., neonatal diabetes and maturity-onset diabetes of the young [MODY]),
diseases of the exocrine pancreas (e.g., cystic fibrosis), and drug-induced diabetes (e.g.,
treatment for HIV/AIDS or after organ transplantation).1 Type 1 diabetes, previously
called insulin-dependent diabetes or juvenile-onset diabetes, accounts for 5-10% of
subjects affected by diabetes. Type 1 diabetes is the result of a cellular mediated
autoimmune destruction of beta-cells of the pancreas; however, some forms of type 1
diabetes have unknown etiologies. T2D accounts for 90-95% of the cases of diabetes, and
was previously referred as non-insulin dependent diabetes, or adult-onset diabetes.1
Individuals with T2D have insulin resistance and usually have do not have absolute
insulin deficiency. Therefore, they usually do not require insulin treatment to survive.1
T2D and obesity rates have risen to epidemic levels in the last decades. In the U.S.,
29.1 million people or 9.3% of the population have diabetes. However, 27.8% of people
with diabetes remain undiagnosed. It has been established that weight gain and
overweight can predict the onset of T2D. The number of people affected by diabetes is
expected to reach 552 million worldwide, with associated increases in complications and
health costs.93

23
2.3.1 Pathophysiology of Diabetes
The pathophysiology of diabetes involves several processes ranging from
autoimmune destruction of beta-cells followed by insulin deficiency to abnormalities that
result in resistance to insulin action.81 During early stages of T2D, beta-cell action
becomes abnormal, which is reflected by the loss of immediate insulin response after
meal ingestion. Subsequently, there is peripheral insulin resistance that develops along
with progressive beta-cell failure and decreased availability of insulin, amylin, and GLP-
1, all of which contribute to hyperglycemia.94 In people with diabetes, the delayed or
absent secretion of insulin exacerbates postprandial hyperglycemia,94 and an accelerated
gastric emptying generates a poorly timed meal-derived glucose to the circulation.
Insulin resistance involving both muscle and the liver are characteristic aspects of
glucose intolerance in patients with T2D. During the basal state, the liver is a major site
of insulin resistance. This is reflected by an excessive production of glucose even when
there is presence of both fasting hyperglycemia and fasting hyperinsulinemia.95 In this
scenario, the accelerated rate of hepatic glucose turning is the primary causal factor of the
elevated FPG concentration in individuals with T2D. In absolute terms, muscle glucose
uptake is increased in the postabsorptive state, but the efficiency of glucose clearance is
decreased. After glucose intake or infusion (e.g., in the insulin stimulated state), both
reduced muscle glucose uptake and impaired suppression of hepatic glucose production
contribute to the insulin resistance. After glucose infusion or intake, the defects in
insulin-mediated glucose uptake by muscle and the suppression of hepatic glucose
production contribute to the same extent to the malfunction of glucose homeostasis in
T2D individuals. Yet, under frank hyperinsulinemic conditions with normal glycemia,

24
hepatic glucose production is mostly suppressed, and impaired muscle glucose uptake is
mainly responsible for the insulin resistance.94,95
In the presence of obesity, and in more than 80% of individuals with T2D, there is an
expanded fat cell mass where the adipocytes are resistant to the antilipolytic impact of
insulin.96 The majority of obese individuals with T2D have visceral adipocity97 and
visceral fat cells have a high lipolytic rate, which is refractory to insulin action.95
Furthermore, in both diabetes and obesity, there is an elevation in the mean daylong
plasma free fatty acid concentration, which along with increased triglyceride/fatty acid
acyl CoA concentration in muscle, liver, and beta cell, result in the onset of
muscle/hepatic insulin resistance and impaired insulin secretion.98 In addition, multiple
known causes lead to hyperglycemia in patients with T2D including decreased insulin
secretion, decreased incretin effect, increased lipolysis, increased glucose reabsorption,
decreased glucose uptake, neurotransmitter dysfunction, increased hepatic glucose
production, and increased glucagon secretion.95
2.4 Lifestyle Management of Diabetes
Lifestyle changes and medical nutrition therapy are considered keystones for
preventing and treating T2D. However, there is no consensus of what dietary approach is
most adequate to control hyperglycemia and to achieve and maintain weight loss.99
2.4.1 Weight Control
Along with nutrition, individuals with diabetes should achieve and maintain
healthy weight. Evidence from two large randomized double-blinded, prospective clinical

25
trials have provided insights on the degree of weight loss that should be achieved and if
the risk reduction could be sustained over time.78 The Diabetes Prevention Program
(DPP) and the Diabetes Prevention Study (DPS)100 have provided supporting evidence on
the importance of implementing healthy behavior changes to promote weight loss and
reduce diabetes risk in people with IGT. Both, the DPP and DPS reported a 58% relative
risk reduction with the lifestyle intervention over a period of 3 years in the progression
from IGT to T2D.101,102
In the DPP, subjects in the lifestyle intervention group a mean of 7 kg after 1 year,
and approximately 35% of them achieved the target ≥ 7% body weight loss during the
following 3 years. The average weight loss was over 3 years was 5.6 kg which
represented a 6% decrease from the baseline weight of 94.1 kg compared with 0.1 kg in
the control group.101 Weight loss in the DPP observational phase was the dominant
predictor of reduced diabetes incidence (hazard ratio per 5 kg weight loss 0.42 [95% CI
0.35-0.51]; p<0.0001). Additionally, after adjustments for changes in diet and physical
activity, 1 kg (1%) of body weight loss was associated with a 16% relative risk reduction
in diabetes risk, which is very important clinically.103 Similar results were observed in the
DPS at 1-year follow up, where individuals enrolled in the intensive lifestyle intervention
lost 4.5 kg (5.1%) body weight compared to 1.0 (1.1%) in the control arm. Compared to
the control group, the intervention arm showed improvements in glycemic control
(HbA1c decrease of 0.1% vs. +1.0%), and lipid (triglycerides -0.2 mmol/L vs. 0.0
mmol/L; HDL-C 0.05 mmol/L vs. 0.02 mmol/L). Additionally, weight loss after 3 years
was 3.5% (4%) and 0.9% (1%) in the intensive and control groups, respectively.6,100

26
In summary, both DPP and DPS have demonstrated benefits in sustained lifestyle
changes and reduction in the progression to diabetes after the 3-year intensive lifestyle
intervention finished.
2.4.2 Diabetes Nutrition Therapy
Nutrition therapy for diabetes has been prescribed since antiquity. The most
ancient evidence of dietary treatment for diabetes was registered in the Ebers Papyrus
(1550 BC), where a diet high in carbohydrates including wheat, grains, grapes, and honey
was prescribed.104 The diet for diabetes went from “sun-dried membranes from young
roosters or drinks made of a combination of dry corn, wild pomegranate’s flower, copper,
oak-gall, honey of roses and cold water” recommended by Galen (AD 128-200), to a diet
rich in lupin (a type of legume), fenugreek (green leaves), and zedoary (white turmeric
root) which was thought to reduce the excretion of sugar in the urine, recommended by
the Persian physician Avicenna (AD 980-1037).93 More types of diets were
recommended between this period of time and until 1799 when John Rollo recommended
to his patients a 1500-calorie diet high in fat and protein consisting of blood pudding and
rancid meat along with medication to reduce appetite. John Rollo was the first to
associate calorie reduction and diabetes symptoms.105 The low-calorie diet known as the
‘starvation diet’ was continually used before and after the discovery of insulin. With the
use of insulin, prescribed diets became richer in carbohydrates, and at sometimes doctors
recommended “free diets” with no carbohydrate restriction.106 In 1935, Harold
Himsworth identified two types of diabetes, the “insulin-sensitive” patients who lacked
the capacity to produce insulin and where liable to develop ketoacidosis, and “insulin-

27
insensitive” patients who were not able to respond fully to their own insulin. This allowed
the use of new treatments for diabetes.107 The ADA advised in the 1940s, restricting
carbohydrate amount in the diet to 40% of the total calorie intake to improve glycemic
control. After a few decades, in the 1970s, the ADA allowed the use of tailored diets,
revising these recommendations in the 1980s to include small amounts of sucrose and
other simple sugars in the diet. The ADA started in 2002 and continued to issue evidence-
based recommendations every year. Although similar guidelines have been created from
other diabetes organizations such as the European Association for the Study of Diabetes
(EASD) and the Diabetes UK, all dietary guidelines coincide on recommending weight-
loss and increased physical activity, as large-scale studies such as the DPP have shown
that a healthy lifestyle improve insulin resistance and glycemic control.108
Nutrition therapy plays an integral role in diabetes management on three levels: in
primary prevention, through interventions aimed at delaying or containing the diabetes
onset; in secondary level, medical nutrition therapy (MNT) is used to try and prevent
complications; and in tertiary level, to control complications derived from diabetes.93
However, many individuals with diabetes struggle to determine what to eat and to adhere
to a prescribed diet.109 The ADA, in their published guidelines, “Standards of Medical
Care 2018” emphasized that nutritional assessment; weight history and analysis of dietary
pattern analysis should be made in individuals with newly diagnosed diabetes.110
There is no universal eating pattern for individuals with diabetes. Each person
with diabetes should receive education, self-management tools, and a specific treatment
including an individualized eating-plan provided by the healthcare team.109,111 A trained
registered dietitian, who is knowledgeable and skilled to provide specific nutrition for

28
nutrition-related diseases should facilitate MNT for individuals with diabetes. MNT
provided by a dietitian has been associated with decreases of HbA1c of 0.3-1% in people
with type 1 diabetes,112 and decreases of 0.5-2% in people with T2D.113 The healthcare
team should have knowledge about nutrition principles for people affected by diabetes
and be supportive in the implementation of the diet.78
2.4.2.1 Nutrition Recommendations
The ADA recommends focusing on healthy eating patterns with the inclusion of
nutrient-rich foods rather than individual nutrients and consuming adequate portion sizes
with the aims of improving overall health.78
2.4.2.1.1 Energy Balance
Modest weight loss may provide clinical improvement (improved glycemia, blood
pressure, and/or lipids) in some individuals, particularly in those in the early stages of
diabetes.114 A study tested a caloric-restricted diet in men and women with T2D to
determine how the diet affected beta-cell function and glucose metabolism. The diet
consisted of a pureed diet (<900 kcal/day) for 12 weeks, and assessments were made at
baseline, and after 6 and 12-weeks of the diet. Results showed that fasting glucose
decreased significantly after the first 6 week of caloric restriction with no further decrease
during the additional 6 weeks (week 6-12) (9.8 ± 1.3, 5.9 ± 0.2, and 6.2 ± 0.3 mmol/L at
baseline and after 6 and 12 week of caloric restriction, respectively; p = 0.01) due to
decrease in endogenous glucose production. In addition, changes included an
improvement in beta-cell function assessed by the disposition index (189 ± 51, 436 ± 68,

29
and 449 ± 67 10-14 dL · kg-1 · min-2 · pmol-1 at baseline and after 6 and 12 weeks of
caloric restriction, respectively; p = 0.01).115 Other studies showed similar results. For
instance, results of a study showed that caloric restriction alone had a significant effect on
glucose metabolism,116 similar to the effect after a Roux-en-Y gastric bypass. Other two
studies reported comparable117 or equivalent118 effects on glucose metabolism after
caloric restriction compared with bariatric surgery. Taken together, this evidence supports
that caloric restriction should be considered in the management of T2D. Thus, energy
intake should be reduced to promote weight loss while maintaining a healthy dietary
pattern in overweight or obese adults with T2D.109
2.4.2.1.2 Macronutrient Distribution
The optimal macronutrient intake to support reduction of excess body weight and
glycemic control has not been established yet. Some studies suggest that macronutrient
distribution may be important for energy restriction and energy balance, with the aim of
improving glucose control119 and lipid profile.120
Carbohydrate intake is a major contributor to glycemic control because its
immediate effect on postprandial glucose concentrations.121 In addition, high- protein
diets with reduction of carbohydrates content lowers postprandial blood glucose and
improves overall glucose control in people with T2D.122 However, more studies are
necessary to establish the total magnitude of response to a high-protein/controlled in
carbohydrate diet, potential adverse effects (e.g., renal function), and long-term
acceptability and adherence of the diet.

30
There is not an ideal of percentage of calories from the macronutrients -
carbohydrate, protein, and lipids, for all people with diabetes. It has been observed that
on average, people with diabetes eat near 45% of their total calorie intake from
carbohydrate, approximately 36-40% from fat, and the remaining ~16-18% from
protein.123,124 However, macronutrient distribution for T2D patients should be based on
individualized assessment of their eating patterns, preferences, and metabolic target.
2.4.2.1.3 Carbohydrates
The evidence for an ideal amount of carbohydrate intake in people with diabetes is
inconclusive. Large-scale observational studies have reported conflicting results with
positive and negative associations of total carbohydrate consumption with diabetes
risk.125-128 Four important factors of carbohydrates reported to be relevant to diabetes
include simple sugars in beverages, fiber, whole grains, and glycemic index. However,
due to the inconsistent findings regarding the effects of low glycemic index diets on
glycemic control and T2D,99,129 this topic is not discussed here.
The quality and quantity of carbohydrates found in foods influence postprandial
glucose levels. Quality of carbohydrates intake may be of more importance in
determining the capacity to increase glucose levels, which would be determined largely
on its influence on gastrointestinal transit and the velocity of nutrient absorption, and the
risk of diabetes in the long-term.130 Simple carbohydrates or “simple sugars” occur in
natural foods (e.g., fruits, vegetables, and milk), and processed foods (e.g., bread, table
sugar, candy, syrups, and sweetened drinks),131 while complex carbohydrates, often
called “starchy carbohydrates”, are found mainly in unprocessed or unrefined foods (e.g.,

31
whole grains, vegetables). Simple sugars are the fastest source of energy due to their
simple chemical structure contains either one or two monosaccharide molecules.131
Commercial drinks containing simple sugars, such as artificially sweetened beverages
and natural commercial fruit juices (usually sugar-enriched), are consumed in significant
amounts worldwide.132 Multiple observational studies have reported that their
consumption is associated with an increased risk of diabetes.58,133-136 The mechanisms by
which sugar-containing drinks promote insulin resistance includes weight gain due to
high energy content, lack of satiating response because these drinks usually do not
contain fiber, higher postprandial blood glucose, and insulin response impairment.137
A randomized controlled trial assessed long-term effects of changes in dietary
carbohydrate/fat ratio and simple vs. complex carbohydrates on body weight and blood
lipids among moderately obese adults (n=398) for 6 moths.138 The seasonal control group
received no intervention, and the three experimental groups received either a control diet
group (dietary intervention typical of average national intake); or an ad libitum low-fat
high simple carbohydrate group; or a low-fat high complex carbohydrate group.138
Compared to baseline, results of body weight loss in the low-fat high complex
carbohydrates and the low-fat high simple carbohydrates groups was 1.8 kg (p <0.001),
and 0.9 kg (p <0.05).138 The seasonal control and control diet groups showed gain weight
(0.1, and 0.08 kg, NS). However, changes in blood lipids did not differ across the diet
groups. These results suggest that decrease of fat intake can lead to a modest reduction in
body weight and body fat, but that moderate increases in simple and complex
carbohydrates did not indicate significant changes in body weight changes.138

32
Regarding quantity of carbohydrates, some published studies have reported that
relative to higher carbohydrate intake levels, diets with lower intake of carbohydrate (21
g/day and up to 40% of total calorie intake) improved markers of glycemic control and
insulin sensitivity.52,139 A randomized controlled trial study compared the effects of 52-
week very low-carbohydrate (14% of total energy from carbohydrate or <50 g/day), high-
unsaturated fat, low-saturated fat diet (LC) vs. a high-carbohydrate, low-fat diet (HC) on
glycemic control and CVD risk factors among obese adults with T2D.140 Outcomes of
interest were HbA1c, fasting blood glucose, glycemic variability assessed with 48-hours
continuous glucose monitoring, diabetes medication, weight, blood pressure, and lipid
profiles (baseline, 24 and 52 week). Both groups showed similar results in reductions of
weight, blood pressure, HbA1c, fasting glucose, and LDL-C (p-diet effect ≥ 0.10).140
However, compared with the HC diet, the LC group reached greater mean reductions in
the diabetes medication score, glycemic variability determined by measuring the
continuous overall net glycemic action, triglycerides, and greater mean increases in HDL-
C (p=0.002). Although both diets showed reductions in fasting blood glucose, HbA1c,
and weight reduction, the LC diet yielded a larger improvement in glucose stability, lipid
profile, the need of medication; which suggests that a LC diet may be more effective for
T2D control.140 However, multiple meta-analyses of randomized control trials evaluating
the effects of LC in T2D indicate that LC diets improve glycemic control in people with
T2D,99,141 while others meta-analysis have not found difference between HC and LC
diets.142-144
While evidence supporting either HC or LC diets for glycemic control is
emerging, the amount of carbohydrate ingested and insulin available are potentially the

33
most important factors affecting glycemic response in the postprandial state. Thus, this
should be considered when developing a dietary strategy. For instance, an alternative
strategy to carbohydrate counting is using the modified plate method, which incorporates
measuring cups to measure portions.145
2.4.2.1.3.1 Dietary Fiber and Whole Grains
Dietary fiber is the indigestible component of complex carbohydrates. Dietary
fiber intake is associated with reduced all-cause mortality among people with diabetes.146
Multiple observational studies suggest that diets rich in fiber and fiber-rich wholegrain
foods, which are defined as foods containing the whole grain seed (kernel), bran, germ,
and endosperm,62 are independently associated with risk reduction for obesity and
diabetes.8,126,147 Possible confounding is possible because high intake of whole grains and
fiber are potential markers of healthier behaviors.148 Regardless, soluble viscous fiber
plays an important role in postprandial glycemia, insulin response and satiety, due to its
effect of slowing gastric emptying and total intestinal nutrient absorption.149
A systematic review did not find enough evidence to support the effect of fiber
on significantly improved glycemic control among subjects with diabetes.150 However,
evidence from interventions have shown modest lowering of pre-prandial glucose and
HbA1c (-0.2% to -0.3%) when subjects have an intake of 50 g/day of fiber.151
Furthermore, multiple prospective studies have reported that insoluble fiber, but not
soluble fiber, associates inversely to incidence of diabetes.8,56,152 Possible reason for this
is that insoluble fiber is closely associated with wholegrain foods (e.g., cereals, legumes,
nuts), in which their germ and skin also contain multiple bioactive phytochemicals with

34
potential benefits.153 Results of randomized clinical trials comparing the effects of
wholegrain and refined grain cereals on glycemic responses in healthy individuals,
insulin sensitivity in obese individuals, or glucose control in people with diabetes support
the beneficial effect of wholegrain foods in insulin resistance conditions.154,155 Although
the mechanisms are unclear, it has been suggested that gastric inhibitory polypeptide,
anti-inflammatory effects, and also changes in the gut microbiota are potential factors that
increase insulin sensitivity.156-159
Fiber provides multiple health benefits (e.g., intestinal health, satiety). In primary
prevention of diabetes, individuals at high risk for T2D are encouraged to achieve the
USDA recommendation for the general public to ingest 14 g/fiber per 1000 kcal (or 25
g/day for women and 38 g/day for men) and foods containing whole grains, which should
be one-half of total grain intakes.109,160 In secondary prevention, individuals with diabetes
are encouraged to follow the same fiber intake recommendations because evidence to
recommend a higher fiber intake is still lacking.160
2.4.2.1.4 Protein
Evidence is inconclusive to recommend a percentage or ideal amount of protein
for improving glycemic control. Some intervention studies have evaluated the effect of
higher protein intake (28-40% of total calories) compared to regular intake (15-19%) on
diabetes outcomes. One study showed a significant decrease in HbA1c with the higher-
protein diet,122 while other studies showed no effect.120,161 On the other hand, kidney
function in people at later stages of diabetes must be considered as well, where a low-
protein diet with less protein from animal sources may be encouraged. In individuals with

35
T2D, protein does not show a significant effect on blood glucose level, but appears to
increase insulin response. In this scenario, intake of protein should not be advised to treat
or prevent hypoglycemia.109
2.4.2.1.5 Total Fat
Goals for fat intake should be individualized among patients with diabetes due to
inconclusive evidence of the effects dietary fat intake. Dietary fat has been proposed to be
more important than quantity. Limited research exists in individuals with diabetes. The
Institute of Medicine (IOM) established an acceptable macronutrient distribution (AMD)
range for total fat of 20-35% of total calories, which was estimated on the basis of
evidence of risk for CHD or obesity and complications at low and high intakes of fat.
However, these recommendations are not specific for diabetes.162
Regarding quality of fat, monounsaturated fatty acid (MUFA) may benefit
glycemic control and CVD risk factors.163 Evidence from preclinical studies indicate that
increased intake of MUFA, such as oleate, would provide physiological benefits. For
instance, while chronic exposure of pancreatic islets to increased levels of fatty acids
induce less insulin secretion,164 SFA such as palmitate appear to cause higher rates of
beta-cell death, while oleate provides neutral or protective effect.165 Additionally, even
chronic elevated circulating fatty acids leads to insulin resistance, this effect seems to be
more greater with SFA than with MUFA.166 Thus, while evidence from in vitro and
animal studies on the effects of parameters of glucose metabolism supports the
substitution of SFA for MUFA among subjects with diabetes,167 findings of experimental
studies in humans are still inconclusive.

36
A study compared the effects one year a high MUFA or high-carbohydrate diet on
body weight and glycemic control outcomes among men and women with T2D.163
Results showed that changes were similar for weight loss over 1 year, with comparable
improvement of body fat, diastolic blood pressure, waist circumference, HDL-C, HbA1c,
fasting glucose and insulin in both groups.163 This indicates that high-MUFA diets are
potential alternatives to low-fat or high-carbohydrate diets to achieve beneficial effects on
diabetes management. Also, evidence regarding relationship between the amount of
dietary saturated fat and glycemic control and CVD risk among people with diabetes is
limited. A study with a short duration of 3 weeks compared glycemic control outcomes
among individuals with T2D. A comparison of a low-SFA (8% total calories) vs. a high-
SFA diet (17% total calories) showed no significant differences in glycemic control and
the majority of CVD measures.168 Additionally, there is limited evidence about the
optimal amount of dietary cholesterol and trans fat in people with diabetes. Only one
large prospective cohort study in women with T2D found a 37% increase in CVD for
every 200 mg of cholesterol/1000 kcal consumed.169
Due to the lack of robust evidence in this area, people with diabetes should
adhere to the guidelines for the general population. The Dietary Guidelines for Americans
201562 recommends to consume less than 10% of calories from SFA to reduce CVD risk.
Foods high in SFA include full-fat dairy products, butter, bacon and marbled meats, and
tropical oils such as coconut and palm, and should be replaced with foods rich in MUFA
and PUFA such as vegetable oils including canola, corn, safflower, soy, and sunflower;
vegetable oils spreads, whole nuts, nut butters, and avocado.62

37
2.4.2.1.6 Alcohol
It has been reported that moderate alcohol intake may help reduce cardiovascular
risk and mortality, regardless the type of alcohol consumed.170 However, excessive intake
of alcohol (≥ 3 drinks/day) consumed on a regular basis may increase hyperglycemia.170
One alcoholic drink is defined as 5 oz. of wine, 12 oz. of beer, 1.5 oz. of distilled spirits,
where each contains 15 g of alcohol.62 In summary, people with diabetes choosing to
drink alcohol should adhere to the recommendations for the adult general population of
one drink/day or less for women and 2 drinks/day or less for men or less, and consuming
alcoholic drinks accompanied by food to reduce the risk of hypoglycemia in those people
taking insulin.62
2.4.2.1.7 Sodium
A review of intervention studies reported that decreasing sodium intakes reduces
blood pressure in people with diabetes.171 Other study showed that people following a
DASH diet with a sodium intake of 2300 mg improved blood pressure and cardiovascular
risk measures.172 However, other studies in people with type 1 diabetes and T2D
measuring urine sodium excretion showed an increased mortality associated with the
lowest sodium intakes, hence showing evidence to be cautious about recommending a
universal restriction of 1500 mg of sodium in this population.173,174 In the lack of robust
evidence for people with diabetes, recommendation in people with diabetes is to reduce
sodium intake to less than 2300 mg/day, and in people with diabetes and hypertension,
additional reduction of sodium should be individualized.62

38
2.5 Dietary Patterns and Health Outcomes
Dietary pattern, often referred as “eating pattern”, is defined as the combination of
foods and beverages that constitute an individual’s complete dietary intake over time, and
may describe a way of eating including proportions, variety of combinations of different
foods and beverages, and also the frequency with which they are habitually consumed.62
Nutrients are not consumed individually, and it is considered that the interaction of such
nutrients in the context of a healthy dietary pattern. Healthy dietary patterns are
considered those characterized by higher consumption of vegetables, fruits, whole grains,
low-fat dairy, and seafood, and lower consumption of red and processed meat, and lower
intakes of refined grains, and sugar-sweetened foods and beverages relative to less
healthy patterns,62 and are frequently associated with decreased risk of CVD, cancer, and
all-cause mortality.55,175 Furthermore, results from multiple studies indicates that
healthy176,177 dietary patterns including the vegan/vegetarian,178 and Mediterarrean Diet
(MedD),179 were associated with reduced inflammation evaluated through biomarkers
such as interleucine-6 (IL-6), C reactive protein (CRP), fibrinogen, and vascular cell
adhesion protein-1 (VCAM-1).177 In this scenario, it is of interest to investigate not only
specific nutrients but also the effectiveness of dietary patterns on health outcomes.
2.5.1 Dietary Approaches to Stop Hypertension
The DASH eating pattern is a diet that emphasizes vegetables, fruits, low-fat dairy
products, whole grains, poultry, fish, that includes only small amounts of red meat,
sweets, and sugar-sweetened drinks, and that contains low amounts of SFA and
cholesterol.180 The DASH pattern was originally created to prevent hypertension.

39
However, now it is recommended as an ideal and healthy dietary pattern for all adults.181
A systematic review and meta-analysis181 on randomized controlled trials examining the
effect of the DASH diet on glycemic control through FBG, serum fasting insulin, and
Homeostatic Model Assessment for Insulin Resistance (HOMA-IR) showed a
significantly decrease in fasting insulin (mean difference -0.15; 95% CI, -0.22 to -0.08;
p<0.001). After subgroup analysis based on the study period indicated that the DASH
diet could significantly reduce fasting insulin levels if prescribed for more than 16 weeks
(mean difference -0.16; 95% CI, -0.23 to -0.08; p<0.001). However, the results of the
meta-analysis did not show a beneficial effect of the DASH diet on FBG (mean
difference -0.26; 95% CI, -0.56 to 0.05, p=0.1), and HOMA-IR (mean difference -0.26;
95% CI, -0.56 to 0.05, p=0.1).181 Therefore, the DASH dietary pattern may lead to an
improvement in insulin sensitivity, and play an important role in longer-term
interventions.
2.5.2 Vegetarian Diets
Vegetarian diets can include vegan diets, which exclude all flesh foods and
animal-derived products; and vegetarian diets, which exclude all flesh foods but may
include egg (ovo), and/or dairy (lacto) products. The vegetarian eating pattern is
characterized by low intake of saturated fat and cholesterol, and high intake of fruits,
vegetables, whole grains, nuts, soy products, fiber, and phytochemicals or biologically
active compounds in plants (e.g., carotenoids).109 A systematic review and meta-analysis
assessing the effects of vegetarian diets on glycemic control in T2D evaluated six
controlled-studies. Results showed that when compared with the comparator diets in each

40
study (either a conventional diabetic, or ADA, or conventional low-fat diet), intake of
vegetarian diets was associated with a significant reduction in HbA1c [-0.39 %; 95% CI:
-0-62 to -0.15, p=0.001], but non significant reduction in fasting blood glucose
concentration (-0.36 mmol/L; 95% CI: -1.04 to 0.32, p=0.301).182 Other studies have
shown inconsistent results in the improvement of glycemic control or CVD factors except
when the intervention also included energy restriction and the presence of weight
loss.178,183
2.5.3 Mediterranean Diets
The MedD represents a pattern with traditional recipes representing heritage and
tradition of the Mediterranean region. Some basic elements of the MedD are extra virgin
olive oil, garlic, onion, fish, green vegetables, nuts and fruits,184 and the adherence to the
MedD can be assessed with the different existing published scores.185 The evidence from
epidemiologic studies and clinical trials about the effectiveness of the MedD decreasing
risk of chronic diseases and mortality is abundant.186,187 Adherence to the MedD is
associated with reduced risk of both total and cardiovascular mortality in diabetic
subjects, independently of the severity of the disease.186
Benefits associated to the MedD include weight loss and lipid profile
improvement,188-190 prevention and control of T2D,184,191-193 decreased incidence of
Metabolic Syndrome,194 prevention of inflammation and oxidative stress, reduced
hypertension,195,196 improved kidney function,197 and protection of cognitive function.198
The benefits also include reducing risk of developing other non-communicable diseases
such as Parkinson’s and Alzheimer’s diseases, and breast cancer,199 reduced preterm

41
delivery in overweight and obese pregnant women,200 and an inverse association between
MedD and risk of developing binge eating disorders.201
Unhealthful dietary patterns have been identified in different studies. Three
unhealthful eating patterns were reported in a study: (1) meat and soda, which was high
in fatty meats, low-fat meat, mixed proteins, high-fat poultry, and eggs; (2) sweets, which
was high refined grains, high-fat sweets, low-fat desserts, high-fat desserts, high-fat dry
cheese, and low-fat dairy product; and (3) alcohol and snacks, characterized by high beer,
wine, liquor, shellfish, and salty and fatty snacks eating patterns.202 A systematic review
and meta-analysis203 on the association of healthful and unhealthful eating patterns with
breast cancer risk and pooled studies identified the following eating patterns: (1)
prudent/healthy, which tended to have high loadings of foods such as fruit, vegetables,
poultry, fish, low-fat dairy, and whole grains; (2) western/unhealthy eating pattern, with
high loadings of foods such as red and/or processed meats, refined grains, potatoes,
sweets, and high-fat dairy; and (3) drinker dietary pattern, characterized by high loadings
of wines, beers, and spirits.203
2.5.4 Mexican Diets
Mexican immigrants are the largest growing minority group in the U.S., and
compared to non-Hispanic white women, Mexican descendants are placed at higher risk
of overweight and obesity,204,205 and associated risk for chronic diseases including T2D.25
The traditional Mexican diet is characterized by high intakes of vegetables, fruits, and
legumes.69 A crossover feeding trial evaluated the metabolic responses to a eucaloric
traditional Mexican vs. a typical U.S. diet among first- and second-generation healthy
42
women of Mexican descent for 24 days.206 The traditional Mexican diet included corn
tortillas, beans, traditional soups “pozole”, tamales, citrus fruits, vegetables with the
inclusion of “nopales”, and jicama), animal fats, whole milk, and “aguas frescas” (mix of
water, fruits, flowers, and sugar), while the U.S. diet included refined carbohydrates, fat-
free or low-fat milk, processed foods, processed meat, vegetable oils, and sugar-
sweetened beverages. When compared to the typical U.S. diet, the traditional Mexican
diet significantly reduced insulin by 14%, HOMA-IR by 15%, and insulin growth factor-
1 by 4%. There was no significant intervention effect on serum concentrations of glucose
and inflammation biomarkers (adiponectin, CRP or IL-6) between the diets. However,
results showed that when compared to a U.S. diet, a traditional Mexican diet improves
insulin sensitivity among healthy Mexican descent women with no changes in weight.
These findings support the reported benefits of following a traditional Mexican diet high
in fruits, vegetables, beans, soups, corn tortillas, whole milk, and Mexican cheeses to
reduce insulin resistance.206
Dietary patterns among Mexicans living in the U.S. have not been thoroughly
studied. The literature reports that acculturation –the process by which immigrants adopt
the host-country lifestyle, is suggested as a main modifying factor on the associations
between diet and metabolic disease risk.207 Among individuals of Mexican descent,
higher acculturation has been associated with lower consumption of their traditional
healthy Mexican foods, which include plentiful fruit, vegetables, legumes, and whole
grains.69,208
It has been reported that Hispanic women who are more acculturated have diets
lower in vegetables, fruits, grains, and beans, and some important nutrients such as

43
protein, calcium, folate, vitamins A and C, compared to less acculturated women.209 Also,
it has been reported that more acculturated Hispanic women consume more fat compared
to women with less acculturation.209 A study evaluating associations of dietary patterns
and macronutrient composition in overweight and obese Hispanic and non-Hispanic
white women showed that Hispanic women consume more energy, a greater proportion
of energy from fat and vegetable protein, less alcohol and less energy from animal protein
compared to non-Hispanic white women.210 Other study evaluating associations of diet
quality indices including the Alternate Mediterranean index, Healthy Eating Index (HEI)-
2010, and DASH score among the Women’s Health Initiative cohort reported that
Hispanic women have better diet quality than their blacks and whites counterparts.211
However, another study reported that dietary quality average (mean±SD) among women
assessed with the Alternate Healthy Eating Index (AHEI) was the highest among Asians
(40.6±11.6), followed by whites (38.6±11.0), blacks (34.7±11.1), and Hispanics
(34.5±10.2) with the lowest diet quality.212
2.5.5 Dietary Pattern Analysis Methods
Different statistical methods have been used to derive dietary patterns; this can be a
priori or a posteriori approach. Index analysis is an “investigator-driven” a priori
approach that creates patterns based on a priori decisions, while cluster analysis and
factor analysis are categorized as “data-driven” approaches that derive a posteriori
patterns.213 The cluster analysis method involves clustering individuals into relatively
homogeneous subgroups (clusters) based on similarities in diet composition,59 while
factor analysis identifies common underlying patterns of food consumption by

44
aggregating food groups on the basis of the degree of correlation with one another.214 As
has been noted previously,213 reported variation in findings when compared the different
methods to derive dietary patterns and their association with colorectal cancer risk. The
authors reported each method answer a different question. Cluster analysis and factor
analysis question what accounts for the variation in intakes and how well those variances
relate to risk, while index analysis questions if variation from a predefined diet relates to
risk.213
Exploratory factor analysis and confirmatory factor analysis are two types of factor
analysis techniques. Exploratory factor analysis is used to identify complex relationships
among items and group items that are part of integrated concepts and there are no a priori
assumptions regarding the relationships among factors.215 Exploratory factor analysis is a
variable reduction technique that captures the primary sources of variation in a set of
variables. When assessing dietary patterns, these variables (foods consumed) and the
identification of major sources of dietary variation, make possible describing the main
dietary patterns in a given study population.72 On the other hand, confirmatory factor
analysis is a more complex approach testing the hypothesis that the items are associated
with particular factors.216
Principal component analysis is another statistical technique that is often used as a
synonym of exploratory factor analysis because the steps to run them are the same
(extraction, interpretation, rotation, and selection of number of factors or components).
Both are powerful statistical techniques, and due to both are variable reduction
techniques, sometimes mistaken as the same statistical method.215 Despite all their
similarities, there are important differences between both methods. The main differences

45
are that in principal component analysis, the principal components retained account for a
maximal amount of variance of the observed variables, minimizes the sum of the squared
perpendicular distance to the component axis, and components are no interpretable due to
the lack of underlying constructs.217 In exploratory factor analysis, derived factors
account for common variance in the data, the amount of variance explained is equal to the
trace of the matrix, and observed variables represent a linear combination of the
underlying factors. Furthermore, exploratory factor analysis takes into account the
random error inherent to measurements (unique factors), whereas principal component
analysis fails to do so.217
2.5.5.1 A posteriori Dietary Pattern Studies
Multiple studies have identified a “prudent” or “healthy” pattern characterized by
high loads of vegetables, fruits, legumes, whole grains, fish, and poultry. 175,177,218,219 A
multiethnic studies reported that at increasing age, women were less likely to eat
according to a “meat” pattern, and more likely to adopt a “vegetable” pattern. 220
Results of a study developed in the southwestern of the U.S. including Hispanic
and non-Hispanic white women (25-79 years) reported the presence of five meaningful
dietary patterns: (1) “western”, (2) “Native Hispanic”, (3) “prudent”, (4)
“Mediterranean”, and (5) “dieter” eating patterns. Results indicated that Hispanic women
reported a higher calorie intake, and a greater proportion of energy from fat and vegetable
protein, less alcohol, and less energy from animal protein compared with non-Hispanic
white women. 210

46
Studies among Puerto Rican and Dominican individuals have reported different
patterns: (1) “fruit and vegetables”, with high loadings of fresh fruits, non-starchy
vegetables, and fish; (2) “pizza and sweets”, with high loadings of pizza, cakes, donuts
and candy; (3) “fried foods”, with high loadings of French fries and fried chicken; (4)
“Caribbean starch”, with high loadings of rice, beans and starchy vegetables (e.g., yucca
and plantains); and (5) “meats”, characterized by high loadings of eggs, processed meats,
and cultural meats (e.g., goat). 218 Other study among Puerto Ricans reported three
meaningful dietary patterns: (1) “meat and French fries”, (2) a “traditional”, (3) and a
“sweets” eating patterns, where a “meat and French fries” pattern was associated with
higher blood pressure and waist circumference, a “traditional” pattern was associated
with lower HDL-cholesterol and a higher likelihood of Metabolic Syndrome, and a
“sweets” pattern was associated with lower HDL-concentrations and higher waist
circumference.221
Among Mexican-Americans, four dietary patterns were reported using and using
2001-2002 NHANES data: (1) “poultry and alcohol”, (2) “milk and baked products”, and
(3) “traditional Mexican diet”, and (4) “meat” patterns. 222 Results of this study did not
find significant associations between the unhealthy dietary patterns identified (“poultry
and alcohol”, “milk and baked products”, “traditional Mexican diet”, and “meat”) and
BMI or obesity.222
Among Mexicans, a study including 5240 men and women showed three dietary
patterns: (1) the “prudent”, characterized by high intakes of vegetable juices, potatoes,
fresh fruits, fresh vegetables, and legumes; (2) the “western”, which had high loadings of
pastries, refined cereals, corn tortillas, and soft drinks, and negative loads of whole

47
cereals, seafood, and whole-milk dairy products; and (3) the “high protein/fat”,
characterized by high intakes of red meat, processed meat, margarine, and eggs.223
Results indicated that a “Western” pattern with high loads tortillas, tacos, and sugary
beverages was associated with higher risk of Metabolic Syndrome.223 Other study
involving 15,890 Mexican adults participating in the National Health Survey 2006 in
Mexico identified three major dietary patterns: (1) the “refined foods and sweets”, with
the highest contribution of energy coming from alcohol, soft drinks, white bread, fast
foods, sweets, and snacks; (2) the “traditional”, with high loads of maize and maize
foods; (3) and the “diverse” pattern”, with high loads of full-fat dairy, rice, pasta, meat,
poultry, eggs, saturated fat, fruits, and vegetables.224
2.5.6 Dietary patterns: Strengths and Limitations
Dietary patterns derived a posteriori have the advantage that they are independent
of definitions of what is a healthy pattern, and they are multidimensional in nature.
Furthermore, unlike the traditional analytical approach used in nutritional epidemiology,
dietary pattern analysis takes into consideration the entire diet rather than individual
nutrients or foods.59 The dietary pattern approach cannot be specific about particular
nutrients responsible for observed differences in disease risk, due to the multiple potential
differences in nutrients between dietary patterns, and therefore, it may not be very useful
and informative about biological relationships between components of the diet and
disease risk.59

48
The type of dietary assessment used to collect the dietary data is an important
aspect to be considered. Interest will be mostly centered on the usual dietary patterns, and
in the scenario of dietary data collected with 24-hour dietary recall or diet records, day-
to-day variation would behave like random measurement error.214 There are general
problems of measurement error associated with self-reported dietary data, which would
be transferred to the derived dietary patterns, and might be even more emphasized
because correlations in measurement error might disfigure the definition of the patterns.
An example of this scenario would be if subjects in a study systematically underestimate
their consumption of unhealthy foods.214
Dietary patterns are likely to change based on socioeconomic status, sex, ethnic
group, and culture. Therefore, it would be necessary to reproduce the results in different
populations. However, this would not mean the results of the pattern analysis are not
valid, due to these differences may be genuine result of different sociocultural
background.225 Additionally, food availability and food preferences change, therefore, the
meaning of dietary patterns is subject to change over time. Finally, evidence is reinforced
when the result from different perspectives of research (e.g., biomarkers of nutrient
consumption, nutrients, foods, food groups, and dietary patterns) show consistent results.
Therefore, it is not expected that dietary patterns replace the nutrient or food analysis;
instead, it is expected to function as a complementary approach to the existing traditional
methods.

49
2.6 Dietary Assessment
Diet is identified as a leading lifestyle risk factor for a wide range of chronic
diseases. Dietary findings have been used successfully to predict cardiovascular disease
risk.226 There are different methods to assess nutrient exposure including subjective and
objective methods; they are discussed briefly discussed in the next subsections.
2.6.1 Subjective Methods
Subjective dietary assessment methods or “traditional methods” to assess an
individual’s intake those collected are self-reported and it can be collected also with help
of an interviewer. These methods include the twenty-four hour dietary recall (24HR),
dietary record, dietary history, and food frequency questionnaire.227
2.6.1.1 Twenty-Four Hour Dietary Recall
The twenty-four hour dietary recall (24HR) is an open-ended questionnaire that
collects information about food consumed over a period of 24 hours.228 The 24HR is
completed during an in-depth interview manner, and typically requires 20-30 min to
complete a single day recall. Information about amounts of each food consumed is
estimated in reference to a common size container (e.g., cups, glasses), standard
measuring cups and spoons, three-dimensional foods models, or two-dimensional aids
(e.g., photographs). Information about preparation methods and ingredients of mixed
dishes is collected, and sometimes the brand of commercial products may be required.
Strength of this method is a relative burden imposed on the responders when compared

50
with other dietary assessment methods (e.g., diet history). However, an important
limitation is that all the information is subject to recall bias and to the skills of the
interviewer.
2.6.1.2 Dietary Record
The dietary record is an open-ended self-administered questionnaire that captures
information of food intake at the time food is consumed, thus minimizes recall bias.229 In
addition, no interviewer is required. A limitation of the dietary record is that it focuses on
short-term intake; hence, multiple days are required to assess usual intake. Also,
respondents should be trained before participating in the dietary record, and literacy and
high motivation are required. This may impose a burden to the respondents who has to
collect the data accurately through the day. Other limitation is the process to analyze the
collected dietary data (e.g., review data, entry, coding, analysis) tend to be time-
consuming, arduous, and expensive to carry out.227
2.6.1.3 Diet History
The diet history provides subjective measures using open- and closed-ended
questionnaires administered by an interviewer. The diet history method was developed to
assess long-term dietary intake. This method combines a 24HR, a 3-day food diary, and a
checklist of foods habitually consumed. It requires highly trained and skilled interviewer
to collect the dietary information during a comprehensive interview (~ 90 minutes to
complete).230 Hence, this method is seldom used in epidemiological studies.

51
2.6.1.4 Food Frequency Questionnaire
The food frequency questionnaire (FFQ) is a subjective measure that uses a
predefined, self- or interviewer-led format that assesses the usual intake over a relatively
long period of time (e.g., 3 or 6 months, or 1 year).231 A strength of this method is that
assess usual dietary intake in a simply, cost-effective and timesaving manner, which
makes this method adequate for epidemiological studies. Limitations include that is
specific to groups of study and research questions (e.g., food frequency questionnaires
should be adapted for target population considering their usual foods consumed), uses
closed-ended questionnaire with the potential of leaving food items out, portion sizes are
estimated whit the potential of under- or over reporting, potential of recall bias, and
requires accurate methods and databases to evaluate the specific questionnaire.232
2.6.1.5 Diet Quality Indices
Diet quality is a concept that involves the assessment of both quality and variety
of the entire diet. Diet quality can be measured by using scoring food patterns relative to
how close they adhere to national dietary guidelines and how diverse the variety of
healthy choices is within core food groups.60 Diet quality scores have been used to
describe dietary patterns among free-living populations, with the aim of determining the
associated risk of some health outcomes, particularly T2D. Prospective cohort studies in
the U.S. have shown that diets with high quality, or with high diet quality score, are
considerably associated with a lower incidence of T2D.233
Scoring systems and indices have been developed for assessing the quality of
dietary patterns based on a priori defined of amounts of specific food groups

52
recommended by current dietary guidelines.233 Some of the most used score and indices
are the HEI-2010, AHEI, Alternate Mediterranean index, and different versions of DASH
score.
The HEI is an algorithm that measures diet quality in alignment to the Dietary
Guidelines for Americans, which along with the food guide pyramid, represent the
cornerstone of federal nutrition policy in the U.S. government.234 The USDA and the U.S.
Department of Health and Human Services update the Dietary Guidelines for Americans
every 5 years; therefore, the HEI has been updated to reflect the current Dietary
Guidelines for Americans.
The first HEI (1995) was developed based on a 10-component system of five food
groups, for nutrients, and a measure of variety in food intake. The components included:
grains, vegetables, fruits, milk, meat, total fat, saturated fat, cholesterol, sodium, and
variety. Each component has a score between 0 and 10 points, with an overall scoring
ranging from 0 to 100.235 The second version, HEI-2005 includes 12 components: total
fruit, whole fruit, total vegetables, dark green and orange vegetables and legumes, total
grains, and whole grains, 5 points each; and milk, meat and beans, oils, saturated fat,
sodium, 10 points each; and empty calories from solid fats, alcoholic beverages, and
added sugars, 20 points. The overall scoring range from 0 to 100.236
The HEI-2010 is the most recent version and is integrated by 12 components
scored from 0-5, 10 or 20, which is determined by the food or nutrient category with a
maximum total score of 100. Adequacy components correspond to food groups or
nutrients that are encouraged as part of a healthful diet. Food groups in the adequacy
component are: total fruit, whole fruit, total vegetables, greens and beans, whole grains,

53
dairy, total protein foods, seafood and plant proteins, and fatty acids (polyunsaturated
fatty acid-PUFA + monounsaturated fatty acid-MUFA ratio), where each score up to 5
points with the exception of fatty acids (10 points). Moderation components correspond
to food groups or nutrients that should be limited. Food groups included in the
moderation component are: refined grains, and sodium, 10 points each; and empty
calories from solid fats, alcoholic beverages, and added sugars, 20 points.237 For
adequacy components, the maximum score is assigned to intakes equal to or higher than
the level of recommended intake. In contrast, for moderation components the maximum
score corresponds to intakes at or beneath the level of recommended intake; therefore, a
higher score reflects lower intake. The scoring standards were created on a density basis,
to focus on diet quality instead of quantity, where each individual component was
assessed as amount per intake of 1000 kcal (4184 kJ), percentage of total energy intake,
or a ratio.234 The total HEI-2010 corresponds to the sum of all the components,238 and the
cut-off points for total HEI are: >80 indicates good diet, 51-80 indicates need for
improvement; <51 indicates poor diet.234
The AHEI was developed by McCullough in 2002239 in an attempt to improve the
HEI at predicting chronic disease risk. The AHEI is composed by the intake of nine
components from the original HEI. In contrast to the HEI-2010 that uses a nutrient
density approach, the AHEI uses an absolute intake approach in which the total amount
of food and nutrients consumed is considered for scoring.239 The AHEI-2010 is a more
recent version of this index.55
The DASH score has several versions varying slightly in terms of items included,
cut-off values, scoring strategy, classification of items and their assignment to food

54
groups. However, they all reflect a common dietary pattern in agreement with dietary
guidelines rich in vegetables, fruit, whole grains, legumes, nuts, fish, and low in highly
processed meat and sweets.240 The DASH score established by Fung et al. (2008) is the
most often used version which includes eight components: high intake of fruits,
vegetables, whole grains, low-fat dairy products, nuts and legumes, and also low intake of
red and processed meats, sodium, and sweetened beverages.241
The Alternate Mediterranean index score was adapted by Fung et al. (2005) from
the scale developed by Trichopoulou et al. (2003) to use with a food frequency
questionnaire developed in the U.S.242 The Alternate Mediterranean index was developed
to reflect higher consumptions of plant foods, including plant proteins, monounsaturated
fat, and fish, and lower consumption of animal products and saturated fat.243 The original
score was composed of 9 items: vegetables, legumes, fruit and nuts, dairy, cereals, meat
and meat products, fish, alcohol, and the ratio of MUFA/Saturated fat. Intakes above the
median received 1 point, all other intakes received 0 points. The modifications of this
original scale to derive the Alternate Mediterranean index included separating fruits and
nuts into two different groups, excluding potatoes from the vegetable group, eliminating
the dairy group, including only whole-grain products, including only red and processed
meat in the meat group, and assigning alcohol intake between 5-15 g/d one point.
Possible scores of the Alternate Mediterranean index ranged from 0-9.242 The DASH
score, along with the HEI, AHEI, and more recently the Alternate Mediterranean index
represent indices of major public health importance in the U.S. due to their association
with decreased risk for multiple diseases. The use of dietary quality indexes considers
multidimensional aspects of food and non-nutrient components (e.g., biologically active

55
dietary constituents), instead of reducing dietary consumption to individual nutrients,
which is considered strength of the method.55 However, a limitation of using dietary
quality indices is the potential sources of heterogeneity due to differences in how the
dietary quality indices are defined and scored.55
2.6.2 Objective Methods
Accurate assessment of dietary exposure is cornerstone in investigating
associations between diet and disease. In the last two decades, research in nutritional
epidemiology has resulted in a considerable amount of information about associations
between diet, nutrients and chronic diseases. Most dietary assessment methods available
rely on self-report with the potential of systematic bias affected by multiple factors (e.g.,
gender, age, and social desirability).244 Contrary, objective measurements are accurate
and easy to replicate; therefore, they tend to be used in conjunction with subjective
measures based on the research question.
2.6.2.1 Biomarkers
Biological markers, termed “biomarker”, refers to a broad subcategory of medical
signs (objective indications of medical state observed from outside the patient), which
can be measured accurately and reproducibly.245 The term biomarker has different
meanings, but most biomarkers are used as surrogate endpoints in clinical research and
are used to predict future events (e.g., CVD risk); contrariwise, biomarkers of exposure
are used to estimate past exposure for instance, to chemical substances (e.g.,
pesticides).244

56
2.6.2.1.1 Biomarkers of Fatty Acid Intake
In nutrition, biomarkers are used for accurate assessment of dietary exposure with
the aim of investigating associations between diet and disease, therefore, biomarkers can
be used as surrogates to measure the intake of certain nutrients or dietary components of
interest in nutrition research.246 For instance, assessment of dietary fat quality is of
interest given that fatty acid intake has been associated with the risk of Metabolic
Syndrome,247 and T2D.248,249 To study dietary fat quality, data are usually derived from
subjective measures (e.g., food frequency questionnaires); however, fatty acids of
erythrocyte membranes are considered an objective measure of long-term (past 6 months)
fatty acid intake250 and endogenous metabolism.248,251 Fatty acid chains are elongated by
elongase and double bonds are inserted by desaturase to generate more unsaturated and
long-chain PUFAs.252 A high desaturase activity may lead to an increased bioavailability
of arachidonic acid with dominant synthesis of arachidonic-derived proinflammatory
eicosanoids, possibly leading to vascular damage, especially in populations eating a
western diet.252 It is difficult to obtain direct measures of desaturase activities;253 for this
reason, desaturase indices are used as surrogate measures endogenous fatty acid
metabolism.254,255
2.6.2.1.2 Biomarkers of Fruit and Vegetable Intake
Besides blood, other biological specimens (e.g., urine, tissues) can be used to
reflect accurate and consistent biomarkers of food consumption. For instance, recovery
biomarkers (e.g., doubly labeled water, 24-hour urinary nitrogen) are considered accurate
in estimating dietary intakes because they reflect a direct relationship between absolute

57
intake and concentration in tissues.256 Other biomarkers are those termed concentration
biomarkers, which correlate with intake, but factors such as metabolism or characteristics
inherent to individuals (e.g., smoking) affect their concentrations; therefore, they cannot
be used as measures of absolute intake. An example of this type of biomarker is
circulating carotenoids. Carotenoids are diverse fat-soluble pigments in substantial
quantities in fruits and vegetables. Since they cannot be synthetized by humans,257 and
since fruit and vegetables carotenoids accounts for around 90% of dietary carotenoid
intake, carotenoids in circulation are considered as reliable biomarkers of carotenoid
consumption. In addition, circulating carotenoid concentrations as biomarkers of fruits
and vegetables intake are mostly validated against self-reported intake of fruits and
vegetables using questionnaires. Some examples of these are alfa-carotene, beta-carotene,
beta-cryptoxanthin, zeaxanthin, lutein, and lycopene.258
2.6.2.2 Objective Methods: Strengths and Limitations
An important advantage of using biomarkers to measure nutrient intake is
avoidance of social desirability and recall bias; thus, they may yield to more accurate
measures than dietary intake assessments provide.232 On the other hand, some limitations
include that biomarkers may be affected by diseases, inter-individual variations in
metabolism, and other physiological factors (e.g., homeostasis reactions). Furthermore,
biomarkers are frequently restricted to estimating intake of particular compounds and not
entire foods,244 making difficult obtaining the absolute dietary intake by individuals.259
Therefore, biomarkers results do not provide dietary information to modify individual’s

58
dietary behaviors. In this case, direct dietary assessment may provide more detailed
information than the information provided by biomarkers.260
2.7 Conclusion
In conclusion, the Metabolic Syndrome, prediabetes and diabetes affect a high
percentage of Hispanic women. Multiple factors play a role in diabetes onset; however,
diet is an important modifiable contributing risk factor to delay and/or prevent T2D onset
and its complications. Nutrition therapy is one of the most important components of
diabetes management; however, differences in diabetes control and management within
ethnic groups might be attributed to different socioeconomic status, access to health care,
acculturation, lifestyle and dietary patterns.
T2D treatment should be aimed at achieving individualized targets for glycemic
control, blood pressure, and lipid concentrations. Individualized nutrition therapy should
address nutrition needs taking into consideration personal preferences, health literacy and
numeracy, access to high-quality foods, state of willingness and ability to change
behavior, and personal barriers to change behaviors. This should occur by using messages
about food choices without judgmental emphasis, and by providing all individuals with
diabetes with real-life tools for developing healthy eating patterns like the DASH,261
vegan or vegetarian patterns,262 and MedD,263 rather than focusing on macronutrients,
micronutrients, or isolated foods.78
The evidence suggests that several dietary strategies may lead to improvements in
diabetes risk factors; hence, there is no one an ideal conclusive dietary pattern that is
expected to benefit or be followed by all individuals with diabetes, because a healthy

59
dietary pattern may vary across different populations and ethnic groups. Research of diet
and dietary patterns among high-risk populations such as women of Mexican descent are
still needed to detect opportunities for improvement in their dietary behaviors. Studying
dietary patterns may provide additional insights to those yielded by analysis of diet
quality based on pre-established guidelines by allowing capturing a larger variety of
dietary patterns among populations. Both strategies, the nutrient and dietary patterns
approaches are complimentary and useful to better understand women’s diet
characteristics and its protective and detrimental effects on health.
The reviewed literature showed that most of the published studies among
Hispanics include multiple backgrounds, which can limit dietary assessment because diet
recall instruments are usually designed and validated for specific subpopulations
(tailored). Therefore, it is possible that some studies assessing dietary patterns among
Hispanic women with multiple backgrounds do not capture all the dietary traits within an
ethnic group. Thus, using adequate methodologies to study the diet as a whole rather than
the nutrient intake approach may provide insights of the accumulative effects of foods
and interactions between their compounds on diabetes risk factors.

60
CHAPTER 3
METHODOLOGY
3.1 Study Design
“De Por Vida” is the parent study for the current analysis. “De Por Vida” is a
behavioral intervention testing a weight-loss lifestyle and diabetes risk reduction for
overweight/obese Hispanic women with T2D, prediabetes or at risk for T2D diagnosis
using a pragmatic randomized controlled trial study design. “De Por Vida” was delivered
at Virginia Garcia Memorial Health Center (VGMHC), a Federal Qualified Health Center
in Hillsboro, Oregon, where the majority of Hispanic patients have low-income (65% of
patients live in poverty) and have low-education attainment. For purposes of this
dissertation, a cross-sectional data analysis was conducted using data from all participants
enrolled in the trial and collected at baseline prior to randomization. A description of the
“De Por Vida” intervention is not included in this dissertation because the follow-up data
of the “De Por Vida” trial was not used for the current analysis.
3.2 Recruitment
Participants were recruited via posters exhibited in clinic exam rooms, by direct
physician referral, and through examination of the Electronic Medical Records of patients
seen at the clinic within the last 18 months. Potential participants were those receiving
their primary medical care at the VGMHC and who met eligibility criteria based on
existing medical record information.
61
Eligible participants had to: (1) be Spanish-speaking and Hispanic; (2) be female; (3)
be ≥ 18 years; (4) have BMI ≥ 27 kg/m2; (5) be diagnosed with T2D or pre-diabetes per
International Classification of Diseases (ICD)-9 codes and/or inclusion of the diagnoses
on patients’ problem lists, or considered to be at risk for developing T2D due to
Metabolic Syndrome, high blood pressure, family history of diabetes, or history of
gestational diabetes; and (6) have had a clinic appointment in the last 18 months.
Participants were excluded if they: (1) were treated for cancer in the past two years (with
the exclusion of non-melanoma skin cancers); (2) had a psychiatric hospitalization in the
past 2 years; (3) had conditions that require limitation of physical activity or that would
be contraindicated for the DASH dietary patterns; (4) were on weight-loss medication
currently or within the past 6 months; (5) were currently or recently (<12 months)
pregnant or breastfeeding; (6) were planning pregnancy in the next 18 months; and (7)
were participating in other studies.
3.3 Participants
A total of 200 participants were enrolled in the trial, one was excluded from the
present analysis because she did not complete the food frequency questionnaire at
baseline. Out of the remaining 199 participants with diet data, 8 participants were
excluded because their reported energy intake was ± 2 SD away from the sample mean,
and thus diet data was deemed implausible. Therefore, a final sample of 191 participants
was used for the current analysis.

62
All study materials and procedures were approved by the Kaiser Permanente Center
for Health Research and Arizona State University Institutional Review Boards
(Appendices A and B). All participants interested in enrolling for the study and
confirmed eligibility provided written informed consent in their language of preference
(English or Spanish; Appendices C and D, respectively) prior to data collection.
3.4 Data Collection
Following confirmation of eligibility and after written informed consent was
obtained; participants were contacted via telephone to complete an interviewer-led survey
that included sociodemographic questions (age, gender), and the Southwestern Food
Frequency Questionnaire (SWFFQ, described below). After the telephone assessment,
participants were scheduled for a visit at the VGMHC, following a 12-hour overnight fast
for collection of FBG, HbA1c, height and weight as described below.
3.5 Measurements
3.5.1 Anthropometric Measurements
Waist circumference was measured at the midpoint between the lower rib and the
iliac crest. The measure was recorded to the nearest 0.5 cm using a linen non-stretch tape
measure with a tension device to provide a constant tension during measurement. Weight
was measured using a standard protocol with participants wearing light indoor clothes
and without shoes and recorded to the nearest 0.1 kg using a calibrated digital scale.

63
Height was measured without shoes and was recorded to the nearest 0.1 cm using a
calibrated wall-mounted stadiometer. Weight and height were used to calculate BMI=
weight/height2 (kg/m2).
3.5.2 Biochemical Assessments
FBG and HbA1c were measured from capillary blood via finger stick using point
of care devices to facilitate data collection by VGMHC staff. Fasting blood glucose was
measured with a OneTouch Ultra glucometer (LifeScan Inc, Milpitas, CA). HbA1c was
measured using an A1cNow+ device (Bayer HealthCare LLC, Sunnyvale, CA). Although
the American Diabetes Association (ADA) does not recommend the use of point of care
devices for diagnostic purposes,78 HbA1c assessment was conducted with one of this
devices in the context of a pragmatic clinical trial because the use of capillary blood with
these devices to detect unrecognized diabetes in clinical settings has been strongly
correlated with standard laboratory tests (R2=0.712, p<0.001).264
3.5.3 Dietary Assessment
Baseline dietary data were collected using the Southwestern Food Frequency
Questionnaire (SWFFQ)265 (Appendix E) by trained bilingual interviewers from Arizona
State University and Kaiser Permanente Center for Health Research. The SWFFQ265 is a
semi-quantitative (frequency and portion size) bicultural, bilingual (English/Spanish)
food frequency questionnaire, adapted from the Arizona Food Frequency
Questionnaire.266 The SWFFQ consists of 158 food items including culturally appropriate
elements of the diet for the southwestern Hispanic population in the U.S., predominantly

64
from the north part of Mexico. Relevant and characteristic foods items include
“nopalitos” (cactus leaves), corn flour tortillas, refried beans, “machaca” (dried beef), and
chorizo. This instrument also allows adding foods not included in the questionnaire, as
well as recording the use of supplements. The SWFFQ has shown a reproducibility of
0.832 and a validity coefficient of 0.700 and has been reported to be effectively used for
its target population.265
Data were collected to reflect the prior three months of intake. The dietary data for
the present study is derived from an intervention study, and the dietary data collection
where planned to occur within the periods of assessment. SWFFQ data were analyzed by
the Arizona Diet, Behavior and Quality of Life Assessment Laboratory at the University
of Arizona, based on the USDA Nutrient Data Bank databases of food composition.267
The output provided information of 87 nutrients, in addition to 25 computed variables
such as percentage of calories from macronutrients.265 The analysis of the SWFFQs
derived a total of 867 potential food items (FIDs). Per SWFFQ analysis, the FIDs were
originally aggregated into 23 food groups as follows: (1) milk, (2) cheese, (3) meat, (4)
mixed dishes, (5) soups, sauces and gravies, (6) eggs, (7) beans, nut, and seeds, (8)
breads, cereals, and crackers, (9) cakes, cookies, and pastries, (10) salty snacks, (11)
fruits, (12) fruit juice, (13) starchy side dishes, (14) vegetables, (15) vegetable juice, (16)
condiments, (17) fats, (18) sweets, candy, and syrup, (19) non-alcohol and non-fruit
beverages, (20) alcohol, (21) fish, (22) poultry, and (23) soy products. The standard
SWFFQ analysis includes diet soft drinks in the “beverages” food group. Because diet
soft drinks do not contribute energy, they were removed from the “beverages” food group
and considered as a separate “diet soft drinks” food group, yielding to a total of 24 food

65
groups. Food groups that included similar items were further collapsed, following the
approach from previous published studies,72,268 as follows: (1) “fruits” and “fruit juice”
were collapsed into the “total fruit” group, (2) “vegetables” and “vegetable juice” groups
were collapsed into the “total vegetables” group, (3) “soy products”, and “beans, nuts and
seeds” groups were collapsed into a group called “beans”, and (4) “cheese” and “milk”
groups were collapsed into the “dairy” group.
All food group variables were non-normally distributed and were transformed
using either square root, natural logarithm, or inverse functions, as needed. After
transformations, skewness and kurtosis improved substantially. The “diet soft drinks”
group was excluded from the analysis due to low reporting and because it was not
possible to normalize the variable after transformations. In addition, individual’s daily
frequencies of consumption of all the collapsed 19 food groups were divided by the total
calories/day consumed to adjust for energy. A total of 19 adjusted food group variables
were yielded (Table 1).
3.6 Sample Size
The sample size estimation was conducted based on the primary outcome for the
“De Por Vida” study (e.g.., body weight). In the “De Por Vida” pilot study 30 participants
completed 6-month follow-up data collection procedures.269 Using a quasi-experimental
design, participants experienced weight changes from 91.6±13.3 kg at baseline to
84.1±11.9 kg at the 6-month follow-up. Based on a power of .80 and alpha of .05, and a
66% retention observed in the “De Por Vida” pilot study, the sample size was estimated

66
at 200 women (100 each arm) and a total of 200 participants were enrolled in the study;
this estimated sample was used as a convenience sample for the analysis proposed herein.
3.7 Dietary Pattern Analysis
For the present analysis of dietary patterns, the exploratory factor analysis technique
was used to identify the number of latent constructs and the underlying factor structure of
a set of variables. Latent construct, also referred as a factor, underlying construct, or
unobserved variable; can be measured indirectly by identifying its influence to responses
on the observed or measured variables. Exploratory factor analysis establishes the
hypothesis of an underlying construct, a variable that is not measured directly and
estimates factors that influence responses on observed variables, called factor scores.270
This technique allows describing and identifying the number of latent constructs, called
factors, which are influenced by unique factors (estimated error due to unreliability in
measurement). Factor loadings are parameter estimates that help to interpret factors.
Loadings are the correlation between observed variables and factors. Eigenvalues indicate
the amount of variance explained by each factor. Though factor scores can be computed,
in common practice summary scores for factors are calculated with a mean or sum of
measured variables that load on a factor.215
To run exploratory factor analysis, the following factors were considered: 1) factor
extraction method, 2) number of factors to retain, 3) rotation, and 4) sample size. SPSS
principal axis factor was used since the data were significantly non-normal.271 Scree plot
and eigenvalues informed the decision on the number of factors to retain, and rotations to
clarify and simplify data structure. Varimax (orthogonal) and oblique rotations were used.

67
If the factors were truly uncorrelated, orthogonal and oblique rotation will produce nearly
identical results.271 After rotation, item-loading tables were reviewed to look for the
cleanest factor structure (item loadings ≥ 0.30), no or few crossloadings, and no factors
with fewer than three items were the best fit to the data. Decisions of number of factors
were based on how the items loaded and which had the most interpretable factors. To
determine whether the sample size was sufficient, the subject to item ratio was examined.
This was determined by how many items each participant answered or was measured on,
not how many were kept after analysis. It has been reported that most of the studies
analyzed (63%), researchers performed analysis with subject to item ratios of 10:1 or less,
which is a still prevalent rule of thumb that many researchers follow when determining a
priori sample size.271 However, a high proportion of reported studies using factor analysis
were based on subject to item ratios of only 2:1 or less.271
After the above-mentioned steps, the solution was interpreted; summary scores
were calculated (by using the mean or sum of variables for variables that load and are
highly correlated with the factor). Regression factor scores used a least square regression
procedure to predict factor score(s). Regression factor scores predict the location of each
individual on the factor component. This method differs from the non-refined sum
method (sum scores) due to the weighed sum non-refined procedure reflects the extent to
which the factor or component estimated is expressed by each individual case; the
method does not use an underlying model to predict an “ideal” factor score. Factor scores
representing each placement of each individual on the factors identified in exploratory
factor analysis were created as described elsewhere 272 to look for associations of dietary
patterns with age, BMI, waist circumference, HbA1c, and FBG.

68
3.8 Statistical Analyses
Data were tested for normality with both visual and the Kolmogorov-Smirnov
normality tests. Outliers (n=8) were identified based on energy intake levels and removed
if they fell in the lowest and upper 2.5 percentile of the distribution (Z.975 score) yielding
a final sample of n=191 participants for all the analyses. After removal of outliers, the
majority of variables remained non-normally distributed. Descriptive results from
participants and their nutrient intake are reported from non-normal and untransformed
data and include the median and interquartile range in addition to mean ± standard
deviations (mean ± SD). Nutrient intake of carbohydrate, protein, fat, saturated fat, and
alcohol were expressed as percentage of total energy/day.
Dietary patterns were derived from the 19 transformed food groups using
exploratory factor analysis. The Kaiser-Meyer-Olkin measure of sampling adequacy was
0.731, above the recommended value of 0.60; and Barlett’s test of sphericity was
significant (chi-square [190] = 771.325 p <0.0001). The principal axis factoring method
with Kaiser normalization was used to extract the factors given that even after
transformations, food groups were non-normal, this was followed by orthogonal and
oblique rotations. To decide the factor rotation, coefficients of factors in the factor
correlation matrix (Appendix F) created by promax (oblique) were examined. It has been
proposed that correlations among factors that are 0.32 and above indicate there is 10% or
more overlap in variances among factors, which would warrant oblique rotation.273 The
observed correlations between factors in the matrix (Appendix F) surpassed 0.32;
therefore, oblique rotation methods (e.g., oblimin and promax) were used to enhance
interpretability of the resultant factors and to allow them to correlate. A scree test

69
suggested six meaningful factors (eigenvalues of ≥ 1.0) explaining 56% of total variance,
which were retained for rotation. Iterative rotations showed that promax provided a
simple structure. In interpreting the rotated factor patterns, an item was considered to
contribute to the pattern (load on a given factor) if the factor loading was ≥ 0.30 for that
factor and was < 0.30 for the other. Factors with at least three-item loadings ≥ 0.30 with
no or few crossloadings were the criteria to retain the factors.
Regression factor scores of each eating pattern were used to test their associations
(Pearson correlation coefficients, r) with risk factors including: age, BMI, waist
circumference, FBG, and HbA1c. Statistical significance was set at the p < 0.05 level. All
the statistical analyses were performed with SPSS software (version 21; IBM
Corporation).

70
Table 1. Food groupings assessed with the southwestern food frequency
questionnaire
Food
group
Food items
Dairy Milk (whole, 2%, 1%, and skim), evaporated milk, cream (half and half, sour, semi-
sweet), yogurt, cheese (cheddar, Swiss, spreads, fresh, and cottage) Read meat Beef, pork, hamburgers, dried shredded beef (“machaca”), chorizo, beef steaks (“carne
asada”), sausage, ham, liver, hot dogs, bacon Mixed
dishes Spaghetti or pasta, pizza, dishes with chicken, Chinese dishes, Mexican dishes, crispy
taco (“flautas”), tacos w/beef and cheese, soft taco, tamales with and without meat,
quesadilla, menudo, pozole, chile relleno, enchiladas, chili, sushi, mole, chimichangas,
tostadas, burritos, macaroni and cheese, beef stew, meat with chile (e.g., “birria”). Soups Cazuela soup, meatball soup (“caldo de albóndigas”), soup w/cheese and chile (“caldo de
queso”), noodle soup, tortilla soup, vegetable soup, vegetable beef (“cocido”), salsa, taco
sauce, barbeque sauce, gravies Eggs Eggs
Beans Lentils, beans, refried beans, chickpeas, sunflower seeds, flaxseed, shelled nuts (peanuts,
walnuts, almonds, pistachios), peanut butter, almond butter, tofu, soy milk, soy-meat
substitutes, soy-based protein powder Grains White bread, biscuits, muffins, whole wheat muffins, bagels, rolls, waffles, pancakes,
cornbread, oat bran, cooked cereal, cold cereals (e.g., corn flakes), 100% wheat bran
cereals (e.g., all bran), sugary cereals (e.g., frosted flakes), granola and breakfast bars,
crackers, Mexican bread, corn tortillas, flour tortillas Pastries Cookies, cake, doughnuts, molasses turnover (“coyotas”) pastries, sweet bread (“pan
dulce”), pumpkin pie Salty
snacks Pork rinds (“chicharrón”), popcorn, potato chips, corn chips, tortilla chips
Fruits Bananas, peaches, nectarines, cantaloupe, watermelon, mangoes, grapefruit, oranges,
pineapple, strawberries, cherries, blueberries, raspberries, pomegranate, apples, pears,
guava, grapes, plums, dried fruit (prunes, raisins, figs), natural fruit juice (grape,
cranberry, orange, grapefruit) Starchy
dishes French fries, mashed potatoes, baked or cooked potato, white rice, Spanish rice, noodles
Vegetables Green beans, squash, broccoli, cauliflower, carrots, spinach, turnip greens, coleslaw,
cabbage, sweet potato, onion, garlic, celery, radish, cucumber, jicama, cactus leaf
(“nopales”), cilantro, artichoke, peppers, chile peppers, tomatoes, corn, peas, mixed
vegetables with carrots, mushrooms, olives, avocado, guacamole, asparagus, kale,
zucchini, lettuce, tomato juice, other vegetable juice (not carrot or tomato) Condiments Artificial sweetener, fat-free salad dressing, non-fat mayonnaise, mustard, horseradish,
non-dairy creamer Fats Butter, lard, margarine (regular and low-calorie), mayonnaise (regular and low-calorie),
salad dressing (regular and low-calorie), vegetable oil (olive and canola) Sweets Sugar, candy, chocolate candy, milkshake, pudding, custard, flan, jelly, syrup, honey,
sherbet (jello), sherbet or sorbet, ice cream, popsicles Fish Shellfish, canned fish (tuna or salmon), canned tuna (oil or water), fried fish, baked or
broiled fish Poultry Fried chicken, chicken or turkey (with or without skin), ground turkey, buffalo wings Drinks Coffee, specialty coffees (latte, mocha, cappuccino), lemonade, Jamaica, tea (herbal,
black, green caffeinated or decaffeinated) sweetened fruit juice, rice drink (“Horchata”),
tang, juice drinks, regular soft drinks Alcohol Beer, wine, liquor

71
CHAPTER 4
RESULTS
4.1 Descriptive Characteristics of Participants
Age range of this sample of women was 18 to 73 years (Table 2). BMI categories
showed that 86% of participants had obesity. Waist circumference mean was above 88
cm among most of participants (99.5%). Fasting blood glucose was high among 86% of
participants with a concentration range of 80 mg/dL to 278 mg/dL, and HbA1c was high
among 73% of participants with a range of 4.7% to 11.8%.
4.2 Macronutrient Intake
Participants reported a mean energy intake of 1603 ± 748 kcal per day with a
macronutrient distribution of 54% of total energy provided by carbohydrates, 18% by
protein, and 31% by fat (Table 3). Reported total sugar and carbohydrate intake values
were 82 ± 52 g/d and 213 ± 100 g/d, respectively. Mean fiber intake was 16 ± 4.3 g/1000
kcal and reported mean intake of SFA and alcohol contributed with 9.4 ± 2.4 % and 0.3 ±
0.4 % of total energy intake, respectively (Table 4).

72
Table 2. Anthropometric, diabetes risk factors, and risk categories among
overweight/obese Hispanic women participating in De Por Vida1
Characteristics n % Mean ± SD2 Median IQR
Age, years 191 100 44.0 ± 10.0 43.0 14.0
BMI, kg/m2 191 100 36.4 ± 6.4 35.0 8.7
BMI categories
Overweight (25.0-29.9 kg/m2) 26 14 28.6 ± 0.9 28.6 1.4
Obesity class I (30.0-34.9 kg/m2) 70 37 32.7 ± 1.5 32.6 2.6
Obesity class II (35.0-39.9 kg/m2) 47 25 37.4 ± 1.6 37.7 2.8
Obesity class III (≥ 40 kg/m2) 48 25 45.3 ± 5.1 44.4 4.9
Waist circumference (≥ 88 cm) 190 99 115.4 ± 13.4 113.4 18.0
Fasting blood glucose, mg/dL 188 98 135.0 ± 45.4 117.5 41.0
Fasting blood glucose categories based on diabetes diagnosis criteria
Normoglycemia (< 100 mg/dL) 26 14 94.0 ± 4.4 96.0 6.0
Prediabetes or impaired fasting
glucose (≥ 100 - <126 mg/dL)
88 46 112.0 ± 7.0 112.0 11.0
Diabetes mellitus (≥ 126 mg/dL) 74 39 177.0 ± 47.0 156.0 79.0
Hemoglobin A1c, % 188 98 6.5 ± 1.4 5.9 1.5
Hemoglobin A1c categories based on diabetes diagnosis criteria
Normal (< 5.7%) 50 26 5.4 ± 0.2 5.5 0.3
Prediabetes (5.7 - <6.5%) 82 43 5.9 ± 0.2 5.9 0.3
Diabetes mellitus (≥ 6.5%) 56 29 8.4 ± 1.4 8.1 1.9
1Non-normal and untransformed values. 2Values shown as mean ± standard deviation (SD). IQR, interquartile range.

73
Table 3. Energy and macronutrient intake among 191 overweight/obese
Hispanic women participating in De Por Vida1
Nutrients Mean ± SD2 Median IQR
Total energy, kcal 1603.0 ± 748.0 1423.0 964.0
Carbohydrates, % energy 54.0 ± 8.0 53.0 12.0
Carbohydrates, g 213.0 ± 100.0 191.0 111.0
Total sugars, g 82.0 ± 52.0 70.0 54.0
Fiber, g 24.0 ± 11.0 21.0 13.0
Protein, % energy 18.0 ± 3.0 18.0 4.0
Total fat, % energy 31.0 ± 5.4 31.0 8.0
Alcohol, % energy 0.3 ± 0.4 0.1 0.0
1Non-normal and untransformed values. 2Values shown as mean ± SD. IQR, interquartile range.
4.3 Dietary Patterns
Factor analysis identified six distinct dietary patterns (Table 4). The first pattern
named “sugar and fat-laden” had high loadings of foods high in sugar, such as candy and
ice cream, and fat-rich foods, such as butter and margarine. This pattern explained 20.3%
of total variance in the intake of food servings/day reported by Hispanic women. The
second pattern named “plant foods and fish” had high loadings of vegetables, fruit, fish
and beans. This pattern explained 8.9% of total variance in the intake of food
servings/day reported. The third pattern named “soups and starchy dishes” had high
loadings of soups and gravies, starchy side dishes, and mixed dishes. This pattern
explained 8.3% of total variance in the intake of food servings/day reported. The fourth
named “meats and snacks” had high loadings of red meat, caloric condiments, and salty
snacks (e.g., pork rinds, popcorn). This pattern explained 6.4% of total variance in the

74
intake of food servings/day reported. The fifth pattern named “beans and grains” had high
loadings of legumes, seeds, nuts, and whole-wheat and refined-grain products (bread,
cereals, crackers and tortillas), fish, and alcohol. This pattern explained 6.3% of total
variance in the intake of food servings/day reported. The sixth and last pattern named
“eggs and dairy” had high loadings of eggs, high-fat dairy products, and fats and oils.
This pattern explained 5.4% of total variance in the intake of food servings/day reported
by participants (Table 4). Although poultry was highly reported during dietary data
collection, this food item did not load on any of the meaningful dietary patterns observed
in this study.
4.4 Associations of Dietary Patterns with Risk Factors
Cross-sectional associations between dietary pattern factor scores and diabetes risk
factors are shown in Table 6. Scores for the “sugar and fat-laden” and “meats and snacks”
patterns were negatively associated with age (r= -0.230, p= 0.001 and r= -0.298,
p<0.001), respectively. Scores for “plant foods and fish” pattern were associated with
fasting blood glucose (r= 0.152, p= 0.037). No significant associations were found
between the “soups and starchy dishes”, “beans and grains”, and “eggs and dairy”
patterns with age, BMI, waist circumference, FBG and HbA1c. A weak association
approaching significance was observed between the “Plant foods & fish” pattern and
HbA1c (r=0.128, p=0.080) (Table 5).
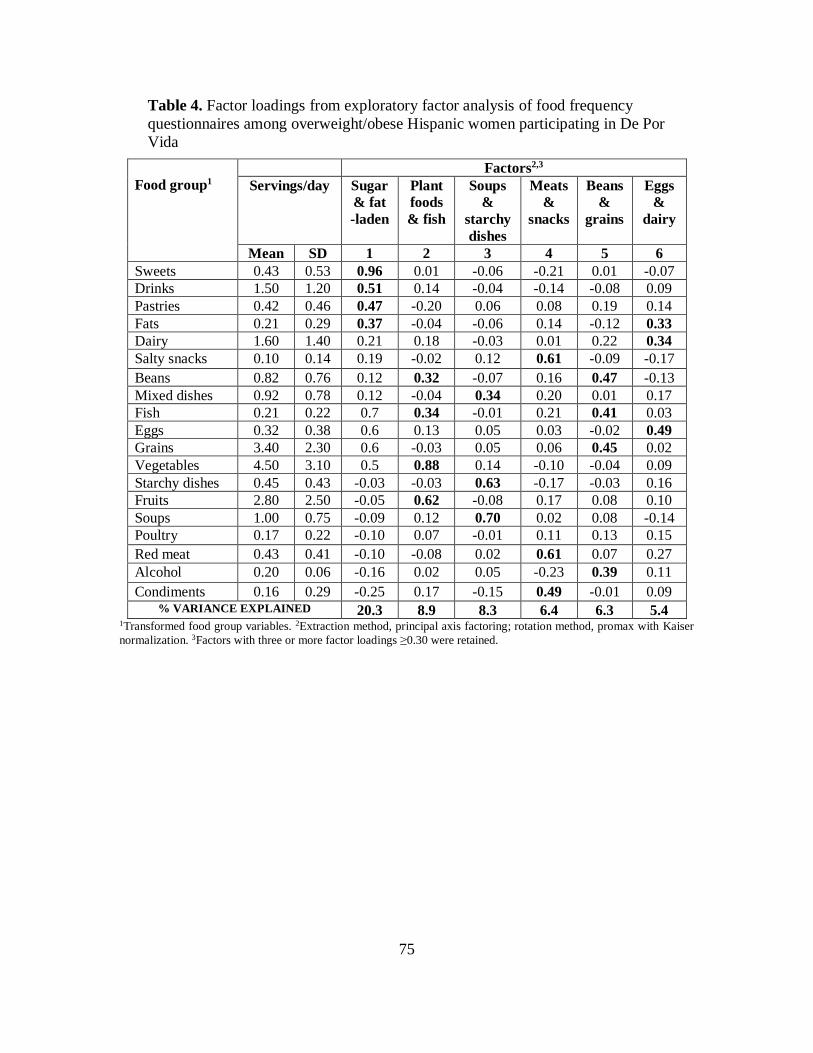
75
Table 4. Factor loadings from exploratory factor analysis of food frequency
questionnaires among overweight/obese Hispanic women participating in De Por
Vida
Food group1
Factors2,3
Servings/day Sugar
& fat
-laden
Plant
foods
& fish
Soups
&
starchy
dishes
Meats
&
snacks
Beans
&
grains
Eggs
&
dairy
Mean SD 1 2 3 4 5 6
Sweets 0.43 0.53 0.96 0.01 -0.06 -0.21 0.01 -0.07
Drinks 1.50 1.20 0.51 0.14 -0.04 -0.14 -0.08 0.09
Pastries 0.42 0.46 0.47 -0.20 0.06 0.08 0.19 0.14
Fats 0.21 0.29 0.37 -0.04 -0.06 0.14 -0.12 0.33
Dairy 1.60 1.40 0.21 0.18 -0.03 0.01 0.22 0.34
Salty snacks 0.10 0.14 0.19 -0.02 0.12 0.61 -0.09 -0.17
Beans 0.82 0.76 0.12 0.32 -0.07 0.16 0.47 -0.13
Mixed dishes 0.92 0.78 0.12 -0.04 0.34 0.20 0.01 0.17
Fish 0.21 0.22 0.7 0.34 -0.01 0.21 0.41 0.03
Eggs 0.32 0.38 0.6 0.13 0.05 0.03 -0.02 0.49
Grains 3.40 2.30 0.6 -0.03 0.05 0.06 0.45 0.02
Vegetables 4.50 3.10 0.5 0.88 0.14 -0.10 -0.04 0.09
Starchy dishes 0.45 0.43 -0.03 -0.03 0.63 -0.17 -0.03 0.16
Fruits 2.80 2.50 -0.05 0.62 -0.08 0.17 0.08 0.10
Soups 1.00 0.75 -0.09 0.12 0.70 0.02 0.08 -0.14
Poultry 0.17 0.22 -0.10 0.07 -0.01 0.11 0.13 0.15
Red meat 0.43 0.41 -0.10 -0.08 0.02 0.61 0.07 0.27
Alcohol 0.20 0.06 -0.16 0.02 0.05 -0.23 0.39 0.11
Condiments 0.16 0.29 -0.25 0.17 -0.15 0.49 -0.01 0.09 % VARIANCE EXPLAINED 20.3 8.9 8.3 6.4 6.3 5.4
1Transformed food group variables. 2Extraction method, principal axis factoring; rotation method, promax with Kaiser
normalization. 3Factors with three or more factor loadings ≥0.30 were retained.

76
Table 5. Associations between dietary patterns and diabetes risk factors among
overweight/obese Hispanic women participating in De Por Vida1,2
Risk factors Factors
Sugar &
fat-laden
Plant
foods &
fish
Soups &
starchy
dishes
Meats &
snacks
Beans
&
grains
Eggs
&
dairy
Age, years -0.230** 0.082 -0.114 -0.298** 0.002 -0.051
BMI, kg/m2 0.012 -0.042 0.014 -0.042 0.067 -0.055
Waist circumference,
cm (n=190)
0.017 -0.044 0.064 0.023 -0.053 0.001
Fasting blood
glucose, mg/dL
(n=188)
-0.044 0.152* 0.039 0.031 -0.028 0.075
Hemoglobin A1c, %
(n=188)
-0.097 0.128 -0.016 -0.047 -0.026 0.016
1Associations assessed with Pearson correlation coefficient (r). *p< 0.05. **p<0.01. 2n=191 unless otherwise indicated.

77
CHAPTER 5
DISCUSSION
Hispanics have one of the highest prevalence of T2D among all racial/ethnic
groups,274 with Hispanic women having one of the highest T2D incidence.275 These
disparities in diabetes suggest that different lifestyle behaviors, including but not limited
to diet quality, may be relevant contributing factors.275 Hispanic women have a greater
risk of obesity and overweight than white women.210 In addition, Hispanic women eat
more energy with greater proportion of energy from fat than white women.210 The study
of distinct dietary patterns and their association with diabetes could provide evidence of
dietary traits that should be modified or reinforced among Hispanic women with the aim
of controlling and preventing T2D. Because the prevalence of Metabolic Syndrome and
T2D among Hispanics is overwhelming, there is a need for characterizing the diet among
Hispanic women in order to help provide more specific dietary guidance. Thus, the
present study was designed to derive a posteriori dietary patterns among Hispanic
women in order to identify distinct dietary patterns and their association with diabetes
among Hispanic women at high risk for T2D.
5.1 Dietary Patterns
Dietary patterns among Hispanic women in the present study were diverse. Four
patterns, the “sugar and fat-laden”, “soups and starchy dishes”, the “meats and snacks”,
and “eggs and dairy” patterns were characterized by sweets, fatty foods, meat, foods high
in sodium, and foods rich in starch. Specifically, the “sugar and fat-laden” pattern had

78
high loadings of foods rich in refined carbohydrates (e.g., candy, chocolate candy, syrup,
ice cream, sugary and soft drinks), which have been considered to promote insulin
resistance.276 This pattern explained the majority of the variance in food intake, with
20.3%, from all the six meaningful derived dietary patterns. This dietary pattern was the
most relevant identified eating pattern among the sample of women in this study. The
high loadings observed in the “sugar and fat-laden” pattern indicate that individuals
adhering to this pattern include more sugary foods and high in fat products in their diets.
The following eating patterns explained smaller percentages of total variance, but
they were also meaningful and together contributed to explain almost 36% of total
variance. The “soups and starchy dishes”, “meats and snacks”, and “eggs and dairy”
patterns were characterized by high loadings of red meat, fats, and fried snacks high in
sodium, saturated fat, and cholesterol. The “beans and grains” pattern included some
foods considered to be healthy, such as legumes, nuts, seeds, soy products, fish, whole
grain bread, and 100% wheat bran cereals, but also included processed foods high in
refined carbohydrates such as white bread, biscuits, muffins, rolls, flour tortilla, and
sugar-laden cereals. Alcohol also loaded as part of the later pattern. The loadings in the
“beans and grains” pattern indicates that individuals adhering to this pattern usually
include legumes, refined grain foods, whole-wheat products, and alcohol in their diets.
Interestingly, in the present study, poultry was highly reported during dietary data
collection; however, this food item did not load on any of the meaningful dietary patterns
observed in this study. A potential explanation is that poultry reported intake was very
homogeneous among all participants.

79
Four patterns, “soups and starchy dishes”, “meats and snacks”, “eggs and dairy”, and
“beans and grains”, were considered to share characteristics with a “Western” eating
pattern. Numerous studies 63,64,218,276 have reported that “Western” type eating patterns,
usually characterized by high intakes of red meat, processed meat, refined grains,
desserts, sweets, French fries, and whole-fat dairy, associate with higher odds of coronary
heart disease independently of other lifestyle factors such as smoking and heart disease
family history, and also associate with an increased risk of Metabolic Syndrome 223 and
T2D.54,66
In this study, the “plant foods and fish” eating pattern was characterized by high
loadings of vegetable-origin foods, fiber and marine protein, and therefore, was
considered to align with a Mediterranean-like dietary pattern,277 which has been
associated with reduced risk of both total and cardiovascular mortality in diabetic
subjects.186 The latter pattern was not labeled as a Mediterranean pattern because
information regarding the use of olive oil was not collected in the current study. The
strongest loading scores for the “plant foods and fish” pattern were for vegetables and
fruits food groups. These food groupings included a great variety of vibrant orange,
yellow, red and dark green vegetables, and fruits (fresh, juice, dried), which are high in
antioxidants such as carotenoids and vitamin C, and nutrients such as potassium,
magnesium, and soluble and insoluble fiber. Increasing evidence point out the role of
nutrition in the aging process assessed by telomere length278 and it has been reported that
higher adherence to a “vegetable-rich“ dietary pattern was positively related to longer
telomeres in women.219 In addition, fish is an important source of protein, and omega-3
fatty acids, both of which have been associated with a lower likelihood of Metabolic
80
Syndrome.279 Multiple studies 177,218,219,223 have identified a type of “prudent” or
“healthy” dietary pattern, mostly characterized by high intakes of vegetables, fruits,
legumes, whole grains, fish, and poultry, which has been associated with lower risk of
diabetes 175 and coronary heart disease.280 For instance, results of a study developed in the
southwestern of the U.S. including Hispanic and non-Hispanic white women (25-79
years) reported the presence of five meaningful dietary patterns: (1) “western”, (2)
“Native Hispanic”, (3) “prudent”, (4) “Mediterranean”, and (5) “dieter” eating patterns.
The authors reported that Hispanic women reported a higher calorie intake, and a greater
proportion of energy from fat and vegetable protein, less alcohol, and less energy from
animal protein compared with non-Hispanic white women.210 These findings are in part
similar to the observed in the current study. For instance, some observed patterns aligned
with a western pattern, and other pattern would align with the prudent pattern observed in
a previous study.210 However, the previous study210 included 68 food groups, while in the
present study the analysis was limited to 19 food groups. This could limit the variety and
specificity of the dietary patterns found in the current study.
Additional studies including Mexicans have reported a diversity of eating patterns
with healthier and less healthy traits. Findings from a study including 5240 Mexican men
and women showed three dietary patterns: (1) the “prudent”, characterized by high
intakes of vegetable juices, potatoes, fresh fruits, fresh vegetables, and legumes; (2) the
“western”, which had high loadings of pastries, refined cereals, corn tortillas, and soft
drinks, and negative loads of whole cereals, seafood, and whole-milk dairy products; and
(3) the “high protein/fat”, characterized by high intakes of red meat, processed meat,
margarine, and eggs.223 Also, a study involving 15,890 Mexican adults who participated

81
in the National Health Survey 2006 in Mexico224 identified three major dietary patterns:
(1) the “refined foods and sweets”, with the highest contribution of energy coming from
alcohol, soft drinks, white bread, fast foods, sweets, and snacks; (2) the “traditional”,
which was characterized by low dietary diversity due to maize and maize foods
accounted roughly for 47% of the total energy intake; and the “diverse” pattern, whit the
highest contribution from full-fat dairy, rice, pasta, meat, poultry, eggs, saturated fat,
fruits, and vegetables.224 The findings of the present study are in agreement with the
“western” and “refined foods and sweets” of the aforementioned studies,223,224 where
sweets and soft drinks were main components of their observed dietary patterns. Soft
drinks have been reported to be main contributors to total energy intake in the Mexican
population224,281 regardless of living in the city or rural areas.224 Mexico is considered one
of the biggest per-capita consumers of soft drinks. As previously published, sweet
beverages contribute with 19.2% and 17.8% of the total daily energy among adults
between 20-59 years and 60 year and older, respectively, being caloric soda (or soft
drinks), caloric coffee/tea, and “agua fresca” the three top sources of energy intake.281
Since Mexico soft drinks intake per capita ranks second to the U.S., it is not surprising
that Mexican immigrants in the U.S. continue to follow this dietary behavior. Regardless,
it is alarming to observe that soft drinks are an important component of the sugar and fat-
laden among women at with multiple risk factors for T2D in the present study.
In a study among Mexican-Americans and using 2001-2002 NHANES, four dietary
patterns were reported: (1) “poultry and alcohol”, (2) “milk and baked products”, and (3)
“traditional Mexican diet”, and (4) “meat” patterns.222 The similarities in the dietary
patterns of the later222 and other discussed studies223 224 with the present study, such as

82
some of the characteristics of the “sugar and fat-laden” pattern, which resembles a
“Western” pattern, and the “plant foods and fish”, which aligns with the “healthful” or
“prudent” and also share characteristics with a “Mediterranean” pattern. Poultry loaded in
one of the patterns described in the previous study among Mexican-Americans.222 This is
contrary to the observed in the current study, given that poultry did not load in any of the
identified patterns. The observed in our study is supported by previous reports indicating
that Mexican Americans consume more red meat such as beef and processed pork
products (e.g., ham, sausage, hot dogs) than poultry.282
Studies among Hispanics have shown a mix of dietary patterns. For instance, the
Bronx A1c study, which included Puerto Rican and Dominican individuals identified five
dietary patterns: (1) “fruit and vegetables”, with high loadings of fresh fruits, non-starchy
vegetables, and fish; (2) “pizza and sweets”, with high loadings of pizza, cakes, donuts
and candy; (3) “fried foods”, with high loadings of French fries and fried chicken; (4)
“Caribbean starch”, with high loadings of rice, beans and starchy vegetables (e.g., yucca
and plantains); and (5) “meats”, characterized by high loadings of eggs, processed meats,
and cultural meats (e.g., goat).218 Interestingly, a different study involving also Puerto
Ricans, the Boston Puerto Rican Health Study (BPRHS), only found three meaningful
dietary patterns: (1) “meat and French fries”, (2) a “traditional”, (3) and a “sweets” eating
patterns.221 Puerto Rican and Mexican traditional foods can be different. For instance, a
traditional Puerto Rican diet usually include fried foods, corn oil, rice, and legumes;
while a traditional Mexican pattern usually include tortillas, tacos, sweet drinks, and
legumes.283 Although it has been a common practice to study Hispanic/Latino population
as a whole, it has been suggested there are important differences within Hispanic/Latino

83
backgrounds. For instance, substantial particularities in diet and food preferences have
been noted, which were suggested to interact with other factors that influence health
behaviors including eating patterns.284 This is potentially reflected in the variety of
dietary patterns observed among Puerto Ricans, Mexicans, and Mexican Americans. In
addition, discrepancies may be due to the questionnaires used to assess dietary intake,
which potentially add heterogeneity to the number of food groups and items in each food
group, leading to a variety of results.
Results from the current study showed more diverse dietary patterns than those
reported in other studies. This diversity is potentially explained by the different degree of
acculturation among women included in this study. Also, it is also possible that even
within Mexican Americans there are differences in diet behaviors depending on some
factors reported to affect dietary behavior such as environment, access to health care,
food insecurity, socioeconomic status, nutritional beliefs,285 lack of knowledge, and
sociocultural norms.286
5.2 Associations of Dietary Patterns with Risk Factors
In this study, the higher number of eating patterns high in meat, foods rich in sugar,
high-fat foods, and high in sodium food items among Hispanic women is of a high
concern because they are at increased high risk or have a formal T2D diagnosis, and one
would expect these women to be adhering to a healthy eating pattern. Multiple studies
have reported associations between unhealthy dietary patterns and metabolic risk
factors.177,222,287 Considering that less healthy dietary patterns are characterized by high
intakes of sugar, fat, saturated fat, sodium, refined grains and highly processed meat

84
foods, all of which have been repeatedly associated with T2D risk, it was expected to find
significant associations between the dietary patterns with unhealthier traits, as well as
finding potentially negative associations between dietary patterns with healthier traits and
T2D risk factors. In the present study, the “sugar and fat-laden” and the “meats and
snacks” dietary patterns were negatively associated with age. In addition, the “plant foods
and fish” pattern was associated with fasting blood glucose. Also, a weak association
approximate to significance was observed between the “plant foods & fish” pattern and
HbA1c.
Interestingly, neither of the eating patterns with characteristics detrimental for health
showed significant associations nor approached significant associations with BMI, waist
circumference, and HbA1c. Failure to find significant associations between the “meats
and snacks”, “sugar and fat-laden”, “soups and starchy dishes”, “beans and grains”, and
“egg and dairy” dietary patterns with other diabetes risk factors including BMI, HbA1c,
and waist circumference in the present study may be explained by multiple factors. First,
the study may be underpowered to detect differences in risk factors across the identified
dietary patterns because all participants were at risk for or had T2D, and no healthy
individuals were included. Second, the sample was homogeneous in sociodemographic
characteristics, since all the participants were primarily low-income, first generation
immigrants, with low literacy. Third, lack of more significant associations of the former
five eating patterns with risk factors may be related to the methodology used to collect
dietary information, which has the potential of under and over reporting nutrient intake.
For instance, rates of underreporting dietary intakes among Mexican and Mexican
American women has been reported to range from 12% to 81.3%.288 Also, overweight

85
and obese weight statuses were reported to be correlates to underreporting dietary intakes.
The predominant obesity status and the relatively low-calorie intake level among
participants in this study supports this limitation. Fourth, it may be suggested there are
other protective factors that potentially attenuate these associations. For instance, first
generation Mexican immigrants are believed to adhere more to their culture than second-
generation Mexicans, whose diet may be influenced by the American culture.69 It also has
been documented that after one generation in the U.S., the influence of the traditional
Mexican diet is lost.69 Measures of acculturation were not included in the present study;
thus, it is not possible to assess how acculturation affected associations of dietary patterns
with diabetes risk factors in the current study.
Interestingly, in the present study, fasting blood glucose was only associated with the
“plant foods and fish”, which was considered a dietary pattern with healthy traits given
that its highest score loadings were for food groups such as vegetables, fruits, legumes,
and fish. If significant, this association was expected to be negative. The reasons for this
association are not clear but a potential explanation is that women with high fasting blood
glucose may be attempting to adhere more to a pattern rich in fiber and good quality
protein. Furthermore, the possibility that participants may have over reported intake of
vegetables and fruits cannot be ruled out. Over reporting of vegetables and fruits is well
documented in the literature, particularly among individuals with a diagnosis of or at risk
for diabetes, or who have received nutritional counseling in the past may be subject to
social desirability bias reporting higher intakes of foods perceived as healthful.289 Also, it
could be speculated that high amounts of fruit, especially fruit juice, could have an
impact on glucose control. It has been previously reported that while increased intake of

86
whole fruit is associated with lower diabetes risk, an increase in fruit juice is associated
with greater risk.135 Also, it is possible that other factors such as lack of physical activity
and/or overweight/obese status moderate this relationship. Measures of physical activity
were not included in the analysis for the present study, but since the effects of diet and
exercise combined are associated with a decrease in the incidence of T2D among those
with impaired glucose,290 it could be speculated that glucose response to a dietary pattern
rich in fruit may be affected by sedentary behavior. Furthermore, obesity and the
concomitant insulin resistance usually present among subjects with abdominal adiposity
as reported previously by multiple studies,291 292,293 has the potential to affect glucose
response to a dietary pattern with healthy rich in healthy foods. Also, a weak association
approximate to significance was observed between the “plant foods & fish” pattern and
HbA1c. This result, as well as the significant association of the later pattern with fasting
blood glucose was contrary to the expected, due to the pattern showed high loads of
vegetables, fruits, and fish; all of them are characteristic of healthy diets.
Studies exploring associations of dietary patterns with risk factors have shown mixed
results. Findings of a study including a multiethnic sample of 514 women (Caucasian,
Chinese, Japanese, native Hawaiian and other) suggested that at increasing age, women
were less likely to eat according to a “meat” pattern, and more likely to adopt a
“vegetable” pattern.220 This finding aligns with the observed in the present study. An
inverse association between age and the “meats and snacks” pattern suggest that younger
women would adhere more to this pattern. In addition, a negative association between the
“sugar and fat-laden” pattern with age was observed. These negative associations of two
eating patterns high in sugar, meat, and snacks high in sodium with age suggest that

87
younger women may adhere more to these eating patterns. This association is potentially
explained by the resemblance between dietary behaviors of adolescents and young adults,
which has been reported to include high amounts of mixed foods containing meat (e.g.
cheeseburgers, pizza), sweet beverages, and snacks rich in sodium.294 Thus, it is possible
that younger women may still be adhering to a pattern characteristic of adolescents in
transition to adulthood.294 Also, it could be possible that older women in this study may
be aware of their health conditions such as excess of weight, and T2D, which would
motivate them to include meat less frequently.
Results from the Boston Puerto Rican Health Study, suggested that a “meat and
French fries” pattern was associated with higher blood pressure and waist circumference,
a “traditional” pattern was associated with lower HDL-cholesterol and a higher likelihood
of Metabolic Syndrome, and a “sweets” pattern was associated with lower HDL-
cholesterolconcentrations and higher waist circumference.221 However, after exclusion of
subjects with diabetes, the sweets pattern was no longer associated with Metabolic
Syndrome.221 Further reports derived from the Boston Puerto Rican Health Study
(n=1117) assessing associations of the three dietary patterns (“meat and French fries”,
“traditional”, and “sweets”) with a composite measure of physiological dysregulation
termed “allostatic load” showed that participants in the highest quintile of the “meat and
French fries” pattern was significantly associated with higher allostatic load score than
participants in the lowest quintile of the pattern.287 A study among Mexican men and
women (n=5240) showed that a “Western” pattern with high intakes of calories from
tortillas, tacos, and sugary beverages was associated with higher risk of Metabolic
Syndrome.223 In contrast, results of a study among Mexican-Americans using 2001-2002

88
NHANES data did not find significant associations between the unhealthy dietary
patterns identified (“poultry and alcohol”, “milk and baked products”, “traditional
Mexican diet”, and “meat”) and BMI or obesity.222 In the present study, the “sugar and
fat-laden” and the “meats and snacks” dietary patterns were negatively associated with
age, and the “plant foods and fish” was associated with fasting blood glucose. These
mixed results of associations with metabolic risk factors among Puerto Ricans, Mexican
Americans, and Mexicans are in agreement with the previously reported marked variation
in eating patterns and risk factors by Hispanic background.
5.3 Strengths and Limitations
It is important to note the strengths and limitations of this study. The homogeneity
of the sample, composed primarily by low-income overweight/obese Mexican-women,
reflects fairly closely the makeup of the Hispanic population attending the community
clinic where the study took place. Also, the use of trained interviewers minimized error
reporting and missing data, and the use of a previously validated food frequency
questionnaire among the Hispanic population increased the likelihood of capturing
measures closer to the participant’s diets. The type of analysis used to the derived dietary
patterns make no a priori assumptions and it is independent of definitions of what is a
healthy pattern, which allows finding as many meaningful patterns as possible.
The limitations of this study include the cross-sectional nature of the analysis,
which does not allow arguing causation. Another limitation is the homogeneity of the
sample, that although was also considered strength, it could also limit external validity
because the sample cannot be considered representative of the Mexican-American adult
89
population as a whole, or of the U.S. population. Furthermore, the sample may be
underpowered to detect significant associations between risk factors and dietary patterns
due to all participants were at increased risk T2D.
A limitation of using a food frequency questionnaire to collect dietary data is the
measurement error associated with self-reported dietary data, which would be transferred
to the derived dietary patterns. This might be even more emphasized because correlations
in measurement error might disfigure the definition of the patterns, and this can lead to
making associations between diets and risk factors weaker and/or non-significant. An
example of this scenario would be if participants in a study systematically underestimate
their consumption of unhealthy foods.214 For instance, sometimes participants may think
of some snack food as “not counting as foods”, but even when the sum of all these foods
throughout the day would contribute significantly to the total daily energy and nutrient
intake.295 The SWFFQ was created to capture the diet of the southwestern part of the
U.S., and foods included are characteristic of the north part of Mexico (e.g., dried beef or
“machaca”); thus, some important food items for participants from the south part of
Mexico may have not been properly captured. FFQs developed and validated for a
specific population may leave out some important food items that are culturally-
appropriate for other culturally-diverse populations.296
The SWFFQ did not record how food was cooked. Therefore, it is possible that
for instance, the intake of fish reported was fried fish instead of using healthier cooking
procedures such as baked or steamed fish. One tool to assess diet that capture more
information is a computerized interviewer-administered diet history questionnaire. The
question order differs from the FFQ in that participants are first asked whether they ate

90
food such as fish., a response of yes for the food leads to the participants choosing in
which preparation they ate fish (e.g., baked, fried, grilled), then frequency of
consumption, and finally three different portion sizes.210 This type of questionnaire may
potentially provide more insights of food preparation, and more accurate way to describe
diet preferences and dietary patterns among populations. Last, there is potential for
limited reproducibility of this study; due to exploratory factor analysis relying on
multiple subjective decisions. For instance, researchers need to make decisions on the
number of meaningful eating patterns to retain assisted with the scree plot and
eigenvalues or variance explained by each eating pattern. Also, there are multiple
rotations that can be used to make the solution more interpretable. Another subjective
decision is the cutoff point chosen to retain item loadings, which can vary based on the
sample size; that is, in studies with larger sample sizes the cutoff could be less
conservative and allow to use a lower cutoff point (e.g., ≥ 0.20) as opposed to studies
with smaller sample sizes, which usually chose a more conservative cutoff point (e.g., ≥
0.30). For all these reasons, the possibility cannot be ruled out that a different team could
find different results using the same dietary data.
5.4 Future Research
The current study was conducted to assess dietary patterns among Hispanic women
and their associations with diabetes risk factors. There is a need for more studies
including healthy and at-risk Hispanic women with larger samples to determine how
dietary patterns differ among women with and without risk for T2D. Further studies

91
should also include more information regarding acculturation, physical activity, and
previous knowledge about diet for T2D to control for potential confounders. This would
help understanding dietary choices and potential factors affecting these choices.
92
CHAPTER 6
CONCLUSION
Research about diet among Hispanic women at high risk for T2D is a growing need,
as T2D continue to be the 6th leading cause of mortality in the U.S. Study of potential
protective traits of Hispanics’ dietary patterns are important to understand what healthy
key components of their diets should be reinforced and which ones should be changed to
decrease their diabetes risk.
The present study was designed to evaluate dietary patterns among overweight/obese
Hispanic women with or at high risk for T2D. Participants of this study were Hispanic,
predominantly of Mexican descent, and previous studies have shown mixed results of
dietary patterns among this set of the population living in the U.S. The primary aim of
this study was to derive dietary patterns using an a posteriori approach. To our
knowledge, this is the first study assessing dietary patterns among Hispanic women, with
predominant Mexican background, and with multiple diabetes risk factors. Additionally,
associations of dietary patterns with diabetes risk factors including BMI, waist
circumference, fasting blood glucose, and HbA1c were assessed.
The findings of this study showed the presence of a variety of dietary patterns in a
homogeneous sample of overweight/obese Hispanic women. Although food items
considered as healthful loaded in multiple patterns, the predominance of dietary patterns
characterized by foods rich in sugar, rich in fat, and high in sodium is alarming given
these women are at increased risk or have a formal T2D diagnosis. The implications for
this is that women at risk adhering to less healthier dietary patterns may be increasing
their likelihood for T2D and/or T2D complications. This finding would justify increasing

93
awareness and adherence to healthier dietary patterns as a path to decrease the metabolic
risk among these women. Significant negative associations of two eating patterns high in
sugar, meat, and snacks high in sodium with age suggest that younger women may adhere
more to these eating patterns. This highlights the importance of assessing dietary patterns
among younger adults to identify dietary traits detrimental for their health in the long run.
Furthermore, an association between fasting blood glucose with an eating pattern rich in
legumes and refined grain and whole-wheat foods may suggest that women with
abnormal glucose are potentially attempting to adhere to an eating pattern with healthier
traits. Lack of associations of BMI, waist circumference, and HbA1c with the eating
patterns rich in meat, sugary foods, foods rich in fat, and snacks high in sodium may be
related to sample size, study design, and the inclusion of only women at increased risk for
T2D.

94
REFERENCES
1. American Diabetes A. (2) Classification and diagnosis of diabetes. Diabetes Care.
2015;38 Suppl:S8-S16.
2. Association AD. 2. Classification and diagnosis of diabetes. Diabetes Care.
2016;39(Supplement 1):S13-S22.
3. Control CfD, Prevention. National diabetes statistics report: estimates of diabetes
and its burden in the United States, 2014. Atlanta, GA: US Department of Health
and Human Services. 2014;2014.
4. Zhuo X, Zhang P, Hoerger TJ. Lifetime direct medical costs of treating type 2
diabetes and diabetic complications. American Journal of Preventive Medicine.
2013;45(3):253-261.
5. Carper MM, Traeger L, Gonzalez JS, Wexler DJ, Psaros C, Safren SA. The
differential associations of depression and diabetes distress with quality of life
domains in type 2 diabetes. Journal of Behavioral Medicine. 2014;37(3):501-510.
6. Lindström J, Ilanne-Parikka P, Peltonen M, et al. Sustained reduction in the
incidence of type 2 diabetes by lifestyle intervention: follow-up of the Finnish
Diabetes Prevention Study. The Lancet. 2006;368(9548):1673-1679.
7. Salas-Salvado J, Martinez-Gonzalez MA, Bullo M, Ros E. The role of diet in the
prevention of type 2 diabetes. Nutrition, Metabolism, and Cardiovascular
Diseases. 2011;21 Suppl 2:B32-48.
8. Schulze MB, Schulz M, Heidemann C, Schienkiewitz A, Hoffmann K, Boeing H.
Fiber and magnesium intake and incidence of type 2 diabetes: a prospective study
and meta-analysis. Archives of Internal Medicine. 2007;167(9):956-965.
9. Pittas AG, Dawson-Hughes B. Vitamin D and diabetes. The Journal of Steroid
Biochemistry and Molecular Biology. 2010;121(1):425-429.
10. Yoshida M, Booth SL, Meigs JB, Saltzman E, Jacques PF. Phylloquinone intake,
insulin sensitivity, and glycemic status in men and women. The American Journal
of Clinical Nutrition. 2008;88(1):210-215.

95
11. Krachler B, Norberg M, Eriksson JW, et al. Fatty acid profile of the erythrocyte
membrane preceding development of Type 2 diabetes mellitus. Nutrition,
Metabolism and Cardiovascular Diseases. 2008;18(7):503-510.
12. Carter-Pokras O, Baquet C. What is a" health disparity"? Public Health Reports.
2002;117(5):426.
13. Golden SH, Brown A, Cauley JA, et al. Health disparities in endocrine disorders:
biological, clinical, and nonclinical factors—an Endocrine Society scientific
statement. The Journal of Clinical Endocrinology & Metabolism.
2012;97(9):E1579-E1639.
14. López L, Golden SH. A new era in understanding diabetes disparities among US
Latinos—all are not equal. Diabetes Care. 2014;37(8):2081-2083.
15. Borrell LN, Crawford ND, Dallo FJ, Baquero MC. Self-reported diabetes in
Hispanic subgroup, non-Hispanic black, and non-Hispanic white populations:
National Health Interview Survey, 1997–2005. Public Health Reports.
2009;124(5):702-710.
16. Hu FB, Stampfer MJ, Haffner SM, Solomon CG, Willett WC, Manson JE.
Elevated risk of cardiovascular disease prior to clinical diagnosis of type 2
diabetes. Diabetes Care. 2002;25(7):1129-1134.
17. Organization WH. Cardiovascular Diseases (CVDs). World Health Organization
2017; http://www.who.int/mediacentre/factsheets/fs317/en/.
18. Palloni A, Arias E. Paradox lost: explaining the Hispanic adult mortality
advantage. Demography. 2004;41(3):385-415.
19. Johnson A, Mercer C, Cassell J. Social determinants of health. 2006.
20. Dominguez K, Penman-Aguilar A, Chang M-H, et al. Vital signs: leading causes
of death, prevalence of diseases and risk factors, and use of health services among
Hispanics in the United States—2009–2013. MMWR: Morbidity and Mortality
Weekly Report. 2015;64(17):469-478.

96
21. MEMBERS WG, Go AS, Mozaffarian D, et al. Heart disease and stroke
statistics—2014 update: a report from the American Heart Association.
Circulation. 2014;129(3):e28.
22. Morales L, Leng M, Escarce J. Risk of cardiovascular disease in first and second
generation Mexican-Americans. Journal of Immigrant and Minority Health.
2011;13(1):61-68.
23. Daviglus ML, Talavera GA, Avilés-Santa ML, et al. Prevalence of major
cardiovascular risk factors and cardiovascular diseases among Hispanic/Latino
individuals of diverse backgrounds in the United States. JAMA.
2012;308(17):1775-1784.
24. Huxley R, Barzi F, Woodward M. Excess risk of fatal coronary heart disease
associated with diabetes in men and women: meta-analysis of 37 prospective
cohort studies. BMJ. 2006;332(7533):73-78.
25. Ollila M-M, West S, Keinänen-Kiukaanniemi S, et al. Overweight and obese but
not normal weight women with PCOS are at increased risk of Type 2 diabetes
mellitus—a prospective, population-based cohort study. Human Reproduction.
2017;32(2):423-431.
26. Tok EC, Ertunc D, Evruke C, Dilek S. The androgenic profile of women with
non-insulin-dependent diabetes mellitus. The Journal of Reproductive Medicine.
2004;49(9):746-752.
27. Pitteloud N, Mootha VK, Dwyer AA, et al. Relationship between testosterone
levels, insulin sensitivity, and mitochondrial function in men. Diabetes Care.
2005;28(7):1636-1642.
28. Oh J-Y, Barrett-Connor E, Wedick NM, Wingard DL. Endogenous sex hormones
and the development of type 2 diabetes in older men and women: the Rancho
Bernardo study. Diabetes Care. 2002;25(1):55-60.
29. Christodoulakos G, Lambrinoudaki I, Panoulis C, et al. Serum androgen levels
and insulin resistance in postmenopausal women: association with hormone
therapy, tibolone and raloxifene. Maturitas. 2005;50(4):321-330.

97
30. Ding EL, Song Y, Malik VS, Liu S. Sex differences of endogenous sex hormones
and risk of type 2 diabetes: a systematic review and meta-analysis. JAMA.
2006;295(11):1288-1299.
31. Lira Neto JC, Xavier MA, Borges JW, Araujo MF, Damasceno MM, Freitas RW.
Prevalence of Metabolic Syndrome in individuals with Type 2 Diabetes Mellitus.
Revista Brasileira de Enfermagem. 2017;70(2):265-270.
32. Wilson PW, D'Agostino RB, Parise H, Sullivan L, Meigs JB. Metabolic
Syndrome as a precursor of cardiovascular disease and type 2 diabetes mellitus.
Circulation. 2005;112(20):3066-3072.
33. Grundy SM, Brewer HB, Cleeman JI, Smith SC, Lenfant C. Definition of
Metabolic Syndrome. Circulation. 2004;109(3):433-438.
34. Moore JX, Chaudhary N, Akinyemiju T. Metabolic Syndrome Prevalence by
Race/Ethnicity and Sex in the United States, National Health and Nutrition
Examination Survey, 1988-2012. Preventing Chronic Disease. 2017;14:E24.
35. Friend A, Craig L, Turner S. The prevalence of Metabolic Syndrome in children–
a systematic review. Archives of Disease in Childhood. 2012;97(Suppl 1):A116-
A117.
36. Miller JM, Kaylor MB, Johannsson M, Bay C, Churilla JR. Prevalence of
Metabolic Syndrome and individual criterion in US adolescents: 2001–2010
National Health and Nutrition Examination Survey. Metabolic Syndrome and
Related Disorders. 2014;12(10):527-532.
37. Ervin RB. Prevalence of Metabolic Syndrome among adults 20 years of age and
over, by sex, age, race and ethnicity, and body mass index: United States.
National Health Statistics Reports. 2009;13:1-8.
38. Pucci G, Alcidi R, Tap L, Battista F, Mattace-Raso F, Schillaci G. Sex- and
gender-related prevalence, cardiovascular risk and therapeutic approach in
Metabolic Syndrome: A review of the literature. Pharmacological Research.
2017;120:34-42.
39. Palmer N, Langefeld C, Ziegler J, et al. Candidate loci for insulin sensitivity and
disposition index from a genome-wide association analysis of Hispanic

98
participants in the Insulin Resistance Atherosclerosis (IRAS) Family Study.
Diabetologia. 2010;53(2):281.
40. Cusi K, Ocampo GL. Unmet needs in Hispanic/Latino patients with type 2
diabetes mellitus. American Journal of Medicine. 2011;124(10 Suppl):S2-9.
41. Cowie CC, Rust KF, Ford ES, et al. Full accounting of diabetes and pre-diabetes
in the US population in 1988–1994 and 2005–2006. Diabetes Care.
2009;32(2):287-294.
42. Grundy SM. Metabolic Syndrome update. Trends in Cardiovascular Medicine.
2016;26(4):364-373.
43. Grundy SM. Pre-diabetes, Metabolic Syndrome, and cardiovascular risk. Journal
of the American College of Cardiology. 2012;59(7):635-643.
44. Cusi K. The role of adipose tissue and lipotoxicity in the pathogenesis of type 2
diabetes. Current Diabetes Reports. 2010;10(4):306-315.
45. Poitout V, Robertson RP. Glucolipotoxicity: fuel excess and β-cell dysfunction.
Endocrine Reviews. 2007;29(3):351-366.
46. Unger RH, Zhou Y-T. Lipotoxicity of beta-cells in obesity and in other causes of
fatty acid spillover. Diabetes. 2001;50(suppl 1):S118.
47. Wu L, Parhofer KG. Diabetic dyslipidemia. Metabolism-Clinical and
Experimental. 2014;63(12):1469-1479.
48. Akita EF, Iwahashi H, Okauchi Y, et al. Predictors of deterioration of glucose
tolerance and effects of lifestyle intervention aimed at reducing visceral fat in
normal glucose tolerance subjects with abdominal obesity. J Diabetes Investig.
2011;2(3):218-224.
49. Feldeisen SE, Tucker KL. Nutritional strategies in the prevention and treatment of
Metabolic Syndrome. Applied Physiology, Nutrition, and Metabolism.
2007;32(1):46-60.

99
50. Dixit VD. Adipose-immune interactions during obesity and caloric restriction:
reciprocal mechanisms regulating immunity and health span. Journal of
Leukocyte Biology. 2008;84(4):882-892.
51. Melanson KJ, Summers A, Nguyen V, et al. Body composition, dietary
composition, and components of Metabolic Syndrome in overweight and obese
adults after a 12-week trial on dietary treatments focused on portion control,
energy density, or glycemic index. Nutrition Journal. 2012;11(1):57.
52. Shai I, Schwarzfuchs D, Henkin Y, et al. Weight loss with a low-carbohydrate,
Mediterranean, or low-fat diet. New England Journal of Medicine.
2008;2008(359):229-241.
53. Organization WH. Global health risks: mortality and burden of disease
attributable to selected major risks. World Health Organization; 2009.
54. McEvoy CT, Cardwell CR, Woodside JV, Young IS, Hunter SJ, McKinley MC.
A posteriori dietary patterns are related to risk of type 2 diabetes: findings from a
systematic review and meta-analysis. Journal of the Academy of Nutrition and
Dietetics. 2014;114(11):1759-1775. e1754.
55. Schwingshackl L, Hoffmann G. Diet quality as assessed by the Healthy Eating
Index, the Alternate Healthy Eating Index, the Dietary Approaches to Stop
Hypertension score, and health outcomes: a systematic review and meta-analysis
of cohort studies. Journal of the Academy of Nutrition and Dietetics.
2015;115(5):780-800 e785.
56. Montonen J, Knekt P, Järvinen R, Aromaa A, Reunanen A. Whole-grain and fiber
intake and the incidence of type 2 diabetes. The American Journal of Clinical
Nutrition. 2003;77(3):622-629.
57. Villegas R, Liu S, Gao Y-T, et al. Prospective study of dietary carbohydrates,
glycemic index, glycemic load, and incidence of type 2 diabetes mellitus in
middle-aged Chinese women. Archives of Internal Medicine. 2007;167(21):2310-
2316.
58. Malik VS, Popkin BM, Bray GA, Després J-P, Willett WC, Hu FB. Sugar-
sweetened beverages and risk of Metabolic Syndrome and type 2 diabetes.
Diabetes Care. 2010;33(11):2477-2483.

100
59. Hu FB. Dietary pattern analysis: a new direction in nutritional epidemiology.
Current Opinion in Lipidology. 2002;13(1):3-9.
60. Wirt A, Collins CE. Diet quality–what is it and does it matter? Public Health
Nutrition. 2009;12(12):2473-2492.
61. Jacques PF, Tucker KL. Are dietary patterns useful for understanding the role of
diet in chronic disease? The American Journal of Clinical Nutrition.
2001;73(1):1-2.
62. Health UDo, Services H. 2015–2020 dietary guidelines for Americans.
Washington (DC): USDA. 2015.
63. Montonen J, Knekt P, Härkänen T, et al. Dietary patterns and the incidence of
type 2 diabetes. American Journal of Epidemiology. 2005;161(3):219-227.
64. Qi L, Cornelis MC, Zhang C, van Dam RM, Hu FB. Genetic predisposition,
Western dietary pattern, and the risk of type 2 diabetes in men. The American
Journal of Clinical Nutrition. 2009:ajcn. 27249.
65. Smith AD, Emmett PM, Newby P, Northstone K. Dietary patterns obtained
through principal components analysis: the effect of input variable quantification.
British Journal of Nutrition. 2013;109(10):1881-1891.
66. Alhazmi A, Stojanovski E, McEvoy M, Garg ML. The association between
dietary patterns and type 2 diabetes: a systematic review and meta-analysis of
cohort studies. Journal of Human Nutrition and Dietetics. 2014;27(3):251-260.
67. Vernarelli JA, Mitchell DC, Rolls BJ, Hartman TJ. Dietary energy density is
associated with obesity and other biomarkers of chronic disease in US adults.
European Journal of Nutrition. 2015;54(1):59-65.
68. Sofianou A, Fung TT, Tucker KL. Differences in diet pattern adherence by
nativity and duration of US residence in the Mexican-American population.
Journal of the American Dietetic Association. 2011;111(10):1563-1569. e1562.

101
69. Batis C, Hernandez-Barrera L, Barquera S, Rivera JA, Popkin BM. Food
acculturation drives dietary differences among Mexicans, Mexican Americans,
and non-Hispanic whites. The Journal of Nutrition. 2011;141(10):1898-1906.
70. Siu AL. Screening for Iron Deficiency Anemia and Iron Supplementation in
Pregnant Women to Improve Maternal Health and Birth Outcomes: US
Preventive Services Task Force Recommendation StatementScreening for Iron
Deficiency Anemia and Iron Supplementation. Annals of Internal Medicine.
2015;163(7):529-536.
71. Farrag SE, Dwivedi AK, Otoukesh S, Badri NJ, Sanchez LA, Nahleh ZA.
Prevalence of Low Vitamin D in Patients with Breast Cancer in a Predominantly
Hispanic Population at the American-Mexican Border. Nutrition and Cancer.
2017;69(6):819-824.
72. Flood A, Rastogi T, Wirfält E, et al. Dietary patterns as identified by factor
analysis and colorectal cancer among middle-aged Americans. The American
Journal of Clinical Nutrition. 2008;88(1):176-184.
73. Mottillo S, Filion KB, Genest J, et al. The Metabolic Syndrome and
cardiovascular risk a systematic review and meta-analysis. Journal of the
American College of Cardiology. 2010;56(14):1113-1132.
74. Borena W, Strohmaier S, Lukanova A, et al. Metabolic risk factors and primary
liver cancer in a prospective study of 578,700 adults. International Journal of
Cancer. 2012;131(1):193-200.
75. Stocks T, Bjorge T, Ulmer H, et al. Metabolic risk score and cancer risk: pooled
analysis of seven cohorts. International Journal of Epidemiology.
2015;44(4):1353-1363.
76. Aguilar M, Bhuket T, Torres S, Liu B, Wong RJ. Prevalence of the Metabolic
Syndrome in the United States, 2003-2012. JAMA. 2015;313(19):1973-1974.
77. Bansal N. Prediabetes diagnosis and treatment: A review. World Journal of
Diabetes. 2015;6(2):296.
78. Association AD. Standards of medical care in diabetes—2017 abridged for
primary care providers. Clinical Diabetes. 2017;35(1):5-26.
102
79. Sacks DB. A1C versus glucose testing: a comparison. Diabetes Care.
2011;34(2):518-523.
80. Inzucchi SE. Diagnosis of diabetes. The New England Journal of Medicine.
2013;368(2):193.
81. Wallum B, Kahn S, McCulloch D, Porte D. Insulin secretion in the normal and
diabetic human. International Textbook of Diabetes Mellitus Alberti KGMM,
DeFronzo RA, Keen H, Zimmet P, Eds Chichester, UK, John Wiley and Sons.
1992:285-301.
82. Aronoff SL, Berkowitz K, Shreiner B, Want L. Glucose metabolism and
regulation: beyond insulin and glucagon. Diabetes Spectrum. 2004;17(3):183-190.
83. Drucker DJ. Minireview: the glucagon-like peptides. Endocrinology.
2001;142(2):521-527.
84. Koda J, Fineman M, Rink T, Dailey G, Muchmore D, Linarelli L. Amylin
concentrations and glucose control. The Lancet. 1992;339(8802):1179-1180.
85. Lugari R, Dei Cas A, Ugolotti D, et al. Evidence for early impairment of
glucagon-like peptide 1-induced insulin secretion in human type 2 (non insulin-
dependent) diabetes. Hormone and Metabolic Research. 2002;34(03):150-154.
86. Dinneen S, Gerich J, Rizza R. Carbohydrate metabolism in non-insulin-dependent
diabetes mellitus. New England Journal of Medicine. 1992;327(10):707-713.
87. Selvin E, Steffes MW, Gregg E, Brancati FL, Coresh J. Performance of A1C for
the classification and prediction of diabetes. Diabetes Care. 2011;34(1):84-89.
88. Zhang X, Gregg EW, Williamson DF, et al. A1C level and future risk of diabetes:
a systematic review. Diabetes Care. 2010;33(7):1665-1673.
89. Cowie CC, Rust KF, Byrd-Holt DD, et al. Prevalence of diabetes and high risk for
diabetes using A1C criteria in the US population in 1988–2006. Diabetes Care.
2010;33(3):562-568.

103
90. Menke A, Rust KF, Savage PJ, Cowie CC. Hemoglobin A1c, fasting plasma
glucose, and 2-hour plasma glucose distributions in US population subgroups:
NHANES 2005–2010. Annals of Epidemiology. 2014;24(2):83-89.
91. Okosun IS, Davis‐Smith M, Paul Seale J, Ngulefac J. Applicability of a
combination of hemoglobin A1c and fasting plasma glucose in population‐based
prediabetes screening. Journal of Diabetes. 2012;4(4):407-416.
92. Avilés-Santa ML, Pérez CM, Schneiderman N, et al. Detecting prediabetes among
Hispanics/Latinos from diverse heritage groups: Does the test matter? Findings
from the Hispanic Community Health Study/Study of Latinos. Preventive
Medicine. 2017;95:110-118.
93. Khazrai YM, Defeudis G, Pozzilli P. Effect of diet on type 2 diabetes mellitus: a
review. Diabetes/Metabolism Research and Reviews. 2014;30 Suppl 1:24-33.
94. Toft-Nielsen M-B, Damholt MB, Madsbad S, et al. Determinants of the impaired
secretion of glucagon-like peptide-1 in type 2 diabetic patients. The Journal of
Clinical Endocrinology & Metabolism. 2001;86(8):3717-3723.
95. Cersosimo E, Triplitt C, Mandarino LJ, DeFronzo RA. Pathogenesis of type 2
diabetes mellitus. 2015.
96. Groop LC, Bonadonna RC, DelPrato S, et al. Glucose and free fatty acid
metabolism in non-insulin-dependent diabetes mellitus. Evidence for multiple
sites of insulin resistance. Journal of Clinical Investigation. 1989;84(1):205.
97. Björntorp P. Metabolic implications of body fat distribution. Diabetes Care.
1991;14(12):1132-1143.
98. Saltiel AR, Kahn CR. Insulin signalling and the regulation of glucose and lipid
metabolism. Nature. 2001;414(6865):799-806.
99. Ajala O, English P, Pinkney J. Systematic review and meta-analysis of different
dietary approaches to the management of type 2 diabetes. American Journal of
Clinical Nutrition. 2013;97(3):505-516.

104
100. Lindström J, Louheranta A, Mannelin M, et al. The Finnish Diabetes Prevention
Study (DPS): Lifestyle intervention and 3-year results on diet and physical
activity. Diabetes Care. 2003;26(12):3230-3236.
101. Knowler W, Barrett-Connor E, Fowler S, et al. Reduction in the incidence of type
2 diabetes with lifestyle intervention or metformin. Scandinavian Journal of
Medicine & Science in Sports. 2003;13(3):208.
102. Tuomilehto J, Lindström J, Eriksson JG, et al. Prevention of type 2 diabetes
mellitus by changes in lifestyle among subjects with impaired glucose tolerance.
New England Journal of Medicine. 2001;344(18):1343-1350.
103. Group DPPR. 10-year follow-up of diabetes incidence and weight loss in the
Diabetes Prevention Program Outcomes Study. The Lancet.
2009;374(9702):1677-1686.
104. Wheeler ML. Cycles: Diabetes nutrition recommendations--past, present, and
future. Diabetes Spectrum. 2000;13(3):116.
105. Day C, Bailey CJ. The hypocaloric diet in type 2 diabetes-déjà vu. The British
Journal of Diabetes & Vascular Disease. 2012;12(1):48-51.
106. Sawyer L, Gale E. Diet, delusion and diabetes. Diabetologia. 2009;52(1):1-7.
107. Kim S. Measurement of insulin action: a tribute to Sir Harold Himsworth.
Diabetic Medicine. 2011;28(12):1487-1493.
108. Group DPPR. The diabetes prevention program (DPP). Diabetes Care.
2002;25(12):2165-2171.
109. Evert AB, Boucher JL, Cypress M, et al. Nutrition therapy recommendations for
the management of adults with diabetes. Diabetes Care. 2014;37 Suppl 1:S120-
143.
110. Association AD. 4. Lifestyle Management: Standards of Medical Care in
Diabetes—2018. Diabetes Care. 2018;41(Supplement 1):S38-S50.

105
111. Inzucchi SE, Bergenstal RM, Buse JB, et al. Management of hyperglycaemia in
type 2 diabetes, 2015: a patient-centred approach. Update to a position statement
of the American Diabetes Association and the European Association for the Study
of Diabetes. Diabetologia. 2015;58(3):429-442.
112. Scavone G, Manto A, Pitocco D, et al. Effect of carbohydrate counting and
medical nutritional therapy on glycaemic control in type 1 diabetic subjects: a
pilot study. Diabetic Medicine. 2010;27(4):477-479.
113. Coppell KJ, Kataoka M, Williams SM, Chisholm AW, Vorgers SM, Mann JI.
Nutritional intervention in patients with type 2 diabetes who are hyperglycaemic
despite optimised drug treatment—Lifestyle Over and Above Drugs in Diabetes
(LOADD) study: randomised controlled trial. BMJ. 2010;341:c3337.
114. Association AD. Standards of Medical Care in Diabetes—2014. Diabetes Care
2014; 37 (Suppl. 1): S14–S80Diagnosis and Classification of Diabetes Mellitus.
Diabetes Care 2014; 37 (Suppl. 1): S81–S90. Diabetes Care. 2014;37(3):887-887.
115. Sathananthan M, Shah M, Edens KL, et al. Six and 12 Weeks of Caloric
Restriction Increases β Cell Function and Lowers Fasting and Postprandial
Glucose Concentrations in People with Type 2 Diabetes–3. The Journal of
Nutrition. 2015;145(9):2046-2051.
116. Isbell JM, Tamboli RA, Hansen EN, et al. The importance of caloric restriction in
the early improvements in insulin sensitivity after Roux-en-Y gastric bypass
surgery. Diabetes Care. 2010;33(7):1438-1442.
117. Plum L, Ahmed L, Febres G, et al. Comparison of glucostatic parameters after
hypocaloric diet or bariatric surgery and equivalent weight loss. Obesity.
2011;19(11):2149-2157.
118. Jackness C, Karmally W, Febres G, et al. Very low–calorie diet mimics the early
beneficial effect of Roux-en-Y gastric bypass on insulin sensitivity and β-cell
function in type 2 diabetic patients. Diabetes. 2013;62(9):3027-3032.
119. Matheni S, Meera S, Kim LE, et al. Six and 12 Weeks of Caloric Restriction
Increases fl Cell Function and Lowers Fasting and Postprandial Glucose
Concentrations in People with Type 2 Diabetes123. The Journal of Nutrition.
2015;145(9):2046-2051.

106
120. Parker B, Noakes M, Luscombe N, Clifton P. Effect of a high-protein, high–
monounsaturated fat weight loss diet on glycemic control and lipid levels in type
2 diabetes. Diabetes Care. 2002;25(3):425-430.
121. Franz MJ, Powers MA, Leontos C, et al. The evidence for medical nutrition
therapy for type 1 and type 2 diabetes in adults. Journal of the American Dietetic
Association. 2010;110(12):1852-1889.
122. Gannon MC, Nuttall FQ, Saeed A, Jordan K, Hoover H. An increase in dietary
protein improves the blood glucose response in persons with type 2 diabetes. The
American Journal of Clinical Nutrition. 2003;78(4):734-741.
123. Vitolins MZ, Anderson AM, Delahanty L, et al. Action for Health in Diabetes
(Look AHEAD) trial: baseline evaluation of selected nutrients and food group
intake. Journal of the American Dietetic Association. 2009;109(8):1367-1375.
124. Oza-Frank R, Cheng YJ, Narayan KV, Gregg EW. Trends in nutrient intake
among adults with diabetes in the United States: 1988-2004. Journal of the
American Dietetic Association. 2009;109(7):1173-1178.
125. Park S-H, Lee K-S, Park H-Y. Dietary carbohydrate intake is associated with
cardiovascular disease risk in Korean: analysis of the third Korea National Health
and Nutrition Examination Survey (KNHANES III). International Journal of
Cardiology. 2010;139(3):234-240.
126. Mohan V, Radhika G, Sathya RM, Tamil SR, Ganesan A, Sudha V. Dietary
carbohydrates, glycaemic load, food groups and newly detected type 2 diabetes
among urban Asian Indian population in Chennai, India (Chennai Urban Rural
Epidemiology Study 59). British Journal of Nutrition. 2009;102(10):1498-1506.
127. Schulze MB, Schulz M, Heidemann C, Schienkiewitz A, Hoffmann K, Boeing H.
Carbohydrate intake and incidence of type 2 diabetes in the European Prospective
Investigation into Cancer and Nutrition (EPIC)-Potsdam Study. British Journal of
Nutrition. 2008;99(5):1107-1116.
128. AlEssa HB, Bhupathiraju SN, Malik VS, et al. Carbohydrate quality and quantity
and risk of type 2 diabetes in US women, 2. The American Journal of Clinical
Nutrition. 2015;102(6):1543-1553.

107
129. Jenkins D, Srichaikul K, Kendall C, et al. The relation of low glycaemic index
fruit consumption to glycaemic control and risk factors for coronary heart disease
in type 2 diabetes. Diabetologia. 2011;54(2):271-279.
130. Buyken A, Mitchell P, Ceriello A, Brand-Miller J. Optimal dietary approaches for
prevention of type 2 diabetes: a life-course perspective. Diabetologia.
2010;53(3):406-418.
131. Feinle C, O'Donovan D, Horowitz M. Carbohydrate and satiety. Nutrition
Reviews. 2002;60(6):155-169.
132. Singh GM, Micha R, Khatibzadeh S, et al. Global, regional, and national
consumption of sugar-sweetened beverages, fruit juices, and milk: a systematic
assessment of beverage intake in 187 countries. PloS One. 2015;10(8):e0124845.
133. Odegaard AO, Koh W-P, Arakawa K, Yu MC, Pereira MA. Soft drink and juice
consumption and risk of physician-diagnosed incident type 2 diabetes: the
Singapore Chinese Health Study. American Journal of Epidemiology.
2010;171(6):701-708.
134. Schulze MB, Manson JE, Ludwig DS, et al. Sugar-sweetened beverages, weight
gain, and incidence of type 2 diabetes in young and middle-aged women. JAMA.
2004;292(8):927-934.
135. Bazzano LA, Li TY, Joshipura KJ, Hu FB. Intake of fruit, vegetables, and fruit
juices and risk of diabetes in women. Diabetes Care. 2008;31(7):1311-1317.
136. De Koning L, Malik VS, Rimm EB, Willett WC, Hu FB. Sugar-sweetened and
artificially sweetened beverage consumption and risk of type 2 diabetes in men–.
The American Journal of Clinical Nutrition. 2011;93(6):1321-1327.
137. Malik VS, Popkin BM, Bray GA, Després J-P, Hu FB. Sugar-sweetened
beverages, obesity, type 2 diabetes mellitus, and cardiovascular disease risk.
Circulation. 2010;121(11):1356-1364.
138. Saris W, Astrup A, Prentice A, et al. Randomized controlled trial of changes in
dietary carbohydrate/fat ratio and simple vs complex carbohydrates on body
weight and blood lipids: the CARMEN study. International Journal of Obesity.
2000;24(10):1310.

108
139. Jenkins DJ, Kendall CW, Banach MS, et al. Nuts as a replacement for
carbohydrates in the diabetic diet. Diabetes Care. 2011;34(8):1706-1711.
140. Tay J, Luscombe-Marsh ND, Thompson CH, et al. Comparison of low-and high-
carbohydrate diets for type 2 diabetes management: a randomized trial, 4. The
American Journal of Clinical Nutrition. 2015;102(4):780-790.
141. Bueno NB, de Melo ISV, de Oliveira SL, da Rocha Ataide T. Very-low-
carbohydrate ketogenic diet v. low-fat diet for long-term weight loss: a meta-
analysis of randomised controlled trials. British Journal of Nutrition.
2013;110(7):1178-1187.
142. Clifton PM, Condo D, Keogh JB. Long term weight maintenance after advice to
consume low carbohydrate, higher protein diets–a systematic review and meta
analysis. Nutrition, Metabolism and Cardiovascular Diseases. 2014;24(3):224-
235.
143. Hu T, Mills KT, Yao L, et al. Effects of low-carbohydrate diets versus low-fat
diets on metabolic risk factors: a meta-analysis of randomized controlled clinical
trials. American Journal of Epidemiology. 2012;176(suppl_7):S44-S54.
144. Naude CE, Schoonees A, Senekal M, Young T, Garner P, Volmink J. Low
carbohydrate versus isoenergetic balanced diets for reducing weight and
cardiovascular risk: a systematic review and meta-analysis. PloS One.
2014;9(7):e100652.
145. Bowen ME, Cavanaugh KL, Wolff K, et al. The diabetes nutrition education
study randomized controlled trial: A comparative effectiveness study of
approaches to nutrition in diabetes self-management education. Patient Education
and Counseling. 2016;99(8):1368-1376.
146. Burger KN, Beulens JW, van der Schouw YT, et al. Dietary fiber, carbohydrate
quality and quantity, and mortality risk of individuals with diabetes mellitus. PloS
One. 2012;7(8):e43127.
147. Priebe M, van Binsbergen J, de Vos R, Vonk RJ. Whole grain foods for the
prevention of type 2 diabetes mellitus. The Cochrane Library. 2008.
109
148. Liu S, Willett WC, Manson JE, Hu FB, Rosner B, Colditz G. Relation between
changes in intakes of dietary fiber and grain products and changes in weight and
development of obesity among middle-aged women. The American Journal of
Clinical Nutrition. 2003;78(5):920-927.
149. Salas-Salvadó J, Farrés X, Luque X, et al. Effect of two doses of a mixture of
soluble fibres on body weight and metabolic variables in overweight or obese
patients: a randomised trial. British Journal of Nutrition. 2008;99(6):1380-1387.
150. Wheeler ML, Dunbar SA, Jaacks LM, et al. Macronutrients, food groups, and
eating patterns in the management of diabetes. Diabetes Care. 2012;35(2):434-
445.
151. Post RE, Mainous AG, King DE, Simpson KN. Dietary fiber for the treatment of
type 2 diabetes mellitus: a meta-analysis. The Journal of the American Board of
Family Medicine. 2012;25(1):16-23.
152. Krishnan S, Rosenberg L, Singer M, et al. Glycemic index, glycemic load, and
cereal fiber intake and risk of type 2 diabetes in US black women. Archives of
Internal Medicine. 2007;167(21):2304-2309.
153. Marquart L, Slavin JL, Fulcher RG. Whole-grain foods in health and disease.
American Association of Cereal Chemists; 2002.
154. Samra RA, Anderson GH. Insoluble cereal fiber reduces appetite and short-term
food intake and glycemic response to food consumed 75 min later by healthy
men–. The American Journal of Clinical Nutrition. 2007;86(4):972-979.
155. Weickert MO, Möhlig M, Schöfl C, et al. Cereal fiber improves whole-body
insulin sensitivity in overweight and obese women. Diabetes Care.
2006;29(4):775-780.
156. Weickert M, Mohlig M, Koebnick C, et al. Impact of cereal fibre on glucose-
regulating factors. Diabetologia. 2005;48(11):2343-2353.
157. Crommen S, Simon M-C. Microbial Regulation of Glucose Metabolism and
Insulin Resistance. Genes. 2017;9(1):10.

110
158. Sandberg JC, Björck IM, Nilsson AC. Effects of whole grain rye, with and
without resistant starch type 2 supplementation, on glucose tolerance, gut
hormones, inflammation and appetite regulation in an 11–14.5 hour perspective; a
randomized controlled study in healthy subjects. Nutrition Journal.
2017;16(1):25.
159. Stefoska‐Needham A, Beck EJ, Johnson SK, Chu J, Tapsell LC. Flaked
sorghum biscuits increase postprandial GLP‐1 and GIP levels and extend
subjective satiety in healthy subjects. Molecular Nutrition & Food Research.
2016;60(5):1118-1128.
160. Bantle JP, Wylie-Rosett J, Albright AL, et al. Nutrition recommendations and
interventions for diabetes: a position statement of the American Diabetes
Association. Diabetes Care. 2008;31:S61-S78.
161. Wycherley TP, Noakes M, Clifton PM, Cleanthous X, Keogh JB, Brinkworth GD.
A high-protein diet with resistance exercise training improves weight loss and
body composition in overweight and obese patients with type 2 diabetes. Diabetes
Care. 2010;33(5):969-976.
162. Trumbo P, Schlicker S, Yates AA, Poos M. Dietary reference intakes for energy,
carbohydrate, fiber, fat, fatty acids, cholesterol, protein and amino acids. Journal
of the American Dietetic Association. 2002;102(11):1621-1630.
163. Brehm BJ, Lattin BL, Summer SS, et al. One-year comparison of a high–
monounsaturated fat diet with a high-carbohydrate diet in type 2 diabetes.
Diabetes Care. 2009;32(2):215-220.
164. Zhou Y-P, Grill VE. Long-term exposure of rat pancreatic islets to fatty acids
inhibits glucose-induced insulin secretion and biosynthesis through a glucose fatty
acid cycle. The Journal of Clinical Investigation. 1994;93(2):870-876.
165. Maedler K, Oberholzer J, Bucher P, Spinas GA, Donath MY. Monounsaturated
fatty acids prevent the deleterious effects of palmitate and high glucose on human
pancreatic β-cell turnover and function. Diabetes. 2003;52(3):726-733.
166. Chavez JA, Summers SA. Characterizing the effects of saturated fatty acids on
insulin signaling and ceramide and diacylglycerol accumulation in 3T3-L1

111
adipocytes and C2C12 myotubes. Archives of Biochemistry and Biophysics.
2003;419(2):101-109.
167. Boden G. Free fatty acids and insulin secretion in humans. Current Diabetes
Reports. 2005;5(3):167-170.
168. Rivellese AA, Giacco R, Annuzzi G, et al. Effects of monounsaturated vs.
saturated fat on postprandial lipemia and adipose tissue lipases in type 2 diabetes.
Clinical Nutrition. 2008;27(1):133-141.
169. Tanasescu M, Cho E, Manson JE, Hu FB. Dietary fat and cholesterol and the risk
of cardiovascular disease among women with type 2 diabetes. The American
Journal of Clinical Nutrition. 2004;79(6):999-1005.
170. Howard AA, Arnsten JH, Gourevitch MN. Effect of alcohol consumption on
diabetes mellitusA systematic review. Annals of Internal Medicine.
2004;140(3):211-219.
171. Suckling RJ, He FJ, MacGregor GA. Altered dietary salt intake for preventing and
treating diabetic kidney disease. Cochrane Database of Systematic Reviews.
2007;12.
172. Azadbakht L, Fard NRP, Karimi M, et al. Effects of the dietary approaches to stop
hypertension (DASH) eating plan on cardiovascular risks among type 2 diabetic
patients. Diabetes Care. 2011;34(1):55-57.
173. Thomas MC, Moran J, Forsblom C, et al. The association between dietary sodium
intake, ESRD, and all-cause mortality in patients with type 1 diabetes. Diabetes
Care. 2011;34(4):861-866.
174. Ekinci EI, Clarke S, Thomas MC, et al. Dietary salt intake and mortality in
patients with type 2 diabetes. Diabetes Care. 2011;34(3):703-709.
175. Brunner EJ, Mosdøl A, Witte DR, et al. Dietary patterns and 15-y risks of major
coronary events, diabetes, and mortality. The American Journal of Clinical
Nutrition. 2008;87(5):1414-1421.
112
176. Barbaresko J, Koch M, Schulze MB, Nöthlings U. Dietary pattern analysis and
biomarkers of low-grade inflammation: a systematic literature review. Nutrition
Reviews. 2013;71(8):511-527.
177. Esmaillzadeh A, Kimiagar M, Mehrabi Y, Azadbakht L, Hu FB, Willett WC.
Dietary patterns and markers of systemic inflammation among Iranian women.
The Journal of Nutrition. 2007;137(4):992-998.
178. Tonstad S, Butler T, Yan R, Fraser GE. Type of vegetarian diet, body weight, and
prevalence of type 2 diabetes. Diabetes Care. 2009;32(5):791-796.
179. Esposito K, Marfella R, Ciotola M, et al. Effect of a Mediterranean-style diet on
endothelial dysfunction and markers of vascular inflammation in the Metabolic
Syndrome: a randomized trial. JAMA. 2004;292(12):1440-1446.
180. Sacks FM, Svetkey LP, Vollmer WM, et al. Effects on blood pressure of reduced
dietary sodium and the Dietary Approaches to Stop Hypertension (DASH) diet.
New England Journal of Medicine. 2001;344(1):3-10.
181. Shirani F, Salehi-Abargouei A, Azadbakht L. Effects of Dietary Approaches to
Stop Hypertension (DASH) diet on some risk for developing type 2 diabetes: a
systematic review and meta-analysis on controlled clinical trials. Nutrition.
2013;29(7):939-947.
182. Yokoyama Y, Barnard ND, Levin SM, Watanabe M. Vegetarian diets and
glycemic control in diabetes: a systematic review and meta-analysis.
Cardiovascular Diagnosis and Therapy. 2014;4(5):373.
183. Nicholson AS, Sklar M, Barnard ND, Gore S, Sullivan R, Browning S. Toward
improved management of NIDDM: a randomized, controlled, pilot intervention
using a lowfat, vegetarian diet. Preventive Medicine. 1999;29(2):87-91.
184. Huo R, Du T, Xu Y, et al. Effects of Mediterranean-style diet on glycemic
control, weight loss and cardiovascular risk factors among type 2 diabetes
individuals: a meta-analysis. European Journal of Clinical Nutrition. 2014.
185. Bach A, Serra-Majem L, Carrasco JL, et al. The use of indexes evaluating the
adherence to the Mediterranean diet in epidemiological studies: a review. Public
Health Nutrition. 2007;9(1a).

113
186. Bonaccio M, Di Castelnuovo A, Costanzo S, et al. Adherence to the traditional
Mediterranean diet and mortality in subjects with diabetes. Prospective results
from the MOLI-SANI study. Eur J Prev Cardiol. 2016;23(4):400-407.
187. Richter CK, Skulas-Ray AC, Kris-Etherton PM. Recent findings of studies on the
Mediterranean diet: what are the implications for current dietary
recommendations? Endocrinology and Metabolism Clinics of North America.
2014;43(4):963-980.
188. Austel A, Ranke C, Wagner N, Gorge J, Ellrott T. Weight loss with a modified
Mediterranean-type diet using fat modification: a randomized controlled trial.
European Journal of Clinical Nutrition. 2015;69(8):878-884.
189. Paoli A, Bianco A, Grimaldi KA, Lodi A, Bosco G. Long term successful weight
loss with a combination biphasic ketogenic Mediterranean diet and Mediterranean
diet maintenance protocol. Nutrients. 2013;5(12):5205-5217.
190. Toobert DJ, Strycker LA, King DK, Barrera M, Jr., Osuna D, Glasgow RE. Long-
term outcomes from a multiple-risk-factor diabetes trial for Latinas: ¡Viva Bien!
Translational Behavioral Medicine. 2011;1(3):416-426.
191. Rodriguez-Rejon AI, Castro-Quezada I, Ruano-Rodriguez C, et al. Effect of a
Mediterranean Diet Intervention on Dietary Glycemic Load and Dietary Glycemic
Index: The PREDIMED Study. Journal of Nutrition and Metabolism.
2014;2014:985373.
192. Lasa A, Miranda J, Bullo M, et al. Comparative effect of two Mediterranean diets
versus a low-fat diet on glycaemic control in individuals with type 2 diabetes.
European Journal of Clinical Nutrition. 2014;68(7):767-772.
193. Steffen LM, Van Horn L, Daviglus ML, et al. A modified Mediterranean diet
score is associated with a lower risk of incident Metabolic Syndrome over 25
years among young adults: the CARDIA (Coronary Artery Risk Development in
Young Adults) study. British Journal of Nutrition. 2014;112(10):1654-1661.
194. Gardener H, Wright CB, Gu Y, et al. Mediterranean-style diet and risk of
ischemic stroke, myocardial infarction, and vascular death: the Northern
Manhattan Study. American Journal of Clinical Nutrition. 2011;94(6):1458-1464.

114
195. Tangney CC, Li H, Wang Y, et al. Relation of DASH-and Mediterranean-like
dietary patterns to cognitive decline in older persons. Neurology.
2014;83(16):1410-1416.
196. Ceriello A, Esposito K, La Sala L, et al. The protective effect of the
Mediterranean diet on endothelial resistance to GLP-1 in type 2 diabetes: a
preliminary report. Cardiovascular Diabetology. 2014;13(1):140.
197. Khatri M, Moon YP, Scarmeas N, et al. The association between a
Mediterranean-style diet and kidney function in the Northern Manhattan Study
cohort. Clinical Journal of the American Society of Nephrology. 2014;9(11):1868-
1875.
198. Whayne TF, Jr. Ischemic heart disease and the Mediterranean diet. Current
Cardiology Reports. 2014;16(6):491.
199. Murtaugh MA, Sweeney C, Giuliano AR, et al. Diet patterns and breast cancer
risk in Hispanic and non-Hispanic white women: the Four-Corners Breast Cancer
Study–. The American Journal of Clinical Nutrition. 2008;87(4):978-984.
200. Saunders L, Guldner L, Costet N, et al. Effect of a Mediterranean diet during
pregnancy on fetal growth and preterm delivery: results from a French Caribbean
Mother-Child Cohort Study (TIMOUN). Paediatric and Perinatal Epidemiology.
2014;28(3):235-244.
201. Bertoli S, Spadafranca A, Bes-Rastrollo M, et al. Adherence to the Mediterranean
diet is inversely related to binge eating disorder in patients seeking a weight loss
program. Clinical Nutrition. 2015;34(1):107-114.
202. Pachucki MA. Food pattern analysis over time: unhealthful eating trajectories
predict obesity. International Journal of Obesity. 2012;36(5):686-694.
203. Brennan SF, Cantwell MM, Cardwell CR, Velentzis LS, Woodside JV. Dietary
patterns and breast cancer risk: a systematic review and meta-analysis. The
American Journal of Clinical Nutrition. 2010;91(5):1294-1302.
204. Ogden C, Carroll M, Kit B, Flegal K. Prevalence of obesity and trends in body
mass index among US children and adolescents, 1999-2010. 2012; 307: 483-90.
JAMA: the journal of the American Medical Association.

115
205. Mamtani M, Kulkarni H, Dyer TD, et al. Waist circumference independently
associates with the risk of insulin resistance and type 2 diabetes in Mexican
American families. PloS One. 2013;8(3):e59153.
206. Santiago-Torres M, Kratz M, Lampe JW, et al. Metabolic responses to a
traditional Mexican diet compared with a commonly consumed US diet in women
of Mexican descent: a randomized crossover feeding trial, 2. The American
Journal of Clinical Nutrition. 2015;103(2):366-374.
207. Garcia L, Gold EB, Wang L, Yang X, Mao M, Schwartz AV. The relation of
acculturation to overweight, obesity, pre-diabetes and diabetes among US
Mexican-American women and men. Ethnicity & Disease. 2012;22(1):58.
208. Montez JK, Eschbach K. Country of birth and language are uniquely associated
with intakes of fat, fiber, and fruits and vegetables among Mexican-American
women in the United States. Journal of the American Dietetic Association.
2008;108(3):473-480.
209. Norman S, Castro C, Albright C, King A. Comparing acculturation models in
evaluating dietary habits among low-income Hispanic women. Ethnicity and
Disease. 2004;14(3):399-404.
210. Murtaugh MA, Herrick JS, Sweeney C, et al. Diet composition and risk of
overweight and obesity in women living in the southwestern United States.
Journal of the American Dietetic Association. 2007;107(8):1311-1321.
211. Cespedes EM, Hu FB, Tinker L, et al. Multiple healthful dietary patterns and type
2 diabetes in the Women's Health Initiative. American Journal of Epidemiology.
2016;183(7):622-633.
212. Qiao Y, Tinker L, Olendzki BC, et al. Racial/ethnic disparities in association
between dietary quality and incident diabetes in postmenopausal women in the
United States: the Women's Health Initiative 1993–2005. Ethnicity & Health.
2014;19(3):328-347.
213. Reedy J, Wirfält E, Flood A, et al. Comparing 3 dietary pattern methods—cluster
analysis, factor analysis, and index analysis—with colorectal cancer risk: the
NIH–AARP Diet and Health Study. American Journal of Epidemiology.
2009;171(4):479-487.

116
214. Schulze MB, Hoffmann K. Methodological approaches to study dietary patterns
in relation to risk of coronary heart disease and stroke. British Journal of
Nutrition. 2006;95(5):860-869.
215. Suhr DD. Principal component analysis vs. exploratory factor analysis. SUGI 30
proceedings. 2005;203:230.
216. Thompson B. Exploratory and confirmatory factor analysis: Understanding
concepts and applications. American Psychological Association; 2004.
217. Truxillo C. Multivariate statistical methods: practical research applications:
course notes. 2003.
218. Davis NJ, Schechter CB, Ortega F, Rosen R, Wylie-Rosett J, Walker EA. Dietary
patterns in blacks and Hispanics with diagnosed diabetes in New York City’s
South Bronx–. The American Journal of Clinical Nutrition. 2013;97(4):878-885.
219. Gong Y, Tian G, Xue H, Zhang X, Zhao Y, Cheng G. Higher adherence to the
‘vegetable-rich’dietary pattern is related to longer telomere length in women.
Clinical Nutrition. 2017.
220. Maskarinec G, Novotny R, Tasaki K. Dietary patterns are associated with body
mass index in multiethnic women. The Journal of Nutrition. 2000;130(12):3068-
3072.
221. Noel SE, Newby P, Ordovas JM, Tucker KL. A traditional rice and beans pattern
is associated with Metabolic Syndrome in Puerto Rican older adults. The Journal
of Nutrition. 2009;139(7):1360-1367.
222. Carrera PM, Gao X, Tucker KL. A study of dietary patterns in the Mexican-
American population and their association with obesity. Journal of the American
Dietetic Association. 2007;107(10):1735-1742.
223. Denova‐Gutiérrez E, Castañón S, Talavera JO, et al. Dietary patterns are
associated with Metabolic Syndrome in an urban Mexican population. The
Journal of nutrition. 2010;140(10):1855-1863.

117
224. Flores M, Macias N, Rivera M, et al. Dietary Patterns in Mexican Adults Are
Associated with Risk of Being Overweight or Obese–3. The Journal of Nutrition.
2010;140(10):1869-1873.
225. Martínez ME, Marshall JR, Sechrest L. Invited commentary: factor analysis and
the search for objectivity. American Journal of Epidemiology. 1998;148(1):17-19.
226. Baik I, Lee M, Jun N-R, Lee J-Y, Shin C. A healthy dietary pattern consisting of a
variety of food choices is inversely associated with the development of Metabolic
Syndrome. Nutrition Research and Practice. 2013;7(3):233-241.
227. Shim JS, Oh K, Kim HC. Dietary assessment methods in epidemiologic studies.
Epidemiol Health. 2014;36:e2014009.
228. Karvetti R, Knuts LR. Validity of the 24-hour dietary recall. Journal of the
American Dietetic Association. 1985;85(11):1437-1442.
229. Margetts BM, Nelson M. Design concepts in nutritional epidemiology. OUP
Oxford; 1997.
230. Burke BS. The dietary history as a tool in research. Journal of the American
Dietetic Association. 1947;23:1041-1046.
231. Hu FB, Rimm E, Smith-Warner SA, et al. Reproducibility and validity of dietary
patterns assessed with a food-frequency questionnaire. The American Journal of
Clinical Nutrition. 1999;69(2):243-249.
232. Shim J-S, Oh K, Kim HC. Dietary assessment methods in epidemiologic studies.
Epidemiology and health. 2014;36.
233. Fung TT, McCullough M, Van Dam RM, Hu FB. A prospective study of overall
diet quality and risk of type 2 diabetes in women. Diabetes Care.
2007;30(7):1753-1757.
234. Guenther PM, Casavale KO, Reedy J, et al. Update of the healthy eating index:
HEI-2010. Journal of the Academy of Nutrition and Dietetics. 2013;113(4):569-
580.

118
235. T KENNEDY E, Ohls J, Carlson S, Fleming K. The healthy eating index: design
and applications. Journal of the American Dietetic Association.
1995;95(10):1103-1108.
236. Guenther PM, Reedy J, Krebs-Smith SM. Development of the healthy eating
index-2005. Journal of the American Dietetic Association. 2008;108(11):1896-
1901.
237. Guenther PM, Kirkpatrick SI, Reedy J, et al. The Healthy Eating Index-2010 is a
valid and reliable measure of diet quality according to the 2010 Dietary
Guidelines for Americans. The Journal of Nutrition. 2014:jn. 113.183079.
238. Freedman LS, Guenther PM, Krebs-Smith SM, Kott PS. A population's mean
Healthy Eating Index-2005 scores are best estimated by the score of the
population ratio when one 24-hour recall is available. The Journal of Nutrition.
2008;138(9):1725-1729.
239. McCullough ML, Feskanich D, Stampfer MJ, et al. Diet quality and major chronic
disease risk in men and women: moving toward improved dietary guidance. The
American Journal of Clinical Nutrition. 2002;76(6):1261-1271.
240. Alhazmi A, Stojanovski E, McEvoy M, Brown W, Garg ML. Diet quality score is
a predictor of type 2 diabetes risk in women: the Australian Longitudinal Study on
Women's Health. British Journal of Nutrition. 2014;112(6):945-951.
241. Fung TT, Chiuve SE, McCullough ML, Rexrode KM, Logroscino G, Hu FB.
Adherence to a DASH-style diet and risk of coronary heart disease and stroke in
women. Archives of Internal Medicine. 2008;168(7):713-720.
242. Fung TT, McCullough ML, Newby P, et al. Diet-quality scores and plasma
concentrations of markers of inflammation and endothelial dysfunction. The
American Journal of Clinical Nutrition. 2005;82(1):163-173.
243. Fung TT, Rexrode KM, Mantzoros CS, Manson JE, Willett WC, Hu FB.
Mediterranean diet and incidence of and mortality from coronary heart disease
and stroke in women. Circulation. 2009;119(8):1093-1100.
244. Kuhnle GG. Nutritional biomarkers for objective dietary assessment. Journal of
the Science of Food and Agriculture. 2012;92(6):1145-1149.

119
245. Strimbu K, Tavel JA. What are biomarkers? Current Opinion in HIV and AIDS.
2010;5(6):463.
246. Jacobs S, Schiller K, Jansen E, et al. Association between erythrocyte membrane
fatty acids and biomarkers of dyslipidemia in the EPIC-Potsdam study. European
Journal of Clinical Nutrition. 2014;68(4):517-525.
247. Colussi G, Catena C, Mos L, Sechi LA. The Metabolic Syndrome and the
Membrane Content of Polyunsaturated Fatty Acids in Hypertensive Patients.
Metabolic Syndrome and Related Disorders. 2015;13(8):343-351.
248. Kroger J, Jacobs S, Jansen EH, Fritsche A, Boeing H, Schulze MB. Erythrocyte
membrane fatty acid fluidity and risk of type 2 diabetes in the EPIC-Potsdam
study. Diabetologia. 2015;58(2):282-289.
249. Lankinen MA, Stancakova A, Uusitupa M, et al. Plasma fatty acids as predictors
of glycaemia and type 2 diabetes. Diabetologia. 2015;58(11):2533-2544.
250. Baylin A, Campos H. The use of fatty acid biomarkers to reflect dietary intake.
Current Opinion in Lipidology. 2006;17(1):22-27.
251. Rzehak P, Heinrich J, Klopp N, et al. Evidence for an association between genetic
variants of the fatty acid desaturase 1 fatty acid desaturase 2 (FADS1 FADS2)
gene cluster and the fatty acid composition of erythrocyte membranes. British
Journal of Nutrition. 2008;101(1):20-26.
252. Cormier H, Rudkowska I, Lemieux S, Couture P, Julien P, Vohl MC. Effects of
FADS and ELOVL polymorphisms on indexes of desaturase and elongase
activities: results from a pre-post fish oil supplementation. Genes & Nutrition.
2014;9(6):437.
253. Warensjo E, Ohrvall M, Vessby B. Fatty acid composition and estimated
desaturase activities are associated with obesity and lifestyle variables in men and
women. Nutrition, Metabolism, and Cardiovascular Diseases. 2006;16(2):128-
136.
254. Patel PS, Sharp SJ, Jansen E, et al. Fatty acids measured in plasma and
erythrocyte-membrane phospholipids and derived by food-frequency
questionnaire and the risk of new-onset type 2 diabetes: a pilot study in the

120
European Prospective Investigation into Cancer and Nutrition (EPIC)–Norfolk
cohort–. The American Journal of Clinical Nutrition. 2010;92(5):1214-1222.
255. Nakamura MT, Yudell BE, Loor JJ. Regulation of energy metabolism by long-
chain fatty acids. Progress in Lipid Research. 2014;53:124-144.
256. Baldrick FR, Woodside JV, Elborn JS, Young IS, McKinley MC. Biomarkers of
fruit and vegetable intake in human intervention studies: a systematic review.
Critical Reviews in Food Science and Nutrition. 2011;51(9):795-815.
257. Couillard C, Lemieux S, Vohl M-C, Couture P, Lamarche B. Carotenoids as
biomarkers of fruit and vegetable intake in men and women. British Journal of
Nutrition. 2016;116(7):1206-1215.
258. Maiani G, Periago Castón MJ, Catasta G, et al. Carotenoids: actual knowledge on
food sources, intakes, stability and bioavailability and their protective role in
humans. Molecular Nutrition & Food Research. 2009;53(S2).
259. Kaaks R, Ferrari P, Ciampi A, Plummer M, Riboli E. Uses and limitations of
statistical accounting for random error correlations, in the validation of dietary
questionnaire assessments. Public Health Nutrition. 2002;5(6a):969-976.
260. Potischman N, Freudenheim JL. Biomarkers of nutritional exposure and
nutritional status: an overview. The Journal of nutrition. 2003;133(3):873S-874S.
261. Ley SH, Hamdy O, Mohan V, Hu FB. Prevention and management of type 2
diabetes: dietary components and nutritional strategies. The Lancet.
2014;383(9933):1999-2007.
262. Rinaldi S, Campbell EE, Fournier J, O'Connor C, Madill J. A comprehensive
review of the literature supporting recommendations from the Canadian Diabetes
Association for the use of a plant-based diet for management of type 2 diabetes.
Canadian Journal of Diabetes. 2016;40(5):471-477.
263. Esposito K, Maiorino MI, Ciotola M, et al. Effects of a Mediterranean-Style Diet
on the Need for Antihyperglycemic Drug Therapy in Patients With Newly
Diagnosed Type 2 DiabetesA Randomized Trial. Annals of Internal Medicine.
2009;151(5):306-314.

121
264. Gomez-Peralta F, Abreu C, Andreu-Urioste L, et al. Point-of-care capillary
HbA1c measurement in the emergency department: a useful tool to detect
unrecognized and uncontrolled diabetes. International Journal of Emergency
Medicine. 2016;9(1):7.
265. Taren D, De Tobar M, Ritenbaugh C, Graver E, Whitacre R, Aickin M.
Evaluation of the southwest food frequency questionnaire. Ecology of Food and
Nutrition. 2000;38(6):515-547.
266. Ritenbaugh C, Aickin M, Taren D, et al. Use of a food frequency questionnaire to
screen for dietary eligibility in a randomized cancer prevention phase III trial.
Cancer Epidemiology and Prevention Biomarkers. 1997;6(5):347-354.
267. Hepburn FN. The USDA National Nutrient Data Bank. The American Journal of
Clinical Nutrition. 1982;35(5):1297-1301.
268. Bédard A, Garcia-Aymerich J, Sanchez M, et al. Confirmatory factor analysis
compared with principal component analysis to derive dietary patterns: a
longitudinal study in adult women. The Journal of Nutrition. 2015;145(7):1559-
1568.
269. Lindberg NM, Stevens VJ, Vega-Lopez S, Kauffman TL, Calderon MR,
Cervantes MA. A weight-loss intervention program designed for Mexican-
American women: cultural adaptations and results. J Immigr Minor Health.
2012;14(6):1030-1039.
270. Joliffe I, Morgan B. Principal component analysis and exploratory factor analysis.
Statistical Methods in Medical Research. 1992;1(1):69-95.
271. Costello AB, Osborne JW. Best practices in exploratory factor analysis: Four
recommendations for getting the most from your analysis. Practical Assessment,
Research & Evaluation. 2005;10(7):1-9.
272. DiStefano C, Zhu M, Mindrila D. Understanding and using factor scores:
Considerations for the applied researcher. Practical Assessment, Research &
Evaluation. 2009;14(20):1-11.
273. Tabachnick BG, Fidell LS. Using multivariate statistics, Boston, MC: Pearson
Education. Inc. 2007.

122
274. Menke A, Casagrande S, Geiss L, Cowie CC. Prevalence of and trends in diabetes
among adults in the united states, 1988-2012. JAMA. 2015;314(10):1021-1029.
275. Ma Y, Hébert JR, Manson JE, et al. Determinants of racial/ethnic disparities in
incidence of diabetes in postmenopausal women in the US: The Women’s Health
Initiative 1993–2009. Diabetes Care. 2012;35(11):2226-2234.
276. Ma J, Yank V, Xiao L, et al. Translating the Diabetes Prevention Program
lifestyle intervention for weight loss into primary care: a randomized trial. JAMA
internal medicine. 2013;173(2):113-121.
277. Bach-Faig A, Berry EM, Lairon D, et al. Mediterranean diet pyramid today.
Science and cultural updates. Public Health Nutrition. 2011;14(12A):2274-2284.
278. Freitas-Simoes T-M, Ros E, Sala-Vila A. Nutrients, foods, dietary patterns and
telomere length: Update of epidemiological studies and randomized trials.
Metabolism-Clinical and Experimental. 2016;65(4):406-415.
279. Noel SE, Newby P, Ordovas JM, Tucker KL. Adherence to an (n-3) Fatty
Acid/Fish Intake Pattern Is Inversely Associated with Metabolic Syndrome among
Puerto Rican Adults in the Greater Boston Area–3. The Journal of Nutrition.
2010;140(10):1846-1854.
280. Hu FB, Rimm EB, Stampfer MJ, Ascherio A, Spiegelman D, Willett WC.
Prospective study of major dietary patterns and risk of coronary heart disease in
men–. The American Journal of Clinical Nutrition. 2000;72(4):912-921.
281. Stern D, Piernas C, Barquera S, Rivera JA, Popkin BM. Caloric Beverages Were
Major Sources of Energy among Children and Adults in Mexico, 1999–2012. The
Journal of Nutrition. 2014;144(6):949-956.
282. Guenther PM, Jensen HH, Batres-Marquez SP, Chen C-F. Sociodemographic,
knowledge, and attitudinal factors related to meat consumption in the United
States. Journal of the American Dietetic Association. 2005;105(8):1266-1274.
283. Chávez N, Sha L, Persky V, Langenberg P, Pestano-Binghay E. Effect of length
of US residence on food group intake in Mexican and Puerto Rican women.
Journal of Nutrition Education. 1994;26(2):79-86.
123
284. Siega-Riz AM, Sotres-Alvarez D, Ayala GX, et al. Food-group and nutrient-
density intakes by Hispanic and Latino backgrounds in the Hispanic Community
Health Study/Study of Latinos–. The American Journal of Clinical Nutrition.
2014;99(6):1487-1498.
285. Montoya JA, Salinas JJ, Barroso CS, Mitchell-Bennett L, Reininger B. Nativity
and nutritional behaviors in the Mexican origin population living in the US-
Mexico border region. Journal of immigrant and minority health. 2011;13(1):94-
100.
286. Valdez L, Amezquita A, Hooker S, Garcia D. Mexican-origin male perspectives
of diet-related behaviors associated with weight management. International
Journal of Obesity. 2017;41(12):1824.
287. Mattei J, Noel SE, Tucker KL. A meat, processed meat, and French fries dietary
pattern is associated with high allostatic load in Puerto Rican older adults. Journal
of the American Dietetic Association. 2011;111(10):1498-1506.
288. Bothwell EK, Ayala GX, Conway TL, Rock CL, Gallo LC, Elder JP.
Underreporting of food intake among Mexican/Mexican-American women: rates
and correlates. Journal of the Academy of Nutrition and Dietetics.
2009;109(4):624-632.
289. Johansson L, Solvoll K, Bjørneboe G-E, Drevon CA. Under-and overreporting of
energy intake related to weight status and lifestyle in a nationwide sample. The
American journal of clinical nutrition. 1998;68(2):266-274.
290. Pan X-R, Li G-w, Hu Y-H, et al. Effects of diet and exercise in preventing
NIDDM in people with impaired glucose tolerance: the Da Qing IGT and
Diabetes Study. Diabetes Care. 1997;20(4):537-544.
291. Carey DG, Jenkins AB, Campbell LV, Freund J, Chisholm DJ. Abdominal fat and
insulin resistance in normal and overweight women: direct measurements reveal a
strong relationship in subjects at both low and high risk of NIDDM. Diabetes.
1996;45(5):633-638.
292. Kahn BB, Flier JS. Obesity and insulin resistance. The Journal of Clinical
Investigation. 2000;106(4):473-481.

124
293. Kahn SE, Hull RL, Utzschneider KM. Mechanisms linking obesity to insulin
resistance and type 2 diabetes. Nature. 2006;444(7121):840.
294. Nielsen SJ, Siega-Riz AM, Popkin BM. Trends in food locations and sources
among adolescents and young adults. Preventive Medicine. 2002;35(2):107-113.
295. Garduño‐Diaz S, Husain W, Ashkanani F, Khokhar S. Meeting challenges
related to the dietary assessment of ethnic minority populations. Journal of
Human Nutrition and Dietetics. 2014;27(4):358-366.
296. Jain M. Culture-specific food frequency questionaires: Development for use in a
cardiovascular study. Canadian Journal of Dietetic Practice and Research.
1999;60(1):27.

125
APPENDIX A
INSTITUTIONAL REVIEW BOARD APPROVAL FOR KAISER PERMANENTE
CENTER FOR HEALTH RESEARCH

126

127

128
APPENDIX B
INSTITUTIONAL REVIEW BOARD APPROVAL FOR ARIZONA STATE
UNIVERSITY

129
Page 1 of 2
APPROVAL: EXPEDITED REVIEW
Sonia Vega-Lopez
SNHP - Nutrition
602/827-2268
Dear Sonia Vega-Lopez:
On 1/1/2014 the ASU IRB reviewed the following protocol:
Type of Review: Initial Study
Title: Diabetes De Por Vida: Culturally Competent
Behavioral Intervention for Diabetes Risk Reduction
Investigator: Sonia Vega-Lopez
IRB ID: STUDY00000404
Category of review: (2)(a) Blood samples from healthy, non-pregnant
adults, (4) Noninvasive procedures, (7)(b) Social
science methods, (7)(a) Behavioral research
Funding: Name: NIH: National Institutes of Health;
Grant Title:
Grant ID:
Documents Reviewed: • HRP-503b-Vega-Lopez-Kaiser, Category: IRB
Protocol;
• NIH Project Narrative, Category: IRB Protocol;
• IRB letter-Kaiser.pdf, Category: Off-site
authorizations (school permission, other IRB
approvals, Tribal permission etc);
• NIH De Por Vida - R01 Submission, Category:
Sponsor Attachment;
The IRB approved the protocol from 1/1/2014 to 12/31/2014 inclusive. Three weeks
before 12/31/2014 you are to submit a completed “FORM: Continuing Review (HRP-
212)” and required attachments to request continuing approval or closure.

130
Page 2 of 2
If continuing review approval is not granted before the expiration date of 12/31/2014
approval of this protocol expires on that date. When consent is appropriate, you must use
final, watermarked versions available under the “Documents” tab in ERA-IRB.
In conducting this protocol you are required to follow the requirements listed in the
INVESTIGATOR MANUAL (HRP-103).
Sincerely,
IRB Administrator
cc:

131
APPENDIX C
CONSENT FORM IN ENGLISH

132

133

134

135

136

137

138
APPENDIX D
CONSENT FORM IN SPANISH

139

140

141

142

143

144

145
146

147
APPENDIX E
SOUTHWESTERN FOOD FREQUENCY QUESTIONNAIRE

148

149

150

151

152

153

154

155

156

157

158

159

160

161

162

163

164

165

166

167

168
APPENDIX F
ADDITIONAL RESULTS

169
Factor correlation matrix with promax rotation1
Factor 1 2 3 4 5 6
1 1.000 0.163 0.435 0.669 0.184 0.336
2 0.163 1.000 0.194 0.193 0.095 0.039
3 0.435 0.194 1.000 0.571 -0.028 0.350
4 0.669 0.193 0.571 1.000 0.145 0.302
5 0.184 0.095 -0.028 0.145 1.000 0.084
6 0.336 0.039 0.350 0.302 0.084 1.000 1Extraction method was principal axis factoring.

170
APPENDIX G
DATA SHEETS

171
Data Sheets
ID Participants’ characteristics
Age
(years)
Weight
(kg)
Height
(cm)
BMI
(kg/m2)
Waist
circumference
(cm)
Fasting
blood
glucose
(mg/dL)
HbA1c
(%)
10001 60 156.80 62.00 28.68 101.50 109 5.80
10002 45 187.00 62.25 33.92 113.47 125 5.80
10010 58 165.80 59.50 32.92 109.10 121 6.30
10016 47 237.80 62.50 42.80 131.45 112 5.90
10019 33 137.80 59.00 27.83 86.67 105 5.10
10021 52 152.20 59.00 30.74 106.05 182 10.20
10027 41 230.40 67.50 35.55 131.05 271 8.90
10032 33 235.60 64.00 40.44 131.43 91 5.40
10034 42 157.00 60.25 30.40 104.40 111 6.10
10035 39 164.80 57.50 35.04 111.15 107 5.90
10041 38 203.40 59.00 41.08 118.75 130 6.10
10042 44 148.00 59.00 29.89 96.65 117 5.70
10045 38 170.20 61.00 32.16 108.00 174 10.90
10046 54 184.40 62.25 33.45 107.75 240 9.90
10054 31 237.20 64.00 40.71 128.90 150 6.00
10058 56 195.80 58.00 40.92 124.50 136 5.90
10059 29 178.40 64.50 30.15 106.05 121 5.20
10060 34 156.80 60.40 30.22 98.75 123 5.90
10064 50 235.60 62.00 43.09 125.50 151 7.40
BMI, body mass index; HbA1c, hemoglobin A1c.
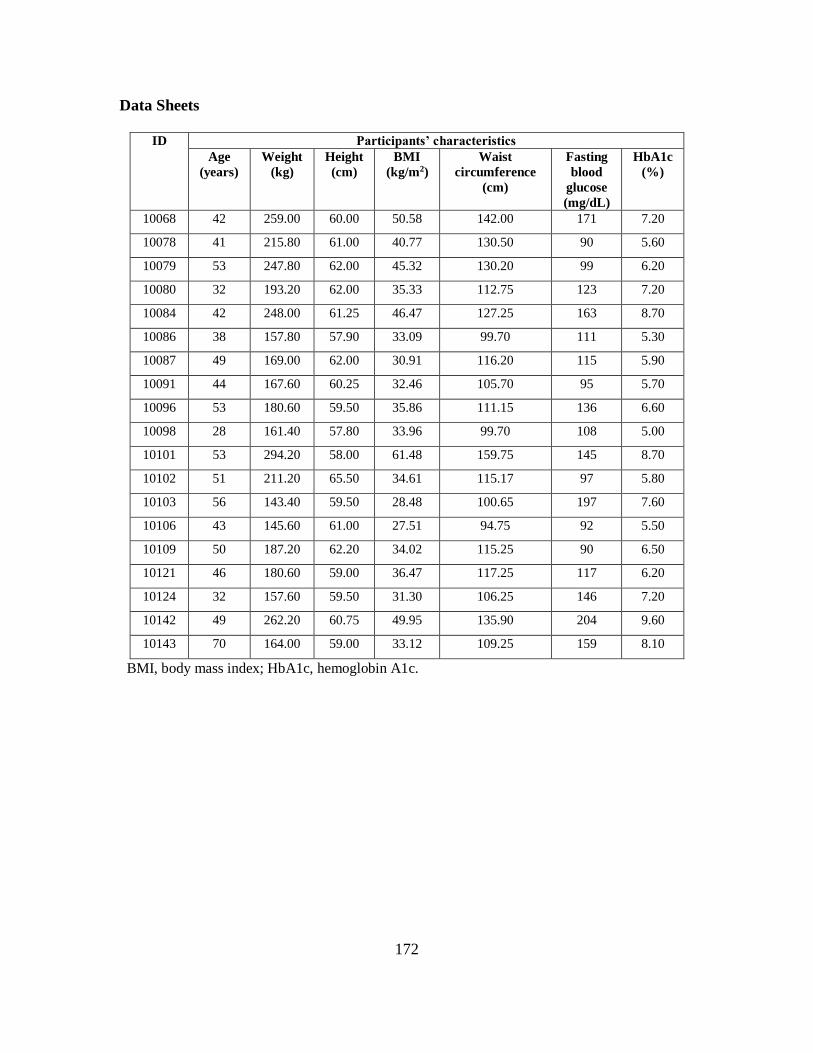
172
Data Sheets
ID Participants’ characteristics
Age
(years)
Weight
(kg)
Height
(cm)
BMI
(kg/m2)
Waist
circumference
(cm)
Fasting
blood
glucose
(mg/dL)
HbA1c
(%)
10068 42 259.00 60.00 50.58 142.00 171 7.20
10078 41 215.80 61.00 40.77 130.50 90 5.60
10079 53 247.80 62.00 45.32 130.20 99 6.20
10080 32 193.20 62.00 35.33 112.75 123 7.20
10084 42 248.00 61.25 46.47 127.25 163 8.70
10086 38 157.80 57.90 33.09 99.70 111 5.30
10087 49 169.00 62.00 30.91 116.20 115 5.90
10091 44 167.60 60.25 32.46 105.70 95 5.70
10096 53 180.60 59.50 35.86 111.15 136 6.60
10098 28 161.40 57.80 33.96 99.70 108 5.00
10101 53 294.20 58.00 61.48 159.75 145 8.70
10102 51 211.20 65.50 34.61 115.17 97 5.80
10103 56 143.40 59.50 28.48 100.65 197 7.60
10106 43 145.60 61.00 27.51 94.75 92 5.50
10109 50 187.20 62.20 34.02 115.25 90 6.50
10121 46 180.60 59.00 36.47 117.25 117 6.20
10124 32 157.60 59.50 31.30 106.25 146 7.20
10142 49 262.20 60.75 49.95 135.90 204 9.60
10143 70 164.00 59.00 33.12 109.25 159 8.10
BMI, body mass index; HbA1c, hemoglobin A1c.

173
Data Sheets
ID Participants’ characteristics
Age
(years)
Weight
(kg)
Height
(cm)
BMI
(kg/m2)
Waist
circumference
(cm)
Fasting
blood
glucose
(mg/dL)
HbA1c
(%)
10145 58 176.40 59.25 35.32 101.60 108 5.70
10150 48 178.60 56.50 39.33 113.25 153 7.80
10152 48 195.20 63.00 34.57 122.25 126 6.00
10153 58 150.00 58.75 30.55 100.25 137 7.00
10161 44 200.00 62.00 36.58 111.95 109 --
10162 48 165.40 64.00 28.39 107.10 101 6.00
10165 56 169.20 61.20 31.76 110.75 140 7.10
10169 41 148.00 59.50 29.39 105.40 109 5.80
10170 38 223.80 60.50 42.98 136.90 125 5.30
10202 23 171.40 61.00 32.38 107.35 99 5.20
10205 33 253.20 63.25 44.49 130.87 111 5.50
10206 29 198.00 59.75 38.99 122.55 99 5.50
10207 45 155.60 59.50 30.90 98.25 131 5.90
10213 43 194.00 60.00 37.88 124.75 92 5.50
10216 55 183.80 63.00 32.56 115.25 104 6.10
10237 38 249.60 62.00 45.65 136.75 104 4.70
10239 33 190.00 58.00 39.71 121.30 109 5.70
10246 37 188.20 59.60 37.25 113.50 251 8.30
10247 32 144.40 61.25 27.06 96.57 96 5.30
BMI, body mass index; HbA1c, hemoglobin A1c.

174
Data Sheets
ID Participants’ characteristics
Age
(years)
Weight
(kg)
Height
(cm)
BMI
(kg/m2)
Waist
circumference
(cm)
Fasting
blood
glucose
(mg/dL)
HbA1c
(%)
10248 35 182.80 63.00 32.38 107.93 101 6.10
10250 52 132.80 57.20 28.53 93.85 112 6.00
10256 27 150.80 63.00 26.71 104.05 -- --
10259 50 258.20 62.50 46.47 133.30 194 8.10
10261 44 187.40 62.50 33.73 109.25 133 5.70
10263 31 232.00 62.70 41.49 130.75 117 5.70
10272 55 196.60 60.00 38.39 117.25 144 6.30
10275 36 191.20 65.00 31.81 112.25 118 5.30
10282 47 163.20 62.75 29.14 102.45 97 5.40
10284 36 162.40 60.20 31.50 101.35 223 8.50
10287 71 155.40 56.00 34.84 110.67 154 7.80
10295 50 182.60 61.00 34.50 113.25 107 5.30
10300 39 204.00 64.00 35.01 108.60 234 8.00
10301 44 233.20 64.75 39.10 123.85 125 5.60
10305 30 187.60 59.00 37.89 126.90 112 5.50
10329 65 162.60 55.75 36.78 113.70 106 5.90
10341 42 205.60 65.35 33.84 113.10 175 6.50
10495 52 142.80 59.25 28.60 98.80 112 5.70
10542 43 257.60 60.50 49.48 125.20 142 6.30
BMI, body mass index; HbA1c, hemoglobin A1c.
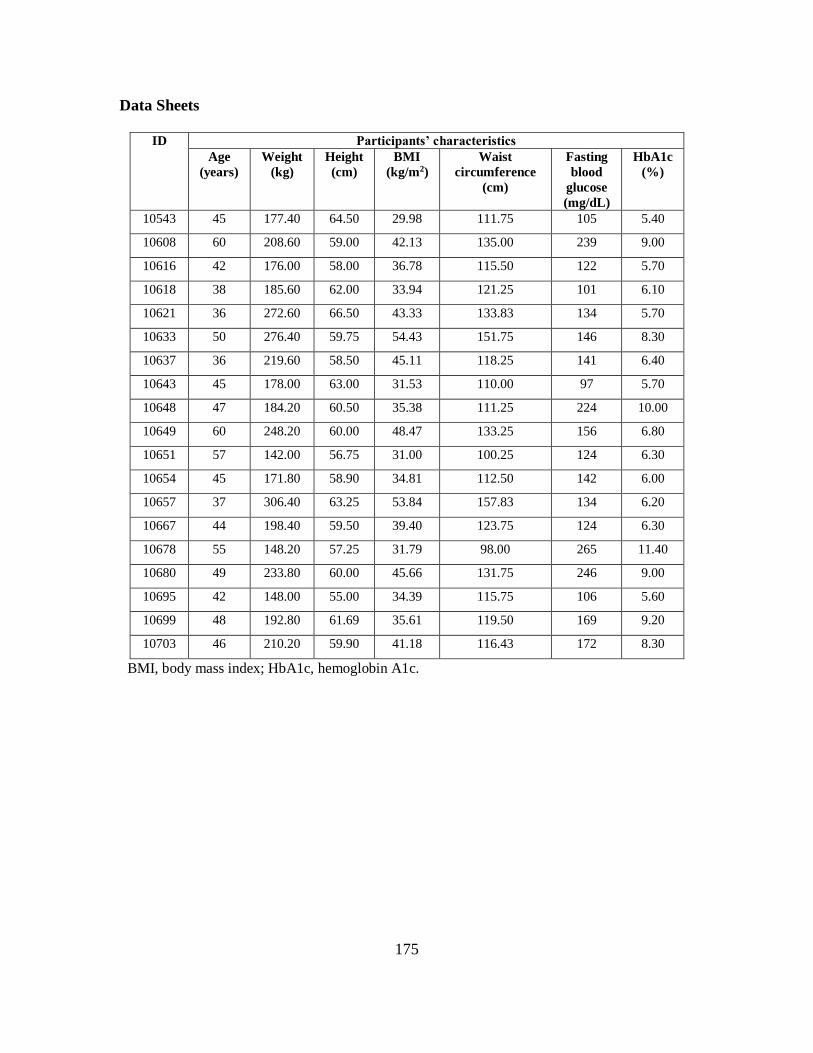
175
Data Sheets
ID Participants’ characteristics
Age
(years)
Weight
(kg)
Height
(cm)
BMI
(kg/m2)
Waist
circumference
(cm)
Fasting
blood
glucose
(mg/dL)
HbA1c
(%)
10543 45 177.40 64.50 29.98 111.75 105 5.40
10608 60 208.60 59.00 42.13 135.00 239 9.00
10616 42 176.00 58.00 36.78 115.50 122 5.70
10618 38 185.60 62.00 33.94 121.25 101 6.10
10621 36 272.60 66.50 43.33 133.83 134 5.70
10633 50 276.40 59.75 54.43 151.75 146 8.30
10637 36 219.60 58.50 45.11 118.25 141 6.40
10643 45 178.00 63.00 31.53 110.00 97 5.70
10648 47 184.20 60.50 35.38 111.25 224 10.00
10649 60 248.20 60.00 48.47 133.25 156 6.80
10651 57 142.00 56.75 31.00 100.25 124 6.30
10654 45 171.80 58.90 34.81 112.50 142 6.00
10657 37 306.40 63.25 53.84 157.83 134 6.20
10667 44 198.40 59.50 39.40 123.75 124 6.30
10678 55 148.20 57.25 31.79 98.00 265 11.40
10680 49 233.80 60.00 45.66 131.75 246 9.00
10695 42 148.00 55.00 34.39 115.75 106 5.60
10699 48 192.80 61.69 35.61 119.50 169 9.20
10703 46 210.20 59.90 41.18 116.43 172 8.30
BMI, body mass index; HbA1c, hemoglobin A1c.
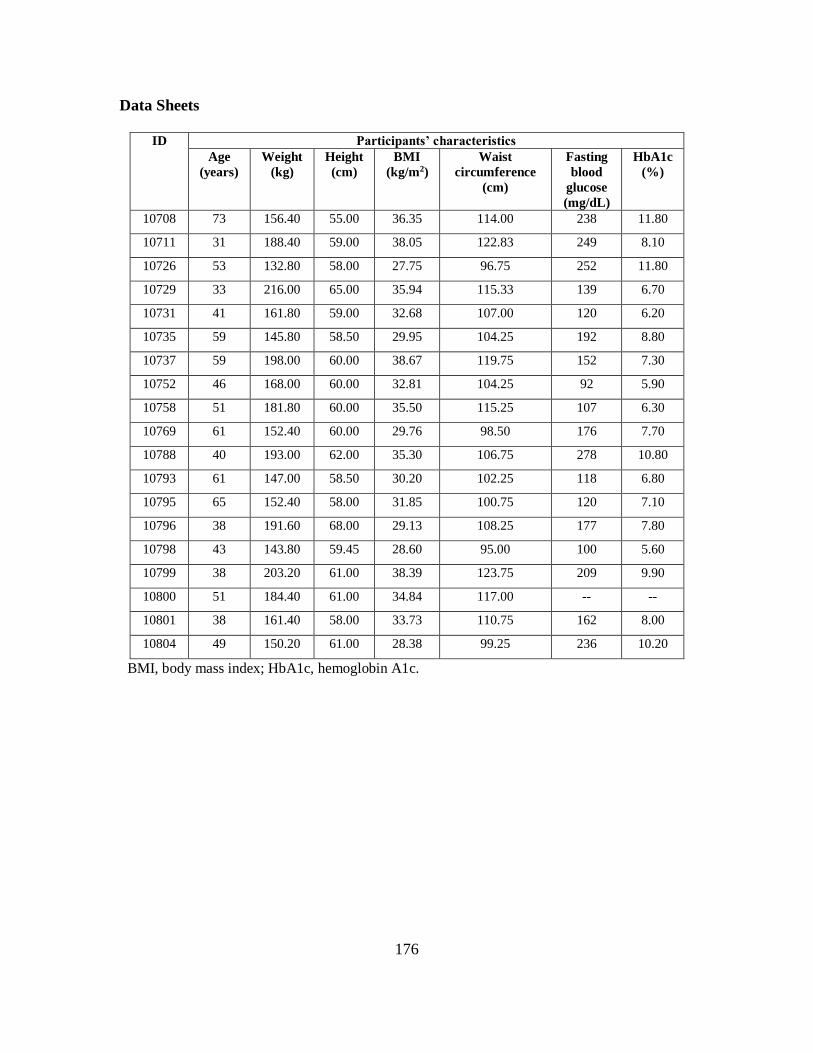
176
Data Sheets
ID Participants’ characteristics
Age
(years)
Weight
(kg)
Height
(cm)
BMI
(kg/m2)
Waist
circumference
(cm)
Fasting
blood
glucose
(mg/dL)
HbA1c
(%)
10708 73 156.40 55.00 36.35 114.00 238 11.80
10711 31 188.40 59.00 38.05 122.83 249 8.10
10726 53 132.80 58.00 27.75 96.75 252 11.80
10729 33 216.00 65.00 35.94 115.33 139 6.70
10731 41 161.80 59.00 32.68 107.00 120 6.20
10735 59 145.80 58.50 29.95 104.25 192 8.80
10737 59 198.00 60.00 38.67 119.75 152 7.30
10752 46 168.00 60.00 32.81 104.25 92 5.90
10758 51 181.80 60.00 35.50 115.25 107 6.30
10769 61 152.40 60.00 29.76 98.50 176 7.70
10788 40 193.00 62.00 35.30 106.75 278 10.80
10793 61 147.00 58.50 30.20 102.25 118 6.80
10795 65 152.40 58.00 31.85 100.75 120 7.10
10796 38 191.60 68.00 29.13 108.25 177 7.80
10798 43 143.80 59.45 28.60 95.00 100 5.60
10799 38 203.20 61.00 38.39 123.75 209 9.90
10800 51 184.40 61.00 34.84 117.00 -- --
10801 38 161.40 58.00 33.73 110.75 162 8.00
10804 49 150.20 61.00 28.38 99.25 236 10.20
BMI, body mass index; HbA1c, hemoglobin A1c.

177
Data Sheets
ID Participants’ characteristics
Age
(years)
Weight
(kg)
Height
(cm)
BMI
(kg/m2)
Waist
circumference
(cm)
Fasting
blood
glucose
(mg/dL)
HbA1c
(%)
10809 51 153.00 58.50 31.43 101.67 103 5.70
10810 43 245.20 62.00 44.84 141.83 111 5.50
10822 45 199.00 59.50 39.52 126.25 266 11.10
10848 56 197.60 63.00 35.00 121.17 271 8.20
10851 48 165.20 57.00 35.75 101.25 113 5.80
10903 43 195.80 64.00 33.61 107.75 120 5.80
10904 39 246.80 63.00 43.71 131.83 119 6.00
10906 43 171.60 61.00 32.42 111.75 116 5.90
10907 37 174.00 59.50 34.55 106.25 152 7.50
10915 48 211.60 62.00 38.70 117.25 112 5.50
10917 42 227.40 59.00 45.92 122.33 103 5.70
10923 31 164.00 61.50 30.48 99.25 116 5.00
10940 37 322.00 60.00 62.88 165.25 104 5.60
10943 44 197.40 60.00 38.55 110.50 127 6.00
10946 48 202.40 62.00 37.02 116.25 108 5.80
10952 40 150.80 62.90 26.80 99.35 110 5.30
10954 40 193.00 59.50 38.32 116.75 112 5.90
10959 34 188.00 63.00 33.30 118.75 101 5.60
10963 31 160.20 56.00 35.91 108.50 98 5.60
BMI, body mass index; HbA1c, hemoglobin A1c.

178
Data Sheets
ID Participants’ characteristics
Age
(years)
Weight
(kg)
Height
(cm)
BMI
(kg/m2)
Waist
circumference
(cm)
Fasting
blood
glucose
(mg/dL)
HbA1c
(%)
10977 51 218.40 61.00 41.26 126.75 -- 5.90
10982 49 137.20 57.50 29.17 96.75 105 5.80
10984 36 249.80 62.50 44.96 131.50 100 5.60
10985 54 202.20 61.00 38.20 123.75 124 6.40
10986 57 232.20 61.50 43.16 130.25 107 6.10
10987 36 168.00 59.50 33.36 105.75 101 6.20
10989 36 221.20 62.00 40.45 113.75 112 5.90
10995 38 162.40 62.50 29.23 105.25 99 5.70
11002 41 157.80 62.00 28.86 109.25 109 5.60
11008 48 180.60 57.00 39.08 109.00 136 6.70
11009 31 192.60 62.00 35.22 122.83 112 5.70
11011 40 155.60 61.00 29.40 97.25 94 5.70
11014 45 239.60 62.00 43.82 133.83 240 8.00
11015 55 156.20 60.50 30.00 105.50 102 5.90
11019 34 151.40 62.00 27.69 103.50 92 4.90
11025 47 177.00 60.00 34.56 109.00 112 5.70
11029 32 155.20 59.00 31.34 103.75 117 5.90
11031 30 206.00 61.50 38.29 124.75 114 5.40
11039 32 181.20 63.00 32.09 110.00 126 7.30
BMI, body mass index; HbA1c, hemoglobin A1c.

179
Data Sheets
ID Participants’ characteristics
Age
(years)
Weight
(kg)
Height
(cm)
BMI
(kg/m2)
Waist
circumference
(cm)
Fasting
blood
glucose
(mg/dL)
HbA1c
(%)
11042 39 175.40 60.75 33.41 113.25 135 6.10
11046 51 164.20 60.00 32.06 108.25 98 5.60
11103 32 203.60 60.00 39.76 117.75 132 5.80
11117 35 151.00 61.00 28.53 96.75 94 5.10
11120 56 159.80 61.00 30.19 101.50 99 5.50
11121 52 162.40 59.50 32.25 110.25 145 6.20
11124 59 215.60 61.00 40.73 121.00 112 6.10
11127 31 160.80 59.00 32.47 94.83 113 5.80
90001 35 188.80 56.50 41.58 115.00 100 5.40
90002 43 230.40 60.00 44.99 111.10 107 5.40
90003 31 216.80 59.25 43.41 129.15 129 6.30
90004 53 186.60 59.00 37.68 121.30 132 5.90
90005 19 188.80 62.25 34.25 114.73 102 5.30
90007 61 172.00 61.00 32.50 113.65 115 5.80
90008 43 295.60 60.70 56.40 156.85 121 6.00
90011 43 158.40 58.00 33.10 106.25 143 6.30
90013 41 158.80 60.00 31.01 111.25 113 5.40
90015 59 201.40 60.25 39.00 116.95 106 5.50
90017 37 190.00 62.00 34.75 117.75 98 5.80
BMI, body mass index; HbA1c, hemoglobin A1c.

180
Data Sheets
ID Participants’ characteristics
Age
(years)
Weight
(kg)
Height
(cm)
BMI
(kg/m2)
Waist
circumference
(cm)
Fasting
blood
glucose
(mg/dL)
HbA1c
(%)
90018 34 179.00 57.75 37.73 117.25 120 5.70
90019 31 229.40 61.50 42.64 131.15 126 5.60
90020 47 210.00 61.00 39.67 103.20 80 5.50
90021 19 232.60 63.25 40.87 120.75 88 5.40
90022 18 182.80 61.00 34.54 111.25 96 4.80
90023 42 205.40 62.00 37.56 119.00 164 6.40
90024 53 213.00 58.00 44.51 129.00 115 6.10
90025 38 246.40 61.00 46.55 138.33 114 5.50
90027 54 180.60 61.00 34.12 120.67 104 5.70
90028 39 171.00 62.50 30.77 101.75 275 9.20
90032 40 185.80 63.00 32.91 108.75 165 8.10
90033 48 248.00 62.25 44.99 130.25 120 5.80
90035 39 207.00 59.50 41.10 141.75 91 5.20
90037 47 260.80 63.00 46.19 135.33 215 8.00
90038 42 174.20 60.00 34.02 105.75 129 5.80
90040 38 190.00 59.00 38.37 120.25 116 5.60
90041 29 243.20 62.00 44.48 125.50 105 5.60
90042 52 204.20 60.00 39.88 122.25 150 8.30
90044 48 182.00 65.00 30.28 -- 113 5.60
BMI, body mass index; HbA1c, hemoglobin A1c.

181
Data Sheets
ID Dietary nutrient intake
Energy
(kcal)
CHO
(%kcal)
CHO
(g)
Total
sugars
(g)
Fiber
(g)
Protein
(g)
Total fat
(%kcal)
Alcohol
(%kcal)
10001 2027 53 271 82 33 95 30 .29
10002 1103 56 153 16 22 45 30 .05
10010 1189 61 182 82 23 47 27 .43
10016 1110 54 149 59 24 50 32 .13
10019 903 64 144 53 15 37 22 .06
10021 2143 45 241 100 25 99 39 .07
10027 1870 47 219 49 22 93 34 .44
10032 1388 44 151 50 15 61 38 1.84
10034 1483 40 147 39 13 68 42 .60
10035 1367 52 179 76 18 60 33 .00
10041 2373 46 274 113 31 151 30 .00
10042 3220 44 355 95 38 180 34 .03
10045 575 46 66 26 7 33 32 .42
10046 2737 64 440 187 48 107 23 .07
10054 3860 51 495 214 50 153 35 .09
10058 929 48 112 40 12 48 34 .06
10059 695 38 66 20 7 39 39 .35
10060 1027 55 141 52 20 38 34 .14
10064 1449 51 183 74 24 73 32 .17
10065 1607 49 198 63 23 77 33 .66
CHO, carbohydrates; kcal, kilocalories; %kcal, percentage of total kilocalories; g, grams.

182
Data Sheets
ID Dietary nutrient intake
Energy
(kcal)
CHO
(%kcal)
CHO
(g)
Total
sugars
(g)
Fiber
(g)
Protein
(g)
Total fat
(%kcal)
Alcohol
(%kcal)
10068 1247 54 170 49 26 55 31 .00
10078 976 62 152 54 17 36 26 .00
10079 1617 53 214 68 24 71 32 .03
10080 3268 64 526 207 57 119 23 .28
10084 1354 66 225 96 24 54 21 .00
10086 2845 54 383 163 35 101 35 .09
10087 1274 51 163 62 18 50 35 .00
10091 3237 52 420 220 32 150 31 .13
10096 1398 41 143 60 17 99 32 .00
10098 3398 47 396 192 34 154 36 .27
10101 960 61 147 78 14 40 25 .00
10102 2426 57 346 114 31 91 30 .00
10103 3834 49 468 134 54 172 36 .00
10106 1558 44 171 70 22 72 40 1.10
10109 528 51 68 17 8 24 30 2.19
10121 972 43 105 36 17 57 37 .00
10124 2364 58 341 122 38 100 28 .15
10142 1166 58 169 80 21 52 27 .12
10143 553 63 87 28 13 22 26 .00
10145 2864 60 429 158 62 123 26 .03
CHO, carbohydrates; kcal, kilocalories; %kcal, percentage of total kilocalories; g, grams.

183
Data Sheets
ID Dietary nutrient intake
Energy
(kcal)
CHO
(%kcal)
CHO
(g)
Total
sugars
(g)
Fiber
(g)
Protein
(g)
Total fat
(%kcal)
Alcohol
(%kcal)
10150 3732 41 383 127 47 233 34 .47
10152 1520 56 212 150 14 69 29 .09
10153 1492 60 224 99 28 63 27 .00
10161 1224 54 167 60 17 57 28 .99
10162 2582 52 335 108 47 125 31 .00
10165 1028 48 124 53 10 43 36 .58
10169 1013 49 124 43 15 51 33 .00
10170 1053 42 112 36 12 48 39 1.60
10202 929 41 95 31 9 42 42 .56
10205 1506 48 179 70 17 68 36 .40
10206 1613 48 194 76 18 76 35 .00
10207 1449 39 142 38 16 83 38 .42
10213 2178 50 270 85 27 103 32 .28
10216 1236 52 161 55 28 59 31 .48
10237 1527 68 258 90 36 53 22 .00
10239 1522 60 227 99 37 57 30 .08
10246 1629 44 178 56 19 68 40 1.02
10247 2464 50 307 98 38 104 36 .69
10248 642 54 87 26 12 28 31 .00
10250 1467 56 207 100 27 74 27 .09
CHO, carbohydrates; kcal, kilocalories; %kcal, percentage of total kilocalories; g, grams.

184
Data Sheets
ID Dietary nutrient intake
Energy
(kcal)
CHO
(%kcal)
CHO
(g)
Total
sugars
(g)
Fiber
(g)
Protein
(g)
Total fat
(%kcal)
Alcohol
(%kcal)
10256 1362 54 185 61 22 58 30 .18
10259 2546 41 258 86 26 126 40 .34
10261 1315 45 147 55 16 60 39 .00
10263 1778 52 233 90 16 76 31 .42
10272 3555 53 474 252 55 161 32 .04
10275 1670 49 204 104 18 82 33 .15
10282 2865 67 482 256 49 107 23 .00
10284 1616 49 198 65 25 78 34 .09
10287 1308 56 183 49 23 60 26 2.16
10295 1042 73 189 89 21 34 18 .00
10300 883 51 112 50 16 45 31 .03
10301 981 50 122 54 16 48 33 .62
10305 3917 46 453 169 36 185 36 .21
10329 717 69 123 59 17 25 22 .18
10341 2064 45 232 55 28 101 36 .29
10495 1325 49 163 80 15 56 36 .06
10542 1021 55 140 34 14 43 29 .75
10543 1437 54 195 72 25 63 30 .49
10608 2111 49 258 94 31 97 34 .06
10616 538 39 53 12 8 33 37 1.43
CHO, carbohydrates; kcal, kilocalories; %kcal, percentage of total kilocalories; g, grams.

185
Data Sheets
ID Dietary nutrient intake
Energy
(kcal)
CHO
(%kcal)
CHO
(g)
Total
sugars
(g)
Fiber
(g)
Protein
(g)
Total fat
(%kcal)
Alcohol
(%kcal)
10618 2102 39 205 72 22 129 37 .72
10621 1807 41 183 67 20 92 40 .66
10633 1213 63 192 65 27 43 26 .05
10637 1234 66 202 105 15 39 25 .26
10643 1898 44 208 89 19 112 34 .00
10648 903 64 145 54 18 34 25 .16
10649 1028 57 147 45 11 41 28 .23
10651 1006 58 146 49 21 34 32 .41
10654 1236 48 149 53 14 51 37 .53
10657 1250 59 183 100 15 52 27 .11
10667 1308 51 167 54 23 60 33 .46
10678 667 50 83 31 16 33 35 .36
10680 855 59 126 60 16 38 27 .07
10695 635 59 93 34 10 25 28 .09
10699 1237 53 165 66 18 60 30 .63
10703 1459 66 239 118 21 46 25 .10
10708 1188 68 201 83 21 38 23 .00
10711 767 46 88 33 13 53 28 .00
10726 1600 71 284 176 17 47 20 .20
10729 1378 52 179 64 19 69 30 .00
CHO, carbohydrates; kcal, kilocalories; %kcal, percentage of total kilocalories; g, grams.

186
Data Sheets
ID Dietary nutrient intake
Energy
(kcal)
CHO
(%kcal)
CHO
(g)
Total
sugars
(g)
Fiber
(g)
Protein
(g)
Total fat
(%kcal)
Alcohol
(%kcal)
10731 2318 47 270 91 37 103 38 .10
10735 1209 56 170 30 24 60 26 .11
10737 661 70 115 37 18 22 21 .00
10752 1029 48 124 44 11 40 37 .34
10758 720 53 95 24 10 29 33 .00
10769 1441 66 237 124 16 58 20 .50
10788 2141 52 279 126 38 105 32 .11
10793 903 60 135 21 18 35 27 .00
10795 791 61 120 41 11 27 29 .17
10796 1616 49 198 73 27 75 33 2.58
10798 1536 55 210 80 32 62 32 .00
10799 2216 63 349 217 48 94 25 .00
10800 2074 66 340 210 29 80 24 .12
10801 1542 48 186 73 24 72 36 .09
10804 1394 47 165 57 24 69 34 .88
10809 1400 56 197 101 17 71 26 .05
10810 3301 50 413 164 43 175 31 .07
10822 1878 45 213 71 28 102 35 .07
10848 892 68 152 30 19 30 21 .03
10851 923 66 152 18 19 34 22 .00
CHO, carbohydrates; kcal, kilocalories; %kcal, percentage of total kilocalories; g, grams.

187
Data Sheets
ID Dietary nutrient intake
Energy
(kcal)
CHO
(%kcal)
CHO
(g)
Total
sugars
(g)
Fiber
(g)
Protein
(g)
Total fat
(%kcal)
Alcohol
(%kcal)
10903 1056 66 174 44 30 38 24 .09
10904 1706 60 257 107 28 66 27 .08
10906 1395 66 230 62 32 50 23 .26
10907 2995 64 477 262 49 107 26 .08
10915 1056 56 148 79 15 51 28 .05
10917 961 51 122 39 11 41 34 .00
10923 2020 58 295 102 34 88 27 .00
10940 1348 56 188 59 18 45 33 .16
10943 1166 38 110 25 16 86 33 .00
10946 693 65 112 16 17 25 24 .00
10952 2258 54 302 93 45 103 29 2.72
10954 2371 42 248 95 18 111 40 .38
10959 863 48 103 26 15 41 35 .16
10963 1875 58 270 103 28 77 28 .03
10977 2540 47 299 103 38 113 37 .00
10982 1007 59 150 47 15 45 25 .00
10984 650 64 104 36 16 25 24 .00
10985 1839 56 257 111 34 81 29 .13
10986 2665 46 304 118 24 121 38 .03
10987 1127 59 166 27 21 45 27 .00
CHO, carbohydrates; kcal, kilocalories; %kcal, percentage of total kilocalories; g, grams.

188
Data Sheets
ID Dietary nutrient intake
Energy
(kcal)
CHO
(%kcal)
CHO
(g)
Total
sugars
(g)
Fiber
(g)
Protein
(g)
Total fat
(%kcal)
Alcohol
(%kcal)
10989 764 58 111 45 16 36 28 .00
10995 1528 44 170 68 24 72 38 .92
11002 1316 60 199 70 17 58 24 .06
11008 1100 59 163 43 17 41 28 .05
11009 1911 58 278 69 43 85 27 .07
11011 1609 55 220 70 23 66 31 .09
11014 1605 44 177 60 17 91 35 .00
11015 1780 46 206 50 29 88 36 .03
11019 1110 45 124 40 10 48 39 .01
11025 759 63 120 19 16 31 22 .07
11029 1760 56 246 107 30 80 29 .08
11031 1579 43 170 54 19 77 39 .00
11039 1920 53 254 53 28 76 33 .00
11042 1181 51 150 19 26 53 34 .00
11046 1095 57 155 36 19 48 28 .00
11103 2050 72 369 237 23 53 20 .38
11117 2123 48 253 93 29 103 34 .48
11120 840 58 121 56 14 34 29 1.04
11121 1404 46 162 58 17 71 35 .10
11124 1295 69 223 141 29 38 25 .00
CHO, carbohydrates; kcal, kilocalories; %kcal, percentage of total kilocalories; g, grams.

189
Data Sheets
ID Dietary nutrient intake
Energy
(kcal)
CHO
(%kcal)
CHO
(g)
Total
sugars
(g)
Fiber
(g)
Protein
(g)
Total fat
(%kcal)
Alcohol
(%kcal)
11127 1297 41 133 49 13 69 37 1.51
90001 1740 62 270 129 32 71 25 .01
90002 1723 68 293 173 25 51 23 .00
90003 1433 55 198 82 32 67 29 .43
90004 2302 48 277 135 20 110 34 .02
90005 1436 44 159 56 13 70 37 .10
90007 2039 51 258 111 27 109 29 .56
90008 2182 46 249 88 22 93 38 .28
90011 1485 51 191 77 25 74 32 .00
90013 1880 50 234 94 19 82 34 .13
90015 1445 74 268 131 29 44 18 .00
90017 1414 46 162 45 22 65 37 .10
90018 2346 62 362 176 42 94 26 .02
90019 2651 46 306 126 20 110 38 .51
90020 1517 43 162 63 16 75 39 .29
90021 633 66 104 40 14 24 23 .00
90022 1509 55 209 126 15 83 25 .04
90023 1710 58 246 104 30 80 26 .55
90024 525 51 67 21 6 27 31 .11
90025 1433 59 210 53 34 72 26 .04
CHO, carbohydrates; kcal, kilocalories; %kcal, percentage of total kilocalories; g, grams.
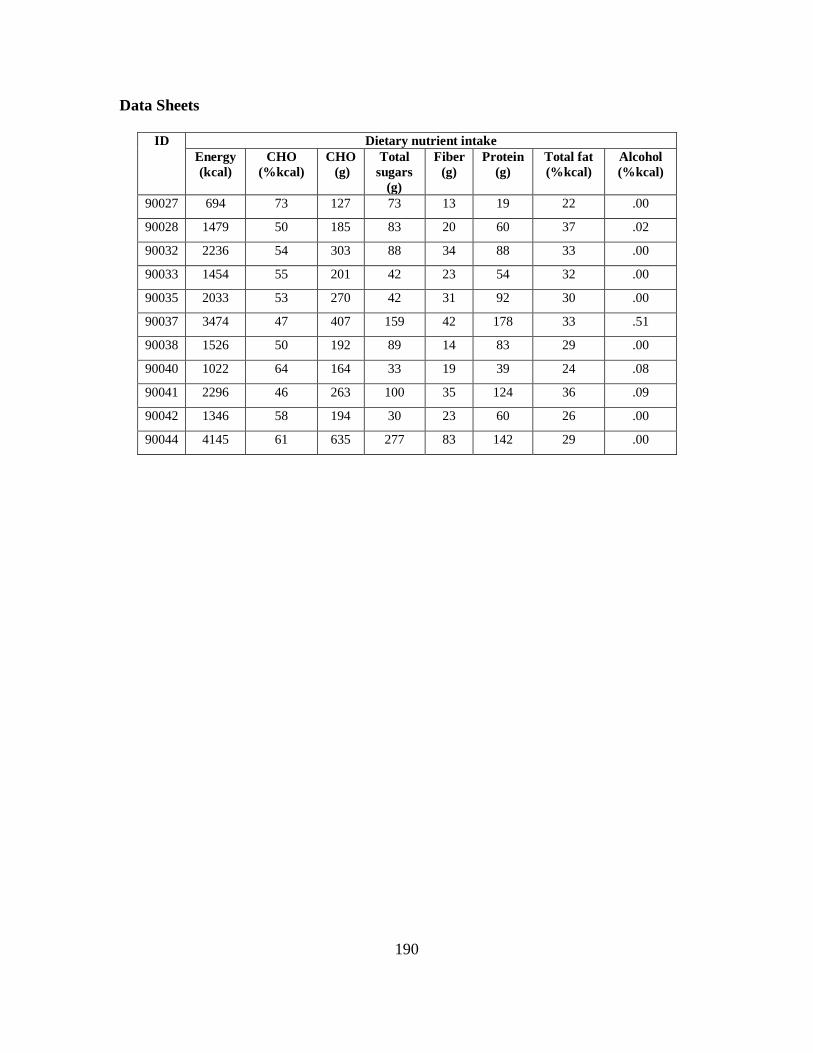
190
Data Sheets
ID Dietary nutrient intake
Energy
(kcal)
CHO
(%kcal)
CHO
(g)
Total
sugars
(g)
Fiber
(g)
Protein
(g)
Total fat
(%kcal)
Alcohol
(%kcal)
90027 694 73 127 73 13 19 22 .00
90028 1479 50 185 83 20 60 37 .02
90032 2236 54 303 88 34 88 33 .00
90033 1454 55 201 42 23 54 32 .00
90035 2033 53 270 42 31 92 30 .00
90037 3474 47 407 159 42 178 33 .51
90038 1526 50 192 89 14 83 29 .00
90040 1022 64 164 33 19 39 24 .08
90041 2296 46 263 100 35 124 36 .09
90042 1346 58 194 30 23 60 26 .00
90044 4145 61 635 277 83 142 29 .00

191
Data Sheets
ID Food group servings consumed per day
Dairy Read meat Mixed
dishes
Soups &
gravies
Eggs
10001 2.504718 .259871 1.682052 1.823452 .146428
10002 .214301 .127913 .997338 .865386 .362768
10010 .987234 .245545 .490586 .133870 .000000
10016 1.123024 .141200 .496994 1.661861 .084624
10019 2.497422 .176941 .159558 .179268 .042752
10021 3.775460 .354212 1.277464 .677812 .727611
10027 .558510 1.421435 1.612987 1.573500 .360692
10032 1.758346 .093547 1.776589 .818181 .042719
10034 1.820864 .645758 1.899647 .433225 .072723
10035 1.701893 .244976 .744789 .139907 .144050
10041 1.166114 .395444 2.671032 .699187 .359842
10042 .862290 1.558500 3.625812 3.041352 .363051
10045 1.557549 .438214 .406826 .077922 .072950
10046 5.545946 .534567 .470342 3.078981 .128015
10054 3.769470 1.611314 2.434627 2.680533 .532355
10058 1.547874 .212825 .481307 .388747 .181148
10059 .927746 .593851 .517757 .434247 .357294
10060 .029538 .198279 .893689 1.672507 .042686
10064 .995420 .605493 .961606 .973428 .072459
10065 .752468 .577618 1.070112 .819904 .183224
10068 .567101 .155181 .158434 .559471 .361258
10078 .362574 .223465 .525370 1.039769 .084161
10079 .322084 .763692 .885476 2.043933 .364089
10080 1.303952 .607971 1.584175 2.245719 .000000
10084 .351192 .032557 .190610 4.123455 .000000
10086 4.486109 .381751 1.354064 .879796 .364749

192
Data Sheets
ID Food group servings consumed per day
Dairy Read meat Mixed
dishes
Soups &
gravies
Eggs
10087 .081652 .424516 .521341 .480931 .545095
10091 5.190167 .797237 1.190835 .238135 1.518472
10096 .165823 .290386 1.643260 .278279 .760821
10098 8.392239 .596230 2.488089 1.038436 1.499447
10101 1.783005 .016973 .423404 .383891 .072459
10102 2.195685 .272411 3.001361 .156558 .218887
10103 2.266550 1.319854 2.290701 2.985896 2.310208
10106 .979840 .029739 1.175830 .148194 .721949
10109 .021173 .178269 .377537 .834848 .181148
10121 .443977 .345901 .667081 .416007 .362390
10124 1.300712 .744373 1.217860 2.102230 .533063
10142 1.580374 .671197 .249662 .493474 .362673
10143 .795555 .000000 .083333 1.157614 .181148
10145 4.271627 .391535 .835606 1.690842 .000000
10150 4.121875 2.280416 2.226931 .865025 .181148
10152 1.932613 .098022 .116787 2.480486 .033850
10153 .998545 .316461 .385281 2.240846 .760821
10161 1.161654 .260610 .508070 .932135 .144616
10162 .999110 .754297 .982767 2.300669 1.523228
10165 1.318663 .552473 .992656 .818181 .000000
10169 .912590 .268290 .620818 .213015 .144277
10170 .469992 .416516 1.370986 .740128 .050149
10202 .532964 .679348 .933879 1.790851 .142238
10205 2.172913 .272107 1.839239 1.576387 .000000
10206 1.697270 1.114693 .869844 .525558 .000000
10207 .892907 .588907 1.750535 .511983 .216906

193
Data Sheets
ID Food group servings consumed per day
Dairy Read meat Mixed
dishes
Soups &
gravies
Eggs
10213 2.128327 .552941 2.395751 1.576048 .722516
10216 .143345 .261410 .904329 1.612342 .364655
10237 .624923 .420777 .033333 .241535 .359842
10239 .907235 .056514 .860188 .730685 .366165
10246 .876129 .753407 .744632 1.033218 .359559
10247 1.249101 .643773 1.461808 1.025121 .358144
10248 .100617 .180900 .248027 .194977 .000000
10250 2.024019 .385492 .718072 .194805 .181148
10256 .840159 .265811 .675904 .466202 .211810
10259 1.711964 1.181007 2.708311 1.846028 .545803
10261 .418916 1.435382 .249149 .189739 1.518472
10263 2.872863 .376639 1.247536 .750830 .532355
10272 10.231395 .093806 .942605 1.635421 1.531551
10275 4.027489 .583504 .765403 .434721 .033532
10282 2.846532 .096399 .372389 .568290 .724780
10284 1.926389 .265633 1.370458 1.491861 .359276
10287 1.912496 .055670 .923943 .539397 .369185
10295 .953535 .179876 .220825 .387467 .000000
10300 1.738933 .240720 .348125 .986561 .360125
10301 .599507 .555346 .642464 .897027 .144616
10305 1.479201 2.744030 2.194608 2.788336 .531648
10329 1.151544 .000000 .147576 .142857 .146994
10341 .838231 .562303 2.732775 .563975 .181809
10495 1.558983 .336870 1.487509 .848479 .727611
10542 .498028 .218487 .581173 1.791676 .000000
10543 1.025092 .317797 1.698424 1.082336 .144730

194
Data Sheets
ID Food group servings consumed per day
Dairy Read meat Mixed
dishes
Soups &
gravies
Eggs
10608 1.208079 1.000710 1.677372 1.093078 .366071
10616 .818345 .496122 .269437 1.499999 .181809
10618 2.460735 .907761 2.510406 1.721636 .359842
10621 1.677208 .384361 2.568957 .528882 .359276
10633 .723892 .149138 .361784 .207751 .000000
10637 .043020 .190011 .973684 .540380 .143824
10643 3.534834 .839045 1.139997 .959183 .723648
10648 .252472 .102297 .349131 .139842 .072459
10649 .151643 .453696 .182481 .836874 .366071
10651 .539408 .068144 .114727 .897205 .085218
10654 1.440923 .233173 .454889 .702378 .361824
10657 1.090995 .272055 .972857 .614871 .083897
10667 .416053 .559615 .535245 1.499999 .072610
10678 .960659 .112271 .281881 .273801 .364655
10680 2.070090 .192705 .178607 .383715 .000000
10695 .133684 .062546 .642240 .878317 .033691
10699 .547930 .298965 1.261128 .581667 .144956
10703 1.108823 .226059 .318278 1.499999 .362107
10708 .792732 .000000 .289602 .997429 .000000
10711 .454070 .736363 .277532 .275386 .042785
10726 .766154 .306346 .677607 .898592 .042268
10729 2.395378 .523323 .635715 1.013374 .083633
10731 .944303 .500811 1.588252 1.046972 .721383
10735 .159331 .590447 .349714 2.368685 .128840
10737 .125953 .000000 .046856 1.277173 .072459
10752 .705383 .126979 1.216750 .336097 .084492

195
Data Sheets
ID Food group servings consumed per day
Dairy Read meat Mixed
dishes
Soups &
gravies
Eggs
10758 .000000 .052770 .461556 .429323 .363523
10769 3.363009 .069205 .128355 .818181 .072459
10788 .426232 1.049677 1.867818 2.255464 .084095
10793 .107431 .101725 .252017 1.150004 .366354
10795 1.195259 .035815 .425860 .836855 .072459
10796 1.481283 .503967 .498059 .583448 .359842
10798 1.180426 .073950 .225900 .244348 .144503
10799 3.758885 .101093 .161499 .415479 1.511338
10800 2.667272 .229631 .740308 1.083912 .145409
10801 2.608917 .274922 .927143 1.002308 .719685
10804 .349937 .165136 1.329128 1.357888 .362956
10809 2.790700 .015066 1.020428 1.615992 .362296
10810 4.073097 1.087859 2.019199 3.040513 .763001
10822 1.385837 .252922 1.940080 1.299006 .361824
10848 1.115616 .063593 .190505 .194805 .000000
10851 .479288 .098464 .132451 .253570 .362673
10903 .575088 .167973 .389094 1.038961 .000000
10904 1.370710 .393030 .946316 3.207760 .215207
10906 .714667 .029276 .527372 1.320261 .084293
10907 2.689713 .441235 .716797 .277857 .073007
10915 2.617347 .435204 .028974 .228435 .145069
10917 1.258207 .482357 .890616 .498861 .084227
10923 1.131509 .621434 .361668 .213616 .715721
10940 .099009 .261987 .862681 .142857 .083831
10943 .603852 .164343 .422371 .848587 .033744
10946 .000000 .028189 .159404 .033333 .362956

196
Data Sheets
ID Food group servings consumed per day
Dairy Read meat Mixed
dishes
Soups &
gravies
Eggs
10952 .848566 .156047 1.269688 1.389752 .721383
10954 1.446483 .565054 3.556975 .716340 .000000
10959 .342080 .266979 .632672 1.810263 .182941
10963 1.863032 .424471 1.141881 2.361674 .033400
10977 .632377 .495601 4.141911 1.377365 .033929
10982 2.874478 .065417 .184898 1.708934 .000000
10984 .000000 .030856 .031158 1.044360 .000000
10985 .961749 .428402 .418392 1.024100 1.530362
10986 5.916428 .978875 2.483282 .637613 .551465
10987 1.272622 .156242 .098011 .499230 .000000
10989 .184185 .032469 .086315 .410404 .182658
10995 1.102548 1.066059 .143434 .818181 1.511338
11002 .289147 .248954 .425143 1.038961 .000000
11008 .282980 .070083 .297101 .851515 .725347
11009 1.452055 .256129 .769881 .418068 .143144
11011 3.009195 .381779 .553245 .797619 .084095
11014 2.454189 .214230 .922624 1.447112 .033744
11015 3.789914 .026740 .834645 1.601427 .365221
11019 .828529 .413348 .680685 .438804 .768352
11025 1.000000 .085607 .186872 .195077 .000000
11029 3.071003 .286266 .717012 .354172 .357861
11031 2.979414 .484795 .208120 1.638504 .715721
11039 1.326923 .662179 .732718 1.998996 .358144
11042 .978432 .000000 .113886 .162113 .360125
11046 1.499534 .179344 .094795 .834848 .363523
11103 .412603 .486659 .828637 .315374 .143257

197
Data Sheets
ID Food group servings consumed per day
Dairy Read meat Mixed
dishes
Soups &
gravies
Eggs
11117 2.925971 1.029239 1.024103 1.159472 .358993
11120 1.396871 .164673 .422678 .886889 .016907
11121 1.795444 .317073 1.334438 .304057 .436567
11124 1.881168 .090103 .583333 1.499999 .085284
11127 1.137369 .574653 1.587146 2.405441 .033612
90001 2.251589 .408644 .936643 .343927 .143597
90002 .141714 .136126 .790370 1.788480 .144503
90003 .143862 .328213 1.006473 .329664 .143144
90004 3.671747 1.230740 1.396516 .925479 .364089
90005 1.213806 1.078334 .775679 1.549592 .777270
90007 1.950726 .703899 1.307212 1.047059 .553588
90008 2.325919 1.162412 2.196176 .871918 .722516
90011 1.706497 1.702272 .475911 .524737 .050479
90013 2.160542 .573890 1.235707 1.442498 .721383
90015 .487020 .062617 .000000 .431329 .072459
90017 1.674796 .511076 .847012 1.176476 .359559
90018 2.863809 .227298 .924917 1.280342 .143484
90019 1.599608 1.067480 1.134630 1.596546 1.503014
90020 1.283214 .390610 1.147131 .628609 .362390
90021 .570687 .072620 .507502 .047119 .000000
90022 5.069666 .557481 .343960 .078490 .017286
90023 .542440 .639200 .365711 2.378384 .000000
90024 1.075107 .059381 .358604 .259302 .000000
90025 .494505 .192221 .482792 1.545749 .182375
90027 .452349 .053616 .116667 .000000 .072459
90028 1.845023 .508700 .343691 .285811 .720251

198
Data Sheets
ID Food group servings consumed per day
Dairy Read meat Mixed
dishes
Soups &
gravies
Eggs
90032 3.278437 .376037 .994936 .848642 .720817
90033 .602621 .604664 .777065 2.212169 .544387
90035 1.138932 .000000 1.701234 .711275 .214924
90037 3.734642 1.374226 3.532965 1.549999 .362390
90038 3.425431 .243491 .570511 .453949 .360975
90040 .907159 .055802 .412736 1.129926 .125372
90041 3.063836 .824628 1.318366 1.690865 .357294
90042 .614726 .413100 .960783 .818181 .072459
90044 1.646117 .000000 .860579 1.937767 .362673

199
Data Sheets
ID Food group servings consumed per day
Beans &
seeds
Bread &
cereals
Pastries Salty
snacks
Fruits
10001 1.272813 5.980166 .155372 .000000 1.867517
10002 .747550 7.472354 .034526 .046593 .445828
10010 .271727 4.100825 .076824 .181733 4.720547
10016 .538426 1.441767 .381067 .104496 3.443654
10019 1.088087 3.561522 .000000 .000000 .710865
10021 .956387 3.963584 .307826 .152218 2.240012
10027 .338902 4.487984 .472545 .050404 1.357632
10032 .383601 1.999999 .634978 .373022 .617826
10034 .390963 2.157642 .518488 .317901 .337478
10035 .588825 3.142904 .124614 .112091 3.984511
10041 1.058052 1.436103 .534587 .091376 3.981519
10042 1.195489 4.999057 1.909205 .094832 1.751906
10045 .280311 1.308076 .132593 .023188 .600864
10046 1.460694 8.466274 .913131 .066667 11.62440
10054 2.360607 3.679354 1.083849 .678554 7.582441
10058 .461276 2.207191 .118314 .000000 1.302668
10059 .141279 1.271075 .140018 .058970 .389868
10060 1.762653 2.030103 .404464 .024825 4.122032
10064 .898673 2.489056 .125908 .284640 3.221812
10065 1.025458 2.912485 .165026 .159617 2.626439
10068 1.897071 1.358234 .000000 .000000 .709085
10078 .033333 4.522232 .000000 .000000 1.897586
10079 .597497 2.497996 .681855 .062160 2.778602
10080 2.657449 8.365645 1.489348 .206117 13.85510
10084 .204589 .727119 .000000 .135797 3.289602

200
Data Sheets
ID Food group servings consumed per day
Beans &
seeds
Bread &
cereals
Pastries Salty
snacks
Fruits
10086 2.258020 4.669926 1.333180 .356369 3.569419
10087 .599634 1.483988 .513202 .042782 2.283021
10091 1.560347 3.142416 1.986738 .000000 2.694318
10096 .193559 1.673430 .000000 .000000 1.781263
10098 1.364240 4.526633 1.034150 .134548 2.067361
10101 .444681 .724936 .342319 .058586 1.817533
10102 .721139 4.200601 .403653 .000000 3.929139
10103 .378596 5.138736 .333825 .169966 6.177748
10106 1.057526 1.461084 .660886 .112823 3.975823
10109 .054441 1.999999 .058757 .142857 .545758
10121 .929572 1.174929 .000000 .000000 1.618927
10124 .535803 6.976171 .634550 .096101 4.279636
10142 .624198 2.685349 .127022 .066667 3.639454
10143 .489365 2.344135 .000000 .000000 .724183
10145 4.656622 5.199860 .215952 .044283 7.124209
10150 3.460948 5.494726 .541939 .000000 2.626376
10152 .446080 .462738 .370614 .000000 .475557
10153 .269246 2.763544 .087844 .023188 3.360988
10161 .226580 1.763528 .261548 .024536 1.434221
10162 1.019711 4.720704 .370614 .052330 3.743623
10165 .393555 1.112090 .211269 .049689 .291084
10169 .336902 2.840313 .130922 .052763 2.488240
10170 .241780 .313475 .000000 .000000 .919210
10202 .113185 .376002 .107199 .197164 .869484
10205 .642414 2.914432 .406135 .000000 1.148813

201
Data Sheets
ID Food group servings consumed per day
Beans &
seeds
Bread &
cereals
Pastries Salty
snacks
Fruits
10206 .356465 3.409542 .000000 .132507 3.241346
10207 .346594 2.719477 .561509 .046593 1.148126
10213 1.486486 1.787228 .654396 .157919 2.686114
10216 1.430328 2.321168 .537839 .051897 2.220887
10237 1.535935 8.186938 .184782 .000000 2.792469
10239 1.424414 2.617840 .000000 .032980 7.311164
10246 .375835 2.055467 .490445 .560959 2.464328
10247 1.290614 3.474730 .889018 .199444 2.552032
10248 .525340 1.038140 .227809 .000000 1.184581
10250 .246595 2.365850 .255639 .024305 5.417992
10256 1.504595 2.909849 .426696 .102457 1.347527
10259 .878773 3.044368 1.002290 .199638 1.345143
10261 .088585 1.508664 .261210 .087038 2.357401
10263 .270573 4.797459 .540096 .271624 1.256175
10272 2.095530 4.608026 .804125 .057716 8.508149
10275 .496371 2.193435 .485853 .159218 1.638340
10282 .904403 4.265254 .255879 .000000 11.28577
10284 .982542 3.147265 .062397 .000000 2.236202
10287 .998635 6.076652 .000000 .000000 2.045202
10295 .469299 3.399021 .149861 .000000 4.171096
10300 .523236 1.290642 .000000 .000000 2.441677
10301 .459131 1.388111 .149493 .077897 2.869648
10305 .192291 5.571124 1.626362 .681239 6.477698
10329 .352826 2.054235 .210239 .000000 3.205747
10341 1.642474 2.753296 .316236 .261307 1.131312

202
Data Sheets
ID Food group servings consumed per day
Beans &
seeds
Bread &
cereals
Pastries Salty
snacks
Fruits
10495 .336349 2.291439 .096951 .000000 2.471488
10542 .274649 2.610457 .196660 .145592 .540258
10543 .885645 1.754258 .034526 .108660 4.202342
10608 2.155778 2.891783 .000000 .000000 1.669628
10616 .343675 1.101351 .086875 .000000 1.109850
10618 .689856 2.665774 1.374780 .231418 3.118487
10621 .384470 .397722 .673011 .000000 1.878573
10633 1.986854 4.249080 .327629 .000000 5.099961
10637 .083333 1.065013 .028857 .023188 3.068571
10643 .410184 2.621684 .552191 .082433 2.535275
10648 .567941 2.425192 .543998 .000000 2.761515
10649 .253344 3.292213 .000000 .024074 1.958936
10651 .395514 2.477615 .096886 .173585 1.609946
10654 .634543 1.222512 .664106 .361594 1.608451
10657 .453147 1.352328 .099367 .090286 1.528410
10667 1.608011 3.099945 .413174 .082750 3.678057
10678 .296883 1.366939 .000000 .000000 1.603017
10680 .449058 .825903 .359296 .000000 2.957750
10695 .458173 2.169987 .034799 .023188 .371937
10699 .458322 .972540 .178503 .044688 3.948223
10703 .731221 4.402831 .596552 .066667 1.899806
10708 .378723 5.006601 .698787 .047961 3.064719
10711 .281167 2.299353 .099498 .056679 1.586895
10726 .188290 2.221891 .414742 .106051 2.697481
10729 1.166439 3.136340 .712452 .119925 1.771318

203
Data Sheets
ID Food group servings consumed per day
Beans &
seeds
Bread &
cereals
Pastries Salty
snacks
Fruits
10731 1.571950 5.053731 .658675 .811278 4.429703
10735 1.131910 7.597331 .100746 .000000 .244883
10737 .789229 2.484661 .000000 .047263 2.852068
10752 .483602 1.238124 1.041912 .000000 .571447
10758 .090113 1.729603 .318386 .000000 .777114
10769 .297298 2.329709 1.046279 .000000 .325048
10788 .837226 1.926578 .178236 .117068 6.703477
10793 .416833 7.418511 .218016 .000000 .230812
10795 .100642 .534024 .000000 .000000 1.816096
10796 .265475 1.781521 .061877 .098370 2.867948
10798 2.474283 1.976902 .924110 .166862 2.265458
10799 .405695 2.233882 .000000 .000000 13.65263
10800 1.355268 1.920575 .376054 .142857 4.010445
10801 .859511 2.457513 .479466 .024710 2.253354
10804 1.312787 1.999999 .118125 .091757 1.806510
10809 .390262 1.781283 .092126 .000000 1.569220
10810 .899026 6.051322 .705741 .086125 4.793561
10822 .274129 4.496288 .574831 .113260 2.863243
10848 .857116 7.646722 .382540 .000000 .337755
10851 .133518 7.947233 .000000 .000000 .629006
10903 1.158186 7.316818 .060577 .000000 2.831806
10904 .628713 1.679225 .061617 .052309 5.146893
10906 .728047 8.188118 .199224 .095447 2.441761
10907 1.613910 3.712409 .121728 .324579 11.74642
10915 .648771 1.228035 .184148 .000000 2.966683

204
Data Sheets
ID Food group servings consumed per day
Beans &
seeds
Bread &
cereals
Pastries Salty
snacks
Fruits
10917 .100944 1.253165 .095636 .000000 .943936
10923 1.546036 8.377379 .136492 .215295 4.879776
10940 .355325 7.395242 .998347 .198611 .345480
10943 .566307 4.201340 .502628 .062502 .569232
10946 .440476 7.321564 .050964 .000000 .250257
10952 .791493 4.648799 .160570 .324025 3.715162
10954 .187695 1.449053 1.411966 .052763 .847046
10959 .829506 1.380129 .193511 .113043 .625119
10963 .329675 5.009522 .609541 .160146 2.583030
10977 1.435759 2.129781 .058497 .040877 1.317038
10982 .234282 4.894099 .278627 .042782 .753099
10984 .797510 .849041 .197791 .000000 1.655641
10985 1.075218 4.912246 .611593 .090914 4.749128
10986 .476693 7.870976 1.171096 .242756 .089818
10987 .611730 7.953297 .062397 .118216 1.055014
10989 1.043698 1.227527 .035346 .000000 1.231610
10995 1.121320 3.153198 .287929 .031703 2.327389
11002 .000000 7.414629 1.309551 .076185 .139440
11008 .033333 7.550529 .889157 .000000 .478903
11009 3.182349 7.865968 .300132 .159737 2.385745
11011 .428473 8.135138 1.196998 .115599 .981663
11014 .457072 2.190800 .121339 .000000 .677681
11015 2.237236 5.385363 .000000 .000000 1.874143
11019 .521158 .612646 .267137 .113043 .425557
11025 1.109697 4.202569 .896956 .000000 .817100

205
Data Sheets
ID Food group servings consumed per day
Beans &
seeds
Bread &
cereals
Pastries Salty
snacks
Fruits
11029 .939332 3.127340 1.610309 .093421 3.226110
11031 .115404 5.483915 .200189 .000000 1.202465
11039 .409317 8.569349 1.287418 .435364 1.178535
11042 1.514317 7.346427 .924252 .000000 .464786
11046 .256483 5.822653 .125351 .126123 1.536172
11103 .995359 4.296127 .256725 .144232 2.326807
11117 1.462396 5.408938 .303438 .220529 4.029848
11120 .500371 1.084990 .327921 .000000 2.303771
11121 .756032 2.377865 .478971 .098945 1.004101
11124 .478445 1.464511 .000000 .000000 12.39834
11127 .224721 .624714 .252092 .376557 .944233
90001 .651045 3.323013 .195293 .122787 5.441626
90002 1.284542 1.188898 .109083 .088389 2.790986
90003 .927083 2.208312 .588803 .024912 5.324701
90004 .550009 1.823605 1.561067 .150177 1.621959
90005 .227168 1.319754 .206162 .071364 .743810
90007 .216597 2.827500 1.823551 .000000 2.724962
90008 .517510 2.664649 .502379 .199372 2.096700
90011 .784361 2.094207 .055278 .161542 8.144279
90013 .054441 1.809957 .087303 .158290 2.546148
90015 .446515 2.485891 .033159 .000000 6.615143
90017 1.487316 4.156080 .755352 .000000 1.149855
90018 1.424531 3.965958 .195233 .133520 5.221583
90019 .471121 3.278871 2.332434 .385271 2.325214
90020 .752781 .819199 .418481 .415141 1.419760

206
Data Sheets
ID Food group servings consumed per day
Beans &
seeds
Bread &
cereals
Pastries Salty
snacks
Fruits
90021 .411584 1.999999 .000000 .000000 2.597258
90022 .843298 2.137090 .207401 .072316 2.899852
90023 1.707788 3.752737 .069599 .176416 2.237878
90024 .406057 1.316667 .072422 .023188 .200860
90025 .326427 8.387347 .061877 .084965 1.627117
90027 .142857 .549557 .123680 .000000 2.808317
90028 .822834 1.272060 1.915514 .144615 2.249633
90032 .932878 8.477076 .845848 .064242 3.161205
90033 .343558 8.474053 .110960 .671762 .815329
90035 .783447 8.603769 .747360 .113043 1.047676
90037 1.538051 3.307406 .801254 .095759 3.244423
90038 .078579 1.883418 .339973 .024594 1.053078
90040 .211213 8.532065 .035164 .054892 1.217413
90041 1.492720 3.076371 .092449 .321681 9.661994
90042 .363509 8.539971 1.238795 .024305 1.561552
90044 5.817741 2.382022 .355068 .687538 10.41022
207
Data Sheets
ID Food group servings consumed per day
Starchy
sides dishes
Vegetables Condiments Fats & oils Sweets
10001 .919964 4.655049 .146522 .000000 .172419
10002 .359122 1.259574 1.038550 .099665 .000000
10010 .043271 8.256284 .234647 .213509 .326429
10016 .363966 6.149190 .000000 .000000 .271641
10019 .204275 .750832 .000000 .000000 .495067
10021 .424567 4.338588 .067541 .434704 .242109
10027 .413690 6.254868 .550128 .210314 .192635
10032 1.319443 1.808996 .500000 .070742 .539632
10034 .528239 .922480 .136847 .278464 .386544
10035 .452922 3.609623 .000000 .034288 1.510379
10041 .260102 8.161057 .000000 .000000 1.021835
10042 .731415 7.188039 .086786 .432649 .304296
10045 .086672 .540980 .000000 .034288 .099984
10046 .180192 7.734412 1.000000 .066667 .094305
10054 .972401 4.928413 .420093 .423239 1.980176
10058 .016352 3.992197 .000000 .107762 .210570
10059 .185552 .736462 .000000 .034288 .037478
10060 .000000 1.101604 .000000 .034288 .806783
10064 .498914 7.344169 .000000 .073474 .481284
10065 .735365 4.295173 .000000 .100830 .552585
10068 .598346 9.813164 .071429 .073474 .250008
10078 .556618 2.553292 .000000 .000000 .158270
10079 1.186670 7.354189 .632943 .073474 .140229
10080 .071656 6.896482 .000000 .068341 1.529828
10084 .873028 9.466902 .000000 .073474 1.726999

208
Data Sheets
ID Food group servings consumed per day
Starchy
sides dishes
Vegetables Condiments Fats & oils Sweets
10086 .486981 2.963247 .000000 1.233873 3.808426
10087 .403986 3.506456 .000000 .440843 .670598
10091 .746118 4.742703 .000000 1.570112 1.658115
10096 .018748 1.940578 .000000 .000000 .119094
10098 .557792 3.474024 .071665 .064298 1.775307
10101 .150842 2.290921 .000000 .000000 .553858
10102 .255312 4.425225 .037447 .212831 .213749
10103 3.543617 13.08712 .000000 .571134 .133296
10106 .197621 7.691138 .063862 .567641 .641944
10109 .366640 3.443137 .000000 .000000 .000000
10121 .139035 4.490678 .222010 .000000 .000000
10124 .615527 6.954333 .509773 .253435 .382531
10142 .000000 4.113924 .214286 .220421 .366691
10143 .000000 2.549922 .000000 .000000 .336121
10145 .382548 11.76542 .036501 .213509 .190540
10150 .376204 3.996135 .000000 .220421 .000000
10152 .306375 6.076357 .000000 .217740 .124574
10153 .413169 4.785082 .036501 .248573 .411461
10161 .776028 5.053011 .038708 .140775 .200916
10162 2.140520 10.82276 .500000 .212378 .558205
10165 .594437 2.794901 .071429 .073474 .055918
10169 .143360 3.488511 .258674 .107762 .229288
10170 .650938 1.813840 .065682 .065682 .180230
10202 .322102 .722310 .000000 .068576 .197481
10205 .457307 2.667614 .000000 .000000 .210107

209
Data Sheets
ID Food group servings consumed per day
Starchy
sides dishes
Vegetables Condiments Fats & oils Sweets
10206 .308167 3.428399 .428571 .428450 .452777
10207 .143419 2.591314 .399791 .287722 .090702
10213 1.865737 1.845340 .000000 .067301 .000000
10216 .179793 5.156425 .000000 .000000 .398863
10237 .173347 4.618272 .500000 .101589 .196420
10239 .041720 10.70179 .086664 .253435 .498749
10246 .819458 4.297209 .510035 .640566 .183936
10247 .238831 10.04440 .040601 .178504 1.376662
10248 .432541 2.589707 .214286 .000000 .184877
10250 .420091 9.005325 .214286 .220421 .120300
10256 .305405 2.728044 .072222 .034288 .649827
10259 .946763 3.428378 .186694 .433026 .951855
10261 .688963 1.866684 .038708 .033013 .123406
10263 .170517 1.582506 .149985 .587699 .856796
10272 .736933 18.10614 .500000 .220421 .059274
10275 .108778 1.735628 .500000 .291164 .504701
10282 .306405 8.752519 .000000 .000000 .122524
10284 .538498 2.972419 .071429 .136148 .276826
10287 .287145 1.082482 .034459 .000000 .000000
10295 .056625 4.823989 .000000 .000000 .879482
10300 .218647 5.271310 .539497 .220421 .000000
10301 .225645 2.462843 .000000 .000000 .093968
10305 .743442 6.274036 .000000 .832330 .953708
10329 .305869 3.815717 .051042 .033336 .000000
10341 .371181 3.459483 .039024 .144216 .891909

210
Data Sheets
ID Food group servings consumed per day
Starchy
sides dishes
Vegetables Condiments Fats & oils Sweets
10495 .352082 3.746438 .037447 .434704 1.088263
10542 .744208 3.393905 .063304 .140775 .221419
10543 .378375 4.219235 .000000 .033013 .214850
10608 .170717 5.532642 .192888 .440843 .118702
10616 .143346 2.329449 .000000 .067301 .064214
10618 .381537 3.917254 .066091 .101589 .689174
10621 .275931 7.155595 .269513 .673899 .609946
10633 .432957 2.829575 .000000 .144011 .181697
10637 1.246211 4.333086 .000000 .072971 .035112
10643 .104951 4.811791 .000000 .254709 .583087
10648 .059926 3.918119 .000000 .000000 .000000
10649 .613280 2.826063 .000000 .282311 .712438
10651 .489459 6.900531 .000000 .067483 .637093
10654 .492772 4.382786 .000000 .499217 .370420
10657 .451798 3.200631 .039812 .102629 .598274
10667 .172519 3.393087 .038708 .653070 .000000
10678 .034015 8.903716 .000000 .218912 .000000
10680 .098506 5.460070 .000000 .000000 .093218
10695 .197621 1.378809 .039024 .034288 .070728
10699 .151483 2.821643 .672680 .068341 .154670
10703 .627139 4.436285 .000000 .140140 .259190
10708 .232597 2.780403 1.043485 .034737 .215435
10711 .069362 1.499267 .000000 .000000 .066092
10726 .835161 5.411639 .079905 .326138 .502882
10729 .141902 2.930535 .040443 .140775 .361712
211
Data Sheets
ID Food group servings consumed per day
Starchy
sides dishes
Vegetables Condiments Fats & oils Sweets
10731 .356993 6.156465 1.079845 .762890 .303100
10735 .669246 2.938965 .072686 .146250 .085534
10737 .181170 4.564718 1.000000 .000000 .000000
10752 .274844 2.400159 .038393 .287722 .064091
10758 .105361 2.529901 .000000 .000000 .061392
10769 .993605 4.845073 .000000 .000000 .857143
10788 .285915 9.878092 .000000 .477580 .484586
10793 .187556 1.676841 .110535 .000000 .055257
10795 1.337619 2.609597 .500000 .392884 .000000
10796 .074953 6.056790 .039655 .293392 .139458
10798 .070236 7.123843 .000000 .253435 .731373
10799 .160318 14.01781 .000000 1.107761 .159808
10800 .170429 3.459204 .223689 .000000 .033250
10801 .701962 4.964408 .000000 .653070 .062505
10804 .239197 3.827756 1.000000 .034288 .029417
10809 .159205 3.824175 .000000 .073474 .000000
10810 .828780 7.288080 .000000 .220421 .561332
10822 .557003 6.626015 .000000 .218912 .000000
10848 .034064 2.284765 .000000 .034288 .394680
10851 1.558166 1.050230 .214286 .285714 .000000
10903 .082433 4.360519 .000000 .142231 .090977
10904 1.060961 3.563518 .338419 .389084 .415573
10906 .122610 6.245728 .000000 .033013 .063187
10907 .375258 15.74606 1.419416 .220421 1.287871
10915 .000000 2.913991 .222430 .437107 .263090

212
Data Sheets
ID Food group servings consumed per day
Starchy
sides dishes
Vegetables Condiments Fats & oils Sweets
10917 .761578 1.953446 .039024 .068576 .062403
10923 .030664 1.173552 .000000 .000000 .198478
10940 .252712 .217961 .000000 1.740905 2.695196
10943 .143319 3.068350 .000000 .208648 .444873
10946 .018540 1.641942 .000000 .067205 .000000
10952 .587972 12.70079 .504951 .073474 .213519
10954 .324847 1.312333 .000000 1.278400 .386682
10959 .280557 3.045502 .040286 .034288 .000000
10963 .617651 4.222607 .543115 .220421 1.100149
10977 1.222906 10.35548 .000000 .000000 .056629
10982 .364926 2.835393 .000000 .033054 .898533
10984 .767190 1.815542 .000000 .000000 .000000
10985 .245453 5.730309 .037131 .034288 1.792849
10986 .221414 2.472384 .073387 1.597037 2.268801
10987 .430656 2.555510 .000000 .098419 .063116
10989 .613505 6.701873 .000000 .000000 .179303
10995 .175269 2.853652 .424244 .495197 1.347539
11002 .542974 2.556909 .064419 .274108 .454415
11008 .638471 .294994 .000000 .034288 .116605
11009 .221314 2.888125 .420093 .067301 .130102
11011 .319803 2.117161 .000000 .522997 .703165
11014 .801436 1.707374 .066667 .558084 .061100
11015 .429047 5.429540 .000000 .000000 .384309
11019 .508564 2.480631 .000000 .139562 .686080
11025 .614106 .297862 .000000 .000000 .885481

213
Data Sheets
ID Food group servings consumed per day
Starchy
sides dishes
Vegetables Condiments Fats & oils Sweets
11029 .129681 8.900992 .040759 .106807 .536616
11031 .225771 4.403887 .071765 .101589 .170663
11039 .154190 3.660203 .148790 .212227 .065708
11042 .029777 3.452627 .510190 .068576 .027855
11046 .071467 2.854519 1.011552 .101665 .216259
11103 .307489 5.471528 .040601 .462059 1.215571
11117 .689654 2.564083 .067763 .163547 .662528
11120 .125906 2.400979 .000000 .180732 .634525
11121 .447761 2.399500 .492482 .067621 .179083
11124 .083821 4.968897 .000000 .000000 .119290
11127 .203919 1.473703 .169273 .219918 .155210
90001 .309920 6.025349 .000000 .034288 .285432
90002 .434059 4.378080 .000000 .034288 1.731806
90003 .202761 8.081585 .000000 .220421 .000000
90004 .447455 3.781235 .137636 .253546 .950441
90005 .494631 2.853678 .042651 .287759 .212519
90007 .171288 7.124472 .036028 .000000 .331502
90008 .576692 4.171759 .034274 .440843 .828612
90011 .434059 5.432122 .000000 .460982 .563445
90013 1.354969 5.206349 .000000 .067301 .416366
90015 .613280 7.727537 .219996 .071245 .414012
90017 .306703 1.986259 .000000 .070742 .537154
90018 .142990 8.948958 1.403601 .000000 .486701
90019 .897099 1.580717 .000000 .844013 .728791
90020 .629447 2.457619 1.127435 .200524 .680400

214
Data Sheets
ID Food group servings consumed per day
Starchy
sides dishes
Vegetables Condiments Fats & oils Sweets
90021 .418835 .558964 .000000 .000000 .000000
90022 .137901 1.456950 .042809 .000000 .373890
90023 .365083 5.787906 .065711 .067301 .176556
90024 .214816 2.185605 .000000 .000000 .000000
90025 .104161 10.21466 .034288 .099280 .259829
90027 .422963 1.528739 .598353 .144493 .071250
90028 .655900 5.055935 1.007818 .034288 1.173976
90032 1.052277 2.433190 .000000 .067301 .659977
90033 .142421 2.733663 .074143 .212378 .224034
90035 1.086130 2.054738 .000000 .132014 .101225
90037 1.517479 7.064801 .081933 .508181 1.250415
90038 .537300 4.131456 .066667 .165486 .210894
90040 .245275 1.143935 .105746 .067301 .086280
90041 .423135 13.55606 .152373 .907242 .343559
90042 .126676 3.627945 .000000 .034288 .060948
90044 1.748378 14.01674 .684651 .067067 .395061

215
Data Sheets
ID Food group servings consumed per day
Fish Poultry Drinks Alcohol
10001 .079528 .324765 .276190 .000000
10002 .112804 .075021 2.066667 .000000
10010 .254715 .116861 1.000000 .038848
10016 .277161 .039490 .428571 .000000
10019 .000000 .000000 1.066667 .000000
10021 .077083 .197039 .628571 .000000
10027 .147989 .201586 1.285714 .070015
10032 .000000 .032585 2.000000 .000000
10034 .165951 .096025 1.066667 .000000
10035 .581228 .167569 1.495238 .000000
10041 .541005 .537191 6.066667 .000000
10042 .146685 .093878 .923810 .000000
10045 .015502 .054900 1.066667 .000000
10046 .182563 .000000 3.214286 .000000
10054 .136890 .088220 1.780952 .000000
10058 .624541 .028566 1.142857 .000000
10059 .536223 .000000 1.142857 .000000
10060 .000000 .000000 .990476 .000000
10064 .468544 .318270 4.000000 .000000
10065 .272343 .387692 .495238 .084055
10068 .255669 .224276 1.066667 .000000
10078 .255118 .031414 1.000000 .000000
10079 .090156 .340497 1.495238 .000000
10080 .272450 .042703 3.133333 .000000
10084 .244662 .334547 .857143 .000000

216
Data Sheets
ID Food group servings consumed per day
Fish Poultry Drinks Alcohol
10086 .057128 .171973 2.571429 .000000
10087 .199798 .151735 .276190 .000000
10091 .030710 .360723 5.142857 .037707
10096 .384148 .123238 .780952 .000000
10098 .202722 .000000 1.852381 .000000
10101 .093744 .097828 1.923810 .000000
10102 .000000 .085292 2.000000 .000000
10103 .220834 .324922 2.285714 .000000
10106 .748737 .328614 2.352381 .170723
10109 .041667 .057406 .142857 .109459
10121 .413805 .324374 .990476 .000000
10124 .176435 .218653 1.852381 .000000
10142 .028014 .128936 1.285714 .000000
10143 .203627 .000000 1.428571 .000000
10145 .000000 .031541 .066667 .000000
10150 .000000 .383937 .428571 .000000
10152 .228213 1.353825 4.571429 .000000
10153 .000000 .237657 1.209524 .000000
10161 .311656 .020882 1.133333 .121388
10162 .066292 .000000 1.000000 .000000
10165 .000000 .118684 2.142857 .000000
10169 .470696 .266990 1.285714 .000000
10170 .139087 .082910 .066667 .153088
10202 .179828 .069544 .276190 .039356
10205 .106429 .000000 1.142857 .000000

217
Data Sheets
ID Food group servings consumed per day
Fish Poultry Drinks Alcohol
10206 .110536 .117669 1.428571 .000000
10207 .000000 .092805 .066667 .000000
10213 .056853 .130534 1.214286 .000000
10216 .204553 .180693 1.352381 .000000
10237 .102947 .000000 2.000000 .000000
10239 .039543 .022896 2.066667 .000000
10246 .351632 .063099 1.200000 .139010
10247 .491344 .163492 3.066667 .150263
10248 .238299 .113544 .495238 .000000
10250 .174355 .305825 .571429 .000000
10256 .224694 .044849 .342857 .000000
10259 .304478 .246975 1.209524 .000000
10261 .055484 .107357 2.285714 .000000
10263 .049782 .199404 .847619 .063782
10272 .231760 .071889 1.857143 .000000
10275 .362857 .179086 1.714286 .000000
10282 .653061 .326071 .000000 .000000
10284 .132291 .064311 .571429 .000000
10287 .103108 .025717 1.000000 .289371
10295 .011846 .000000 .495238 .000000
10300 .413992 .052837 1.638095 .000000
10301 .185776 .061090 .133333 .000000
10305 .437820 .232109 2.428571 .084117
10329 .026621 .000000 1.428571 .000000
10341 .235309 .261091 1.495238 .000000

218
Data Sheets
ID Food group servings consumed per day
Fish Poultry Drinks Alcohol
10495 .112713 .022575 1.571429 .000000
10542 .033565 .153731 .542857 .064837
10543 .182472 .076637 1.495238 .064825
10608 .138091 .023001 3.142857 .000000
10616 .170935 .000000 .133333 .064842
10618 .948964 .459682 1.200000 .064866
10621 .805055 .284256 .428571 .123010
10633 .000000 .029895 1.000000 .000000
10637 .072288 .000000 2.000000 .000000
10643 .088090 .720191 1.571429 .000000
10648 .000000 .098361 .428571 .000000
10649 .012524 .146011 2.000000 .000000
10651 .253353 .057474 .428571 .035897
10654 .147232 .030033 1.066667 .064825
10657 .418882 .112169 3.133333 .000000
10667 .169420 .261814 .276190 .000000
10678 .030827 .043308 .571429 .000000
10680 .099874 .074263 .571429 .000000
10695 .028260 .078311 1.352381 .000000
10699 .675890 .203767 1.704762 .079661
10703 .061433 .030465 3.066667 .000000
10708 .285726 .023052 2.852381 .000000
10711 .285045 .297949 .133333 .000000
10726 .164174 .110517 6.571429 .000000
10729 .042554 .082334 1.276190 .000000

219
Data Sheets
ID Food group servings consumed per day
Fish Poultry Drinks Alcohol
10731 .319746 .468939 1.352381 .000000
10735 .062732 .066154 2.495238 .000000
10737 .000000 .000000 1.000000 .000000
10752 .086075 .091732 1.561905 .000000
10758 .050559 .022966 .000000 .000000
10769 .537213 .020022 2.142857 .074339
10788 .387897 .022923 2.214286 .000000
10793 .127589 .118355 1.209524 .000000
10795 .121166 .000000 1.000000 .000000
10796 .886070 .342686 1.352381 .416993
10798 .198781 .263539 2.000000 .000000
10799 .409198 .472510 4.000000 .000000
10800 .169005 .148055 .495238 .000000
10801 .445933 .074304 2.561905 .000000
10804 .504978 .118021 2.428571 .064802
10809 .032637 .186204 .142857 .000000
10810 .667002 1.722888 4.071429 .000000
10822 .929930 .205348 1.000000 .000000
10848 .028796 .050687 2.066667 .000000
10851 .091905 .098377 1.428571 .000000
10903 .033565 .104561 .704762 .000000
10904 .447261 .145832 .704762 .000000
10906 .279516 .031035 .209524 .037885
10907 .517021 .137888 4.142857 .000000
10915 .076007 .073486 1.000000 .000000

220
Data Sheets
ID Food group servings consumed per day
Fish Poultry Drinks Alcohol
10917 .106054 .116471 .428571 .000000
10923 .079446 .083283 1.000000 .000000
10940 .000000 .000000 1.785714 .000000
10943 .070854 1.416831 1.066667 .000000
10946 .030326 .029895 .857143 .000000
10952 .545964 .165423 2.000000 .620679
10954 .390721 .367465 2.428571 .000000
10959 .108658 .032372 .142857 .000000
10963 .079269 .000000 3.066667 .000000
10977 .310034 .073788 2.133333 .000000
10982 .195523 .103919 1.142857 .000000
10984 .096479 .346756 1.000000 .000000
10985 .189265 .070296 5.571429 .000000
10986 .319106 .110509 3.000000 .000000
10987 .000000 .346756 .428571 .000000
10989 .183139 .183125 1.857143 .000000
10995 .000000 .000000 2.000000 .138998
11002 .120661 .563817 2.066667 .000000
11008 .000000 .044483 1.428571 .000000
11009 .104396 .164281 .923810 .000000
11011 .030859 .062700 2.000000 .000000
11014 .329034 .638675 .333333 .000000
11015 .116898 .598457 1.000000 .000000
11019 .101031 .067000 .857143 .000000
11025 .000000 .000000 1.000000 .000000

221
Data Sheets
ID Food group servings consumed per day
Fish Poultry Drinks Alcohol
11029 .126796 .081756 .923810 .000000
11031 .142238 .193232 .571429 .000000
11039 .029325 .223370 1.000000 .000000
11042 .183590 .000000 1.000000 .000000
11046 .030835 .316235 .923810 .000000
11103 .058773 .033123 6.704762 .064900
11117 .182399 .137826 .200000 .090584
11120 .059159 .188569 1.000000 .076240
11121 .326730 .431505 2.000000 .000000
11124 .000000 .000000 1.000000 .000000
11127 .377754 .235485 1.409524 .152908
90001 .293383 .057260 2.066667 .000000
90002 .154971 .031035 4.066667 .000000
90003 .169223 .142772 1.428571 .000000
90004 .164896 .246285 3.066667 .000000
90005 .308935 .124499 1.928571 .000000
90007 .038473 .377253 1.571429 .101798
90008 .118328 .031035 1.428571 .000000
90011 .151601 .197793 .495238 .000000
90013 .074863 .244990 2.638095 .000000
90015 .317483 .086026 .571429 .000000
90017 .140264 .000000 1.342857 .000000
90018 .715062 .000000 2.285714 .000000
90019 .116414 .107830 3.066667 .063782
90020 .542832 .341781 1.771429 .032976

222
Data Sheets
ID Food group servings consumed per day
Fish Poultry Drinks Alcohol
90021 .000000 .000000 .000000 .000000
90022 .000000 .189105 .209524 .000000
90023 1.419503 .131445 3.133333 .090605
90024 .053018 .029135 .495238 .000000
90025 .721778 .337729 1.561905 .000000
90027 .030829 .028946 1.142857 .000000
90028 .056854 .371960 1.209524 .000000
90032 .028669 .077740 1.066667 .000000
90033 .122776 .053040 .571429 .000000
90035 .197812 .458388 .000000 .000000
90037 .376708 .202199 .561905 .000000
90038 .773943 .411224 .133333 .000000
90040 .107128 .106957 .200000 .000000
90041 .802771 .470976 .428571 .000000
90042 .000000 .070055 1.000000 .000000
90044 .000000 .000000 .209524 .000000