aquifers and quality of ground water along the gulf coast ... · along the gulf coast of western...
TRANSCRIPT

STATE OF FLORIDA
STATE BOARD OF CONSERVATION
DIVISION OF GEOLOGY
FLORIDA GEOLOGICAL SURVEY
Robert O. Vernon, Director
REPORT OF INVESTIGATIONS NO. 29
AQUIFERS AND QUALITY OF GROUND WATER
ALONG THE GULF COAST OF WESTERN FLORIDA
By
Jack T. Barraclough and Owen T. Marsh
U. S. Geological Survey
Prepared by the
UNITED STATES GEOLOGICAL SURVEY
in cooperation with the
FLORIDA GEOLOGICAL SURVEY,
ESCAMBIA COUNTY, SANTA ROSA COUNTY,
and the
CITY OF PENSACOLA
TALLAHASSEE
1962
CULTUaA4LIBRAY
FLORIDA STATE BOARD
OF
CONSERVATION
FARRIS BRYANT
Governor
Tom Adams Richard Ervin
Secretary of State Attorney General
J. Edwin Larson Ray E. Green
Treasurer Comptroller
Thomas D. Bailey Doyle Conner
Superintendent of Public Instruction Commissioner of Agriculture
W. Randolph Hodges
Director
ii

LETTER OF TRANSMITTAL
cW-
'_'nonida LgeoloqlcalTallahassee
August 8, 1962
Honorable Farris Bryant, ChairmanFlorida State Board -of ConservationTallahassee, Florida
Dear Governor Bryant:
The Division is publishing, as Florida Geological Survey Report ofInvestigations No. 29, a comprehensive report on the aquifers and qual-ity of ground water along the gulf coast of western Florida, writtenby Mr. J. T. Barraclough,' engineer, and Mr. Owen T. Marsh, geologist,U. S. Geological Survey. This report was prepared in cooperation withthis department, Escambia County, Santa Rosa County, and the Cityof Pensacola.
Three separate aquifers have been identified, each being separatedby clay aquicludes. With the definition of the geology in this area, itbecomes possible to make some tentative plans for deep well wastedisposal, as well as the wise and comprehensive management of thefresh water resources contained in the shallow aquifers.
Respectfully yours,
Robert O. Vernon, Directorand State Geologist
iii

Completed manuscript received
February 21, 1962
Published for the Florida Geological Survey
By Rose Printing Company, Inc.
Tallahassee, Florida
August 8, 1962
iv
CONTENTS
Page
Abstract 1______________
Introduction 1___ ___ _ _____-____--
Purpose and scope -_____
Location of the area _ -- ---------_-_-------__ ---- 2
Previous work __2_____-------
Acknowledgments -___---_- ---- __ 3
Geology and hydrology 4______ .___._____ 4
Geologic setting -- -- _____ _ 4
Hydrologic principles 4_____
Aquifers 7_______ _ -_7
Sand-and-gravel aquifer 7-_ ------ 7Floridan aquifer 9- ----- 9
Upper limestone - 10
Lower limestone _ _____ 16
Aquicludes _17
Miocene clay __ ____17
Bucatunna Clay Member __17
Middle Eocene clay and shale - 18
Chemical quality of ground water 18
Definitions and general discussion -------- - 18
Water in the sand-and-gravel aquifer 20
Dissolved solids ___- ------ 20
Hardness 20
Chloride 20Fluoride _20
Iron _____ -- 20
Dissolved gases __-20
Water in the Floridan aquifer 20
Upper limestone of the Floridan aquifer __21
Dissolved solids _--21
Hardness ___ _ 21
Chloride .- --- ___ _22
Fluoride ___ -- -23
Iron ____ 24
Dissolved gases -_________ 24
Lower limestone of the Floridan aquifer - --- 24
Summary and conclusions ----- ------- 25
References ------- ------- - - 27
V


ILLUSTRATIONS
Figure Page
1 Location of area described in this report ....-----...........-----... 3
2 Aquifers and aquicludes along the gulf coast of western Florida asshown in representative test well near Pensacola ---.......--.---..... --- ---... 5
3 Geologic cross section A-A' along the gulf coast of western Florida - 6
4 Water levels in a well in the sand-and-gravel aquifer and a well in theFloridan aquifer compared with rainfall at Pensacola --------- 9
5 Western Florida gulf coast showing structure contours on top of theupper limestone of the Floridan aquifer -..---- ......-------- -- 11
6 Western Florida gulf coast showing thickness of the upper limestone ofthe Floridan aquifer --......-..--..-- .. ........ ----..-------.----------------- 12
7 Hydrographs of three wells tapping the upper limestone of the Floridanaquifer, showing decline of artesian pressure head in southern OkaloosaCounty ....--.................---.....--- - ------------- ----------------------.. 14
8 Western Florida gulf coast showing net decline of artesian pressure head
in wells tapping the upper limestone of the Floridan aquifer, January
1948 to September 1960 ..--...-----.-- --------------------- ------.------- 15
9 Western Florida gulf coast showing the dissolved-solids content of
water from the upper limestone of the Floridan aquifer .......----. _facing 22
10 Western Florida gulf coast showing hardness of water from the upper
limestone of the Floridan aquifer .......------------------ facing 22
11 Western Florida gulf coast showing chloride content of water from the
upper limestone of the Floridan aquifer .. -------------- facing 24
12 Western Florida gulf coast showing fluoride content of water from the
upper limestone of the Floridan aquifer ------- facing 24
vii


AQUIFERS AND QUALITY OF GROUND WATER ALONGTHE GULF COAST OF WESTERN FLORIDA
By
Jack T. Barraclough and Owen T. Marsh
ABSTRACT
A study of electric logs, well cuttings, and chemical analyses of waterfrom wells in the western Florida Panhandle reveals the relation ofthe quality of ground water to the geology. Three aquifers separated byclay aquicludes underlie the panhandle west of the ChoctawhatcheeRiver: (1) the sand-and-gravel aquifer at the surface, (2) the upperlimestone of the Floridan aquifer, and (3) the lower limestone of theFloridan aquifer. The remarkably soft and relatively unmineralized waterin the sand-and-gravel aquifer supplies most of the wells in the westernhalf of the area. In the eastern half of the area, where this aquifer isthin, most wells obtain water from the upper limestone of the Floridanaquifer. Electric logs suggest that some fresh water may be present atthe top of the lower limestone of the Floridan aquifer in the area northand east of Fort Walton Beach.
Dissolved solids, chloride, and fluoride in water from the upper lime-stone of the Floridan aquifer increase in a southwesterly direction (down-dip) across the area according to a simple, mappable pattern. Hardnessof the water decreases downdip as a result of ion exchange by claysin the upper limestone. Areas of usable and unusable water have beendelineated on maps.
Two water problems in the Fort Walton Beach area are brought tolight by this study: (1) a sharp decline of water levels amounting to asmuch as 82 feet since 1936, and (2) incipient salt-water intrusion atthe Fort Walton Beach Elementary School, induced by the drop in waterlevels. The magnitude of this decline probably is related to the lowpermeability of the clay in the upper limestone of the Floridan aquifer.
INTRODUCTION
PURPOSE AND SCOPEThe rapid growth of population in the western part of the Florida
Panhandle in recent years has resulted primarily from three factors: (1)The abundance of excellent ground water has attracted more and moreindustries to the area; (2) two large military bases, the Naval Air Stationat Pensacola and Eglin Air Force Base at Niceville, are in the area;and (3) the unsurpassed beaches, numerous waterways, and agreeable
1
2 FLORIDA GEOLOGICAL SURVEY
climate have been attracting greater numbers of tourists as well aspermanent residents.
A key factor in both present and anticipated future growth is thesupply of fresh ground water. The present use of ground water in thearea probably exceeds 100 million gallons per day. The future develop-ment and efficient utilization of the ground-water resources requires aknowledge of both geologic and hydrologic conditions. For example,what water-bearing formations underlie the area? How deep is the freshwater? What is the chemical quality of the water? Is the water levelrising, falling, or remaining constant? These are some of the questionsthat the authors of this report seek to answer.
This paper is a byproduct of an intensive investigation of the waterresources of Escambia and Santa Rosa counties being made by the U.S.Geological Survey in cooperation with the Florida Geological Survey,Escambia and Santa Rosa counties, and the city of Pensacola.
LOCATION OF THE AREA
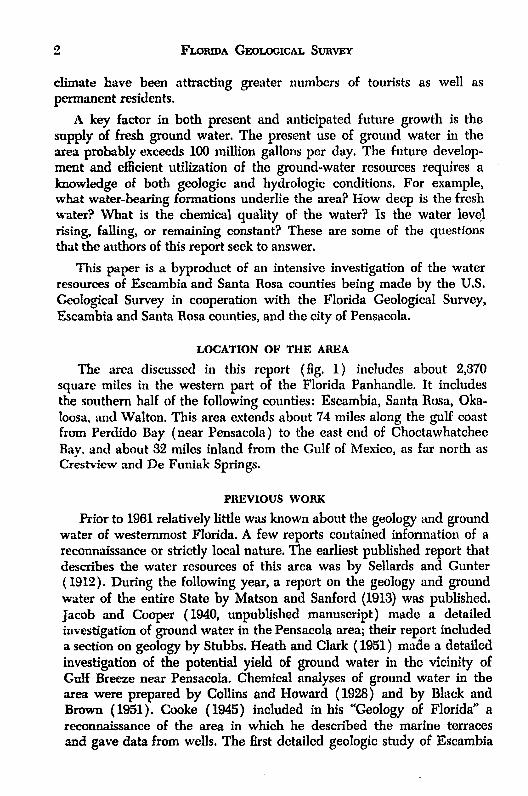
The area discussed in this report (fig. 1) includes about 2,370square miles in the western part of the Florida Panhandle. It includesthe southern half of the following counties: Escambia, Santa Rosa, Oka-loosa, and Walton. This area extends about 74 miles along the gulf coastfrom Perdido Bay (near Pensacola) to the east end of ChoctawhatcheeBay, and about 32 miles inland from the Gulf of Mexico, as far north asCrestview and De Funiak Springs.
PREVIOUS WORK
Prior to 1961 relatively little was known about the geology and groundwater of westernmost Florida. A few reports contained information of areconnaissance or strictly local nature. The earliest published report thatdescribes the water resources of this area was by Sellards and Gunter(1912). During the following year, a report on the geology and groundwater of the entire State by Matson and Sanford (1913) was published.Jacob and Cooper (1940, unpublished manuscript) made a detailedinvestigation of ground water in the Pensacola area; their report includeda section on geology by Stubbs. Heath and Clark (1951) made a detailedinvestigation of the potential yield of ground water in the vicinity ofGulf Breeze near Pensacola. Chemical analyses of ground water in thearea were prepared by Collins and Howard (1928) and by Black andBrown (1951). Cooke (1945) included in his "Geology of Florida" areconnaissance of the area in which he described the marine terracesand gave data from wells. The first detailed geologic study of Escambia

REPORT OF INVESTIGATIONS No. 29 3
o.. I '- i A
~-- ---- ---- - ----
AREA DESCRIBED INTHIS REPORT
__ i _--_\ 0
0 LLS@. ....
j - ...--- --
Figure 1. Location of area described in this report.
and Santa Rosa counties was made by Marsh (1962) in connection witha comprehensive investigation of the water resources of the area that iscurrently being made by the U.S. Geological Survey. An interim reportof that investigation (Musgrove, Barraclough, and Marsh, 1961) sum-marizes the geology and water resources of the western half of the areadiscussed in the present paper.
ACKNOWLEDGMENTS.
The writers would like to express appreciation to M. E. Batz and C. A.Witcher, Jr., of the Chemstrand Corp. for various courtesies extended; toLehmon Spillers of Pensacola, as well as to Docie Bass and E. L. Thoma-son of Fort Walton Beach for supplying data on wells; and to EarlCampbell, Okaloosa County sanitarian, A. G. Symons of the Layne-Central Co., and Shelby Sanders of Shelby Sanders and Associates forfurnishing chemical analyses of water samples.

4 FLORIDA GEOLOGICAL SURVEY
GEOLOGY AND HYDROLOGY
GEOLOGIC SETTING
The part of the Florida Panhandle described in this paper lies in theCoastal Plain province and is situated along the north flank of the vastsinking trough known as the gulf coast geosyncline. Long-continued sub-sidence of this trough has resulted in the deposition of sand, clay, andlimestone beds, most of which thicken toward the gulf. These beds dipabout 30-35 feet per mile toward the southwest in the area of this report.
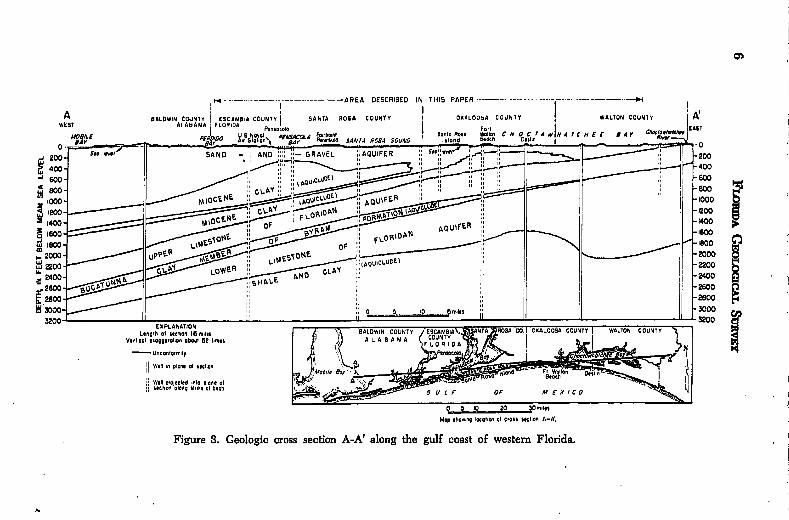
Fresh water occurs in parts of three principal aquifers: (1) the sand-and-gravel aquifer, (2) the upper limestone of the Floridan aquifer, and(3) the lower limestone of the Floridan aquifer (fig. 2). East of theChoctawhatchee River the limestone of the Floridan aquifer forms theland surface, which is pock-marked with countless sinkholes. West of theriver the limestone slopes uniformly southwestward until at Pensacolait lies more than 1,200 feet below the surface. West of the Choctawhat-chee River a westward-thickening wedge of sand and gravel underliesthe land surface. Throughout most of the area two thick beds of clayseparate the sand-and-gravel aquifer from the upper limestone of theFloridan aquifer. A thinner but more extensive bed of clay divides theFloridan aquifer into an upper limestone and a lower limestone (fig. 3).The lower two clay beds pinch out near the eastern border of the area,bringing the upper and lower limestones of the Floridan aquifer togetherand causing the sand-and-gravel aquifer to rest directly upon the Floridanaquifer. The uppermost clay bed ends abruptly farther west. TheFloridan aquifer is underlain by impermeable clay and shale.
HYDROLOGIC PRINCIPLESPart of the rain that falls on the land surface runs off into lakes and
streams; part returns to the atmosphere by evaporation, either directlyor through the leaves of plants (evapotranspiration); and part seepsinto the ground to become ground water. A simple analogy would be tocompare the ground with a pail of sand. If you sprinkle water on the sand(in imitation of rain) until the water rises nearly to the top of the sand,you have a rough example of ground water that occurs under water-table conditions. But to bring the analogy closer to reality, the pail musthave a few holes in the sides and bottom so that the water is continuallyleaking out. Unless you keep sprinkling water on the sand, the waterlevel-called the water table-will drop steadily lower and lower.Similarly, ground water keeps leaking away through seeps and springsinto streams, lakes, and oceans. This subterranean water supply must bereplenished periodically by rainfall (and snowmelt in northern areas)if the water table is to remain near a given level. The quantity of rainfall

REPORT OF INVESTIGATIONS No. 29 5
AGE D RIPTIV SAMPL LG RAPHIC RESISTIVITY IN OHM-METERSAGE DESCRIPTIVE SAMPLE LOG SECTIONO 20 40 60 80 100 120 14C0-Sand, ight-brown, medium to very coarse ; .:
100- - ..
200- Sand, light-brown, very coarse; "0 and gravel SAND - AND- GRAVEL
300V Sand, light gay, fine to very coarse; -"0 mollusk shells
400- Cloy. sandy U I F
z Sand, very coarse, shells; and grovel '.
5 j Mollusk sheUs with some fine to very ' EXPLANATIONz. coorse sdnd '?i-W600oo-O Gravel with shells and medium .'" . *- .- Relatively permeable bed
to very coarse sand700- Claygroy
---- .Relatively impermeobbed*Grovel and shell fragments Reovely irme o*
Cloy, gray, sandy '-
in 0 0
Grovel. very coarse sand. shells
z u0 A U ICLUDES o 0-- -- I (Absent in northern half of Escomba
_ Cloy, dark-gray, sandy - and Santa Roso Counties)
S1100- 2
0
1200- , Limestone, grayish white, and dark -- z gray clay
W 1300- M Limestone, light gray fossils rare FLORIDAN AQUIFERi >'(Upper limestone)
z o ond, medium to very coarse, and< fine wa l.l
. 1400- Limestone, grayish whie, someI Z foraminifers in lower halfa-u 1500- uj
. Cloy, dork gray, a little pyrite and A Q U C L U E
0 o crbonaceous material (Bucotunno Cloy Member of1600 - O Coboo ou moerio Byrom Formatioon)
1700-
1800 - z
S Limestone, white, abundant FLORIDAN AQUIFER1900- ' foraminifers (Lower limestone)90 Liforominifers
,-
2000 - J
2100
2200 j z-2200 Cloy, gray, with forminifers -A 0 U I C L U D E-o
2300 --
Figure 2. Aquifers and aquicludes along the gulf coast of western Florida asshown in representative test well near Pensacola.
---...--......------------- AREA DESCRIBED IN THIS PAPER --------- -----------
A BALDWIN COUNTY ESCAMA COUNT SANTA ROSA COUNTY OKAOOA COUNTY WALTON COUNTY AWEST A ABAMA FLORIDA Pn Fort WIC I e EAST
BI U Naol p Foaipoll Saonlu RoS o Ibo C H 0 C r A t AAY CAoCIM e EAL PER 0 _ StPoleon s n•' inulo SAIN A ROSA SOUNO Ilond o C OD m -
--
0. S lil SAND - AND - GRAVEL AQUIFER2
00 200
o400o- : lAO• I '1•"• ""64003000 -oU:5 1 m -1 00Booo CLo
Mp 1200 Uo ormlocly 'o of 0 stio n A-
FIgWell ure p, 8. Ge o ioon s obIle Icon A- AI an he gr d
ha N n r f beeL U o o ' C 0
20000 S 20 0e 2000l
Mp shon o of CROSS Slio A-A2400
Figure 8. Ceologic cross section A-A' along the gulf coast of western Florida.Figure 3. Geologic cross section A-A' along the gulf coast of western Florida.

REPORT OF INVESTIGATIONS No. 29 7
varies from month to month and year to year in an unpredictable man-ner, although the average for a given period may be fairly constant. Intimes of above-average rainfall the water table rises, and in times ofbelow-average rainfall the water table declines. Figure 4 shows thisrelationship.
The type of ground water just described is called nonartesian. Com-monly, however, the water is confined in a permeable bed of sand orlimestone, for example, that is sandwiched between relatively imperme-able beds, such as clay. Such confined water is under artesian pressure.Ground water is termed artesian if it is confined under enough pressureto make it rise in a well above the top of the permeable bed thatcontains the water. It is not necessary that the water rise to or abovethe land surface to be classified as artesian. A rough demonstration ofwater under artesian pressure can be made with a 3-foot piece of gardenhose filled with water. If you hold your thumb over one end and raisethe other end, you can feel the pressure against your thumb. But if some-one were to cut a small hole into the upper surface of the hose nearits middle, a jet of water would shoot upward, just as water rises in awell drilled through a confining bed of clay into a water-bearing bed ofsand or limestone. The height to which water will rise in an artesianwell is called the artesian pressure head.
An aquifer is a formation (such as a thick layer of sand or limestone),a part of a formation, or a group of interconnected formations that arepermeable enough to transmit usable quantities of water. An aquicludeis a bed (such as clay or shale) that is too impermeable to transmitwater in usable quantities.. Areas where aquifers are replenished arecalled recharge areas, and areas where aquifers lose water are calleddischarge areas.
AQUIFERS
SAND-AND-GRAVEL AQUIFER
The wedge-shaped deposit of sand and gravel that underlies theland surface west of the Choctawhatchee River is known as the sand-and-gravel aquifer (Musgrove, Barraclough, and Marsh, 1961). The aqui-fer is exposed from Escambia County, Alabama, on the north to theGulf of Mexico on the south, and from the Choctawhatchee River on theeast at least to Mobile Bay on the west. Although the aquifer generallythickens downdip to the west and southwest from its thin outcrop alongthe Choctawhatchee River, considerable variations in thickness occurthroughout the area, as indicated in figure 3: 150 feet at Fort WaltonBeach, 500 feet at the Santa Rosa-Okaloosa County line, 300 feet indowntown Pensacola, 700 feet at Perdido Bay, and 1,200 feet at MobileBay. The aquifer overlies thick layers of relatively impermeable clay

8 FLORIDA GEOLOGICAL SURVEY
everywhere in the area except the eastern part, where it rests uponthe upper limestone of the Floridan aquifer.
The sand-and-gravel aquifer consists predominantly of white toreddish brown quartz sand ranging from very fine to very coarse and inplaces mixed with granules and small pebbles of quartz and chert. Lensesand stringers of gravel and clay occur throughout the aquifer. The claylenses range from a few inches to several tens of feet in thickness andmay extend from a few feet to several miles in length. Impermeablelayers of hardpan also are found within the sand-and-gravel aquifer.This dense, rusty brown material-referred to simply as "rock" by localdrillers-is formed through cementation of sand by iron oxides precipi-tated from ground water. It occurs extensively throughout westernFlorida and southern Alabama and ranges in thickness from a fractionof an inch to 3 or 4 feet. Little is known about the lateral extent ofthese layers, but probably no layer extends for more than a few thousandyards.
Fossils, including snails, clams, and microscopic animals, indicatethat the lower part of the sand-and-gravel aquifer is of Late MioceneAge (roughly 10-15 million years old); the upper part is much younger.
The sand-and-gravel aquifer contains ground water under both ar-tesian and water-table conditions. Where the water is confined by clayor hardpan, it is under artesian pressure. Where the water is not confinedby impermeable layers, it is under water-table conditions.
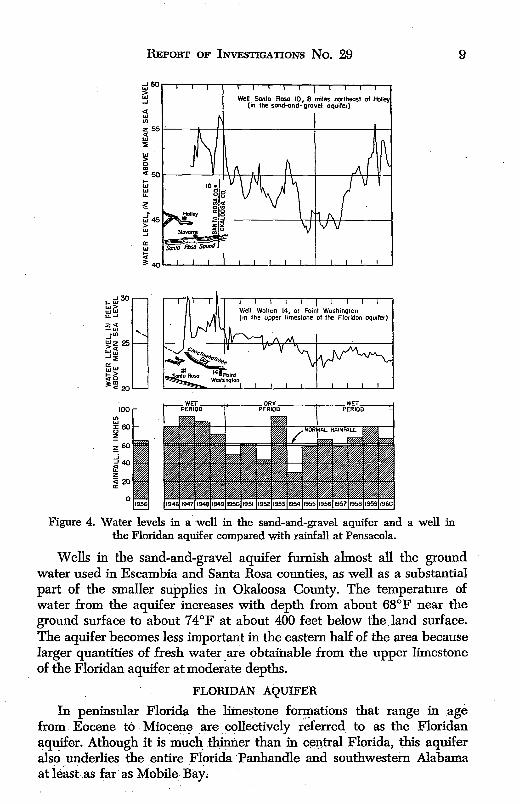
Changes of the water level within the sand-and-gravel aquifer are theresult of both natural and artificial causes. The principal natural causeis variation in the amount of rainfall which affects recharge of the aquifer.Manmade causes include intensive pumping and the erection of struc-tures, such as dams or canals, which alter the natural pattern of drainageor infiltration. Figure 4 compares variations in the annual rainfall atPensacola with changes of the artesian pressure head in a well drilledinto the upper limestone of the Floridan aquifer, as well as with changesof the water level in a well drilled into the sand-and-gravel aquifer. Thehydrograph for the latter well (Santa Rosa 10) shows water-levelchanges from 1947 to 1960 in an area where this aquifer is virtuallyunaffected by pumping. The graph shows close correlation of ground-.water levels with rainfall. The high water levels from 1947 to 1949reflect a very wet period, the lowered levels from 1950 to 1955 indicatea relatively dry period, and the rise of the water table from 1956 to 1960reflects the increase in rainfall during that period. The 1959-60 waterlevel is about the same as it was in 1948. The maximum change observedduring the period of record was 13 feet, the highest water level at 56feet above sea level in 1949 and the lowest water level at 43 feet abovesea level in 1955.
REPORT OF INVESTIGATIONS NO. 29 9
S60 I
W Well Santo Rosa 10, 8 miles northeast of Holey(in the sand-ond-grovel aquifer)
4z 55
•0 0
45
40 , ,i,1 1 1, ,,,
, J pir-le i , , o i , i , o J IuJ>
Wj Well Walton 14, at Point Washington(in the upper limestone of the Floridon aquifer)
2 I , ,
t00 OD PERIOD PERIODSNORMAL RAIN a
S0 Wao s inlton_ 1936 .4 19 19 6 1 1420
z I
'60
1938 194 1947 194 1949 1950 1951 1952 1953 1954 1955 1956 1957 1959 1959 1 960
Figure 4. Water levels in a well in the sand-and-gravel aquifer and a well inthe Floridan aquifer compared with rainfall at Pensacola.
Wells in the sand-and-gravel aquifer furnish almost all the groundwater used in Escambia and Santa Rosa counties, as well as a substantialpart of the smaller supplies in Okaloosa County. The temperature ofwater from the aquifer increases with depth from about 680 F near theground surface to about 74°F at about 400 feet below the.land surface.The aquifer becomes less important in the eastern half of the area becauselarger quantities of fresh water are obtainable from the upper limestoneof the Floridan aquifer at moderate depths.
FLORIDAN AQUIFER
In peninsular Florida the limestone formations that range in agefrom Eocene to Miocene are collectively referred to as the Floridanaquifer. Athough it is much thinner than in central Florida, this aquiferalso underlies the entire Florida Panhandle and southwestern Alabamaat least as far as Mobile Bay.

10 FLORIDA GEOLOGICAL SURVEY
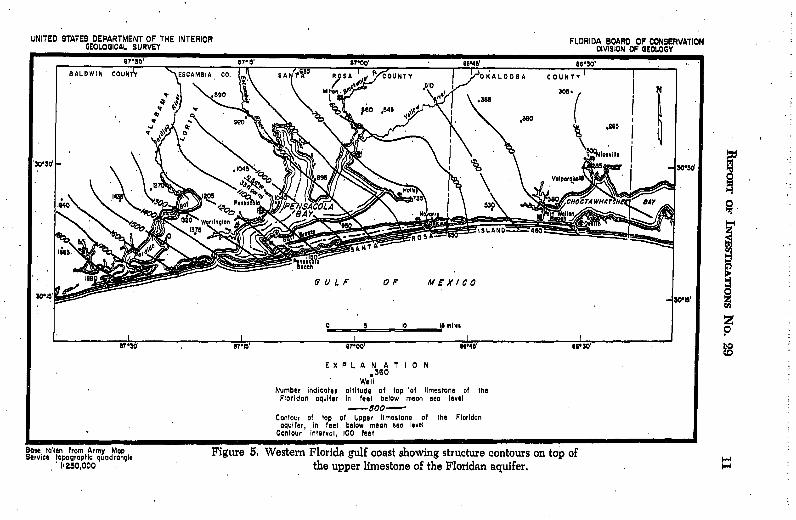
East of the Choctawhatchee River the Floridan aquifer forms theland surface, which is dotted with sinkholes. West of the river the topof the aquifer slopes uniformly southwestward (fig. 5) until at theeastern shore of Mobile Bay it lies about 2,100 feet below the landsurface. Thus, the top of the Floridan aquifer has an average apparentdip (along section A-A', fig. 3) of about 20 feet per mile from east towest.
Within the area of this report the Bucatunna Clay Member of theByram Formation separates the Floridan aquifer into an "upper lime-stone" and a lower limestone." The Bucatunna thins to the east andfinally pinches out a few miles east of Destin. The maximum thicknessof the Floridan aquifer within the area, including both the upper andthe lower limestones, is about 1,900 feet in southern Walton County.
Upper limestone. Along section A-A' (fig. 3) between theChoctawhatchee River and Mobile Bay the upper limestone ranges from350 to 450 feet in thickness. The upper limestone thins northward fromthe Gulf of Mexico (fig. 6). This thinning is much more rapid in theeastern part of the area than in the western. The thinnest known sectionof the upper limestone (45 feet) is in southern Okaloosa County, northof Niceville: the thickest known section (455 feet) is near the mouth ofPerdido Bay.
The upper limestone is composed of light gray to brown dolomiticlimestone and some dolomite which has a distinctive "spongy-looking"texture and contains abundant shell fragments of clams, snails, andmicroscopic animals. In much of the area the upper limestone containslayers of green and brown clay. In some wells this limestone sectionmust be screened and gravel packed, or the clay beds cased off, toprevent the water that is withdrawn from becoming turbid.
The upper limestone of the Floridan aquifer is recharged directly byrain where the limestone lies at or near the surface of the ground, orindirectly by percolation from the sand-and-gravel aquifer. The Floridanaquifer discharges water continuously by seepage into the gulf, by upwardleakage, and by pumping or flowing from wells.
The water in the Floridan aquifer within the area of study is underartesian pressure. Changes in the artesian pressure head are dependent-upon variations in rainfall and the quantity of water withdrawn by wells.Pumping from the upper limestone has the greatest effect on the artesianpressure in the central part of the area.
Figure 4 shows the artesian pressure head in a well drilled into theupper limestone of the Floridan aquifer at Point Washington, near theeast end of Choctawhatched Bay. Although the well is in an area where
UNITED STATES DEPARTMENT OF THE INTERIOR FLORIDA BOARD OF CONSERVATIONGEOLOGICAL SURVEY DIVISION OF GEOLOGY
8730, 87T15' 87o00' 8645' 86'30'BALDWIN COUN Y ESCAMBIA CO. SA
635 R SA ( COUNTY 11OK ALOOSA COUNTY
39200 no
3063d - Hell Volpa 5 -- 8530630
0 5 10 I miles
87B '30' 68 15 ' e' 8*0'
EXPL A N ATIO N,360
WellNumber indlcoates oltitude of top 'of limestone of the
Florldon oqulfer in feet below mean sea level
Contour of top of Upper limestone of the Floridonaquifer, in feet below mean sea level
Contour Interval, 100 feet
ose ictoken romArmy MOpe Figure 5. Western Florida gulf coast showing structure contours on top ofService oporothehic quranof the Floridan uifer' 11250000 the upper limestone of the Floridan aquifer.

UNITED STATES DEPARTMENT OF THE INTERIOR FLORIDA BOARD OF CONSERVATIONGEOLOGICAL SURVEY DIVISION OF GEOLOGY
l7 30 1 800 66'45 e*
BALDWIN COUN Y ESCAlIA CO SAN A8
8 O Y ALOSA COUNTY
0' " o5 _2^ J° I"I I
Wel Nl cvi0- on sample o
S5 -vlpoa
limestone in feel of the lorid3n aquifer
Contour interval 50 feet,
Bae tken from Army Mop.
SoN1 - 3D*lt'
_ _ 5 0 015 m:ie
6y*30 7°15'
8*45' re 0',
SWl N EXPLANATI N
Wimestronein feet of he Floridn aquifer,
Contour interval 50 feet,
ii EXPLANATI
Servie ken from Army MContour Figure 6the thicknesern Flrida gulf coast showing thickness of the
Service topographic quodrongle1 25s0,000 upper limestone of the Floridan aquifer.

REPORT OF INVESTIGATIONS No. 29 13
very little water is pumped from the aquifer, the head has droppedabout 3 feet since 1948. This lowering may be the result of heavypumping from the upper limestone elsewhere in the area. From 1946 to1949 the artesian pressure rose, from 1949 to 1956 it declined slightly,and from 1956 to 1960 it rose slightly. These trends reflect periods ofabundant or deficient rainfall.
Formerly, artesian wells in low areas in the Fort Walton Beach areawould flow but they no longer flow because of the considerable declinein the artesian pressure head. This decline doubtless has been causedby increased use of water, especially by Eglin Air Force Base, the cityof Fort Walton Beach, and other nearby water users. In 1986, the artesianpressure head in wells tapping the upper limestone at Fort Walton Beachaveraged about 56 feet above sea level. By 1960, however, the averageartesian pressure head had declined to about 18 feet below sea level.This means that the average net decline of the artesian pressure head inthe upper limestone at Fort Walton Beach has been about 74 feet since1936.
Figure 7 illustrates part of this striking decline. The top graph showsthat the artesian pressure head in a well that is 17 miles northwest ofFort Walton Beach has declined about 16 feet since 1948. The hydrographshows very little correlation with rainfall. The gradual decrease of theartesian pressure may be attributed mainly to pumping. The middlegraph shows the decline of the artesian pressure in a well that is 7miles north of Fort Walton Beach. During the period of record the aver-age decline was about 30 feet. The bottom graph represents the moststriking decline of artesian pressure in the area, in a well (Okaloosa 3)at the Fort Walton Beach Elementary School. This decline was 95 feetbetween 1936 and 1957. The artesian pressure head recovered about13 feet from August 1957 to December 1960. It should be noted, however,that this recovery was a result of above-average rainfall from 1958 to1960. If rainfall returns to or below average and present pumping con-tinues, the downward trend of the artesian pressure head may be ex-pected to continue. In 1951 the well stopped flowing and since then hasflowed only intermittently for short periods. The artesian pressure headdropped below sea level in 1954 and has remained below this level mostof the time since then. Low points on the hydrograph of Okaloosa 3generally reflect the increased use of water during the summer forwatering lawns and other purposes.
Figure 8 is a contour map of the area showing the net decline ofartesian pressure in wells tapping the upper limestone, from January1948 to September 1960. The map is based on an analysis of the hydro-graphs of wells in the area. It shows that the greatest decline, about 56

WATEfR LEVEL, IN FEET REFERRED 10 MEAN S: A LEV 'L
S - .-.. - - --- --- - . ..- o .o-
|. I1" L I 8- .-I T. . .. 1l : -
_a a-
l og, - /:
SSantoa os Counly
0a 0
Oholoolo Counly
I '
I'- ____ O_________________^k._"

UNITED: STATES DEPARTMENT OF THE INTERIOR FLORIDA BOARD OF CONSERVATIONG. EOLOGICAL SURVEY DIVISION OF GEOLOGY
'' • 87*15' ' 870' s6*45 8 30 s ' '
', , I SANTA ROSA COUNTY OKALOOSA COUNTY WALTON COUNTY
Sweo, A i*5LAN C.,,
Well Crestview k 3045'
Contour interval, 5 feet
B t Shoo
2 0l o FnMilton 500p , Ju
,: / c. 21003
', Halle , ,27N vie
I' 250,0
.r lmst o LAN , Ja y 19 to SWellhlln
,acoto . . ...... ** /jf p - 4 A N L F N(
Contour line showing net decline of the artesian pressure
head, in feet during the period January 1948- September
19601 dashed where approximateContour Interval, 5 feet
lasi'taktn .fromr Army 'Mp Figure 8. Western Florida gulf coast showing net decline of artesian pressure head in wells tapping the'Service, topographic 1uadrangle

16 FLORIDA GEOLOGICAL SURVEY
feet, was at Fort Walton Beach, and the smallest decline, about 2feet, was at Point Washington, near the east end of Choctawhatchee Bay.It is interesting to note that the water level in a well drilled into thesand-and-gravel aquifer 8 miles northeast of Holley and located wellwithin the cone of depression of water in the upper limestone of theFloridan aquifer (fig. 4) had a net rise of 1.3 feet during this sameperiod.
Little is known about the water-transmitting and water-storing abilitiesof the upper limestone. Well-yield figures indicate that the aquifer trans-mits water readily in some places and reluctantly in others. In somelocalities large quantities of clay have been found and probably the clayfils some voids in the limestone. This clay may have been depositedin the voids during later advances of the sea, after solution cavities hadbeen formed. Electric logs and well samples also indicate that fairly con-tinuous beds of clay are present in the upper limestone.
The drawdown in the Fort Walton Beach area (fig. 8) appears tobe much greater than would be expected from the amount of pumpingin the area. The presence of the clay in the upper limestone provides areasonable explanation. This clay would reduce both the permeabilityand the effective porosity of the aquifer, and would result in unusuallylarge drawdowns. In addition, the erratic occurrence of clay-filled voidswould explain the great variation observed in the yield of otherwisesimilar wells.
The temperature of water from the upper limestone of the Floridanaquifer ranges from about 70 0F in the eastern part of the area to as highas 95'F near Pensacola.
Lower limestone. The lower limestone of the Floridan aquifer is muchmore variable in thickness than the upper limestone. From its maximumthickness of about 1,500 feet in southern Walton County, it thins abruptlyto about 700 feet just west of Destin. The limestone continues to thin tothe west, although at a much more uniform rate, until at Mobile Bayit is less than 300 feet thick. The limestone also thins southward, towardthe gulf, from about 1,000 feet in northern Santa Rosa County to about450 feet in central Escambia County. Thus, unlike most geologic forma-tions along the gulf coast, this limestone thins rather than thickens down-dip. The lower limestone is white to grayish cream and is rather softand chalky. It consists mainly of microscopic animals, corals, sand dollars,clams, and many other types of shells. Thick, lens-shaped masses of hard,light gray shale and siltstone, as well as a small amount of gray clay, areirregularly distributed in the lower half of the limestone.

REPORT OF INVESTIGATIONS No. 29 17
AQUICLUDES
In most of the area the aquifers are separated by relatively imperme-able formations (aquicludes) which greatly retard the upward and down-ward movement of ground water.
MIOCENE CLAY
Two thick masses of clay (Marsh, 1962) separated by a thin bed ofsand lie between the sand-and-gravel aquifer and the Floridan aquiferover most of the area. Along section A-A' (fig. 8) the upper clay thickensfrom about 300 feet at Mobile Bay to about 670 feet at Pensacola. East ofPensacola the clay thins, and just west of the Santa Rosa-Okaloosa Countyline it terminates rather abruptly by interfingering with the sand-and-gravel aquifer. The lower clay thins from about 500 feet at Mobile Bayto 150 feet at the Santa Rosa-Okaloosa County line. East of this pointit thickens again to about 300 feet at Fort Walton Beach and then thinsand finally pinches out in southwestern Walton County. Both the upperand lower clays appear to interfinger with the sand-and-gravel aquiferabout 20 miles north of Pensacola. The sand bed between the two claysthickens from about 30 feet at Pensacola to about 90 feet at Mobile Bayand about 130 feet just northwest of upper Perdido Bay. A flowing wellin Warrington obtains water from this bed of sand.
Fossil clams, snails, and shells of microscopic animals date these thickclays as late Miocene in age (10 to 15 million years old). The clay is grayto dark gray and contains much silt, very fine to coarse sand, and a littlegravel.
BUCATUNNA CLAY MEMBER
Throughout most of the area the upper and lower limestones of theFloridan aquifer are separated by the Bucatunna Clay Member of theByram Formation (Marsh, 1962). This clay bed differs from the Mioceneclays discussed above in being much thinner, more uniform in thickness,and more regionally extensive. The Bucatunna underlies most of western-most Florida and parts of Alabama, Mississippi, and Louisiana. Withinthe area discussed in this report the Bucatunna attains a maximum thick-ness of 215 feet just north of Escambia Bay. It thins northward and east-ward, pinching out in southern Walton County, 17 miles west of theChoctawhatchee River.
The Bucatunna consists of soft gray silty to sandy clay containing avariety of fossils. The clay rests unconformably upon the eroded surfaceof the lower limestone of the Floridan aquifer and is overlain conformably
18 FLORIDA GEOLOGICAL SURVEY
by the flat, even base of the upper limestone, with which it interfingerslocally.
MIDDLE EOCENE CLAY AND SHALE
In the western part of the Florida Panhandle the limestones of theFloridan aquifer are underlain by gray clay and shale of Middle EoceneAge (roughly 50 million years old). The top of this formation dips gen-erally southwestward and undulates broadly. Eastward along the coastfrom Mobile Bay the top of the formation is relatively flat, except insouthern Walton County where it plunges abruptly downward.
CHEMICAL QUALITY OF GROUND WATER
Ground water contains various amounts of substances dissolved fromthe air, soil, or rocks, as well as mineral matter introduced from bodiesof surface water such as streams and oceans. For example, salt water mayenter the aquifer from the sea. The amount of such substances dissolvedby ground water depends on the climate, type of soil or rock, and otherfactors. The chemical content of ground water differs considerably fromone aquifer to another and even from place to place within a givenaquifer. Ground water along the gulf coast of western Florida is of sev-eral types: Some is so free of dissolved substances that it can be usedeven in automobile batteries in place of distilled water; some, althoughmineralized to a moderate degree, can be made entirely satisfactory formost uses by simple treatment; and some is so highly mineralized that itcannot be made suitable for ordinary use by any practical treatment.
DEFINITIONS AND GENERAL DISCUSSION
The standard unit for reporting the concentration of various mineralconstituents in ground water is part per million (ppm), which meansthat if a sample of water is reported to contain one part per million ofiron, a million pounds of such water would contain one pound of iron.
The term total dissolved solids indicates approximately the total quan-tity of mineral matter in solution. The U.S. Public Health Service (1946)recommends that the concentration of dissolved solids in a drinking-water supply should not exceed 500 ppm, although water with 1,000 ppmis acceptable where nothing better is available. Water with more than1,000 ppm of dissolved solids usually contains enough of some constitu-ents to produce a noticeable taste or to make the water unsuitable formany domestic and industrial uses.
Hardness of water is caused principally by compounds of calciumand magnesium. Hardness of water is generally recognized by the
.1

REPORT OF INVESTIGATIONS No. 29 19
amount of soap required to produce lather. Many U.S. Geological Surveyreports have classified water ranging in hardness from 0 to 60 ppm assoft, from 61 to 120 ppm as moderately hard, from 121 to 200 ppm ashard, and more than 200 ppm as very hard.
The chloride content of ground water is a good indication of the extentto which it has been contaminated by sea water, for about 90 percent ofthe dissolved-solids content of sea water consists of chloride salts. Groundwater with a chloride content of less than 30 ppm generally has notbeen contaminated by water from present or ancient seas. Chloride saltsdo not usually affect the potability of water except when present inquantities sufficient to cause a salty taste. The U.S. Public Health Servicerecommends 250 ppm of chloride as the upper limit for public drinkingwater supplies. Water with a chloride content of 500 ppm tastes saltyto most people. Water with a chloride content of more than about 800 ppmmay cause damage to plants, shrubs, and irrigated crops. In addition, ahigh-chloride content makes the water more corrosive.
The fluoride content of water used for drinking has aroused con-siderable public interest in recent years. Evidence indicates that thepresence of about 1.0 ppm of fluoride in drinking water decreases theoccurrence of dental caries (tooth decay) when the water is habituallyconsumed by children during the period of formation of their teeth. Forthis reason, fluoride is added to many public water supplies. Drinkingwater containing more than 1.5 ppm of fluoride may cause dentalfluorosis (mottled enamel) in children's teeth. The U.S. Public HealthService (1946) specifies 1.5 ppm of fluoride as the maximum concen-tration allowable for water that is to be used for drinking.
Iron is dissolved by ground water and surface water (streams, lakes,and oceans) from nearly all rocks and soils and from iron pipes. A con-centration of more than about 0.3 ppm of iron in water is objectionableas it stains porcelain, plumbing fixtures, and clothing; it imparts anundesirable taste to the water; and upon oxidation it forms a reddishbrown sediment. Excess iron usually can be removed from water byaeration and filtration, but some water supplies require the addition ofhydrated lime or soda ash. Along the gulf coast of western Florida, theconcentration of iron in the ground water varies considerably from placeto place and from one depth to another.
Hydrogen sulfide gas is present in ground water in some areas andgives the water a distinctive taste and odor. Water containing it areusually called "sulfur water." This gas, which is probably caused by thereduction of sulfates, can be removed by aerating the water, by chlorina-tion, or by allowing it to stand in an open container.

20 FLORIDA GEOLOGICAL SURVEY
Carbon dioxide in water from the sand-and-gravel aquifer causes thewater to be acidic and therefore corrosive. Most industries and munici-palities in the western part of the Florida Panhandle treat the waterfrom this aquifer to reduce its corrosiveness in order to protect waterpipes, water heaters, and other metallic objects with which the watercomes into contact.
WATER IN THE SAND-AND-GRAVEL AQUIFER
Water in the sand-and-gravel aquifer is not only abundant but alsoextraordinarily soft and relatively unmineralized. The availability of awater supply of such excellent quality is the prime reason that majorindustries, such as the Chemstrand Corp. and St. Regis Paper Co., havechosen to locate in this part of the State. The Columbia National Corp.extracts zirconium from minerals mined at Starke, Florida, and trans-ports the ore 345 miles to its processing plant in Santa Rosa County inorder to utilize ground water in the area.
Dissolved solids. The dissolved-solids content of water from the sand-and-gravel aquifer in this area generally is extremely low, ranging from15 to 40 ppm. However, water from this aquifer in some localities maycontain as much as 300 ppm of dissolved solids.
Hardness. Water from the sand-and-gravel aquifer is exceptionallysoft, generally containing 4 to 30 ppm of calcium and magnesium car-bonates. In places, water from deeper parts of this aquifer may beconsiderably harder, containing as much as 150 ppm of these carbonates.
Chloride. The chloride content of water from the sand-and-gravelaquifer generally ranges from 2 to 30 ppm except where salty water hasnot been completely flushed from the aquifer or where lateral encroach-ment from salt-water bodies has occurred.
Fluoride. The water from the sand-and-gravel aquifer usually con-tains less than 0.2 ppm fluoride.
Iron. The iron content of water from the sand-and-gravel aquiferranges from 0.06 to 4.9 ppm, although it is usually less than 0.25 ppm.
Dissolved gases. Water from the sand-and-gravel aquifer containsenough carbon dioxide to make the water acidic. Some water from thisaquifer contains hydrogen sulfide in solution.
WATER IN THE FLORIDAN AQUIFER
'The upper limestone of the Floridan aquifer is of more economicimportance to the area than the lower limestone as a source of freshwater, for both present and future use. Few, if any, wells in the area

REPORT OF INVESTIGATIONS No. 29 21
uDamn water trom the lower limestone, whereas the upper limestone isthe principal aquifer for wells in the eastern part of the area.
UPPER LIMESTONE OF THE FLORIDAN AQUIFER
Water in the upper limestone of the Floridan aquifer is suitable formost uses in the eastern two-thirds of the area. However, increasingconcentrations of dissolved solids, chloride, and fluoride in the westernthird of the area makes the water unsuitable for most purposes.
Dissolved solids. In the western part of the Florida Panhandle, thedissolved-solids content of water from the upper limestone ranges from92 ppm at De Funiak Springs to 3,960 pp.m at Pensacola Beach. As shownin figure 9, dissolved-solids content increases in a southwesterly directionacross the area. In the region between De Funiak Springs, Crestview,Holley, Fort Walton Beach, and Freeport, water from the upper lime-stone contains less than 500 ppm of dissolved solids. The dissolved-solidscontent increases toward Point Washington and in a small area in FortWalton Beach, as well as southward and westward from Holley. AtPensacola, Gulf Breeze, and Pensacola Beach, the dissolved-solids con-tent of water from the upper limestone exceeds 1,000 ppm (fig. 9).
Hardness. Figure 10 shows that the hardness of water from the upperlimestone ranges from 24 to 146 ppm across the area. The hardest wateroccurs in the area between Crestview and Destin (including Nicevilleand Valparaiso) and around Point Washington. Moderately hard water(hardness range from 60-120 ppm) from the upper limestone is foundat Pensacola, Gulf Breeze, Crestview, De Funiak Springs, and Freeport.Soft water (hardness range 0-60 ppm) is found at Fort Walton Beach,Destin, Navarre, and Holley.
The dissolved-solids content of the water from the upper limestoneincreases in a southwesterly direction within the area (fig. 9). It wouldbe reasonable to expect the water to become increasingly harder in thisdirection also, for the hardness of ground water in limestone usuallyincreases as the dissolved-solids content increases. This actually happensin the area between De Funiak Springs and Niceville and around PointWashington. However, from Niceville to Fort Walton Beach the hardnessdecreases rather abruptly; and at Pensacola and Pensacola Beach, wherethe water is highly mineralized, it is only moderately hard.
A possible explanation for this decrease of hardness may be naturalsoftening of the water by ion exchange between the water and clayminerals, as considerable clay occurs in the upper limestone of theFloridan aquifer. Glauconite, an ion-exchange mineral commonly foundin marine sediments, also has been noted in many well cuttings from thisarea. Carlston (1942, p. 16) suggests that the increase in bicarbonate

22 FLORIDA GEOLOGICAL .SURVEY
content of water from northern Alabama is ,caused by carbon dioxidereacting with calcium and magnesium carbonates in the sediments. Thecalcium and magnesium ions that were taken1 into solution by this reac-tion are exchanged for sodium ions on glauconite and on clay minerals.Such a process would explain the softening of the water and the increasein sodium and bicarbonate ion contents.
A less important process that may tend to reduce thel hardness of thewater is indirectly a result of the dip of the upper limestone. In general,where the top of the upper limestone is more than 400 feet below sealevel, the water in it is softer than farther updip. The temperature of theground water down to a depth of about 50 feet is usually about the sameas the average annual temperature of the air, which at Pensacola isabout 680F. Below a depth of 50 feet the temperature of ground waterincreases steadily downward for a considerable distance. In the westernFlorida Panhandle the temperature of ground water increases about1"F for each 50 to 80 feet of depth. Thus, the temperature of water inthe upper limestone of the Floridan aquifer increases in a southwesterlydirection as the aquifer gets deeper. In the areas where the water isrelatively soft, its temperature is at least 75 0F. As water becomes warmerthe amount of carbon dioxide gas that it can hold in solution decreases.The less carbon dioxide in the water, the smaller the amount of calciumand magnesium carbonate that can remain in solution. Therefore, as thetemperature of the water increases, these carbonates tend to precipitateout of solution, leaving the water softer.
Chloride. The chloride content of water from the upper limestone ofthe Floridan aquifer ranges from 2 to more than 2,000 ppm. Figure 11shows how the chloride content varies in the area. The chloride con-centration is very low between Crestview, De Funiak Springs, and Nice-vile, and increases in a southwesterly direction. The 250-ppm contourcrosses Fairpoint Peninsula west of Navarre and crosses Santa RosaIsland near the Santa Rosa-Okaloosa County line. Except in a small areaat Fort Walton Beach and another south of Point Washington, thechloride content of water east of this contour meets the U.S. PublicHealth Service recommended standards for a public supply. West of the250-ppm contour much of the water from the upper limestone is toosalty for a public supply.
This study revealed evidence of incipient salt-water encroachment inthe upper limestone of the Floridan aquifer in a small area at FortWalton Beach. During 1948, the chloride content of water from the wellat the Fort Walton Beach Elementary School was determined at threedifferent times to be 70, 68, and -72 ppm. On October: 7, 1960, the

UN!TED STATES DEPARTMENT OF THE INTERIOR FLORIDA BOARD OF CONSERVATIONGEOLOGICAL SURVEY DIVISION OF GEOLOGY
87"15' 87°00' 86045' 86030' 86015'
ESANTA ROSA POUNTY I OA N AT.453045
iveWell
- .. ... :. ._ rings
SMiltongrphc Mp
o R
Pen
N Ton 406 667- -•/ 0SA 7 r 06 35:.1 5 Point37O4 0 0
..J- c Washington
s; G U L F OF oMEXI COPn nsohola
875' 87 °00' 86045'
86*50'
86 15'
E X P L A N A T I O N
9450Well
Number is dissolved solids in ppm
Less than 500 ppm 500-1000 ppm More than 1000 ppmWater suitable for Water suitable for some Water too highly mineralizedmunicipal supplies purposes for most purposes
Contour interval variable
se tzken from Army Mop
ce topographic Map1 250,000 Figure 9. Western Florida gulf coast showing the dissolved-solids content of water from the upper limestone of the Floridan aquifer.

UNITED STATES DEPARTMENT OF THE INTERIOR F DA DGEOLOGICAL SURVEY FLORIDA BOARD OF CONSERVATIONGEOLOGICAL S Y DIVISION OF GEOLOGY
-ANTA ROSA OUNTY OKALOOSA/ 108' COUNTY WALTON COUNTY
Crestview 0 / , 30°45 ,
Welln7
2 3 L 4 8"0105
Nmeei N 76
n CO-Xoz lemle
Contour interval, 20 ppme Funiok
Pens taken from Army Ma
r-qwe topographic MapS250,000 Figure 10. Western Florida gulf coast showing hardness of water from the upper limestone of the Foridan aquifer.". - . - Beas ch WM -" - -
E X PN LA"N A T I 0 N
Number is hardness in ppm
0-60 ppm 61-120 ppm 121-200 ppmSoft Moderately hard Hard
Contour interval, 20 ppm:c'" taken from Army MapS
:,-Yr•.sce topographic Map1 250,000 Figure 10. Western Florida gulf coast showing hardness of water from the upper limestone of the Floridan aquifer.

REPORT OF INVESTIGATIONS No. 29 23
chloride content was 262 ppm, and about 2 weeks later it was 290 ppm.This is an increase of more than 200 ppm in the last 12 years. Salt-water encroachment may be a result of the drastic lowering of the waterlevel in this well (fig. 7). Before much water was withdrawn from theupper limestone, the artesian pressure head in the upper limestone prob-ably was about the same as in the lower limestone. Extensive pumpingof water from the upper limestone has doubtless reduced the artesianpressure head considerably below that in the lower limestone. This differ-ence in head would cause the water in the lower limestone to moveupward, under the higher artesian pressure. Salt water from! the lowerlimestone probably is moving upward through about 60 feet of theBucatunna Clay Member (fig. 3) into the upper limestone. This upwardencroachment may have been facilitated by the presence of old wellsthat penetrated the Bucatunna Clay Member and were later pluggedor partially plugged. Salt water may have moved upward through partof the borehole.
As the water level in the upper limestone at Fort Walton Beach isbelow sea level most of the time, salt water from the Gulf of Mexico orChoctawhatchee Bay would have the potential head to percolate down-ward to this limestone. However, the possibility that this has happenedseems remote, because a bed of clay about 300 feet thick overlies thelimestone and-would greatly retard the movement of water from! aboveinto the aquifer. In contrast, the clay bed below the upper limestoneis relatively thin and, moreover, is perforated by open-hole sections ofseveral old wells; this situation, coupled with the fact that water inthe lower limestone has a higher head than water in the upper lime-stone, makes intrusion of salt water from below much more likely.Furthermore, no appreciable increase in the chloride content has beennoted in water from wells closer to the gulf or the bay than the high-chloride well at the elementary school.
The implications of the data collected at the school well in FortWalton Beach warrant continued measurement of the water level andthe initiation of a periodic sampling program to keep a check on thechloride content. In addition, the chloride content of water from nearbywells, especially the city wells, should be checked periodically to deter-mine any significant change in the salinity of the water.
Fluoride. The fluoride content of water from the upper limestone ofthe Floridan aquifer ranges from 0.0 ppm in the vicinity of Niceville to6.5 ppm at Pensacola Beach. Figure 12 indicates that the fluoride con-tent of water from this aquifer increases in a southwesterly directionacross the area. Patterns on the map indicate areas in which the fluoride

24 FLORIDA GEOLOGICAL SURVEY
content of the water (from 0.5 to 1.5 ppm) would reduce tooth decayamong children drinking the water (Black and Brown, 1951, p. 15).An area of beneficial fluoride content lies between Destin and Holley,and another south of Point Washington. An area in which the fluoridecontent (more than 1.5 ppm) of water from the upper limestoie is sohigh that it might cause mottling of children's teeth also is shown onfigure 12 (Black and Brown, 1951, p. 15). This area includes FairpointPeninsula west of Navarre and the western part of Santa Rosa Island.It is interesting to note that the fluoride content of water from a test wellat Pensacola Beach (6.5 ppm) was almost twice as high as that from anyother well in Florida known to the writers (excluding ground water con-taminated by industrial wastes). In the area between Nicevile, Crest-view, and De Funiak Springs the fluoride content of water from theupper limestone is less than 0.5 ppm and probably would have little orno effect on children's teeth (Dean, 1943, p. 1173).
There are several possible sources of this fluoride. Certain mineralscommon in marine sediments contain fluoride. Among these are glau-conite, phosphate, and muscovite, which have been noted in well samplesin West Florida. The mica (muscovite) is especially abundant. Accordingto Hem (1959, p. 112), "Cederstrom (1945) attributes fluoride in groundwaters of the Virginia coastal plain to solution of micas which containfluoride." Another possible source, mentioned by LaMoreaux (1948, p.32-34) is sea water that has not been completely flushed from the aquifer.Fluoride is a normal, although minor, constituent of sea water. In WestFlorida, the fluoride content of water from the upper limestone gener-ally increases with increasing depth of the aquifer. LaMoreaux noted asimilar correlation in certain marine sands of southern Alabama. He alsoobserved a relation between high-fluoride content of ground water andmarine glauconitic sands. Some of the.fluoride may be derived from theclay beds located within the aquifer.
Iron. The concentration of iron in water from the upper limestoneof the Floridan aquifer ranges from 0.0 to 5.0 ppm.
Dissolved gases. Most waters from the Floridan aquifer within thestudy area contain hydrogen sulfide gas in solution.
LOWER LIMESTONE OF THE FLORIDAN AQUIFER
Unfortunately, no water samples could be obtained from the lowerlimestone of the Floridan aquifer. However, electric-log resistivities indi-cate that most of the water in this limestone is salty. The upper part of thelower limestone possibly contains fresh - water north and east of FortWalton Beach (updip), but until samples of the water can be analyzed,this possibility can be only speculative.

UNITED STATES DEPARTMENT OF THE INTERIOR FLORIDA BOARD OF CONSERVATIONGEOLOGICAL SURVEY DIVISION OF GEOLOGY87015' 87000
' 86045 86030
, 86 15'
O.SANTA ROSA -OUNTY OK A"•L.OOS OUNTY.30
30045'
r - - .De Funtk evWell
... .. -.:- ---- -7"
SSprings
.. .. . , - -...,- .:.--.- .' . . .' 3
Miltonirrigation uses
6Base taken from Army Map
Service topographic
30*3B - -Freeport91,495 5 6
e INSET A C 6. * Pon
A SE NE 660 Washin too G UL F OF MEX/CO onesacol o 00 o 5 10 15 miles
87015. 8700' 86045' 86-30' 8615'E X P L A N ATIOMN
o64Well
Chloride content in ppm Number is chloride content in ppm
-,500 --- W, I0I IContour interval variable less than 250 ppm 250-1000 ppm more than 1000 ppm
Water suitable for Water suitable for some Water too salty formunicipal supplies manufacturing and most usesirrigation uses
Bose taken from Army MapService topographic
1:250,000 Figure 11. Western Florida gulf coast showing chloride content of water from the upper limestone of the Floridan aquifer,

UNITED STATES DEPARTMENT OF THE INTERIOR FLORIDA BOARD OF CONSERVATIONGEOLOGICAL SURVEY DIVISION OF GEOLOGY
87015 ' 87000' 86045' 86030' 86°15'
SANTA ROSA OUNTY L OKALO3045' -3045
Halley
PE INS OLA .9
BA Fluoride content too low Fluoride content beneficial uoride content
ervice topograpc Ma
50000 Figure 12. Western Florida gulf coast showing fluoride content of water from the upper limestone of the FlBAContour interval, 0.85 t Wappmton
Gase taken from Army MapOF MEXICOeice topographic Map5 15 miles
1:250,000 Figure 12. Wes contern Florida gulf coast showing fluoride content of water from the upper limestone of thicial Fluoride Floridan aquifer.ntent
l: 250,000 Figure 12, Western Florida gulf coast showing fluoride content of water from the upper limestone of the Floridan aquifer.

REPORT OF INVESTIGATIONS No. 29 25
SUMMARY AND CONCLUSIONS
Three aquifers separated by clay aquicludes underlie the area dis-cussed in this paper. The sand-and-gravel aquifer at the surface containssoft, relatively unmineralized water and supplies most of the wells inthe western half of the area. The deeper lying upper limestone of theFloridan aquifer contains water that is more mineralized and suppliesmost of the wells in the eastern half of the area. Most of the lower lime-stone of the Floridan aquifer is too salty for use.
Maps showing hardness, dissolved solids, chloride, and fluoride inwater from the upper limestone indicate that this water is suitable formost uses in the eastern two-thirds of the area. The concentrations ofthe mineral constituents increase in a southwesterly direction, makingthe water unsuitable for most purposes in the western third of the area.The hardest water occurs in the eastern part of the area and the waterbecomes softer in a southwesterly direction.
A decline in head in the upper limestone at Fort Walton Beach hasamounted to about 82 feet since 1986. Apparently, this caused salt waterfrom the lower limestone to move upward through the Bucatunna ClayMember into the upper limestone. Clay in the upper limestone of theFloridan aquifer has played a significant role in the producton of largedrawdowns by decreasing both the permeability and the effective poros-ity of the aquifer. It has also effectively softened the water in the aquiferby ion exchange.

REPORT OF INVESTICATIONS No. 29 27
REFERENCES
Barraclough, J. T. (see Musgrove, R. H.)
Black, A. P.1951 (and Brown, Eugene) Chemical character of Florida's waters,
1951: Florida State Board Cons., Div. Water Survey and Research,Paper 6.
Brown, Eugene (see Black, A. P.)
Carlston, C. W.1942 Fluoride in the ground water of the Cretaceous area of Alabama:
Alabama Geol. Survey Bull. 52.
Cederstrom, D. J.1945 Geology and ground-water resources of the Coastal Plain in south-
eastern Virginia: Virginia Geol. Survey Bull. 63.
Clark, W. E. (see Heath, R. C.)
Collins, W. D.1928 (and Howard, C. S.) Chemical character of waters of Florida:
U. S. Geol, Survey Water-Supply Paper 596-G.
Cooke, C. Wythe1945 Geology of Florida: Florida Geol. Survey Bull. 29.
Cooper, H. H., Jr. (see Jacob, C. E.)
Dean, H. Trendley1943 Domestic water and dental caries: Am. Water Works Assoc. Jour.,
v. 35, no. 9, p. 1161-1183.
Gunter, Herman (see Sellards, E. H.)
Heath, R. C.1951 (and Clark, W. E.) Potential yield of ground water on the Fair
Point Peninsula, Santa Rosa County, Florida: Florida Geol. SurveyRept. Inv. 7.
Hem, J. D.1959 Study and interpretation of the chemical characteristics of natural
water: U. S. Geol. Survey Water-Supply Paper 1473.
Howard, C. S. (see Collins, W. D.)
Jacob, C. E.1940 (and Cooper H. H., Jr.) Report on the ground-water resources of the
Pensacola area in Escambia County, Florida, with a section on thegeology by S. A. Stubbs: U.S. Geol. Survey open-file report.
LaMoreaux, P.E.1948 Fluoride in the ground water of the Tertiary area of Alabama:
Alabama Geol. Survey Bull. 59.

28 FLORIDA GEOLOGICAL SURVEY
Marsh, O.T. (also see Musgrove, R.H.)1962 Relation of Bucatunna Clay Member (Byram Formation, Oligocene)
to geology and ground water of westernmost Florida: Geol. Soc.America Bull., v. 73, p. 243-251.
Matson, G.C.1913 (and Sanford, Samuel) Geology and ground waters of Florida:
U.S. Geol. Survey Water-Supply Paper 319.
Musgrove, R.H.1961 (and Barraclough, J.T., and Marsh, O.T.) Interim report on the
water resources of Escambia and Santa Rosa counties,. Florida:Florida Geol. Survey Inf. Circ. 30.
Sanford, Samuel (see Matson, G.C.)
Sellards, E.I.1912 (and Gunter, Herman) The water supply of west-central and west
Florida: Florida Geol. Survey 4th Ann. Rept., p. 81-155.
Stubbs, S.A. (see Jacob, C.E.)
US. Public Health Service1946 Drinking water standards: Public Health Repts., v. 61, no. 11,
p. 371-384.

-FLORIDA-GEOLOGICAL-SURVEY
COPYRIGHT NOTICE© [year of publication as printed] Florida Geological Survey [source text]
The Florida Geological Survey holds all rights to the source text ofthis electronic resource on behalf of the State of Florida. TheFlorida Geological Survey shall be considered the copyright holderfor the text of this publication.
Under the Statutes of the State of Florida (FS 257.05; 257.105, and377.075), the Florida Geologic Survey (Tallahassee, FL), publisher ofthe Florida Geologic Survey, as a division of state government,makes its documents public (i.e., published) and extends to thestate's official agencies and libraries, including the University ofFlorida's Smathers Libraries, rights of reproduction.
The Florida Geological Survey has made its publications available tothe University of Florida, on behalf of the State University System ofFlorida, for the purpose of digitization and Internet distribution.
The Florida Geological Survey reserves all rights to its publications.All uses, excluding those made under "fair use" provisions of U.S.copyright legislation (U.S. Code, Title 17, Section 107), arerestricted. Contact the Florida Geological Survey for additionalinformation and permissions.