institutional resilience along the mississippi gulf coast
TRANSCRIPT

University of South CarolinaScholar Commons
Theses and Dissertations
2015
Institutional Resilience Along The Mississippi GulfCoast in The Context of Pre- And Post-HurricaneKatrinaKhai Hoan NguyenUniversity of South Carolina
Follow this and additional works at: https://scholarcommons.sc.edu/etd
Part of the Geography Commons
This Open Access Thesis is brought to you by Scholar Commons. It has been accepted for inclusion in Theses and Dissertations by an authorizedadministrator of Scholar Commons. For more information, please contact [email protected].
Recommended CitationNguyen, K. H.(2015). Institutional Resilience Along The Mississippi Gulf Coast in The Context of Pre- And Post-Hurricane Katrina.(Master's thesis). Retrieved from https://scholarcommons.sc.edu/etd/3696

i
INSTITUTIONAL RESILIENCE ALONG THE MISSISSIPPI
GULF COAST IN THE CONTEXT OF PRE- AND POST-HURRICANE
KATRINA
by
Khai Hoan Nguyen
Bachelor of Arts
University of Georgia, 2012
Submitted in Partial Fulfillment of the Requirements
For the Degree of Master of Arts in
Geography
College of Arts and Sciences
University of South Carolina
2015
Accepted by:
Susan L. Cutter, Director of Thesis
Melanie Gall, Reader
Jean Taylor Ellis, Reader
Lacy Ford, Senior Vice Provost and Dean of Graduate Studies

ii
© Copyright by Khai Hoan Nguyen, 2015
All Rights Reserved.

iii
DEDICATION
To John and my parents. Thank you for your love and support. Without you, I
would not be able to complete this process. I love you more than words can express.

iv
ACKNOWLEDGEMENTS
I would like to thank my advisor, Dr. Susan Cutter and my committee members
Dr. Melanie Gall and Dr. Jean Ellis for their patience and guidance through this process.
You guys are my role models. I would like to thank Kevin Ash, Ronald Schumann,
Rachel Reeves, Cam Horne, Caglar Koylu, and Mary Windsor for your advice and
encouragement.

v
ABSTRACT
Building resilience to disasters helps reduce loss of life and property, allowing
communities to recover more quickly from shocks and disruptions. Governing
institutions are tasked with tremendous responsibility in terms of mitigating risks and
enhancing resilience of local communities through proactive planning and policies. It is
important to examine how institutional policies have changed pre- and post-disaster to
determine their contribution to community resilience. Metrics and indicators can be used
to quantitatively assess, establish baseline, track, and monitor resilience at the community
level. Few studies have attempted to measure institutional resilience using a set of
indicators and metrics, and even fewer explore the conceptual gaps between academic
research on hazards and emergency management practice.
This research investigates the utility of the Baseline Resilience Indicators for
Communities (BRIC) institutional resilience (IR) sub-index in a context-specific case
study. This study replicates the BRIC IR sub-index, aggregated at the state scale, for
eighty-two counties in Mississippi in the context of pre- and post-Hurricane Katrina.
Difference of means and median tests along with evaluating of change in ranking were
utilized to determine the drivers of change in institutional resilience from 2000 to 2010
for the state of Mississippi and for Hancock, Harrison, and Jackson counties. In addition,
content analysis of state and local hazard mitigation plans (HMPs) provides contextual
information to explain observed changes in institutional resilience metrics as well as in
post-disaster mitigation practice.

vi
Mitigation spending, flood insurance coverage, disaster aid experience,
jurisdictional coordination, and crop insurance coverage are the drivers of change in
institutional resilience for the state of Mississippi, while only the first three indicators
along with population stability are the drivers for Hancock, Harrison and Jackson
counties. Increases in mitigation spending and flood insurance coverage can be directly
attributed to Hurricane Katrina. Content analysis of state and local HMPs suggests that
the theoretical basis of BRIC IR indicators is reflective of mitigation practice. In addition,
there are substantial improvements in the post-Hurricane Katrina HMPs in the categories
of hazard identification, jurisdictional coordination, reporting of loss data, hazard
modeling, participation in the National Flood Insurance Program, and social vulnerability
assessment.

vii
TABLE OF CONTENTS
Dedication .......................................................................................................................... iii
Acknowledgements ............................................................................................................ iv
Abstract ............................................................................................................................... v
List of Tables ...................................................................................................................... x
List of Figures .................................................................................................................. xiii
CHAPTER 1: INTRODUCTION ....................................................................................... 1
1.1 Research Goals and Contributions .................................................................... 2
1.2 Research Questions ........................................................................................... 3
CHAPTER 2: LITERATURE REVIEW ............................................................................ 4
2.1 Conceptualizing Disaster Resilience................................................................. 4
2.2 Disaster Resilience at the Community Level .................................................... 6
2.3 Roles of Institutions in Building Resilience ................................................... 15
2.4 Summary ......................................................................................................... 20
CHAPTER 3: BACKGROUND AND STUDY AREA ................................................... 21
3.1 Background: Baseline Resilience Indicators for Communities (BRIC) Index 21
3.2 BRIC Institutional Resilience (IR) Indicators ................................................. 22
3.3 Study Area ...................................................................................................... 24
3.4 Summary ......................................................................................................... 26
CHAPTER 4: METHODOLOGY AND RESULTS FOR QUESTION #1 ..................... 27

viii
4.1 Methodology ................................................................................................... 27
4.2 Visualization of Temporal Change in Institutional Resilience for
Mississippi ............................................................................................................ 29
4.3 Case Study: BRIC Institutional Resilience for Hancock, Harrison and Jackson
Counties ................................................................................................................ 34
4.4 Examination of Institutional Resilience Indicators and Metrics for Mississippi
and Hancock, Harrison and Jackson Counties ...................................................... 38
4.5 Summary ......................................................................................................... 57
CHAPTER 5: METHODOLOGY AND RESULTS FOR QUESTION #2 ..................... 59
5.1 Hazard Mitigation Plans ................................................................................. 59
5.2 Methodology ................................................................................................... 60
5.3 Checklist Construction and In-depth Analysis of State and Local Hazard
Mitigation Plans .................................................................................................... 63
5.4 Summary ......................................................................................................... 80
CHAPTER 6: DISCUSSION ............................................................................................ 81
6.1 Utility of the BRIC Institutional Resilience (IR) Sub-Index with regard to the
State of Mississippi and Hancock, Harrison and Jackson counties ...................... 81
6.2 Content Analysis of Hazard Mitigation Plans for the State of Mississippi and
Hancock, Harrison and Jackson Counties ............................................................. 85
6.3 Suggested Improvements for BRIC Institutional Resilience Sub-Index and
Hazard Mitigation Planning .................................................................................. 91
6.4 Institutional Resilience: For Whom? To What? ............................................. 96
6.5 Theoretical Contribution: Operationalizing the DROP Model ....................... 96
6.6 Future Research .............................................................................................. 98
6.7 Conclusion ...................................................................................................... 99
REFERENCES ............................................................................................................... 102

ix
APPENDIX A: BRIC INSITITUTIONAL RESILIENCE SCORES FOR EIGHTY-TWO
COUNTIES IN MISSISSIPPI ......................................................................................... 114

x
LIST OF TABLES
Table 2.1: Selected definitions of community resilience. ................................................... 8
Table 2.2: Selected framework-based resilience indices and case-study applications. .... 13
Table 3.1: Institutional resilience indicators, datasets, and temporal timeframes. ........... 22
Table 4.1: Breakdowns of BRIC institutional resilience scores and metrics (standardized
values) for Mississippi counties with the highest and lowest rankings in 2000, aggregated
at state scale (n=82). ......................................................................................................... 31
Table 4.2: Breakdowns of BRIC institutional resilience scores and metrics (standardized
values) for Mississippi counties with the highest and lowest rankings in 2010, aggregated
at state scale (n=82). ......................................................................................................... 32
Table 4.3: Paired difference of means test result comparing BRIC IR scores (aggregated at
state scale) in 2000 and 2010 ............................................................................................ 33
Table 4.4: Paired difference of means test comparing Mississippi IR scores aggregated at
the national scale and Mississippi IR scores aggregated at state scale in 2000 and 2010. 34
Table 4.5: Breakdowns of BRIC institutional resilience scores and metrics (standardized
values) for Hancock, Harrison and Jackson counties in 2000 and 2010, with state ranking
in parentheses (out of 82 counties). .................................................................................. 36
Table 4.6: Breakdowns of BRIC institutional Resilience scores and metrics (standardized
values) for Hancock, Harrison and Jackson counties in 2000 and 2010, with national
ranking in parentheses (out of 3,108 counties). ................................................................ 37
Table 4.7: Wilcoxon Signed-Rank Test results comparing change in values of each
indicator from 2000 to 2010 for the State of Mississippi (n=82). .................................... 39
Table 4.8: Mississippi counties with the highest mitigation spending per capita
in 2000. ............................................................................................................................. 40
Table 4.9: Mississippi counties with the highest and lowest mitigation spending per capita
in 2010. ............................................................................................................................. 40
Table 4.10: Mitigation spending for Hancock, Harrison and Jackson counties in 2000 and
2010................................................................................................................................... 42
xi
Table 4.11: Mississippi counties with highest and lowest flood insurance coverage
in 2000. ............................................................................................................................. 43
Table 4.12: Mississippi counties with highest and lowest flood insurance coverage
in 2010. ............................................................................................................................. 44
Table 4.13: Flood insurance coverage for Hancock, Harrison and Jackson counties in 2000
and 2010. ........................................................................................................................... 45
Table 4.14: Mississippi counties with highest and lowest jurisdictional coordination in
2000................................................................................................................................... 46
Table 4.15: Mississippi counties with highest and lowest jurisdictional coordination in
2010................................................................................................................................... 46
Table 4.16: Jurisdictional coordination for Hancock, Harrison and Jackson counties in 2000
and 2010. ........................................................................................................................... 48
Table 4.17: Mississippi counties with highest and lowest disaster aid experience
in 2000. ............................................................................................................................. 49
Table 4.18 Mississippi counties with highest and lowest disaster aid experience
in 2010. ............................................................................................................................. 49
Table 4.19: Disaster aid experience for Hancock, Harrison and Jackson counties in 2000
and 2010. ........................................................................................................................... 50
Table 4.20: Mississippi counties with CERTs in 2010. .................................................... 51
Table 4.21: Performance regime (proximity of county seat from the state capital) for
Mississippi counties. ......................................................................................................... 51
Table 4.22: Performance regime (proximity of county seat from the nearest Metropolitan
Statistical Area) for Mississippi counties. ........................................................................ 52
Table 4.23: Performance regime (proximity of county seat to capital) for Hancock,
Harrison and Jackson counties. ......................................................................................... 53
Table 4.24: Performance regime (proximity of county seat to nearest Metropolitan
Statistical Area) for Hancock, Harrison and Jackson counties. ........................................ 53
Table 4.25: Mississippi counties with highest and lowest population stability in 2000. .. 54
Table 4.26: Mississippi counties with highest and lowest population stability in 2010. .. 54

xii
Table 4.27: Population stability for Hancock, Harrison and Jackson counties in 2000 and
2010................................................................................................................................... 55
Table 4.28: Mississippi counties with highest and lowest crop insurance coverage
in 2000. ............................................................................................................................. 56
Table 4.29: Mississippi counties with highest and lowest crop insurance coverage
in 2010. ............................................................................................................................. 56
Table 4.30: Crop insurance coverage for Hancock, Harrison and Jackson counties in 2000
and 2010. ........................................................................................................................... 57
Table 4.31: Drivers of temporal change in institutional resilience for the State of
Mississippi and for Hancock, Harrison and Jackson counties. ......................................... 57
Table 5.1: State and local mitigation plans included in this study.................................... 61
Table 5.2: Checklist for state and county HMPs using BRIC institutional indicators. .... 63
xiii
LIST OF FIGURES
Figure 2.1: Disaster Resilience of Place (DROP) model (Cutter et al. 2008b). ............... 10
Figure 3.1: Map of coastal counties in Mississippi........................................................... 25
Figure 4.1: BRIC institutional resilience scores for eighty-two counties in Mississippi in
2000 and 2010 (aggregated at the state scale). ................................................................. 30

1
CHAPTER 1: INTRODUCTION
Over the previous fifty years, total losses in the United States from weather-
related events have increased tremendously (Cutter and Emrich 2005; Barthel and
Neumayer 2012; Hallegatte et al. 2013; Preston 2013). Urban population growth and
persistent development in or near the coastal zones contribute to greater exposure of lives
and properties (Klein et al. 2003b). Inhabitants and institutions are often ill-prepared and
ill-equipped as they lack the adaptive capacity and coping mechanisms to absorb the
potential for loss and recover from disturbances (Cutter et al. 2008b). In recent decades,
notable meteorological hazards like Post-Tropical Cyclone Sandy (2012) and Hurricane
Katrina (2005) wrought havoc in U.S. coastal communities, causing losses and damage in
the tens of billions of dollars (Waple 2005; Blake et al. 2013). Disruptions to local
economic activities and social functions were followed by long and strenuous
reconstruction periods (Cutter et al. 2006; Manuel 2013). As local communities struggle
with potential devastation posed by natural hazard events and emerging climate change
impacts, it is no longer sufficient for these communities to assess only the physical and
social vulnerability of a particular area or population. Rather, this process of vulnerability
assessment must be carried out in tandem with evaluating and enhancing a community’s
disaster resilience (National Preparedness Goal 2011; IPCC 2012).
Current disaster policies push for guidelines on how to incorporate resilience as a
means of mitigating disaster impacts. In 2012, the National Research Council argued that
it is necessary to evaluate and benchmark the baseline conditions that contribute to

2
community resilience as well as measure the factors affecting the capacity of
communities to respond to and rebound from adverse impacts of an event. This can be
accomplished through the construction of resilience metrics and social indicators
(Birkmann 2007; Cutter et al. 2010). Resilience metrics and indicators are useful tools in
terms of measuring community resilience levels. Indicators can be employed when
setting policy goals in mitigation planning or as screening tools to set baselines and
assess temporal and spatial changes (Birkmann 2007; Frazier 2013). Metrics and
indicators, however, provide limited and generalized representations of reality and do not
capture all of the complex facets of resilience. It is necessary to carry out further research
to understand resilience indicators both in terms of the approaches used to build them and
their usefulness in real-world applications (Fekete 2009; Tate 2012; Frazier 2013; Singh-
Peterson et al. 2015).
1.1 Research Goals and Contributions
The purpose of this thesis is evaluate and contextualize the output metrics of the
Baseline Resilience Indicators for Communities (BRIC) index through replication of the
institutional resilience sub-index at the state and content analysis of hazard mitigation
plans. It conducts a longitudinal assessment of institutional resilience in a real-world
application using the Mississippi Gulf Coast in the context of pre- and post-Hurricane
Katrina as a case study. It also examines the disaster governance structure of the state of
Mississippi by exploring how mitigation practices have changed in the post-Katrina
period. The mixed method approach aims to acquire a better sense of institutional
resilience both in academic and practical settings. It also provides a crucial opportunity

3
for bridging conceptual gaps between researchers and practitioners in the disaster
management realm.
1.2 Research Questions
The following research questions provide the focus for this thesis:
1. How has the institutional resilience for the Mississippi Gulf Coast, conceptualized
as BRIC indicators, changed in the setting of pre- and post-Katrina?
2. Do state and local mitigation plans explain or indicate changes in institutional
resilience metrics for the Mississippi Gulf Coast in the setting of pre- and post-
Katrina?
Chapter 2 provides a literature overview of the theoretical and practical
orientation of resilience, focusing on the institutional aspect. Chapter 3 focuses on the
background of BRIC index, the institutional resilience indicators and the Mississippi Gulf
Coast as study area. Next, Chapter 4 details the methodology and results of the BRIC
institutional resilience sub-index in the context of pre- and post-Hurricane Katrina.
Chapter 5 contains the examination of state and local hazard mitigation plans regarding
how they have changed within the respective timeframe. Finally, Chapter 6 discusses the
significances of the findings and suggests improvements for hazard mitigation plans as
well as new indicators of institutional resilience.

4
CHAPTER 2: LITERATURE REVIEW
2.1 Conceptualizing Disaster Resilience
There are numerous ways in which resilience is conceptualized but there is “no
broadly accepted single definition” between the environmental science, hazard and
practitioner communities (Klein et al. 2003a; Manyena 2006; Cutter et al. 2008b, 599).
Etymologically, the concept of resilience stemmed from resilio or resilire, meaning to
“bounce” in Latin and has a long history rooted in the classical arts, literature, law,
engineering, computer science, and social sciences (Alexander 2013). In recent years, the
number of academic works relating to resilience have skyrocketed in social science
research including disciplines such as geography, sociology, psychology and public
health (Renschler et al. 2010; Zhou et al. 2010; Chamlee-Wright Storr 2011; Miles and
Chang 2011; Cox and Perry 2011; Aldrich 2012; Berkes and Ross 2013; Morton and
Lurie 2013; Plough et al. 2013; Tidball and Stedman 2013; Cutter et al. 2014b).
Holling (1973) was one of the first to describe resilience as a measure of the
ability of a system to absorb change and persist after disturbances. In other words, a
resilient system is one that can absorb shocks and still function. Another aspect of
resilience concerns the capacity for renewal, re-organization and development (Folke
2006). Given these characteristics, two different framings of resilience emerge:
ecological and engineering resilience. The global environmental change literature
identifies with the ecological framing of resilience, which emphasizes the adaptive ability
to cope with and learn from unpredictability (Manyena 2014). It examines resilience in

5
relation to the long-term impacts of climate change. Adger (2000) explains the linkage
between ecological resilience and social resilience in terms of human resource
dependency on the natural environment, a process he observed in developing societies
whose livelihoods and social order are intricately intertwined with the availability of
natural resources. In later work, Adger et al. (2005) suggests that socio-ecological
resilience refers to the capacity of a complex system to execute self-organization through
adaptive learning and preparing for uncertainty and surprise. As such, socio-ecological
resilience is directly related to adaptive capacity, or the ability of a system to adjust to
change, moderate the effects and cope with a disturbance (Smit and Wandel 2006; Engle
2011).
Engineering resilience refers to resistance to disturbance, the ability to maintain
an acceptable level of functioning, and speedy return to a single static equilibrium
(McDaniels et al. 2008). It is closely associated with short-term coping with specific
natural hazards, relating to concepts such as vulnerability, preparedness, response, and
recovery (Birkmann 2006b; Paton 2006; Walsh 2007; Norris et al. 2008; Twiggs 2009;
Wells et al. 2013). It can be applied at different scales to individuals, households,
institutions, cities, regions or nations (Aguirre 2005; Bonnano et al. 2007; Butler 2007;
Hassink 2009; Joerin and Shaw 2011; Manyena 2014). In the hazard literature, resilience
can be defined as “the ability to prepare and plan for, absorb, recover from, and more
successfully adapt to actual or potential adverse events” (NRC 2012, 16). It also refers to
the capacity to rapidly restore system function to pre-disaster level (UNISDR 2009).
Norris et al. (2008) discuss the notion of resilience as a set of capacities, which can be
enhanced by economic and community resources. Others focus on engineered structures

6
and land-use planning, which seek to minimize the impacts of disasters and quickly
restore crucial services and lifelines (Bruneau et al. 2003; Rose 2007; McAllister 2013).
Berkes and Ross (2013) introduce an integrated concept of community resilience,
attempting to unify the two disparate framings mentioned above. Characteristics such as
adaptive capacity, flexibility, social networks and self-organization are desired traits in
both ecological and engineered framing of resilience. These traits can be fostered through
community development and community-based planning. Communities should strive to
attain general resilience to a wide range of uncertainties and surprises while recognizing
that building disaster resilience to specific hazards is also important.
2.2 Disaster Resilience at the Community Level
Many current works and research on disaster explore how to enhance resilience,
ideally at the community level. This section features various definitions of community
resilience and its conceptualizations at the community scale. Community is a complex
and difficult concept to define because it can range from “grass-roots groups and
neighborhoods to complex amalgams of formal institutions and sectors in larger
geopolitical units” (Norris et al. 2008, 128).
From a hazard perspective, the spatial dimension remains crucial in terms of
identifying socially and physically vulnerable populations based on geographical
locations. Such spatial framing of community should acknowledge that individuals
identify membership based on diverse factors such as occupation, religion, socio-
economic status, gender or recreational activities, among others (Twigg 2007; Berkes and
Ross 2013). As such, a community should be examined based on its spatial location as
well as the socio-demographic characteristics of its population.

7
Community resilience is generally discussed in terms of the capacity, ability, and
resources to cope with and bounce back from exposure to a disruptive event and also
future events (Table 2.1). The process of building and enhancing community resilience
can be achieved in the preparedness, mitigation, response and recovery phases. Two
central aspects of community resilience are social learning and social capital. Resilience
is associated with social learning, or the ability to self-organize, which enables
communities to incorporate post-disaster lessons into planning and policies in order to be
more prepared for the next disaster (Cutter et al. 2008b; Manyena 2014). Social capital is
linked to the ability of a community to self-organize in the response and recovery period
(Nakagawa and Shaw 2004; Aldrich 2012). Mutual assistance from social networks can
benefit members of a group in terms of providing financial and social support in times of
crisis.
Beyond the social components, community resilience also relates to the capability
of the built environment to resist and rapidly recover from disruptive events (McAllister
2013). This means that critical facilities and lifelines need to be operational and
functional during and after hazard events to support other aspects of community
resilience. As such, community resilience is a multi-dimensional concept that can be
applied to examine the social system and the built environment in the context of pre- and
post-disaster.

8
Table 2.1: Selected definitions of community resilience.
Citations Definition (direct quotes)
Timmerman 1981 A system's capacity to absorb and recover from the occurrence of a hazardous
event; reflective of a society's ability to cope and to continue to cope in the
future
Wildavsky 1991 The capacity to cope with unanticipated dangers after they have become
manifest, learning to bounce back
Comfort et al. 1999 The capacity to adapt existing resources and skills to new systems and
operating conditions
Mileti 1999 (The ability to) withstand an extreme event without suffering devastating
losses, damage, diminished productivity, or quality of life without a large
amount of assistance from outside the community
Paton 2000 The capability to bounce back and to use physical and economic resources
effectively to aid recovery following exposure to hazards
Chenoweth and
Stehlik 2001
The ability to respond to crises in ways that strengthen community bonds,
resources, and the community's capacity to cope
Bruneau et al. 2003 The ability of social units to mitigate hazards, contain the effects of disasters
when they occur, and carry out recovery activities in ways that minimize social
disruption and mitigate the effects of future earthquakes
Ganor and Ben-
Lavy 2003
The ability of individuals and communities to deal with a state of continuous
long term stress; the ability to find unknown inner strengths and resources in
order to cope effectively; the measure of adaptation and flexibility
Godschalk 2003 A sustainable network of physical systems and human communities, capable of
managing extreme events; during disaster, both must be able to survive and
function under extreme stress
Coles and Buckle
2004
A community’s capacities, skills, and knowledge that allow it to participate
fully in recovery from disasters
Norris et al. 2008 A process linking a set of networked adaptive capacities to a positive trajectory
of functioning and adaptation in constituent populations after a disturbance
UNISDR 2009 The ability of a system, community, or society exposed to hazards to resist,
absorb, accommodate to and recover from the effects of a hazard in a timely
and efficient manner, including through preservation and restoration of basic
structures and functions.
Magis 2010 The existence, development, and engagement of community resources by
community members to thrive in an environment characterized by change,
uncertainty, unpredictability, and surprise
Acosta et al. 2011 The ongoing and developing capacity of the community to account for its
vulnerabilities and develop capabilities that aid that community in (1)
preventing, withstanding, and mitigating the stress of a health incident; (2)
recovering in a way that restores the community to a state of self-sufficiency
and at least the same level of health and social functioning after a health
incident; and (3) using knowledge from a past response to strengthen the
community’s ability to withstand the next health incident.
Cox and Perry 2011 A reflection of people's shared and unique capacities to manage and adaptively
respond to the extraordinary demands on resources and losses associated with
disasters
Berkes and Ross
2013
Communities do not control all of the conditions that affect them, but they
have the ability to change many of the conditions that can increase their
resilience. They can build resilience through their responses to shocks and
stress, and actively develop resilience through capacity building and social
learning.

9
2.2.1 Community Disaster Resilience Frameworks
In the last decade, there have been increased efforts to create conceptual
frameworks and models to operationalize resilience. Bruneau et al. (2003) provides a
seismic resilience framework for communities introducing the four R’s: robustness,
redundancy, rapidity and resourcefulness. These four R’s have been influential in the
conceptualization of many subsequent resilience frameworks. For example, Rose and
Krausmann (2013) construct an economic resilience index to measure business recovery
in post-disaster periods. This framework applies the four R’s from Bruneau et al. (2003)
as proxies for economic performance indicators. Norris et al. (2008) utilize the
robustness, redundancy and rapidity concepts to generate a resilience index at the
community level which defines resilience as a set of networked adaptive capacities
composed of factors relating to economic development, information communication,
social capital and community competence. Renschler et al. (2010a) introduce the
PEOPLES Resilience Framework that highlight seven aspects of community resilience
regarding to population and demographics, environmental and ecosystems, organized
governmental services, physical infrastructure, lifestyle and community competence,
economic development, and socio-cultural capital. Lastly, Cutter et al. (2008b) propose
the Disaster Resilience of Place (DROP) model, which focuses on social resilience at the
community level (Figure 2.1). The authors draw from multiple influences, defining
disaster resilience as:
The ability of a social system to respond and recover from disaster
includes those inherent conditions that allow the system to absorb impacts
and cope with an event, as well as post-event, adaptive processes that

10
facilitate the ability of the social system to re-organize, change and learn
to respond to a threat (Cutter et al. 2008b, 599).
Figure 2.1: Disaster Resilience of Place (DROP) model (Cutter et al. 2008b).
Resilience in the post-disaster setting will not only allow the affected population
to “bounce back” quickly, but also “bounce forward” to adapt appropriately in
preparation for the next disturbance (Manyena et al. 2011). The DROP model theorized
that there are sets of inherent vulnerability and resilience, which exist at the nexus of
social systems, natural systems and the built environment. This conceptualization points
to two qualities of resilience: inherent and adaptive. Inherent resilience refers to the
system components that function well during non-crisis periods, while adaptive resilience
is the flexibility of system in the post-disaster period. Adaptive resilience consists
improvisation and social learning which should be incorporate back into the system as
part of inherent resilience in the post-disaster period (Rose 2004). These two
qualifications can be applied to infrastructure, institutions, organizations, social systems,
or economic systems (Cutter et al. 2008b).

11
2.2.2 Resilience Indices and Applications
The Committee that produced the report, Disaster Resilience: A National
Imperative, for the National Research Council recognized the need for resilience
measurement (NRC 2012). Quantitative means of assessment allow key actors and
institutions to prioritize investments and needs, monitor progress, and compare the
benefits of increasing resilience with associated costs. Resilience metrics and indicators
can be applied to set targets, establish goals for improvement, and provide quantitative
measures for ranking and monitoring resilience factors. These can also be a way to unify
disparate views of stakeholders around a consensus (Cutter et al. 2013). In addition,
quantitative analysis of resilience indices can help inform local and national
policymakers about changes in the socioeconomic structure of at-risk communities
(Sherrieb et al. 2010).
There are various contemporary indices that have emerged from resilience
conceptual frameworks (NRC 2012). Notable examples include: Rose (2004)’s economic
resilience index at multiple market scales, Mayunga (2007)’s capital-based approach the
Community Disaster Resilience Index, Carreno et al. (2007)’s Risk Management Index
on public and institutional policies, Cutter et al. (2010)’s Baseline Resilience Indicators
for Communities Index, Sherrieb et al. (2010)’s Community Resilience Index based on
economic development and social capital, Orencio and Fujii (2013)’s localized disaster-
resilience index to assess coastal communities, and Miles and Chang (2013)’s ResilUS
for measuring hazard-related damage and recovery over time.
Some of the previously mentioned resilience indices have been put into
applications (Table 2.2). These case studies are usually place-based because resilience

12
can be better understood within a specific geographical, spatial and cultural context
(Berkes and Ross 2013). Some case studies attempt to validate the resilience metrics by
comparing them against social vulnerability and recovery metrics while others examine
the utilities of the indicators and metrics by soliciting opinions of emergency
practitioners. Sherrieb et al. (2010) apply the community resilience model by Norris et al.
(2008) to examine economic development and social capital for the state of Mississippi at
the county level. The authors utilize the metrics from eleven indicators from the Social
Vulnerability Index (SoVI) to validate their resilience index. They find that community
resilience along with community capital and economic development are negatively
correlated with social vulnerability. Bergstrand et al. (2015) adopt this method by
Sherrieb et al. (2010) and replicate the Social Vulnerability Index and the Community
Resilience at the national level. Their findings suggest that there is a relationship between
resilience and social vulnerability; however, this relationship is varied based on regional
differences. On the other hand, Burton (2015) evaluates the relationship of resilience
indicators (similar to those of BRIC) and disaster recovery at the block group level by
comparing them in a case study of the Mississippi Gulf Coast. His findings suggest that
certain indicators have the potential to be externally validated using post-disaster
recovery activities.

13
Table 2.2: Selected framework-based resilience indices and case-study applications.
Resilience
Framework Domains Resilience Index Case-study Applications
Disaster
Resilience of
Place
(DROP)
Model
(Cutter et al.
2008b)
Social, Economic,
Institutional,
Infrastructural, Community
Capital, Ecological
Baseline
Resilience
Indicators for
Communities
(BRIC) Index
(Cutter et al.
2014b)
FEMA Region IV, U.S.
(Cutter et al. 2010)
United States (Cutter et al.
2014b)
Sarasota County, FL (Frazier
et al. 2013)
Sunshine Coast, Australia
(Singh-Peterson et al. 2013)
Indonesia (Kusumastuti et al.
2014)
Mississippi Gulf Coast, U.S.
(Burton 2015)
Capital-
based
strategies
(Mayunga
2007)
Social Capital, Economic
Capital. Human Capital,
Physical Capital, Natural
Capital
Community
Disaster
Resilience Index
(Mayunga 2007)
Gulf Coast region, U.S.
(Mayunga 2007)
Community
Capacity
(Norris et al.
2008)
Economic Development,
Social Capital, Information
and Communication,
Community Competence
Community
Resilience Index
(Sherrieb et al.
2010)
State of Mississippi, U.S.
(Sherrieb et al. 2010)
United States (Bergstrand et
al. 2015)
4 R’s
framework
(Bruneau et
al. 2003)
Robustness, Redundancy,
Resourcefulness, Rapidity
Properties of
Resilience (Chang
and Shinozuka
2004)
Memphis, TN (Cimellaro et al.
2010)
Memphis, TN (Chang and
Shinozuka 2004)
Economic
Resilience
(Rose 2004)
Inherent Resilience
Computable
General
Equilibrium
(CGE) Model
Portland, OR (Rose 2004)
PEOPLES
(Renschler et
al. 2010a)
Population and
Demographics,
Environmental/Ecosystems,
Organized Governmental
Services, Physical
Infrastructure,
Lifestyle & Community
Competence, Economic
Development, Social-
Cultural Capital
PEOPLES
(Renschler et al.
2010b)
San Francisco, CA (Martinelli
et al. 2014)
Disaster-
Resilient
Coastal
Community
(Orencio and
Fujii 2013)
Environmental and Natural
Resource Management,
Sustainable Livelihood,
Social Protection, Planning
Regimes
Coastal
Community
Disaster
Resilience Index
(Orencio 2014)
none
14
Frazier et al. (2013) and Singh-Peterson et al. (2014) exemplify several studies
that evaluate the application of the BRIC index in a context-specific research. Frazier et
al. (2013) explore the application of BRIC for Sarasota County, Florida. The authors
conduct reviews of different types of current hazard mitigation plans and construct a
checklist of resilience factors using the indicators of the Cutter et al. (2010)’s BRIC
model as a reference. In addition, they also carry out focus groups with representatives
from hazard, engineering, public safety and public work sectors, to help identify
resilience indicators that are applicable to the region. Singh-Peterson et al. (2014) utilize
the BRIC indicators (Cutter et al. 2010) to construct baseline resilience index for the
Sunshine Coast of Australia using national data sources as well as for surveying
representatives from telecommunication, energy, water, health, and emergency service
sectors. This study examines the usefulness of the adapted BRIC as a top-down
assessment tool. Based on survey analysis of planners, Singh-Peterson et al. (2014)
conclude that BRIC is not suited to the Sunshine Coast local government area because of
the omission of environmental resilience and regional and local diversity themes in Cutter
et al. (2010). Similar to the Sunshine Coast study, the results from Frazier et al. (2013)
suggest that there are several temporal, scalar and geographical limitations associated
with quantitative resilience indicators. Both Singh-Peterson et al. (2014) and Frazier et al.
(2013) stress the importance of consultations with practitioners and incorporate their
suggestions into the construction of a resilience index, bridging the gap between
academic research and practices.
Although applications of resilience indices are becoming increasingly common,
they vary in terms of scale (e.g. local, city, national) and geographical area (e.g.

15
developed countries, developing countries). None of the noted examples conducted a
longitudinal assessment of change in resilience metrics, including in the context of pre-
and post-disaster. This is true despite the fact that the concept of disaster resilience
emphasizes the ability or capacity of a community to cope and bounce back from
disruption (Table 2.2). McAllister (2013) points out that it is important to track and
monitor resilience metrics before and after hazard events in addition to determining the
overall resilience of a community. In recognition of this research need, this thesis
conducts a longitudinal assessment of institutional resilience before and after Hurricane
Katrina.
2.3 Roles of Institutions in Building Resilience
Institutions are often perceived as instrumental to and responsible for the
resilience of a social system through mitigation actions and reduction of vulnerability
(Djalante and Thomalla 2011). Adger (2000, 354) states that “social resilience is
institutionally determined, in the sense that institutions permeate all social systems and
institutions fundamentally determine the economic system in terms of its structure and
distribution of assets”. Adaptive policies can help communities lessen the impacts from
disaster and speed up the recovery periods by reinforcing institutional capacity for
anticipation and learning. There are multiple factors that contribute to a society’s or
system’s resilience against the impacts of natural hazards and other forms of disturbance.
Efforts to examine how resilience can be strengthened or enhanced can be seen in the
contexts of infrastructural resilience (Bruneau et al. 2003; McDaniels et al. 2008; Rogers
et al. 2012; Chang et al. 2014), economic resilience (Rose 2007; Simmie and Martin
2010; Rose and Krausmann 2013), community capital (Norris et al. 2008; Chamlee-

16
Wright and Storr 2011; Aldrich 2012; Plough et al. 2013), social resilience (Morrow
2008; Keck and Sakdapolrak 2013), and institutional resilience (Adger 2000; Godschalk
2003; Berke and Smith 2009; Manyena 2014).
Institutions consist of “habitualized behavior and rules and norms that govern
society as well as the more usual notion of formal institutions with memberships,
constituencies and stakeholders” (Adger 2000, 348). They also contain “elements that
measure how organizations manage or respond to disaster such as organizational
structure, capacity, leadership, training, and experience” (Cutter et al. 2008b, 604). These
usually take the form of governmental entities, but there have been growing collaborative
partnerships between public sectors, private organizations and civil society in the
decision-making process relating to disaster governance (Tierney 2012).
The capacity of an institution to effectively respond to and cope with natural
hazard events reflects and contributes to the overall resilience of a system. Proactive
hazard mitigation planning presumes the inevitability of change and attempts to create a
system that is capable of adapting to new conditions and scenarios (Godschalk 2003).
This type of action enhances system resilience by moving it beyond the status quo (Klein
et al. 2003a; Manyena et al. 2011. Flexibility, vertical and horizontal integration and
intra-sectorial cooperation regarding institutional management can serve to enhance
system resilience as opposed to a hierarchical command and control structure (Cutter et
al. 2008a; Berke and Smith 2009; Smith 2012; Berke et al. 2012).
Godschalk (2003) and Duxbury and Dickinson (2007) identify several
mechanisms to bolster resilience against disaster: building code standards, land-use
planning, at-risk property acquisition, and tax incentives. Other strategies include

17
developing community mitigation capacity, network communication channels between
different agencies and key actors, actively assessing hazards and risks, assisting socially
vulnerable populations and spreading public awareness through educational and outreach
programs. Effective hazard mitigation planning and practices are just two examples of
instruments that can be executed by governmental institutions to support resilience
building in communities.
At the national level, multiple federal disaster frameworks along with programs
and funding from the Federal Emergency Management Agency (FEMA) are designed to
proactively address risk reduction by incentivizing coordination and integration of
mitigation activities at the state and local levels. In 2000, the federal government passed
the Disaster Mitigation Act, providing a new set of requirements which states must
comply with in order to qualify for mitigation grant assistance (Berke and Smith 2009;
Smith 2012). It also required state and local governments to prepare and implement pre-
disaster mitigation plans (Smith 2011; Godschalk et al. 2009). Furthermore, FEMA has
different types of grants available for mitigation projects in the forms of post-disaster
Hazard Mitigation Grant Program (HMGP), Pre-Disaster Mitigation Grant Program
(PDM) and Flood Mitigation Assistance Program (FMA). These programs encourage and
aid states and local governments in mitigation planning as well as implementing risk
reduction projects (Rose 2007). Protective actions against hazard risks are beneficial
investments that can significantly improve public safety by reducing loss of life and
injuries (Rose 2007). A study by the Multi-hazard Mitigation Council demonstrates that
on average, for every $1 spent by Federal Emergency Management Agency (FEMA) on
hazard mitigation, society derives $4 in future benefits (MMC 2005).

18
2.3.1 Institutional Resilience Indicators
Few studies have attempted to examine institutional resilience as an individual
characteristic of system resilience, and even fewer have attempted to measure it by using
a set of indicators and metrics, particularly in a disaster context (Esnard et al. 2011;
Ainuddin and Routray 2012; Cutter et al. 2014b; Yoon et al. 2015). For Esnard et al.
(2011), institutional resilience functions as a component of an index measuring relative
displacement risk to hurricanes. It consists of state and local disaster planning, mandated
natural hazard elements and their geographic coverage in local planning, and mandated
requirements for post-disaster recovery plans. The authors measure these variables as
binary values, i.e. their presence or absence.
Another study produced by Ainuddin and Routray (2012) identify mitigation,
municipal services and awareness as indicators of institutional resilience in their study of
earthquake hazards in Baluchistan. Their indicators are associated with the percentage of
population covered by hazard mitigation plan, percentage of municipal expenditures for
fire and emergency management system and medical services, and percentage of people
with earthquake education. Next, Yoon et al. (2015) develop an institutional resilience
sub-index for their Community Disaster Resilience Index for South Korea. These
institutional resilience indicators related to mitigation capacity and preparedness in terms
of mitigation planning, rainwater outflow reduction planning and detention facilities
planning.
Lastly, Cutter et al. (2010) originally proposed eight different BRIC institutional
indicators for the examination of resilience in the Southeastern region on the U.S. They
related to mitigation (e.g. population coverage by mitigation plan, Community Rating

19
Systems for Flood, and Storm Ready communities), flood insurance coverage, municipal
services, political fragmentation, disaster experience, and social connectivity. Cutter et al.
(2014b) update the BRIC institutional index and expand the list of indicators covering ten
different aspects of disaster governance at the national scale. The institutional resilience
score of each county in the U.S. can be calculated using data relating mitigation
spending, flood insurance coverage, jurisdictional coordination, disaster aid experience,
performance regime-proximity of county seat to state capital, performance regime-
proximity of county seat to nearest metropolitan statistical area, population stability,
nuclear accident planning and crop insurance coverage. These are further explained in the
following chapter.
Despite the differences in methodological and contextual approach between these
four studies, the basic logic behind selecting institutional resilience indicators is similar
in each. First, institutional resilience is regarded as an individual characteristic of overall
system resilience, along with social, economic, political, infrastructural, and
environmental resilience. Second, the selection of the indicators is directly related to the
availability of data sources depending on the temporal and spatial scale of the index.
Finally, composite indicators are perceived to be useful for evaluating and benchmarking
the baseline conditions that lead to community resilience as well as providing metrics to
set priorities and aid in in decision-making processes (Cutter et al. 2010).
The institutional resilience section from the BRIC index (Cutter et al. 2014b) was
chosen because its indicators are more likely to experience change post-disaster,
especially in the mitigation funding and insurance expansion categories (Rose 2007;
Michel-Kerjan 2010). As such, institutional policies relating to these categories are more
20
actionable because mitigation planning and flood insurance coverage have been shown to
be economically beneficial to individuals, communities and society (Kunreuther 2006;
Rose 2007; Yoon et al 2015).
2.4 Summary
Resilience is a multi-faceted concept that has been conceptualized,
operationalized and applied by various disciplines. In the hazard and disaster literature,
resilience is closely related to mitigation, community resources, engineered structural
protections, and land-use regulations. There have been many attempts to operationalize
resilience frameworks into functional indices to benchmark resilience by employing
metrics and indicators. In the case of institutional resilience, governing institutions are
tasked with tremendous responsibility in terms of mitigating risks and enhancing
resilience in their communities. As such, mitigation planning and policies are major parts
of disaster governance that can affect the process of building and enhancing overall
community resilience. Application of an institutional resilience index in a context-
specific case study can help shed light on the utility of resilience metrics and indicators at
varying scale. It is important to examine how institutional resilience, as well as other
aspects of resilience (e.g. social, economic, infrastructural, community capital and
ecological), has changed before and after hazard events in order to prioritize and allocate
resources. In addition, monitoring institutional resilience metrics is crucial in determining
the effectiveness and weaknesses of mitigation actions.
21
CHAPTER 3: BACKGROUND AND STUDY AREA
3.1 Background: Baseline Resilience Indicators for Communities (BRIC) Index
The Baseline Resilience Indicators for Communities (BRIC) is a resilience index
designed to monitor and compare disaster resilience at multiple scales. The Disaster
Resilience of Place (DROP) model on inherent resilience by Cutter et al. (2008b)
provides the conceptual framework for BRIC. The data for BRIC mainly came from
publicly available sources including census population data, FEMA data on flood
coverage and mitigation planning, non-profits and private sources. BRIC used U.S.
counties as the spatial unit of analysis because county boundaries are less likely to change
over time as compared to other census units (e.g. census tracts, block groups). In
addition, county emergency management institutions are heavily involved in emergency
management planning, serving as intermediaries between state and municipal
governments (Cutter et al. 2010; Cutter et al. 2014b).
The first version of BRIC contained five sub-indices, each with its own selection
of indicators: social resilience, economic resilience, institutional resilience, infrastructure
resilience and community capital (Cutter et al. 2010). Cutter et al (2014b) revised BRIC
to expand the set of indicators for each of these listed components and included an
additional environmental resilience sub-index. The authors transformed and standardized
raw data values into comparable scales such as percentages, per capita and density
functions. Variables were normalized using a min-max rescaling scheme that
decomposed the values into an identical range between 0 and 1. This standardization
22
process was also applied to the sub-component resilience scores. The overall sub-
component score was calculated by summing the normalized value of relevant indicators.
The final resilience score for each county was constructed by summing the composites of
the six resilience sub-indices. The scores range from zero to six with higher scores
indicating greater resilience (Cutter et al. 2014b). They represent a relative, not absolute,
measurement of community resilience, which can be used to as comparative tools to
understand resilience between places.
3.2 BRIC Institutional Resilience (IR) Indicators
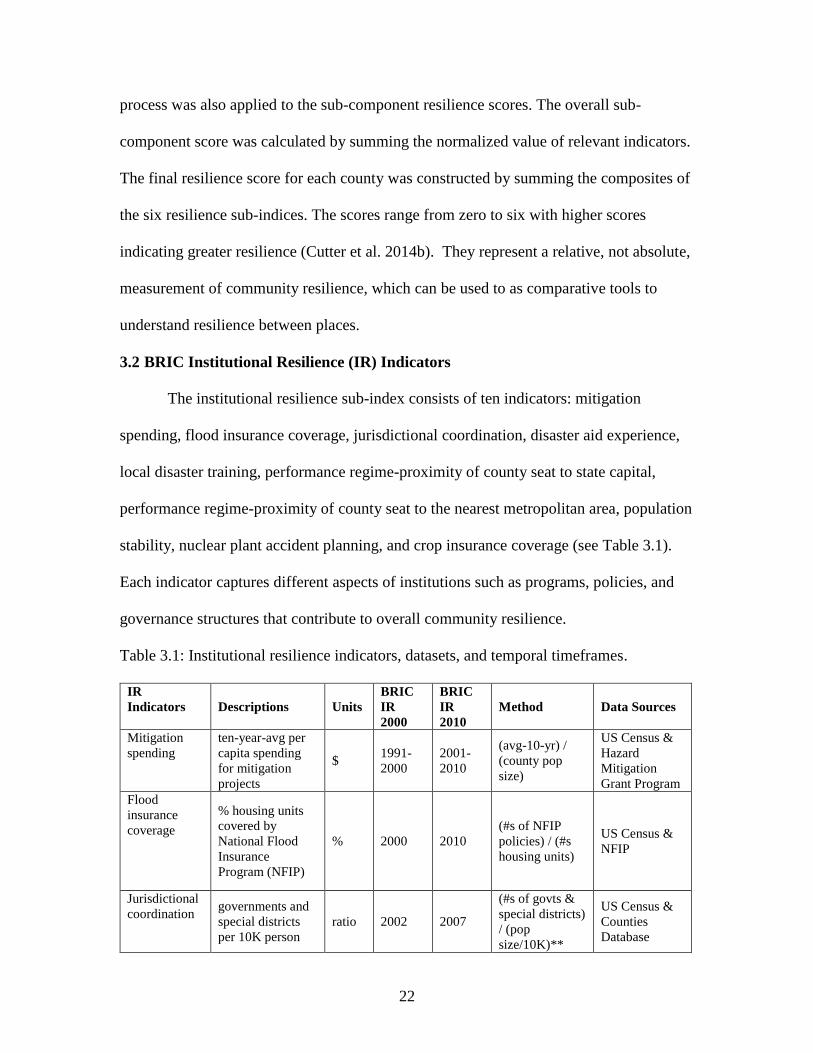
The institutional resilience sub-index consists of ten indicators: mitigation
spending, flood insurance coverage, jurisdictional coordination, disaster aid experience,
local disaster training, performance regime-proximity of county seat to state capital,
performance regime-proximity of county seat to the nearest metropolitan area, population
stability, nuclear plant accident planning, and crop insurance coverage (see Table 3.1).
Each indicator captures different aspects of institutions such as programs, policies, and
governance structures that contribute to overall community resilience.
Table 3.1: Institutional resilience indicators, datasets, and temporal timeframes.
IR
Indicators Descriptions Units
BRIC
IR
2000
BRIC
IR
2010
Method Data Sources
Mitigation
spending
ten-year-avg per
capita spending
for mitigation
projects
$ 1991-
2000
2001-
2010
(avg-10-yr) /
(county pop
size)
US Census &
Hazard
Mitigation
Grant Program
Flood
insurance
coverage
% housing units
covered by
National Flood
Insurance
Program (NFIP)
% 2000 2010
(#s of NFIP
policies) / (#s
housing units)
US Census &
NFIP
Jurisdictional
coordination governments and
special districts
per 10K person
ratio 2002 2007
(#s of govts &
special districts)
/ (pop
size/10K)**
US Census &
Counties
Database

23
IR
Indicators Descriptions Units
BRIC
IR
2000
BRIC
IR
2010
Method Data Sources
Disaster
aid
experience
presidential
disaster
declarations
divided by
number of loss
causing events
ratio 1990-
1999
2000-
2009
(#s of PDD) /
(#s of
SHELDUS
events)
PDD Database
& SHELDUS*
Local
disaster
training
% population in
communities with
Citizen Corps
program
% 2000 2010 (#s of CERTs) /
(pop size)
US Census &
Citizen Corps
Council
Performance
regimes-state
capital
proximity of
county seat to seat
capital
miles 2000 2010
measures
straight line
distance from
county seat to
state capital**
Tiger/Line &
National Atlas
Performance
regimes-
nearest metro
area
proximity of
county seat to
nearest county
seat within
Metropolitan
Statistical Area
(MSA)
miles 2000 2010
measures
straight line
distance from
county seat to
nearest MSA**
Tiger/Line &
National Atlas
Population
stability population change
over previous
five-year-period
% 1995-
2000
2005-
2010
% of population
change in 5-yr
period**
US Census &
Current
Population
Estimates
Nuclear
plant accident
planning
% population
within 10 miles of
nuclear power
plant
% 2000 2010
(pop within 10
mi of nuclear
plant) / (county
pop size)
US Census &
Nuclear Power
Plant Database
Crop
insurance
coverage
crop insurance
policies per
square mi
% 2000 2010
(#s of crop
insurance) /
(land coverage)
Tiger/Line &
Farm Subsidies
*SHELDUS stands for Spatial Hazard Events and Losses Database for the United States
** The normalized values were inverted before the min-max standardization scheme can
be applied
Mitigation planning and policies have demonstrable and measurable benefits to
individuals and communities at large (Berke and Godschalk et al. 2009; McDaniels et al.
2015). In addition, a higher degree of integration of emergency management activities,
local disaster training, and nuclear accident planning can enhance disaster preparedness
in localities, allowing for a more effective deployment of resources during times of crisis
(Murphy 2007; Ansell et al. 2010; Simonovich and Sharabi 2013). Flood insurance and

24
crop insurance coverage can reduce the burden on individuals in the post-disaster period
along with incentivizing communities to implement disaster risk reduction initiatives to
minimize losses to property and livelihoods (Cheong 2011; Michel-Kerjan et al. 2012).
Another aspect of resilience is disaster aid experience, which represents institutional
knowledge in terms of accessing the bureaucratic structure to obtain aid and resources
pertaining to disaster response and recovery. Finally, population stability is important to
resilience because rapid population changes can affect the coping capability of a system.
Unexpected population growth means that critical services might not be able to keep pace
while population decline can contribute to decrease in tax base and municipal budgets,
placing more pressure on existing institutions (Sherrieb et al. 2010). Analysis of how
each of these indicators change over time contribute to better understanding of the
process of building resilience, which can be influenced by various spatial and temporal
factors.
3.3 Study Area
The utility of resilience metrics and indicators can be better understood through a
place-based application (Berkes and Ross 2013). For this research, Hancock, Harrison
and Jackson counties were selected for analysis (Figure 3.1). This thesis focuses on the
coastal counties of Mississippi because the coastal area suffered from intense winds,
storm surge and flooding from Hurricane Katrina, which displaced tens of thousands of
people from their homes (Frey and Singer 2006). In general, Hurricane Katrina is by far
the costliest tropical cyclones to hit the U.S., causing more than $108 billion in property
damage mainly in Mississippi and Louisiana (Blake et al. 2011).

25
Winds of 135 mph and a storm surge of 32 feet wiped out casinos, businesses,
parks, multimillion dollar homes and other physical structures along the affected
Mississippi coast (Steven-Picou and Hudson 2010). In East Biloxi, housing of low-
income residents was destroyed, rendering many homeless (Cutter et al. 2014a). Major
critical lifelines were lost, businesses closed, and communities were displaced. In
addition to the loss of life and property, coastal ecosystems were heavily impacted,
experiencing saltwater intrusion in wetlands, erosion of barrier islands (Evans-Cowley
and Gough 2008) and widespread damage to forest ecosystems (Kupfer et al. 2008).
Figure 3.1: Map of coastal counties in Mississippi.
At present, the Mississippi coast is home to about 13% of the state’s population
and many important industries. The 2010 U.S. Census data shows that Harrison County,
which includes the Biloxi-Gulfport metropolitan area, is the most populated (187,000) of

26
the three coastal counties followed by Jackson County (140,00) and Hancock County
(43,900). These counties are home to numerous industries including gambling,
shrimping and fishing, tourism, oil and gas extraction, shipbuilding, defense and
aerospace (NOAA 2015). In addition, the coast is host to many busy docks and ports,
including the Port of Gulfport, one of the busiest ports in the U.S. Gulf region (NOAA
2015). The Mississippi coastal counties and their strategic locations play a vital role in
the state’s economy. Their geographical location along with active utilization and
exploitation of coastal resources and ecosystems has also made this area more vulnerable
to the destructive forces of natural hazards such as flooding, frequent hurricanes, and
storm surges (Day et al. 2007).
3.4 Summary
The fundamental characteristic of resilience is the ability to persist and withstand
shock after a disturbance as well as carry out adaptive learning to be more prepared for
the next event. The coast of Mississippi is situated in a high-hazard area for hurricanes
and storm surges. As such, it represents an ideal location for examining and monitoring
resilience at a finer scale.
27
CHAPTER 4: METHODOLOGY AND RESULTS FOR QUESTION #1
4.1 Methodology
Q1: How has the institutional resilience for the Mississippi Gulf Coast,
conceptualized as BRIC indicators, changed in the setting of pre- and post-
Katrina contexts?
To answer research question #1, the institutional resilience (IR) sub-index was
replicated for the state of Mississippi at the county level for years 2000 and 2010. The
ten-year-period between 2000 and 2010 is sufficient for analysis of change resilience
metrics. The data for the index were gathered, transformed, normalized, and standardized
according to the methodology provided in Cutter et al (2014b). Instead of scaling the
institutional resilience metrics at the national scale for 3,108 U.S. counties as seen in the
work of Cutter et al. 2014b, these IR were scaled for eighty-two counties in Mississippi.
This process allowed for intra-county comparison within the State of Mississippi.
Theoretically, a county in Mississippi will have more in common with other counties in
Mississippi than with counties in Minnesota or Virginia, given that mitigation activities
devolve from the federal level to states and their local communities (FEMA 2013).
The IR composite score for each county ranges from 0 to 10, with the higher score
indicating more resilience. The individual indicator values range from 0 to 1, with unity
indicating the most resilient condition. In the case of four indicators, the absolute values
were inverted to match theoretical orientation. They consist of jurisdictional coordination,
performance regime-proximity of county seat from state capital, performance
28
regime-proximity of county seat from the nearest metropolitan area, and population
stability. For instance, the smaller the value for jurisdictional coordination, the more
integrated the governance structure. Similarly, smaller distances from each county seat to
the capital and the nearest metropolitan statistical area indicates increased resilience due
to proximity to resources. In addition, smaller changes in population within the five-year-
period contribute to resilience because the counties are less likely to experience
unexpected strains on institutional resources from new arrivals.
First, the IR scores were mapped because the visualization of resilience scores can
provide a comparative overview of where improvements are most needed. Next, paired
difference of means tests (alpha of 0.05) was applied to determine whether the BRIC
scores aggregated at the state scale have significantly changed over the ten-year-period.
Further, to illustrate that scale matters, different combination of IR scores at the national
scale and the state scale for 2000 and 2010 were used as pairs in the statistical analysis.
Second, given that the nonparametric distribution of each IR indicator, the
Wilcoxon Signed-Rank test, an alternative to the paired different of means test, was
applied to the standardized values to determine which IR indicators had significantly
changed from 2000 to 2010 at Mississippi scale. Drivers of institutional resilience at the
state scale refer to variables of the index that experience statistically significant change
(alpha of 0.05) longitudinally. In the case of the tri-county study area, drivers of
institutional resilience are determined by the significant change in rank and absolute
values from 2000 and 2010. In addition, the absolute values of each indicator were
utilized to explain and contextualize the changes in resilience aspects for both the state of
Mississippi and the study area.

29
4.2 Visualization of Temporal Change in Institutional Resilience for Mississippi
The maps in Figure 4.1 illustrate that institutional resilience for Mississippi
counties has changed spatially over ten years. The northern part of the Mississippi tends
to have lower scores than the southern part at both times. In 2000, the most resilient
counties were Quitman, Grenada, Leflore, Washington, Warren, Hinds and Harrison. In
2010, this spatial distribution shifted towards the coastal area, with Lawrence, Hancock,
Harrison and Jackson and their neighboring counties having the highest resilient scores.
By contrast, the spatial pattern for least resilient counties also changed. In 2000, the least
resilient counties were located in northeastern part of the state including Union,
Tishomingo, Itawamba and Yalobusha. By 2010, these counties were replaced by
Benton, Sharkey and Choctaw. Moreover, many other counties experienced a change in
ranking. For example, the resilience score for De Soto County shifted from relatively low
in 2000 to relatively high in 2010. A contrasting example is Washington County, whose
score of high resilience in 2000 shifted to medium resilience in 2010.
Table 4.1 and Table 4.2 show the scores of the most and least resilient counties in
2000 and 2010 from Figure 4.1. The standardized values of each indicator are also
shown. For 2000, the difference between the highest and the lowest resilience score was
2.41 while for 2010, it was 3.04. The most resilient counties in 2000 had high values in
the areas of jurisdiction coordination and population stability. In comparison, the most
resilient counties in 2010 were also highly ranked in terms integrated government
coordination as well as urbanization. The least resilient counties ranked high only in one
or two aspects and very low in others. Furthermore, indicators such as disaster training
and nuclear planning in general contributed little value to institutional resilience.

30
Figure 4.1: BRIC institutional resilience scores for eighty-two counties in Mississippi in 2000 and 2010 (aggregated at the state scale).
30

31
Table 4.1: Breakdowns of BRIC institutional resilience scores and metrics (standardized values) for Mississippi counties with the highest
and lowest rankings in 2000, aggregated at state scale (n=82).
Rank County
IR
Score
2000
Mitigation
Spending
Flood
Insurance
Coverage
Jurisdiction
Coordination
Disaster
Aid
Exp
Disaster
Training
Near
State
Capital
Near
MSA
Pop
Stability
Nuclear
Planning
Crop
Insurance
Coverage
Most resilient
1 Leflore 4.66 0.73 0.47 0.77 0.19 0.00 0.62 0.21 1.00 0.00 0.68
2 Washington 4.61 0.67 0.45 0.85 0.37 0.00 0.59 0.29 0.83 0.00 0.55
3 Claiborne 4.53 0.00 0.07 0.84 0.20 0.00 0.80 0.57 1.00 1.00 0.05
4 Harrison 4.47 0.54 0.57 0.97 0.25 0.00 0.30 1.00 0.84 0.00 0.00
5 Quitman 4.44 0.65 0.12 0.06 0.68 0.00 0.36 0.62 0.95 0.00 1.00
Least resilient
78 Benton 2.47 0.00 0.00 0.27 0.18 0.00 0.11 0.81 0.99 0.00 0.12
79 Tishomingo 2.46 0.00 0.01 0.73 0.13 0.00 0.00 0.66 0.85 0.00 0.07
80 Itawamba 2.45 0.05 0.01 0.78 0.13 0.00 0.19 0.37 0.80 0.00 0.11
81 Union 2.43 0.00 0.00 0.71 0.07 0.00 0.21 0.62 0.65 0.00 0.18
82 Yalobusha 2.25 0.00 0.02 0.38 0.02 0.00 0.38 0.53 0.80 0.00 0.11
31

32
Table 4.2: Breakdowns of BRIC institutional resilience scores and metrics (standardized values) for Mississippi counties with the
highest and lowest rankings in 2010, aggregated at state scale (n=82).
Rank County
IR
Score
2010
Mitigation
Spending
Flood
Insurance
Coverage
Jurisdiction
Coordination
Disaster
Aid
Exp
Disaster
Training
Near
State
Capital
Near
MSA
Pop
Stability
Nuclear
Planning
Crop
Insurance
Coverage
Most resilient
1 Hancock 5.30 1.00 1.00 0.84 0.37 0.00 0.31 1.00 0.78 0.00 0.00
2 Jackson 4.55 0.32 0.70 0.98 0.41 0.00 0.22 1.00 0.90 0.00 0.01
3 Harrison 4.38 0.35 0.54 0.99 0.33 0.00 0.30 1.00 0.87 0.00 0.00
4 George 4.37 0.18 0.04 0.95 1.00 0.00 0.38 1.00 0.77 0.00 0.05
5 Lawrence 4.16 0.02 0.02 0.85 0.17 0.79 0.79 0.66 0.84 0.00 0.02
Least resilient
78 Montgomery 2.41 0.00 0.01 0.69 0.03 0.00 0.62 0.21 0.71 0.00 0.13
79 Oktibbeha 2.39 0.03 0.04 0.94 0.28 0.00 0.49 0.16 0.41 0.00 0.03
80 Benton 2.35 0.01 0.00 0.50 0.20 0.00 0.11 0.81 0.58 0.00 0.14
81 Choctaw 2.31 0.02 0.00 0.71 0.23 0.00 0.60 0.14 0.59 0.00 0.02
82 Sharkey 2.26 0.00 0.16 0.00 0.12 0.00 0.76 0.36 0.33 0.00 0.52
32

33
The result from a paired difference of means test suggests that there is no
statistically difference between the BRIC IR scores in 2000 and 2010 at the Mississippi
scale (Table 4.3). Although the changes are not statistically significant, one must keep in
mind that institutional resilience for each county is a composite score, which is calculated
by summing the standardized values of all ten indicators. These values of any particular
indicator have increased or decreased over the ten-year-period.
Table 4.3: Paired difference of means test result comparing BRIC IR scores (aggregated at
state scale) in 2000 and 2010
Pair t-statistic p-value
(p < 0.05)
State BRIC IR Scores 2000
State BRIC IR Scores 2010 -1.114 .269
4.2.1 Scaling Matters: Aggregation at the National Scale versus State Scale
The replicated BRIC IR scores for Mississippi in this study were scaled within the
eighty-two counties. Paired difference of means tests (Table 4.4) suggest the scores
scaled at the national scale for Mississippi are statistically different than the scores scale
statewide in both 2000 and 2010. For example, in 2010, Hancock County had an IR score
of 5.30 at the state scale as compared to a score of 4.48 at the national scale (see Table
4.5 and Table 4.6). At the Mississippi scale, Hancock County is being compared against
eighty-one other counties in Mississippi, while at the national scale, it is compared
against 3,107 other counties in the U.S. While the paired difference of means test in
Table 3.2 indicates that there is no statistical significant difference between the IR scores
for Mississippi from 2000 to 2010, the IR scores at the national scale are statistically
different from 2000 to 2010 (Table 4.4). These statistical results illustrate that spatial
scale has a considerable influence on the institutional resilience scores. It is important to
consider the scaling factor and comparison units when the index is being replicated. More
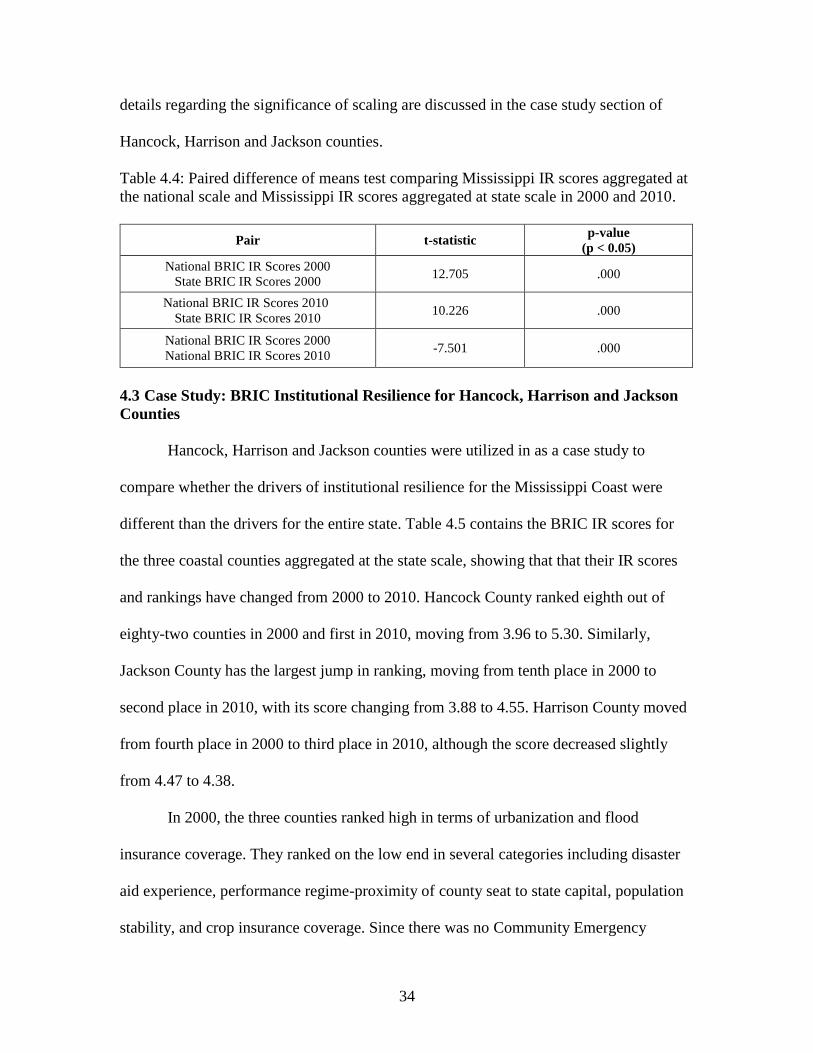
34
details regarding the significance of scaling are discussed in the case study section of
Hancock, Harrison and Jackson counties.
Table 4.4: Paired difference of means test comparing Mississippi IR scores aggregated at
the national scale and Mississippi IR scores aggregated at state scale in 2000 and 2010.
Pair t-statistic p-value
(p < 0.05)
National BRIC IR Scores 2000
State BRIC IR Scores 2000 12.705 .000
National BRIC IR Scores 2010
State BRIC IR Scores 2010 10.226 .000
National BRIC IR Scores 2000
National BRIC IR Scores 2010 -7.501 .000
4.3 Case Study: BRIC Institutional Resilience for Hancock, Harrison and Jackson
Counties
Hancock, Harrison and Jackson counties were utilized in as a case study to
compare whether the drivers of institutional resilience for the Mississippi Coast were
different than the drivers for the entire state. Table 4.5 contains the BRIC IR scores for
the three coastal counties aggregated at the state scale, showing that that their IR scores
and rankings have changed from 2000 to 2010. Hancock County ranked eighth out of
eighty-two counties in 2000 and first in 2010, moving from 3.96 to 5.30. Similarly,
Jackson County has the largest jump in ranking, moving from tenth place in 2000 to
second place in 2010, with its score changing from 3.88 to 4.55. Harrison County moved
from fourth place in 2000 to third place in 2010, although the score decreased slightly
from 4.47 to 4.38.
In 2000, the three counties ranked high in terms of urbanization and flood
insurance coverage. They ranked on the low end in several categories including disaster
aid experience, performance regime-proximity of county seat to state capital, population
stability, and crop insurance coverage. Since there was no Community Emergency

35
Response Team (CERT) or nuclear plant in Hancock, Harrison and Jackson, the nuclear
plant accident planning and local disaster training indicators are not applicable to these
counties. In 2010, Hancock, Harrison and Jackson ranked in the top three counties in
terms of mitigation spending and flood insurance coverage and on the bottom for crop
insurance coverage. Jackson and Hancock County, who respectively ranked eighteenth
and twenty-first in mitigation spending per capita in 2000, moved to first and second
place in 2010. In addition, the ranks of these three counties in the disaster aid experience
and population stability have relatively improved. The two performance regime
indicators are constant in values for 2000 and 2010, and as such, there was no change in
rank.
At the national scale (see Table 4.6), Hancock, Harrison and Jackson counties
have moved up in ranks from 2000 to 2010, and their BRIC IR scores have also increased
over time. In 2000, Hancock County ranked 1109th out of 3,108 counties. In 2010, it
ranked 124th of out of 3,108 counties. Similarly, Harrison County moved from 994th place
in 2000 to 610th place in 2010, and Jackson County moved from 1385th place in in 2000
to 397th place in 2010. In terms of percentiles, at the national scale, Hancock and
Harrison counties ranked in the 70th percentile with Jackson County in the 50th percentile
in 2000. By 2010, Hancock County was in the 90th percentile while Harrison and Jackson
were in the 80th percentile. By comparison, at the state scale Hancock, Harrison and
Jackson counties ranked in the 90th percentile in both 2000 and 2010.

36
Table 4.5: Breakdowns of BRIC institutional resilience scores and metrics (standardized values) for Hancock, Harrison and Jackson
counties in 2000 and 2010, with state ranking in parentheses (out of 82 counties).
Rank County
IR
State
Score
Mitigation
Spending
Flood
Insurance
Coverage
Jurisdiction
Coordination
Disaster
Aid
Exp
Disaster
Training
Near
State
Capital
Near
MSA
Pop
Stability
Nuclear
Planning
Crop
Insurance
Coverage
BRIC IR 2000
8 Hancock 3.96 0.01 (21) 1.00 (1) 0.76 (44) 0.38 (26) 0.00 (n/a) 0.31 (66) 1.00 (1) 0.50 (78) 0.00 (n/a) 0.00 (76)
4 Harrison 4.47 0.54 (5) 0.57 (3) 0.97 (2) 0.25 (49) 0.00 (n/a) 0.30 (67) 1.00 (1) 0.84 (44) 0.00 (n/a) 0.00 (79)
10 Jackson 3.88 0.02 (18) 0.53 (4) 0.96 (4) 0.27 (43) 0.00 (n/a) 0.22 (72) 1.00 (1) 0.86 (40) 0.00 (n/a) 0.01 (58)
BRIC IR 2010
1 Hancock 5.30 1.00 (1) 1.00 (1) 0.84 (46) 0.37 (11) 0.00 (n/a) 0.31 (66) 1.00 (1) 0.78 (50) 0.00 (n/a) 0.00 (78)
3 Harrison 4.38 0.35 (3) 0.54 (3) 0.99 (3) 0.33 (14) 0.00 (n/a) 0.30 (67) 1.00 (1) 0.87 (34) 0.00 (n/a) 0.00 (77)
2 Jackson 4.55 0.32 (2) 0.70 (2) 0.98 (5) 0.41 (9) 0.00 (n/a) 0.22 (72) 1.00 (1) 0.90 (29) 0.00 (n/a) 0.01 (56)
36

37
Table 4.6: Breakdowns of BRIC institutional Resilience scores and metrics (standardized values) for Hancock, Harrison and Jackson
counties in 2000 and 2010, with national ranking in parentheses (out of 3,108 counties).
Rank County
IR
National
Score
Mitigation
Spending
Flood
Insurance
Coverage
Jurisdiction
Coordination
Disaster
Aid
Exp
Disaster
Training
Near
State
Capital
Near
MSA
Population
Stability
Nuclear
Planning
Crop
Insurance
Coverage
BRIC IR 2000
1109 Hancock 4.03 0.00
(1027)
0.29
(58)
0.99
(1138)
0.22
(972)
0.00
(n/a)
0.71
(2219)
1.00
(1)
0.81
(2838)
0.00
(n/a)
0.00
(2706)
994 Harrison 4.06 0.08
(162)
0.17
(89)
1.00
(326)
0.16
(1423)
0.00
(n/a)
0.71
(2236)
1.00
(1)
0.94
(1608)
0.00
(n/a)
0.00
(2729)
1385 Jackson 3.96 0.00
(951)
0.15
(91)
1.00
(342)
0.17
(1354)
0.00
(n/a)
0.68
(2406)
1.00
(1)
0.95
(1421)
0.00
(n/a)
0.00
(2377)
BRIC IR 2010
124 Hancock 4.48 0.23
(27)
0.54
(18)
0.99
(1243)
0.10
(1221)
0.00
(n/a)
0.71
(2219)
1.00
(1)
0.91
(2188)
0.00
(n/a)
0.00
(2764)
610 Harrison 4.11 0.08
(84)
0.29
(59)
1.00
(268)
0.09
(1330)
0.00
(n/a)
0.71
(2236)
1.00
(1)
0.95
(1540)
0.00
(n/a)
0.00
(2280)
397 Jackson 4.20 0.07
(97)
0.38
(38)
1.00
(316)
0.11
(1117)
0.00
(n/a)
0.68
(2406)
1.00
(1)
0.96
(1292)
0.00
(n/a)
0.01
(2718)
37

38
For comparison, Table 4.5 and Table 4.6 break down the state and national
ranking by individual indicators in year 2000 and 2010. These rankings clarify where
each county ranked statewide and nationally in terms of mitigation spending, flood
insurance coverage, government coordination, disaster aid experience, local disaster
training, performance regimes, population stability, crop insurance coverage and nuclear
accident planning. For example, in 2000, Hancock ranked first in the state in the flood
insurance coverage category with an indicator score of 1.00. At the national scale,
although the absolute value for flood insurance policy per housing unit remained the
same, Hancock County ranked 58th out of 3,108 counties with an indicator score of 0.29.
Such discrepancies between the national and state scale demonstrate that ranking can be
interpreted differently depending on the scaling. As noted earlier, the spatial scale is a
crucial factor to consider in replication of an index as well in interpretation of its metrics
and indicators.
4.4 Examination of Institutional Resilience Indicators and Metrics for Mississippi
and Hancock, Harrison and Jackson Counties
The Wilcoxon Signed-Rank tests were performed on the all the institutional
indicators to determine whether the changes in rank from 2000 to 2010 are statistically
significant for the state of Mississippi. Due to the low number of cases in the tri-county
study area, this test cannot be used to determine statistical significance in Hancock,
Harrison and Jackson counties. The results are listed in Table 4.7, which reveal that rank
changes are statistically significant for several indicators such as mitigation spending,
flood insurance coverage, jurisdictional coordination, disaster aid experience, and crop
insurance coverage. Meanwhile, changes in local disaster training, population stability
and nuclear accident planning are not significant. In the case of the performance regimes,

39
their values remain constant in the BRIC 2000 and 2010 and as such, no change could be
measured. Moreover, there was no data for Mississippi in 2000 in the local disaster
training category. As a result, the Wilcoxon Signed-Rank test was not applied for this
indicator.
Table 4.7: Wilcoxon Signed-Rank Test results comparing change in values of each
indicator from 2000 to 2010 for the State of Mississippi (n=82).
Indicators Wilcoxon
(p < 0.05)
Mitigation spending 0.000
Flood insurance coverage 0.000
Jurisdictional coordination 0.000
Disaster aid experience 0.000
Performance regimes-state capital 1.000
Performance regimes-nearest metro area 1.000
Population stability 0.076
Nuclear plant accident planning 0.655
Crop insurance coverage 0.048
4.4.1 Mitigation Spending: State of Mississippi
The Wilcoxon Signed-Rank test indicates that the mitigation spending in 2000 is
statistically different from 2010 (see Table 4.7). In general, the majority of counties in
Mississippi experienced significant increases in mitigation funding from 2000 to 2010.
Many counties had zero in mitigation spending in 2000, with only thirty-seven counties
having received mitigation funding between 1991 and 2000. By 2010, majority of
counties had received post-disaster mitigation funding from the Hazard Mitigation Grant
Program (HMGP). A close examination of the absolute values of counties with highest
mitigation spending in 2000 and 2010 indicate some discrepancies between temporal
contexts in terms of longitudinal assessment. For instance, Grenada County ranked first
in hazard mitigation spending with $16.20 per capita in 2000 and Hancock County in
2010 with $85.10 per capita (Table 4.8 and Table 4.9). This difference in highest

40
mitigation spending per capita from 2000 to 2010 reveals two important points: 1)
Mitigation spending in Mississippi has increased systematically from 2000 to 2010 and 2)
In order to understand the significance of the rank changes, researchers and practitioners
like must examine both the absolute and standardized (ranked) data.
Table 4.8: Mississippi counties with the highest mitigation spending per capita in 2000.
Rank County
Mitigation
per capita
($)
2000
Population
Grants Received
($)
#s of
Grants
1 Grenada 16.21 23,263 2,978,290 1
2 Leflore 11.75 37,947 3,521,184 5
3 Washington 10.78 62,977 5,364,533 5
4 Quitman 10.51 10,117 839,624 3
5 Harrison 8.73 189,601 13,075,743 16
Table 4.9: Mississippi counties with the highest and lowest mitigation spending per capita
in 2010.
Rank County
Mitigation
per capita
($)
2010
Population
Grants Received
($)
#s of
Grants
1 Hancock 85.10 43,929 37,381,916 26
2 Stone 68.28 17,786 12,145,112 9
3 Wayne 40.69 20,747 8,442,938 6
4 Harrison 30.18 187,105 56,472,159 41
5 Jackson 27.44 139,668 38,333,603 32
…
78 Calhoun 0.27 14,962 39,815 2
79 Issaquena 0 1,406 0 0
80 Itawamba 0 23,401 0 0
81 Marshall 0 37,144 0 0
82 Sharkey 0 4,916 0 0
Given that the standardized data represents mitigation funding per capita, it does
not capture the disparity between more populous counties and less populous counties. For
example, in 2000, although Grenada County had the highest mitigation spending per
capita, Harrison County received the most mitigation grants, taking in about $13 million
for sixteen projects; Grenada only received $3 million for one project. The reason that

41
Harrison County ranks lower in terms of mitigation spending is because it has a much
larger population (189,601) as compared to Grenada (23,263) and the values were
standardized by population. Such discrepancies can also be observed in the 2010 data in
which Wayne County ranked higher than Harrison County in terms of mitigation
spending per capita; however, Harrison County had nine times the population of Wayne
County and seven times the amount of grants received.
The shift in mitigation spending concentration can be attributed to Hurricane
Katrina and the affected geographical area. In 2000, the state of Mississippi and its
counties had ninety-eight projects funded by the HMGP. Funding from HMGP can only
be acquired in the post-disaster context in which a disaster has been declared by the
federal government. Between 1991 and 2000, Mississippi had several federally declared
disasters including severe storms, ice storms, flooding, tornadoes, and hurricanes. Out of
ninety-eight grants, twenty-six were linked to a severe winter event in 1994, and thirty-
three to Hurricane George, which impacted many counties in 1998. In comparison,
between 2001 and 2010, the state and its counties received 463 HMGP grants, about 74%
(341 grants) of which were related to Hurricane Katrina in 2005.
4.4.1.1 Mitigation Spending: Hancock, Harrison and Jackson Counties
Mitigation spending dramatically increased for all three coastal counties from
2000 to 2010. This reflects the overall trend at the state scale. For example, Hancock
County had only $0.31 mitigation spending per capita in BRIC IR 2000 (Table 4.10). In
2010, this value increased to $85.10 per capita. Similarly, Harrison and Jackson also
experienced increase in mitigation funding, which influences the change in ranking.
Hancock County came in first place in 2010, as compared its twenty-first place in 2000.

42
Harrison County shifted from fifth place to second place, even though contribution of
mitigation spending to the overall IR score has dropped from 0.54 to 0.34. Certainly, the
ranking shift in mitigation spending has an important role in the change in institutional
resilience for the Mississippi Gulf Coast as well as having significant contribution to the
overall BRIC IR scores in 2010. For example, change in ranking for Hancock County
increases the standardized value from 0.01 in BRIC IR 2000 to 1.00 in BRIC 2010,
adding 0.99 to the overall resilience score. In 2000, mitigation spending contributed to
less than 0.1% of the IR score. In 2010, it made up for about 20% of the overall IR score.
Table 4.10: Mitigation spending for Hancock, Harrison and Jackson counties in 2000 and
2010.
Rank County BRIC IR values
(standardized)
Mitigation per
Capita
($)
Population
Size
Grant
Received
($)
#s of
Grants
BRIC IR 2000
21 Hancock 0.01 0.19 42,967 65,050 3
5 Harrison 0.54 8.73 131,420 13,075,743 16
18 Jackson 0.02 0.31 189,601 322,336 5
BRIC IR 2010
1 Hancock 1.00 85.10 43,929 37,381,916 26
2 Harrison 0.35 30.18 187,105 56,472,159 41
3 Jackson 0.32 32.45 139,668 38,333,603 32
These increases in migration funding can be linked to Hurricane Katrina. Twenty-
three out of twenty-six grants for Hancock County in BRIC IR 2010 are directly related
to Katrina, thirty-four out forty-one for Harrison County, and twenty-two out of thirty-
two for Jackson County. In the pre-Katrina period, the three coastal counties received
around $14 million in mitigation funding. In contrast, they received about $120 million in
HMGP funding in the post-Katrina period.

43
4.4.2 Flood Insurance Coverage: State of Mississippi
The Wilcoxon Signed-Rank Test was utilized to compare flood insurance
coverage in 2000 and 2010 (see Table 4.7). This test indicates that the there is a
statistically significant difference between the 2000 and 2010. A closer look at the
absolute values suggests that flood coverage has generally expanded for the entire state of
Mississippi, but the percentage of coverage remains relatively low. Less than ten counties
have flood coverage that exceeded ten percent. Table 4.11 and Table 4.12 contain details
regarding the number of flood insurance policy and housing units of top five counties
with the highest and lowest coverage. Hancock, Harrison and Jackson counties are the
top ranking counties in both the 2000 and 2010. These counties have to frequently deal
with hazards relating to storm surge, flooding, and tropical cyclones. Benton, Franklin
and Tippah County remain on the bottom in 2000 and 2010 with little to no expansion of
flood coverage.
Table 4.11: Mississippi counties with highest and lowest flood insurance coverage in
2000.
Rank County
% of Housing Units
with Flood
Insurance
#s of NFIP
Policies in 2000 #s of Housing Units
1 Hancock 22.42 4,724 21,072
2 Issaquena 17.79 156 877
3 Harrison 12.79 10,184 79,636
4 Jackson 11.83 6,114 51,678
5 Leflore 10.46 1,475 14,097
…
78 Tippah 0.05 5 8,868
79 Jefferson 0.03 4 5891
80 Franklin 0.24 1 4,119
81 Benton 0 0 3,456
82 Kemper 0 0 4,533

44
Table 4.12: Mississippi counties with highest and lowest flood insurance coverage in
2010.
Rank County
% of Housing Units
with Flood
Insurance
#s of NFIP
Policies in 2010 #s of Housing Units
1 Hancock 48.34 9,550 19,756
2 Jackson 34.05 19,748 57,995
3 Harrison 26.01 20,880 80,275
4 Issaquena 21.35 152 712
5 Washington 11.87 2,645 22,276
…
78 Tippah 0.12 12 9,609
79 Pontotoc 0.11 13 12,215
80 Benton 0.10 4 4,073
81 Jefferson Davis 0.08 5 5,909
82 Franklin 0.02 1 4,170
From 2000 to 2010, the number of NFIP policies increased with little change in
the number of housing units for the majority of counties in Mississippi. This dramatic
expansion of flood insurance coverage for the coastal area can be linked to Hurricane
Katrina. The damages caused by the storm surges from Katrina revealed the risk and
vulnerability of populated settlements along the coast resulting in increased participation
in the NFIP Program (Michel-Kerjan 2010).
4.4.2.1 Flood Insurance Coverage: Hancock, Harrison and Jackson Counties
Flood insurance policies double in the case of Hancock and Harrison counties
while tripling for Jackson County from 2000 to 2010 (Table 4.13). This trend parallels
the overall state trend in increased flood insurance expansion in the post-disaster period.
Hancock, Harrison and Jackson counties are the top three counties with the highest flood
insurance coverage in both BRIC IR 2000 and 2010. As mentioned earlier, the expansion
in flood insurance coverage from 2000 to 2010 can be attributed to Hurricane Katrina,
given the severity of the post-disaster impacts. Since the rankings for these three counties

45
remain relatively the same from 2000 to 2010, they do not significantly influence the
change in the IR scores because the tri-coastal counties remain in the top three. The
change in rank (or lack thereof) due to min-max scaling, however, obscures the fact that
the number of flood insurance policies has increased dramatically in the study area.
Furthermore, the flood insurance coverage indicator is one of the main contributors to the
BRIC IR scores for the Mississippi coast. In BRIC IR 2000 and 2010, it makes up almost
20% of the overall resilience score in Hancock County and 13% for Harrison County.
Table 4.13: Flood insurance coverage for Hancock, Harrison and Jackson counties in
2000 and 2010.
Rank County BRIC IR
values
(standardized)
% of Housing
Units with Flood
Insurance
#s of NFIP
Policy
#s of
Housing
Units
BRIC IR 2000
1 Hancock 1.00 22.41838 4,724 21,072
3 Harrison 0.57 12.78819 10,184 79,636
4 Jackson 0.53 11.83095 6,114 51,678
BRIC IR 2010
1 Hancock 1.00 48.33974 9,550 19,756
3 Harrison 0.54 26.01059 20,880 80275
2 Jackson 0.70 34.05121 19,748 57,995
4.4.3 Jurisdictional Coordination: State of Mississippi
The results from the Wilcoxon Signed-Rank Test indicate that there is a
statistically significant difference from 2000 to 2010 regarding to jurisdictional
coordination (see Table 4.7). The number of government and special districts (e.g. local
administrative bodies) in Mississippi counties saw an overall decline from 2000 to 2010
(Table 4.14 and Table 4.15). The data classification system from the U.S. Census might
have changed over the years; some government and special districts that were counted in
2000 are not included in 2007. Another reason is that some of the governments and
special districts are eliminated or consolidated over the years due to budget constraints or
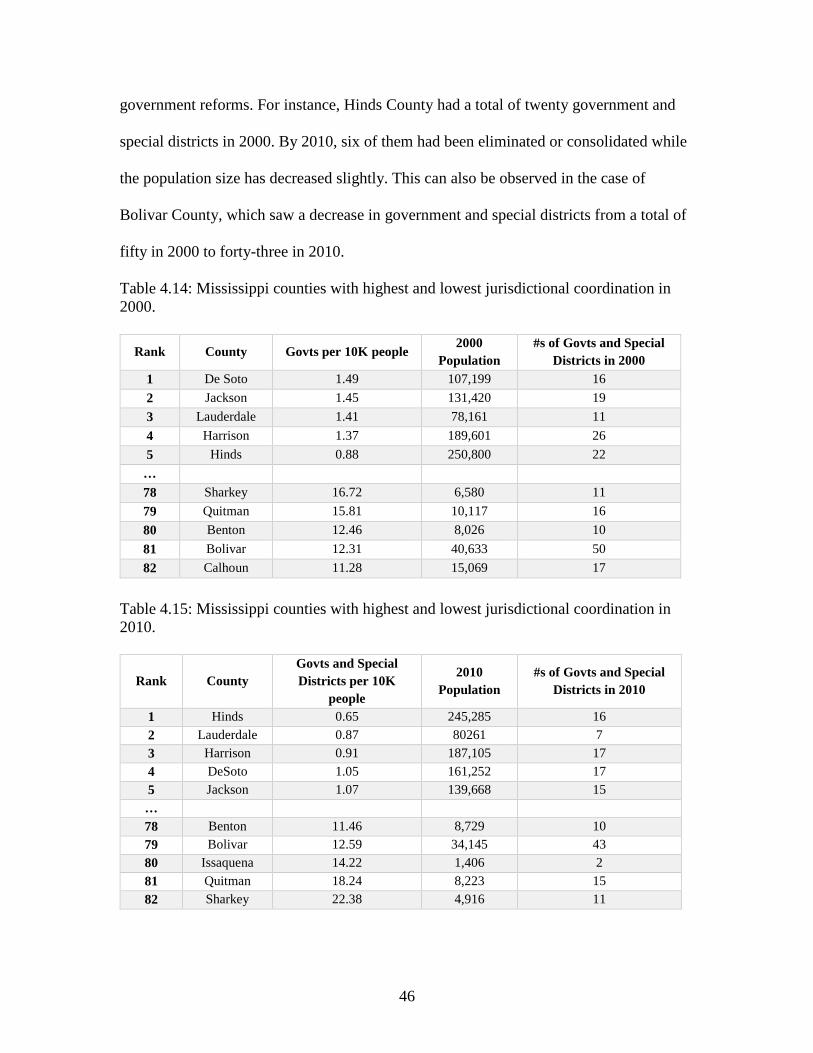
46
government reforms. For instance, Hinds County had a total of twenty government and
special districts in 2000. By 2010, six of them had been eliminated or consolidated while
the population size has decreased slightly. This can also be observed in the case of
Bolivar County, which saw a decrease in government and special districts from a total of
fifty in 2000 to forty-three in 2010.
Table 4.14: Mississippi counties with highest and lowest jurisdictional coordination in
2000.
Rank County Govts per 10K people 2000
Population
#s of Govts and Special
Districts in 2000
1 De Soto 1.49 107,199 16
2 Jackson 1.45 131,420 19
3 Lauderdale 1.41 78,161 11
4 Harrison 1.37 189,601 26
5 Hinds 0.88 250,800 22
…
78 Sharkey 16.72 6,580 11
79 Quitman 15.81 10,117 16
80 Benton 12.46 8,026 10
81 Bolivar 12.31 40,633 50
82 Calhoun 11.28 15,069 17
Table 4.15: Mississippi counties with highest and lowest jurisdictional coordination in
2010.
Rank County
Govts and Special
Districts per 10K
people
2010
Population
#s of Govts and Special
Districts in 2010
1 Hinds 0.65 245,285 16
2 Lauderdale 0.87 80261 7
3 Harrison 0.91 187,105 17
4 DeSoto 1.05 161,252 17
5 Jackson 1.07 139,668 15
…
78 Benton 11.46 8,729 10
79 Bolivar 12.59 34,145 43
80 Issaquena 14.22 1,406 2
81 Quitman 18.24 8,223 15
82 Sharkey 22.38 4,916 11

47
The top five counties with the highest jurisdictional coordination in 2000 and
2010 were Hinds, Lauderdale, Harrison, De Soto and Jackson County. Their low values
in the Govt. Coordination column in Table 4.14 and 4.15 indicate they have less political
fragmentation as compared to their counterparts. For example, in 2000, De Soto County
had sixteen government and special districts that are responsible for a population of
107,199 people. In contrast, Bolivar County had fifty government and special districts for
a population of 40,633. As mentioned earlier in the background describing BRIC
indicators, the fewer government and special districts that are present in a county, the
higher the jurisdictional coordination. In addition, the counties that have the highest
jurisdictional coordination values are also highly populous while the counties with the
lowest are less populated.
4.4.3.1 Jurisdictional Coordination: Hancock, Harrison and Jackson Counties
Hancock, Harrison and Jackson counties experienced a reduction in the number of
government and special districts from 2000 to 2010, although their population sizes have
changed only slightly (Table 4.16). As such, this decrease indicates that there is more
coordination between different agencies and less political fragmentation, contributing to
overall institutional resilience. As discussed earlier, the state of Mississippi overall
experiences a decline in this category. The influence of this statewide trend can be seen in
the jurisdictional coordination ranking of the counties which has remained relatively the
constant from 2000 to 2010. It is not a significant driver of the change in institutional
resilience. A high degree of jurisdictional coordination, however, is an important
contributor to overall IR scores for these three coastal counties.

48
Table 4.16: Jurisdictional coordination for Hancock, Harrison and Jackson counties in
2000 and 2010.
Rank County
BRIC IR values
(standardized)
Govts and Special
Districts per 10K
people
Population
Size
#s Govts
and Special
Districts
BRIC IR 2000
44 Hancock 0.76 4.65 42,967 20
2 Harrison 0.97 1.37 189,601 26
4 Jackson 0.96 1.45 131,420 19
BRIC IR 2010
46 Hancock 0.84 4.10 43,929 18
3 Harrison 0.99 0.91 187,105 17
5 Jackson 0.98 1.07 139,668 15
4.4.4 Disaster Aid Experience: State of Mississippi
The Wilcoxon Signed-Rank Test indicates that there is a statistically significant
difference from 2000 to 2010 regarding disaster aid experience (see Table 4.7). Table
4.17 and Table 4.18 illustrate that the number of PDDs has not increased over time but
the loss-causing events have significantly increased. As such, there is a clear trend of
decline from 2000 to 2010 in terms of the ratio of PDD per loss event. Given that the
ratio speaks to the ability of counties to acquire federal funding post-disaster, counties
with lower ratios are less resilient than counties with higher ratios as they either receive
less federal assistance and/or experience more loss-events from hazards. One important
caveat to keep in mind is that PDDs and loss-causing events are numeric counts. A billion
dollar PDD for a particular county, like Hurricane Katrina, is counted exactly the same as
a one hundred million dollar PDD in another county. This formula of not distinguishing
the dollar amount also applies to the loss-causing events.

49
Table 4.17: Mississippi counties with highest and lowest disaster aid experience in 2000.
Rank County PDD per Loss Event in 2000 #s of PDDs #s of loss events
1 Tate 0.50 10 20
2 Franklin 0.47 8 17
3 Wilkinson 0.47 7 15
4 Quitman 0.36 5 14
5 Tunica 0.33 5 15
…
78 Sharkey 0.08 2 25
79 Neshoba 0.06 3 48
80 Lee 0.06 5 86
81 Yalobusha 0.06 2 35
82 Forrest 0.05 3 62
Table 4.18 Mississippi counties with highest and lowest disaster aid experience in 2010.
Rank County PDD per Loss Event in 2010 #s of PDD #s of loss event
1 George 0.24 6 25
2 Wilkinson 0.23 6 26
3 Amite 0.21 7 33
4 Green 0.14 5 36
5 Wayne 0.14 5 36
…
78 Jones 0.02 4 173
79 Rankin 0.02 5 218
80 Leflore 0.02 2 99
81 Montgomery 0.02 1 54
82 De Soto 0.01 2 162
4.4.4.1 Disaster Aid Experience: Hancock, Harrison and Jackson Counties
The disaster aid experience ranking for Hancock, Harrison and Jackson counties
has moved up from 2000 to 2010, even though these counties have had more hazard
related loss-events in 2010 (Table 4.19). This ranking reflects a statewide trend of
increasing loss events while the number of PDDs remains relatively constant from 2000
and 2010. The BRIC IR standardized values indicate that disaster aid experience is a
driver of change in institutional resilience as well as a modest contributor to the overall
BRIC IR scores.

50
Table 4.19: Disaster aid experience for Hancock, Harrison and Jackson counties in 2000
and 2010.
Rank County BRIC IR values
(standardized)
PDD per
Loss Event #s of PDDs
#s of loss
events
BRIC IR 2000
26 Hancock 0.38 0.22 7 32
49 Harrison 0.25 0.16 7 43
43 Jackson 0.27 0.17 7 41
BRIC IR 2010
11 Hancock 0.37 0.10 6 62
14 Harrison 0.33 0.09 6 69
9 Jackson 0.41 0.11 7 66
4.4.5 Local Disaster Training: State of Mississippi and Hancock, Harrison and
Jackson Counties
The indicator for Local Disaster Training is characterized by the percent of
population covered by Community Emergency Response Team (CERT) Program, which
is part of the Citizen Corps Program created by the Department of Homeland Security to
help coordinate volunteer activities in emergency situations. The CERT Program
educates people about disaster preparedness for hazards that may impact the local area
and trains them basic disaster response skills. These emergency response skills include
fire safety, light search and rescue, team organization, and disaster medical operations
(FEMA 2015c). Since it was created in the post-9/11 era, there are no data for Mississippi
in 2000. In 2010, only four counties out of eighty-two Mississippi counties had CERT
teams (Table 4.20). These are De Soto, Leflore, Lawrence and Panola counties. In the
case of the tri-county study area, Hancock, Harrison and Jackson counties did not have
any CERT in 2010.

51
Table 4.20: Mississippi counties with CERTs in 2010.
County % of CERTs
per capita
#s of CERTs
in 2010
Population
Size
De Soto 0.19 300 161,252
Leflore 0.16 52 32,317
Lawrence 0.15 19 12,929
Panola 0.00 2 34,707
4.4.6 Performance Regimes: State of Mississippi
This first performance regime indicator is calculated by measuring the distance, in
miles, from the county seat to the state capital. The data was acquired from the National
Atlas. The same data is applied to both 2000 and 2010 under the assumption that the
county seats have not changed. Cutter et al. (2014b) utilize ArcGIS to measure the
straight-line distance from the county seats to the capital. The closer the county seat is to
the capital, the more resilient the county itself. The capital of Mississippi is Jackson,
which is located in Hinds County. The county seat of Rankin County is closer to Jackson
than that of Hinds County. Given the distance measurements in Table 4.21, Union, Lee,
Benton, Itawamba and Marshall are located the farthest from Jackson.
Table 4.21: Performance regime (proximity of county seat from the state capital) for
Mississippi counties.
Rank County Distance from County Seat to Capital (miles)
1 Rankin 11.22
2 Hinds 13.53
3 Madison 23.14
4 Simpson 29.12
5 Copiah 32.42
…
78 Union 164.52
79 Lee 157.65
80 Benton 157.12
80 Itawamba 156.74
82 Marshall 152.98

52
This second performance regime indicator is represented by the distance from the
county seat to the nearest metropolitan statistical area (MSA). Similar to the first
performance regime, the closer the county seat is to the nearest MSA, the more resilient
the county itself. The same data is applied to 2000 and 2010, under the assumption that
the distance between the county seat and MSA remains the same over ten years. Rankin,
Hinds, Madison, Simpson and Copiah along with twelve other counties have their county
seats located within MSAs, and as such, the distance represented Table 4.22 is zero. By
contrast, Oktibbeha, Sunflower, Choctaw, Monroe, and Webster are counties located in
the northern central region. They are predominantly rural, and their county seats are
located further away from urban centers.
Table 4.22: Performance regime (proximity of county seat from the nearest Metropolitan
Statistical Area) for Mississippi counties.
Rank County Distance from County Seat from MSA (miles)
1 Rankin 0.00
2 Hinds 0.00
3 Madison 0.00
4 Simpson 0.00
5 Copiah 0.00
…
78 Oktibbeha 66.28
79 Sunflower 67.09
80 Choctaw 67.71
80 Monroe 68.18
82 Webster 79.12
4.4.6.1 Performance Regimes: Hancock, Harrison and Jackson Counties
The performance regime indicators remain for the tri-county region constant in
BRIC IR 2000 and 2010 (Table 4.23 and Table 4.24). As such, there is no change in
ranking in these categories for Hancock, Harrison and Jackson counties. The standardized
values of the second performance regime, proximity of county seat to the nearest
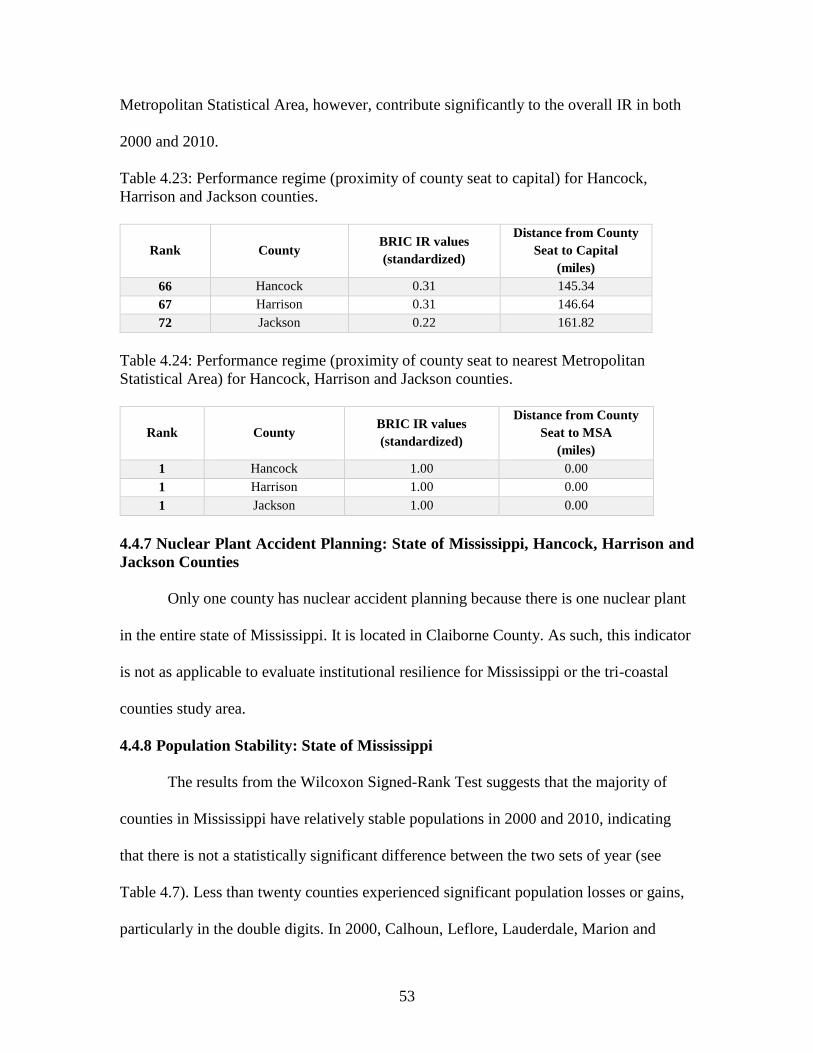
53
Metropolitan Statistical Area, however, contribute significantly to the overall IR in both
2000 and 2010.
Table 4.23: Performance regime (proximity of county seat to capital) for Hancock,
Harrison and Jackson counties.
Rank County BRIC IR values
(standardized)
Distance from County
Seat to Capital
(miles)
66 Hancock 0.31 145.34
67 Harrison 0.31 146.64
72 Jackson 0.22 161.82
Table 4.24: Performance regime (proximity of county seat to nearest Metropolitan
Statistical Area) for Hancock, Harrison and Jackson counties.
Rank County BRIC IR values
(standardized)
Distance from County
Seat to MSA
(miles)
1 Hancock 1.00 0.00
1 Harrison 1.00 0.00
1 Jackson 1.00 0.00
4.4.7 Nuclear Plant Accident Planning: State of Mississippi, Hancock, Harrison and
Jackson Counties
Only one county has nuclear accident planning because there is one nuclear plant
in the entire state of Mississippi. It is located in Claiborne County. As such, this indicator
is not as applicable to evaluate institutional resilience for Mississippi or the tri-coastal
counties study area.
4.4.8 Population Stability: State of Mississippi
The results from the Wilcoxon Signed-Rank Test suggests that the majority of
counties in Mississippi have relatively stable populations in 2000 and 2010, indicating
that there is not a statistically significant difference between the two sets of year (see
Table 4.7). Less than twenty counties experienced significant population losses or gains,
particularly in the double digits. In 2000, Calhoun, Leflore, Lauderdale, Marion and

54
Webster experience the least in terms of population change while Hancock, Issaquena,
Rankin, Lamar and DeSoto have significant population growth (Table 4.25 and Table
4.26). In the 2010, Attala, Walthall, Itawamba, Lowndes and Forest had relatively stable
population size within the five-year-period. De Soto, Stone, and Lamar experienced
significant population growth while Jefferson and Issaquena counties have significant
population decline.
Table 4.25: Mississippi counties with highest and lowest population stability in 2000.
Rank County % of Population Change
1995-2000
1995
Population
2000
Population
1 Calhoun 0.09 15,056 15,069
2 Leflore -0.09 37,981 37,947
3 Lauderdale 0.11 78,076 78,161
4 Marion 0.12 25,565 25,595
5 Webster -0.13 10,307 10,294
…
78 Hancock 13.66 37,802 42,967
79 Issaquena 13.98 1,995 2,274
80 Rankin 15.96 99,451 115,327
81 Lamar 16.09 33,655 39,070
82 DeSoto 27.29 84,217 107,199
Table 4.26: Mississippi counties with highest and lowest population stability in 2010.
Rank County % of Population Change
2005-2010
2005
Population
2010
Population
1 Attala 0.06 19,552 19,564
2 Walthall -0.11 15,460 15,443
3 Itawamba 0.18 23,359 23,401
4 Lowndes -0.19 59,895 59,779
5 Forrest -0.21 75,095 74,934
…
78 DeSoto 17.70 137,004 161,252
79 Jefferson -18.09 9,432 7,726
80 Stone 19.67 14,862 17,786
81 Lamar 24.75 44,616 55,658
82 Issaquena -26.35 1,909 1,406

55
4.4.8.1 Population Stability: Hancock, Harrison and Jackson Counties
Hancock, Harrison and Jackson counties moved up in ranking in terms of
population stability from 2000 to 2010 (Table 4.27). In 2000, Hancock County
experienced significant population growth. In 2010, it has relatively small population
decline. Similarly, Harrison County experienced modest population growth in 2000 and
slight population decline in 2010. Meanwhile, Jackson County has a similar level of
growth in both 2000 and 2010. As such, stable population size, as compared to dramatic
population gain or loss, is a significant driver of change in institutional resilience and
contributor to the overall BRIC IR scores for these three coastal counties.
Table 4.27: Population stability for Hancock, Harrison and Jackson counties in 2000 and
2010.
Rank County BRIC IR values
(standardized)
% of
Population
Change
Population Size
BRIC IR 2000 1995 2000
78 Hancock 0.50 13.66 37,802 42,967
44 Harrison 0.84 4.43 181,553 189,601
40 Jackson 0.86 3.79 126,626 131,420
BRIC IR 2010 2005 2010
50 Hancock 0.78 -5.96 46,711 43,929
34 Harrison 0.87 -3.46 193,810 187,105
29 Jackson 0.90 2.74 135,940 139,668
4.4.9 Crop Insurance Coverage: State of Mississippi
The Wilcoxon Signed-Rank test indicates that the level of crop insurance
coverage is statistically and significantly different from 2000 to 2010 (see Table 4.7).
Crop insurance policies are present in the northwestern and northern regions of
Mississippi, which include Quitman, Sunflower, Leflore, Tallahatchie, Humphreys,
Coahoma and Bolivar (Table 4.28 and Table 4.29). For these counties, crop insurance
coverage has increased from 2000 to 2010. This expansion can be linked to increased

56
awareness and tightened regulations regarding crop protection against adverse weather
hazards, disease or pests (Glauber et al. 2002).
Table 4.28: Mississippi counties with highest and lowest crop insurance coverage in
2000.
Rank County % Crop Insurance
Coverage in 2000 #s Crop Policies
Land Area
(sq. miles)
1 Quitman 2.28 923 404.84
2 Sunflower 1.70 1182 693.79
3 Tallahatchie 1.55 998 643.92
4 Leflore 1.54 913 591.93
5 Bolivar 1.49 1305 876.28
…
78 Newton 0.00 2 578.03
79 Harrison 0.00 2 580.98
80 Stone 0.00 1 445.37
81 Lauderdale 0.00 1 703.51
82 Jasper 0.00 0 676.00
Table 4.29: Mississippi counties with highest and lowest crop insurance coverage in
2010.
Rank County % Crop Insurance
Coverage in 2010 #s Crop Policies
Land Area
(sq. miles)
1 Quitman 2.86 1160 405.01
2 Sunflower 2.15 1500 697.75
3 Humphreys 2.13 893 418.49
4 Coahoma 2.06 1138 552.44
5 Leflore 1.79 1062 592.54
…
78 Hancock 0.00 1 473.75
79 Neshoba 0.00 1 570.14
80 Newton 0.00 1 578.10
81 Lauderdale 0.00 1 703.63
82 Jasper 0.00 0 676.24
4.4.9.1 Crop Insurance Coverage: Hancock, Harrison and Jackson Counties
The ranking for crop insurance coverage has remained relatively the same from
2000 to 2010 for Hancock, Harrison and Jackson counties (Table 4.30). There is no
significant increase in the number of crop insurance policies over the ten-year-period. As

57
such, this indicator is not a significant driver or contributor of institutional resilience for
the coastal area.
Table 4.30: Crop insurance coverage for Hancock, Harrison and Jackson counties in 2000
and 2010.
Rank County BRIC IR values
(standardized)
% of Crop
Insurance
Coverage
#s of Crop
Insurance
Policies
Land Area
(sq. miles)
BRIC IR 2000
76 Hancock 0.00 0.00 2 476.88
79 Harrison 0.00 0.00 2 580.98
58 Jackson 0.01 0.03 23 726.9
BRIC IR 2010
78 Hancock 0.00 0.00 1 473.75
77 Harrison 0.00 0.00 2 573.99
56 Jackson 0.01 0.04 28 722.75
4.5 Summary
There are five drivers of change in institutional resilience for the state of
Mississippi and four for Hancock, Harrison and Jackson counties (Table 4.31). In the
state of Mississippi, institutional resilience drivers include mitigation spending, flood
insurance coverage, disaster aid experience, jurisdictional coordination and crop
insurance coverage. The impacts of Hurricane Katrina can be observed in a statewide
increase in mitigation funding, flood insurance participation and crop insurance coverage.
For the three coastal counties, drivers are mitigation spending, flood insurance coverage,
disaster aid experience and population stability.
Table 4.31: Drivers of temporal change in institutional resilience for the State of
Mississippi and for Hancock, Harrison and Jackson counties.
Statewide Tri-County Coastal Counties
1. Mitigation Spending 1. Mitigation Spending
2. Flood Insurance Coverage 2. Flood Insurance Coverage
3. Disaster Aid Experience 3. Disaster Aid Experience
4. Jurisdictional Coordination 4. Population Stability
5. Crop Insurance Coverage

58
The detailed analysis of the BRIC IR scores for Hancock, Harrison and Jackson
counties shows that the change in rank in each institutional resilience indicator has a
direct effect on the change in resilience score over time in many cases. Consequently,
when a county moves up in terms of ranking in a particular IR category, the overall IR
score will usually increase. In the case of flood insurance coverage, although the number
of flood policies has dramatically increased in the study area, the ranking of Hancock,
Harrison and Jackson remains relatively the same from 2000 to 2010. As such, the min-
max scaling can obscure significant details. Driving indicators of institutional resilience
for the coastal counties are slightly different than that of the whole state because they are
more context-specific and applicable to the study area. This is an important point to note
for decision makers who wish to use BRIC as a tool for deciding where to invest money
or allocate resources. Local needs are different from state priorities.

59
CHAPTER 5: METHODOLOGY AND RESULTS FOR QUESTION #2
The quantitative analysis of the BRIC institutional resilience (IR) index shows
that many IR indicators are directly related to mitigation planning. These indicators
include mitigation spending flood insurance coverage, disaster aid experience, local
disaster training, and nuclear plant accident planning. As such, qualitative analysis of
state and local hazard mitigation plans can yield useful insights in regard to
contextualizing the indicators.
5.1 Hazard Mitigation Plans
The central purpose of multi-hazard mitigation planning is to reduce and manage
risk and hazards in the long-term. Multi-hazard mitigation plans are required for state and
local governments by the Disaster Mitigation Act of 2000 as well as serving as a
condition for receiving federal funding and grants. The Act, which amended the Stafford
Disaster Relief and Emergency Assistance Act of 1988, emphasizes that mitigation
planning processes need to incorporate identification of hazards, risks, and
vulnerabilities, prioritize mitigation actions, encourage partnership between citizens,
local and state governments, and provide technical assistance for these efforts.
The Federal Emergency Management Agency (FEMA) has multiple guidelines to
aid states and local government in developing mitigation plans (FEMA 2008). Over the
years, these guidelines have been thoroughly incorporated into mitigation plans. As a
result, mitigation planning at federal, state and local level follows the same set of steps.
The first step for local and state governments is to facilitate and conduct meetings with

60
diverse community groups. Community leaders can provide input on mitigation strategies
and help evaluate the community’s capacities and needs. The second step is to complete a
risk assessment of the potential impacts of hazards on the people, economy, and built and
natural environments of the community. The objective is to identify and prioritize risk
reduction strategies (FEMA 2008).
The third step in the process is to build a mitigation strategy, which consists of
mitigation goals, objectives and action items that the community will pursue. These are
developed in consultation with subject matter experts, stakeholders and public surveys, as
well as utilizing existing guides and resources. Collectively stakeholders identify eligible
activities and projects that qualify for funding under the FEMA Hazard Mitigation
Assistance (HMA). The final step is to commit to plan maintenance procedures, which
are monitoring, evaluating and updating. Since mitigation plans are considered “living
documents,” mitigation plans need to be evaluate and modify over time. According to the
old guidelines, states were required to update their plans every three years and local
governments every three years. As of 2015, current FEMA guidelines require both states
and local governments to update their plans every five years (FEMA 2015b).
5.2 Methodology
Q2: Do state and local mitigation plans explain or indicate changes in
institutional resilience for the Mississippi Gulf Coast in the setting of pre-
and post-Katrina?
Content analysis of state and local hazard mitigation plans was used to answer
research question #2. The selected spatial unit of analysis is state and county-based
hazard mitigation documents between the years of 2000 and 2010 to maintain the spatial

61
and temporal consistency with the BRIC analysis. The pre-Katrina hazard mitigation
plans (HMPs) for Hancock, Harrison, Jackson and the state of Mississippi were acquired
from the Mississippi Emergency Management Agency via public information request.
These HMPs were the first official mitigation plans, as mandated by the Disaster
Mitigation Act of 2000, for Mississippi and the tri-coastal county study area. The post-
Katrina HMPs were the most current mitigation plans, which were found online on
county and state websites or from directly contacting the local hazard mitigation offices.
There were several updates between the first and most currents state and county
HMPs (Table 5.1). The 2004 State HMP had been updated in 2007, 2010 and 2013.
Hancock County updated its 2001 County HMP in 2006 and 2013. Harrison County
updated its 2001 County HMP in 2005, 2008 and 2014. Lastly, Jackson County updated
its 2005 County HMP in 2012. The most updated State and County HMPs were selected
to represent post-Katrina HMPs because they can provide useful insights regarding the
current mitigation practices and how these practices had evolved over time. In addition,
these HMPs contained examples of lessons learned from Hurricane Katrina and how they
had been incorporated into current planning goals and strategies.
Table 5.1: State and local mitigation plans included in this study.
Year Plan Title
State of
Mississippi
2004 State of Mississippi Standard Mitigation Plan
2013 Mississippi State Hazard Mitigation Plan Update
Hancock County 2001 Hancock County Hazard Mitigation Plan
2013 Hancock County Multi-jurisdictional Hazard Mitigation Plan Update
Harrison County 2001 Harrison County Mitigation Plan
2014 Harrison County Multi-jurisdictional Hazard Mitigation Plan
Jackson County 2005 Jackson County Multi-jurisdictional Hazard Mitigation Plan
2012 Jackson County Multi-jurisdictional Hazard Mitigation Plan

62
The qualitative data acquired from the content analysis process was explored in
different ways. First, the indicators in the BRIC institutional sub-index were utilized as
variables to construct a checklist, using the methodology in Frazier et al. (2013). The
authors utilize the BRIC framework developed by Cutter et al. (2010) as a reference to
review different disaster mitigation plans including post-disaster development plan,
comprehensive emergency management plan, comprehensive plan, and local mitigation
strategy plan. The BRIC resilience indicators were used to determine whether certain
factors were referenced or highlighted in reviewed plans.
Unlike Frazier et al. (2013), this checklist is a longitudinal assessment of hazard
mitigation practices. It only included hazard mitigation plans and not emergency
management plans, comprehensive plans, and post-disaster plans. The checklist was used
to assess discussions in pre- and post-Katrina state and local hazard mitigation documents
relating to the ten IR indicators. It recorded whether the IR indicators were present or
absent in the pre- and post-Katrina HMPs. Second, an in-depth assessment of IR
indicators was conducted to describe how they changed in the context of pre- and post-
Katrina.
This section contains a comprehensive assessment of the institutional indicators
that are found in either or both of the pre- and post-Katrina state and local HMPs. It
documents the way these indicators are represented in the HMPs as well as the way their
representations have changed over time. As such, documentation of any changes that
were made afterward, taking the impacts of Katrina into account, provides clarifications
and contextualization for the output metrics of BRIC IR indicators.

63
5.3 Checklist Construction and In-depth Analysis of State and Local Hazard
Mitigation Plans
Table 5.2 indicates that while certain IR indicators are ubiquitously present in all
HMPs, others are noticeably missing. For instance, hazard mitigation, jurisdictional
coordination, disaster aid experience and flood insurance coverage are present in both
state and local hazard mitigation plans in the pre- and post-Katrina contexts. By contrast,
crop insurance coverage, nuclear accident planning (with exception of the pre-Katrina
State HMP) and the two performance regimes are not found in any of the examined
documents.
Table 5.2: Checklist for state and county HMPs using BRIC institutional indicators.
Mississippi Hancock Harrison Jackson
Institutional Resilience 2004 2013 2001 2013 2001 2014 2005 2012
Mitigation spending x x x x x x x x
Jurisdictional coordination x x - x - x x x
Disaster aid experience x x partial x partial x x x
Flood insurance coverage x x x x x x x x
Local disaster training x - - - - x - -
Population stability - x x x x x x x
Crop insurance coverage - - - - - - - -
Performance regimes-
state capital - - - - - - - -
Performance regimes-
nearest metro area - - - - - - - -
Nuclear plant accident
planning x - - - - - - -
(x) present and (-) absent
5.3.1 Mitigation Spending: State of Mississippi
FEMA’s Hazard Mitigation Grant Program (HMGP) funds all mitigation plans
and their subsequent updates. The State hazard mitigation plan is developed and
maintained by the Mississippi Emergency Management Agency (MEMA). The HMGP
provides grants to states and local governments to implement long-term hazard mitigation

64
after a major disaster declaration. About 15 percent of the post-disaster assistance goes to
ward mitigation programs and comes at least a year after a disaster declaration. Projects
that are funded by HMGP include but not limited to retrofitting critical facilities, building
saferooms and storm shelters, eliminating repetitive flood loss structures and creating
warning systems.
According to the first HMP of the State of Mississippi, which was created in
2004, the comprehensive planning process involves coordination, collaboration and
consultation. The mitigation plan has to be constructed in accordance with FEMA
Mitigation Planning Guidance. MEMA decides to work different research and planning
teams for prioritized hazards, which include earthquake, flood, hurricane, tornado, dam
and levee hazards, and winter storm. In addition, state emergency management
representatives are obligated to seek inputs from federal and local agencies along with
community groups and business organizations. MEMA also has to make sure their
mitigation strategies are integrated with local plants and initiatives. Next, it conducts
multi-hazard risk and vulnerability assessment for prioritized hazards in terms of loss
modeling, potential loss estimates, and exposure of critical state facilities. Moreover, the
MEMA is responsible for assessment of local capacities and provides funding and
technical assistance to its local districts. Finally, since the hazard mitigation plan is
considered a “living document,” MEMA must maintain its goals and objectives and
update the plan every five years. The steps described here represent the basic outline of
any mitigation frameworks for the state, county or municipal level.
The latest HMP for the State of Mississippi was updated in 2013 by MEMA. The
document shows that it has been completed with a high degree with public participation.

65
There are observable changes between the 2004 State HMP and the 2013 updated. For
instance, the 2004 State plan divides Mississippi into ten planning and development
districts, which were established by grouping counties into ten geographic clusters (e.g.
north, northwest, southern, etc.). By contrast, the political structure discussed in the 2013
HMP manages Mississippi counties by classifying them into nine different MEMA
regions. Next, as required by FEMA, the prioritized hazards have grown to include
wildfire. Meanwhile, severe weather and hurricanes and tropical storms are classified
under the tropical cyclone category. Moreover, the hazard identification and risk
assessment section shifts from using just probabilistic estimation to priority ranking
methodology, or the Hazard Ranking Index, which takes into account multiple factors
such as areas affected by hazards, health and safety consequences, property damage,
environmental damage, and probability of future occurrence.
The 2004 HMP document uses historical records of different hazards to model the
worst-case-scenarios. In the 2013 HMP, given the severe degree of property losses and
casualties caused by Hurricane Katrina, it was used as a baseline to estimate damages,
displacement and exposure in tropical cyclone scenario modelling. Lastly, the 2013 HMP
also includes social vulnerability assessment, as opposed to focusing only on structural
vulnerability as in previous versions. Based on the Social Vulnerability Index, or SoVI,
the plan identifies different socio-demographic and built environment variables to
determine the state’s most socially vulnerable counties (Cutter et al. 2003). Over time, the
state plan has been drastically improved in every single aspect due to increased learning
experience, technological advances, and communications with its public and private

66
partners. In addition, the disaster experience from Hurricane Katrina contributes to
increased awareness about the realizable impacts of environmental hazards.
The notion of resilience can be seen throughout the 2013 state HMP. By contrast,
the 2004 HMP did not have any reference mentioning resilience. Building and enhancing
resilience is the central basis for the broad mission of the 2013 State Hazard Mitigation
document. Most of its goals and objectives in the 2004 State HMP and 2013 HMP bear
some resemblance in terms of techniques and strategies to increase public awareness,
reduce risk, foster cooperation and collaboration among all levels of governments, non-
profit and private sectors, and strengthen local capacities.
5.3.1.1 Mitigation Spending: Hancock County
The Federal Emergency Management Agency (FEMA) requires counties to
update their HMPs every five years. The first HMP for Hancock County was created in
2001, and its latest version was updated in 2013. Moreover, unlike the 2000 version, the
2013 HMP is a multijurisdictional plan, which was jointly prepared by Hancock County,
the city of Diamondhead, and the unincorporated community of Pearlington.
Multijurisdictional planning allows different localities and their respective county to
create comprehensive approaches that cover multiple jurisdictions; the city of Bay St.
Louis and Waveland have their own local HMPs. In addition, multijurisdictional planning
will aid in terms of economics of scale by leveraging individual capabilities and sharing
costs and resources. One of the tradeoffs of this type of planning is localities might have
less control over the process as leadership become more centralized (FEMA 2000).
When compared the 2001 and 2013 Hancock County HMPs, there are observable
differences. First, the 2013 County HMP includes extensive vulnerability and capacity

67
assessments for localities that are covered under its jurisdiction, the city of Diamondhead
and the unincorporated community of Pearlington. The plan also contains different
hazard profiles and mitigation strategies specially tailored to these localities. Second, in
2001 Hancock County was concerned both environmental and technological hazards,
which included flooding, hurricanes, rail accident, traffic, terrorism, wildfires, tornadoes
and severe heat. By 2013, most of the technological hazards were eliminated from the
priority list and more natural hazards such as severe weathers, costal erosion, and climate
change were added. Assessment of climate change is new and a recent federal
requirement (Babcock 2013). The prioritized hazards as identified by the county are
much different than that of the state.
Third, similar to the latest State HMP, the 2013 HMP incorporates the impacts of
Hurricane Katrina extensively throughout the document. Since the county and its
localities have not fully recovered, any recovery and mitigation activities have to be able
to handle the worst-case-scenario Katrina disaster. Fourth, the 2013 County HMP has
incorporated different mechanisms to assess weakness and strengths in mitigation goals
and actions, as compared to the lack of assessment in the first HMP. The 2013 county
plan also recorded which actions were completed and recognize barriers to the
incomplete ones. Finally, in 2013, the county had also expanded its list of mitigation
projects that are qualified for federal funding under HMGP. In addition to making
improvements to public shelters and public warning systems, the county, as of 2013,
applied for funding to establish fire breaks, retrofit individual structures to withstand
hurricane force winds, and enforce land use and building code regulations.

68
5.3.1.2 Mitigation Spending: Harrison County
The first HMP for Harrison County was approved in 2001, and its latest version
was updated in 2014. Similar to Hancock County, the most updated version is a
multijurisdictional mitigation plan, which covers planning for the county and the cities of
Biloxi, D’Iberville, Gulfport, and Pass Christian. Consequently, the current county plan
conducts vulnerability and capability assessments on multiple hazards, taking the
localities under its jurisdiction into account. The list of prioritized hazards has expanded
since 2001 to include solely environmental hazards such as extreme heat, wildfires,
hailstorm, hurricane and tropical storms, severe weather, earthquake, tornado, windstorm,
flood, coastal erosion, storm surge, wave action, and sea-level-rise and other effects
associated with climate change. It chose excludes the technological or manmade hazards
that were stated in the 2001 HMP such as railroad accident, terrorism and traffic
accidents because these are not high-risk hazard in Harrison County.
Second, similar to the other post-Katrina HMPs, the impacts of the Hurricane
were incorporated throughout the document, particularly in the worst-case-scenario
modeling and simulations. In addition, flood and storm surge maps were revised to show
the extent and the magnitude of Katrina’s surge. Federal funding that was received post-
Katrina were used to enforce building code and land use regulations as well as increase
construction of storm shelters and retrofit public structures. Third, Harrison County has
adopted and applied the Hazard Ranking Index that was used to categorize and prioritize
hazards for the State. Lastly, unlike the 2001 County HMP, the current version contains a
comprehensive asset inventory (e.g. school, hospital, police station, fire station, etc.),
which is usually lacking in many pre- and post-Katrina HMPs. Overall, the pre- and

69
post-Katrina HMP for Harrison County are significantly different from each other in
terms of management structure, prioritized hazard types, comprehensiveness of
vulnerability and capability assessment, and the degrees of communication with
community, non-profit and private groups.
5.3.1.3 Mitigation Spending: Jackson County
Jackson County finalized its first hazard mitigation plan following the impact of
Katrina, which was approved in November 2005. Although the planning process started
in early 2003, many pertinent programs and files were destroyed in Hurricane Katrina in
late August 2005. Consequently, the 2005 County HMP was not as comprehensive as its
counterparts, resembling the first HMPs in Hancock and Harrison counties. Over time,
the current county HMP shows significant improvement as compared to the first version.
First, the 2012 version is a multijurisdictional mitigation plan, which covers Jackson
County and the city of Gautier. The city of Moss Point, Ocean Springs and Pascagoula
participated in the planning process in 2005, but chose to create separate hazard
mitigation plans for 2012. Second, the 2012 County HMP expands the list of prioritized
hazards to include coastal erosion, drought, flood, hurricane and coastal storms, storm
surge, severe weather, tornado, wildfires and sea-level-rise. These are ranked using
probability of hazard occurrence instead of applying the State’s Hazard Ranking Index.
Moreover, the vulnerability and capability assessment portion of Jackson County are not
as comprehensive as compared to that of Hancock and Harrison counties. There are very
few applications of HAZUS-MH loss modeling, and they are exclusively applied to storm
surge and hurricane.

70
Third, the impacts of Hurricane Katrina are not incorporated into worst-case-
scenario. In addition, the current plan does not have a comprehensive list of critical
facilities. A partial explanation for this deficiency in vulnerability and capability
assessment is due to the fact that many important planning files were lost during the
Hurricane, however, that was seven years ago. Furthermore, the plan does not contain a
record of projects that were executed using funds from HMGP. Overall, the 2005 and the
2012 County HMP are somewhat different from one another, but the 2012 version is not
as comprehensive as the current HMPs of Hancock and Harrison counties.
5.3.2 Jurisdictional Coordination: State of Mississippi
An indicator of jurisdictional coordination can be found in the second chapter of
both the 2004 and 2013 State HMPs. This section of the documents record—as required
by FEMA—every step of the planning process as well as the personnel that were
involved. In 2004, the state planners coordinated with different specialized teams. The
representatives came from other state governmental agencies, research universities, the
Federal Emergency Management Agency, National Weather Service, U.S. Geological
Survey and U.S. Army Corps of Engineers. Each team was responsible for a specific
hazard type such as winter storm, earthquake or flood.
By contrast, the 2013 State HMP was produced under the guidance of a
centralized entity called the Hazard Mitigation Council. The Council, formed in 2007
through an executive order by Governor Haley Barbour, is responsible for coordinating
mitigation efforts between all levels of government, non-profit organizations, and the
private sector. Members from cabinet level departments meet with mitigation planners,
MEMA staff, FEMA program managers and specialists, local emergency managers, and

71
university researchers to set mitigation goals and objectives along with assisting with
vulnerability and capacity assessments. In addition, there are additional meetings and
summits during which MEMA personnel interact with the Mississippi Civil
Defense/Emergency Management Association (MCDEMA) to integrate statewide
planning initiatives with local efforts. They also work closely with professionals who are
involved with public health officials, Emergency Medical Service, hospital, fire and law
enforcement representatives, volunteer organizations, and local governmental agencies.
Given the two documents, there are significant improvements in jurisdiction coordination
as time went on. This can be partially attributed to lessons learned from Hurricane
Katrina and/or increased in coordination and communication experience.
5.3.2.1 Jurisdictional Coordination: Hancock County
The 2001 County HMP did not document any consultation activity between local
planners and other agencies, hazard experts, non-profit, or private sectors. By contrast,
evidence of jurisdictional coordination in the updated 2013 version is found in two
aspects. First, the 2013 County HMP is a multijurisdictional plan which was produced
jointly between the county, the city of Diamondhead, and the unincorporated community
of Pearlington. This characteristic suggests that there are some elements pertaining to
jurisdictional coordination when a county has a multijurisdictional hazard mitigation
plan. Second, Chapter 3 of the 2013 County HMP details the planning process, which is
the responsibility of the Hancock County Hazard Mitigation Committee. The Committee
includes representatives from neighboring communities, local and regional agencies
involved in development, business, academia, and private non-profit organizations. The
Committee is also tasked with increasing public involvement through open forums and

72
meetings. Given the current state of Hancock County, the presence of a centralized entity,
which bears strong resemblance the State’s Hazard Mitigation Council, indicates that
there has been improvements made to jurisdictional coordination.
5.3.2.2 Jurisdictional Coordination: Harrison County
Harrison County’s 2001 HMP discusses its partnership with the county Civil
Defense Agency and briefly mentions its coordination with outside agency personnel.
The document mentioned different local representatives as liaisons during emergencies,
but did not go into details about the extent of the relationship. In addition, it also pointed
out that the Civil Defense agency is responsible for providing technical support and
expertise to monitor flood and disaster warnings. Given these aspects, the 2001 County
HMP did not capture enough information to indicate that there was effective
jurisdictional coordination at the time. In the post-Katrina period, Harrison County
recognizes that all information provided in earlier plans as it relates to hazard risks and
vulnerabilities, capabilities, community goals and recommended mitigation actions need
to be updated due to the effects of the storm. Consequently, the 2014 version is a product
of the Local Hazard Mitigation Planning Council (LHMPC) and an outside consultant
team, an engineering firm called Dewberry. The LHMPC invited new members and
representatives from the American Red Cross, American Medical Responses, Harrison
County, city of Biloxi, D’Iberville, Gulfport, Long Beach and Pass Christian, the
Gulfport-Biloxi International Airport, other cabinet departments, utility companies and
casino managers. Finally, the LHMPC held open forums and webinars as part of an
outreach effort for community hazard mitigation practices and providing information to

73
the public. Over time, there are observable improvements made to jurisdictional
coordination between the first mitigation plan and its current version.
5.3.2.3 Jurisdictional Coordination: Jackson County
The 2005 Jackson County HMP briefly documents the collaboration between
county officials, city personnel from Gautier and Moss Point, civil defense departments,
zoning and planning council and other emergency service professionals. The details of
these meetings were not extensive. Moving forward to 2012, the Local Hazard Mitigation
Council, which includes emergency representatives from Jackson County and the city of
Gautier, sought technical assistance from state agencies (e.g. MEMA, Department of
Health, Marine Resources, Transportation, etc.), business and non-profit communities,
city councils, county medical communities, and utility providers. They held several
meetings to identify and prioritize hazards, conduct vulnerability and capacity
assessments, as well as formulate mitigation goals and actions. In addition, the Council
incorporated public inputs gathered from workshops and surveys into the planning
process. Overall, the elements of jurisdictional coordination are also present in all current
state and local hazard mitigation plans in the form of meetings between personnel from
different level of governmental agencies, non-profit organizations and private sectors.
5.3.3 Disaster Aid Experience: State of Mississippi
In the hazard assessment portion of the 2004 State HMP, it includes the data for
PDDs and the number of loss-causing hazard events, which were acquired from FEMA
and National Climatic Data Center (NCDC). The PDDs were reported for each hazard
type as well as specified the name of the disaster declared counties. This data was also
used to create a checklist to determine which counties are at the highest risk for certain

74
types of hazards. The loss data from NCDC was used to specify the type and the number
of loss-causing events along with the amount in property and crop damage. In addition,
NCDC data also contains information about fatalities that occurred during hazardous
events. The PDDs and loss data are present in the vulnerability assessment portion of
flood, hurricane, winter storm and tornado. By 2013, there are some alterations that were
made to the loss reporting approach in mitigation planning.
The 2013 State HMP uses data from the Spatial Hazard Events and Losses
Database for the United States (SHELDUS) in addition to FEMA and NCDC data.
SHELDUS data was only present in the tornado damage assessment and absent in other
hazard assessments such as hurricane, flood and winter storm. The document cites that
SHELDUS was utilized because its data can be adjusted for inflation, unlike NCDC data.
Meanwhile, NDCD data was used to report property and crop damage and casualties for
each MEMA region, and PDD data specified the amount of total public assistance,
emergency work, and permanent work received by during each presidentially declared
disaster. Moreover, NCDC data was used to report on losses during severe weather,
extreme winter weather, flood, hurricane and tornado events. Losses and damages due to
hazards like drought, dam and levee failure, earthquake and coastal erosion are either
absent or reported by using other sources.
5.3.3.1 Disaster Aid Experience: Hancock, Harrison and Jackson Counties
By using the metric of disaster aid experience as a proxy, it can be observed that
Hancock and Harrison counties have partial reporting of losses in their pre- and post-
Katrina hazard mitigation plans. Only Jackson County’s HMP include Presidential
Disaster Declaration reporting in its profiling of hazards. As well, none of the pre- and

75
post-Katrina county HMPs uses SHELDUS data, as they mostly rely on NCDC data for
loss reporting.
For Hancock County, NCDC data was used in both the 2001 and 2013 HMPs.
The most recent version, however, has a more detailed account of damages and casualties
for hazards like hurricanes, severe weather, flood, and coastal storms. In addition, PDD
data, which was absent in the 2001 HMP, was used to report federally declared hurricane
events. For Harrison County, the way losses are reported is similar that of Hancock
County. The pre-Katrina 2001 County HMP only briefly covers losses caused by
different hazards while the more updated version includes more details. As such, the
2014 County HMP uses NCDC data to report the number of events and overall losses for
severe weather, flood, tornado, hurricane, storm surge, and wave action. Moreover, PDD
data was used to report for federally declared losses from hurricane and flood. Lastly,
Jackson County has the only report that includes some information about federally
declared disasters in its pre-Katrina HMP, most of which concerns hurricanes. In
addition, the 2005 County HMP also contains detailed records of losses on tornado,
hurricane, flood and coastal storm events. Its method of reporting losses was not altered
in the updated 2012 version.
5.3.4 Flood Insurance Coverage: State of Mississippi
For the State of Mississippi, NFIP coverage is an important component of
capacity assessment. The state keeps detailed records of communities that are covered by
NFIP and hopes to increase participation in years to come. In the 2004 State HMP,
Mississippi reported that 273 out of 310 communities included Special Flood Hazard
Areas (SFHA) or flood plain members of the NFIP. In addition, 19 of these 273

76
communities also participate in the Community Rating System (CRS). The CRS program
incentivizes communities to engage in floodplain management activities that exceed the
minimum NFIP requirements. In exchange, flood insurance premium rates are discounted
based on the class rating of the community. By 2013, Mississippi had 330 communities
participating in the NFIP and 29 in CRS. This expansion of NFIP participation can in part
be attributed to damages caused by Hurricane Katrina as well as increased outreach and
education about the program itself. According to NFIP loss statistics, the Gulf Coast
counties had the highest flood losses in the period of 1978 to 2013. They are also the top
three counties with the most repetitive and severe repetitive loss of structures, which
continue to strain NFIP resources. As observed in the pre-Katrina and post-Katrina State
HMPs, the discussion about NFIP is relatively similar in the two documents.
5.3.4.1 Flood Insurance Coverage: Hancock, Harrison and Jackson Counties
Given that the Mississippi Gulf Coast area historically has the highest flood
losses, it comes as no surprise that discussion regarding NFIP is present in all of the
HMPs for Hancock, Harrison and Jackson counties. As of 2004, none of these counties
participate in the CRS Program. The pre-Katrina HMPs for these counties did not
perform detailed analysis of NFIP coverage as compared the post-Katrina County HMPs.
For Hancock County 2013 HMP, NFIP is discussed in terms of flood mapping, structural
elevation, floodplain ordinance and management, and CRS participation. In addition, the
county tracks the repetitive and severe repetitive loss properties by mapping and record
keeping, appropriately allocating resources and implementing loss-reduction strategies.
With regard to CRS, Hancock County and the City of Diamondhead are not members. By
contrast, the City of Bay St. Louis and Waveland both participate in the CRS with

77
respective ratings of seven (15% discount in SFHA and 5% in non-SFHA) and five (25%
discount in SFHA and 10% in non-SFHA).
In the 2001 Harrison County HMP, NFIP was mentioned in the repetitive loss
properties, which the county kept detailed records, and included a recommendation
section relating to retrofitting structures. The document also notes the prospect of
Harrison County joining the CRS program. By 2014, Harrison County is certified as
Class 8 community, which receives 10% in premium reduction in SHFA and 5% in non-
SFHA. The CRS class rating for Harrison and Jackson communities fall into the average,
with majority of nationwide communities attaining rating in Class 8 or 9 (Landry and Li).
Similar to the 2013 Hancock County HMP, the most updated version for Harrison
County points out that NFIP participation is crucial in capability assessment as well as in
floodplain management, flood mapping, reduction of repetitive and severe repetitive loss
structures, and enforcement of flood ordinance. In the case of Jackson County, the 2005
County HMP only makes a brief mentioning of NFIP in regard to repetitive loss
properties. In addition, one of goals of the plan was to attain better CRS rating for
participating jurisdictions to indicate a lower flooding risk level. As of 2012, Jackson
County, the City of Gautier, Ocean Springs and Pascagoula are participating members of
the CRS system, with respective class ratings of nine, seven, seven and five. As for NFIP,
the 2012 County HMP discusses flood insurance in similar terms as those of current
Hancock and Harrison counties HMPs.
5.3.5 Local Disaster Training: State of Mississippi
The 2004 State HMP records that as of 2005, there are a total of 74 CERT Teams
in Mississippi with 1,037 participants, many that come from school districts, community

78
colleges, community centers, medical centers, and community emergency services.
Meanwhile, the most updated 2013 HMP has no mentioning of CERT. This information
can be found the State’s Comprehensive Emergency Management Plan of 2012.
5.3.5.1 Local Disaster Training: Hancock, Harrison and Jackson Counties
According the 2004 State HMP, no CERT was present in the Harrison, Hancock
or Jackson County. As such, the pre-Katrina HMPs of the Gulf Coast counties have no
mentioning of CERT. As for the current County HMP, the only reference to CERT was
found in Harrison’s 2014 HMP as it discussed the need to expand CERT with little
details.
5.3.6 Population Stability: State of Mississippi
The 2004 State HMP did not take population stability into consideration. It only
considered the total population in 2000 of each planning and development district but did
not address how population growth or decline would affect the capability to cope with
different hazard types. In contrast, the 2013 State HMP takes population growth or
decline into account in terms of economic activities and available housing units. For
instance, from 2000 to 2010, 39 out of 82 counties gained population and 13 of these
gained by ten percent. Meanwhile, 41 counties experienced a population decline between
2000 and 2012. Many of these counties are primarily located in the Mississippi Delta
where the economic base has historically been heavily reliant on agriculture. Some of
them experienced population loss percentages in the double digits. Population loss in
rural areas can be attributed to a decrease in farming activities, high poverty, lack of job
opportunities and other industries, difficult access to healthcare, education and retail
services, low natural amenities and general remoteness (McGranahan and Beale 2002).

79
Population growth or decline can have significant influence over the availability of
housing units and local economic activities. Decisions regarding mitigation planning,
building codes, flood control, storm water control and protection of wetlands have to take
change in population density into account.
5.3.6.1 Population Stability: Hancock, Harrison and Jackson Counties
Population stability as an indicator is present in all the pre-Katrina and post-
Katrina County HMPs for Hancock, Harrison, and Jackson. Hurricane Katrina has
significantly impacted the population growth trend in the Gulf Coast counties. As of
2010, Harrison, Hancock, and Jackson rebounded to their pre-Katrina population levels.
The 2001 Hancock County HMP mentions the percentage change in population but did
not go into detail about the impact of such change. By contrast, the 2013 updated version
discusses population change in terms of available housing and effects on economic
growth. Planners also map and locate dense population centers to decentralize shelters.
The 2001 Harrison HMP also mentions population changes, especially post-
disaster, in terms of housing unit availability, but does not go into more detail. By 2013,
planners incorporated population changes into decision making to address evacuation
mapping, flood mapping, hazard awareness and sheltering. In Jackson County, a more
detailed assessment about population change was found in the 2012 County HMP.
Similar to Hancock and Harrison counties, the planners incorporate change in population
density into risk and capability assessments along with calculating available housing
units.

80
5.3.7 Indicators Absent from Hazard Mitigation Plans
The indicators for crop insurance damage, nuclear accident planning and
performance regimes are absent in all of the state and county HMPs. Although these
HMPs contain information about crop damage, they have no mention of crop insurance.
As for nuclear accident planning, it was identified as a non-prioritized hazard in the 2004
State HMP, because as of present, Mississippi only has one nuclear power plant. The
document did not include any reference regarding population residing nearby the nuclear
plant. Lastly, the methodological approach to calculate the metrics for the performance
regimes is a straight-distance measurement between county seat to the nearest
Metropolitan Statistical Area or the state capital. These metrics are not observed in any of
HMPs in addition function as constant values in BRIC institutional resilience in 2000 and
2010. As such, they were not included in the analysis.
5.4 Summary
The results of the content analysis in Chapter 4 illustrate that the BRIC
institutional resilience sub-index contains many elements that can be found in state and
local hazard mitigation (HMPs) plans. Six out of ten institutional resilience indicators are
present throughout, however, the output metrics of these resilience indicators are not
always found in HMPs. Mitigation spending, flood insurance coverage and disaster aid
experience are found in the pre- and post-Hurricane Katrina state and local HMPs while
jurisdictional coordination, local disaster training and population stability are found in
some and not others. Content analysis of HMPs provides supplementary information for
each of the institution resilience indicators, allowing for differentiation between a
theoretical approach and institutional practices.

81
CHAPTER 6: DISCUSSION
This chapter contains four discussion topics. The first topic analyzes the utility of
the Baseline Resilience Indicators for Communities (BRIC) institutional resilience sub-
index. The second topic discusses the changes to mitigation practices at the state and
local scale in post-Hurricane Katrina period. The third topic suggests improvements for
BRIC institutional resilience sub-index and for state and local hazard mitigation plans.
Finally, the last topic covers the future outlooks on how to bridge the gap between
institutional resilience indicators and institutional practices.
6.1 Utility of the BRIC Institutional Resilience (IR) Sub-Index with regard to the
State of Mississippi and Hancock, Harrison and Jackson counties
The establishment of baselines and periodic examination of reliance markers
relative to that baseline is an important consideration in the development of standards
(McAllister 2013). Replication of the BRIC institutional resilience sub-index at the state
scale (n=82) demonstrates that it is useful for establishing a resilience baseline as well as
measuring how that baseline has shifted in Mississippi post-disaster. Indicators such as
mitigation spending, flood insurance coverage, crop insurance coverage, jurisdictional
coordination and population stability are more likely to change from pre- to post-Katrina
within a ten-year interval. By contrast, nuclear plant accident planning, local disaster
training, and the two performance regimes are less likely to change. Evaluation of the
absolute and standardized values of the resilience metrics illustrate that there are some
discrepancies in terms of institutional drivers of change in resilience at the state and local

82
scale. At the state scale, the Wilcoxson Signed-Rank Test is useful for determining which
indicators are statistically different from 2000 to 2010. By comparison, observations of
changes in rank are more appropriate in determining the indicators that drive change in
institutional resilience at the local tri-county scale.
Mitigation spending, flood insurance coverage, disaster aid experience,
jurisdictional coordination, and crop insurance coverage drive change in institutional
resilience at the state scale while only the first three mentioned indicators along with
population stability drive institutional resilience for Hancock, Harrison, and Jackson
counties. The changes in indicators such as mitigation spending and flood insurance
coverage can be directly linked to Hurricane Katrina while the rest have weaker linkage
or no relationship with the disaster itself. Undoubtedly, the impacts of Hurricane Katrina
have influenced the dramatic increase in mitigation spending and expansion of flood
coverage, both at the state scale and the tri-coastal county scale.
In the case of mitigation spending, the majority of the Hazard Mitigation Grant
Program (HMGP) grants received between 2001 and 2010 by the state of Mississippi,
Hancock, Harrison, and Jackson counties were directly related to the Hurricane Katrina.
As for flood insurance coverage, Hurricane Katrina produced a significant amount of
surge and coastal flooding resulting in more than $2.6 billion in National Flood Insurance
Program claims (FEMA 2015a). In the post-Katrina period, the state significantly
increased the number of flood insurance policies in the post-Katrina period (FEMA
2015a). In Hancock, Harrison and Jackson counties, the number of national flood
insurance policies has almost doubled or tripled from 2000 to 2010. The changes as
assessed by the BRIC IR metrics in mitigation spending and flood insurance coverage are

83
consistent with the findings within the academic literature and by FEMA (Kunreuther
2006; Rose 2007; Berke and Godschalk 2009; Nance 2009; Michel-Kerjan 2010; FEMA
2015a).
According to the BRIC IR sub-index, Hancock, Harrison and Jackson counties are
the most resilient counties in Mississippi in 2010. This assessment is difficult to validate.
Changes in institutional resilience for these three counties are mainly driven by the
increase in mitigation spending and flood insurance coverage, which are directly linked
to Katrina. However, spikes in mitigation spending and expansion of flood insurance
policies are reactive policy decisions rather than proactive ones (Mitchell 2006a; Landry
and Li 2011). As such, an additional temporal setting (e.g. BRIC IR 2015) is needed to
examine how institutional indicators perform in periods without a major disaster or
whether such institutional resilience decreases over time relative to other counties in the
state.
At the state scale, changes in crop insurance coverage, jurisdictional coordination,
and disaster aid experience have weaker or no linkages to Hurricane Katrina. Although
the change in the level of crop insurance from 2000 to 2010 is statistically relevant, this
increase could be partially be linked to the crop damage by Hurricane Katrina, or the
prevalence of pests and diseases, or some combination of factors (Glauber et al. 2002).
Similarly, the decrease of the number of government and special districts in Mississippi
counties could be linked to Hurricane Katrina. Consolidation of governmental agencies
and districts could be a result of lessons learned post-disaster in order to improve
response, communication, and coordination during times of crisis (Ansell et al. 2010). As
observed in the BRIC IR sub-index, the linkage between the jurisdictional coordination

84
indicator and Hurricane Katrina is difficult to establish because decrease in political
fragmentation can also be a function of governmental reform over time. Lastly, disaster
aid experience has little to no association with Hurricane Katrina as measured by the
numeric counts of loss events and the Presidential Disaster Declarations (PDDs). The
numeric counts did not distinguish between the dollar amount of a high loss event and a
low loss event. This lack of monetary distinction is also applied to PDD events. As such,
Katrina would be counted the same way as less severe events.
At the tri-coastal county scale, Hancock, Harrison and Jackson counties rank
significantly higher in 2010 than 2000 in terms of population stability. Between 1995 and
2000, these three counties had modest to high population growth, but in the immediate
aftermath of Katrina, the Mississippi Coast experienced substantial population loss due to
evacuation or permanent relocation (Hori and Shafter 2010). As a result, between 2005
and 2010, the indicator shows little to no population growth because these counties are
still recovering to their pre-Katrina levels.
For future improvements, planners may want to incorporate state and county data
and tailor the BRIC IR sub-index to represent local needs (Frazier 2013; Singh-Person et
al. 2013). For instance, the local disaster training variable was intended to capture the
degree of preparedness at the county level. Given that the value for this indicator was
missing for many Mississippi counties, planners could utilize alternative proxies such as
Fire Corps, Neighborhood Watch, Volunteers in Police Program and other Citizen Corps
programs to measure local disaster preparedness.
The BRIC index as a whole provides a good basis for benchmarking resilience.
However, it is important to understand the processes that are involved in the index

85
construction such as theoretical and practical justification, variable selection, data
availability, weighting, scalability, transformation and standardization process (Cutter et
al. 2008b; Fekete 2009; Tate 2012). Without a good grasp of these processes, it may be
difficult to utilize the output metrics to responsibly allocate resources.
6.2 Content Analysis of Hazard Mitigation Plans for the State of Mississippi and
Hancock, Harrison and Jackson Counties
Overall findings for the second research question indicate that there are
substantial differences from the pre- to post-Katrina hazard mitigation plans at the state
and local level. Between the first and the most updated hazard mitigation plans, the
categories of hazard prioritization, vulnerability and capability assessment, scenario
modeling, reporting of losses, jurisdictional coordination, and public outreach are
generally improved. Many of these observed improvements, however, are the result of
changed federal requirements in order to qualify for funding from the Hazard Mitigation
Grant Program along with other hazard related programs (Birkland and Waterland 2008;
Berke et al. 2012). As such, the changes in pre- and post-Katrina mitigation practices can
be attributed to federal top-down directives rather than local initiatives, even though state
and local inputs and initiatives in mitigation planning are observed in several categories.
6.2.1 Hazard Identification in State and Local Hazard Mitigation Planning
In the post-Katrina setting, state and local governments initiated hazard mitigation
councils to improve coordination and communication between representatives from
different government agencies, researchers, non-profits, planners, business communities,
and public health facilities. At the state level, the Hazard Mitigation Council approved a
new hazard ranking process. This Hazard Ranking Methodology, adopted in the 2013
State HMP, evaluates each hazard based on risk and vulnerability characteristics such as

86
area impacted, public health, property damage, environmental damage and economic
disruption. These are used in conjunction with the usual method of estimating probability
of future occurrence. As required by FEMA, this hazard ranking process also includes
extensive assessment of local hazard mitigation plans to match up the hazards of concern
to local communities (Berke et al. 2012). For example, the 2013 HMP established that if
45 percent or fewer of the local plans identified the hazard, it was deemed to pose no
significant threat to the state.
Furthermore, the Hazard Ranking Methodology also influences how each hazard
is profiled in terms of loss and scenario modeling, which consists of potential losses in
lives and property, building exposure, debris generation, population displaced and
emergency shelters needed. As a result, mitigation actions are prioritized based on the
hazard ranking and assessment. The majority of mitigation strategies focus on tornado,
dam and levee failure, tropical cyclone, flood, and wildfire because these hazards possess
a high risk level. The Council excluded technological and manmade hazards because they
pose less of a threat to the state than natural ones. These hazards are also not a federal
requirement for an HMP. Similarly, Hancock, Harrison and Jackson counties excluded
assessment of these hazards in their most recent HMPs as well.
Although elected local mitigation councils for Hancock, Harrison and Jackson
counties consulted on the hazard ranking process, only Harrison County’s most updated
HMP incorporated the state-wide hazard ranking approach. The hazard identification and
prioritization process as applied in the 2013 State HMP is not seen in the local HMPs for
Hancock and Jackson Counties. These two counties rely on public surveys and
probability of occurrence to prioritize and profile local hazards. The local HMPs from

87
Hancock and Jackson counties identify hazards based on historical records and past
damages, which include casualties and property and economic damage. By contrast,
Harrison County HMP incorporates findings from public surveys along with its Hazard
Ranking Index, similar to that of the state, to determine how to it will address each
hazard. One of the reasons Hancock and Jackson Counties have not adopted the state’s
Hazard Ranking Methodology is because it is too new. The state unveiled the
methodology in 2013, which means that the 2013 Hancock County HMP and 2012
Jackson County HMP did not have enough time to integrate it into their local plans. It is
likely that the Hazard Ranking Methodology will be incorporated in the next version of
the local HMPs.
The hazard prioritization process is driven by different interests within the
councils, and this affects the types of mitigation funding the state or local government
may be able to acquire. There are two areas of concern in the process: (1) climate change
and its related hazards (e.g. drought, sea-level-rise) and (2) public participation. The 2013
State HMP has one mentioning of climate change, with limited details, even though a
discussion of climate change and its effects on local extreme weather is now federally
required (Babcock 2013). By comparison, local HMPs for Hancock, Harrison and
Jackson counties elaborate on climate change and related hazards such sea-level-rise,
droughts, and frequent flooding. This pattern is reflective of current literature that climate
change adaptation predominately planning occurs at the local and municipal level and not
as a top-down directive (Measham et al. 2011).
Although the state and local hazard mitigation councils represent collaborative
partnerships between government, non-profits, and business sectors, the more vulnerable

88
citizens are often excluded from the decision making process. FEMA requires that the
planning process include public participation, which is usually observed in terms of
posting a draft copy to a website, forums, workshops and surveys. These techniques are
not as proactive in reaching out to disadvantaged groups such as low-income and
minority racial and ethnic groups, who are often underrepresented in the decision-making
process (Berke et al. 2012). State and local governments should consider using different
types of participatory methods to mobilize and involve communities in the planning
process employing consensus-based approaches and community outreach strategies
(Pearce 2003).
These observations as such relate closest to two institutional resilience indicators,
mitigation spending and statewide coordination. Mitigation spending targets highly
ranked hazards while statewide coordination points to increased coordination between
state and local governments. One aspect to note about the relationship between the state
and tri-county study area is that emergency management representatives from Hancock,
Harrison and Jackson work directly within the state’s Hazard Mitigation Council to
update the State HMP. This is not the case for other counties in Mississippi, with the
exception of DeSoto County. It bears repeating that the Mississippi Gulf Coast has
enormous economic and political importance to the state. The involvement of their local
representatives in the state mitigation planning process could indicate these coastal
counties rank higher than others in terms of state prioritization and allocation of resources
(Blaikie et al. 2004).

89
6.2.2 Jurisdictional Coordination at the Local Level
In the case of Hancock, Harrison and Jackson counties, one of the most
significant changes from the pre- to post-Katrina period is the transition from county
hazard mitigation plans to multijurisdictional mitigation plans. All of the current county
HMPs for the study area cover multiple jurisdictions. Some jurisdictions within a county
chose to opt out of the county’s multijurisdictional plan in order to create their own
HMPs due to differences in priorities. Multijurisdictional mitigation planning can be a
strong indication that there are increased coordination activities between the county and
its local districts (Carr 2007). This means that overlapping mitigation actions and
activities can be reduced based on jointly created plans.
6.2.3 Reporting of Loss Data and Hazard Modeling
In order to meet federal guidelines, the post-Katrina state and county HMPs made
substantial improvements in the reporting of losses section. The hazard modeling portion
of the state and county HMPs is also substantially improved in the post-Katrina period. In
the case of the state of Mississippi HMP, loss data on property damage and crop losses
originated from the National Climatic Data Center (NCDC) were incorporated into the
plan’s risk assessment of different hazards for each MEMA region. Similarly, Hancock,
Harrison and Jackson counties incorporated loss records obtained from NCDC for each
hazard in their probabilistic assessment of future occurrence. NCDC records are not as
spatially accurate as loss data from the SHELDUS which provides place-specific history
of losses (Gall et al. 2009).
The current state plan utilizes software like Digital Elevation Model, RiskMap
and Storm Surge Modeling to simulate storm surges and flooding, which were not present

90
in the 2004 State HMP, to complement HAZUS-MH modeling. Moreover, the current
state version includes worst-case-scenario assessments regarding exposure of population,
infrastructure and critical facilities. The worst-case-scenario for hurricanes utilizes
inundation levels and losses from Hurricane Katrina (500-Year-Event) to anticipate
shelter requirements, infrastructural exposure and damages and debris generation. As
well, at the county level, Hurricane Katrina exposed the vulnerability of both the social
system and the physical system. In the case of Hancock, Harrison, and Jackson counties,
impacts from Hurricane Katrina on critical infrastructure, buildings and vulnerable
population were considered in hurricane, storm surge, and flooding HAZUS-MH
scenarios.
6.2.4 Participation in the National Flood Insurance Program
In the post-Katrina period, there has been an increase in statewide participation in
the NFIP program. Hancock, Harrison and Jackson Counties extended NFIP coverage to
local jurisdictions and communities (Michel-Kerjan 2010). It is evident by the number of
projects covered by the NFIP. This increase in NFIP participation is also captured by the
flood insurance coverage metric. Furthermore, while there is some increase in the number
of Community Rating System (CRS) communities, it has not risen dramatically. Only ten
counties joined the CRS program in the post-Katrina period. Harrison and Jackson
counties along with some of their local jurisdictions have joined CRS in 2003 and 2011
respectively while Hancock County has not, although this is part of its future action
goals. This finding is consistent with current literature relating to low participation in the
CRS program, in part due to the voluntary nature of the program and land-use
development conflicts (Burby 2001; Landry and Li 2011)

91
6.2.5 Social Vulnerability Assessment
The pre-Katrina State and County HMP only contained brief mentions of
vulnerable populations. Assessment of social vulnerability in the post-Katrina period has
seen some improvements, particularly at the state level. The 2013 State HMP derives
socio-demographic variables from the Social Vulnerability Index, or SoVI, to identify
vulnerable populations and communities (Cutter et al. 2003). The results from social
vulnerability assessment are incorporated into mitigation actions. As part of their
mitigation goal, the state of Mississippi and Jackson County determined to conduct
public outreach to vulnerable populations such as the elderly, low-income and non-native
speakers. In contrast, instead of targeting certain population demographics, Hancock
County and Harrison counties have some mitigation actions related to reducing risk in
socially vulnerable communities. Systematic social vulnerability assessment should be
carried out in tandem with community outreach and educational programs (Pearce 2003;
Berke and Campanella 2008).
6.3 Suggested Improvements for BRIC Institutional Resilience Sub-Index and
Hazard Mitigation Planning
It is difficult to obtain evidence to validate BRIC, because it is a generalization of
certain aspect of on the ground reality. The quantitative evaluation of the BRIC IR sub-
index combined with qualitative analysis of hazard mitigation practices shed light on the
complexity of disaster resilience. The analysis of state and local HMPs provided
supplementary information and contextualization to the resilience metrics and indicators
regarding changes in institutional resilience pre- and post-Katrina.

92
6.3.1 Compatibility between BRIC’s Institutional Resilience Indicators and Hazard
Mitigation Practices
Six out of the ten institutional resilience indicators utilized in BRIC are found in
hazard mitigation plans. There are certain degrees of compatibility and incompatibility
between the resilience indicators and their respective presence in hazard mitigation plans.
For example, increase in mitigation spending contributes to higher overall IR scores for
the majority of Mississippi counties. Increased investment in mitigation activities can
also be seen in the substantial improvements in the pre- and post-Katrina plans. As well,
the expansion of flood insurance coverage results in an increase in the IR scores and the
post-Katrina HMPs. In the case of disaster aid experience, information regarding
presidential disaster declarations and loss-causing events were found in the HMPs,
although the ratio does not apply. In addition, the ratio does not differentiate the
difference in dollar amount between each loss event. In the future, the disaster aid
experience indicator should take in consideration the loss amounts. Another example of
compatibility can be found in local disaster training; however, the mentioning of CERT is
only present in some pre-and post-Katrina HMPs.
By comparison, jurisdictional coordination is measured by a ratio of the number
of governments and special districts per 10,000 people. This ratio is not present in the
mitigation plans, but the characteristics of jurisdictional coordination, as suggested by the
extant academic literature, can be found in terms of multi-jurisdictional mitigation
planning. An alternative metric that can perhaps capture jurisdictional coordination is a
binary variable recording presence or absence of multi-jurisdictional plan. Moreover, one
could also count the number of jurisdictions covered by a multiple-jurisdictional plan.

93
The more jurisdictions there are participating in a jointly created plan, the more
coordination between a county and its local districts.
Furthermore, in the case of the study area, the population stability indicator did
not capture the immediate population loss during Hurricane Katrina because it measures
the population change every five years. Since the first two years post-disaster is an
important period for displaced communities to return and rebuild, this indicator fails to
capture the significance of post-disaster population displacement. This observation,
however, does not negate that the need for calculating population stability. Within the
scope of this research, this BRIC IR indicator has limited utility. In order to improve
measurement of population stability, especially for heavy impacted areas in the post-
Katrina context, instead of measuring population change by a five-year increment, it
could be measured every one to two years. Population stability can be calculated by using
Special Population Estimates for Impacted Counties in the Gulf Coast area or the 2005
American Community Survey Special Product for the Gulf Coast Area (Frey and Singer
2006).
Finally, the performance regime indicators, based on their theoretical orientation
are not applicable to the qualitative analysis. None of the HMPs mention the benefits of
having its county seat near a metropolitan statistical area or close proximity to the capital.
This does not mean that these indicators are useless. An alternative way to measure the
advantage of being close to the capital is looking into State HMP to see which county
representatives were consulted during the planning process (Blaikie et al. 2004). For
example, the indicator of the first performance regime (e.g. proximity of county seat to
capital) for Hancock, Harrison and Jackson Counties indicate that these counties are

94
located relatively far from the capital. However, an in-depth assessment of the State HMP
shows that the emergency representatives from only four counties were present during the
planning process. These counties include Hancock, Harrison, Jackson, and DeSoto. As
such, long distance between the county seat and the capital does not mean that there is
less communication between county and state representatives.
6.3.2 Suggested Improvements in Hazard Mitigation Plans
In the case of State and Local HMPs, there are some areas that could be
improved. First, the 2013 State of Mississippi HMP uses SHELDUS data for its inflation
adjustment property only for tornadoes. As for the rest of the hazards, the loss-causing
event data comes from NCDC, which is not adjusted for inflation. In the case of the tri-
county study area, none of the HMPs use inflation-adjusted data. As such, using the best
available and most accurate data are important to enhancing institutional resilience.
Losses that occurred ten to twenty years earlier are different in terms of monetary
amounts to losses experienced in the present or recent past. In the future, the state and
counties should use inflation adjusted loss data (Gall et al. 2009).
Systematic and standardized social vulnerability assessment was included in the
2013 State HMP, but this has not trickled down to the counties. This form of assessment
should parallel physical assessments to reduce not only losses in property but also in
lives. Socially vulnerable populations, who are not only at-risk in terms of exposure but
also response and recovery, should be considered in mitigation actions (Pearce 2003).
Lastly, although the HMPs take population stability into consideration, they do not
incorporate potential population surges or losses into worst-case-scenario planning. An
unexpected surge in population can overwhelm the ability of institutions to manage crises

95
(Sherrieb et al. 2010). Dramatic population loss can affect tax bases and upkeep of
critical facilities. These should be factored into state and county probabilistic scenarios.
6.3.3 Suggested Institutional Indicators Outside of the BRIC Institutional Resilience
Sub-Index
The analysis of state and local hazard mitigation plans yield useful insights
regarding additional indicators for the BRIC institutional resilience sub-index.
Institutional resilience can be measured by conducting a longitudinal assessment on the
reduction of repetitive loss properties. They are defined as any property for which four or
more flood insurance claims of more than $1,000 have been paid within any rolling ten-
year-period since Jan 1, 1978 (FEMA 2011). State and local governments track and
FEMA track repetitive loss properties. Data for this indicator can be requested from
FEMA’s BureauNet (FEMA 2011).
Another potential measurement of institutional resilience is the number of
approved Emergency Action Plans at the county level. Emergency Action Plans are
designed to minimize or mitigate the impacts of potential dam or levee failures. They are
also applicable in the case of nuclear power plants, coal mining, oil production plants,
refineries (Binder 2002). Within the context of BRIC index, the number of EAPs should
be examined for dams and levees, which are vulnerable to excessive flooding,
earthquakes, and other hazards. Similar to the nuclear accident planning, this indicator,
which assesses the number of EAPs per county, should incorporate nearby population
centers into consideration (Walh 1997). Data can be acquired via the state Department of
Environmental Quality or other departments that are in charge of regulating dam safety.

96
6.4 Institutional Resilience: For Whom? To What?
As presented in the literature review section, the definition of resilience is
contested among scholars from various disciplines. In addition, there is no agreed upon
definition for institutional resilience. Some perceive institutional resilience as an over-
arching force and a causal agent that influences multiple facets of resilience (i.e. social,
economic, infrastructural, and ecological) while others frame it as a component of a
resilient system, paralleling economic, social, infrastructural, community capital, and
ecological resilience (Adger 2000; Cutter et al. 2008b). In this study, institutional
resilience is associated with the latter framing. Here I propose to define it based on the
observations that were made in the research and analysis process. Institutional resilience
can be defined as the ability of governance organizations, which are made up of
government agencies, community groups, non-profits, private sector and other actors
involved in the emergency management process, to minimize disruptions, respond, and
recover from disaster through effective and proactive coordination, communication, and
planning. Similar to other aspects of system resilience, it also means the ability to
incorporate continuous learning from past disasters and recovery challenges such that
organizations and institutions can adapt and be more prepared for future shocks and
disruptions. Moreover, institutional resilience goes beyond sustaining physical structures
but also involving vulnerable and at-risk populations in the planning process through
outreach and educational programs.
6.5 Theoretical Contribution: Operationalizing the DROP Model
The Disaster Resilience of Place (DROP) Model in Figure 2.1 illustrates the
schematic representation of disaster resilience. The BRIC indicators are selected and
97
designed to measure inherent resilience, which are characteristics of the system that
function well during non-crisis periods (Cutter et al. 2003; Cutter et al. 2014b). In
examining the effect of Hurricane Katrina on the institutional resilience on the state of
Mississippi and its coastal areas, it is evident that some indicators of institutional
resilience sub-indexes could be classified to measure adaptive resilience. Mitigation
spending and flood insurance coverage have increased significantly in the post-disaster
period. The state also significantly expanded its flood insurance participation. These
findings were found in the institutional resilience metrics and the state and local hazard
mitigation plans.
Comparison of the pre- and post-Katrina HMPs indicate that there are
characteristics of social learning in terms of social vulnerability assessment, hazard
modeling, hazard classification and ranking, participation in the NFIP program, and
multi-level jurisdictional coordination. Social learning “occurs when beneficial
impromptu actions are formalized into institutional policy for handling future events”
(Cutter et al. 2003, 603). Lessons learned from Katrina were incorporated in the updated
version of both state and local HMPs to improve preparedness activities and policy
decisions regarding land-use planning, building codes, zoning and structural buyouts.
These post-disaster lessons are fed back into the next phase mitigation planning, and as
such social learning from the previous disaster experience strengthen the inherent
resilience characteristics, from which a community can become more resilient as it
prepares for future disruptive events.
Identification of adaptive resilience indicators can help inform the disaster
policymaking process. As observed in the BRIC IR sub-index and HMPs, indicators such

98
as mitigation spending and flood insurance coverage are part of actionable policy
decisions. These indicators are the drivers of institutional resilience in the context of
Mississippi. More future work is needed to identify adaptive resilience indicators in other
sub-indices such as social, economic, infrastructural, community capital, and ecological
factors.
6.6 Future Research
Due to the difficulty in acquiring HMPs at different temporal settings, other types
of plans such as pre-disaster, recovery, comprehensive and emergency plans were not
considered in this research. Frazier et al. (2013) find elements of institutional resilience
present in post-disaster redevelopment plans and comprehensive plans for Sarasota
County. Moreover, the authors also observe elements of social, economic, infrastructural
and community capital in these planning documents as well. This suggests that hazard
mitigation plans and other planning documents are useful in terms of evaluating different
aspects of resilience related to policy decision-making (Berke and Campanella 2008).
This study focuses on institutional resilience in the context of pre- and post-
Hurricane Katrina. Six of the indicators of the institutional sub-index were found in local
and state hazard mitigation plans. It would be useful to conduct a similar study centered
on a different type of disaster such as tornadoes, earthquakes, or droughts in other states
in the U.S. Alternatively, the BRIC index could be applied in the context of Hurricane
Katrina but using other sub-indices such as social, economic, infrastructural, community
capital, and environmental at the national and state scale. In addition, Hurricane Katrina
is shown to be influential in driving change in institutional resilience. It would also be
valuable to examine how institutional and other types of resilience indicators (i.e. social,

99
economic, infrastructural, community capital, and environmental) perform during periods
without a major disaster. Examination of the indicators and metrics in these sub-indices
and how they change over time can contribute to a holistic understanding of disaster
resilience.
Moreover, Hancock, Harrison and Jackson counties are economically and
politically important to the state. Representatives from the targeted coastal counties
directly participate in the hazard mitigation planning and decision-making process, as
compared to other counties in Mississippi. It would be useful to examine the HMPs from
the less economically developed and least populous counties and determine how they
coordinate with the state with regard to mitigation planning and how their institutional
resilience scores have changed before and after a disastrous event.
6.7 Conclusion
This study confirms that the BRIC institutional resilience sub-index is useful in
terms of evaluating the overall resilience of a community as well as to longitudinally
compare resilience before and after a disaster. Given that the overall BRIC score for each
county is a composite, Hurricane Katrina is an influential factor in driving the change in
both institutional resilience and overall system resilience. Application of the BRIC
institutional resilience sub-index reveals the effects of scaling and standardization and
how these processes can obscure significant contextual details. Replication of the sub-
index demonstrates that scaling and contextualization matter in terms of explaining the
utility of the resilience metrics and indicators. Scaling at the national level will yield
different BRIC scores along with different metrics for each indicator. In addition, it is

100
important to evaluate both the absolute and standardized data to holistically interpret the
BRIC results.
Evaluation of the state and local HMPs adds another level of contextualization to
explain the BRIC IR indicators as well provide useful insights into the disaster
governance structure of the state of Mississippi. At both state and local level, the hazard
mitigation plans are designed to meet the minimum federal requirements. Improvements
in mitigation practice from pre- and to post-Katrina period are a function increased
federal standards over time, even though there are various aspects initiated by the state
and local counties. Best planning practice means that planners and representatives going
beyond that what is required by the federal governments. Examples of these include the
participation of socially vulnerable groups in the decision-making process, incorporation
of inflation-adjusted loss data, addressing the issue of land-use in hazardous areas, and
integrating climate change adaptation into planning practices.
Mitigation has tremendous value to society in terms of safety, equity and
sustainability. Proactive mitigation planning helps create safer communities, reduce loss
of life and property damage, and allows individuals to minimize post-disaster disruptions
and recover more quickly (Godschalk 2003; Yoon et al. 2015). Resilience is a concept
and a practice that will become increasingly relevant in the future. Recently, the
Department of Housing and Urban Development launched a National Disaster Resilience
Competition to help affected communities recover from disasters and prepare to mitigate
risk. Personnel from federal agencies are partnering with universities, local governments,
and non-profit institutions, notably the Rockefeller Foundation, to design mitigation
strategies for different eligible communities. By using qualitative analysis to complement

101
quantitative findings as well as focusing on one specific aspect of resilience, the
methodological approach of this study can be reproduced for studying and improving
other facets of resilience indicators and metrics. This mixed-method approach seeks to
answer the research questions while concurrently working to bridge the conceptual
understanding between hazard research and practice.

102
REFERENCES
Acosta, J., Stern, S., Uscher-Pines, L., & Williams, M. V. (2011). Building community
resilience to disasters: a way forward to enhance national health security. Rand
Corporation.
Adger, W. N. (2000). Social and ecological resilience: are they related? Progress in
Human Geography, 24(3), 347–364.
Adger, W. N., Hughes, T. P., Folke, C., Carpenter, S. R., & Rockström, J. (2005). Social-
ecological resilience to coastal disasters. Science, 309(5737), 1036–1039.
Aguirre, B., Dynes, R. R., Kendra, J., & Connell, R. (2005). Institutional resilience and
disaster planning for new hazards: Insights from hospitals. Journal of Homeland
Security and Emergency Management, 2(2).
Ainuddin, S., & Routray, J. K. (2012). Earthquake hazards and community resilience in
Baluchistan. Natural Hazards, 63(2), 909–937.
Aldrich, D. P. (2012). Social, not physical, infrastructure: the critical role of civil society
after the 1923 Tokyo earthquake. Disasters, 36(3), 398–419.
Alexander, D. E. (2013). Resilience and disaster risk reduction: an etymological journey.
Natural Hazards and Earth System Science, 13(11), 2707–2716.
Ansell, C., Boin, A., & Keller, A. (2010). Managing transboundary crises: Identifying the
building blocks of an effective response system. Journal of Contingencies and
Crisis Management, 18(4), 195–207.
Babcock, M. (2013). State Hazard Mitigation Plans & Climate Change : Rating the
States. Columbia Law School: Center for Climate Law.Barthel, F., & Neumayer,
E. (2012). A trend analysis of normalized insured damage from natural disasters.
Climatic Change, 113(2), 215–237. http://doi.org/10.1007/s10584-011-0331-2
Bergstrand, K., Mayer, B., Brumback, B., & Zhang, Y. (2015). Assessing the
Relationship between Social Vulnerability and Community Resilience to Hazards.
Social Indicators Research, 1–19.
Berke, P., & Godschalk, D. (2009). Searching for the good plan: A meta-analysis of plan
quality studies. Journal of Planning Literature, 23(3), 227–240.

103
Berke, P., & Smith, G. (2009). Hazard mitigation, planning, and disaster resilience:
challenges and strategic choices for the 21st century. Building Safer Communities.
Risk Governance, Spatial Planning and Responses to Natural Hazards, 1–18.
Berke, P., Smith, G., & Lyles, W. (2012). Planning for resiliency: Evaluation of state
hazard mitigation plans under the disaster mitigation act. Natural Hazards
Review, 13(2), 139–149.
Berkes, F., & Ross, H. (2013). Community resilience: toward an integrated approach.
Society & Natural Resources, 26(1), 5–20.
Binder, D. (2002). Emergency Action Plans: A Legal and Practical Blueprint Failing to
Plan is Planning to Fail. University of Pittsburgh Law Review, 63, 791.
Birkland, T., & Waterman, S. (2008). Is Federalism the Reason for Policy Failure in
Hurricane Katrina? Publius: The Journal of Federalism, 38(4), 692–714.
doi:10.1093/publius/pjn020
Birkmann, J. (2006a). Indicators and criteria for measuring vulnerability: Theoretical
bases and requirements. Measuring vulnerability to natural hazards: Towards
disaster resilient societies. United Nations Univ., New York.
Birkmann, J. (2006b). Measuring vulnerability to promote disaster-resilient societies:
Conceptual frameworks and definitions, 9–54.
Birkmann, J. (2007). Risk and vulnerability indicators at different scales: applicability,
usefulness and policy implications. Environmental Hazards, 7(1), 20–31.
Blake, E. S., Kimberlain, T. B., Berg, R. J., Cangialosi, J. P., & Ii, J. L. B. (2013).
Tropical Cyclone Report: Hurricane Sandy.
Blake, E. S., & Landsea, C. W. (2011). The Deadliest, Costliest, and Most Intense United
States Tropical Cyclones from 1851 to 2010 (and Other Frequently Requested
Hurricane Facts). National Hurricane Center.
Blaikie, P., Cannon, T., Davis, I., & Wisner, B. (2004). At risk: natural hazards, people’s
vulnerability and disasters. Routledge.
Bonanno, G. A., Galea, S., Bucciarelli, A., & Vlahov, D. (2007). What predicts
psychological resilience after disaster? The role of demographics, resources, and
life stress. Journal of Consulting and Clinical Psychology, 75(5), 671.
Bruneau, M., Chang, S. E., Eguchi, R. T., Lee, G. C., O’Rourke, T. D., Reinhorn, A. M.,
… von Winterfeldt, D. (2003). A framework to quantitatively assess and enhance
the seismic resilience of communities. Earthquake Spectra, 19(4), 733–752.
104
Burby, R. J. (2001). Flood insurance and floodplain management: the US experience.
Global Environmental Change Part B: Environmental Hazards, 3(3), 111–122.
Burby, R. J., Deyle, R. E., Godschalk, D. R., & Olshansky, R. B. (2000). Creating hazard
resilient communities through land-use planning. Natural Hazards Review, 1(2),
99–106.
Butler, L. D., Morland, L. A., & Leskin, G. A. (2007). Psychological resilience in the
face of terrorism. Psychology of Terrorism, 400–417.
Burton, C. G. (2015). A Validation of Metrics for Community Resilience to Natural
Hazards and Disasters Using the Recovery from Hurricane Katrina as a Case
Study. Annals of the Association of American Geographers, 105(1), 67–86.
Carr, T. L. (2007). A Study of Local Governments Participating in the Pre-Disaster
Mitigation (PDM) Program and Populations Served. Journal of Homeland
Security and Emergency Management, 4(2). doi:10.2202/1547-7355.1258
Carreño, M. L., Cardona, O. D., & Barbat, A. H. (2007). A disaster risk management
performance index. Natural Hazards, 41(1), 1–20.
Chamlee‐Wright, E., & Storr, V. H. (2011). Social capital as collective narratives and
post‐disaster community recovery. The Sociological Review, 59(2), 266–282.
Chang, S. E. (2003). Evaluating disaster mitigations: methodology for urban
infrastructure systems. Natural Hazards Review, 4(4), 186–196.
Chang, S. E. (2014). Infrastructure resilience to disasters. The Bridge, 44(3).
Chang, S. E., & Shinozuka, M. (2004). Measuring improvements in the disaster resilience
of communities. Earthquake Spectra, 20(3), 739–755.
Chenoweth, L., & Stehlik, D. (2001). Building resilient communities: Social work
practice and rural Queensland. Australian Social Work, 54(2), 47–54.
Cheong, S.-M. (2011). Policy solutions in the US. Climatic Change, 106(1), 57–70.
Coles, E., & Buckle, P. (2004). Developing community resilience as a foundation for
effective disaster recovery.
Comfort, L., Wisner, B., Cutter, S., Pulwarty, R., Hewitt, K., Oliver-Smith, A., Wiener,
J., et al. (1999). Reframing disaster policy: the global evolution of vulnerable
communities. Global Environmental Change Part B: Environmental Hazards,
1(1), 39–44.

105
Cox, R. S., & Perry, K.-M. E. (2011). Like a fish out of water: Reconsidering disaster
recovery and the role of place and social capital in community disaster resilience.
American Journal of Community Psychology, 48(3-4), 395–411.
Cutter, S. L., Ahearn, J. A., Amadei, B., Crawford, P., Eide, E. A., Galloway, G. E., …
Schoch-Spana, M. (2013). Disaster resilience: A national imperative.
Environment: Science and Policy for Sustainable Development, 55(2), 25–29.
Cutter, S. L., Ash, K. D., & Emrich, C. T. (2014b). The geographies of community
disaster resilience. Global Environmental Change, 29, 65–77.
Cutter, S. L., Boruff, B. J., & Shirley, W. L. (2003). Social vulnerability to environmental
hazards*. Social Science Quarterly, 84(2), 242–261.
Cutter, S. L., Burton, C. G., & Emrich, C. T. (2010). Disaster resilience indicators for
benchmarking baseline conditions. Journal of Homeland Security and Emergency
Management, 7(1).
Cutter, S.L., L. Barnes, M. B., Burton C.B., Evans E., Tate E.C. and Webb. J. (2008a).
"Community and Regional Resilience: Perspectives from Hazards, Disasters, and
Emergency Management." CARRI Research Report 1. Oak Ridge: Community
and Regional Resilience Institute.
http://www.resilientus.org/library/FINAL_CUTTER_9-25-08_1223482309.pdf
Cutter, S. L., Barnes, L., Berry, M., Burton, C., Evans, E., Tate, E., & Webb, J. (2008b).
A place-based model for understanding community resilience to natural disasters.
Global Environmental Change, 18(4), 598–606.
Cutter, S. L., & Emrich, C. (2005). Are natural hazards and disaster losses in the U.S.
increasing? Eos, Transactions American Geophysical Union, 86(41), 381.
http://doi.org/10.1029/2005EO410001
Cutter, S. L., Emrich, C. T., Mitchell, J. T., Boruff, B. J., Gall, M., Schmidtlein, M. C., …
Melton, G. (2006). The Long Road Home: Race, Class, and Recovery from
Hurricane Katrina. Environment: Science and Policy for Sustainable
Development, 48(2), 8–20. http://doi.org/10.3200/ENVT.48.2.8-20
Cutter, S., Emrich, C. T., Mitchell, J. T., Piegorsch, W. W., Smith, M. M., & Weber, L.
(2014a). Hurricane Katrina and the Forgotten Coast of Mississippi. Cambridge
University Press.
Day, J. W., Boesch, D. F., Clairain, E. J., Kemp, G. P., Laska, S. B., Mitsch, W. J., …
Shabman, L. (2007). Restoration of the Mississippi Delta: lessons from hurricanes
Katrina and Rita. Science, 315(5819), 1679–1684.

106
Djalante, R., & Thomalla, F. (2011). Community resilience to natural hazards and climate
change impacts: a review of definitions and operational frameworks. Asian J
Environ Disaster Manag, 3(3), 339–355.
Duxbury, J., & Dickinson, S. (2007). Principles for sustainable governance of the coastal
zone: in the context of coastal disasters. Ecological Economics, 63(2), 319–330.
Engle, N. L. (2011). Adaptive capacity and its assessment. Global Environmental
Change, 21(2), 647–656.
Esnard, A.-M., Sapat, A., & Mitsova, D. (2011). An index of relative displacement risk to
hurricanes. Natural Hazards, 59(2), 833–859.
Evans-Cowley, J. S., & Gough, M. Z. (2008). Evaluating environmental protection in
post-Hurricane Katrina plans in Mississippi. Journal of Environmental Planning
and Management, 51(3), 399–419.
Federal Emergency Management Agency. (2000). Multi-hazard Mitigation Planning
Guidance under the Disaster Mitigation Act of 2000. Washington, DC: U.S.
Government Printing Office, 2008.
Federal Emergency Management Agency. (2008). The National Mitigation Data
Collection Tool and RLP Viewer. Washington, DC: U.S. Government Printing
Office
Federal Emergency Management Agency (FEMA). (2013). The Stafford Act: Robert T.
Stafford Disaster Relief and Emergency Assistance Act, as Amended. Department
of Homeland Security.
Federal Emergency Management Agency. (2015a). Mississippi Recovery Office.
Department of Homeland Security.
Federal Emergency Management Agency. (2015b). State Mitigation Plan Review Guide.
Department of Homeland Security
Federal Emergency Management Agency. (2015c). Community Emergency Response
Teams. Retrieved from https://www.fema.gov/community-emergency-response-
teams
Fekete, A. (2009). Validation of a social vulnerability index in context to river-floods in
Germany. Natural Hazards and Earth System Sciences, 9, 393–403.
Folke, C. (2006). Resilience: the emergence of a perspective for social–ecological
systems analyses. Global Environmental Change, 16(3), 253–267.

107
Frazier, T. G., Thompson, C. M., Dezzani, R. J., & Butsick, D. (2013). Spatial and
temporal quantification of resilience at the community scale. Applied Geography,
42, 95–107.
Frey, W. H., & Singer, A. (2006). Katrina and Rita impacts on gulf coast populations:
First census findings. Brookings Institution, Metropolitan Policy Program
Washington.
Gall, M., Borden, K. a., & Cutter, S. L. (2009). When Do Losses Count? Bulletin of the
American Meteorological Society, 90(6), 799–809.
doi:10.1175/2008BAMS2721.1
Ganor, M., & Ben-Lavy, Y. (2003). Community resilience: Lessons derived from Gilo
under fire. Journal of Jewish Communal Service, 79(2/3), 105–108.
Glauber, J. W., Collins, K. J., & Barry, P. J. (2002). Crop insurance, disaster assistance,
and the role of the federal government in providing catastrophic risk protection.
Agricultural Finance Review, 62(2), 81–101.
Godschalk, D. R. (2003). Urban hazard mitigation: creating resilient cities. Natural
Hazards Review, 4(3), 136–143.
Godschalk, D. R., Rose, A., Mittler, E., Porter, K., & West, C. T. (2009). Estimating the
value of foresight: aggregate analysis of natural hazard mitigation benefits and
costs. Journal of Environmental Planning and Management, 52(6), 739–756.
Hallegatte, S., Green, C., Nicholls, R. J., & Corfee-Morlot, J. (2013). Future flood losses
in major coastal cities. Nature Climate Change, 3(9), 802–806.
Hassett, W. L., & Handley, D. M. (2006). Hurricane Katrina Mississippi’s Response.
Public Works Management & Policy, 10(4), 295–305.
Hassink, R. (2010). Regional resilience: a promising concept to explain differences in
regional economic adaptability? Cambridge Journal of Regions, Economy and
Society, 3(1), 45–58.
Holling, C. S. (1973). Resilience and stability of ecological systems. Annual Review of
Ecology and Systematics, 1–23.
Hori, M., Schafer, M. J., & Bowman, D. J. (2009). Displacement dynamics in southern
Louisiana after Hurricanes Katrina and Rita. Population research and policy
review, 28(1), 45–65.
Intergovernmental Panel on Climate Change (IPCC). (2012). Managing the risks of
extreme events and disasters to advance climate change adaptation. A Special

108
Report of Working Groups I and II of the Intergovernmental Panel on Climate
Change. http://doi.org/10.1017/CBO9781139177245
Joerin, J., & Shaw, R. (2011). Mapping climate and disaster resilience in cities. Climate
and Disaster Resilience in Local Governments, 47–61.
Keck, M., & Sakdapolrak, P. (2013). What is social resilience? Lessons learned and ways
forward. Erdkunde, 5–19.
Klein, R. J. T., Nicholls, R. J., & Thomalla, F. (2003a). Resilience to natural hazards:
How useful is this concept? Global Environmental Change Part B:
Environmental Hazards, 5(1), 35–45.
Klein, R. J. T., Nicholls, R. J., & Thomalla, F. (2003b). The resilience of coastal
megacities to weather-related hazards. Building Safer Cities, 101–120.
Kupfer, J. A., Myers, A. T., McLane, S. E., & Melton, G. N. (2008). Patterns of forest
damage in a southern Mississippi landscape caused by Hurricane Katrina.
Ecosystems, 11(1), 45–60.
Kunreuther, H. (2006). Disaster mitigation and insurance: Learning from Katrina. The
Annals of the American Academy of Political and Social Science, 604(1), 208–
227.
Kusumastuti, R. D., Husodo, Z. A., Suardi, L., & Danarsari, D. N. (2014). Developing a
resilience index towards natural disasters in Indonesia. International Journal of
Disaster Risk Reduction, 10, 327–340.
Landry, C. E., & Li, J. (2011). Participation in the community rating system of NFIP:
Empirical analysis of North Carolina counties. Natural Hazards Review, 13(3),
205–220.
Nance, E. (2009). Responding to Risk: The Making of Hazard Mitigation Strategy in
Post-Katrina New Orleans. Journal of Contemporary Water Research &
Education, (141), 21–30.
National Oceanic and Atmospheric Administration. (2015). Gulf of Mexico Data Atlas.
Retrieved November 7, 2015, from
http://www.ncddc.noaa.gov/website/DataAtlas/atlas.htm
National Preparedness Goal. (2011). Department of Homeland Security. Retrieved from
http://www.fema.gov/library/viewRecord.do?fromSearch=fromsearch&id=5689\n
papers2://publication/uuid/26A8CB51-B875-46FC-9BFD-0A0C89280F30\
Magis, K. (2010). Community resilience: An indicator of social sustainability. Society
and Natural Resources, 23(5), 401–416.

109
Manuel, J. (2013). The Long Road to Recovery. Environmental Health Perspectives,
121(5), A152–9.
Manyena, S. B. (2006). The concept of resilience revisited. Disasters, 30(4), 434–450.
Manyena, S. B. (2014). Disaster resilience: A question of “multiple faces” and “multiple
spaces”? International Journal of Disaster Risk Reduction, 8, 1–9.
Manyena, S. B., O’Brien, G., O’Keefe, P., & Rose, J. (2011). Disaster resilience: A
bounce back or bounce forward ability. Local Environment, 16(5), 417–424.
Mayunga, J. S. (2007). Understanding and Applying the Concept of Community Disaster
Resilience : A capital-based approach. Summer Academy for Social Vulnerability
and Resilience Building, (July), 22–28.
Martinelli, D., Cimellaro, G. P., & Renschler, C. S. (2014). Quantification of the
Economic Resilience from the Community Level to the Individual Business
Level: The Bay Area Case Study. In Proceedings of the Structures Congress
2014.
McAllister, T. (2013). NIST Technical Note 1975: Developing Guidelines and Standards
for Disaster Resilience of the Built Environment: A Research Needs Assessment
(pp. 1–142). Department of Commerce: National Institute of Standards and
Technology.
McDaniels, T., Chang, S., Cole, D., Mikawoz, J., & Longstaff, H. (2008). Fostering
resilience to extreme events within infrastructure systems: Characterizing decision
contexts for mitigation and adaptation. Global Environmental Change, 18(2),
310–318.
McDaniels, T. L., Chang, S. E., Hawkins, D., Chew, G., & Longstaff, H. (2015).
Towards disaster-resilient cities: an approach for setting priorities in infrastructure
mitigation efforts. Environment Systems and Decisions, 1–12.
Mcgranahan, D. A., & Beale, C. L. (2002). Understanding Rural Population Loss. Rural
America, 17(4), 2–11.
Measham, T. G., Preston, B. L., Smith, T. F., Brooke, C., Gorddard, R., Withycombe, G.,
& Morrison, C. (2011). Adapting to climate change through local municipal
planning: barriers and challenges. Mitigation and Adaptation Strategies for
Global Change, 16(8), 889-909.
Michel-Kerjan, E. O. (2010). Catastrophe economics: the national flood insurance
program. The Journal of Economic Perspectives, 165–186.

110
Michel-Kerjan, E., Lemoyne de Forges, S., & Kunreuther, H. (2012). Policy Tenure
Under the U.S. National Flood Insurance Program (NFIP). Risk Analysis, 32(4),
644–658. http://doi.org/10.1111/j.1539-6924.2011.01671.x
Miles, S. B., & Chang, S. E. (2011). ResilUS: a community based disaster resilience
model. Cartography and Geographic Information Science, 38(1), 36–51.
Mileti, D. (1999). Disasters by Design: A Reassessment of Natural Hazards in the United
States. Joseph Henry Press.
Mitchell, J. K. (2006a). The primacy of partnership: Scoping a new national disaster
recovery policy. The ANNALS of the American Academy of Political and Social
Science, 604(1), 228–255.
Mitchell, J. T. (2006b). Hurricane Katrina and Mississippi’s “Invisible Coast”: A
Photographic Journal. Southeastern Geographer, 46(2), 181–188.
MMC (Multi-hazard Mitigation Council) (2005). Natural hazard mitigation saves: An
independent study to assess the future savings from mitigation activities. National
Institute of Building Sciences, Washington, DC.
Morrow, B. (2008). Community resilience: A social justice perspective. CARRI Research
Report Oak Ridge, TN.
Morton, M. J., & Lurie, N. (2013). Community resilience and public health practice.
American Journal of Public Health, 103(7), 1158–1160.
Murphy, B. L. (2007). Locating social capital in resilient community-level emergency
management. Natural Hazards, 41(2), 297–315.
Nakagawa, Y., & Shaw, R. (2004). Social capital: A missing link to disaster recovery.
International Journal of Mass Emergencies and Disasters, 22(1), 5–34.
Norris, F. H., Stevens, S. P., Pfefferbaum, B., Wyche, K. F., & Pfefferbaum, R. L.
(2008). Community resilience as a metaphor, theory, set of capacities, and
strategy for disaster readiness. American Journal of Community Psychology,
41(1-2), 127–150.
Orencio, P. M. (2014). Developing and applying composite indicators for assessing and
characterizing vulnerability and resilience of coastal communities to
environmental and social change. Hokkaido University.
Orencio, P. M., & Fujii, M. (2013). A localized disaster-resilience index to assess coastal
communities based on an analytic hierarchy process (AHP). International Journal
of Disaster Risk Reduction, 3, 62–75.

111
Paton, D. (2006). Disaster resilience: integrating individual, community, institutional and
environmental perspectives. Disaster Resilience: An Integrated Approach, 320.
Paton, D., Smith, L., & Violanti, J. (2000). Disaster response: risk, vulnerability and
resilience. Disaster Prevention and Management: An International Journal, 9(3),
173–180.
Pearce, L. (2003). Disaster Management and Community Planning, and Public
Participation : How to Achieve Sustainable Hazard Mitigation. Natural Hazards,
(28), 211–228.
Plough, A., Fielding, J. E., Chandra, A., Williams, M., Eisenman, D., Wells, K. B. …
Magaña, A. (2013). Building community disaster resilience: perspectives from a
large urban county department of public health. American Journal of Public
Health, 103(7), 1190–1197.
Preston, B. L. (2013). Local path dependence of U.S. socioeconomic exposure to climate
extremes and the vulnerability commitment. Global Environmental Change,
23(4), 719–732. http://doi.org/10.1016/j.gloenvcha.2013.02.009
Reeves, A. (2011). Political Disaster: Unilateral Powers, Electoral Incentives, and
Presidential Disaster Declarations. The Journal of Politics, 73(04), 1142–1151.
Renschler, C. S., Frazier, A., Arendt, L., Cimellaro, G.-P., Reinhorn, A. M., & Bruneau,
M. (2010a). A framework for defining and measuring resilience at the community
scale: The PEOPLES resilience framework. MCEER.
Renschler, C. S., Frazier, A. E., Arendt, L. A., Cimellaro, G. P., Reinhorn, A. M., &
Bruneau, M. (2010b). Developing the “PEOPLES” resilience framework for
defining and measuring disaster resilience at the community scale. In Proceedings
of the 9th US national and 10th Canadian conference on earthquake engineering
(9USN/10CCEE), Toronto (pp. 25–29).
Rogers, C. D. F., Bouch, C. J., Williams, S., Barber, A. R. G., Baker, C. J., Bryson, J. R.,
… Jefferson, I. (2012). Resistance and resilience–paradigms for critical local
infrastructure. Proceedings of the ICE-Municipal Engineer, 165(2), 73–83.
Rose, A. (2004). Defining and measuring economic resilience to disasters. Disaster
Prevention and Management: An International Journal, 13(4), 307–314.
Rose, A. (2007). Economic resilience to natural and man-made disasters:
Multidisciplinary origins and contextual dimensions. Environmental Hazards,
7(4), 383–398.

112
Rose, A., & Krausmann, E. (2013). An economic framework for the development of a
resilience index for business recovery. International Journal of Disaster Risk
Reduction, 5, 73–83.
Sherrieb, K., Norris, F. H., & Galea, S. (2010). Measuring capacities for community
resilience. Social Indicators Research, 99(2), 227–247.
Simmie, J., & Martin, R. (2010). The economic resilience of regions: towards an
evolutionary approach. Cambridge Journal of Regions, Economy and Society,
3(1), 27–43.
Simonovich, J., & Sharabi, M. (2013). Dealing with environmental disaster: the
intervention of Community Emergency Teams (CET) in the 2010 Israeli forest
fire disaster. Journal of Sustainable Development, 6(2), p86.
Singh-Peterson, L., Salmon, P., Goode, N., & Gallina, J. (2014). Translation and
evaluation of the baseline resilience Indicators for Communities on the sunshine
coast, Queensland Australia. International Journal of Disaster Risk Reduction,
10, 116–126.
Smit, B., & Wandel, J. (2006). Adaptation, adaptive capacity and vulnerability. Global
Environmental Change, 16(3), 282–292.
Smith, G. (2012). Planning for post-disaster recovery: A review of the United States
disaster assistance framework. Island Press.
Steven Picou, J., & Hudson, K. (2010). Hurricane Katrina and Mental Health: A
Research Note on Mississippi Gulf Coast Residents*. Sociological Inquiry, 80(3),
513–524.
Tate, E. (2012). Social vulnerability indices: a comparative assessment using uncertainty
and sensitivity analysis. Natural Hazards, 63(2), 325–347.
Tidball, K., & Stedman, R. (2013). Positive dependency and virtuous cycles: From
resource dependence to resilience in urban social-ecological systems. Ecological
Economics, 86, 292–299.
Tierney, K. (2012). Disaster governance: social, political, and economic dimensions.
Annual Review of Environment and Resources, 37, 341–363.
Timmerman, P. (1981). A Review of Models and Possible Climatic Applications:
Vulnerability resilience and collapse of Society. Institute for Environmental
Studies, University of Toronto.
Twigg, J. (2009). Characteristics of a Disaster-Resilient Community.

113
United States National Research Council (NRC) (2012). Disaster Resilience: A National
Imperative. The National Academies Press, Washington, DC
UNISDR. (2009). UNISDR Terminoology on Disaster Risk Reduction. International
Stratergy for Disaster Reduction (ISDR), 1–30. Retrieved from
www.unisdr.org/publications
Wahl, T. L. (1997). Predicting embankment dam breach parameters-A needs assessment.
In Proceedings of the Congress- International Association for Hydraulic Reearch
(pp. 48–53). Local Organizing Committee of the XXV Congress.
Walsh, F. (2007). Traumatic loss and major disasters: Strengthening family and
community resilience. Family Process, 46(2), 207–227.
Waple, A. (2005). Hurricane Katrina. NOAA’s National Climatic Data Center.
Wells, K. B., Tang, J., Lizaola, E., Jones, F., Brown, A., Stayton, A., … Fogleman, S.
(2013). Applying community engagement to disaster planning: developing the
vision and design for the Los Angeles County Community Disaster Resilience
initiative. American Journal of Public Health, 103(7), 1172–1180.
Wildavsky, A. (1994). Accounting for the environment. Accounting, Organizations and
Society, 19(4), 461–481.
Yoon, D. K., Kang, J. E., & Brody, S. D. (2015). A measurement of community disaster
resilience in Korea. Journal of Environmental Planning and Management,
(ahead-of-print), 1–25.
Zhou, H., Wan, J., & Jia, H. (2010). Resilience to natural hazards: a geographic
perspective. Natural Hazards, 53(1), 21–41.
114
APPENDIX A: BRIC INSITITUTIONAL RESILIENCE SCORES FOR
EIGHTY-TWO COUNTIES IN MISSISSIPPI
This appendix features the composite BRIC institutional resilience (IR) scores of
eighty-two counties in Mississippi, aggregated at the state scale, for 2000 and 2010. Each
county is ranked based on its IR score, which ranges from 0 to 10, with each unit
increased indicating more resilience. Table A.1 and A.2 contain detailed breakdown of
the standardized values of the IR indicators, which range from 0 to 1, with each unit
increased indicating more resilience.

115
Table A.1: Breakdowns of BRIC institutional resilience scores and metrics (standardized values) for eighty-two counties in
Mississippi in 2000, aggregated at state scale (n=82)
Rank County
IR
Score
2000
Mitigation
Spending
Flood
Insurance
Coverage
Jurisdiction
Coord
Disaster
Aid
Exp
Disaster
Training
Near
State
Capital
Near
MSA
Population
Stability
Nuclear
Planning
Crop
Insurance
Coverage
43 Adams 3.26 0.01 0.01 0.91 0.40 0.00 0.62 0.33 0.94 0.00 0.04
67 Alcorn 2.72 0.03 0.01 0.80 0.27 0.00 0.01 0.55 0.88 0.00 0.16
39 Amite 3.33 0.00 0.01 0.82 0.22 0.00 0.61 0.71 0.95 0.00 0.01
53 Attala 3.09 0.02 0.01 0.67 0.23 0.00 0.74 0.50 0.89 0.00 0.03
78 Benton 2.47 0.00 0.00 0.27 0.18 0.00 0.11 0.81 0.99 0.00 0.12
62 Bolivar 2.84 0.05 0.11 0.28 0.13 0.00 0.52 0.21 0.88 0.00 0.65
69 Calhoun 2.66 0.00 0.03 0.34 0.26 0.00 0.43 0.28 1.00 0.00 0.32
58 Carroll 2.97 0.00 0.01 0.65 0.32 0.00 0.67 0.34 0.83 0.00 0.15
77 Chickasaw 2.49 0.00 0.01 0.63 0.11 0.00 0.40 0.18 0.92 0.00 0.25
73 Choctaw 2.60 0.00 0.01 0.60 0.42 0.00 0.60 0.14 0.81 0.00 0.01
3 Claiborne 4.53 0.00 0.07 0.84 0.20 0.00 0.80 0.57 1.00 1.00 0.05
61 Clarke 2.88 0.00 0.08 0.67 0.32 0.00 0.63 0.26 0.92 0.00 0.01
56 Clay 3.05 0.01 0.09 0.85 0.37 0.00 0.42 0.17 0.97 0.00 0.17
32 Coahoma 3.42 0.01 0.06 0.50 0.38 0.00 0.37 0.56 0.91 0.00 0.62
13 Copiah 3.85 0.00 0.02 0.79 0.21 0.00 0.89 1.00 0.93 0.00 0.02
30 Covington 3.54 0.00 0.03 0.86 0.54 0.00 0.76 0.66 0.66 0.00 0.03
70 DeSoto 2.65 0.00 0.04 0.96 0.35 0.00 0.16 1.00 0.00 0.00 0.13
26 Forrest 3.61 0.00 0.15 0.91 0.00 0.00 0.63 1.00 0.92 0.00 0.00
21 Franklin 3.70 0.00 0.00 0.61 0.93 0.00 0.70 0.51 0.94 0.00 0.01
42 George 3.28 0.00 0.06 0.89 0.22 0.00 0.38 1.00 0.68 0.00 0.04
49 Greene 3.19 0.00 0.05 0.82 0.48 0.00 0.43 0.80 0.59 0.00 0.01
7 Grenada 4.23 1.00 0.13 0.89 0.35 0.00 0.52 0.25 0.90 0.00 0.18
8 Hancock 3.96 0.01 1.00 0.76 0.38 0.00 0.31 1.00 0.50 0.00 0.00
4 Harrison 4.47 0.54 0.57 0.97 0.25 0.00 0.30 1.00 0.84 0.00 0.00
6 Hinds 4.41 0.01 0.24 1.00 0.15 0.00 0.99 1.00 0.98 0.00 0.05
44 Holmes 3.26 0.00 0.04 0.62 0.13 0.00 0.77 0.56 0.96 0.00 0.18
14 Humphreys 3.84 0.24 0.24 0.44 0.27 0.00 0.73 0.41 0.93 0.00 0.58
115

116
Rank County
IR
Score
2000
Mitigation
Spending
Flood
Insurance
Coverage
Jurisdiction
Coord
Disaster
Aid
Exp
Disaster
Training
Near
State
Capital
Near
MSA
Population
Stability
Nuclear
Planning
Crop
Insurance
Coverage
18 Issaquena 3.72 0.00 0.79 0.50 0.48 0.00 0.73 0.29 0.49 0.00 0.44
80 Itawamba 2.45 0.05 0.01 0.78 0.13 0.00 0.19 0.37 0.80 0.00 0.11
10 Jackson 3.88 0.02 0.53 0.96 0.27 0.00 0.22 1.00 0.86 0.00 0.01
38 Jasper 3.34 0.00 0.00 0.74 0.38 0.00 0.78 0.59 0.85 0.00 0.00
34 Jefferson 3.39 0.00 0.01 0.73 0.53 0.00 0.73 0.51 0.80 0.03 0.05
23 Jefferson
Davis 3.65 0.00 0.00 0.69 0.53 0.00 0.79 0.68 0.94 0.00 0.01
35 Jones 3.38 0.00 0.06 0.89 0.14 0.00 0.68 0.66 0.93 0.00 0.01
51 Kemper 3.15 0.00 0.00 0.63 0.46 0.00 0.59 0.46 1.00 0.00 0.00
68 Lafayette 2.67 0.00 0.01 0.88 0.18 0.00 0.30 0.65 0.60 0.00 0.06
54 Lamar 3.08 0.02 0.04 0.85 0.16 0.00 0.59 1.00 0.41 0.00 0.01
55 Lauderdale 3.06 0.00 0.08 0.97 0.09 0.00 0.63 0.29 1.00 0.00 0.00
20 Lawrence 3.70 0.00 0.04 0.77 0.55 0.00 0.79 0.66 0.87 0.00 0.02
31 Leake 3.50 0.07 0.02 0.84 0.30 0.00 0.82 0.63 0.80 0.00 0.01
72 Lee 2.63 0.01 0.05 0.88 0.02 0.00 0.24 0.32 0.82 0.00 0.27
1 Leflore 4.66 0.73 0.47 0.77 0.19 0.00 0.62 0.21 1.00 0.00 0.68
24 Lincoln 3.64 0.00 0.01 0.87 0.36 0.00 0.79 0.75 0.85 0.00 0.00
33 Lowndes 3.41 0.07 0.28 0.90 0.28 0.00 0.40 0.35 0.99 0.00 0.14
11 Madison 3.86 0.05 0.10 0.93 0.26 0.00 0.94 1.00 0.51 0.00 0.06
17 Marion 3.72 0.00 0.15 0.88 0.34 0.00 0.67 0.68 1.00 0.00 0.01
40 Marshall 3.30 0.00 0.01 0.87 0.42 0.00 0.15 1.00 0.75 0.00 0.10
66 Monroe 2.78 0.00 0.06 0.84 0.19 0.00 0.34 0.14 0.95 0.00 0.26
60 Montgomery 2.90 0.00 0.01 0.54 0.38 0.00 0.62 0.21 0.96 0.00 0.17
64 Neshoba 2.81 0.00 0.01 0.92 0.03 0.00 0.71 0.34 0.79 0.00 0.00
63 Newton 2.81 0.00 0.01 0.65 0.15 0.00 0.74 0.37 0.89 0.00 0.00
46 Noxubee 3.22 0.00 0.02 0.70 0.42 0.00 0.51 0.48 0.98 0.00 0.11
74 Oktibbeha 2.57 0.00 0.04 0.89 0.15 0.00 0.49 0.16 0.80 0.00 0.03
57 Panola 3.00 0.00 0.03 0.63 0.09 0.00 0.34 0.73 0.77 0.00 0.41
47 Pearl River 3.21 0.07 0.14 0.91 0.30 0.00 0.51 0.72 0.56 0.00 0.01
28 Perry 3.56 0.00 0.09 0.59 0.53 0.00 0.54 1.00 0.81 0.00 0.00
116

117
Rank County
IR
Score
2000
Mitigation
Spending
Flood
Insurance
Coverage
Jurisdiction
Coord
Disaster
Aid
Exp
Disaster
Training
Near
State
Capital
Near
MSA
Population
Stability
Nuclear
Planning
Crop
Insurance
Coverage
37 Pike 3.37 0.00 0.02 0.80 0.27 0.00 0.64 0.69 0.94 0.00 0.01
71 Pontotoc 2.64 0.00 0.00 0.70 0.35 0.00 0.29 0.45 0.68 0.00 0.16
76 Prentiss 2.51 0.00 0.01 0.76 0.20 0.00 0.10 0.41 0.81 0.00 0.22
5 Quitman 4.44 0.65 0.12 0.06 0.68 0.00 0.36 0.62 0.95 0.00 1.00
27 Rankin 3.58 0.00 0.12 0.92 0.10 0.00 1.00 1.00 0.42 0.00 0.02
36 Scott 3.37 0.00 0.01 0.83 0.24 0.00 0.85 0.63 0.78 0.00 0.02
65 Sharkey 2.79 0.00 0.22 0.00 0.07 0.00 0.76 0.36 0.84 0.00 0.54
9 Simpson 3.90 0.01 0.04 0.87 0.29 0.00 0.91 1.00 0.77 0.00 0.01
22 Smith 3.69 0.00 0.01 0.70 0.57 0.00 0.84 0.75 0.81 0.00 0.00
50 Stone 3.15 0.00 0.02 0.78 0.26 0.00 0.46 1.00 0.63 0.00 0.00
45 Sunflower 3.25 0.09 0.06 0.67 0.16 0.00 0.63 0.15 0.74 0.00 0.75
41 Tallahatchie 3.28 0.00 0.07 0.38 0.26 0.00 0.45 0.46 0.97 0.00 0.68
12 Tate 3.85 0.00 0.01 0.76 1.00 0.00 0.23 1.00 0.62 0.00 0.23
75 Tippah 2.52 0.00 0.00 0.57 0.14 0.00 0.12 0.66 0.93 0.00 0.09
79 Tishomingo 2.46 0.00 0.01 0.73 0.13 0.00 0.00 0.66 0.85 0.00 0.07
25 Tunica 3.63 0.00 0.09 0.51 0.63 0.00 0.21 1.00 0.76 0.00 0.43
81 Union 2.43 0.00 0.00 0.71 0.07 0.00 0.21 0.62 0.65 0.00 0.18
29 Walthall 3.56 0.00 0.07 0.89 0.47 0.00 0.64 0.55 0.92 0.00 0.03
15 Warren 3.82 0.06 0.09 0.90 0.08 0.00 0.86 0.67 0.97 0.00 0.19
2 Washington 4.61 0.67 0.45 0.85 0.37 0.00 0.59 0.29 0.83 0.00 0.55
52 Wayne 3.12 0.00 0.03 0.85 0.38 0.00 0.56 0.50 0.78 0.00 0.01
59 Webster 2.96 0.00 0.01 0.63 0.58 0.00 0.52 0.00 1.00 0.00 0.22
16 Wilkinson 3.74 0.00 0.07 0.69 0.93 0.00 0.52 0.71 0.80 0.00 0.03
48 Winston 3.20 0.00 0.02 0.80 0.57 0.00 0.62 0.18 0.97 0.00 0.03
82 Yalobusha 2.25 0.00 0.02 0.38 0.02 0.00 0.38 0.53 0.80 0.00 0.11
19 Yazoo 3.71 0.00 0.19 0.72 0.29 0.00 0.85 0.67 0.69 0.00 0.30
117

118
Table A.2: Breakdowns of BRIC institutional resilience scores and metrics (standardized values) for eighty-two counties in
Mississippi in 2010, aggregated at state scale (n=82)
Rank County
IR
Score
2010
Mitigation
Spending
Flood
Insurance
Coverage
Jurisdiction
Coord
Disaster
Aid Exp
Disaster
Training
Near
State
Capital
Near
MSA
Population
Stability
Nuclear
Planning
Crop
Insurance
Coverage
42 Adams 3.17 0.14 0.01 0.93 0.10 0.00 0.62 0.33 0.98 0.00 0.06
77 Alcorn 2.43 0.01 0.01 0.88 0.05 0.00 0.01 0.55 0.81 0.00 0.11
8 Amite 4.03 0.01 0.00 0.89 0.88 0.00 0.61 0.71 0.92 0.00 0.01
37 Attala 3.25 0.01 0.01 0.79 0.18 0.00 0.74 0.50 1.00 0.00 0.02
80 Benton 2.35 0.01 0.00 0.50 0.20 0.00 0.11 0.81 0.58 0.00 0.14
76 Bolivar 2.52 0.02 0.09 0.45 0.08 0.00 0.52 0.21 0.56 0.00 0.59
67 Calhoun 2.65 0.00 0.02 0.54 0.23 0.00 0.43 0.28 0.92 0.00 0.24
53 Carroll 2.95 0.01 0.01 0.77 0.09 0.00 0.67 0.34 0.93 0.00 0.13
71 Chickasaw 2.57 0.01 0.00 0.79 0.25 0.00 0.40 0.18 0.65 0.00 0.29
81 Choctaw 2.31 0.02 0.00 0.71 0.23 0.00 0.60 0.14 0.59 0.00 0.02
10 Claiborne 3.94 0.02 0.03 0.89 0.22 0.00 0.80 0.57 0.38 1.00 0.02
69 Clarke 2.64 0.01 0.04 0.78 0.11 0.00 0.63 0.26 0.80 0.00 0.00
54 Clay 2.94 0.01 0.06 0.92 0.36 0.00 0.42 0.17 0.90 0.00 0.10
49 Coahoma 3.06 0.02 0.03 0.59 0.14 0.00 0.37 0.56 0.63 0.00 0.72
7 Copiah 4.05 0.15 0.01 0.87 0.14 0.00 0.89 1.00 0.97 0.00 0.01
35 Covington 3.31 0.02 0.02 0.89 0.07 0.00 0.76 0.66 0.87 0.00 0.02
20 DeSoto 3.75 0.08 0.03 0.98 0.00 1.00 0.16 1.00 0.33 0.00 0.17
19 Forrest 3.76 0.04 0.07 0.95 0.07 0.00 0.63 1.00 0.99 0.00 0.00
43 Franklin 3.16 0.02 0.00 0.75 0.31 0.00 0.70 0.51 0.87 0.00 0.01
4 George 4.37 0.18 0.04 0.95 1.00 0.00 0.38 1.00 0.77 0.00 0.05
29 Greene 3.41 0.02 0.04 0.90 0.56 0.00 0.43 0.80 0.65 0.00 0.01
59 Grenada 2.82 0.01 0.06 0.90 0.08 0.00 0.52 0.25 0.84 0.00 0.14
1 Hancock 5.30 1.00 1.00 0.84 0.37 0.00 0.31 1.00 0.78 0.00 0.00
3 Harrison 4.38 0.35 0.54 0.99 0.33 0.00 0.30 1.00 0.87 0.00 0.00
6 Hinds 4.13 0.01 0.11 1.00 0.05 0.00 0.99 1.00 0.94 0.00 0.03
41 Holmes 3.19 0.01 0.02 0.74 0.24 0.00 0.77 0.56 0.66 0.00 0.19
28 Humphreys 3.43 0.01 0.11 0.54 0.29 0.00 0.73 0.41 0.59 0.00 0.75
118

119
Rank County
IR
Score
2010
Mitigation
Spending
Flood
Insurance
Coverage
Jurisdiction
Coord
Disaster
Aid Exp
Disaster
Training
Near
State
Capital
Near
MSA
Population
Stability
Nuclear
Planning
Crop
Insurance
Coverage
75 Issaquena 2.53 0.00 0.44 0.38 0.29 0.00 0.73 0.29 0.00 0.00 0.41
63 Itawamba 2.75 0.00 0.01 0.89 0.22 0.00 0.19 0.37 1.00 0.00 0.06
2 Jackson 4.55 0.32 0.70 0.98 0.41 0.00 0.22 1.00 0.90 0.00 0.01
47 Jasper 3.08 0.00 0.01 0.84 0.09 0.00 0.78 0.59 0.77 0.00 0.00
68 Jefferson 2.65 0.02 0.00 0.79 0.19 0.00 0.73 0.51 0.31 0.03 0.05
36 Jefferson
Davis 3.30 0.02 0.00 0.77 0.21 0.00 0.79 0.68 0.81 0.00 0.02
34 Jones 3.33 0.06 0.03 0.93 0.05 0.00 0.68 0.66 0.91 0.00 0.01
51 Kemper 3.01 0.01 0.00 0.81 0.21 0.00 0.59 0.46 0.92 0.00 0.00
72 Lafayette 2.55 0.02 0.02 0.93 0.19 0.00 0.30 0.65 0.40 0.00 0.05
61 Lamar 2.80 0.09 0.03 0.95 0.07 0.00 0.59 1.00 0.06 0.00 0.01
55 Lauderdale 2.93 0.07 0.04 0.99 0.06 0.00 0.63 0.29 0.85 0.00 0.00
5 Lawrence 4.16 0.02 0.02 0.85 0.17 0.79 0.79 0.66 0.84 0.00 0.02
31 Leake 3.37 0.01 0.01 0.91 0.21 0.00 0.82 0.63 0.77 0.00 0.00
62 Lee 2.78 0.01 0.04 0.93 0.08 0.00 0.24 0.32 0.80 0.00 0.35
14 Leflore 3.89 0.01 0.15 0.80 0.03 0.86 0.62 0.21 0.57 0.00 0.63
22 Lincoln 3.67 0.12 0.01 0.94 0.16 0.00 0.79 0.75 0.89 0.00 0.01
48 Lowndes 3.07 0.01 0.11 0.93 0.14 0.00 0.40 0.35 0.99 0.00 0.14
23 Madison 3.64 0.02 0.06 0.97 0.07 0.00 0.94 1.00 0.51 0.00 0.07
39 Marion 3.23 0.01 0.07 0.95 0.12 0.00 0.67 0.68 0.72 0.00 0.01
45 Marshall 3.11 0.00 0.01 0.93 0.09 0.00 0.15 1.00 0.84 0.00 0.09
57 Monroe 2.88 0.02 0.04 0.91 0.24 0.00 0.34 0.14 0.93 0.00 0.27
78 Montgomery 2.41 0.00 0.01 0.69 0.03 0.00 0.62 0.21 0.71 0.00 0.13
40 Neshoba 3.20 0.02 0.01 0.97 0.18 0.00 0.71 0.34 0.97 0.00 0.00
56 Newton 2.90 0.01 0.00 0.82 0.06 0.00 0.74 0.37 0.89 0.00 0.00
52 Noxubee 2.99 0.02 0.01 0.83 0.20 0.00 0.51 0.48 0.80 0.00 0.15
79 Oktibbeha 2.39 0.03 0.04 0.94 0.28 0.00 0.49 0.16 0.41 0.00 0.03
33 Panola 3.35 0.01 0.02 0.76 0.12 0.03 0.34 0.73 0.94 0.00 0.39
25 Pearl River 3.56 0.22 0.10 0.96 0.27 0.00 0.51 0.72 0.77 0.00 0.01
18 Perry 3.77 0.01 0.05 0.77 0.41 0.00 0.54 1.00 0.97 0.00 0.01
119

120
Rank County
IR
Score
2010
Mitigation
Spending
Flood
Insurance
Coverage
Jurisdiction
Coord
Disaster
Aid Exp
Disaster
Training
Near
State
Capital
Near
MSA
Population
Stability
Nuclear
Planning
Crop
Insurance
Coverage
24 Pike 3.62 0.11 0.01 0.90 0.36 0.00 0.64 0.69 0.91 0.00 0.01
65 Pontotoc 2.72 0.01 0.00 0.80 0.20 0.00 0.29 0.45 0.77 0.00 0.21
64 Prentiss 2.74 0.01 0.00 0.90 0.19 0.00 0.10 0.41 0.96 0.00 0.18
32 Quitman 3.36 0.18 0.08 0.19 0.43 0.00 0.36 0.62 0.49 0.00 1.00
15 Rankin 3.88 0.05 0.07 0.96 0.05 0.00 1.00 1.00 0.72 0.00 0.04
26 Scott 3.53 0.01 0.00 0.90 0.17 0.00 0.85 0.63 0.94 0.00 0.03
82 Sharkey 2.26 0.00 0.16 0.00 0.12 0.00 0.76 0.36 0.33 0.00 0.52
13 Simpson 3.92 0.01 0.02 0.91 0.11 0.00 0.91 1.00 0.94 0.00 0.01
30 Smith 3.40 0.01 0.01 0.81 0.08 0.00 0.84 0.75 0.90 0.00 0.00
9 Stone 3.96 0.80 0.02 0.90 0.52 0.00 0.46 1.00 0.25 0.00 0.00
46 Sunflower 3.11 0.01 0.05 0.76 0.09 0.00 0.63 0.15 0.67 0.00 0.75
50 Tallahatchie 3.04 0.07 0.03 0.58 0.17 0.00 0.45 0.46 0.68 0.00 0.59
44 Tate 3.14 0.01 0.01 0.89 0.18 0.00 0.23 1.00 0.67 0.00 0.16
70 Tippah 2.60 0.01 0.00 0.72 0.21 0.00 0.12 0.66 0.82 0.00 0.06
73 Tishomingo 2.55 0.01 0.01 0.82 0.08 0.00 0.00 0.66 0.92 0.00 0.05
27 Tunica 3.52 0.04 0.05 0.73 0.13 0.00 0.21 1.00 0.83 0.00 0.53
58 Union 2.85 0.01 0.00 0.78 0.07 0.00 0.21 0.62 0.95 0.00 0.21
21 Walthall 3.72 0.01 0.03 0.94 0.53 0.00 0.64 0.55 1.00 0.00 0.02
17 Warren 3.77 0.07 0.05 0.92 0.07 0.00 0.86 0.67 0.97 0.00 0.17
38 Washington 3.23 0.00 0.25 0.89 0.22 0.00 0.59 0.29 0.48 0.00 0.51
12 Wayne 3.92 0.48 0.02 0.90 0.56 0.00 0.56 0.50 0.91 0.00 0.01
66 Webster 2.67 0.02 0.00 0.76 0.23 0.00 0.52 0.00 0.94 0.00 0.18
11 Wilkinson 3.93 0.03 0.04 0.80 0.96 0.00 0.52 0.71 0.86 0.00 0.01
60 Winston 2.81 0.01 0.01 0.86 0.23 0.00 0.62 0.18 0.87 0.00 0.01
74 Yalobusha 2.54 0.00 0.01 0.59 0.14 0.00 0.38 0.53 0.79 0.00 0.09
16 Yazoo 3.79 0.01 0.11 0.85 0.07 0.00 0.85 0.67 0.98 0.00 0.26
120