appendix h -traffic analysis - navcen.uscg.gov
TRANSCRIPT

Appendix H - Traffic Analysis The following map products show the traffic patterns for the various vessel categories operating
in the Bering Sea. All maps are derived from Automatic Information System (AIS) signals that were
transmitted by vessels, received by AIS Satellites, and archived by the Coast Guard's Navigation Center.
Each vessel category has a brief introductory paragraph followed by a table of transit segment data and
two maps. Both the maps and the table oftransit segments come from the same AIS data set. The first
map is a heat map, which generalizes the traffic patterns into a series of graduated colors to show
frequency of occurrence. Heat maps are helpful in identifying trends in highly cluttered data but in so
doing omit some data. The second map displays all recorded transit segments without any
generalization or editing. The unedited map offers visual granularity, but in highly trafficked areas,
traffic patterns can become indiscernible. Careful review of both map types will offer the best
perspective on transit trends. The accompanying table of data shows which vessel types fed into each
broader vessel category. Also included in the table is the quantity of transit segments recorded for each
vessel type. A transit segment is not the precise number of vessels for that type, but rather the total
number of transit segments recorded for the given vessel type.
As noted in the previous appendix, the data set includes 5,200 different vessels generating over
117,000 transit segments. The number of transit segments does not accurately reflect the actual
number of vessel transits for two reasons. First many AIS transit segments cannot be traced back to a
particular vessel due to errors on the part of the vessel, such as incorrectly programming the AIS unit
before using it. The Coast Guard omitted those transmissions from the data set. Second, a single vessel
can product many transit segments on a single voyage. Automated Information System (AIS) Satellite
coverage is not constant. Sometimes the AIS satellite will receive a transmission from a given vessel, but
then loose the signal as the satellite's orbit takes it to a location where it no longer has a line of sight
path to the vessel. Usually another passing satellite will reacquire the AIS signal within a short period,
often within a few hours. When this occurs, and the AIS data is processed and displayed on a GIS
generated map, this display will show a series of short unconnected transit segments, all of which come
from the same vessel. Thus, the tabular data on the number of transit segments cannot be used to
determine the actual number of vessel transits. Rather, it is useful for determining a rough order of
magnitude estimate of how much various segments of commercial activity contribute to the whole. The
2,277 transit segments attributed to tank vessels, for example, represent about 1.3% of the region's
overall traffic while the 20,514 transit segments attributed to bulk carriers represent about 12%.
These maps and the associated table of data are from satellite AIS data collected for full
calendar years 2014 and 2015. Outer Continental Shelf (OCS) exploratory drilling activity was occurring
during this time, so the Coast Guard believes that this data set is useful as a planning tool to
approximate future trends should OCS exploration activity resume. The previous appendix contains a
more thorough discussion on how the AIS data collection and processing. Unless otherwise noted all
maps are in Mercator projection with a central meridian of 168.00W and a standard parallel 62.00N.
Geographic coordinate system is WGS 1984.
91

Tank Vessel Traffic Tank vessel traffic within the Bering Sea region is predominantly destined to and from specific
locations to deliver oil products to coastal communities or bulk storage facilities. Consequently, tankers
travelling from one community to the next often take the shortest route which is a near coastal route.
The Bering Sea is not well surveyed. One recent tanker grounding occurred in a shallow area near
Nunivak Island that can be attributed to inaccurate depths being displayed on a nautical chart. Because
of the type of cargo carried, tank vessels represent a significant risk to the environment in the event of a
casualty. One way to mitigate this is to keep this traffic further offshore. The AIS data shows four specific
trends worth noting.
First, there are a number of tank vessel transits that are destined to coastal communities for
direct offload/onload of product to a shore side facility, or for lightering operations in those
communities that do not have port facilities. These transits are expected to continue as long as there is a
need for fuel deliveries in western Alaska. For these vessels, adoption of routing measures will increase
safety margins during portions of a transit where a vessel follows established routing measures.
Second, there are a handful oftank vessels that are coming from or going to locations in the Far
East. There are about 12-15 transit segments that show vessels coming into Alaska and bound for the
vicinity of St. Lawrence or Nunivak Islands, or Bristol Bay. This equates to about 6-8 two-way transits
over the course of 2014-2015. Most of these vessels appear to be heading toward particular
destinations, and as noted above, adoption of routing measures will provide a marginal increase in
safety during portions of a transit where a vessel follows routing measures.
Third, the AIS data shows that tank vessel traffic does not follow consistent track lines. In many
cases vessels are transiting through areas where Areas to Be Avoided (ATBA's) are being considered, and
are coming closer to the Diomede Islands, St. Lawrence Island and Nunivak Island than might be
appropriate. Given the potential high consequence of a tank vessel grounding or other casualty resulting
in a release of petroleum products, the AIS data supports the case for establishing ATBA's.
Fourth, the heat map shows a significant amount of the overall tank vessel traffic through the
Bering Strait is passing through Russian waters. Oil and Gas Development is ongoing in the Russian
Arctic. The Coast Guard expects this segment of maritime traffic to increase in the future as the Yamal
oil field continues to develop and new Ice-class LNG carriers come into service.
Vessel Trpe Chemical/Products Tanker Products Tanker Crude Oil Tanker Chemical Tanker LPG Tanker Crude/Oil Products Tanker LNGTanker Asphalt/Bitumen Tanker Combination Gas Tanker (LNG/LPG)
Transit Segment 1,196 498 235 112 70 69 57 38 2
2,277
92
Tank Vessel

Tanker Traffic All Tonnage 2014 - 2015
-- Proposed Route
High Traffic
Low Traffic
Russia
St. Lawrence Is.
Red Dog Mine
Kotzebue
Alaska
Bethel

Tanker Traffic All Tonnage 2014 - 2015
-- Proposed Route
-- - -- Tanker Traffic Kotzebue
Russia
St. Lawrence Is.
Alaska
Bethel

Bulk Carrier Traffic The majority of the bulk carrier traffic transiting through the Bering Sea consists of ore carriers
that travel between the Red Dog Mine and ports in East Asia. Because the predominant traffic is moving
in a northeast to southwest orientation, most bulk carriers would not follow the proposed route once
operating south of the Bering Strait. AIS data also shows that bulk carriers are not following consistent
track lines as they pass through the Bering Strait, with some sailing north and west of the Diomede
Islands and on to Russian waters, while some remain in US waters and pass to the east of the Diomede
Islands. Once south of the Bering Strait, most vessels headed toward the Far East turn to the west well
before they would if following the proposed "Western Spur" of the two-way route. Adopting routing
measures that couple an ATBA for the Diomede Islands with a recently surveyed two-way route in US
waters might positively influence vessels making this transit to avoid sensitive areas. Following the
proposed routing measures would result in vessel traffic deviating from current patterns by a significant
amount. The length of the voyage through this area would increase by approximately 20 nautical miles,
or approximately 14% over that of a shorter track line of approximately 123 nautical miles passing closer
to the Diomede Islands.
Occasional bulk carrier transits occur in a more north-south orientation for vessels bound to or
from Dutch Harbor or Unimak Pass. As observed with tank vessel traffic, some of these vessels are
transiting in close proximity to the east side of Saint Lawrence Island, which, while slightly shorter, is an
environmentally sensitive area where confidence in hydrographic information is of low confidence. A
grounding or pollution accident in this area would be of concern. The bulk carrier traffic that is flowing in
a north-south direction through the Bering Sea would be well suited to follow the recommended route.
From the junction point near Fairway Island, following the proposed two-way route and observing the 4
recommended ATBA's all the way to Unimak Pass would only add about 12 nautical miles, or about 2%,
to the overall transit distance when compared to the 628 nautical mile route that would pass close to
the eastern end of St. Lawrence Island.
Vessel Type Transit Segment
Bulk Carrier 20,120 } Wood Chips Carrier 362
-
B- u-lk_C_a-rr-ie-r,_Se-lf--d-is-ch-a-rgi-·n_g ___________ 2~1--- Bulk Carrier Bulk/Oil Carrier (OBO) Ore Carrier
20,514
95

Bulk Carrier All Tonnage 2014 - 2015
-- Proposed Route
High Traffic
Low Traffic
Russia
\ \
St. \.awrence Is. , .. 1··.
\
Kotzebue
Nome
Alaska
Bethel
Nunivak Is.

Bulk Carrier All Tonnage 2014 - 2015
Red Dog Mine -- Proposed Route
-- Bulk Traffic Kotzebue
Russia
Alaska
Bethel
Nunivak Is .

Cargo Carrier Traffic The cargo carrier traffic (non tug) using the Bering Sea region is comprised of a variety of vessel
types within the cargo vessel class which transit to different destinations for differing reasons. The
prominent vessel transits lines noted on the north side of the Alaska Peninsula going roughly east and
west towards Naknek and Togiak Bay are mostly refrigerated cargo carriers supporting the fishing
industry. The traffic transiting along the east side of Nunivak and in the Kuskokwim Bay area is
predominantly landing craft traffic delivering cargo to coastal communities. The traffic noted using the
west side of Nunivak island is a mixture of vessel types within the cargo carrier class making transits to
ports in the northern portion of the Bering Sea. While the majority of the cargo vessel is following
coastal trade routes that do not overlap with the proposed routing measures, a few voyages do
correlate well and would be well suited to follow the recommended route thereby allowing them to
follow a well surveyed transit route, increase their distance from shore, avoid environmentally sensitive
areas, and derive a slight benefit in the form of reduced risk for collision avoidance. Vessels carrying
cargo between Dutch Harbor and Nome, AK, for example, would enjoy these benefits by joining the
proposed two-way route near Nunivak Island and following along the route before departing in the
direction of Nome.
Vessel Trpe Vehicles Carrier General Cargo Ship Open Hatch Cargo Ship Landing Craft General Cargo Ship (with Ro-Ro facility) Livestock Carrier Ro-Ro Cargo Ship General Cargo/Passenger Ship Heavy Load Carrier Heavy Load Carrier, semi submersible Palletised Cargo Ship
Transit Segment 2,829 1,927 1,387 299 87 23 17 6 4 4 2
10,819
98
Cargo Carrier

Proposed Route
Low Traffic
Cargo Carrier (Non-Tug) All Tonnage 2014 - 2015
Red Dog Mine
\ '
- -('Kotzebue -1,- -.\ .. I , I , . \/--
,.- •
Russia
Nome
St Lawrence Is.
Alaska
Nunivak Is.··

-- Proposed Route
- Cargo Traffic
Cargo Carrier (Non-Tug) All Tonnage 2014 - 2015
Red Dog Mine
Russia
Alaska L
Bethel

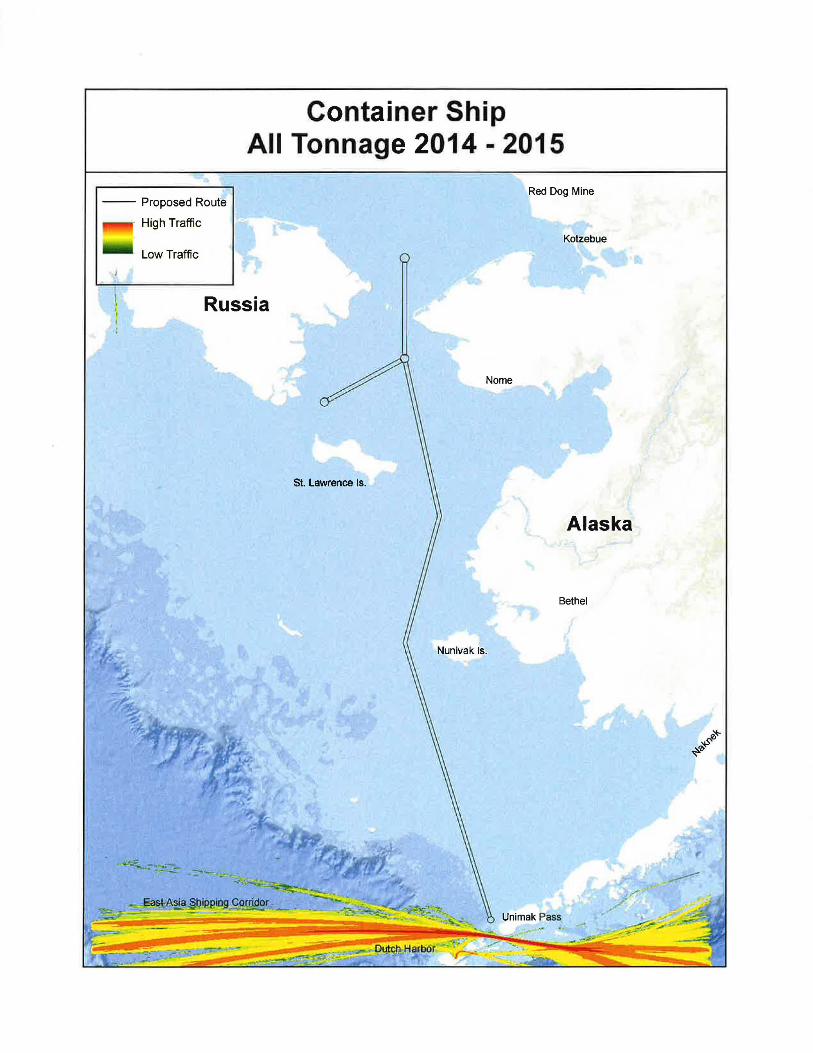
Container Ship Traffic With over 15,000 transit segments, container ship traffic represents one of the most frequent
ship types within the area where historical AIS transit data was analyzed. Their transit patterns and
histories; however, show very few transits north of the Pribilof Islands and into the central Bering Sea
region. Consequently, container ship traffic does not, at present, represent a significant concern to the
area being studied.
Future increases in container ship traffic through northern US waters are not expected unless
port infrastructure capable of handling container ship traffic is built in the US Arctic or Canada, or
Russia's Northern Sea Route develops into a viable alternative to the Suez Canal. In this later scenario
most of any future increase in container ship traffic would originate in the Far East, and follow the
shortest possible route to Europe through Russian waters to the Bering Strait, then on to the Northern
Sea Route and Europe.
Should this scenario come to pass where the Northern Sea Route captures container ship traffic
that would have otherwise passed through the Suez Canal, there might be some container ship traffic
that would originate either in Dutch Harbor or the West Coast of North America and use the proposed
two-way route through the Bering Strait to capitalize on the same opportunity. In fact, the granular map
of container ship traffic shows at least one such voyage by a container ship that stopped in Provedeniya,
Russia. For the reasons below, this single vessel track does not reliably predict that future vessel activity
would transit to the west of Saint Lawrence Island unless those vessels also call on Russian destinations.
A container ship following the proposed two-way route from Unimak Pass to a point north of
the Diomede Islands, then turning westward toward Russia's Cape Dezhneva to commence a transit of
the Northern Sea Route would enjoy a slightly shorter transit (by approximately 24 miles) than it would
if it chose to sail to the west of St. Lawrence Island and enter Russian waters earlier. Exports of frozen
US fish products originating in Dutch Harbor bound for some possible future market in Europe are an
example of the type of containerized shipments that might one day utilize the proposed route.
The Suez Canal is utilized by many other types of vessels than just container ships, so any future
shifts in trade patterns that use the Bering Strait as an alternative to the Suez Canal would likely involve
many different types of vessels. For reasons of brevity, however, this possible future scenario is only
discussed in this section.
Vessel TyPe Container Ship (Fully Cellular) Container Ship (Fully Cellular with Ro- Ro Facility)
Transit Segment 15,228
6 15,234
101
~ Container Ship
Container Ship All Tonnage 2014 - 2015
Red Dog Mine -- Proposed Route
High Traffic Kotzebue
Low Traffic
Russia
Nome
St. Lawrence Is.
Alaska
Bethel
Nunivak Is.

Container Ship All Tonnage 2014 - 2015
"· -- Proposed Route Red Dog Mine
Container Traffic Kotzebue
Russia j
I I
I
Nome
St. Lawrence Is.
Alaska
Bethel
Nunivak Is.
Passenger Ship Traffic Passenger vessel traffic volume in the Bering Sea region is quite low and widely distributed. The
passenger ships transiting the area are of a medium size ranging from 200 to 500 ft in length and carry
around 200 passengers, although 2016 saw one transit of a single much larger cruise ship. This transit
did not fall within the date range of the data set analyzed. The passenger vessels operating in this area
are typically providing cruising options to the adventure and eco tourist market. Passenger vessels do
routinely transit near shore when attempting to observe wildlife and make port calls, which does expose
the vessel to increased risk of an accidental grounding. Passenger vessels also bring the unique risk of a
mass rescue situation if an on board emergency prompted an evacuation. The remote and sparsely
populated Bering Sea region does not have the equipment or infrastructure to rescue, lodge and
medically treat hundreds of persons at a time. While the majority of the passenger vessels have transit
destinations that do not overlap with the proposed routing measures, some do correlate well and would
be well suited to follow the recommended rout thereby allowing them to follow a well surveyed transit
route, increase their distance from shore and avoid environmentally sensitive areas.
Careful examination of passenger vessel transit segments provides a useful example of how to
correlate the number of transit segments to the rough number of vessels. The passenger vessel heat
tracks are all the result oftwo years worth of data transmitted by a small number of passenger ships.
The heat tracks near Nome, AK, for example are the result of 5 passenger ships stopping in Nome over
2014 and 2015. These vessels also voyage to Russia's Far East. In Unimak Pass, the transit segment
count is driven higher by regular sailings of a single vessel of the Alaska Marine Highway System as well
as an occasional cruise ship calling in Dutch Harbor or engaged in a voyage to reposition the vessel in or
out of Alaska for the operating season.
Vessel TyPe Passenger /Cruise Passenger/Ro-Ro Ship (Vehicles) Passenger Ship Air Cushion Vehicle Passenger /Ro-Ro Ship (Vehicles)
Transit Segment 147 78 9 7
241
104
Passenger Ship

Passenger Ship All Tonnage 2014 - 2015
-- Proposed Route
· High Traffic
· Low Traffic
Russia
Nome
St. LaWl'.eflGe Is.
Nunivak Is.
Red Dog Mine
Kotzebue
Alaska
Bethel

Passenger Ship All Tonnage 2014 - 2015
-- Proposed Route
-- Passenger Traffic
Russia
Eas.t Asia $hipping Corridor
I I
St. Lawrence .ls.
Red Dog Mine
Kotzebue
Nome
Alaska
Bethel
Nunivak Is.
Fishing Vessel Traffic
Fishing vessel activity in the Bering Sea region is quite high and stands as the most prevalent use
of the waterway. The 60,925 transit segments associated with fishing vessels represent 52% of the total.
While fishing vessels do transit all portions of the Bering Sea, the southern and central Bering Sea and
Bristol Bay region sees the highest concentrations of fishing vessel activity, which is concentrated on
shallower and more productive fishing grounds. The fishing vessels operating in this area represent a
regional fishery of national significance with nearly two million metric tons of fish caught annually and
an overall economic impact of around 5 billion dollars. The majority of the vessels within the fishing
industry are comparatively small to other commercial traffic.
While there are some large factory trawlers and factory processers that are capable of causing a
sizable pollution spill or major loss of life should they experience a major casualty. For the purpose of
this study, though, the most likely threat posed by the presence of fishing vessels is the possibility of a
collision with one of the far more numerous catcher vessels. Unimak Pass, which is near the center of
the most heavily trafficked fishing areas is also a major shipping corridor between Far East ports and the
North American West Coast seeing over 4,000 ship transits per year. Linking a north-south two-way
route to the existing safety fairway in Unimak Pass should have the benefit of increasing predictability
for vessels operating in this area, especially if some transiting fishing vessels choose to follow part of the
two-way route while on their way to the fishing grounds. In other areas, the majority of fishing vessels
havei transit destinations that do not overlap well with the proposed routing measures. Use of the
recommended route by those fishing vessels is not expected to occur on a widespread basis. Large
commercial vessels would be expected to follow the recommended route, however, and this is expected
to reduce the risk of collision in those areas where the two-way route crosses areas with significant
concentrations of vessels engaged in fishing. One area where this occurs is shown on the heat map,
where the route passes through an area with higher levels of fishing activity about halfway between
Unimak Pass and Nunivak Island.
One other noteworthy area with high levels of fishing vessel activity is observable on the
western edge ofthe heat map in the western Bering Sea on the Russian side of the US/Russia maritime
boundary line. While outside of the PARS study area, this concentration of fishing vessels may pose a
concern sometime in the future ifthe Northern Sea Route begins to capture traffic from the Suez Canal.
Vessel Type Fishing Vessel Stern Trawler Factory Stern Trawler Trawler Fish Factory Ship Fish Farm Support Vessel Fishery Research Vessel Fish Carrier
Transit Segment 40,168 10,475 6,755 1,847 1,174 227 193 86
60,925
107
Fishing Vessel

Fishing Vessel All Tonnage 2014 - 2015
-- Proposed Route
High Traffic
Low Traffic
Russia
. East ASla·Shipping Corridor
St. Lawrence Is.
Red Dog Mine
Kotzebue
Nome
Alaska
Bethel
Nunivak Is .

Fishing Vessel All Tonnage 2014 - 2015
-- Proposed Route
- - Fishing Traffic
Russia
/ ..
~st.ASla SJJlp~ Certldor r
,.
Red Dog Mine
~otzebue
Alaska
Bethel