appendix ii: ghd bsia traffic report
TRANSCRIPT
URBIS 170928 - PA0929 - BOODARIE STRUCTURE PLAN V5 - FINAL.DOCX
APPENDICES
Appendix II: GHD BSIA Traffic Report

LandCorp Boodarie Strategic Industrial Area
Traffic Assessment
June 2013

GHD | Report for LandCorp - Boodarie Strategic Industrial Area, 61/26171 | i
Standard disclaimer
This report: has been prepared by GHD for LandCorp and DSD and may only be used and relied on by LandCorp and DSD for the purpose agreed between GHD and LandCorp and DSD as set out in section 1.1 of this report.
GHD otherwise disclaims responsibility to any person other than LandCorp and DSD arising in connection with this report. GHD also excludes implied warranties and conditions, to the extent legally permissible.
The services undertaken by GHD in connection with preparing this report were limited to those specifically detailed in the report and are subject to the scope limitations set out in the report.
The opinions, conclusions and any recommendations in this report are based on conditions encountered and information reviewed at the date of preparation of the report. GHD has no responsibility or obligation to update this report to account for events or changes occurring subsequent to the date that the report was prepared.
The opinions, conclusions and any recommendations in this report are based on assumptions made by GHD described in this report (refer section 3.1.1 of this report). GHD disclaims liability arising from any of the assumptions being incorrect.
GHD has prepared this report on the basis of information provided by LandCorp and DSD and others who provided information to GHD (including Government authorities)], which GHD has not independently verified or checked beyond the agreed scope of work. GHD does not accept liability in connection with such unverified information, including errors and omissions in the report which were caused by errors or omissions in that information.
GHD has not been involved in the preparation of the Structure Plan Document and has had no contribution to, or review of the Structure Plan Document other than in the Boodarie Industrial Estate Traffic Assessment. GHD shall not be liable to any person for any error in, omission from, or false or misleading statement in, any other part of the Structure Plan Document.

ii | GHD | Report for LandCorp - Boodarie Strategic Industrial Area, 61/26171
Table of contents Standard disclaimer.................................................................................................................... i
1. Introduction ............................................................................................................................... 1 1.1 General ........................................................................................................................... 1 1.2 Proposed Development ................................................................................................... 1 1.3 Scope of Work ................................................................................................................. 1
2. Existing Site Conditions ............................................................................................................. 5 2.1 Great Northern Highway (GNH) ....................................................................................... 5 2.2 Great Northern Highway – Cycling Facilities .................................................................... 6 2.3 Great Northern Highway – Pedestrian Facilities ............................................................... 6 2.4 Great Northern Highway – Public Transport Facilities ...................................................... 6 2.5 Boodarie Station Access Road ........................................................................................ 6
3. Planned Development ............................................................................................................... 7 3.1 Traffic Generation ............................................................................................................ 7 3.2 Internal Roads ............................................................................................................... 10 3.3 Great Northern Highway ................................................................................................ 11 3.4 Interim Development – Noxious Area ............................................................................. 26 3.5 Austroads Warrants for Intersection Treatment .............................................................. 30 3.6 Off and On road parking ................................................................................................ 31 3.7 High Wide Loads (HWL) and PAM Corridor ................................................................... 32 3.8 Consideration of road train assembly/overnight parking ................................................. 32 3.9 Consideration of the demand for public transport facilities .............................................. 32 3.10 Construction Activity and Access ................................................................................... 33 3.11 Stakeholder Liaison ....................................................................................................... 33
4. Recommendations .................................................................................................................. 34
Table index Table 1 Great Northern Highway – Existing Traffic Volumes ......................................................... 5
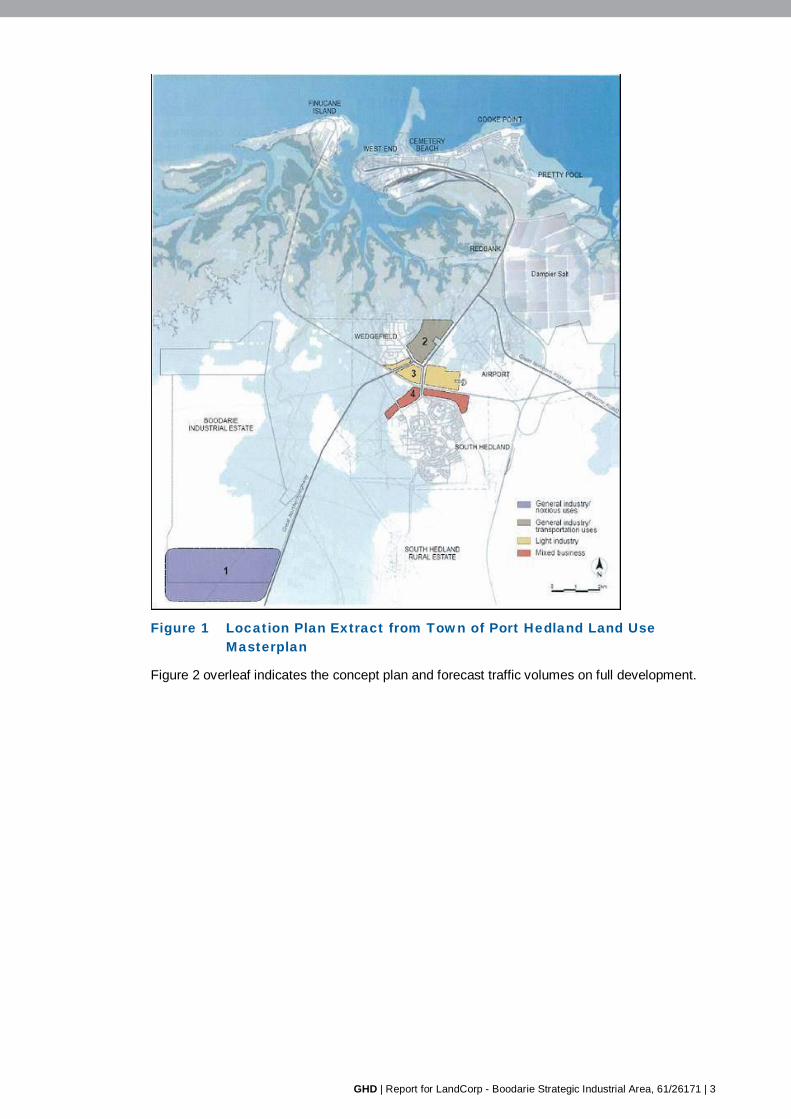
Figure index Figure 1 Location Plan Extract from Town of Port Hedland Land Use Masterplan .......................... 3
GHD | Report for LandCorp - Boodarie Strategic Industrial Area, 61/26171 | 1
1. Introduction 1.1 General
LandCorp is preparing a Structure Plan for the industrial development of a 4000 hectare
greenfield site in Boodarie, located approximately 12 kilometres south-west of the Port Hedland
townsite (Figure 1). The site is generally bound by Great Northern Highway (GNH) to the east
and unoccupied desert areas to the south and west and disused BHPB briquetted iron plant to
the north.
It should be noted that development of the Estate is likely to be over 50 years and only 25% of
development may be achieved by 2031.
GHD has been engaged by LandCorp and the Department of State Development (DSD) to
prepare this traffic assessment to provide traffic input to the Boodrarie Strategic Industrial Area
(BSIA) Structure Plan.
1.2 Proposed Development
It is understood that the industrial development will be primarily focussed on heavy industry and
will comprise industrial buildings and plant hardstand areas, internal access roads and the
potential upgrading of existing roads.
Primary activities will include downstream processing of raw minerals and energy sources,
noxious industries and port related activities.
1.3 Scope of Work
GHD scope of work is to undertake traffic and transport assessment for input to the Structure
Plan, tasks have included:
Review previous traffic input and confirmed gaps and site specific assumptions. Trip
rates and trip distribution has been reviewed.
Discussed requirements with Main Roads and Town of Port Hedland in Port Hedland.
Broader transport modelling of the surrounding area to 2031 taking into account
development in the area as undertaken by SKM for Main Roads. The SKM report has
been reviewed for its relevance to this study.
Preparation of a spreadsheet model of scenarios for Boodarie with the northern Port
Access Corridor. Traffic distribution and growth factors for GNH have been agreed with
LandCorp.
Determination of levels of service and capacity constraints and confirmation of access,
intersection treatments and carriageway requirements for 2031 assessment. The likely
level of development for the design years are as advised by Urban Plan Town Planners
for the project.
Liaison with Main Roads/Shire for input and concurrence in relation to access and
intersection treatments.
Consideration of construction activity. An assessment of potential activity associated
with the development of the site was undertaken and recommendations made for
access.
Consideration of the following to be undertaken :

2 | GHD | Report for LandCorp - Boodarie Strategic Industrial Area, 61/26171
- Vehicle access (for both heavy and light vehicles – and PAMS potentially)
- Road Hierarchy (internal to the site only)
- Typical Road cross sections
- Intersection controls
- Off and on road parking
- Arterial road access control
- HWL
- Traffic impacts
Consideration of road train assembly/overnight parking
Consideration of the demand for public transport and cycle facilities in discussion with
DoT
Pedestrian requirements
Undertaking a parking assessment
Undertaking a Road safety assessment of the proposed concept plan.
Liaison with ToPH/Main Roads as required.
Obtaining latest available traffic data from Main Roads.
Assisting the Town Planner to incorporate the traffic outcomes into the Structure Plan
Preparing a report with outcomes and recommendations. Typical cross sections and
Sidra output graphics for intersection configurations have been provided.
Figure 1 and 2 indicates the site location.
GHD | Report for LandCorp - Boodarie Strategic Industrial Area, 61/26171 | 3
Figure 1 Location Plan Extract from Town of Port Hedland Land Use Masterplan
Figure 2 overleaf indicates the concept plan and forecast traffic volumes on full development.

4 | GHD | Report for LandCorp - Boodarie Strategic Industrial Area, 61/26171
GHD | Report for LandCorp - Boodarie Strategic Industrial Area, 61/26171 | 5
2. Existing Site Conditions The site is bounded by Great Northern Highway on its east side and access is proposed at three
locations, off the GNH.
To the west the site is bounded by the proposed “Western Infrastructure Corridor” which will
comprise a number of proponents exporting iron ore through the planned PHPA Outer Harbour.
For the purposes of this report, no access is currently assumed to this corridor, however future
potential to link to this corridor is acknowledged.
2.1 Great Northern Highway (GNH)
2.1.1 GNH Traffic Volumes - Existing
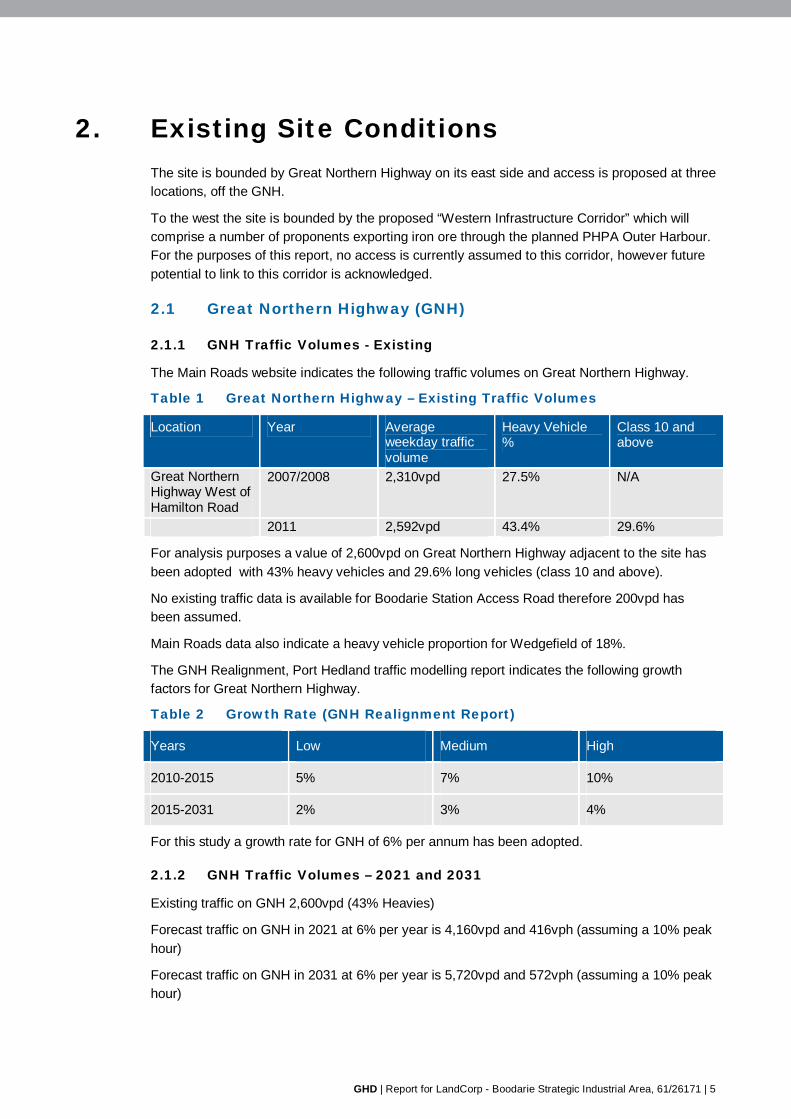
The Main Roads website indicates the following traffic volumes on Great Northern Highway.
Table 1 Great Northern Highway – Existing Traffic Volumes
Location Year Average weekday traffic volume
Heavy Vehicle %
Class 10 and above
Great Northern Highway West of Hamilton Road
2007/2008 2,310vpd 27.5% N/A
2011 2,592vpd 43.4% 29.6%
For analysis purposes a value of 2,600vpd on Great Northern Highway adjacent to the site has
been adopted with 43% heavy vehicles and 29.6% long vehicles (class 10 and above).
No existing traffic data is available for Boodarie Station Access Road therefore 200vpd has
been assumed.
Main Roads data also indicate a heavy vehicle proportion for Wedgefield of 18%.
The GNH Realignment, Port Hedland traffic modelling report indicates the following growth
factors for Great Northern Highway.
Table 2 Growth Rate (GNH Realignment Report)
Years Low Medium High
2010-2015 5% 7% 10%
2015-2031 2% 3% 4%
For this study a growth rate for GNH of 6% per annum has been adopted.
2.1.2 GNH Traffic Volumes – 2021 and 2031
Existing traffic on GNH 2,600vpd (43% Heavies)
Forecast traffic on GNH in 2021 at 6% per year is 4,160vpd and 416vph (assuming a 10% peak
hour)
Forecast traffic on GNH in 2031 at 6% per year is 5,720vpd and 572vph (assuming a 10% peak
hour)
6 | GHD | Report for LandCorp - Boodarie Strategic Industrial Area, 61/26171
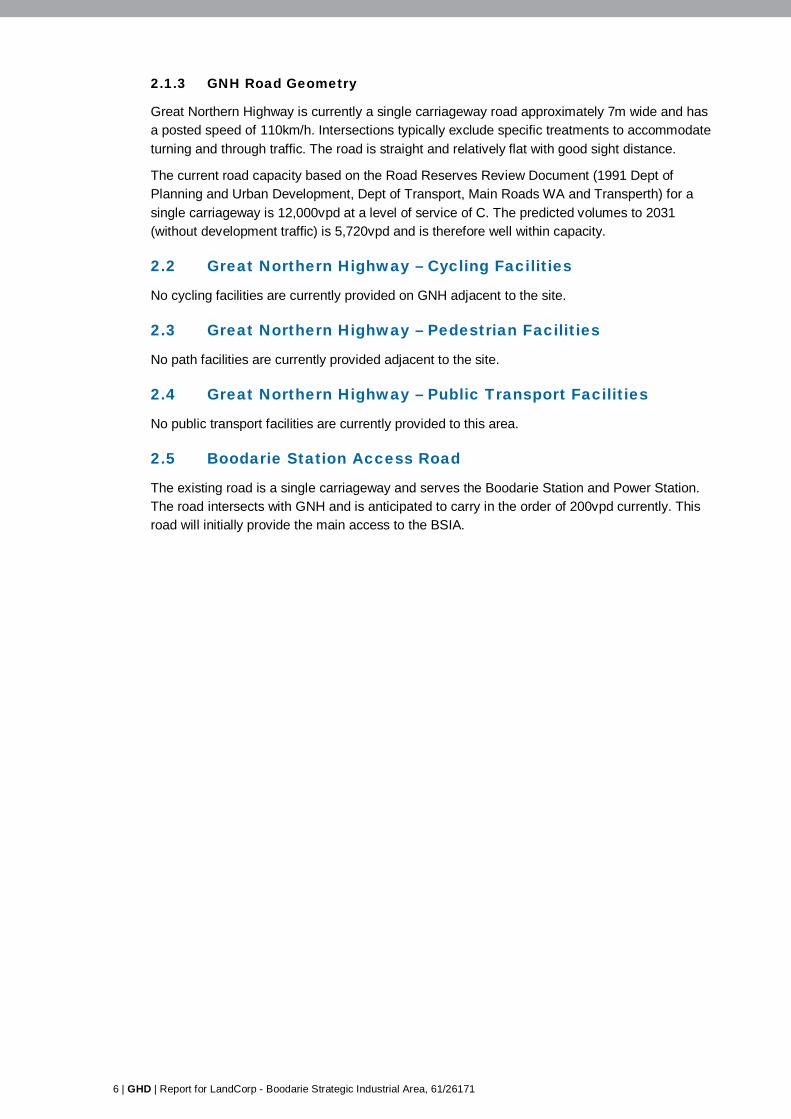
2.1.3 GNH Road Geometry
Great Northern Highway is currently a single carriageway road approximately 7m wide and has
a posted speed of 110km/h. Intersections typically exclude specific treatments to accommodate
turning and through traffic. The road is straight and relatively flat with good sight distance.
The current road capacity based on the Road Reserves Review Document (1991 Dept of
Planning and Urban Development, Dept of Transport, Main Roads WA and Transperth) for a
single carriageway is 12,000vpd at a level of service of C. The predicted volumes to 2031
(without development traffic) is 5,720vpd and is therefore well within capacity.
2.2 Great Northern Highway – Cycling Facilities
No cycling facilities are currently provided on GNH adjacent to the site.
2.3 Great Northern Highway – Pedestrian Facilities
No path facilities are currently provided adjacent to the site.
2.4 Great Northern Highway – Public Transport Facilities
No public transport facilities are currently provided to this area.
2.5 Boodarie Station Access Road
The existing road is a single carriageway and serves the Boodarie Station and Power Station.
The road intersects with GNH and is anticipated to carry in the order of 200vpd currently. This
road will initially provide the main access to the BSIA.
GHD | Report for LandCorp - Boodarie Strategic Industrial Area, 61/26171 | 7
3. Planned Development 3.1 Traffic Generation
The planned development is shown on the Structure Plan in Figure 2 First principles traffic
generation has been estimated based on the following information:
The type of land use and heavy industry, outlying location, FIFO workforce, contract workers,
access to employer supplied bus transfer and carpooling opportunity will influence the total
traffic generation. The current FIFO/contract workforce proportion of the total service population
is 15% and short term visitors 9% (AEC Group 2011)
It should be noted the PHPA Outer Harbour Masterplan study which is currently underway,
might ultimately impact on the BSIA. There is also an on-going PAM corridor study which may
impact on traffic movement and operation.
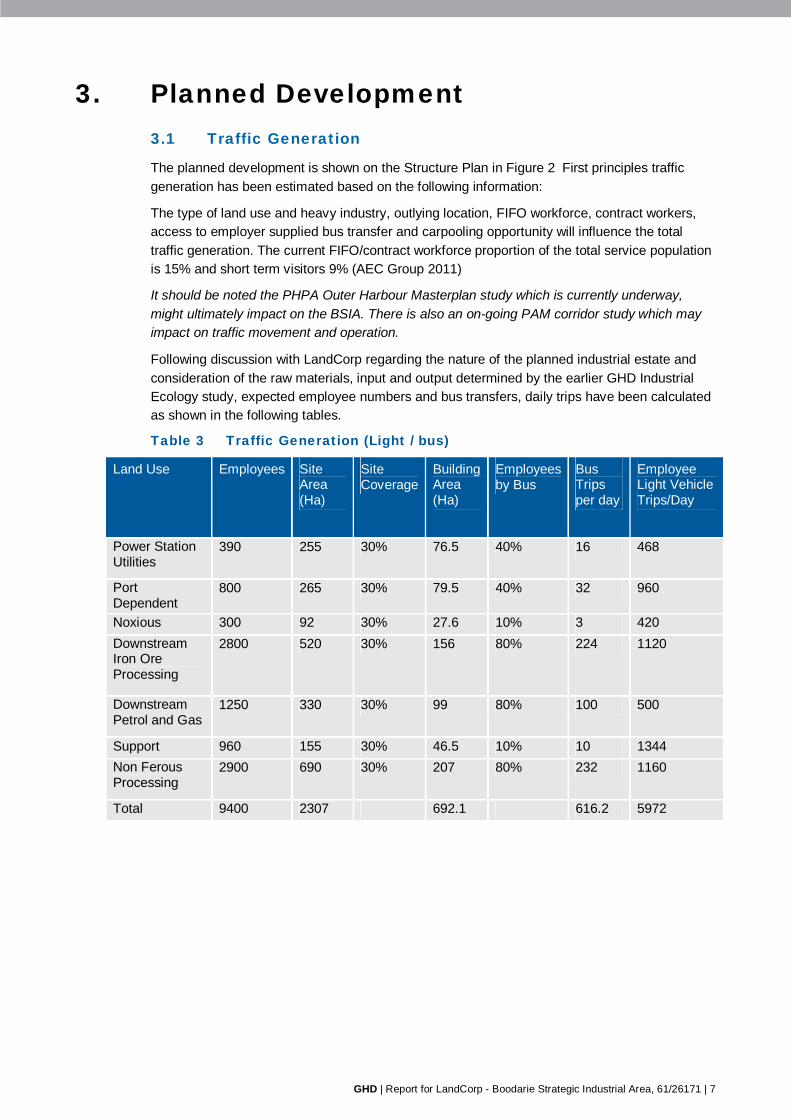
Following discussion with LandCorp regarding the nature of the planned industrial estate and
consideration of the raw materials, input and output determined by the earlier GHD Industrial
Ecology study, expected employee numbers and bus transfers, daily trips have been calculated
as shown in the following tables.
Table 3 Traffic Generation (Light / bus)
Land Use Employees Site Area (Ha)
Site Coverage
Building Area (Ha)
Employees by Bus
Bus Trips per day
Employee Light Vehicle Trips/Day
Power Station Utilities
390 255 30% 76.5 40% 16 468
Port Dependent
800 265 30% 79.5 40% 32 960
Noxious 300 92 30% 27.6 10% 3 420
Downstream Iron Ore Processing
2800 520 30% 156 80% 224 1120
Downstream Petrol and Gas
1250 330 30% 99 80% 100 500
Support 960 155 30% 46.5 10% 10 1344
Non Ferous Processing
2900 690 30% 207 80% 232 1160
Total 9400 2307 692.1 616.2 5972

Table 4 Traffic Generation (All)
Land Use ktpa (In/Out/Waste)
Trucks per Day 2 way (85t per truck)
Sub Total vpd (bus, light and heavy)
Total Including Maintenance/Service, other movements (+10%) vpd
Power Station Utilities
285 18 502 552
Port Dependent 1082 70 1062 1168
Noxious 1040 67 490 539
Downstream Iron Ore Processing
8711 562 1906 2096
Downstream Petrol and Gas
1192 77 677 744
Support 3275 211 1565 1721
Non Ferous Processing
1771 114 1506 1657
Total 17356 1119 7707 8478
For analysis purposes a figure of 9,500vpd has been adopted to ensure a robust assessment
and allow for fewer bus movements/car pooling than anticipated.
3.1.1 Assumptions:
The following assumptions are used for the trip generation calculations.
Employees transported to site by bus as indicated in Table 3.
Triple Road Train Capacity 85t (as per Table4)
Carpooling assumed for 30% of employees for Noxious and Support Industry Sites and 3
per car
Volumes of material / goods to be transported (in ktpa) based on the Industrial Ecology
Report for the BSIA (spreadsheet dated 26 May 2011 used).
Peak Hour traffic assumed to be 10% of daily traffic. (Surveys in Pinga Street indicate 7.4
- 8%)
Rail, pipeline and conveyor options are available (as alternative modes of transport) as
indicated in the Industrial Ecology Assessment. The figures / data / volumes used in this
report are based on envisaged road traffic only (as per the industrial ecology study), with
only limited and minor provision for modal shift. In the event that roads become the
primary means of transport within the estate then this assumption and the associated
traffic volumes will need to be revisited
10% additional traffic assumed to allow for maintenance, servicing etc
For the transport assessment 9,500vpd will be assumed and 950vph.
Road Train proportion 13% will be used
Total heavy vehicle proportion of 20% assumed.
GHD | Report for LandCorp - Boodarie Strategic Industrial Area, 61/26171 | 9
3.1.2 Forecast Traffic Volumes at Intersections with GNH (Full Development 2031)
The plan provides for three access points which will ultimately provide good accessibility to the
development. The location of these as been based on separations distances which allow for
sufficient merging / weaving and ramps in the future should this be necessary and ever become
grade separated interchanges.
It should also be noted the planned Western Infrastructure Corridor (WIC) is likely to require the
lifting of the GNH over this corridor and the proximity of these works to the south will also impact
the access locations.
If access to the Port is not available via the BSIA then there will also be additional impacts to the
intersections with GNH.
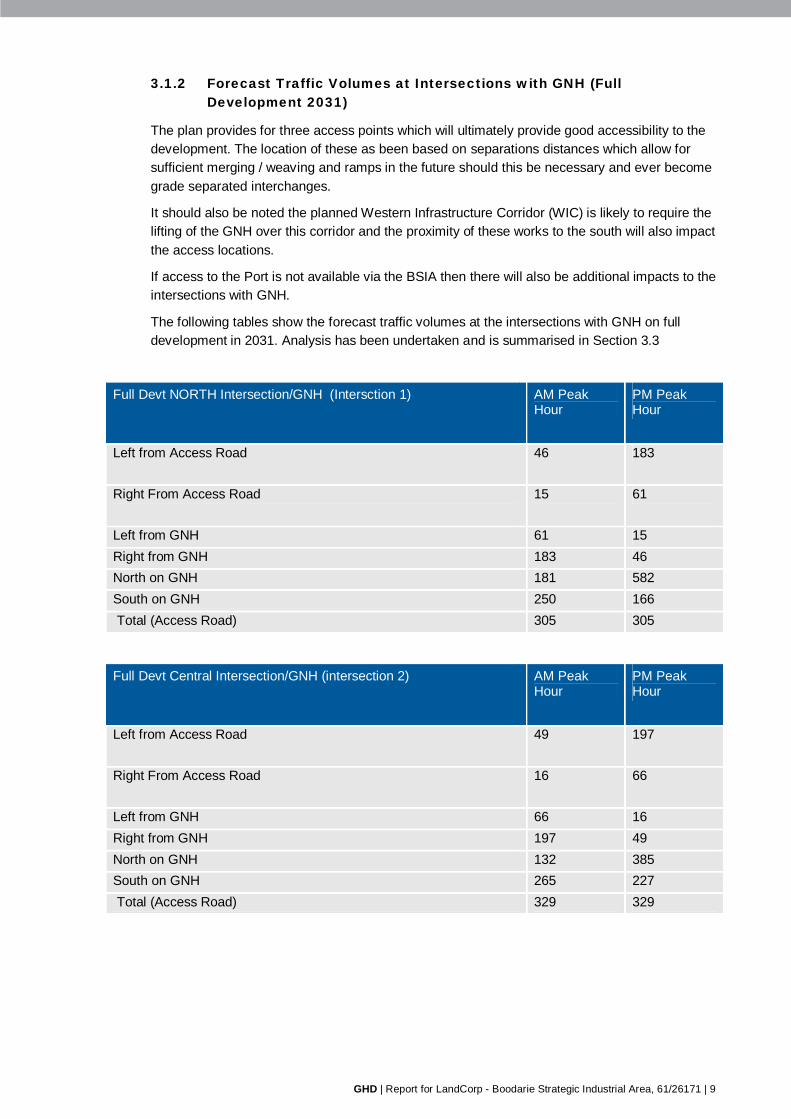
The following tables show the forecast traffic volumes at the intersections with GNH on full
development in 2031. Analysis has been undertaken and is summarised in Section 3.3
Full Devt NORTH Intersection/GNH (Intersction 1) AM Peak Hour
PM Peak Hour
Left from Access Road 46 183
Right From Access Road 15 61
Left from GNH 61 15
Right from GNH 183 46
North on GNH 181 582
South on GNH 250 166
Total (Access Road) 305 305
Full Devt Central Intersection/GNH (intersection 2) AM Peak Hour
PM Peak Hour
Left from Access Road 49 197
Right From Access Road 16 66
Left from GNH 66 16
Right from GNH 197 49
North on GNH 132 385
South on GNH 265 227
Total (Access Road) 329 329
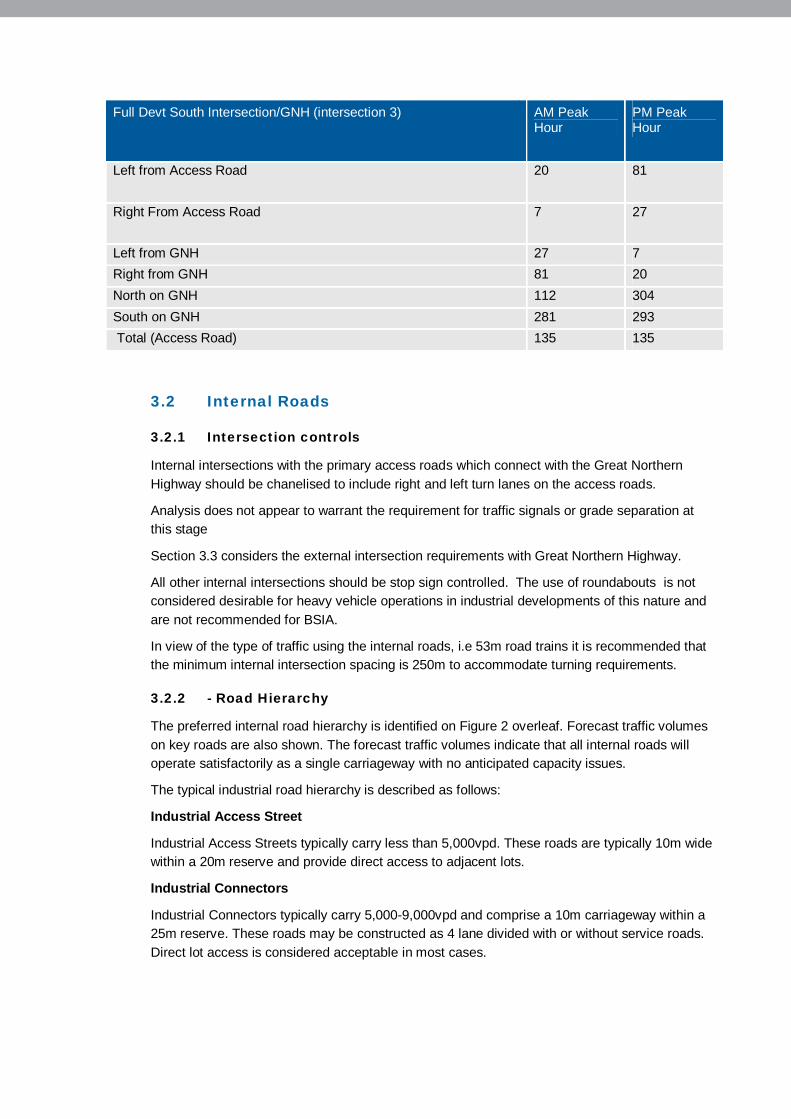
Full Devt South Intersection/GNH (intersection 3) AM Peak Hour
PM Peak Hour
Left from Access Road 20 81
Right From Access Road 7 27
Left from GNH 27 7
Right from GNH 81 20
North on GNH 112 304
South on GNH 281 293
Total (Access Road) 135 135
3.2 Internal Roads
3.2.1 Intersection controls
Internal intersections with the primary access roads which connect with the Great Northern
Highway should be chanelised to include right and left turn lanes on the access roads.
Analysis does not appear to warrant the requirement for traffic signals or grade separation at
this stage
Section 3.3 considers the external intersection requirements with Great Northern Highway.
All other internal intersections should be stop sign controlled. The use of roundabouts is not
considered desirable for heavy vehicle operations in industrial developments of this nature and
are not recommended for BSIA.
In view of the type of traffic using the internal roads, i.e 53m road trains it is recommended that
the minimum internal intersection spacing is 250m to accommodate turning requirements.
3.2.2 - Road Hierarchy
The preferred internal road hierarchy is identified on Figure 2 overleaf. Forecast traffic volumes
on key roads are also shown. The forecast traffic volumes indicate that all internal roads will
operate satisfactorily as a single carriageway with no anticipated capacity issues.
The typical industrial road hierarchy is described as follows:
Industrial Access Street
Industrial Access Streets typically carry less than 5,000vpd. These roads are typically 10m wide
within a 20m reserve and provide direct access to adjacent lots.
Industrial Connectors
Industrial Connectors typically carry 5,000-9,000vpd and comprise a 10m carriageway within a
25m reserve. These roads may be constructed as 4 lane divided with or without service roads.
Direct lot access is considered acceptable in most cases.

GHD | Report for LandCorp - Boodarie Strategic Industrial Area, 61/26171 | 11
Industrial Arterial
Industrial Arterial Routes are major roads carrying in excess of 9,000vpd. These roads are
typically constructed as 4 lane divided carriageways with a 15m median to accommodate truck
turning movements.
Commentary
All forecast traffic volumes for full development are shown on Figure 2.
The forecast traffic volumes on the access roads connecting to GNH 1,350-3,050vpd indicate
that a single carriageway is likely to accommodate development traffic.
In view of the road train activity accessing the Estate it is considered that the access roads from
GNH should accommodate right turn facilities to allow following traffic to pass.
It is considered the cross section should be as follows: 2 x 5.1m verge, 2 x 5m traffic lane, 15m
median with turn lanes where required. The overall reserve width is 35.2m. (Servicing
requirements will also need to be added to the reserve width or by way of easements)
It is considered that all other roads should be 10m wide within a 25m reserve.(Servicing
requirements will also need to be added to the reserve width or by way of easements)
3.2.3 Pedestrian Facilities
It is important to provide pedestrian paths on at least one side of all Estate roads for the ultimate
development to accommodate likely requirements. Typically industrial developments include
lunch bar facilities and bus stops and paths should therefore be provided to facilitate access. In
the short term paths are unlikely to be required until development generates pedestrian
demand.
3.2.4 Cycling Facilities
The road space is generally shared where traffic volumes are below 3,000vpd, however in view
of the large vehicles likely to use the development and significant safety issues, a path network
to include shared paths with pedestrians should be provided on all roads as part of the ultimate
development. In the short term paths are unlikely to be required until development generates
significant pedestrian/cycle demand and traffic volumes approach the above levels.
A 50km/h speed limit throughout the estate is assumed.
3.3 Great Northern Highway
In view of the State Road classification, high speed posted speed 110km/h and the traffic mix an
intersection spacing of 1.5km has been adopted.
Great Northern Highway is currently a single carriageway road approximately 7m wide and has
a posted speed of 110km/h. Intersections typically exclude specific treatments to accommodate
turning and through traffic. The road is straight and relatively flat with good sight distance.
The current road capacity based on the Road Reserves Review Document for a single
carriageway is 12,000vpd at a level of service of C. The predicted volumes to 2031 (without
development traffic) is 5,720vpd and is therefore well within capacity. Adding development
traffic of 1500-6170vpd increases the daily volume to 7,220-11,890vpd indicating that volumes
will be at the upper level of capacity for a single carriageway. Upgraded intersection
requirements are discussed in this section.
In view of the increased activity associated with this development it is considered that the speed
limit should be reduced adjacent to the site from 110km/h to 90km/h.

3.3.1 Intersection Modelling
In view of the likely slow development of the BSIA i.e 10% by 2021, 25% by 2031 and full
development over 50 years, it is recommended the modelling and traffic volumes generated by
the development are reviewed periodically in order that the road and intersection requirements
can be reviewed and revised as required.
3.3.2 Northern Intersection Analysis - 2031
The intersection has been analysed assuming minor modification to the existing intersection to
allow two exit lanes in the Access Road, a speed limit of 110km/h is maintained on GNH. The
following geometry refers.
Northern Intersection – 2031
2031 Great Northern Highway/Northern Intersection AM Peak Hour Stop (Two-Way)
Movement Performance – Vehicles
Mov ID Turn Demand
Flow
HV Deg. Satn Average
Delay
Level of
Service
95% Back of Queue Prop.
Queued
Effective
Stop Rate
Average
Speed Vehicles Distance
veh/h % v/c sec veh m per veh km/h
South: GNH South
1 L 61 20.0 0.142 15.1 LOS C 0.0 0.0 0.00 1.54 65.9
2 T 181 20.0 0.142 0.0 LOS A 0.0 0.0 0.00 0.00 110.0
Approach 242 20.0 0.142 3.8 NA 0.0 0.0 0.00 0.39 97.5
North: GNH North
8 T 250 20.0 0.384 3.9 LOS A 3.9 33.9 0.63 0.00 72.7
9 R 183 20.0 0.384 19.1 LOS C 3.9 33.9 0.63 1.08 66.9
Approach 433 20.0 0.384 10.3 NA 3.9 33.9 0.63 0.46 70.6
West: Northern Access Road
10 L 46 20.0 0.070 14.9 LOS B 0.3 2.4 0.40 0.89 54.1
12 R 15 20.0 0.143 46.1 LOS E 0.5 4.3 0.87 1.00 35.2
Approach 61 20.0 0.143 22.6 LOS C 0.5 4.3 0.51 0.92 47.8
All Vehicles 736 20.0 0.384 9.2 NA 3.9 33.9 0.41 0.47 74.3
GHD | Report for LandCorp - Boodarie Strategic Industrial Area, 61/26171 | 13
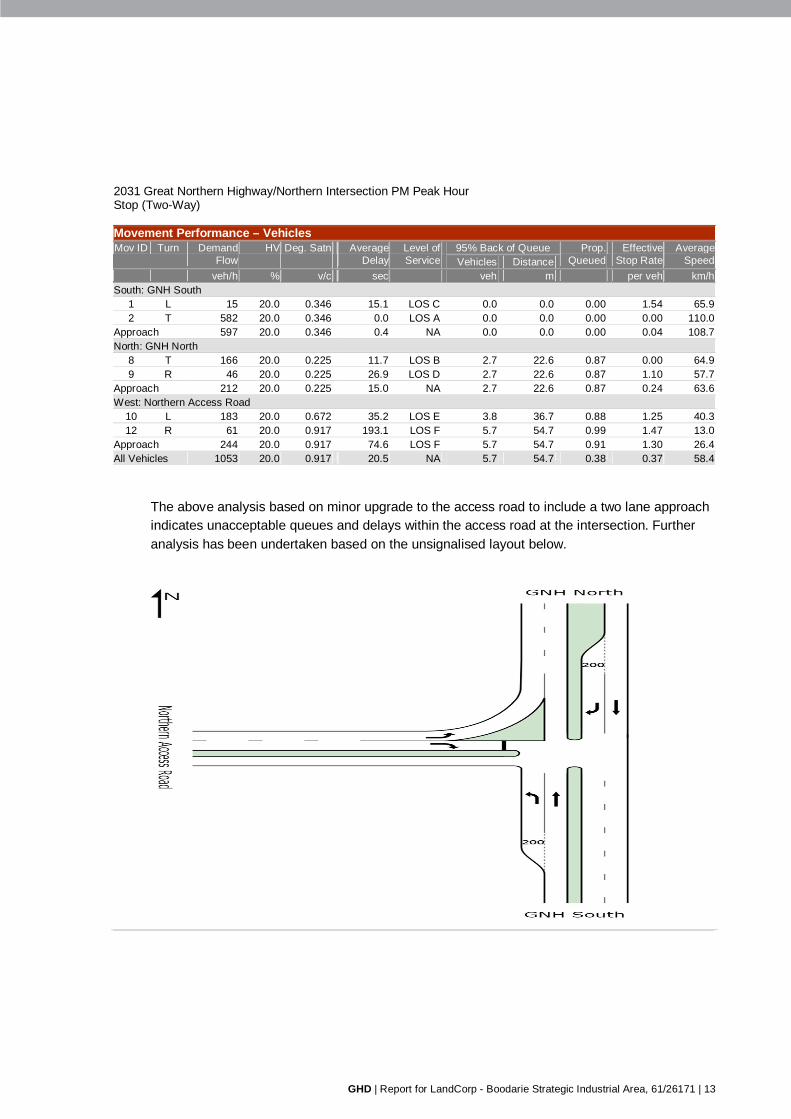
2031 Great Northern Highway/Northern Intersection PM Peak Hour Stop (Two-Way)
Movement Performance – Vehicles
Mov ID Turn Demand
Flow
HV Deg. Satn Average
Delay
Level of
Service
95% Back of Queue Prop.
Queued
Effective
Stop Rate
Average
Speed Vehicles Distance
veh/h % v/c sec veh m per veh km/h
South: GNH South
1 L 15 20.0 0.346 15.1 LOS C 0.0 0.0 0.00 1.54 65.9
2 T 582 20.0 0.346 0.0 LOS A 0.0 0.0 0.00 0.00 110.0
Approach 597 20.0 0.346 0.4 NA 0.0 0.0 0.00 0.04 108.7
North: GNH North
8 T 166 20.0 0.225 11.7 LOS B 2.7 22.6 0.87 0.00 64.9
9 R 46 20.0 0.225 26.9 LOS D 2.7 22.6 0.87 1.10 57.7
Approach 212 20.0 0.225 15.0 NA 2.7 22.6 0.87 0.24 63.6
West: Northern Access Road
10 L 183 20.0 0.672 35.2 LOS E 3.8 36.7 0.88 1.25 40.3
12 R 61 20.0 0.917 193.1 LOS F 5.7 54.7 0.99 1.47 13.0
Approach 244 20.0 0.917 74.6 LOS F 5.7 54.7 0.91 1.30 26.4
All Vehicles 1053 20.0 0.917 20.5 NA 5.7 54.7 0.38 0.37 58.4
The above analysis based on minor upgrade to the access road to include a two lane approach
indicates unacceptable queues and delays within the access road at the intersection. Further
analysis has been undertaken based on the unsignalised layout below.
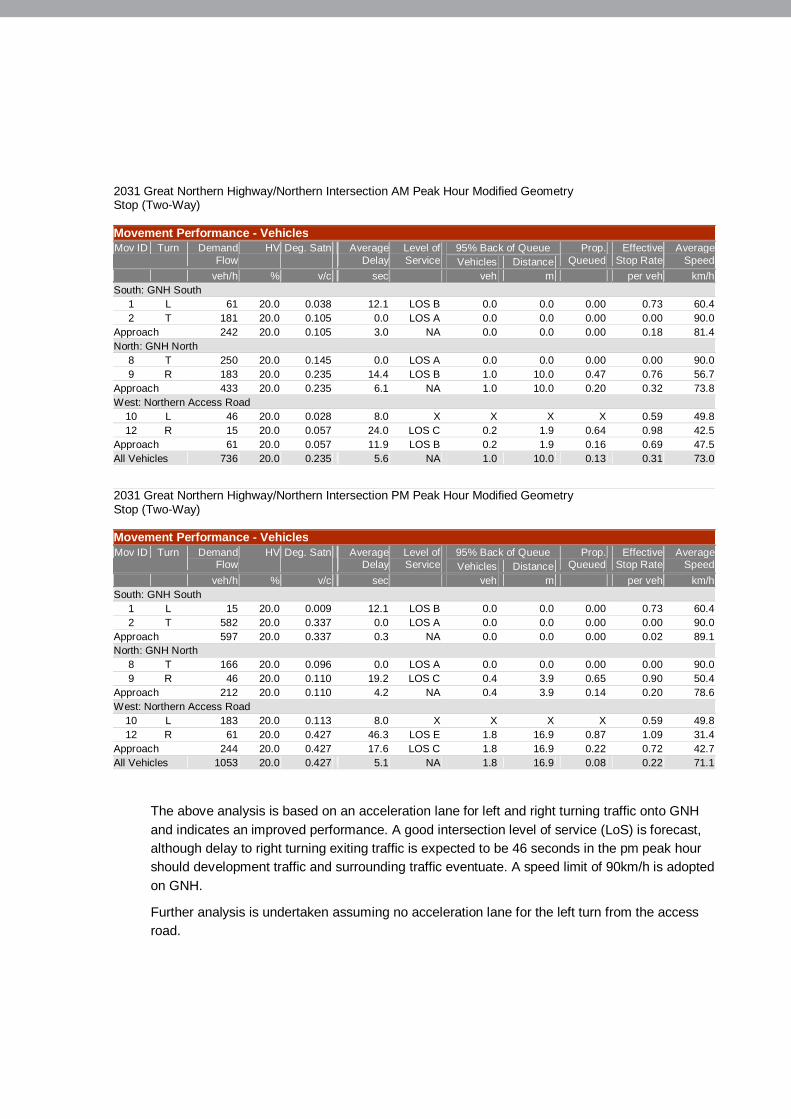
2031 Great Northern Highway/Northern Intersection AM Peak Hour Modified Geometry Stop (Two-Way)
Movement Performance - Vehicles
Mov ID Turn Demand
Flow
HV Deg. Satn Average
Delay
Level of
Service
95% Back of Queue Prop.
Queued
Effective
Stop Rate
Average
Speed Vehicles Distance
veh/h % v/c sec veh m per veh km/h
South: GNH South
1 L 61 20.0 0.038 12.1 LOS B 0.0 0.0 0.00 0.73 60.4
2 T 181 20.0 0.105 0.0 LOS A 0.0 0.0 0.00 0.00 90.0
Approach 242 20.0 0.105 3.0 NA 0.0 0.0 0.00 0.18 81.4
North: GNH North
8 T 250 20.0 0.145 0.0 LOS A 0.0 0.0 0.00 0.00 90.0
9 R 183 20.0 0.235 14.4 LOS B 1.0 10.0 0.47 0.76 56.7
Approach 433 20.0 0.235 6.1 NA 1.0 10.0 0.20 0.32 73.8
West: Northern Access Road
10 L 46 20.0 0.028 8.0 X X X X 0.59 49.8
12 R 15 20.0 0.057 24.0 LOS C 0.2 1.9 0.64 0.98 42.5
Approach 61 20.0 0.057 11.9 LOS B 0.2 1.9 0.16 0.69 47.5
All Vehicles 736 20.0 0.235 5.6 NA 1.0 10.0 0.13 0.31 73.0
2031 Great Northern Highway/Northern Intersection PM Peak Hour Modified Geometry Stop (Two-Way)
Movement Performance - Vehicles
Mov ID Turn Demand Flow
HV Deg. Satn Average Delay
Level of Service
95% Back of Queue Prop. Queued
Effective Stop Rate
Average Speed Vehicles Distance
veh/h % v/c sec veh m per veh km/h
South: GNH South
1 L 15 20.0 0.009 12.1 LOS B 0.0 0.0 0.00 0.73 60.4
2 T 582 20.0 0.337 0.0 LOS A 0.0 0.0 0.00 0.00 90.0
Approach 597 20.0 0.337 0.3 NA 0.0 0.0 0.00 0.02 89.1
North: GNH North
8 T 166 20.0 0.096 0.0 LOS A 0.0 0.0 0.00 0.00 90.0
9 R 46 20.0 0.110 19.2 LOS C 0.4 3.9 0.65 0.90 50.4
Approach 212 20.0 0.110 4.2 NA 0.4 3.9 0.14 0.20 78.6
West: Northern Access Road
10 L 183 20.0 0.113 8.0 X X X X 0.59 49.8
12 R 61 20.0 0.427 46.3 LOS E 1.8 16.9 0.87 1.09 31.4
Approach 244 20.0 0.427 17.6 LOS C 1.8 16.9 0.22 0.72 42.7
All Vehicles 1053 20.0 0.427 5.1 NA 1.8 16.9 0.08 0.22 71.1
The above analysis is based on an acceleration lane for left and right turning traffic onto GNH
and indicates an improved performance. A good intersection level of service (LoS) is forecast,
although delay to right turning exiting traffic is expected to be 46 seconds in the pm peak hour
should development traffic and surrounding traffic eventuate. A speed limit of 90km/h is adopted
on GNH.
Further analysis is undertaken assuming no acceleration lane for the left turn from the access
road.
GHD | Report for LandCorp - Boodarie Strategic Industrial Area, 61/26171 | 15
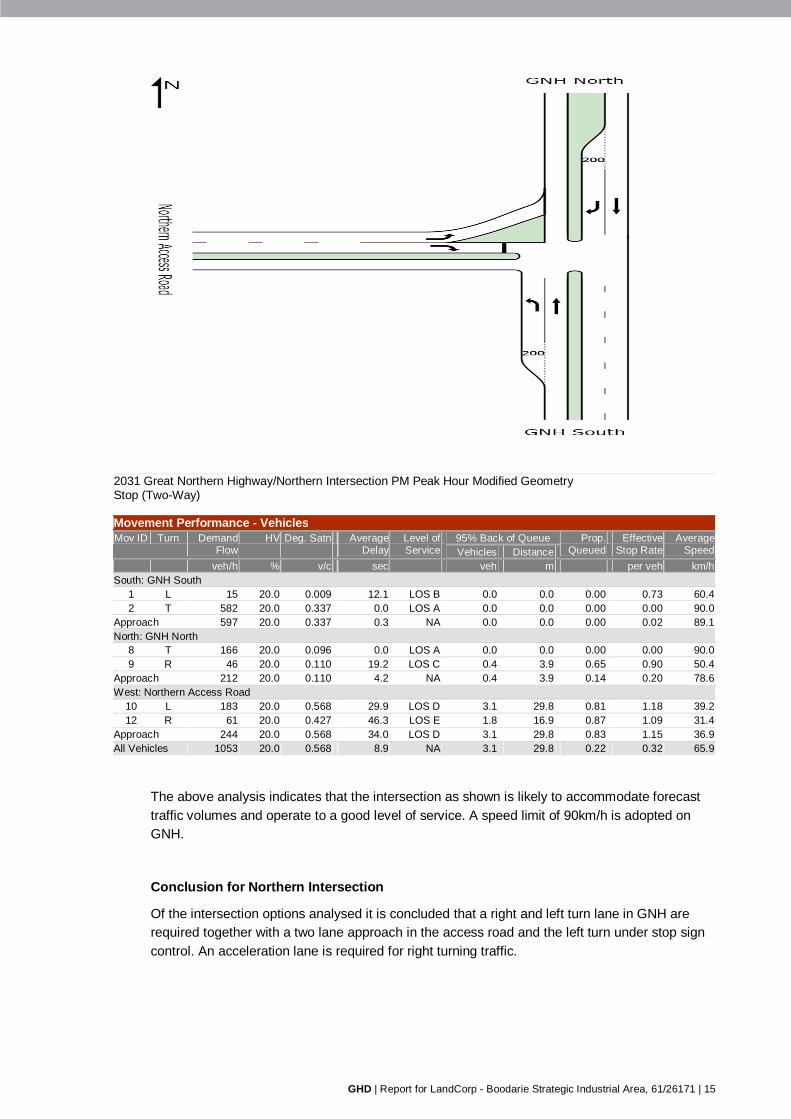
2031 Great Northern Highway/Northern Intersection PM Peak Hour Modified Geometry Stop (Two-Way)
Movement Performance - Vehicles
Mov ID Turn Demand Flow
HV Deg. Satn Average Delay
Level of Service
95% Back of Queue Prop. Queued
Effective Stop Rate
Average Speed Vehicles Distance
veh/h % v/c sec veh m per veh km/h
South: GNH South
1 L 15 20.0 0.009 12.1 LOS B 0.0 0.0 0.00 0.73 60.4
2 T 582 20.0 0.337 0.0 LOS A 0.0 0.0 0.00 0.00 90.0
Approach 597 20.0 0.337 0.3 NA 0.0 0.0 0.00 0.02 89.1
North: GNH North
8 T 166 20.0 0.096 0.0 LOS A 0.0 0.0 0.00 0.00 90.0
9 R 46 20.0 0.110 19.2 LOS C 0.4 3.9 0.65 0.90 50.4
Approach 212 20.0 0.110 4.2 NA 0.4 3.9 0.14 0.20 78.6
West: Northern Access Road
10 L 183 20.0 0.568 29.9 LOS D 3.1 29.8 0.81 1.18 39.2
12 R 61 20.0 0.427 46.3 LOS E 1.8 16.9 0.87 1.09 31.4
Approach 244 20.0 0.568 34.0 LOS D 3.1 29.8 0.83 1.15 36.9
All Vehicles 1053 20.0 0.568 8.9 NA 3.1 29.8 0.22 0.32 65.9
The above analysis indicates that the intersection as shown is likely to accommodate forecast
traffic volumes and operate to a good level of service. A speed limit of 90km/h is adopted on
GNH.
Conclusion for Northern Intersection
Of the intersection options analysed it is concluded that a right and left turn lane in GNH are
required together with a two lane approach in the access road and the left turn under stop sign
control. An acceleration lane is required for right turning traffic.
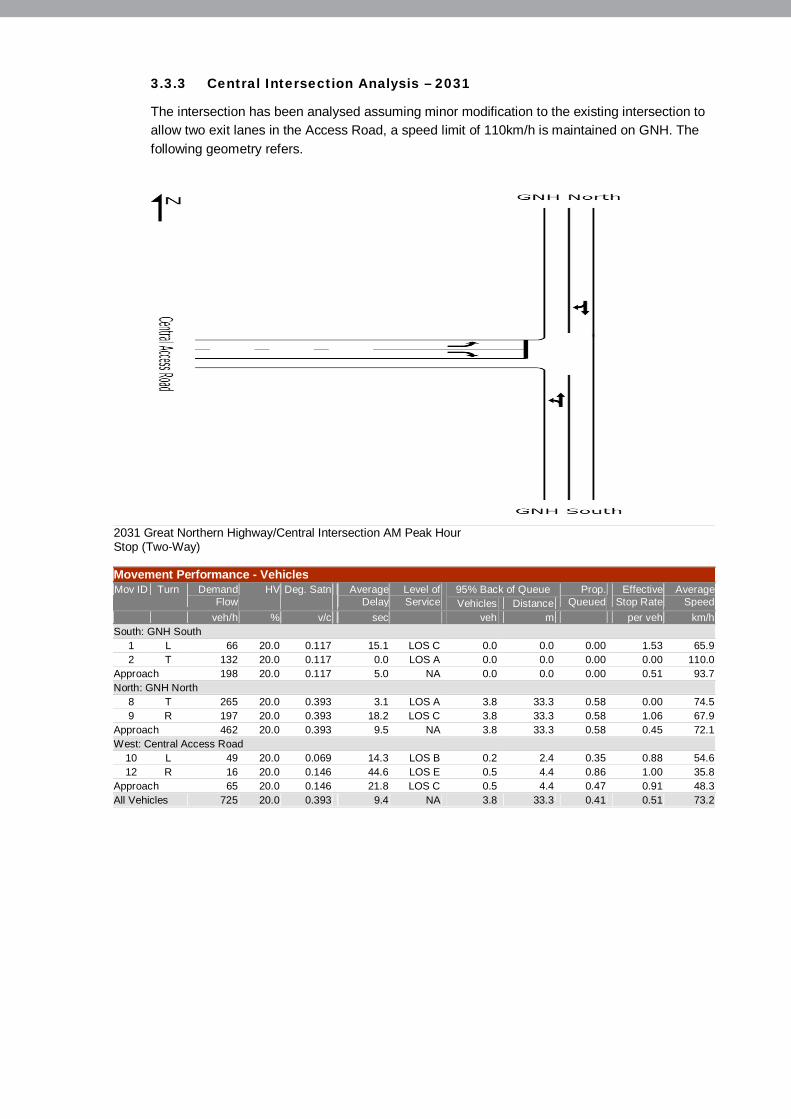
3.3.3 Central Intersection Analysis – 2031
The intersection has been analysed assuming minor modification to the existing intersection to
allow two exit lanes in the Access Road, a speed limit of 110km/h is maintained on GNH. The
following geometry refers.
2031 Great Northern Highway/Central Intersection AM Peak Hour Stop (Two-Way)
Movement Performance - Vehicles
Mov ID Turn Demand
Flow
HV Deg. Satn Average
Delay
Level of
Service
95% Back of Queue Prop.
Queued
Effective
Stop Rate
Average
Speed Vehicles Distance
veh/h % v/c sec veh m per veh km/h
South: GNH South
1 L 66 20.0 0.117 15.1 LOS C 0.0 0.0 0.00 1.53 65.9
2 T 132 20.0 0.117 0.0 LOS A 0.0 0.0 0.00 0.00 110.0
Approach 198 20.0 0.117 5.0 NA 0.0 0.0 0.00 0.51 93.7
North: GNH North
8 T 265 20.0 0.393 3.1 LOS A 3.8 33.3 0.58 0.00 74.5
9 R 197 20.0 0.393 18.2 LOS C 3.8 33.3 0.58 1.06 67.9
Approach 462 20.0 0.393 9.5 NA 3.8 33.3 0.58 0.45 72.1
West: Central Access Road
10 L 49 20.0 0.069 14.3 LOS B 0.2 2.4 0.35 0.88 54.6
12 R 16 20.0 0.146 44.6 LOS E 0.5 4.4 0.86 1.00 35.8
Approach 65 20.0 0.146 21.8 LOS C 0.5 4.4 0.47 0.91 48.3
All Vehicles 725 20.0 0.393 9.4 NA 3.8 33.3 0.41 0.51 73.2

GHD | Report for LandCorp - Boodarie Strategic Industrial Area, 61/26171 | 17
2031 Great Northern Highway/Central Intersection PM Peak Hour Stop (Two-Way)
Movement Performance - Vehicles
Mov ID Turn Demand
Flow
HV Deg. Satn Average
Delay
Level of
Service
95% Back of Queue Prop.
Queued
Effective
Stop Rate
Average
Speed Vehicles Distance
veh/h % v/c sec veh m per veh km/h
South: GNH South
1 L 16 20.0 0.233 15.1 LOS C 0.0 0.0 0.00 1.54 65.9
2 T 385 20.0 0.233 0.0 LOS A 0.0 0.0 0.00 0.00 110.0
Approach 401 20.0 0.233 0.6 NA 0.0 0.0 0.00 0.06 107.9
North: GNH North
8 T 227 20.0 0.218 5.6 LOS A 2.2 18.5 0.68 0.00 73.4
9 R 49 20.0 0.218 20.8 LOS C 2.2 18.5 0.68 1.18 65.9
Approach 276 20.0 0.218 8.3 NA 2.2 18.5 0.68 0.21 72.3
West: Central Access Road
10 L 197 20.0 0.437 21.1 LOS C 2.3 22.0 0.65 1.10 49.1
12 R 66 20.0 0.639 72.7 LOS F 2.8 27.3 0.94 1.17 26.9
Approach 263 20.0 0.639 34.1 LOS D 2.8 27.3 0.72 1.12 40.7
All Vehicles 940 20.0 0.639 12.2 NA 2.8 27.3 0.40 0.40 67.1
The above analysis based on minor upgrade to the access road to include a two lane approach
indicates unacceptable queues and delays within the access road at the intersection. Further
analysis has been undertaken based on the unsignalised layout below.
2031 Great Northern Highway/Central Intersection AM Peak Hour Modified Geometry Stop (Two-Way)
Movement Performance - Vehicles
Mov ID Turn Demand Flow
HV Deg. Satn Average Delay
Level of Service
95% Back of Queue Prop. Queued
Effective Stop Rate
Average Speed Vehicles Distance
veh/h % v/c sec veh m per veh km/h
South: GNH South
1 L 66 20.0 0.041 12.1 LOS B 0.0 0.0 0.00 0.73 60.4
2 T 132 20.0 0.076 0.0 LOS A 0.0 0.0 0.00 0.00 90.0
Approach 198 20.0 0.076 4.0 NA 0.0 0.0 0.00 0.24 78.9
North: GNH North
8 T 265 20.0 0.154 0.0 LOS A 0.0 0.0 0.00 0.00 90.0
9 R 197 20.0 0.236 13.9 LOS B 1.1 10.3 0.43 0.73 57.4
Approach 462 20.0 0.236 5.9 NA 1.1 10.3 0.18 0.31 74.2
West: Central Access Road
10 L 49 20.0 0.030 8.0 X X X X 0.59 49.8
12 R 16 20.0 0.057 22.8 LOS C 0.2 1.9 0.61 0.97 43.3
Approach 65 20.0 0.057 11.6 LOS B 0.2 1.9 0.15 0.68 47.8
All Vehicles 725 20.0 0.236 5.9 NA 1.1 10.3 0.13 0.33 72.0

2031 Great Northern Highway/Central Intersection PM Peak Hour Modified Geometry Stop (Two-Way)
Movement Performance - Vehicles
Mov ID Turn Demand
Flow
HV Deg. Satn Average
Delay
Level of
Service
95% Back of Queue Prop.
Queued
Effective
Stop Rate
Average
Speed Vehicles Distance
veh/h % v/c sec veh m per veh km/h
South: GNH South
1 L 16 20.0 0.010 12.1 LOS B 0.0 0.0 0.00 0.73 60.4
2 T 385 20.0 0.223 0.0 LOS A 0.0 0.0 0.00 0.00 90.0
Approach 401 20.0 0.223 0.5 NA 0.0 0.0 0.00 0.03 88.6
North: GNH North
8 T 227 20.0 0.132 0.0 LOS A 0.0 0.0 0.00 0.00 90.0
9 R 49 20.0 0.082 15.9 LOS C 0.3 3.0 0.53 0.80 54.6
Approach 276 20.0 0.132 2.8 NA 0.3 3.0 0.09 0.14 82.1
West: Central Access Road
10 L 197 20.0 0.121 8.0 X X X X 0.59 49.8
12 R 66 20.0 0.273 28.0 LOS D 1.1 10.7 0.72 1.03 40.0
Approach 263 20.0 0.273 13.0 LOS B 1.1 10.7 0.18 0.70 46.5
All Vehicles 940 20.0 0.273 4.7 NA 1.1 10.7 0.08 0.25 70.7
The above analysis is based on an acceleration lane for left and right turning traffic onto GNH
and indicates an improved performance. A good intersection level of service (LoS) is forecast. A
speed limit of 90km/h is adopted on GNH.
Further analysis is undertaken assuming no acceleration lane for the left turn from the access
road.

GHD | Report for LandCorp - Boodarie Strategic Industrial Area, 61/26171 | 19
2031 Great Northern Highway/Central Intersection PM Peak Hour Modified Geometry. No acceleration lane from access road Stop (Two-Way)
Movement Performance - Vehicles
Mov ID Turn Demand Flow
HV Deg. Satn Average Delay
Level of Service
95% Back of Queue Prop. Queued
Effective Stop Rate
Average Speed Vehicles Distance
veh/h % v/c sec veh m per veh km/h
South: GNH South
1 L 16 20.0 0.010 12.1 LOS B 0.0 0.0 0.00 0.73 60.4
2 T 385 20.0 0.223 0.0 LOS A 0.0 0.0 0.00 0.00 90.0
Approach 401 20.0 0.223 0.5 NA 0.0 0.0 0.00 0.03 88.6
North: GNH North
8 T 227 20.0 0.132 0.0 LOS A 0.0 0.0 0.00 0.00 90.0
9 R 49 20.0 0.082 15.9 LOS C 0.3 3.0 0.53 0.80 54.6
Approach 276 20.0 0.132 2.8 NA 0.3 3.0 0.09 0.14 82.1
West: Central Access Road
10 L 197 20.0 0.411 21.3 LOS C 2.2 20.7 0.63 1.08 44.6
12 R 66 20.0 0.273 28.0 LOS D 1.1 10.7 0.72 1.03 40.0
Approach 263 20.0 0.411 23.0 LOS C 2.2 20.7 0.65 1.07 43.4
All Vehicles 940 20.0 0.411 7.5 NA 2.2 20.7 0.21 0.35 67.5
The above analysis indicates that the intersection as shown is likely to accommodate forecast
traffic volumes and operate to a good level of service. A speed limit of 90km/h is adopted on
GNH.
Conclusion for Central Access
Of the intersection options analysed it is concluded that a right and left turn lane in GNH are
required together with a two lane approach in the access road and the left turn under stop sign
control. An acceleration lane is required for right turning traffic.
3.3.4 Southern Intersection Analysis – 2031
The intersection has been analysed assuming minor modification to the existing intersection to
allow two exit lanes in the Access Road, a speed limit of 110km/h is maintained on GNH. The
following geometry refers.

2031 Great Northern Highway/Southern Intersection AM Peak Hour Stop (Two-Way)
Movement Performance - Vehicles
Mov ID Turn Demand Flow
HV Deg. Satn Average Delay
Level of Service
95% Back of Queue Prop. Queued
Effective Stop Rate
Average Speed Vehicles Distance
veh/h % v/c sec veh m per veh km/h
South: GNH South
1 L 27 20.0 0.082 15.1 LOS C 0.0 0.0 0.00 1.54 65.9
2 T 112 20.0 0.082 0.0 LOS A 0.0 0.0 0.00 0.00 110.0
Approach 139 20.0 0.082 2.9 NA 0.0 0.0 0.00 0.30 100.2
North: GNH North
8 T 281 20.0 0.252 1.5 LOS A 2.0 17.1 0.42 0.00 83.7
9 R 81 20.0 0.252 16.7 LOS C 2.0 17.1 0.42 1.20 70.1
Approach 362 20.0 0.252 4.9 NA 2.0 17.1 0.42 0.27 81.0
West: Southern Access Road
10 L 20 20.0 0.026 13.8 LOS B 0.1 0.9 0.29 0.87 55.0
12 R 7 20.0 0.039 30.1 LOS D 0.1 1.3 0.75 1.00 43.1
Approach 27 20.0 0.039 18.0 LOS C 0.1 1.3 0.41 0.90 51.3
All Vehicles 528 20.0 0.252 5.0 NA 2.0 17.1 0.31 0.31 82.7
2031 Great Northern Highway/Southern Intersection PM Peak Hour Stop (Two-Way)
Movement Performance - Vehicles
Mov ID Turn Demand Flow
HV Deg. Satn Average Delay
Level of Service
95% Back of Queue Prop. Queued
Effective Stop Rate
Average Speed Vehicles Distance
veh/h % v/c sec veh m per veh km/h
South: GNH South
1 L 7 20.0 0.180 15.1 LOS C 0.0 0.0 0.00 1.54 65.9
2 T 304 20.0 0.180 0.0 LOS A 0.0 0.0 0.00 0.00 110.0
Approach 311 20.0 0.180 0.3 NA 0.0 0.0 0.00 0.03 108.8
North: GNH North
8 T 293 20.0 0.199 3.7 LOS A 2.1 17.2 0.64 0.00 76.6
9 R 20 20.0 0.199 18.9 LOS C 2.1 17.2 0.64 1.14 69.1
Approach 313 20.0 0.199 4.7 NA 2.1 17.2 0.64 0.07 76.2
West: Southern Access Road
10 L 81 20.0 0.149 16.6 LOS C 0.5 5.3 0.50 0.96 52.7
12 R 27 20.0 0.226 44.4 LOS E 0.8 7.4 0.86 1.02 35.9
Approach 108 20.0 0.226 23.6 LOS C 0.8 7.4 0.59 0.97 47.2
All Vehicles 732 20.0 0.226 5.6 NA 2.1 17.2 0.36 0.19 79.2
The above analysis based on minor upgrade to the access road to include a two lane approach
indicates a reasonable operating performance although significant impacts are forecast for
southbound through traffic delay on GNH.
Further analysis has been undertaken for the geometry shown below.

GHD | Report for LandCorp - Boodarie Strategic Industrial Area, 61/26171 | 21
2031 Great Northern Highway/Southern Intersection AM Peak Hour Modified Geometry Stop (Two-Way)
Movement Performance - Vehicles
Mov ID Turn Demand Flow
HV Deg. Satn Average Delay
Level of Service
95% Back of Queue Prop. Queued
Effective Stop Rate
Average Speed Vehicles Distance
veh/h % v/c sec veh m per veh km/h
South: GNH South
1 L 27 20.0 0.017 12.1 LOS B 0.0 0.0 0.00 0.73 60.4
2 T 112 20.0 0.065 0.0 LOS A 0.0 0.0 0.00 0.00 90.0
Approach 139 20.0 0.065 2.3 NA 0.0 0.0 0.00 0.14 83.3
North: GNH North
8 T 281 20.0 0.163 0.0 LOS A 0.0 0.0 0.00 0.00 90.0
9 R 81 20.0 0.089 13.1 LOS B 0.4 3.5 0.31 0.68 58.3
Approach 362 20.0 0.163 2.9 NA 0.4 3.5 0.07 0.15 81.6
West: Southern Access Road
10 L 20 20.0 0.012 8.0 X X X X 0.59 49.8
12 R 7 20.0 0.016 17.2 LOS C 0.1 0.6 0.46 0.86 47.5
Approach 27 20.0 0.016 10.4 LOS B 0.1 0.6 0.12 0.66 49.1
All Vehicles 528 20.0 0.163 3.2 NA 0.4 3.5 0.05 0.18 79.6
2031 Great Northern Highway/Southern Intersection PM Peak Hour Modified Geometry Stop (Two-Way)
Movement Performance - Vehicles
Mov ID Turn Demand
Flow
HV Deg. Satn Average
Delay
Level of
Service
95% Back of Queue Prop.
Queued
Effective
Stop Rate
Average
Speed Vehicles Distance
veh/h % v/c sec veh m per veh km/h
South: GNH South
1 L 7 20.0 0.004 12.1 LOS B 0.0 0.0 0.00 0.73 60.4
2 T 304 20.0 0.176 0.0 LOS A 0.0 0.0 0.00 0.00 90.0
Approach 311 20.0 0.176 0.3 NA 0.0 0.0 0.00 0.02 89.2
North: GNH North
8 T 293 20.0 0.170 0.0 LOS A 0.0 0.0 0.00 0.00 90.0
9 R 20 20.0 0.029 14.6 LOS B 0.1 1.0 0.46 0.72 56.4
Approach 313 20.0 0.170 0.9 NA 0.1 1.0 0.03 0.05 87.3
West: Southern Access Road
10 L 81 20.0 0.050 8.0 X X X X 0.59 49.8
12 R 27 20.0 0.083 20.9 LOS C 0.3 2.9 0.57 0.96 44.6
Approach 108 20.0 0.083 11.2 LOS B 0.3 2.9 0.14 0.68 48.2
All Vehicles 732 20.0 0.176 2.2 NA 0.3 2.9 0.03 0.13 79.6

The above analysis is based on an acceleration lane for left and right turning traffic onto GNH
and indicates an improved performance. A good intersection level of service (LoS) is forecast. A
speed limit of 90km/h is adopted on GNH.
Further analysis has been undertaken for the geometry shown below.
2031 Great Northern Highway/Southern Intersection PM Peak Hour Modified Geometry. No lt acc lane from access rd. Stop (Two-Way)
Movement Performance - Vehicles
Mov ID Turn Demand Flow
HV Deg. Satn Average Delay
Level of Service
95% Back of Queue Prop. Queued
Effective Stop Rate
Average Speed Vehicles Distance
veh/h % v/c sec veh m per veh km/h
South: GNH South
1 L 7 20.0 0.004 12.1 LOS B 0.0 0.0 0.00 0.73 60.4
2 T 304 20.0 0.176 0.0 LOS A 0.0 0.0 0.00 0.00 90.0
Approach 311 20.0 0.176 0.3 NA 0.0 0.0 0.00 0.02 89.2
North: GNH North
8 T 293 20.0 0.170 0.0 LOS A 0.0 0.0 0.00 0.00 90.0
9 R 20 20.0 0.029 14.6 LOS B 0.1 1.0 0.46 0.72 56.4
Approach 313 20.0 0.170 0.9 NA 0.1 1.0 0.03 0.05 87.3
West: Southern Access Road
10 L 81 20.0 0.144 17.5 LOS C 0.5 5.2 0.49 0.94 47.4
12 R 27 20.0 0.083 20.9 LOS C 0.3 2.9 0.57 0.96 44.6
Approach 108 20.0 0.144 18.4 LOS C 0.5 5.2 0.51 0.95 46.7
All Vehicles 732 20.0 0.176 3.2 NA 0.5 5.2 0.09 0.17 78.1
The above analysis indicates that the intersection as shown is likely to accommodate forecast
traffic volumes and operate to a good level of service. A speed limit of 90km/h is adopted on
GNH.
GHD | Report for LandCorp - Boodarie Strategic Industrial Area, 61/26171 | 23
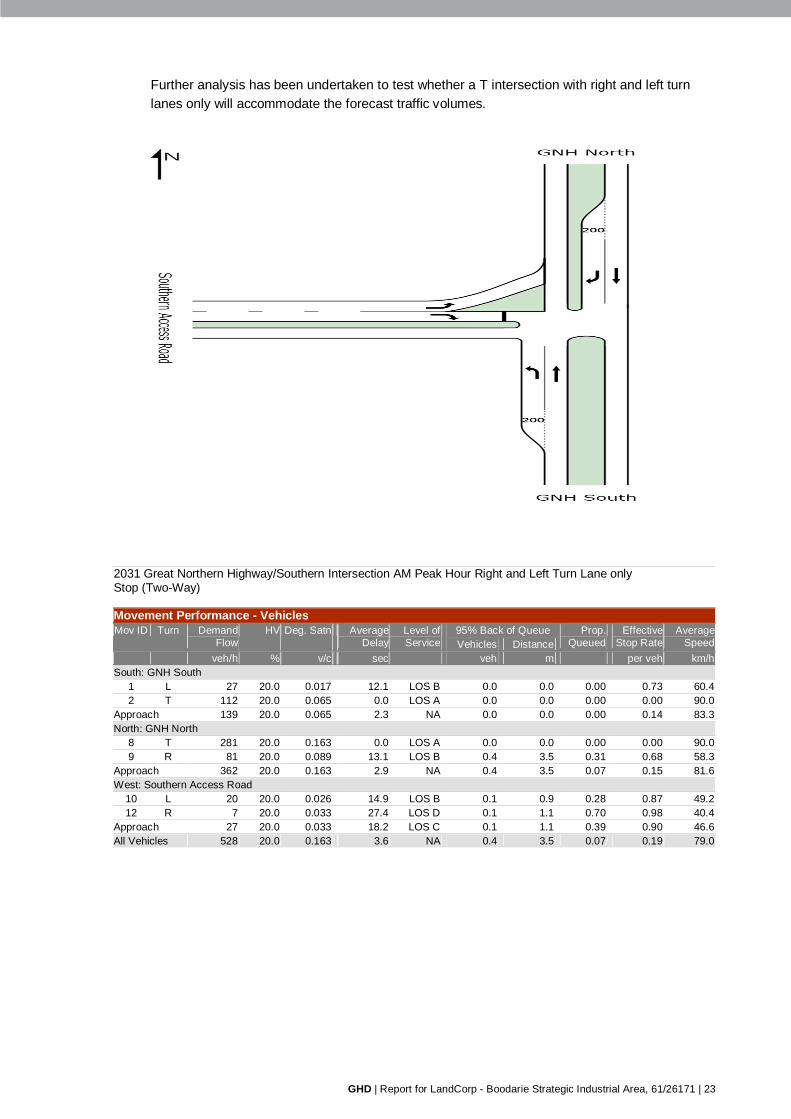
Further analysis has been undertaken to test whether a T intersection with right and left turn
lanes only will accommodate the forecast traffic volumes.
2031 Great Northern Highway/Southern Intersection AM Peak Hour Right and Left Turn Lane only Stop (Two-Way)
Movement Performance - Vehicles
Mov ID Turn Demand
Flow
HV Deg. Satn Average
Delay
Level of
Service
95% Back of Queue Prop.
Queued
Effective
Stop Rate
Average
Speed Vehicles Distance
veh/h % v/c sec veh m per veh km/h
South: GNH South
1 L 27 20.0 0.017 12.1 LOS B 0.0 0.0 0.00 0.73 60.4
2 T 112 20.0 0.065 0.0 LOS A 0.0 0.0 0.00 0.00 90.0
Approach 139 20.0 0.065 2.3 NA 0.0 0.0 0.00 0.14 83.3
North: GNH North
8 T 281 20.0 0.163 0.0 LOS A 0.0 0.0 0.00 0.00 90.0
9 R 81 20.0 0.089 13.1 LOS B 0.4 3.5 0.31 0.68 58.3
Approach 362 20.0 0.163 2.9 NA 0.4 3.5 0.07 0.15 81.6
West: Southern Access Road
10 L 20 20.0 0.026 14.9 LOS B 0.1 0.9 0.28 0.87 49.2
12 R 7 20.0 0.033 27.4 LOS D 0.1 1.1 0.70 0.98 40.4
Approach 27 20.0 0.033 18.2 LOS C 0.1 1.1 0.39 0.90 46.6
All Vehicles 528 20.0 0.163 3.6 NA 0.4 3.5 0.07 0.19 79.0

2031 Great Northern Highway/Southern Intersection PM Peak Hour Modified Geometry. Rt and LT Only Stop (Two-Way)
Movement Performance - Vehicles
Mov ID Turn Demand Flow
HV Deg. Satn Average Delay
Level of Service
95% Back of Queue Prop. Queued
Effective Stop Rate
Average Speed Vehicles Distance
veh/h % v/c sec veh m per veh km/h
South: GNH South
1 L 7 20.0 0.004 12.1 LOS B 0.0 0.0 0.00 0.73 60.4
2 T 304 20.0 0.176 0.0 LOS A 0.0 0.0 0.00 0.00 90.0
Approach 311 20.0 0.176 0.3 NA 0.0 0.0 0.00 0.02 89.2
North: GNH North
8 T 293 20.0 0.170 0.0 LOS A 0.0 0.0 0.00 0.00 90.0
9 R 20 20.0 0.029 14.7 LOS B 0.1 1.0 0.46 0.72 56.3
Approach 313 20.0 0.170 0.9 NA 0.1 1.0 0.03 0.05 87.3
West: Southern Access Road
10 L 81 20.0 0.144 17.5 LOS C 0.5 5.2 0.49 0.94 47.4
12 R 27 20.0 0.180 36.7 LOS E 0.6 5.8 0.81 1.00 35.4
Approach 108 20.0 0.180 22.3 LOS C 0.6 5.8 0.57 0.96 43.7
All Vehicles 732 20.0 0.180 3.8 NA 0.6 5.8 0.10 0.17 76.8
The above analysis indicates that the intersection as shown is likely to accommodate forecast
traffic volumes and operate to a good level of service, although a LoS of E is forecast for the
right turn movement during the pm peak hour. A speed limit of 90km/h is adopted on GNH.
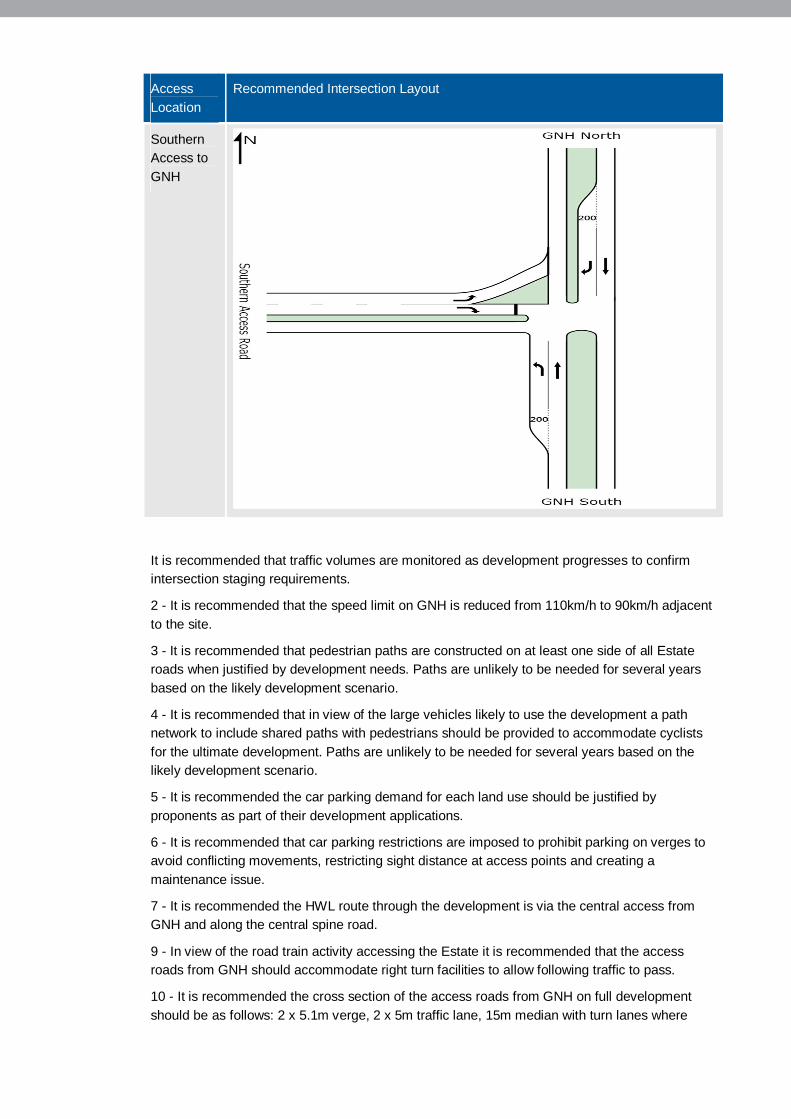
Conclusion for Southern Access
Of the intersection options analysed it is concluded that a right and left turn lane in GNH are
required together with a two lane approach in the access road and the left turn under stop sign
control. An acceleration lane is not essential for right turning traffic, however is desirable in view
of the heavy vehicle movement i.e. road trains.
3.3.5 Summary showing recommended treatment (Full Development)
Access
Location
Recommended Intersection Layout
Northern
access to
GNH

GHD | Report for LandCorp - Boodarie Strategic Industrial Area, 61/26171 | 25
Access
Location
Recommended Intersection Layout
Central
Access to
GNH
Southern
Access to
GNH
It is understood that only 25% of development is likely to occur by 2031, the above analysis
assumes full development by 2031, the intersection construction should therefore be staged to
include T Intersections with left and right turn lanes in the first stage.
As development increases the intersections will need to be upgraded as discussed to include
acceleration lanes for the right turn movement at the northern and central access. The traffic
generated by the development should be carefully monitored over time and intersection
upgrade introduced when required.

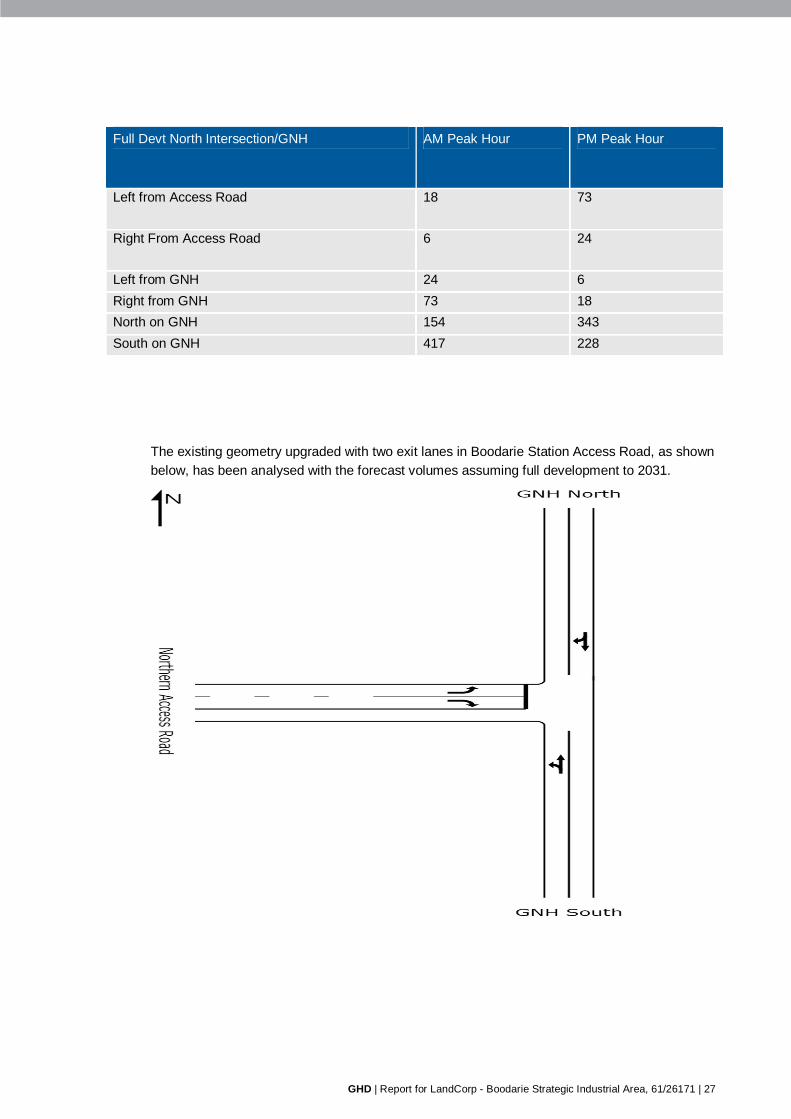
3.4 Interim Development – Noxious Area
This section considers the access requirements for the Noxious area in isolation.
A plan showing the Noxious Area under consideration is shown below.
Figure 3 Location of Noxious Area
Interim access will be via the existing Boodarie Station Access Road and analysis has been
undertaken assuming development of the Noxious area initially. This is discussed as follows:
Based on the trip generation in Table 4, the Noxious area is likely to generate around 539 trips
per day and Power Station 552vpd. Turning volumes have been derived for 2031 as follows:
GHD | Report for LandCorp - Boodarie Strategic Industrial Area, 61/26171 | 27
Full Devt North Intersection/GNH AM Peak Hour PM Peak Hour
Left from Access Road 18 73
Right From Access Road 6 24
Left from GNH 24 6
Right from GNH 73 18
North on GNH 154 343
South on GNH 417 228
The existing geometry upgraded with two exit lanes in Boodarie Station Access Road, as shown
below, has been analysed with the forecast volumes assuming full development to 2031.

2031 Great Northern Highway/Northern Intersection AM Peak Hour Noxious Only Full Devt Stop (Two-Way)
Movement Performance - Vehicles
Mov ID Turn Demand Flow
HV Deg. Satn Average Delay
Level of Service
95% Back of Queue Prop. Queued
Effective Stop Rate
Average Speed Vehicles Distance
veh/h % v/c sec veh m per veh km/h
South: GNH South
1 L 24 20.0 0.104 15.1 LOS C 0.0 0.0 0.00 1.54 65.9
2 T 154 20.0 0.104 0.0 LOS A 0.0 0.0 0.00 0.00 110.0
Approach 178 20.0 0.104 2.0 NA 0.0 0.0 0.00 0.21 103.2
North: GNH North
8 T 417 20.0 0.327 2.2 LOS A 3.1 26.5 0.54 0.00 79.2
9 R 73 20.0 0.327 17.4 LOS C 3.1 26.5 0.54 1.14 70.6
Approach 490 20.0 0.327 4.5 NA 3.1 26.5 0.54 0.17 78.2
West: Northern Access Road
10 L 18 20.0 0.025 14.3 LOS B 0.1 0.9 0.34 0.87 54.6
12 R 6 20.0 0.061 47.3 LOS E 0.2 1.8 0.87 1.00 34.7
Approach 24 20.0 0.061 22.5 LOS C 0.2 1.8 0.47 0.90 47.8
All Vehicles 692 20.0 0.327 4.5 NA 3.1 26.5 0.40 0.20 81.4
2031 Great Northern Highway/Northern Intersection PM Peak Hour Noxious Only full Devt Stop (Two-Way)
Movement Performance - Vehicles
Mov ID Turn Demand Flow
HV Deg. Satn Average Delay
Level of Service
95% Back of Queue Prop. Queued
Effective Stop Rate
Average Speed Vehicles Distance
veh/h % v/c sec veh m per veh km/h
South: GNH South
1 L 6 20.0 0.202 15.1 LOS C 0.0 0.0 0.00 1.54 65.9
2 T 343 20.0 0.202 0.0 LOS A 0.0 0.0 0.00 0.00 110.0
Approach 349 20.0 0.202 0.3 NA 0.0 0.0 0.00 0.03 109.1
North: GNH North
8 T 228 20.0 0.161 4.1 LOS A 1.7 13.8 0.64 0.00 76.3
9 R 18 20.0 0.161 19.3 LOS C 1.7 13.8 0.64 1.15 68.2
Approach 246 20.0 0.161 5.3 NA 1.7 13.8 0.64 0.08 75.8
West: Northern Access Road
10 L 73 20.0 0.146 17.3 LOS C 0.5 5.1 0.53 0.97 52.1
12 R 24 20.0 0.178 38.8 LOS E 0.6 5.7 0.83 1.00 38.4
Approach 97 20.0 0.178 22.7 LOS C 0.6 5.7 0.60 0.98 47.9
All Vehicles 692 20.0 0.202 5.2 NA 1.7 13.8 0.31 0.18 81.8
The analysis for the Noxious Development (full development) only, indicates that the
intersection with Great Northern Highway is forecast to operate to a good level of service
assuming the Noxious industry is fully developed by 2031.
It is noted that southbound through traffic speed on Great Northern Highway is likely to be
impacted upon at peak times and localised widening should be considered to reduce the risk of
rear end collision caused by traffic being unable to pass right turning traffic.
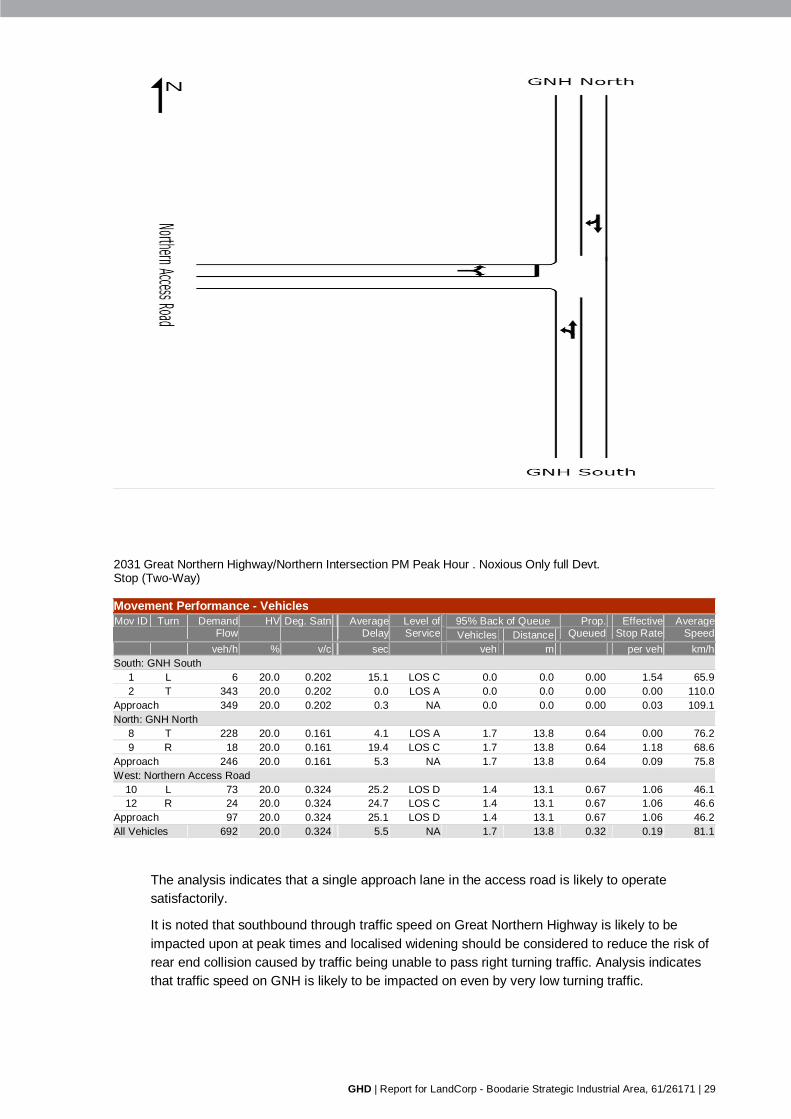
A check of the current geometry has also been undertaken with a single lane approach in the
access road and is discussed as follows:
GHD | Report for LandCorp - Boodarie Strategic Industrial Area, 61/26171 | 29
2031 Great Northern Highway/Northern Intersection PM Peak Hour . Noxious Only full Devt. Stop (Two-Way)
Movement Performance - Vehicles
Mov ID Turn Demand Flow
HV Deg. Satn Average Delay
Level of Service
95% Back of Queue Prop. Queued
Effective Stop Rate
Average Speed Vehicles Distance
veh/h % v/c sec veh m per veh km/h
South: GNH South
1 L 6 20.0 0.202 15.1 LOS C 0.0 0.0 0.00 1.54 65.9
2 T 343 20.0 0.202 0.0 LOS A 0.0 0.0 0.00 0.00 110.0
Approach 349 20.0 0.202 0.3 NA 0.0 0.0 0.00 0.03 109.1
North: GNH North
8 T 228 20.0 0.161 4.1 LOS A 1.7 13.8 0.64 0.00 76.2
9 R 18 20.0 0.161 19.4 LOS C 1.7 13.8 0.64 1.18 68.6
Approach 246 20.0 0.161 5.3 NA 1.7 13.8 0.64 0.09 75.8
West: Northern Access Road
10 L 73 20.0 0.324 25.2 LOS D 1.4 13.1 0.67 1.06 46.1
12 R 24 20.0 0.324 24.7 LOS C 1.4 13.1 0.67 1.06 46.6
Approach 97 20.0 0.324 25.1 LOS D 1.4 13.1 0.67 1.06 46.2
All Vehicles 692 20.0 0.324 5.5 NA 1.7 13.8 0.32 0.19 81.1
The analysis indicates that a single approach lane in the access road is likely to operate
satisfactorily.
It is noted that southbound through traffic speed on Great Northern Highway is likely to be
impacted upon at peak times and localised widening should be considered to reduce the risk of
rear end collision caused by traffic being unable to pass right turning traffic. Analysis indicates
that traffic speed on GNH is likely to be impacted on even by very low turning traffic.

3.5 Austroads Warrants for Intersection Treatment
The following chart indicates the warrants for intersection treatment based on turning traffic
volumes and design speed.
GHD | Report for LandCorp - Boodarie Strategic Industrial Area, 61/26171 | 31
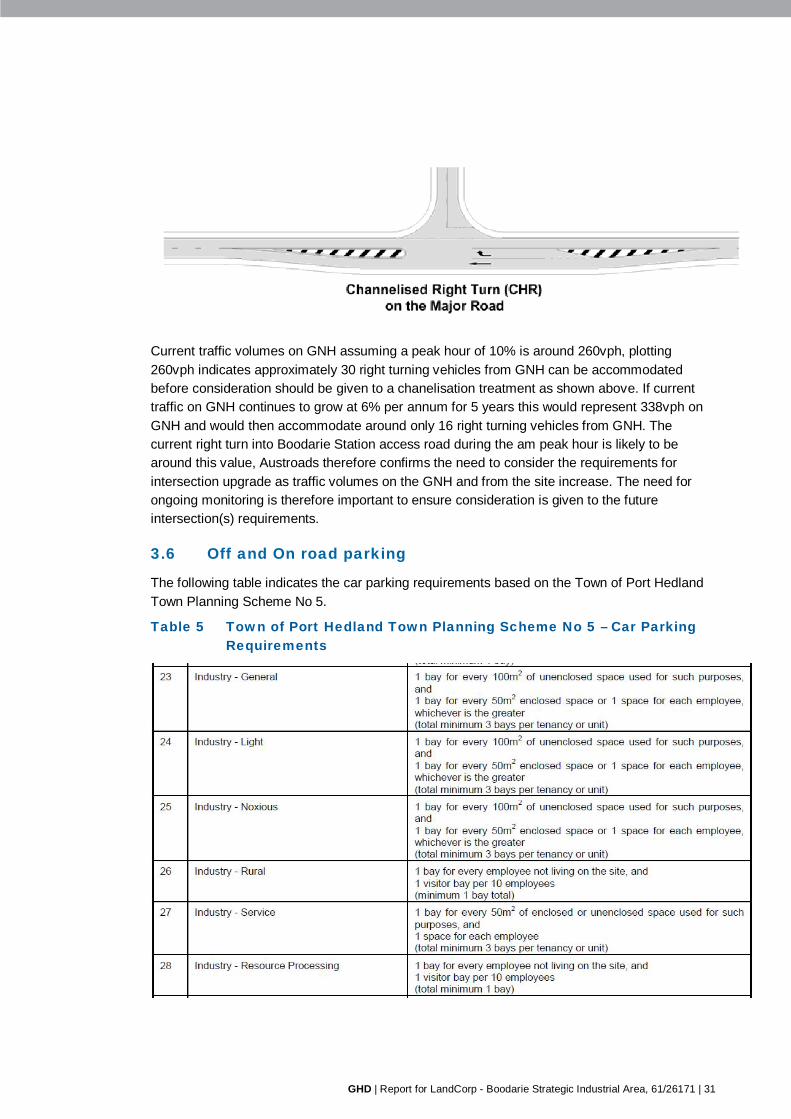
Current traffic volumes on GNH assuming a peak hour of 10% is around 260vph, plotting
260vph indicates approximately 30 right turning vehicles from GNH can be accommodated
before consideration should be given to a chanelisation treatment as shown above. If current
traffic on GNH continues to grow at 6% per annum for 5 years this would represent 338vph on
GNH and would then accommodate around only 16 right turning vehicles from GNH. The
current right turn into Boodarie Station access road during the am peak hour is likely to be
around this value, Austroads therefore confirms the need to consider the requirements for
intersection upgrade as traffic volumes on the GNH and from the site increase. The need for
ongoing monitoring is therefore important to ensure consideration is given to the future
intersection(s) requirements.
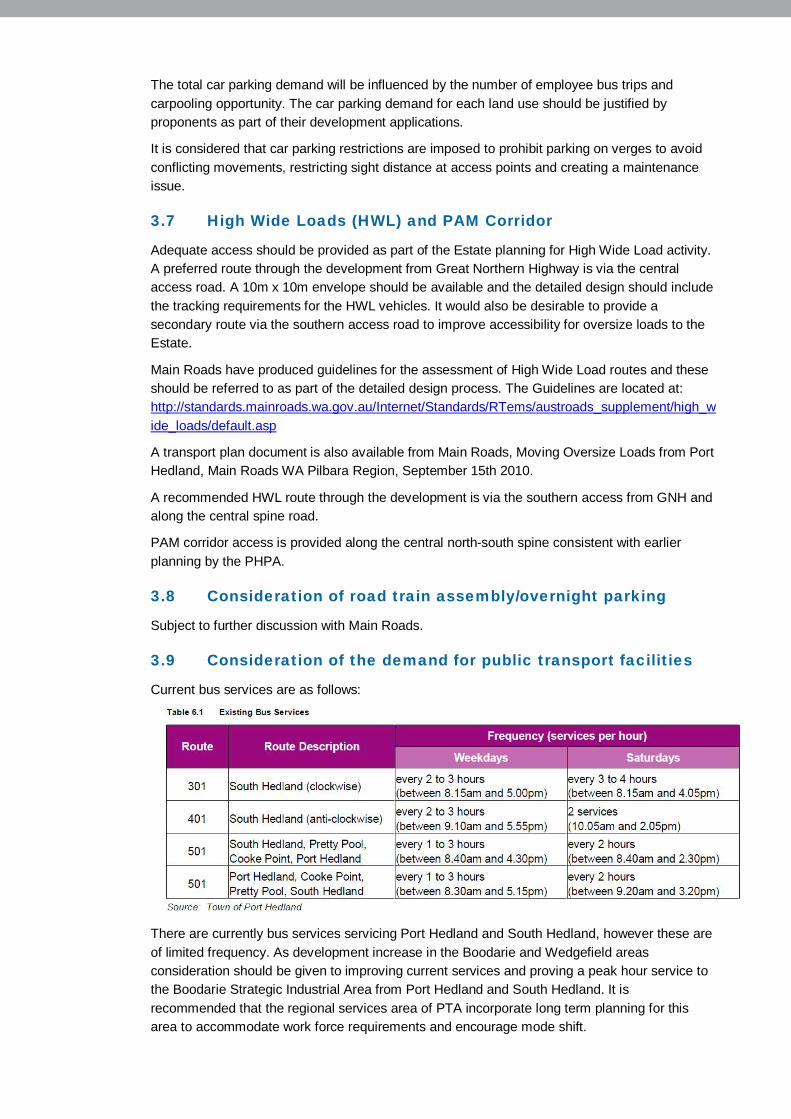
3.6 Off and On road parking
The following table indicates the car parking requirements based on the Town of Port Hedland
Town Planning Scheme No 5.
Table 5 Town of Port Hedland Town Planning Scheme No 5 – Car Parking Requirements
The total car parking demand will be influenced by the number of employee bus trips and
carpooling opportunity. The car parking demand for each land use should be justified by
proponents as part of their development applications.
It is considered that car parking restrictions are imposed to prohibit parking on verges to avoid
conflicting movements, restricting sight distance at access points and creating a maintenance
issue.
3.7 High Wide Loads (HWL) and PAM Corridor
Adequate access should be provided as part of the Estate planning for High Wide Load activity.
A preferred route through the development from Great Northern Highway is via the central
access road. A 10m x 10m envelope should be available and the detailed design should include
the tracking requirements for the HWL vehicles. It would also be desirable to provide a
secondary route via the southern access road to improve accessibility for oversize loads to the
Estate.
Main Roads have produced guidelines for the assessment of High Wide Load routes and these
should be referred to as part of the detailed design process. The Guidelines are located at:
http://standards.mainroads.wa.gov.au/Internet/Standards/RTems/austroads_supplement/high_w
ide_loads/default.asp
A transport plan document is also available from Main Roads, Moving Oversize Loads from Port
Hedland, Main Roads WA Pilbara Region, September 15th 2010.
A recommended HWL route through the development is via the southern access from GNH and
along the central spine road.
PAM corridor access is provided along the central north-south spine consistent with earlier
planning by the PHPA.
3.8 Consideration of road train assembly/overnight parking
Subject to further discussion with Main Roads.
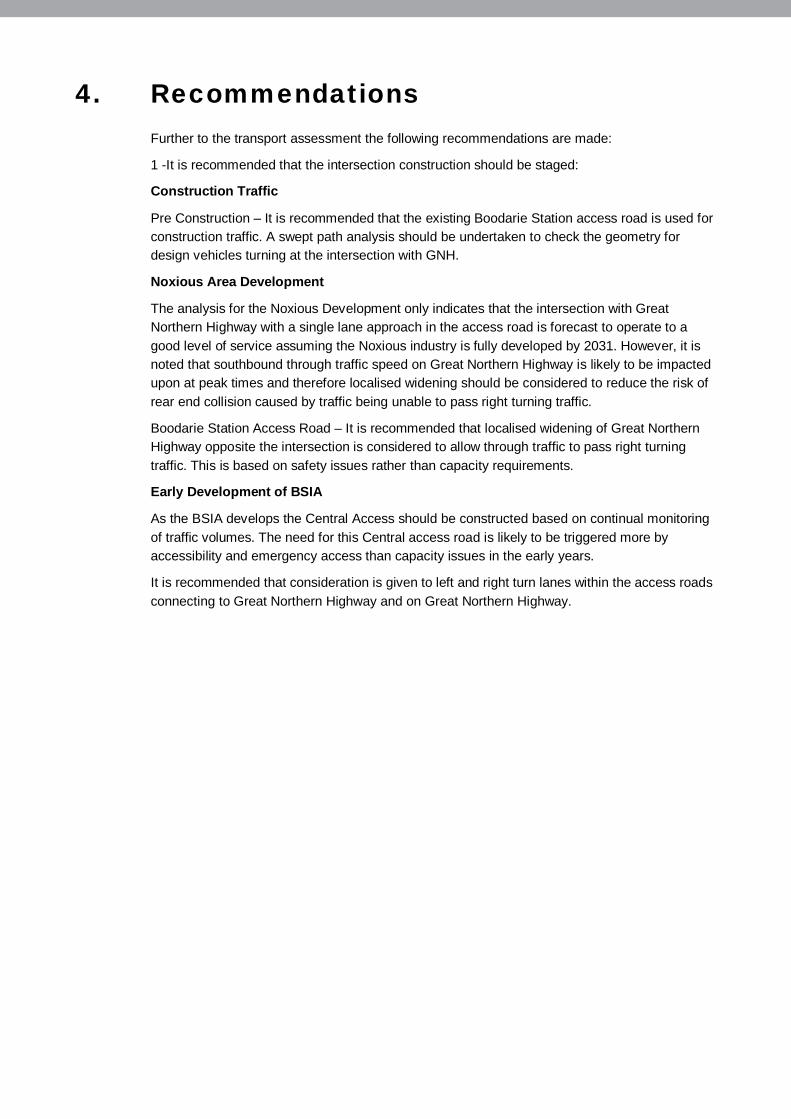
3.9 Consideration of the demand for public transport facilities
Current bus services are as follows:
There are currently bus services servicing Port Hedland and South Hedland, however these are
of limited frequency. As development increase in the Boodarie and Wedgefield areas
consideration should be given to improving current services and proving a peak hour service to
the Boodarie Strategic Industrial Area from Port Hedland and South Hedland. It is
recommended that the regional services area of PTA incorporate long term planning for this
area to accommodate work force requirements and encourage mode shift.

GHD | Report for LandCorp - Boodarie Strategic Industrial Area, 61/26171 | 33
3.10 Construction Activity and Access
Construction access is available via the existing Boodarie Station Access Road. It is
recommended that the intersection is checked to ensure geometry is adequate to accommodate
turning construction traffic.
3.11 Stakeholder Liaison
3.11.1 Stakeholder Workshop 9 November 2010
The following includes comments made by Main Roads at a Stakeholder Workshop held in
November 2010.
MRWA require GNH to have a reserve wide enough for dual carriageway. Reserve has
a number of services already.
Out of town, reserve is 100m, but more width may be required because of existing
services. Dual carriageway may require service relocations.
Depending on development time frame (if < 20years), then bridges for new Wedgefield
Bypass may have to be dual carriageway. Much cheaper to build now rather than later.
If 30,000 + vpd generated from Boodarie, then will require three dual carriageway
access road intersections.
Those numbers will warrant some form of public transport system.
Parking will be an issue as well.
Concerns as to where employees will come from. Likely a new more direct access road
will be needed from South Hedland. Either Quartz Quarry Road possibly or the road
past South Hedland WWTP.
In the future, may be desirable for GNH to peel away to the east away from Boodarie,
and possibly use Wallwork Rd, along east side of SH WWTP and then connect into the
South Hedland main North South access road, where a new bridge is proposed to be
constructed at the existing railway crossing. Existing GNH would then be downgraded
to a service road for the industrial estate, taking truck traffic away from the main road.
GNH is an unencumbered HWL route, limited by bridge loading capacity of 340 t.
Issue of HWL/PAMS corridor, road requires unencumbered clearance vertically.
Requires 20 m high, 15 m wide access. This causes issues when it comes to rail, as
MRWA will not permit rail over road, to avoid height encumbrances on HWL/PAMS.
PAMS crossings at rail lines, have to generally be at grade, even after a road over rail
crossing is constructed, because of the steeper approach grades which are usually
needed for the new approach roads to a bridge.
1.5km spacing preferable between new intersections along GNH into Boodarie.
The report was sent to Main Roads and a formal response to the concept and findings of the
transport assessment is awaited.
3.11.2 Town of Port Hedland
The report was sent to the Town of Port Hedland and a formal response to the concept and
findings of the transport assessment is awaited.
4. Recommendations Further to the transport assessment the following recommendations are made:
1 -It is recommended that the intersection construction should be staged:
Construction Traffic
Pre Construction – It is recommended that the existing Boodarie Station access road is used for
construction traffic. A swept path analysis should be undertaken to check the geometry for
design vehicles turning at the intersection with GNH.
Noxious Area Development
The analysis for the Noxious Development only indicates that the intersection with Great
Northern Highway with a single lane approach in the access road is forecast to operate to a
good level of service assuming the Noxious industry is fully developed by 2031. However, it is
noted that southbound through traffic speed on Great Northern Highway is likely to be impacted
upon at peak times and therefore localised widening should be considered to reduce the risk of
rear end collision caused by traffic being unable to pass right turning traffic.
Boodarie Station Access Road – It is recommended that localised widening of Great Northern
Highway opposite the intersection is considered to allow through traffic to pass right turning
traffic. This is based on safety issues rather than capacity requirements.
Early Development of BSIA
As the BSIA develops the Central Access should be constructed based on continual monitoring
of traffic volumes. The need for this Central access road is likely to be triggered more by
accessibility and emergency access than capacity issues in the early years.
It is recommended that consideration is given to left and right turn lanes within the access roads
connecting to Great Northern Highway and on Great Northern Highway.
GHD | Report for LandCorp - Boodarie Strategic Industrial Area, 61/26171 | 35
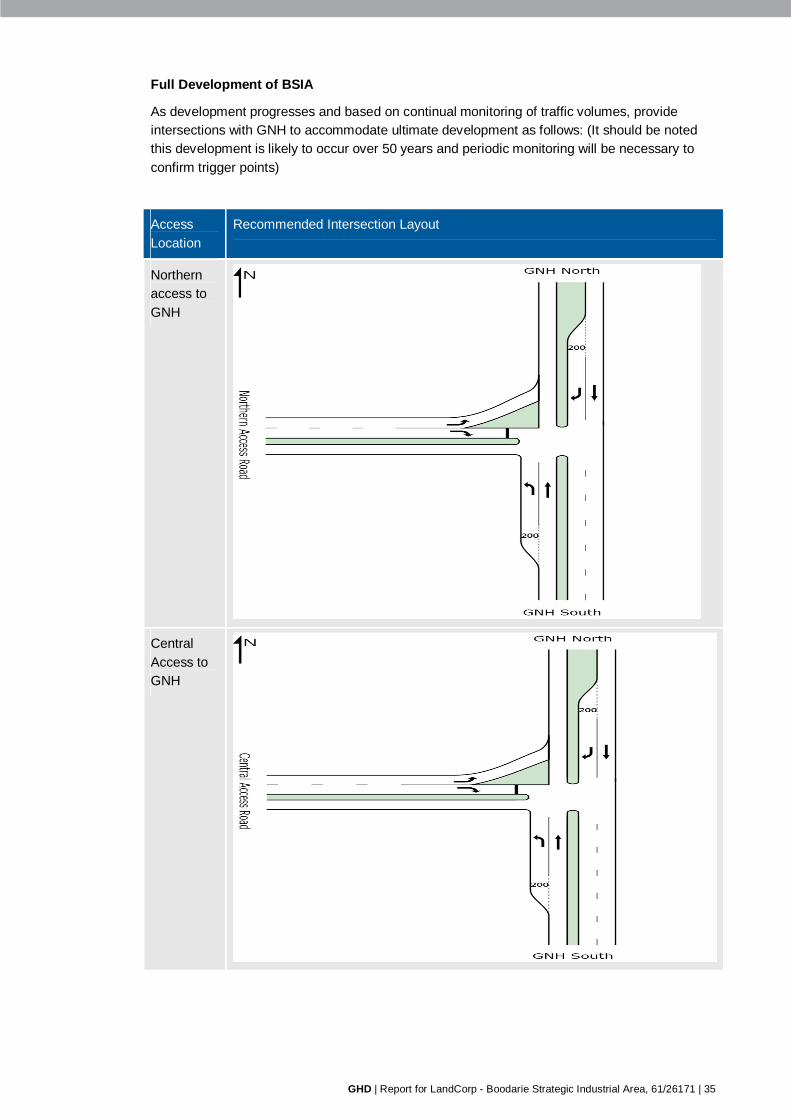
Full Development of BSIA
As development progresses and based on continual monitoring of traffic volumes, provide
intersections with GNH to accommodate ultimate development as follows: (It should be noted
this development is likely to occur over 50 years and periodic monitoring will be necessary to
confirm trigger points)
Access
Location
Recommended Intersection Layout
Northern
access to
GNH
Central
Access to
GNH
Access
Location
Recommended Intersection Layout
Southern
Access to
GNH
It is recommended that traffic volumes are monitored as development progresses to confirm
intersection staging requirements.
2 - It is recommended that the speed limit on GNH is reduced from 110km/h to 90km/h adjacent
to the site.
3 - It is recommended that pedestrian paths are constructed on at least one side of all Estate
roads when justified by development needs. Paths are unlikely to be needed for several years
based on the likely development scenario.
4 - It is recommended that in view of the large vehicles likely to use the development a path
network to include shared paths with pedestrians should be provided to accommodate cyclists
for the ultimate development. Paths are unlikely to be needed for several years based on the
likely development scenario.
5 - It is recommended the car parking demand for each land use should be justified by
proponents as part of their development applications.
6 - It is recommended that car parking restrictions are imposed to prohibit parking on verges to
avoid conflicting movements, restricting sight distance at access points and creating a
maintenance issue.
7 - It is recommended the HWL route through the development is via the central access from
GNH and along the central spine road.
9 - In view of the road train activity accessing the Estate it is recommended that the access
roads from GNH should accommodate right turn facilities to allow following traffic to pass.
10 - It is recommended the cross section of the access roads from GNH on full development
should be as follows: 2 x 5.1m verge, 2 x 5m traffic lane, 15m median with turn lanes where

GHD | Report for LandCorp - Boodarie Strategic Industrial Area, 61/26171 | 37
required. The overall reserve width is 35.2m minimum. In addition any extra width for main
drains, process industry services, conveyors, trunk power lines as may be needed by industry.
11 - It is recommended that all other roads should be 10m wide within a minimum 25m reserve.
In addition any extra width for main drains, process industry services, conveyors, trunk power
lines as may be needed by industry.

GHD
GHD House, 239 Adelaide Tce. Perth, WA 6004 P.O. Box 3106, Perth WA 6832 T: 61 8 6222 8222 F: 61 8 6222 8555 E: [email protected]
© GHD 2013
This document is and shall remain the property of GHD. The document may only be used for the purpose for which it was commissioned and in accordance with the Terms of Engagement for the commission. Unauthorised use of this document in any form whatsoever is prohibited.
G:\61\26171\WP\127885-BISA-Rev following JK and JDV Review.docx
Document Status
Rev No.
Author Reviewer Approved for Issue
Name Signature Name Signature Date
0 S McDermott J De Villiers J De Villiers J De Villiers J De Villiers 11/6/2013

GHD | Report for LandCorp - Boodarie Strategic Industrial Area, 61/26171 | 39
www.ghd.com