appendix c mpe-stats3
TRANSCRIPT

APPENDIX C
Air Quality Model Performance Evaluation: Evaluation at VISTAS and Nearby Class I Areas

C-1
C.1 OVERVIEW The discussion of model performance in this Appendix focuses on the comparison of observational data from the Interagency Monitoring of PROtected Visual Environments (IMPROVE) monitors and model output data from the 2002 VISTAS BaseG2 Actual annual air quality modeling. The evaluation will primarily focus on the air quality model’s performance with respect to individual components of fine particulate matter (PM2.5), as good model performance of the component species will dictate good model performance of total or reconstituted fine particulate matter from which visibility is constructed. Model performance of the total fine particulate matter and the resulting total light extinction will also be provided as a means to discuss the overall model performance for this Implementation Plan.
C.1.1 IMPROVE Monitoring Sites
There are eighteen (18) Class I areas within the VISTAS States (VISTAS region) as shown in Figure C-1. There are also several Class I areas adjacent to the VISTAS region where we also project future-year visibility conditions. Figure C-2 displays the IMPROVE monitoring sites within and nearby the VISTAS region. The 18 VISTAS Class I areas and nearby Class I areas where the CMAQ Base G2 modeling results are evaluated in this Appendix are as follows: VISTAS Class I Areas
• Sipsey Wilderness Area (SIPS), Alabama • Chassahowitzka Wildlife Refuge (CHAS), Florida • Everglades National Park (EVER), Florida • St. Marks Wildlife Refuge (SAMA), Florida • Cohutta Wilderness Area (COHU), Georgia • Wolf Island Wildlife Refuge (WOIS), Georgia • Okefenokee Wildlife Refuge (OKEF), Georgia • Mammoth Cave National Park (MACA), Kentucky • Linville Gorge Wilderness Area (LIGO), North Carolina • Shining Rock Wilderness Area (SHRO), North Carolina • Swanquarter Wildlife Refuge (SWAN), North Carolina • Joyce Kilmer-Slickrock Wilderness Area (JKSR), North Carolina • Cape Romain Wildlife Refuge (ROMA), South Carolina • Great Smoky Mountains National Park (GRSM), Tennessee-North Carolina • James River Face Wilderness Area (JARI), Virginia • Shenandoah National Park (SHEN), Virginia • Dolly Sods Wilderness Area (DOSO), West Virginia • Otter Creek Wilderness Area (OTCR), West Virginia

C-2
Nearby Class I Areas • Breton Island Wildlife Refuge (BRET), Louisiana • Caney Creek Wilderness Area (CACR), Arkansas • Upper Buffalo Wilderness Area (UPBU), Arkansas • Mingo Wildlife Refuge (MING), Missouri • Hercules Glade Wilderness Area (HEGL), Missouri • Brigantine Wildlife Refuge (BRIG), New Jersey
Note that not all Class I areas have their own IMPROVE monitor. The Wolf Island Class I area shares the Okefenokee IMPROVE monitor in Georgia and in West Virginia, the Otter Creek Class I area shares the Dolly Sods IMPROVE monitor and the Joyce Kilmer-Slickrock Class I area shares the IPROVE monitor at Great Smokey Mountains National Park. So when presenting model performance evaluation and visibility projections for Okefenokee, Dolly Sods and Great Smokey Mountains IMPROVE monitors they are also represented of, respectively, Wolf Island, Otter Creek and Joyce Kilmer-Slickrock Class I areas, respectively. Also note that there are some IMPROVE sites not located in Class I areas. Although data at these sites are used in the regional evaluation discussed in Appendix B, the performance at the individual IMPROVE monitors not located at a Class I area are not discussed in this section. For the VISTAS region, the Cadiz (CADI) site is one such IMPROVE monitor.

C-3
Figure C-1. Class I areas within the VISTAS region.

C-4
250 500 750 1000 1250 1500 1750 2000
-1500
-1250
-1000
-750
-500
-250
0
250
500
EVER1
CHAS1BRET1
SAMA1
OKEF1SIKE1
ROMA1SIPS1
CACR1
COHU1
SHRO1
SWAN1
GRSM1
UPBU1
LIGO1HEGL1
CADI1MING1MACA1
JARI1JEFF1
ELDO1
SHEN1
LIVO1
WASH1DOSO1
BRIG1AREN1
QUCI1
BOND1LASU1
MKGO1
MOMO1ADPI1
COHI1GRRI1
Figure C-2. IMPROVE monitoring sites within and near the VISTAS region.
C.1.2 Particulate Matter and Component Species
Regional haze is calculated by estimating light scattering and absorption by components of PM2.5. Regional haze is measured by an extinction coefficient (bext), which represents the light attenuation resulting from scattering and absorption of light from ambient particulate matter plus scattering of light due to gas molecules in the air (i.e., Rayleigh scattering). Some scattering does occur from air molecules; however, the bulk of light extinction is caused by the presence of suspended particles, particularly fine particles (aerodynamic mass <2.5 μm). Fine particulate matter can be composed of varying amounts of several different species, including:
• Sulfates • Nitrates • Ammonium • Organic carbon (OC)

C-5
• Elemental carbon (EC) • Coarse particulate matter (i.e., PM10 - PM2.5) • Soil (also known as crustal material, fine soil, major metal oxides, inorganic particulates,
or other PM) • Sea Salt (NaCl) [new IMPROVE equation]
The composition of particulate matter can vary from day-to-day, allowing a day with a large concentration of sulfates to be closely followed by a day dominated by organic carbon. This is an important fact as some of the components of fine particulate matter are more effective at light scattering than others. Since there can be such a large variability in the concentrations of the component species, the model will actually be evaluated on a per species basis, followed by a an evaluation of total reconstructed fine particle mass. This is also a more stringent test of the model, as simply looking at particle pollution performance may provide good results, even though the underlying constituent concentrations are incorrect. Only a brief overview of total fine particles after component evaluation is necessary, since the accuracy of the model in predicting the component species will dictate the accuracy of the total fine particulate mass prediction.
C.1.3 20% Best and Worst Days
Projections of light extinction for the evaluation of regional haze are based on a subset of days for which there is monitored data. IMPROVE monitors collect 24-hour PM samples every third day. Observations of component species on these days are used to calculate light extinction, which is the basis on which these days are ranked. These rankings are then used to identify the 20% most impaired days, or “worst days”, and the 20% least impaired days, or “best days”, for use in visibility projections. Table C-1 lists of the 20% best and worst days for all of Class I areas within and nearby of the VISTAS region. . Since the ultimate future year projections are based on these 20% best and worst days, the following performance evaluation of the model has mainly focused on the best and worst days for VISTAS and nearby Class I areas.

C-6
Date Julian Day SIPS CHAS EVER SAMA COHU OKEF MACA LIGO SHRO SWAN ROMA GRSM JARI SHEN DOSO BRET CACR UPBU MING HEGL BRIG1
01/05/02 5 W W B B W B B W
01/08/02 8 B B B B B
01/11/02 11 B B B B B B B B
01/14/02 14 B B B B B B B B B B B B B
01/17/02 17 W W W
01/20/02 20 B B B W W
01/23/02 23 B B W B B B B B B B
01/26/02 26 B W B B B B B B B B B B
01/29/02 29 B W
02/01/02 32 B B B B B B B B B
02/04/02 35 W W B B
02/07/02 38 B B B B B B B B B
02/10/02 41 W
02/13/02 44 W W W B W B W B W B B
02/16/02 47 W W W W B
02/19/02 50 B B B B
02/22/02 53 W W
02/25/02 56 W W W W W W W
02/28/02 59 B B B B W
03/03/02 62 W B B B B B B B B
03/06/02 65 B
03/09/02 68 B B B B B B B B B B B B B B
03/12/02 71 B B B B
03/15/02 74 W W W
03/18/02 77 B B B B B W B
03/21/02 80 W B B B W
03/24/02 83 B
03/27/02 86 W B
03/30/02 89 B W W B W B B B B B B B B
04/02/02 92 B
04/05/02 95 W W W W
04/08/02 98 W W B B
04/11/02 101 B B
04/14/02 104 B B B B B B B B B
04/17/02 107 W B W
04/20/02 110 W W

C-7
Date Julian Day SIPS CHAS EVER SAMA COHU OKEF MACA LIGO SHRO SWAN ROMA GRSM JARI SHEN DOSO BRET CACR UPBU MING HEGL BRIG1
04/23/02 113 B W B B B B B
04/26/02 116 B W W B B B B B B B B B
04/29/02 119 B B W B B B B
05/02/02 122 W W W W W W W W W W
05/05/02 125 W W B B W B
05/08/02 128 W W W W W W W W W W W
05/11/02 131 W W
05/14/02 134 B B B B
05/17/02 137 B W W W W W B B W
05/20/02 140 B B
05/23/02 143 W W W W
05/26/02 146 B W W W W
05/29/02 149 W W W W B W W
06/01/02 152 W W W W W W W W W W W
06/04/02 155 W W W W W W W W W W W W
06/07/02 158 W B W B B B B W W B
06/10/02 161 W B B W B W W W
06/13/02 164 B B W W W W B B
06/16/02 167 B B B
06/19/02 170 B B W W W B W W W B W W W W
06/22/02 173 B B B B W B B W W W W W
06/25/02 176 B B B B B B B W W B B B W
06/28/02 179 B B B W W W W
07/01/02 182 B W W W W W W
07/04/02 185 W W W W W W W W W W W
07/07/02 188 W W W W W W W W W W W W
07/10/02 191 W B B W B W W W B W W W B W W W W W
07/13/02 194 B B B B W W B
07/16/02 197 W W W W W W W W W W W B W W W
07/19/02 200 W W W W W W W W W B
07/22/02 203 B W W W W W W W W
07/25/02 206 W B B W W W W W B W W W W W B
07/28/02 209 B W W B W
07/31/02 212 B B W W W W W W W W
08/03/02 215 W W W W W W W W W W W W W
08/06/02 218 W W B W W W W W W W W W W W

C-8
Date Julian Day SIPS CHAS EVER SAMA COHU OKEF MACA LIGO SHRO SWAN ROMA GRSM JARI SHEN DOSO BRET CACR UPBU MING HEGL BRIG1
08/09/02 221 W W W W B W B W W W W B
08/12/02 224 W B B W W W W W W W W W W W
08/15/02 227 B W B B B W W B B B B
08/18/02 230 B W
08/21/02 233 W W W W W W W W B
08/24/02 236 W W W W W W W W W B
08/27/02 239 B B B W W W W W W W W W
08/30/02 242 B B B B B W W W W
09/02/02 245 B W B B B B W W
09/05/02 248 B B W W W B W W W W W
09/08/02 251 W B W W W W B W W W W W W B
09/11/02 254 W B W W W W W W W W W W W W W
09/14/02 257 B W B B B W B W W W W W W W
09/17/02 260 W W W W W W W W W W W W W W W W W
09/20/02 263 W W W W B B W W W B B
09/23/02 266 B B W B B W B W B B B B
09/26/02 269 B B B B B B B W W B
09/29/02 272 W W W W W
10/02/02 275 B W W W W
10/05/02 278 W B W B B B B W
10/08/02 281 W W W W B W B B B B
10/11/02 284 W B B B B B B W B B
10/14/02 287 B B W B B B B
10/17/02 290 W W W B B B B
10/20/02 293 W W W B B
10/23/02 296 W W B W W W W W W W
10/26/02 299 B B W B B B B B
10/29/02 302 B B B B B B B B B B B B B B B
11/01/02 305 W W
11/04/02 308 B B W B B B B B B
11/07/02 311 W W B B B
11/10/02 314 B
11/13/02 317 B B
11/16/02 320 B B B B B B B B W W W
11/19/02 323 B B B
11/22/02 326 B B W B B B

C-9
Date Julian Day SIPS CHAS EVER SAMA COHU OKEF MACA LIGO SHRO SWAN ROMA GRSM JARI SHEN DOSO BRET CACR UPBU MING HEGL BRIG1
11/25/02 329 W W B W
11/28/02 332 W W B B W W B
12/01/02 335 B B B B B B B B B
12/04/02 338 W W B B B B
12/07/02 341 W W W W B W W B B W W B B B W W W W
12/10/02 344 B B B B B B
12/13/02 347 B B B B B B B B B B W
12/16/02 350 W W W
12/19/02 353 B B B B B B B
12/22/02 356 B B B B B B B B B B B B B B
12/25/02 359 B B B B B B B B B B B
12/28/02 362 B W B B W
12/31/02* 365 B B B B B B

C-10
C.2 Model Performance Statistics
To quantify model performance, several statistical measures were calculated and evaluated for all the IMPROVE monitors within the VISTAS 12 km domain and individually for each IMPROVE monitor associated with a VISTAS or nearby Class I areas. The statistical measures selected were based on the recommendations outlined in section 18.4.1 of the USEPA’s Guidance On The Use Of Models And Other Analyses for Demonstrating Attainment of Air Quality Goals for Ozone, PM2.5, and Regional Haze (EPA, 2007a). In 2004, VISTAS established model performance goals and criteria for components of fine particle mass (Table C-2) based on previous model performance for ozone and fine particles. EPA modeling guidance for fine particulate matter at the time noted that PM models might not be able to achieve the same level of performance as ozone models. VISTAS’ evaluation considered several statistical performance measures and displays. Table C-2. Model performance goals and criteria for components of fine particle mass.
Fractional Bias Fractional Error Comment
<15% <35% Goal for PM model performance based on ozone model performance, considered excellent performance
<30% <50% Goal for PM model performance, considered good performance
<60% <75% Criteria for PM model performance, considered average performance. Exceeding this level of performance indicates fundamental concerns with the modeling system and triggers diagnostic evaluation.
The statistical measures were calculated for all of the component species of particulate matter responsible for light extinction, and for total light extinction. For convenience, these statistical measures or metrics, along with a variety of additional statistical measures, are summarized in Table C-3.

C-11
Table C-3. Statistical metric calculations. Statistical Measure Shorthand
Notation Mathematical Expression Notes
Accuracy of Paired Peak
Ap
peak
peak
OOP −
Coefficient of Determination
R2
( )( )
∑ ∑
∑
= =
=
−−
⎥⎦
⎤⎢⎣
⎡−−
N
i
N
iii
N
iii
OOPP
OOPP
1 1
22
2
1
)()(
Pi= prediction at time and location i; Oi = observation at time and location i; P = arithmetic average of Pi, i = 1, 2, . . ., N; O = arithmetic average of Oi, i = 1, 2, . . ., N;
Normalized Mean Error
NME
∑
∑
=
=
−
N
ii
N
iii
O
OP
1
1
Reported as %
Root Mean Square Error
RMSE
( )21
1
21⎥⎦
⎤⎢⎣
⎡−∑
=
N
iii OP
N
Reported as %
Mean Fractional Error
MFE ∑= +
−N
i ii
ii
OPOP
N 1
2
Reported as %
Mean Absolute Gross Error
MAGE ∑=
−N
iii OP
N 1
1
Mean Normalized Gross Error
MNGE ∑=
−N
i i
ii
OOP
N 1
1
Reported as %
Mean Biased MB ( )∑
=
−N
iii OP
N 1
1
Reported as concentration
Mean Normalized Bias
MNB ( )∑=
−N
i i
ii
OOP
N 1
1
Reported as %
Mean Fractionalized Bias (Fractional Bias)
MFB ∑=
⎟⎟⎠
⎞⎜⎜⎝
⎛+−N
i ii
ii
OPOP
N 1
2
Reported as %
Normalized Mean Bias
NMB ( )
∑
∑
=
=
−
N
ii
N
iii
O
OP
1
1
Reported as %
Bias Factor BF ∑=
⎟⎟⎠
⎞⎜⎜⎝
⎛N
i i
i
OP
N 1
1
Reported as BF:1 or 1:BF or in fractional notation (BF/1 or 1/BF)
C-12
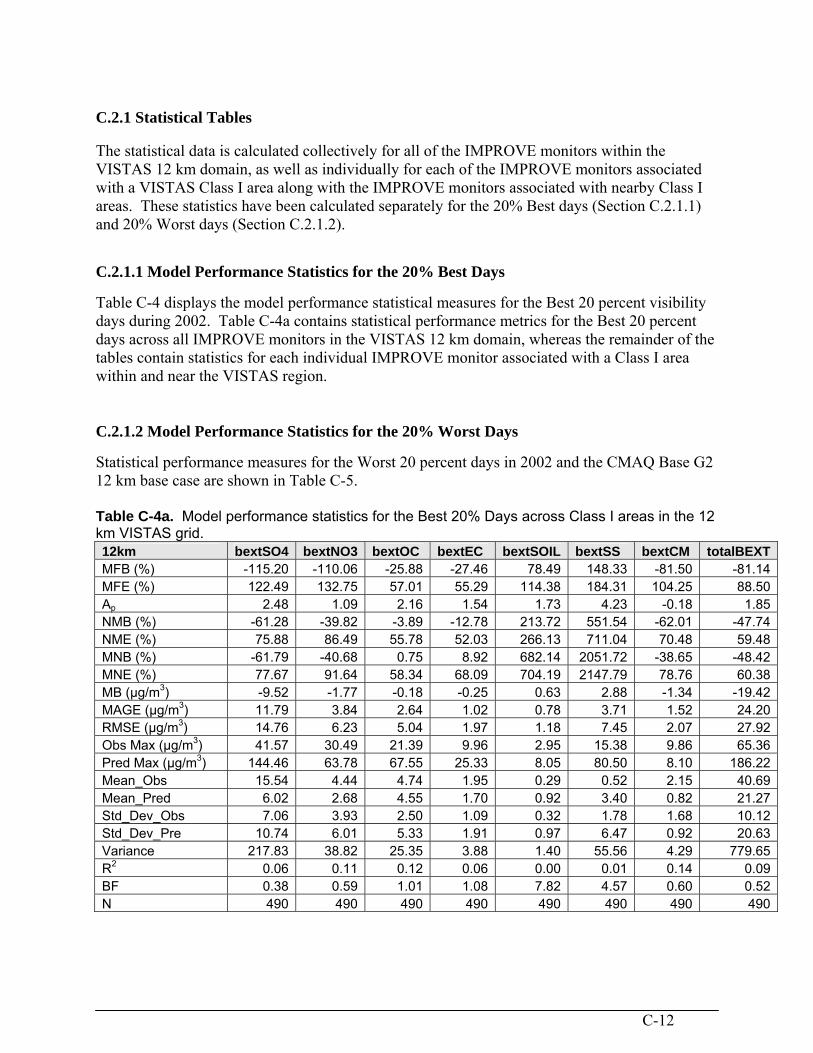
C.2.1 Statistical Tables
The statistical data is calculated collectively for all of the IMPROVE monitors within the VISTAS 12 km domain, as well as individually for each of the IMPROVE monitors associated with a VISTAS Class I area along with the IMPROVE monitors associated with nearby Class I areas. These statistics have been calculated separately for the 20% Best days (Section C.2.1.1) and 20% Worst days (Section C.2.1.2).
C.2.1.1 Model Performance Statistics for the 20% Best Days
Table C-4 displays the model performance statistical measures for the Best 20 percent visibility days during 2002. Table C-4a contains statistical performance metrics for the Best 20 percent days across all IMPROVE monitors in the VISTAS 12 km domain, whereas the remainder of the tables contain statistics for each individual IMPROVE monitor associated with a Class I area within and near the VISTAS region.
C.2.1.2 Model Performance Statistics for the 20% Worst Days
Statistical performance measures for the Worst 20 percent days in 2002 and the CMAQ Base G2 12 km base case are shown in Table C-5. Table C-4a. Model performance statistics for the Best 20% Days across Class I areas in the 12 km VISTAS grid. 12km bextSO4 bextNO3 bextOC bextEC bextSOIL bextSS bextCM totalBEXTMFB (%) -115.20 -110.06 -25.88 -27.46 78.49 148.33 -81.50 -81.14MFE (%) 122.49 132.75 57.01 55.29 114.38 184.31 104.25 88.50Ap 2.48 1.09 2.16 1.54 1.73 4.23 -0.18 1.85NMB (%) -61.28 -39.82 -3.89 -12.78 213.72 551.54 -62.01 -47.74NME (%) 75.88 86.49 55.78 52.03 266.13 711.04 70.48 59.48MNB (%) -61.79 -40.68 0.75 8.92 682.14 2051.72 -38.65 -48.42MNE (%) 77.67 91.64 58.34 68.09 704.19 2147.79 78.76 60.38MB (μg/m3) -9.52 -1.77 -0.18 -0.25 0.63 2.88 -1.34 -19.42MAGE (μg/m3) 11.79 3.84 2.64 1.02 0.78 3.71 1.52 24.20RMSE (μg/m3) 14.76 6.23 5.04 1.97 1.18 7.45 2.07 27.92Obs Max (μg/m3) 41.57 30.49 21.39 9.96 2.95 15.38 9.86 65.36Pred Max (μg/m3) 144.46 63.78 67.55 25.33 8.05 80.50 8.10 186.22Mean_Obs 15.54 4.44 4.74 1.95 0.29 0.52 2.15 40.69Mean_Pred 6.02 2.68 4.55 1.70 0.92 3.40 0.82 21.27Std_Dev_Obs 7.06 3.93 2.50 1.09 0.32 1.78 1.68 10.12Std_Dev_Pre 10.74 6.01 5.33 1.91 0.97 6.47 0.92 20.63Variance 217.83 38.82 25.35 3.88 1.40 55.56 4.29 779.65R2 0.06 0.11 0.12 0.06 0.00 0.01 0.14 0.09BF 0.38 0.59 1.01 1.08 7.82 4.57 0.60 0.52N 490 490 490 490 490 490 490 490

C-13
Table C-4b. Model performance statistics for the Best 20% Days and the Breton Island Class I area. BRET bextSO4 bextNO3 bextOC bextEC bextSOIL bextSS bextCM totalBEXTMFB (%) -152.90 -179.64 -82.67 -69.08 14.14 27.20 -80.87 -139.99MFE (%) 152.90 181.21 83.72 69.19 126.36 166.60 91.94 139.99Ap -0.74 -0.69 -0.54 -0.46 -0.25 -0.47 -0.46 -0.66NMB (%) -86.23 -94.40 -54.53 -50.86 -14.55 -47.92 -56.39 -81.07NME (%) 86.23 95.50 55.38 50.96 132.14 111.15 59.69 81.07MNB (%) -85.67 -90.70 -53.78 -48.24 454.91 -71.19 -41.48 -81.47MNE (%) 85.67 92.44 54.89 48.36 519.05 76.78 71.91 81.47MB (μg/m3) -15.48 -2.76 -1.40 -0.81 -0.05 -0.39 -1.98 -32.99MAGE (μg/m3) 15.48 2.80 1.43 0.82 0.43 0.90 2.10 32.99RMSE (μg/m3) 16.76 3.21 1.79 1.04 0.57 1.25 2.40 33.48Obs Max (μg/m3) 28.83 7.28 6.17 2.75 1.61 3.81 7.45 48.75Pred Max (μg/m3) 7.43 2.23 2.86 1.48 1.21 2.03 4.00 16.64Mean_Obs 17.95 2.93 2.57 1.60 0.33 0.81 3.51 40.69Mean_Pred 2.47 0.16 1.17 0.79 0.28 0.42 1.53 7.70Std_Dev_Obs 7.00 1.50 1.40 0.76 0.41 1.00 1.66 6.09Std_Dev_Pre 2.24 0.49 0.90 0.46 0.31 0.51 1.06 4.97Variance 280.94 10.28 3.21 1.08 0.32 1.57 5.76 1120.72R2 0.12 0.04 0.34 0.25 0.08 0.05 0.31 0.22BF 0.14 0.09 0.46 0.52 5.55 0.15 0.59 0.19N 23 23 23 23 23 23 23 23
Table C-4c. Model performance statistics for the Best 20% Days and the Brigantine Class I area. BRIG bextSO4 bextNO3 bextOC bextEC bextSOIL bextSS bextCM totalBEXTMFB (%) -118.49 -85.82 1.36 36.59 68.09 88.47 -126.19 -75.43MFE (%) 126.68 116.82 57.68 75.89 107.44 176.33 126.19 94.46Ap 0.14 0.09 7.20 4.77 2.48 -0.61 -0.70 1.14NMB (%) -66.46 -29.38 124.33 131.07 204.17 -11.47 -76.73 -39.27NME (%) 75.91 76.29 157.87 159.04 240.37 164.42 76.73 67.56MNB (%) -65.18 -24.93 99.46 309.60 278.12 3530.32 -75.55 -35.94MNE (%) 75.82 86.26 138.10 336.38 303.32 3647.08 75.55 69.99MB (μg/m3) -10.86 -1.07 5.36 2.69 0.48 -0.23 -3.00 -17.47MAGE (μg/m3) 12.41 2.77 6.81 3.26 0.56 3.30 3.00 30.05RMSE (μg/m3) 13.51 3.51 16.44 6.75 0.74 4.55 3.49 34.13Obs Max (μg/m3) 27.59 11.88 8.23 4.39 0.62 12.00 8.61 52.91Pred Max (μg/m3) 31.45 12.90 67.55 25.33 2.17 4.65 2.62 113.43Mean_Obs 16.35 3.63 4.31 2.05 0.23 2.00 3.90 44.48Mean_Pred 5.48 2.56 9.67 4.74 0.71 1.77 0.91 27.01Std_Dev_Obs 5.74 2.26 1.88 1.17 0.13 3.83 1.82 6.00Std_Dev_Pre 7.08 3.74 16.57 6.23 0.54 1.28 0.76 28.02Variance 182.58 12.31 270.43 45.58 0.55 20.74 12.15 1165.02R2 0.04 0.19 0.16 0.00 0.03 0.29 0.04 0.06BF 0.35 0.75 1.99 3.91 3.78 14.85 0.24 0.64N 22 22 22 22 22 22 22 22
C-14
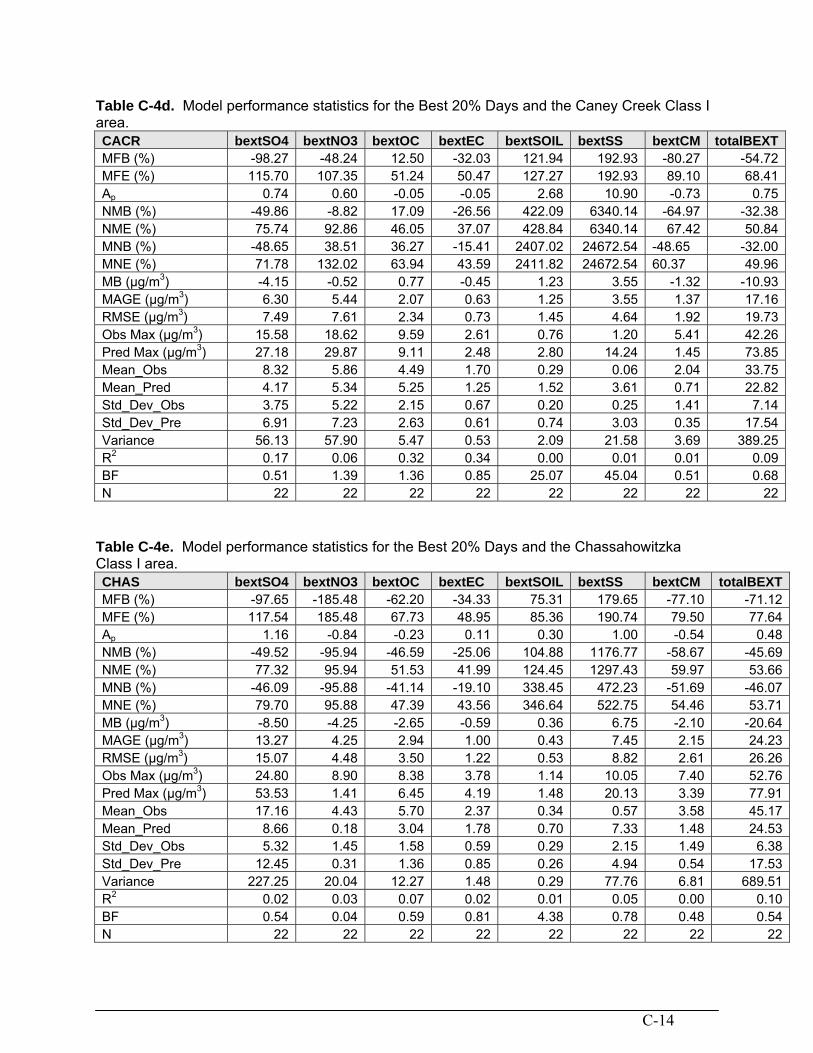
Table C-4d. Model performance statistics for the Best 20% Days and the Caney Creek Class I area. CACR bextSO4 bextNO3 bextOC bextEC bextSOIL bextSS bextCM totalBEXTMFB (%) -98.27 -48.24 12.50 -32.03 121.94 192.93 -80.27 -54.72MFE (%) 115.70 107.35 51.24 50.47 127.27 192.93 89.10 68.41Ap 0.74 0.60 -0.05 -0.05 2.68 10.90 -0.73 0.75NMB (%) -49.86 -8.82 17.09 -26.56 422.09 6340.14 -64.97 -32.38NME (%) 75.74 92.86 46.05 37.07 428.84 6340.14 67.42 50.84MNB (%) -48.65 38.51 36.27 -15.41 2407.02 24672.54 -48.65 -32.00MNE (%) 71.78 132.02 63.94 43.59 2411.82 24672.54 60.37 49.96MB (μg/m3) -4.15 -0.52 0.77 -0.45 1.23 3.55 -1.32 -10.93MAGE (μg/m3) 6.30 5.44 2.07 0.63 1.25 3.55 1.37 17.16RMSE (μg/m3) 7.49 7.61 2.34 0.73 1.45 4.64 1.92 19.73Obs Max (μg/m3) 15.58 18.62 9.59 2.61 0.76 1.20 5.41 42.26Pred Max (μg/m3) 27.18 29.87 9.11 2.48 2.80 14.24 1.45 73.85Mean_Obs 8.32 5.86 4.49 1.70 0.29 0.06 2.04 33.75Mean_Pred 4.17 5.34 5.25 1.25 1.52 3.61 0.71 22.82Std_Dev_Obs 3.75 5.22 2.15 0.67 0.20 0.25 1.41 7.14Std_Dev_Pre 6.91 7.23 2.63 0.61 0.74 3.03 0.35 17.54Variance 56.13 57.90 5.47 0.53 2.09 21.58 3.69 389.25R2 0.17 0.06 0.32 0.34 0.00 0.01 0.01 0.09BF 0.51 1.39 1.36 0.85 25.07 45.04 0.51 0.68N 22 22 22 22 22 22 22 22
Table C-4e. Model performance statistics for the Best 20% Days and the Chassahowitzka Class I area. CHAS bextSO4 bextNO3 bextOC bextEC bextSOIL bextSS bextCM totalBEXTMFB (%) -97.65 -185.48 -62.20 -34.33 75.31 179.65 -77.10 -71.12MFE (%) 117.54 185.48 67.73 48.95 85.36 190.74 79.50 77.64Ap 1.16 -0.84 -0.23 0.11 0.30 1.00 -0.54 0.48NMB (%) -49.52 -95.94 -46.59 -25.06 104.88 1176.77 -58.67 -45.69NME (%) 77.32 95.94 51.53 41.99 124.45 1297.43 59.97 53.66MNB (%) -46.09 -95.88 -41.14 -19.10 338.45 472.23 -51.69 -46.07MNE (%) 79.70 95.88 47.39 43.56 346.64 522.75 54.46 53.71MB (μg/m3) -8.50 -4.25 -2.65 -0.59 0.36 6.75 -2.10 -20.64MAGE (μg/m3) 13.27 4.25 2.94 1.00 0.43 7.45 2.15 24.23RMSE (μg/m3) 15.07 4.48 3.50 1.22 0.53 8.82 2.61 26.26Obs Max (μg/m3) 24.80 8.90 8.38 3.78 1.14 10.05 7.40 52.76Pred Max (μg/m3) 53.53 1.41 6.45 4.19 1.48 20.13 3.39 77.91Mean_Obs 17.16 4.43 5.70 2.37 0.34 0.57 3.58 45.17Mean_Pred 8.66 0.18 3.04 1.78 0.70 7.33 1.48 24.53Std_Dev_Obs 5.32 1.45 1.58 0.59 0.29 2.15 1.49 6.38Std_Dev_Pre 12.45 0.31 1.36 0.85 0.26 4.94 0.54 17.53Variance 227.25 20.04 12.27 1.48 0.29 77.76 6.81 689.51R2 0.02 0.03 0.07 0.02 0.01 0.05 0.00 0.10BF 0.54 0.04 0.59 0.81 4.38 0.78 0.48 0.54N 22 22 22 22 22 22 22 22

C-15
Table C-4f. Model performance statistics for the Best 20% Days and the Cohutta Class I area. COHU bextSO4 bextNO3 bextOC bextEC bextSOIL bextSS bextCM totalBEXTMFB (%) -87.92 -80.72 -5.85 -24.92 92.95 198.40 -43.63 -64.47MFE (%) 106.08 104.25 41.26 44.71 108.35 198.40 89.95 70.27Ap 0.57 -0.18 0.54 0.03 1.38 23.19 -0.88 -0.01NMB (%) -43.70 -38.79 8.59 -16.07 189.67 16676.44 -71.13 -41.05NME (%) 69.09 67.47 40.33 33.25 204.65 16676.44 82.18 47.02MNB (%) -45.05 -35.48 8.54 -12.98 451.68 10913.35 -9.19 -41.72MNE (%) 71.18 67.60 45.10 38.67 462.35 10913.35 84.08 48.37MB (μg/m3) -7.46 -1.79 0.39 -0.30 0.51 2.40 -0.91 -16.67MAGE (μg/m3) 11.80 3.12 1.82 0.61 0.55 2.40 1.05 19.10RMSE (μg/m3) 12.95 4.15 2.32 0.70 0.73 2.97 2.24 21.31Obs Max (μg/m3) 24.33 14.54 6.69 3.25 0.84 0.28 8.34 51.42Pred Max (μg/m3) 38.12 11.93 10.33 3.34 1.99 6.75 0.99 50.69Mean_Obs 17.08 4.62 4.52 1.84 0.27 0.01 1.27 40.62Mean_Pred 9.62 2.83 4.91 1.55 0.78 2.41 0.37 23.94Std_Dev_Obs 4.94 3.06 1.37 0.73 0.22 0.06 2.05 6.33Std_Dev_Pre 10.77 3.50 2.79 0.84 0.51 1.80 0.23 14.43Variance 167.74 17.20 5.39 0.49 0.53 8.81 5.01 453.92R2 0.04 0.10 0.30 0.44 0.01 0.02 0.03 0.12BF 0.55 0.65 1.09 0.87 5.52 11.01 0.86 0.58N 20 20 20 20 20 20 20 20
Table C-4g. Model performance statistics for the Best 20% Days and the Dolly Sods Class I area. DOSO bextSO4 bextNO3 bextOC bextEC bextSOIL bextSS bextCM totalBEXTMFB (%) -107.37 -62.64 -78.22 -73.22 104.58 200.00 -84.35 -97.79MFE (%) 109.37 98.95 78.34 76.44 110.05 200.00 127.36 97.79Ap -0.04 0.45 -0.52 -0.47 2.47 -999.00 -0.79 -0.21NMB (%) -62.79 -24.54 -57.40 -49.56 317.65 -999.00 -79.16 -61.85NME (%) 65.70 64.67 57.44 51.87 321.71 -999.00 84.37 61.85MNB (%) -64.90 -18.19 -52.99 -48.25 926.54 -999.00 20.22 -63.26MNE (%) 67.01 69.59 53.11 52.13 931.32 -999.00 143.07 63.26MB (μg/m3) -8.23 -0.74 -2.55 -0.92 0.45 0.82 -0.56 -20.58MAGE (μg/m3) 8.61 1.96 2.55 0.96 0.46 0.82 0.60 20.58RMSE (μg/m3) 9.90 2.68 3.16 1.10 0.59 1.02 0.80 21.54Obs Max (μg/m3) 23.24 9.02 9.02 3.44 0.43 0.00 1.93 43.68Pred Max (μg/m3) 22.29 13.11 4.36 1.82 1.49 2.76 0.41 34.63Mean_Obs 13.11 3.03 4.43 1.85 0.14 0.00 0.71 33.27Mean_Pred 4.88 2.29 1.89 0.93 0.59 0.82 0.15 12.69Std_Dev_Obs 5.34 2.39 2.10 0.76 0.11 0.00 0.61 7.00Std_Dev_Pre 5.28 3.02 1.13 0.52 0.40 0.63 0.10 7.57Variance 98.09 7.20 9.97 1.20 0.34 1.05 0.64 464.10R2 0.19 0.30 0.18 0.35 0.05 -999.00 0.11 0.36BF 0.35 0.82 0.47 0.52 10.27 0.00 1.20 0.37N 21 21 21 21 21 21 21 21

C-16
Table C-4h. Model performance statistics for the Best 20% Days and the Cohutta Class I area. EVER bextSO4 bextNO3 bextOC bextEC bextSOIL bextSS bextCM totalBEXTMFB (%) -165.78 -199.82 -8.55 -6.99 -58.20 -10.33 -119.13 -131.93MFE (%) 165.78 199.82 43.15 52.61 105.18 127.64 119.13 131.93Ap -0.61 -1.00 -0.18 -0.17 -0.85 -0.67 -0.64 -0.55NMB (%) -88.57 -99.95 -5.12 -12.84 -69.39 -58.59 -76.84 -78.61NME (%) 88.57 99.95 40.75 47.33 84.41 98.24 76.84 78.61MNB (%) -89.70 -99.95 3.63 -2.76 -1.43 -56.94 -72.48 -78.57MNE (%) 89.70 99.95 40.75 41.91 96.80 57.89 72.48 78.57MB (μg/m3) -8.06 -2.04 -0.15 -0.12 -0.27 -0.74 -1.80 -23.62MAGE (μg/m3) 8.06 2.04 1.21 0.45 0.33 1.24 1.80 23.62RMSE (μg/m3) 8.36 2.15 1.47 0.64 0.52 1.75 2.03 23.93Obs Max (μg/m3) 14.39 3.74 5.72 2.89 1.84 4.83 3.91 32.94Pred Max (μg/m3) 5.54 0.02 4.71 2.39 0.27 1.57 1.40 14.82Mean_Obs 9.10 2.04 2.96 0.95 0.39 1.26 2.35 30.05Mean_Pred 1.04 0.00 2.81 0.83 0.12 0.52 0.54 6.43Std_Dev_Obs 2.57 0.68 0.96 0.63 0.43 1.44 0.89 2.39Std_Dev_Pre 1.26 0.00 1.05 0.60 0.06 0.39 0.30 3.22Variance 69.82 4.61 2.16 0.41 0.27 3.07 4.13 572.47R2 0.23 0.00 0.01 0.22 0.12 0.14 0.00 0.00BF 0.10 0.00 1.04 0.93 0.99 0.30 0.28 0.21N 24 24 24 24 24 24 24 24
Table C-4i. Model performance statistics for the Best 20% Days and the Great Smoky Mountains Class I area. GRSM bextSO4 bextNO3 bextOC bextEC bextSOIL bextSS bextCM totalBEXTMFB (%) -94.17 -85.46 4.96 -7.50 138.59 178.02 -92.16 -63.98MFE (%) 106.13 121.52 35.87 46.24 146.55 192.47 100.92 73.86Ap 1.26 0.42 0.48 0.80 5.01 1.79 -0.80 1.12NMB (%) -46.57 -28.06 17.14 5.51 631.35 909.08 -69.24 -38.72NME (%) 73.85 89.51 44.67 47.10 648.27 1026.45 72.85 55.67MNB (%) -43.83 -18.32 18.89 8.54 1821.12 -1.90 -53.08 -37.82MNE (%) 82.10 96.66 43.55 48.94 1826.58 88.88 64.36 58.76MB (μg/m3) -8.72 -1.12 0.73 0.11 0.97 2.19 -0.79 -16.09MAGE (μg/m3) 13.83 3.57 1.91 0.96 1.00 2.48 0.83 23.13RMSE (μg/m3) 17.59 4.96 2.88 1.22 1.31 3.29 1.09 27.06Obs Max (μg/m3) 31.91 10.95 8.95 3.38 0.69 3.59 3.75 52.59Pred Max (μg/m3) 72.10 15.57 13.26 6.09 4.17 10.01 0.77 111.51Mean_Obs 18.72 3.99 4.27 2.03 0.15 0.24 1.14 41.55Mean_Pred 10.00 2.87 5.00 2.15 1.13 2.43 0.35 25.46Std_Dev_Obs 8.30 3.09 1.77 0.72 0.17 0.84 0.78 9.77Std_Dev_Pre 14.66 4.40 3.10 1.33 0.89 2.27 0.21 21.63Variance 309.58 24.64 8.30 1.48 1.70 10.85 1.19 732.11R2 0.03 0.03 0.18 0.16 0.01 0.02 0.03 0.03BF 0.56 0.82 1.19 1.09 19.21 0.09 0.47 0.62N 23 23 23 23 23 23 23 23

C-17
Table C-4j. Model performance statistics for the Best 20% Days and the Hercules Glade Class I area. HEGL bextSO4 bextNO3 bextOC bextEC bextSOIL bextSS bextCM totalBEXTMFB (%) -132.82 -81.46 -11.53 -30.28 144.10 200.00 -32.67 -47.04MFE (%) 132.82 103.95 40.05 41.82 144.10 200.00 57.88 60.54Ap -0.63 1.76 0.17 -0.04 8.46 -999.00 -0.35 0.89NMB (%) -77.98 -20.11 -4.87 -21.83 720.14 -999.00 -28.19 -28.48NME (%) 77.98 82.73 35.75 33.02 720.14 -999.00 48.77 46.61MNB (%) -78.28 -32.69 0.82 -20.20 911.74 -999.00 -11.82 -29.64MNE (%) 78.28 78.59 39.89 33.88 911.74 -999.00 51.51 47.04MB (μg/m3) -9.24 -1.15 -0.27 -0.53 2.20 8.53 -0.67 -11.19MAGE (μg/m3) 9.24 4.73 2.01 0.80 2.20 8.53 1.16 18.31RMSE (μg/m3) 9.68 7.54 2.51 0.94 2.56 10.14 1.47 20.11Obs Max (μg/m3) 17.95 13.33 9.21 3.73 0.57 0.00 5.14 44.20Pred Max (μg/m3) 6.62 36.84 10.79 3.57 5.40 22.46 3.33 83.40Mean_Obs 11.85 5.71 5.61 2.41 0.31 0.00 2.39 39.28Mean_Pred 2.61 4.56 5.34 1.88 2.50 8.53 1.71 28.09Std_Dev_Obs 3.36 3.53 1.88 0.74 0.13 0.00 1.10 3.87Std_Dev_Pre 1.80 8.16 2.56 0.86 1.32 5.60 0.81 18.23Variance 93.67 56.85 6.31 0.88 6.57 102.75 2.15 404.22R2 0.23 0.13 0.14 0.27 0.02 -999.00 0.00 0.15BF 0.22 0.67 1.01 0.80 10.12 0.00 0.88 0.70N 23 23 23 23 23 23 23 23
Table C-4k. Model performance statistics for the Best 20% Days and the James River Face Class I area. JARI bextSO4 bextNO3 bextOC bextEC bextSOIL bextSS bextCM totalBEXTMFB (%) -91.09 -83.18 -65.51 -65.84 84.39 199.75 -132.42 -83.60MFE (%) 100.63 118.95 69.44 67.77 84.97 199.75 132.42 87.18Ap -0.09 0.75 -0.67 -0.72 0.88 330.57 -0.77 0.09NMB (%) -47.44 -45.84 -49.87 -54.56 146.02 291595.78 -80.40 -52.48NME (%) 59.51 92.91 53.49 55.58 146.61 291595.78 80.40 56.50MNB (%) -51.16 -4.56 -44.70 -45.74 216.63 6626.39 -78.95 -52.91MNE (%) 63.28 112.94 49.69 47.91 217.19 6626.39 78.95 57.42MB (μg/m3) -10.04 -2.26 -3.11 -1.88 0.35 2.00 -1.05 -25.36MAGE (μg/m3) 12.59 4.59 3.34 1.91 0.35 2.00 1.05 27.30RMSE (μg/m3) 14.16 5.71 4.56 2.62 0.43 2.45 1.18 29.72Obs Max (μg/m3) 41.57 10.56 21.39 9.96 0.69 0.02 2.90 60.15Pred Max (μg/m3) 37.76 18.46 6.97 2.82 1.29 5.24 0.67 65.41Mean_Obs 21.16 4.94 6.24 3.44 0.24 0.00 1.31 48.33Mean_Pred 11.12 2.67 3.13 1.56 0.59 2.00 0.26 22.97Std_Dev_Obs 7.70 2.48 3.83 1.96 0.15 0.00 0.61 7.18Std_Dev_Pre 11.63 4.04 1.82 0.58 0.26 1.45 0.15 16.35Variance 200.48 32.55 20.77 6.87 0.18 6.01 1.39 883.03R2 0.25 0.10 0.21 0.10 0.09 0.02 0.36 0.08BF 0.49 0.95 0.55 0.54 3.17 2.92 0.21 0.47N 23 23 23 23 23 23 23 23

C-18
Table C-4l. Model performance statistics for the Best 20% Days and the Linville Gorge Class I area. LIGO bextSO4 bextNO3 bextOC bextEC bextSOIL bextSS bextCM totalBEXTMFB (%) -115.63 -95.20 -45.21 -44.22 104.52 181.01 -105.22 -97.19MFE (%) 116.61 115.72 51.50 50.16 115.41 181.18 119.65 97.19Ap -0.44 -0.72 0.31 -0.09 1.23 2.10 -0.83 -0.42NMB (%) -69.37 -53.30 -31.24 -31.42 230.32 1115.81 -77.59 -63.14NME (%) 69.82 71.17 42.01 38.50 251.11 1117.78 78.96 63.14MNB (%) -69.20 -43.30 -30.96 -29.43 510.03 884.70 -45.89 -63.32MNE (%) 70.23 74.23 38.11 36.49 519.16 885.91 88.23 63.32MB (μg/m3) -9.06 -1.22 -1.42 -0.68 0.42 0.97 -0.72 -21.62MAGE (μg/m3) 9.12 1.63 1.90 0.83 0.46 0.97 0.74 21.62RMSE (μg/m3) 10.48 2.33 2.46 1.05 0.59 1.28 1.00 22.72Obs Max (μg/m3) 25.33 11.62 8.77 4.76 0.70 0.98 3.43 41.91Pred Max (μg/m3) 14.31 3.29 11.47 4.35 1.56 3.06 0.57 24.48Mean_Obs 13.05 2.29 4.53 2.16 0.18 0.09 0.93 34.24Mean_Pred 4.00 1.07 3.12 1.48 0.60 1.05 0.21 12.62Std_Dev_Obs 5.92 2.24 2.03 0.95 0.16 0.27 0.80 6.50Std_Dev_Pre 3.72 1.15 2.65 1.07 0.42 0.82 0.14 6.37Variance 109.79 5.41 6.07 1.10 0.35 1.65 1.01 516.35R2 0.20 0.19 0.41 0.46 0.02 0.00 0.43 0.14BF 0.31 0.57 0.69 0.71 6.10 1.41 0.54 0.37N 21 21 21 21 21 21 21 21
Table C-4m. Model performance statistics for the Best 20% Days and the Mammoth Cave Class I area. MACA bextSO4 bextNO3 bextOC bextEC bextSOIL bextSS bextCM totalBEXTMFB (%) -121.24 -61.27 -66.90 -38.39 96.54 200.00 -53.22 -83.33MFE (%) 121.24 98.70 67.80 46.35 106.03 200.00 106.30 83.33Ap -0.45 0.12 -0.29 -0.27 0.55 -999.00 -0.80 -0.04NMB (%) -73.51 -18.48 -47.74 -32.06 228.66 -999.00 -61.68 -53.43NME (%) 73.51 84.20 48.54 37.77 248.33 -999.00 76.41 53.43MNB (%) -72.87 -13.78 -46.23 -24.86 315.06 -999.00 -6.34 -53.97MNE (%) 72.87 81.80 47.16 34.63 322.26 -999.00 97.75 53.97MB (μg/m3) -18.73 -1.78 -3.18 -0.94 0.86 3.45 -0.71 -30.58MAGE (μg/m3) 18.73 8.09 3.24 1.11 0.94 3.45 0.88 30.58RMSE (μg/m3) 20.15 10.57 3.79 1.47 1.10 4.21 1.21 34.66Obs Max (μg/m3) 39.05 30.49 13.25 6.05 1.41 0.00 4.08 65.36Pred Max (μg/m3) 21.37 34.29 9.43 4.41 2.19 8.01 0.83 63.00Mean_Obs 25.48 9.61 6.67 2.94 0.38 0.00 1.15 57.23Mean_Pred 6.75 7.83 3.49 2.00 1.24 3.45 0.44 26.65Std_Dev_Obs 6.70 6.69 2.68 1.11 0.27 0.00 1.02 6.69Std_Dev_Pre 5.16 9.91 2.19 0.90 0.60 2.47 0.25 17.74Variance 405.94 111.65 14.33 2.17 1.22 17.73 1.47 1201.52R2 0.04 0.05 0.42 0.13 0.03 -999.00 0.03 0.12BF 0.27 0.86 0.54 0.75 4.15 0.00 0.90 0.46N 23 23 23 23 23 23 23 23

C-19
Table C-4n. Model performance statistics for the Best 20% Days and the Mingo Class I area. MING bextSO4 bextNO3 bextOC bextEC bextSOIL bextSS bextCM totalBEXTMFB (%) -122.89 -71.02 -31.76 -7.09 138.37 197.99 24.07 -20.17MFE (%) 122.89 108.52 46.62 37.98 138.37 197.99 58.30 47.25Ap -0.59 4.78 -0.27 0.22 4.57 53.62 -0.18 2.28NMB (%) -73.17 15.70 -26.09 -2.91 508.18 20904.07 14.53 0.62NME (%) 73.17 124.27 39.88 37.18 508.18 20904.07 64.88 48.50MNB (%) -73.66 10.81 -17.69 3.48 1070.38 3119.60 89.76 -1.41MNE (%) 73.66 118.63 38.69 38.50 1070.38 3119.60 114.86 46.76MB (μg/m3) -12.68 0.74 -1.74 -0.07 2.61 21.82 0.41 0.29MAGE (μg/m3) 12.68 5.88 2.66 0.88 2.61 21.82 1.84 22.58RMSE (μg/m3) 13.73 13.02 3.40 1.10 3.11 28.77 2.72 35.59Obs Max (μg/m3) 32.46 11.03 12.57 3.80 1.45 1.47 9.86 56.75Pred Max (μg/m3) 13.20 63.78 9.23 4.66 8.05 80.50 8.10 186.22Mean_Obs 17.33 4.73 6.68 2.38 0.51 0.10 2.83 46.57Mean_Pred 4.65 5.48 4.93 2.31 3.12 21.93 3.24 46.86Std_Dev_Obs 6.18 3.01 2.76 0.77 0.38 0.35 2.51 7.41Std_Dev_Pre 3.83 13.49 2.45 1.07 1.71 19.37 1.84 38.39Variance 188.61 169.45 11.59 1.21 9.67 827.57 7.42 1266.49R2 0.25 0.03 0.12 0.09 0.00 0.27 0.05 0.13BF 0.26 1.11 0.82 1.03 11.70 2.93 1.90 0.99Num_Points 22 22 22 22 22 22 22 22
Table C-4o. Model performance statistics for the Best 20% Days and the Okefenokee Class I area. OKEF bextSO4 bextNO3 bextOC bextEC bextSOIL bextSS bextCM totalBEXTMFB (%) -128.51 -179.19 31.20 -51.96 15.38 151.32 -127.01 -83.50MFE (%) 128.51 179.19 43.66 66.15 92.26 162.36 127.01 83.50Ap -0.57 -0.56 0.83 -0.13 -0.23 0.04 -0.71 -0.33NMB (%) -76.36 -92.60 53.82 -31.70 5.19 217.14 -80.36 -56.54NME (%) 76.36 92.60 61.43 49.69 109.76 270.83 80.36 56.54MNB (%) -76.48 -92.69 52.43 -31.75 160.17 -8.23 -75.22 -56.79MNE (%) 76.48 92.69 62.30 51.45 208.59 31.64 75.22 56.79MB (μg/m3) -14.61 -3.72 3.79 -0.69 0.02 0.59 -1.57 -26.00MAGE (μg/m3) 14.61 3.72 4.33 1.09 0.41 0.74 1.57 26.00RMSE (μg/m3) 15.31 4.06 5.77 1.22 0.55 0.88 1.81 27.22Obs Max (μg/m3) 26.45 8.07 11.63 4.86 1.77 2.07 3.93 52.70Pred Max (μg/m3) 11.29 3.56 21.29 4.24 1.36 2.15 1.12 35.48Mean_Obs 19.13 4.02 7.05 2.18 0.37 0.27 1.96 45.99Mean_Pred 4.52 0.30 10.85 1.49 0.39 0.86 0.38 19.99Std_Dev_Obs 4.27 1.56 2.04 0.85 0.39 0.61 0.94 5.57Std_Dev_Pre 3.31 0.77 5.18 1.11 0.32 0.52 0.27 8.41Variance 234.25 16.49 33.34 1.48 0.31 0.78 3.27 740.97R2 0.07 0.01 0.28 0.23 0.07 0.09 0.06 0.13BF 0.24 0.07 1.52 0.68 2.60 0.21 0.25 0.43Num_Points 22 22 22 22 22 22 22 22

C-20
Table C-4p. Model performance statistics for the Best 20% Days and the Cape Romain Class I area. ROMA bextSO4 bextNO3 bextOC bextEC bextSOIL bextSS bextCM totalBEXTMFB (%) -124.88 -181.06 -94.53 -46.13 12.09 -31.75 -43.14 -122.25MFE (%) 135.54 181.06 101.08 72.68 84.22 150.25 63.91 126.73Ap 0.56 -0.57 0.10 -0.25 1.56 -0.80 -0.58 0.06NMB (%) -59.52 -93.83 -50.21 -35.42 27.07 -75.42 -45.43 -69.84NME (%) 78.50 93.83 61.05 49.83 104.69 108.25 53.72 74.60MNB (%) -60.36 -93.35 -56.56 -35.41 71.98 -4.48 -19.27 -70.13MNE (%) 87.92 93.35 64.79 46.91 115.30 120.19 52.90 76.16MB (μg/m3) -8.44 -2.51 -1.72 -0.37 0.06 -2.52 -1.23 -27.68MAGE (μg/m3) 11.13 2.51 2.09 0.53 0.23 3.62 1.46 29.56RMSE (μg/m3) 12.73 2.73 2.45 0.75 0.37 5.48 2.27 30.48Obs Max (μg/m3) 26.12 4.50 8.19 5.01 0.65 15.38 8.77 50.02Pred Max (μg/m3) 40.73 1.93 9.04 3.75 1.66 3.04 3.67 53.00Mean_Obs 14.19 2.68 3.43 1.06 0.22 3.35 2.71 39.63Mean_Pred 5.74 0.17 1.71 0.68 0.28 0.82 1.48 11.95Std_Dev_Obs 6.77 1.02 1.81 1.08 0.18 4.48 2.03 7.68Std_Dev_Pre 9.02 0.43 2.23 0.93 0.37 0.88 0.88 12.36Variance 161.99 7.47 5.98 0.56 0.13 30.00 5.16 928.75R2 0.07 0.00 0.40 0.63 0.05 0.23 0.09 0.05BF 0.40 0.07 0.43 0.62 1.72 0.75 0.81 0.30Num_Points 23 23 23 23 23 23 23 23
Table C-4q. Model performance statistics for the Best 20% Days and the St. Marks Class I area. SAMA bextSO4 bextNO3 bextOC bextEC bextSOIL bextSS bextCM totalBEXTMFB (%) -126.89 -188.67 0.59 -14.74 1.18 160.72 -97.03 -97.60MFE (%) 137.86 188.67 63.77 63.21 119.22 174.90 100.19 102.93Ap 0.37 -0.80 1.33 0.82 -0.69 3.18 -0.64 0.28NMB (%) -68.20 -96.21 45.71 21.88 -42.60 502.57 -67.55 -57.30NME (%) 80.63 96.21 84.58 78.78 103.88 537.83 69.19 63.73MNB (%) -60.48 -96.73 40.44 14.39 195.14 3985.28 -60.84 -57.58MNE (%) 88.12 96.73 85.00 69.07 259.81 4022.29 64.66 64.99MB (μg/m3) -12.62 -2.70 2.03 0.34 -0.20 0.93 -1.72 -23.78MAGE (μg/m3) 14.92 2.70 3.76 1.23 0.48 1.00 1.76 26.45RMSE (μg/m3) 15.81 2.84 5.77 1.86 0.70 1.37 2.07 28.55Obs Max (μg/m3) 24.51 4.76 9.53 3.98 2.05 1.13 4.89 50.25Pred Max (μg/m3) 33.63 0.96 22.22 7.25 0.64 4.74 1.75 64.45Mean_Obs 18.50 2.80 4.45 1.57 0.47 0.19 2.54 41.51Mean_Pred 5.88 0.11 6.48 1.91 0.27 1.12 0.83 17.73Std_Dev_Obs 4.41 0.96 1.96 1.04 0.58 0.37 1.09 6.13Std_Dev_Pre 8.14 0.25 5.95 2.16 0.19 1.16 0.45 16.11Variance 249.94 8.05 33.28 3.45 0.49 1.87 4.27 814.88R2 0.02 0.14 0.14 0.25 0.23 0.26 0.00 0.03BF 0.40 0.03 1.40 1.14 2.95 11.14 0.39 0.42Num_Points 22 22 22 22 22 22 22 22

C-21
Table C-4r. Model performance statistics for the Best 20% Days and the Shenandoah Class I area. SHEN bextSO4 bextNO3 bextOC bextEC bextSOIL bextSS bextCM totalBEXTMFB (%) -74.36 25.46 35.69 15.95 133.54 200.00 -62.78 -25.64MFE (%) 93.26 75.95 50.96 36.84 133.54 200.00 73.10 53.35Ap 5.97 1.09 5.98 4.44 3.08 -999.00 -0.54 3.27NMB (%) 4.37 74.12 91.62 50.01 420.15 -999.00 -52.15 6.69NME (%) 99.60 103.04 107.36 67.27 420.15 -999.00 56.76 56.93MNB (%) -9.26 79.51 87.61 49.86 901.25 -999.00 -39.38 2.07MNE (%) 96.56 110.24 100.76 66.81 901.25 -999.00 54.53 57.60MB (μg/m3) 0.52 3.61 2.55 0.81 0.57 3.12 -0.47 2.16MAGE (μg/m3) 11.86 5.02 2.99 1.09 0.57 3.12 0.51 18.34RMSE (μg/m3) 28.13 6.76 7.50 2.78 0.65 3.91 0.61 34.08Obs Max (μg/m3) 20.73 11.73 5.74 2.68 0.35 0.00 1.92 42.00Pred Max (μg/m3) 144.46 24.52 40.06 14.58 1.41 8.41 0.89 179.34Mean_Obs 11.90 4.87 2.78 1.62 0.14 0.00 0.90 32.21Mean_Pred 12.42 8.48 5.33 2.43 0.71 3.12 0.43 34.37Std_Dev_Obs 4.19 2.96 1.49 0.69 0.09 0.00 0.49 6.21Std_Dev_Pre 29.54 6.95 7.90 2.83 0.33 2.40 0.22 36.39Variance 791.22 45.64 56.28 7.74 0.42 15.25 0.37 1161.58R2 0.07 0.31 0.28 0.08 0.20 -999.00 0.37 0.12BF 0.91 1.80 1.88 1.50 10.01 0.00 0.61 1.02Num_Points 23 23 23 23 23 23 23 23
Table C-4s. Model performance statistics for the Best 20% Days and the Shining Rock Class I area. SHRO bextSO4 bextNO3 bextOC bextEC bextSOIL bextSS bextCM totalBEXTMFB (%) -75.84 -81.41 13.51 27.00 123.07 194.49 -1.93 -68.69MFE (%) 86.97 107.46 56.47 58.31 131.08 194.49 144.41 74.39Ap 1.86 -0.12 0.39 0.57 3.68 36.95 -0.76 0.70NMB (%) -32.22 -52.02 30.21 41.98 483.48 9454.52 -69.54 -42.24NME (%) 62.92 80.62 67.11 68.10 499.53 9454.52 93.21 51.49MNB (%) -43.15 -17.86 61.34 130.27 1099.73 1414.30 21.60 -44.28MNE (%) 62.34 93.68 91.14 155.33 1105.94 1414.30 142.80 51.78MB (μg/m3) -2.64 -0.81 0.74 0.46 0.46 0.92 -0.43 -10.14MAGE (μg/m3) 5.16 1.25 1.63 0.74 0.47 0.92 0.58 12.36RMSE (μg/m3) 7.24 1.75 2.33 1.02 0.59 1.32 0.82 14.01Obs Max (μg/m3) 13.73 4.65 6.13 2.31 0.28 0.10 2.87 31.05Pred Max (μg/m3) 39.24 4.09 8.51 3.63 1.29 3.81 0.68 52.94Mean_Obs 8.19 1.55 2.43 1.09 0.09 0.01 0.62 24.00Mean_Pred 5.55 0.75 3.17 1.55 0.55 0.93 0.19 13.86Std_Dev_Obs 4.17 1.30 1.31 0.58 0.08 0.03 0.70 5.96Std_Dev_Pre 8.28 1.00 2.05 0.98 0.38 0.97 0.14 10.91Variance 52.35 3.08 5.44 1.05 0.35 1.75 0.68 196.33R2 0.31 0.00 0.02 0.14 0.02 0.00 0.00 0.19BF 0.57 0.79 1.61 2.30 12.00 2.52 0.86 0.56N 24 24 24 24 24 24 24 24

C-22
Table C-4t. Model performance statistics for the Best 20% Days and the Sipsey Class I area. SIPS bextSO4 bextNO3 bextOC bextEC bextSOIL bextSS bextCM totalBEXTMFB (%) -106.85 -109.16 -9.15 -54.86 77.60 200.00 -117.27 -69.04MFE (%) 120.51 109.41 40.17 64.97 113.99 200.00 117.27 78.81Ap 1.69 -0.33 0.70 -0.04 -0.14 -999.00 -0.74 1.04NMB (%) -47.35 -56.06 8.56 -36.07 120.89 -999.00 -76.03 -41.33NME (%) 84.16 56.35 41.07 46.35 198.21 -999.00 76.03 57.32MNB (%) -53.46 -61.27 2.84 -34.17 389.14 -999.00 -71.89 -42.53MNE (%) 82.66 61.52 39.22 48.53 410.41 -999.00 71.89 57.28MB (μg/m3) -9.62 -4.46 0.59 -0.98 0.65 3.74 -1.76 -21.39MAGE (μg/m3) 17.11 4.49 2.83 1.26 1.06 3.74 1.76 29.67RMSE (μg/m3) 21.62 6.66 3.79 1.53 1.30 4.54 2.07 32.63Obs Max (μg/m3) 36.05 21.36 11.04 4.69 2.95 0.00 4.24 61.55Pred Max (μg/m3) 97.08 14.24 18.78 4.49 2.52 9.09 1.12 125.72Mean_Obs 20.32 7.96 6.89 2.72 0.54 0.00 2.31 51.75Mean_Pred 10.70 3.50 7.48 1.74 1.19 3.74 0.55 30.36Std_Dev_Obs 6.48 5.30 2.40 1.08 0.67 0.00 1.17 6.11Std_Dev_Pre 20.91 4.28 5.23 1.17 0.75 2.64 0.29 26.57Variance 467.50 44.35 14.40 2.35 1.70 20.58 4.28 1064.78R2 0.10 0.21 0.54 0.19 0.10 -999.00 0.08 0.11BF 0.47 0.39 1.03 0.66 4.89 0.00 0.28 0.57N 21 21 21 21 21 21 21 21
Table C-4u. Model performance statistics for the Best 20% Days and the Swanquarter Class I area. SWAN bextSO4 bextNO3 bextOC bextEC bextSOIL bextSS bextCM totalBEXTMFB (%) -136.66 -161.55 -38.76 -28.09 46.67 34.79 -118.19 -118.69MFE (%) 138.38 170.70 62.73 58.61 109.65 173.91 118.19 120.57Ap -0.13 1.44 2.83 1.96 0.27 -0.67 -0.60 0.18NMB (%) -74.90 -69.17 11.83 17.63 96.96 -46.99 -72.45 -68.09NME (%) 77.12 92.56 65.71 77.26 189.16 134.86 72.45 70.44MNB (%) -76.02 -77.95 -12.66 83.61 335.71 -81.74 -73.26 -69.58MNE (%) 77.94 92.54 56.88 146.06 375.39 81.74 73.26 71.69MB (μg/m3) -9.68 -1.72 0.37 0.18 0.16 -0.66 -2.15 -24.60MAGE (μg/m3) 9.97 2.30 2.06 0.80 0.31 1.89 2.15 25.45RMSE (μg/m3) 10.90 2.57 4.25 1.71 0.42 3.11 2.37 26.66Obs Max (μg/m3) 21.09 4.21 6.60 2.59 0.87 11.33 6.25 42.25Pred Max (μg/m3) 18.25 10.24 25.28 7.65 1.11 3.69 2.53 49.97Mean_Obs 12.93 2.48 3.14 1.04 0.16 1.40 2.97 36.13Mean_Pred 3.24 0.77 3.51 1.22 0.32 0.74 0.82 11.53Std_Dev_Obs 3.88 0.85 1.44 0.75 0.19 2.68 1.42 3.96Std_Dev_Pre 4.36 2.22 5.35 1.84 0.32 1.02 0.60 11.96Variance 118.84 6.61 18.09 2.91 0.18 9.70 5.63 710.89R2 0.05 0.23 0.60 0.11 0.03 0.08 0.62 0.26BF 0.24 0.22 0.87 1.84 4.36 0.09 0.27 0.30N 23 23 23 23 23 23 23 23

C-23
Table C-4v. Model performance statistics for the Best 20% Days and the Upper Buffalo Class I area. UPBU bextSO4 bextNO3 bextOC bextEC bextSOIL bextSS bextCM totalBEXTMFB (%) -138.41 -121.02 -23.25 -46.69 93.32 199.90 -110.88 -88.95MFE (%) 139.43 121.02 44.59 56.99 108.59 199.90 126.30 90.01Ap -0.07 -0.37 -0.11 0.36 2.20 1232.47 -0.85 0.00NMB (%) -77.41 -71.02 -13.97 -31.38 262.69 767627.06 -78.16 -58.54NME (%) 79.10 71.02 36.99 43.46 275.35 767627.06 81.63 59.75MNB (%) -78.49 -70.21 -11.36 -29.34 1615.30 17510.96 -57.49 -57.86MNE (%) 79.56 70.21 37.29 42.69 1625.86 17510.96 84.47 58.99MB (μg/m3) -8.11 -3.62 -0.67 -0.54 0.95 3.28 -2.71 -21.59MAGE (μg/m3) 8.28 3.62 1.76 0.74 1.00 3.28 2.83 22.04RMSE (μg/m3) 9.10 4.57 2.03 0.88 1.19 4.05 3.42 23.65Obs Max (μg/m3) 19.65 12.68 8.70 2.65 0.81 0.01 8.94 44.16Pred Max (μg/m3) 18.27 7.98 7.73 3.60 2.58 11.59 1.31 44.17Mean_Obs 10.47 5.10 4.77 1.71 0.36 0.00 3.47 36.88Mean_Pred 2.36 1.48 4.10 1.17 1.32 3.28 0.76 15.29Std_Dev_Obs 4.10 3.60 1.70 0.47 0.17 0.00 2.13 5.26Std_Dev_Pre 3.75 1.87 2.09 0.74 0.63 2.44 0.33 8.88Variance 82.79 20.90 4.14 0.78 1.41 16.42 11.68 559.29R2 0.18 0.38 0.23 0.12 0.20 0.02 0.00 0.01BF 0.22 0.30 0.89 0.71 17.15 8.00 0.43 0.42N 22 22 22 22 22 22 22 22
Table C-5a. Model performance statistics for the Worst 20% Days across Class I areas in the 12 km VISTAS grid. 12km bextSO4 bextNO3 bextOC bextEC bextSOIL bextSS bextCM totalBEXTMFB (%) -63.82 -121.18 -32.08 -63.17 22.51 188.69 -87.88 -49.58MFE (%) 74.05 146.07 50.78 70.50 69.91 191.96 115.76 60.44Ap -0.50 0.44 -0.83 -0.28 -0.43 8.80 -0.65 -0.43NMB (%) -39.35 -18.22 -29.24 -42.51 36.38 18564.68 -69.20 -32.51NME (%) 50.22 87.96 48.66 52.21 97.47 18666.07 74.92 44.58MNB (%) -38.14 -39.83 -15.63 -41.16 156.91 7919.56 -39.56 -29.87MNE (%) 51.57 102.75 43.37 51.71 189.98 7956.43 88.73 44.15MB (μg/m3) -48.14 -1.38 -6.15 -2.24 0.38 12.46 -2.26 -55.75MAGE (μg/m3) 61.44 6.66 10.23 2.75 1.01 12.52 2.44 76.45RMSE (μg/m3) 82.20 13.69 28.78 3.59 1.79 20.70 3.53 101.79Obs Max (μg/m3) 475.66 107.80 614.69 41.23 16.92 11.70 20.96 735.80Pred Max (μg/m3) 235.90 154.76 102.23 29.67 9.61 114.64 7.23 419.01Mean_Obs 122.36 7.57 21.03 5.26 1.04 0.07 3.26 171.51Mean_Pred 74.22 6.19 14.88 3.03 1.42 12.52 1.01 115.76Std_Dev_Obs 68.78 14.02 31.42 3.03 1.23 0.57 2.77 72.23Std_Dev_Pre 59.70 18.80 12.73 3.01 1.23 16.52 1.03 74.73Variance 6757.49 187.38 828.03 12.88 3.20 428.51 12.47 10360.90R2 0.22 0.48 0.20 0.32 0.00 0.00 0.06 0.11BF 0.62 0.60 0.84 0.59 2.57 4.23 0.58 0.70N 512 512 510 510 512 512 512 512

C-24
Table C-5b. Model performance statistics for the Worst 20% Days at the Breton Island Class I area. BRET bextSO4 bextNO3 bextOC bextEC bextSOIL bextSS bextCM totalBEXTMFB (%) -108.00 -197.37 -85.96 -103.52 -39.07 138.89 -103.81 -108.13MFE (%) 113.52 197.37 88.07 103.52 106.38 165.39 103.81 109.77Ap -0.13 -0.96 -0.75 -0.68 -0.84 1.71 -0.37 -0.25NMB (%) -58.22 -98.65 -60.76 -69.59 -60.95 572.95 -61.85 -62.38NME (%) 64.22 98.65 62.79 69.59 99.61 650.61 61.85 63.98MNB (%) -60.00 -99.31 -53.74 -66.26 39.75 76.21 -63.36 -62.99MNE (%) 66.37 99.31 56.03 66.26 126.72 130.85 63.36 64.73MB (μg/m3) -42.55 -8.04 -5.76 -3.05 -0.78 1.64 -2.74 -69.94MAGE (μg/m3) 46.94 8.04 5.95 3.05 1.28 1.87 2.74 71.73RMSE (μg/m3) 52.63 10.62 10.17 3.77 2.59 2.49 3.16 79.19Obs Max (μg/m3) 126.22 29.70 46.34 12.96 11.47 1.93 10.72 171.55Pred Max (μg/m3) 109.49 1.16 11.69 4.20 1.84 5.21 6.78 129.27Mean_Obs 73.10 8.15 9.47 4.38 1.28 0.29 4.44 112.12Mean_Pred 30.54 0.11 3.72 1.33 0.50 1.93 1.69 42.17Std_Dev_Obs 18.79 7.30 10.41 2.76 2.32 0.55 2.01 19.64Std_Dev_Pre 34.94 0.30 3.36 0.93 0.52 1.69 1.72 40.19Variance 2770.25 112.76 103.42 14.21 6.70 6.18 9.96 6270.32R2 0.19 0.55 0.44 0.43 0.08 0.07 0.42 0.13BF 0.40 0.01 0.46 0.34 1.40 0.51 0.37 0.37N 24 24 24 24 24 24 24 24
Table C-5c. Model performance statistics for the Worst 20% Days at the Brigantine Class I area.
BRIG bextSO4 bextNO3 bextOC bextEC bextSOIL bextSS bextCM totalBEXTMFB (%) -68.36 -54.70 -42.36 -16.55 25.67 197.35 -96.66 -44.58MFE (%) 76.35 101.20 51.78 34.66 67.60 197.35 133.02 55.90Ap -0.28 0.60 -0.83 -0.28 -0.44 17.73 -0.92 -0.70NMB (%) -44.01 58.77 -63.48 -14.87 38.85 16306.94 -81.39 -38.91NME (%) 53.83 103.33 67.06 30.43 98.91 16306.94 84.05 48.12MNB (%) -43.87 -1.06 -27.55 -7.43 133.28 486.75 -76.23 -28.70MNE (%) 54.42 87.49 40.23 34.29 162.56 486.75 76.23 42.52MB (μg/m3) -53.74 7.87 -31.03 -1.17 0.43 8.35 -3.53 -81.61MAGE (μg/m3) 65.73 13.84 32.78 2.40 1.08 8.35 3.64 100.93RMSE (μg/m3) 77.68 25.55 110.38 3.47 1.68 9.45 5.34 154.13Obs Max (μg/m3) 275.18 71.94 614.69 41.23 6.83 1.13 20.65 735.80Pred Max (μg/m3) 197.92 115.45 102.23 29.67 3.80 21.08 1.62 223.13Mean_Obs 122.10 13.40 48.89 7.88 1.10 0.05 4.34 209.75Mean_Pred 68.36 21.27 17.86 6.71 1.52 8.40 0.81 128.14Std_Dev_Obs 60.77 16.68 127.43 7.80 1.30 0.24 4.16 133.57Std_Dev_Pre 52.55 37.68 20.47 5.76 1.05 4.52 0.31 56.24Variance 6034.93 652.70 12184.42 12.05 2.83 89.35 28.56 23754.77R2 0.24 0.74 0.88 0.85 0.00 0.01 0.04 0.04BF 0.56 0.99 0.72 0.93 2.33 0.27 0.22 0.71N 22 22 22 22 22 22 22 22

C-25
Table C-5d. Model performance statistics for the Worst 20% Days at the Caney Creek Class I area. CACR bextSO4 bextNO3 bextOC bextEC bextSOIL bextSS bextCM totalBEXTMFB (%) -69.34 -45.08 -7.66 -68.17 31.62 190.50 -113.64 -43.67MFE (%) 73.49 94.78 32.17 68.17 57.31 190.50 122.51 52.94Ap -0.46 0.69 -0.12 -0.34 -0.26 20.76 -0.81 -0.25NMB (%) -46.53 23.99 -3.37 -49.45 29.65 24425.54 -79.04 -30.60NME (%) 50.44 86.91 28.24 49.45 81.70 24425.54 79.74 40.54MNB (%) -45.19 17.81 0.41 -48.37 140.50 1964.48 -61.55 -26.81MNE (%) 50.01 99.08 30.62 48.37 158.09 1964.48 79.67 40.75MB (μg/m3) -50.95 2.45 -0.66 -2.16 0.42 14.33 -3.40 -49.12MAGE (μg/m3) 55.22 8.88 5.55 2.16 1.16 14.33 3.43 65.08RMSE (μg/m3) 78.07 23.14 7.96 2.46 1.88 16.37 3.94 92.23Obs Max (μg/m3) 281.03 70.57 51.07 7.26 6.70 1.35 7.89 324.07Pred Max (μg/m3) 151.79 119.16 44.88 4.82 4.98 29.35 1.46 244.51Mean_Obs 109.50 10.22 19.65 4.38 1.43 0.06 4.30 160.52Mean_Pred 58.54 12.67 18.99 2.21 1.85 14.38 0.90 111.40Std_Dev_Obs 61.21 17.65 10.63 1.38 1.34 0.28 1.98 59.45Std_Dev_Pre 44.67 27.86 10.96 1.04 1.01 8.19 0.32 65.64Variance 6095.27 535.44 63.35 6.06 3.54 267.87 15.53 8506.03R2 0.15 0.30 0.52 0.29 0.07 0.13 0.01 0.04BF 0.55 1.18 1.00 0.52 2.41 0.90 0.38 0.73N 23 23 23 23 23 23 23 23
Table C-5e. Model performance statistics for the Worst 20% Days at the Chassahowitzka Class I area. CHAS bextSO4 bextNO3 bextOC bextEC bextSOIL bextSS bextCM totalBEXTMFB (%) -56.60 -120.68 -35.75 -30.28 103.28 200.00 -20.70 -16.94MFE (%) 65.36 143.24 47.42 50.30 115.65 200.00 41.49 34.42Ap 0.63 1.18 -0.34 0.35 0.04 -999.00 -0.48 0.51NMB (%) -30.52 -46.96 -29.64 -18.68 199.83 -999.00 -24.95 -9.49NME (%) 45.19 90.60 40.89 44.17 239.31 -999.00 41.42 31.54MNB (%) -36.55 -38.40 -24.84 -16.13 522.15 -999.00 -9.21 -10.29MNE (%) 47.47 100.64 38.58 45.44 531.13 -999.00 37.57 31.36MB (μg/m3) -23.98 -2.50 -6.10 -1.16 1.31 28.97 -0.67 -11.87MAGE (μg/m3) 35.52 4.83 8.42 2.73 1.57 28.97 1.11 39.44RMSE (μg/m3) 40.90 6.12 11.22 3.14 1.84 30.72 1.65 44.81Obs Max (μg/m3) 121.53 9.87 71.19 10.37 3.58 0.00 6.40 169.84Pred Max (μg/m3) 198.53 21.47 46.83 14.02 3.71 58.76 3.31 256.55Mean_Obs 78.59 5.33 20.60 6.19 0.66 0.00 2.69 125.05Mean_Pred 54.61 2.83 14.49 5.03 1.97 28.97 2.02 113.18Std_Dev_Obs 22.96 2.23 14.55 1.97 0.74 0.00 1.34 19.06Std_Dev_Pre 46.76 5.23 10.49 3.27 0.87 10.47 0.50 50.42Variance 1673.04 37.40 125.95 9.83 3.38 943.77 2.73 2007.87R2 0.53 0.00 0.56 0.19 0.11 -999.00 0.07 0.25BF 0.63 0.62 0.75 0.84 6.22 0.00 0.91 0.90N 23 23 23 23 23 23 23 23
C-26
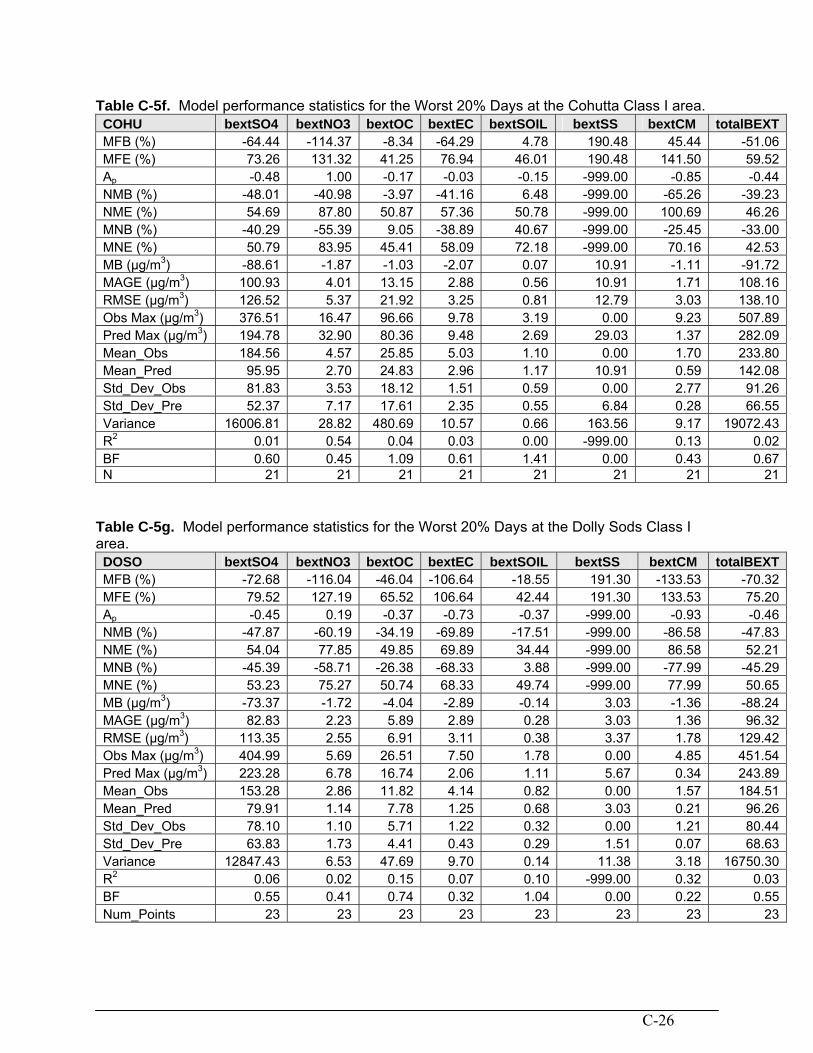
Table C-5f. Model performance statistics for the Worst 20% Days at the Cohutta Class I area. COHU bextSO4 bextNO3 bextOC bextEC bextSOIL bextSS bextCM totalBEXTMFB (%) -64.44 -114.37 -8.34 -64.29 4.78 190.48 45.44 -51.06MFE (%) 73.26 131.32 41.25 76.94 46.01 190.48 141.50 59.52Ap -0.48 1.00 -0.17 -0.03 -0.15 -999.00 -0.85 -0.44NMB (%) -48.01 -40.98 -3.97 -41.16 6.48 -999.00 -65.26 -39.23NME (%) 54.69 87.80 50.87 57.36 50.78 -999.00 100.69 46.26MNB (%) -40.29 -55.39 9.05 -38.89 40.67 -999.00 -25.45 -33.00MNE (%) 50.79 83.95 45.41 58.09 72.18 -999.00 70.16 42.53MB (μg/m3) -88.61 -1.87 -1.03 -2.07 0.07 10.91 -1.11 -91.72MAGE (μg/m3) 100.93 4.01 13.15 2.88 0.56 10.91 1.71 108.16RMSE (μg/m3) 126.52 5.37 21.92 3.25 0.81 12.79 3.03 138.10Obs Max (μg/m3) 376.51 16.47 96.66 9.78 3.19 0.00 9.23 507.89Pred Max (μg/m3) 194.78 32.90 80.36 9.48 2.69 29.03 1.37 282.09Mean_Obs 184.56 4.57 25.85 5.03 1.10 0.00 1.70 233.80Mean_Pred 95.95 2.70 24.83 2.96 1.17 10.91 0.59 142.08Std_Dev_Obs 81.83 3.53 18.12 1.51 0.59 0.00 2.77 91.26Std_Dev_Pre 52.37 7.17 17.61 2.35 0.55 6.84 0.28 66.55Variance 16006.81 28.82 480.69 10.57 0.66 163.56 9.17 19072.43R2 0.01 0.54 0.04 0.03 0.00 -999.00 0.13 0.02BF 0.60 0.45 1.09 0.61 1.41 0.00 0.43 0.67N 21 21 21 21 21 21 21 21
Table C-5g. Model performance statistics for the Worst 20% Days at the Dolly Sods Class I area. DOSO bextSO4 bextNO3 bextOC bextEC bextSOIL bextSS bextCM totalBEXTMFB (%) -72.68 -116.04 -46.04 -106.64 -18.55 191.30 -133.53 -70.32MFE (%) 79.52 127.19 65.52 106.64 42.44 191.30 133.53 75.20Ap -0.45 0.19 -0.37 -0.73 -0.37 -999.00 -0.93 -0.46NMB (%) -47.87 -60.19 -34.19 -69.89 -17.51 -999.00 -86.58 -47.83NME (%) 54.04 77.85 49.85 69.89 34.44 -999.00 86.58 52.21MNB (%) -45.39 -58.71 -26.38 -68.33 3.88 -999.00 -77.99 -45.29MNE (%) 53.23 75.27 50.74 68.33 49.74 -999.00 77.99 50.65MB (μg/m3) -73.37 -1.72 -4.04 -2.89 -0.14 3.03 -1.36 -88.24MAGE (μg/m3) 82.83 2.23 5.89 2.89 0.28 3.03 1.36 96.32RMSE (μg/m3) 113.35 2.55 6.91 3.11 0.38 3.37 1.78 129.42Obs Max (μg/m3) 404.99 5.69 26.51 7.50 1.78 0.00 4.85 451.54Pred Max (μg/m3) 223.28 6.78 16.74 2.06 1.11 5.67 0.34 243.89Mean_Obs 153.28 2.86 11.82 4.14 0.82 0.00 1.57 184.51Mean_Pred 79.91 1.14 7.78 1.25 0.68 3.03 0.21 96.26Std_Dev_Obs 78.10 1.10 5.71 1.22 0.32 0.00 1.21 80.44Std_Dev_Pre 63.83 1.73 4.41 0.43 0.29 1.51 0.07 68.63Variance 12847.43 6.53 47.69 9.70 0.14 11.38 3.18 16750.30R2 0.06 0.02 0.15 0.07 0.10 -999.00 0.32 0.03BF 0.55 0.41 0.74 0.32 1.04 0.00 0.22 0.55Num_Points 23 23 23 23 23 23 23 23
C-27
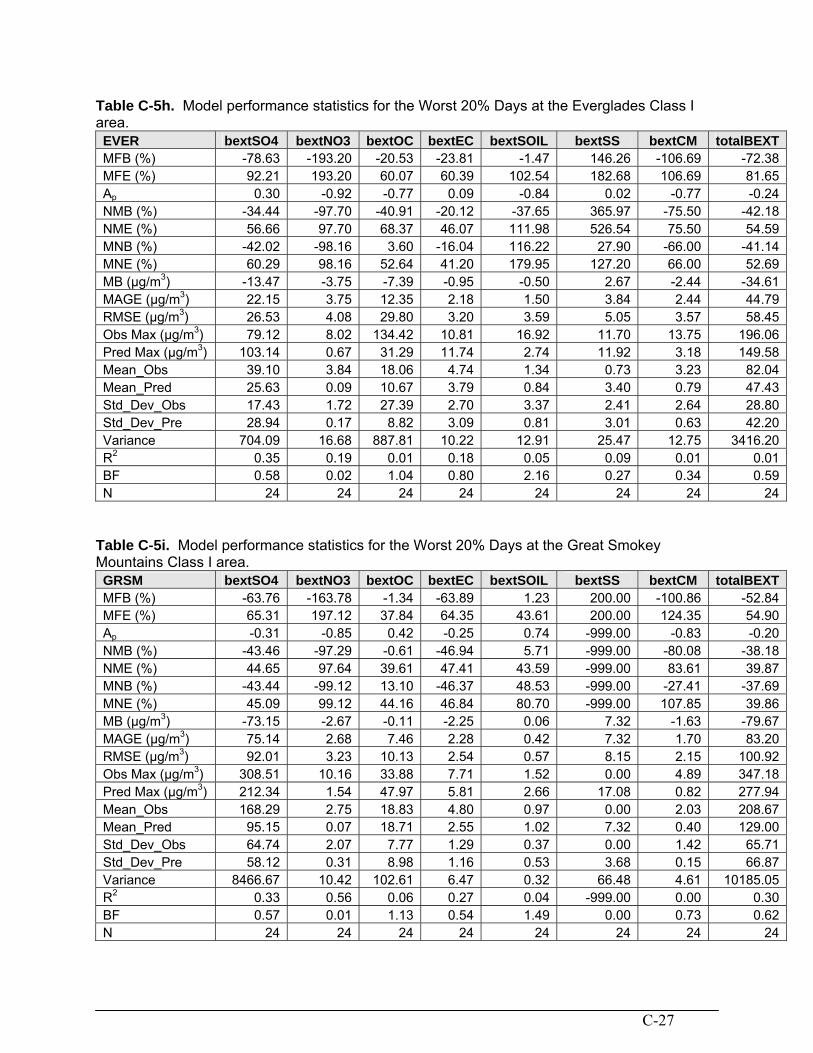
Table C-5h. Model performance statistics for the Worst 20% Days at the Everglades Class I area. EVER bextSO4 bextNO3 bextOC bextEC bextSOIL bextSS bextCM totalBEXTMFB (%) -78.63 -193.20 -20.53 -23.81 -1.47 146.26 -106.69 -72.38MFE (%) 92.21 193.20 60.07 60.39 102.54 182.68 106.69 81.65Ap 0.30 -0.92 -0.77 0.09 -0.84 0.02 -0.77 -0.24NMB (%) -34.44 -97.70 -40.91 -20.12 -37.65 365.97 -75.50 -42.18NME (%) 56.66 97.70 68.37 46.07 111.98 526.54 75.50 54.59MNB (%) -42.02 -98.16 3.60 -16.04 116.22 27.90 -66.00 -41.14MNE (%) 60.29 98.16 52.64 41.20 179.95 127.20 66.00 52.69MB (μg/m3) -13.47 -3.75 -7.39 -0.95 -0.50 2.67 -2.44 -34.61MAGE (μg/m3) 22.15 3.75 12.35 2.18 1.50 3.84 2.44 44.79RMSE (μg/m3) 26.53 4.08 29.80 3.20 3.59 5.05 3.57 58.45Obs Max (μg/m3) 79.12 8.02 134.42 10.81 16.92 11.70 13.75 196.06Pred Max (μg/m3) 103.14 0.67 31.29 11.74 2.74 11.92 3.18 149.58Mean_Obs 39.10 3.84 18.06 4.74 1.34 0.73 3.23 82.04Mean_Pred 25.63 0.09 10.67 3.79 0.84 3.40 0.79 47.43Std_Dev_Obs 17.43 1.72 27.39 2.70 3.37 2.41 2.64 28.80Std_Dev_Pre 28.94 0.17 8.82 3.09 0.81 3.01 0.63 42.20Variance 704.09 16.68 887.81 10.22 12.91 25.47 12.75 3416.20R2 0.35 0.19 0.01 0.18 0.05 0.09 0.01 0.01BF 0.58 0.02 1.04 0.80 2.16 0.27 0.34 0.59N 24 24 24 24 24 24 24 24
Table C-5i. Model performance statistics for the Worst 20% Days at the Great Smokey Mountains Class I area. GRSM bextSO4 bextNO3 bextOC bextEC bextSOIL bextSS bextCM totalBEXTMFB (%) -63.76 -163.78 -1.34 -63.89 1.23 200.00 -100.86 -52.84MFE (%) 65.31 197.12 37.84 64.35 43.61 200.00 124.35 54.90Ap -0.31 -0.85 0.42 -0.25 0.74 -999.00 -0.83 -0.20NMB (%) -43.46 -97.29 -0.61 -46.94 5.71 -999.00 -80.08 -38.18NME (%) 44.65 97.64 39.61 47.41 43.59 -999.00 83.61 39.87MNB (%) -43.44 -99.12 13.10 -46.37 48.53 -999.00 -27.41 -37.69MNE (%) 45.09 99.12 44.16 46.84 80.70 -999.00 107.85 39.86MB (μg/m3) -73.15 -2.67 -0.11 -2.25 0.06 7.32 -1.63 -79.67MAGE (μg/m3) 75.14 2.68 7.46 2.28 0.42 7.32 1.70 83.20RMSE (μg/m3) 92.01 3.23 10.13 2.54 0.57 8.15 2.15 100.92Obs Max (μg/m3) 308.51 10.16 33.88 7.71 1.52 0.00 4.89 347.18Pred Max (μg/m3) 212.34 1.54 47.97 5.81 2.66 17.08 0.82 277.94Mean_Obs 168.29 2.75 18.83 4.80 0.97 0.00 2.03 208.67Mean_Pred 95.15 0.07 18.71 2.55 1.02 7.32 0.40 129.00Std_Dev_Obs 64.74 2.07 7.77 1.29 0.37 0.00 1.42 65.71Std_Dev_Pre 58.12 0.31 8.98 1.16 0.53 3.68 0.15 66.87Variance 8466.67 10.42 102.61 6.47 0.32 66.48 4.61 10185.05R2 0.33 0.56 0.06 0.27 0.04 -999.00 0.00 0.30BF 0.57 0.01 1.13 0.54 1.49 0.00 0.73 0.62N 24 24 24 24 24 24 24 24

C-28
Table C-5j. Model performance statistics for the Worst 20% Days at the Hercules Glade Class I area. HEGL bextSO4 bextNO3 bextOC bextEC bextSOIL bextSS bextCM totalBEXTMFB (%) -62.64 -64.72 -31.35 -67.72 88.94 192.00 -37.50 -27.40MFE (%) 73.75 95.79 40.17 67.72 93.38 192.00 51.55 43.36Ap -0.54 -0.19 -0.33 -0.31 0.80 -999.00 -0.58 -0.45NMB (%) -39.63 -21.48 -26.27 -48.11 176.06 -999.00 -36.57 -19.99NME (%) 52.05 55.67 35.45 48.11 190.77 -999.00 47.96 36.40MNB (%) -37.25 -18.60 -22.76 -48.54 330.59 -999.00 -23.65 -14.88MNE (%) 52.07 75.95 33.30 48.54 334.07 -999.00 40.40 34.41MB (μg/m3) -41.28 -3.14 -4.77 -2.39 1.84 28.38 -1.05 -31.35MAGE (μg/m3) 54.21 8.13 6.44 2.39 1.99 28.38 1.38 57.08RMSE (μg/m3) 82.66 16.53 8.68 2.63 2.53 30.85 1.93 90.89Obs Max (μg/m3) 339.47 99.26 42.42 9.36 4.42 0.00 8.18 377.55Pred Max (μg/m3) 155.36 80.27 28.32 6.45 7.97 47.45 3.41 207.61Mean_Obs 104.15 14.60 18.16 4.96 1.04 0.00 2.88 156.80Mean_Pred 62.87 11.47 13.39 2.57 2.88 28.38 1.83 125.46Std_Dev_Obs 61.34 27.70 8.58 1.45 0.82 0.00 1.57 52.29Std_Dev_Pre 49.77 22.81 6.10 1.33 1.52 12.33 0.63 59.02Variance 6832.22 273.09 75.41 6.90 6.43 951.43 3.74 8260.55R2 0.02 0.64 0.29 0.46 0.01 -999.00 0.00 0.05BF 0.63 0.81 0.77 0.51 4.31 0.00 0.76 0.85N 25 25 25 25 25 25 25 25
Table C-5k. Model performance statistics for the Worst 20% Days at the James Rover Face Class I area. JARI bextSO4 bextNO3 bextOC bextEC bextSOIL bextSS bextCM totalBEXTMFB (%) -44.05 -161.63 -45.20 -99.63 -17.57 200.00 -151.62 -46.37MFE (%) 55.27 173.62 50.38 99.63 35.59 200.00 151.62 52.93Ap -0.23 0.64 -0.74 -0.70 -0.76 -999.00 -0.96 -0.27NMB (%) -29.70 -72.08 -45.42 -66.94 -25.82 -999.00 -88.49 -33.54NME (%) 40.79 96.06 47.83 66.94 36.46 -999.00 88.49 39.47MNB (%) -27.68 -77.76 -32.72 -65.82 -5.07 -999.00 -85.78 -32.04MNE (%) 41.58 96.60 38.51 65.82 36.00 -999.00 85.78 39.68MB (μg/m3) -48.04 -3.12 -11.73 -4.71 -0.28 6.09 -2.62 -71.76MAGE (μg/m3) 65.98 4.16 12.36 4.71 0.39 6.09 2.62 84.45RMSE (μg/m3) 78.63 4.57 23.32 5.01 0.79 6.47 3.13 97.61Obs Max (μg/m3) 274.58 8.70 119.43 11.72 4.58 0.00 10.28 324.44Pred Max (μg/m3) 212.68 14.24 30.79 3.53 1.11 9.46 0.44 237.97Mean_Obs 161.76 4.33 25.83 7.03 1.07 0.00 2.96 213.98Mean_Pred 113.71 1.21 14.10 2.32 0.79 6.09 0.34 142.22Std_Dev_Obs 44.65 1.96 23.46 1.98 0.80 0.00 1.76 52.76Std_Dev_Pre 62.85 3.39 6.34 0.64 0.21 2.23 0.07 65.78Variance 6182.14 20.87 543.67 25.14 0.62 41.85 9.82 9528.45R2 0.11 0.08 0.31 0.22 0.13 -999.00 0.00 0.13BF 0.72 0.22 0.67 0.34 0.95 0.00 0.14 0.68N 24 24 24 24 24 24 24 24

C-29
Table C-5l. Model performance statistics for the Worst 20% Days at the Linville Gorge Class I area.
LIGO bextSO4 bextNO3 bextOC bextEC bextSOIL bextSS bextCM totalBEXTMFB (%) -62.93 -150.69 -30.70 -87.63 -18.24 196.89 -153.13 -57.00MFE (%) 67.74 159.27 40.91 87.63 31.41 196.89 153.13 60.02Ap -0.19 -0.02 0.15 -0.33 0.08 3.84 -0.82 -0.23NMB (%) -39.98 -71.27 -23.15 -59.18 -15.85 5689.19 -86.95 -38.66NME (%) 44.99 82.09 32.56 59.18 28.30 5689.19 86.95 41.53MNB (%) -41.43 -74.75 -21.29 -59.63 -11.88 384.10 -86.53 -39.51MNE (%) 46.79 85.40 33.45 59.63 27.35 384.10 86.53 42.81MB (μg/m3) -58.86 -1.63 -3.65 -2.69 -0.13 5.25 -2.09 -71.19MAGE (μg/m3) 66.23 1.88 5.14 2.69 0.23 5.25 2.09 76.47RMSE (μg/m3) 75.30 2.08 6.40 2.81 0.29 5.68 2.19 87.22Obs Max (μg/m3) 290.29 4.53 31.89 6.06 1.27 2.03 4.03 343.89Pred Max (μg/m3) 235.90 4.41 36.79 4.06 1.37 9.82 0.75 266.44Mean_Obs 147.22 2.29 15.77 4.55 0.81 0.09 2.40 184.14Mean_Pred 88.35 0.66 12.12 1.86 0.68 5.34 0.31 112.95Std_Dev_Obs 49.16 0.94 6.92 0.97 0.26 0.43 0.74 52.20Std_Dev_Pre 60.94 1.28 7.33 0.84 0.30 2.38 0.14 65.76Variance 5669.60 4.34 41.00 7.88 0.09 32.28 4.81 7607.62R2 0.41 0.10 0.51 0.36 0.29 0.18 0.29 0.41BF 0.59 0.25 0.79 0.40 0.88 0.22 0.13 0.60N 22 22 22 22 22 22 22 22
Table C-5m. Model performance statistics for the Worst 20% Days at the Mammoth Cave Class I area.
MACA bextSO4 bextNO3 bextOC bextEC bextSOIL bextSS bextCM totalBEXTMFB (%) -65.12 -134.11 -64.77 -68.22 37.17 183.33 73.57 -57.57MFE (%) 68.90 147.55 66.39 68.22 55.41 183.33 156.43 60.57Ap -0.38 -0.37 0.07 -0.25 -0.53 -999.00 -0.69 -0.39NMB (%) -46.69 -57.44 -44.40 -49.42 22.76 -999.00 -28.66 -42.27NME (%) 49.96 65.21 46.28 49.42 72.16 -999.00 117.76 44.92MNB (%) -41.05 -64.03 -45.70 -48.73 103.82 -999.00 23.87 -37.74MNE (%) 45.22 84.58 47.41 48.73 117.45 -999.00 124.55 41.05MB (μg/m3) -83.29 -5.79 -9.61 -2.75 0.29 13.40 -0.32 -96.83MAGE (μg/m3) 89.11 6.58 10.02 2.75 0.93 13.40 1.31 102.89RMSE (μg/m3) 120.48 10.17 11.30 3.15 1.58 15.17 1.60 136.14Obs Max (μg/m3) 347.31 107.80 40.53 9.05 8.22 0.00 4.63 405.74Pred Max (μg/m3) 216.80 68.26 43.56 6.76 3.90 25.46 1.41 246.32Mean_Obs 178.37 10.09 21.64 5.57 1.28 0.00 1.11 229.07Mean_Pred 95.08 4.29 12.03 2.82 1.58 13.40 0.79 132.24Std_Dev_Obs 68.00 21.11 7.98 1.75 1.55 0.00 1.56 65.54Std_Dev_Pre 56.54 13.85 8.66 1.42 0.69 7.28 0.27 65.53Variance 14514.27 103.51269 127.72 9.90 2.51 230.24 2.55 18532.89R2 0.00 0.93 0.54 0.29 0.03 -999.00 0.00 0.01BF 0.59 0.36 0.54 0.51 2.04 0.00 0.62 0.62N 24 24 24 24 24 24 24 24

C-30
Table C-5n. Model performance statistics for the Worst 20% Days at the Mingo Class I area. MING bextSO4 bextNO3 bextOC bextEC bextSOIL bextSS bextCM totalBEXTMFB (%) -20.59 -53.58 -22.20 -18.82 107.61 190.54 -13.23 20.38MFE (%) 66.65 111.83 49.34 43.70 113.87 190.54 37.67 54.93Ap -0.13 0.07 -0.22 -0.25 0.45 72.50 -0.38 0.46NMB (%) 4.74 30.45 -27.80 -22.91 206.49 87137.63 -21.72 40.81NME (%) 59.76 64.63 44.49 40.91 227.86 87137.63 36.98 65.30MNB (%) 6.00 58.25 5.73 1.02 587.75 13729.83 -3.73 47.74MNE (%) 65.16 150.88 56.28 48.24 592.40 13729.83 36.45 69.83MB (μg/m3) 5.35 6.29 -4.29 -1.12 2.99 69.04 -1.12 69.50MAGE (μg/m3) 67.43 13.36 6.87 2.00 3.30 69.04 1.91 111.22RMSE (μg/m3) 83.82 21.83 9.85 2.64 3.77 76.00 2.60 136.16Obs Max (μg/m3) 263.55 105.09 40.46 10.36 6.65 1.56 11.69 287.91Pred Max (μg/m3) 228.22 112.07 31.38 7.75 9.61 114.64 7.23 419.01Mean_Obs 112.84 20.67 15.43 4.89 1.45 0.08 5.15 170.33Mean_Pred 118.19 26.96 11.14 3.77 4.44 69.12 4.03 239.83Std_Dev_Obs 63.96 30.73 10.19 2.42 1.37 0.33 2.83 43.37Std_Dev_Pre 88.99 38.04 6.24 1.47 1.73 32.57 1.04 111.15Variance 7025.62 476.67 97.08 6.99 14.18 5776.49 6.75 18538.89R2 0.17 0.68 0.22 0.08 0.02 0.03 0.32 0.00BF 1.06 1.58 1.06 1.01 6.88 12.57 0.96 1.48N 22 22 20 20 22 22 22 22
Table C-5o. Model performance statistics for the Worst 20% Days at the Okefenokee Class I area.
OKEF bextSO4 bextNO3 bextOC bextEC bextSOIL bextSS bextCM totalBEXTMFB (%) -79.19 -151.20 -7.49 -66.68 18.36 193.37 -117.48 -60.64MFE (%) 79.72 153.54 42.51 78.30 75.40 193.37 121.37 60.64Ap -0.23 -0.62 -0.49 -0.21 0.42 5.42 -0.71 -0.10NMB (%) -49.55 -78.69 -18.89 -42.37 30.38 6970.71 -79.40 -43.75NME (%) 50.03 80.92 50.95 62.56 90.15 6970.71 80.10 43.75MNB (%) -52.76 -80.49 6.44 -39.32 296.99 62.41 -68.22 -42.38MNE (%) 53.31 83.19 39.20 60.73 338.55 62.41 72.60 42.38MB (μg/m3) -47.55 -4.38 -6.64 -3.20 0.24 4.11 -2.14 -69.45MAGE (μg/m3) 48.02 4.51 17.90 4.72 0.72 4.11 2.16 69.45RMSE (μg/m3) 57.10 5.46 37.27 7.22 0.93 4.49 2.47 88.19Obs Max (μg/m3) 271.57 15.83 156.35 29.54 1.57 1.36 4.79 341.01Pred Max (μg/m3) 208.50 6.03 80.47 23.21 2.23 8.70 1.41 308.25Mean_Obs 95.97 5.57 35.14 7.54 0.79 0.06 2.69 158.76Mean_Pred 48.41 1.19 28.50 4.35 1.04 4.17 0.55 89.30Std_Dev_Obs 57.98 3.49 32.48 6.19 0.45 0.28 1.33 60.33Std_Dev_Pre 44.25 1.86 19.09 5.04 0.59 1.75 0.33 57.69Variance 3260.75 29.83 1388.71 52.15 0.86 20.15 6.12 7777.06R2 0.69 0.12 0.00 0.10 0.30 0.06 0.09 0.31BF 0.47 0.20 1.06 0.61 3.97 0.07 0.32 0.58N 23 23 23 23 23 23 23 23
C-31
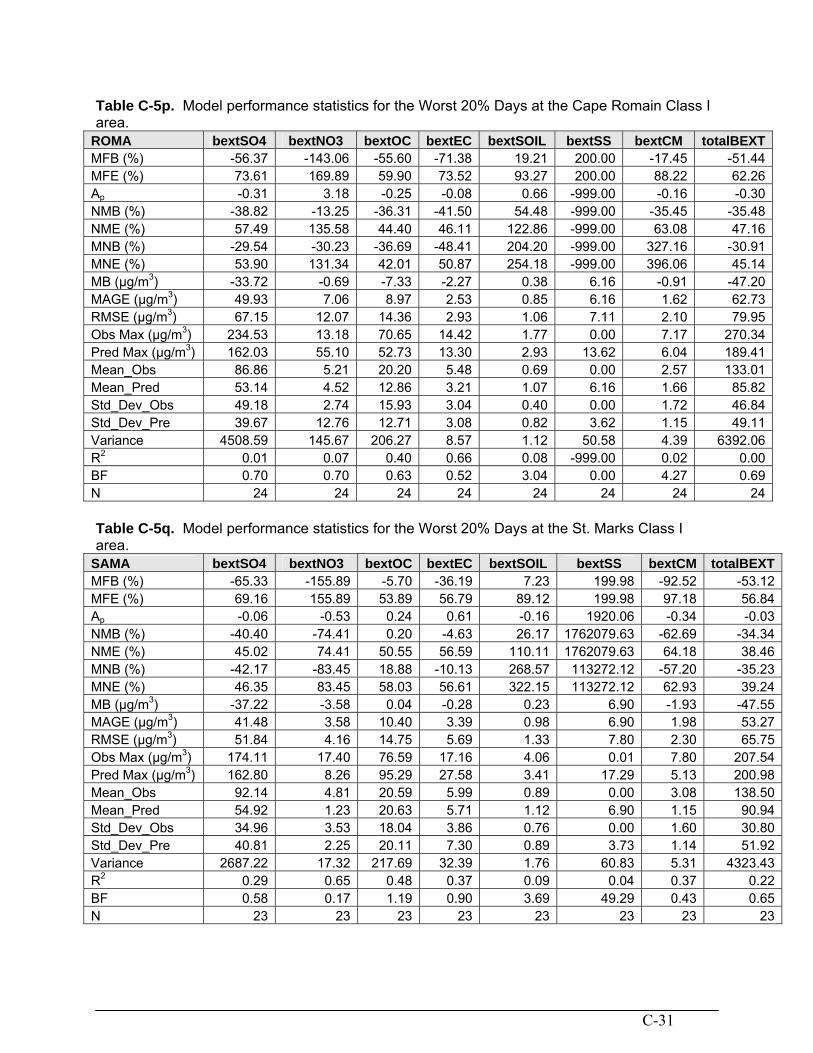
Table C-5p. Model performance statistics for the Worst 20% Days at the Cape Romain Class I area.
ROMA bextSO4 bextNO3 bextOC bextEC bextSOIL bextSS bextCM totalBEXTMFB (%) -56.37 -143.06 -55.60 -71.38 19.21 200.00 -17.45 -51.44MFE (%) 73.61 169.89 59.90 73.52 93.27 200.00 88.22 62.26Ap -0.31 3.18 -0.25 -0.08 0.66 -999.00 -0.16 -0.30NMB (%) -38.82 -13.25 -36.31 -41.50 54.48 -999.00 -35.45 -35.48NME (%) 57.49 135.58 44.40 46.11 122.86 -999.00 63.08 47.16MNB (%) -29.54 -30.23 -36.69 -48.41 204.20 -999.00 327.16 -30.91MNE (%) 53.90 131.34 42.01 50.87 254.18 -999.00 396.06 45.14MB (μg/m3) -33.72 -0.69 -7.33 -2.27 0.38 6.16 -0.91 -47.20MAGE (μg/m3) 49.93 7.06 8.97 2.53 0.85 6.16 1.62 62.73RMSE (μg/m3) 67.15 12.07 14.36 2.93 1.06 7.11 2.10 79.95Obs Max (μg/m3) 234.53 13.18 70.65 14.42 1.77 0.00 7.17 270.34Pred Max (μg/m3) 162.03 55.10 52.73 13.30 2.93 13.62 6.04 189.41Mean_Obs 86.86 5.21 20.20 5.48 0.69 0.00 2.57 133.01Mean_Pred 53.14 4.52 12.86 3.21 1.07 6.16 1.66 85.82Std_Dev_Obs 49.18 2.74 15.93 3.04 0.40 0.00 1.72 46.84Std_Dev_Pre 39.67 12.76 12.71 3.08 0.82 3.62 1.15 49.11Variance 4508.59 145.67 206.27 8.57 1.12 50.58 4.39 6392.06R2 0.01 0.07 0.40 0.66 0.08 -999.00 0.02 0.00BF 0.70 0.70 0.63 0.52 3.04 0.00 4.27 0.69N 24 24 24 24 24 24 24 24
Table C-5q. Model performance statistics for the Worst 20% Days at the St. Marks Class I area.
SAMA bextSO4 bextNO3 bextOC bextEC bextSOIL bextSS bextCM totalBEXTMFB (%) -65.33 -155.89 -5.70 -36.19 7.23 199.98 -92.52 -53.12MFE (%) 69.16 155.89 53.89 56.79 89.12 199.98 97.18 56.84Ap -0.06 -0.53 0.24 0.61 -0.16 1920.06 -0.34 -0.03NMB (%) -40.40 -74.41 0.20 -4.63 26.17 1762079.63 -62.69 -34.34NME (%) 45.02 74.41 50.55 56.59 110.11 1762079.63 64.18 38.46MNB (%) -42.17 -83.45 18.88 -10.13 268.57 113272.12 -57.20 -35.23MNE (%) 46.35 83.45 58.03 56.61 322.15 113272.12 62.93 39.24MB (μg/m3) -37.22 -3.58 0.04 -0.28 0.23 6.90 -1.93 -47.55MAGE (μg/m3) 41.48 3.58 10.40 3.39 0.98 6.90 1.98 53.27RMSE (μg/m3) 51.84 4.16 14.75 5.69 1.33 7.80 2.30 65.75Obs Max (μg/m3) 174.11 17.40 76.59 17.16 4.06 0.01 7.80 207.54Pred Max (μg/m3) 162.80 8.26 95.29 27.58 3.41 17.29 5.13 200.98Mean_Obs 92.14 4.81 20.59 5.99 0.89 0.00 3.08 138.50Mean_Pred 54.92 1.23 20.63 5.71 1.12 6.90 1.15 90.94Std_Dev_Obs 34.96 3.53 18.04 3.86 0.76 0.00 1.60 30.80Std_Dev_Pre 40.81 2.25 20.11 7.30 0.89 3.73 1.14 51.92Variance 2687.22 17.32 217.69 32.39 1.76 60.83 5.31 4323.43R2 0.29 0.65 0.48 0.37 0.09 0.04 0.37 0.22BF 0.58 0.17 1.19 0.90 3.69 49.29 0.43 0.65N 23 23 23 23 23 23 23 23

C-32
Table C-5r. Model performance statistics for the Worst 20% Days at the Shenandoah Class I area.
SHEN bextSO4 bextNO3 bextOC bextEC bextSOIL bextSS bextCM totalBEXTMFB (%) -76.03 12.44 -21.00 -77.27 13.36 175.00 -119.18 -69.71MFE (%) 84.20 97.89 50.51 78.63 50.24 175.00 119.18 77.03Ap -0.46 -0.13 -0.84 -0.60 -0.75 -999.00 -0.94 -0.36NMB (%) -49.46 51.63 -43.57 -57.04 -16.01 -999.00 -80.94 -44.97NME (%) 56.28 129.69 59.35 58.47 50.78 -999.00 80.94 51.51MNB (%) -45.12 149.15 -2.40 -52.83 59.10 -999.00 -72.31 -41.96MNE (%) 55.84 198.87 48.56 54.30 86.79 -999.00 72.31 50.86MB (μg/m3) -86.47 3.04 -8.89 -3.12 -0.18 8.24 -2.65 -99.38MAGE (μg/m3) 98.39 7.64 12.11 3.20 0.57 8.24 2.65 113.84RMSE (μg/m3) 117.52 10.84 31.39 4.09 1.17 9.41 3.88 135.13Obs Max (μg/m3) 354.08 32.37 150.90 15.51 6.59 0.00 15.30 375.09Pred Max (μg/m3) 192.70 28.15 24.29 6.22 1.63 16.00 0.91 240.70Mean_Obs 174.83 5.89 20.40 5.48 1.12 0.00 3.27 221.00Mean_Pred 88.37 8.93 11.51 2.35 0.94 8.24 0.62 121.62Std_Dev_Obs 74.90 6.47 29.56 2.49 1.30 0.00 2.91 66.32Std_Dev_Pre 63.95 8.06 6.22 1.10 0.33 4.63 0.18 79.02Variance 13811.26 117.59460 985.14 16.77 1.37 88.53 15.09 18260.59R2 0.10 0.00 0.01 0.00 0.23 -999.00 0.01 0.03BF 0.55 2.49 0.98 0.47 1.59 0.00 0.28 0.58N 24 24 24 24 24 24 24 24
Table C-5s. Model performance statistics for the Worst 20% Days at the Shining Rock Class I area.
SHRO bextSO4 bextNO3 bextOC bextEC bextSOIL bextSS bextCM totalBEXTMFB (%) -64.10 -187.59 -31.54 -28.66 -29.64 199.31 -132.94 -57.06MFE (%) 68.47 187.59 39.71 36.19 41.93 199.31 132.94 59.79Ap -0.55 -0.85 0.57 0.14 -0.39 151.98 -0.86 -0.52NMB (%) -44.23 -96.56 -20.83 -23.28 -29.58 50992.11 -83.16 -41.26NME (%) 48.75 96.56 33.83 31.40 38.94 50992.11 83.16 44.09MNB (%) -42.37 -96.50 -21.93 -21.05 -19.64 12340.48 -78.61 -39.81MNE (%) 47.60 96.50 33.53 29.33 33.81 12340.48 78.61 42.98MB (μg/m3) -71.73 -3.00 -3.26 -0.57 -0.31 5.56 -1.51 -80.99MAGE (μg/m3) 79.06 3.00 5.30 0.77 0.41 5.56 1.51 86.54RMSE (μg/m3) 106.33 3.22 6.88 0.95 0.57 5.84 1.73 114.15Obs Max (μg/m3) 475.66 6.49 23.94 3.86 2.55 0.06 3.68 518.88Pred Max (μg/m3) 214.07 0.96 37.53 4.41 1.56 8.90 0.50 250.07Mean_Obs 162.18 3.11 15.66 2.45 1.05 0.01 1.82 196.28Mean_Pred 90.45 0.11 12.40 1.88 0.74 5.57 0.31 115.28Std_Dev_Obs 77.95 1.22 4.55 0.73 0.51 0.02 0.88 80.56Std_Dev_Pre 56.81 0.21 7.07 0.80 0.28 1.82 0.08 61.81Variance 11306.41 10.38869 47.33 0.90 0.33 34.06 2.98 13029.82R2 0.11 0.03 0.26 0.24 0.11 0.09 0.21 0.13BF 0.58 0.03 0.78 0.79 0.80 24.88 0.21 0.60N 25 25 25 25 25 25 25 25

C-33
Table C-5t. Model performance statistics for the Worst 20% Days at the Sipsey Class I area. SIPS bextSO4 bextNO3 bextOC bextEC bextSOIL bextSS bextCM totalBEXTMFB (%) -70.46 -117.95 -10.05 -80.92 22.60 199.72 -129.72 -48.58MFE (%) 80.31 143.41 59.66 83.49 59.52 199.72 129.72 60.40Ap -0.26 -0.05 0.81 -0.45 0.37 919.30 -0.72 -0.12NMB (%) -39.82 -33.47 14.40 -55.11 43.23 738981.75 -79.24 -28.95NME (%) 49.60 93.13 62.85 57.44 76.60 738981.75 79.24 41.90MNB (%) -41.83 -47.12 12.97 -54.30 71.45 6291.68 -77.36 -29.54MNE (%) 53.89 95.39 63.20 57.30 99.81 6291.68 77.36 44.20MB (μg/m3) -51.76 -3.37 3.35 -3.26 0.43 11.39 -2.45 -53.35MAGE (μg/m3) 64.47 9.37 14.63 3.40 0.76 11.39 2.45 77.22RMSE (μg/m3) 76.05 17.21 18.18 3.72 0.99 13.95 2.68 90.66Obs Max (μg/m3) 279.55 63.69 41.03 11.07 2.28 0.03 5.08 325.68Pred Max (μg/m3) 208.05 60.69 74.21 6.10 3.12 31.20 1.41 286.87Mean_Obs 129.97 10.07 23.28 5.92 0.99 0.00 3.09 184.32Mean_Pred 78.21 6.70 26.63 2.66 1.42 11.39 0.64 130.96Std_Dev_Obs 65.73 16.76 8.98 1.85 0.45 0.01 1.08 62.72Std_Dev_Pre 64.39 15.57 20.92 1.40 0.82 8.24 0.33 87.85Variance 5783.50 296.22 330.57 13.84 0.98 194.58 7.16 8218.50R2 0.38 0.19 0.24 0.16 0.00 0.06 0.01 0.30BF 0.58 0.53 1.13 0.46 1.71 2.91 0.23 0.70N 22 22 22 22 22 22 22 22
Table C-5u. Model performance statistics for the Worst 20% Days at the Swanquarter Class I area.
SWAN bextSO4 bextNO3 bextOC bextEC bextSOIL bextSS bextCM totalBEXTMFB (%) -56.96 -122.20 -58.99 -76.45 31.37 187.73 -131.45 -49.02MFE (%) 81.41 156.01 58.99 79.31 74.32 194.88 131.45 62.35Ap 0.03 0.45 -0.79 0.21 1.01 6.38 -0.74 0.00NMB (%) -24.66 3.84 -52.47 -50.51 50.46 7507.01 -80.76 -31.38NME (%) 57.70 93.70 52.47 55.29 100.20 7623.59 80.76 46.10MNB (%) -28.04 -19.11 -41.81 -51.65 183.63 -58.29 -77.44 -29.30MNE (%) 59.96 125.41 41.81 55.08 214.89 58.29 77.44 45.20MB (μg/m3) -20.67 0.29 -12.17 -2.42 0.31 3.93 -2.95 -42.55MAGE (μg/m3) 48.38 6.98 12.17 2.65 0.62 3.99 2.95 62.51RMSE (μg/m3) 58.52 10.49 24.00 2.90 0.87 4.51 3.25 76.28Obs Max (μg/m3) 209.85 45.16 128.63 7.73 1.34 1.20 7.26 243.51Pred Max (μg/m3) 216.04 65.32 26.40 9.32 2.68 8.88 1.89 244.55Mean_Obs 83.84 7.44 23.19 4.79 0.62 0.05 3.65 135.60Mean_Pred 63.17 7.73 11.02 2.37 0.93 3.98 0.70 93.05Std_Dev_Obs 43.76 9.31 24.50 1.68 0.34 0.25 1.34 39.17Std_Dev_Pre 60.46 16.51 6.37 1.92 0.62 2.16 0.41 60.38Variance 3425.07 110.06 576.21 8.44 0.75 20.33 10.56 5818.45R2 0.21 0.63 0.38 0.35 0.19 0.12 0.00 0.04BF 0.72 0.81 0.58 0.48 2.84 0.02 0.23 0.71N 23 23 23 23 23 23 23 23
C-34
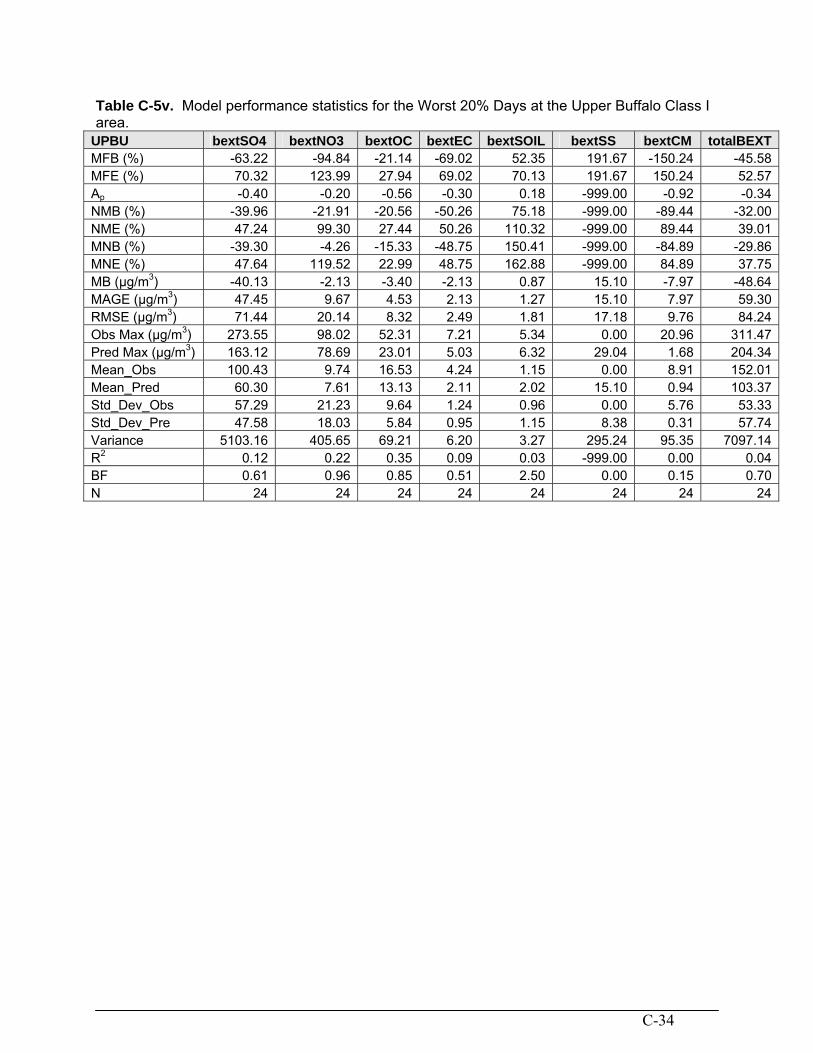
Table C-5v. Model performance statistics for the Worst 20% Days at the Upper Buffalo Class I area.
UPBU bextSO4 bextNO3 bextOC bextEC bextSOIL bextSS bextCM totalBEXTMFB (%) -63.22 -94.84 -21.14 -69.02 52.35 191.67 -150.24 -45.58MFE (%) 70.32 123.99 27.94 69.02 70.13 191.67 150.24 52.57Ap -0.40 -0.20 -0.56 -0.30 0.18 -999.00 -0.92 -0.34NMB (%) -39.96 -21.91 -20.56 -50.26 75.18 -999.00 -89.44 -32.00NME (%) 47.24 99.30 27.44 50.26 110.32 -999.00 89.44 39.01MNB (%) -39.30 -4.26 -15.33 -48.75 150.41 -999.00 -84.89 -29.86MNE (%) 47.64 119.52 22.99 48.75 162.88 -999.00 84.89 37.75MB (μg/m3) -40.13 -2.13 -3.40 -2.13 0.87 15.10 -7.97 -48.64MAGE (μg/m3) 47.45 9.67 4.53 2.13 1.27 15.10 7.97 59.30RMSE (μg/m3) 71.44 20.14 8.32 2.49 1.81 17.18 9.76 84.24Obs Max (μg/m3) 273.55 98.02 52.31 7.21 5.34 0.00 20.96 311.47Pred Max (μg/m3) 163.12 78.69 23.01 5.03 6.32 29.04 1.68 204.34Mean_Obs 100.43 9.74 16.53 4.24 1.15 0.00 8.91 152.01Mean_Pred 60.30 7.61 13.13 2.11 2.02 15.10 0.94 103.37Std_Dev_Obs 57.29 21.23 9.64 1.24 0.96 0.00 5.76 53.33Std_Dev_Pre 47.58 18.03 5.84 0.95 1.15 8.38 0.31 57.74Variance 5103.16 405.65 69.21 6.20 3.27 295.24 95.35 7097.14R2 0.12 0.22 0.35 0.09 0.03 -999.00 0.00 0.04BF 0.61 0.96 0.85 0.51 2.50 0.00 0.15 0.70N 24 24 24 24 24 24 24 24

C-35
C.2.3 Class I Area Model Performance Evaluation
Below we summarize the CMAQ 2002 Base G2 12 km Actual base case model performance at each of the Class I area within and nearby the VISTAS region for the best and worst 20% days and then for all days during 2002.
C.2.3.1 Sipsey Wilderness Area (SIPS), Alabama
C.2.3.1.1 SIPS Best 20 Percent Days
Figure C-3a. CMAQ 2002 Base G2 12 km Actual base case model performance for the Best 20 percent days at Sipsey (SIPS), Alabama for SO4 (top left), NO3 (top right), OMC (bottom left) and EC (bottom right).

C-36
Figure C-3b. CMAQ 2002 Base G2 12 km Actual base case model performance for the Best 20 percent days at Sipsey (SIPS), Alabama for Soil (top left), CM (top right), Sea Salt (bottom left) and Total Bext (bottom right).
C-37
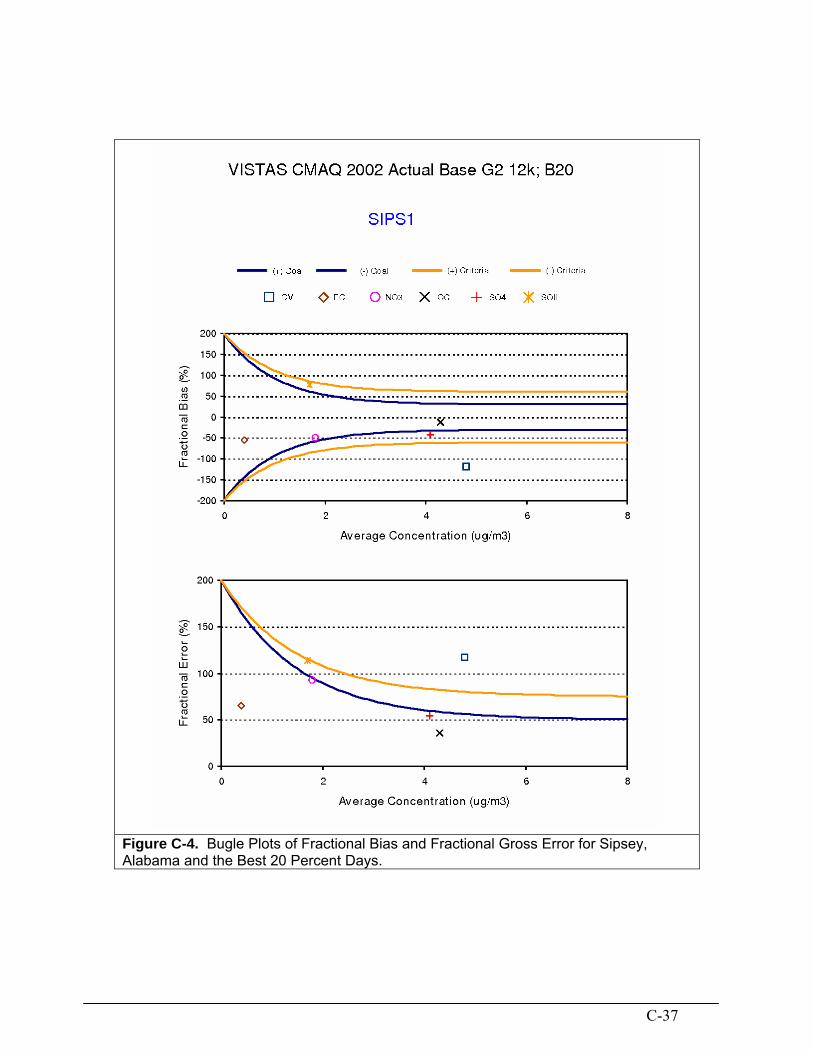
Figure C-4. Bugle Plots of Fractional Bias and Fractional Gross Error for Sipsey, Alabama and the Best 20 Percent Days.

C-38
2.3.1.2 SIPS Worst 20 Percent Days
Figure C-5a. CMAQ 2002 Base G2 12 km Actual base case model performance for the Worst 20 percent days at Sipsey (SIPS), Alabama for SO4 (top left), NO3 (top right), OMC (bottom left) and EC (bottom right).

C-39
Figure C-5b. CMAQ 2002 Base G2 12 km Actual base case model performance for the Worst 20 percent days at Sipsey (SIPS), Alabama for Soil (top left), CM (top right), Sea Salt (bottom left) and Total Bext (bottom right).

C-40
Figure C-6. Bugle Plots of Fractional Bias and Fractional Gross Error for Sipsey, Alabama and the Worst 20 Percent Days.

C-41
2.3.1.3 SIPS for All Days
Figure C-7. Time series of predicted and observed SO4, NO3, OMC, EC, Soil, CM, Sea Salt and PM2.5 mass across all monitoring days at Sipsey, Alabama for the CMAQ 2002 Base G2 12 km base case simulation.

C-42
Figure C-7. (concluded) Time series of predicted and observed SO4, NO3, OMC, EC, Soil, CM, Sea Salt and PM2.5 mass across all monitoring days at Sipsey, Alabama for the CMAQ 2002 Base G2 12 km base case simulation.
C-43
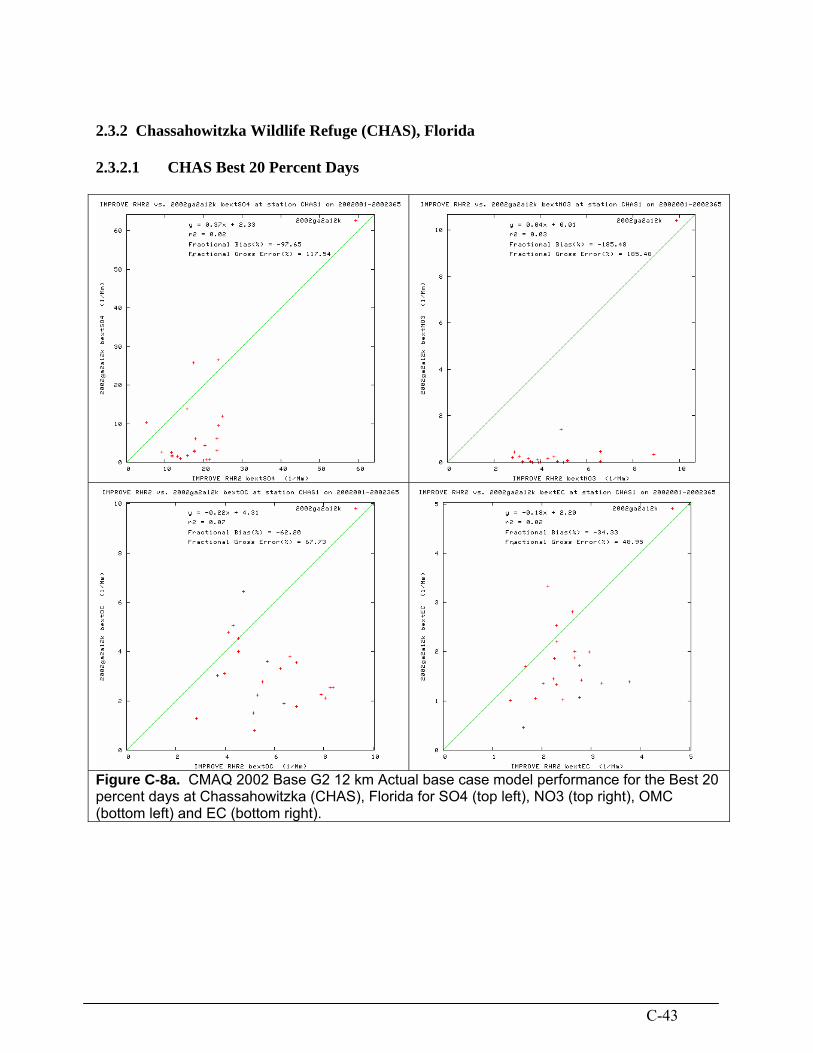
2.3.2 Chassahowitzka Wildlife Refuge (CHAS), Florida 2.3.2.1 CHAS Best 20 Percent Days
Figure C-8a. CMAQ 2002 Base G2 12 km Actual base case model performance for the Best 20 percent days at Chassahowitzka (CHAS), Florida for SO4 (top left), NO3 (top right), OMC (bottom left) and EC (bottom right).

C-44
Figure C-8b. CMAQ 2002 Base G2 12 km Actual base case model performance for the Best 20 percent days at Chassahowitzka (CHAS), Florida for Soil (top left), CM (top right), Sea Salt (bottom left) and Total Bext (bottom right).

C-45
Figure C-9. Bugle Plots of Fractional Bias and Fractional Gross Error for CHAS and the Best 20 Percent Days.

C-46
2.3.2.2 CHAS Worst 20 Percent Days
Figure C-10a. CMAQ 2002 Base G2 12 km Actual base case model performance for the Worst 20 percent days at Chassahowitzka (CHAS), Florida for SO4 (top left), NO3 (top right), OMC (bottom left) and EC (bottom right).

C-47
Figure C-10b. CMAQ 2002 Base G2 12 km Actual base case model performance for the Worst 20 percent days at Chassahowitzka (CHAS), Florida for Soil (top left), CM (top right), Sea Salt (bottom left) and Total Bext (bottom right).

C-48
Figure C-11. Bugle Plots of Fractional Bias and Fractional Gross Error for CHAS and the Worst 20 Percent Days.

C-49
2.3.2.3 CHAS for All Days
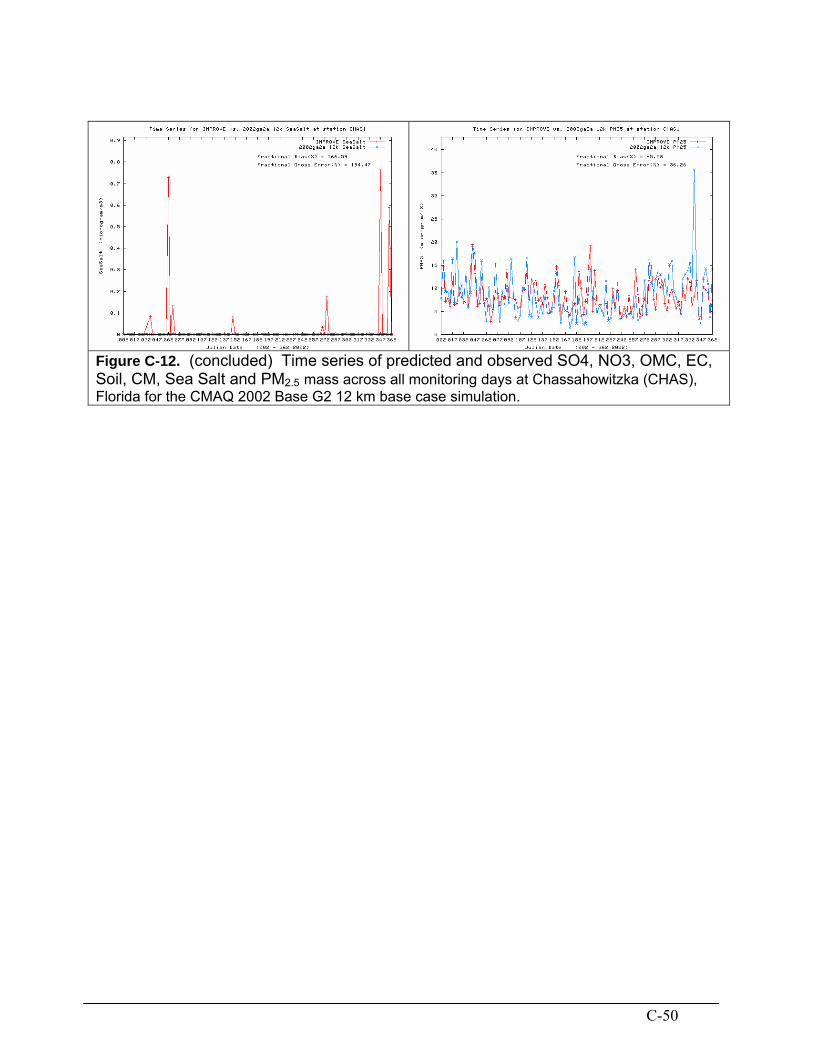
Figure C-12. Time series of predicted and observed SO4, NO3, OMC, EC, Soil, CM, Sea Salt and PM2.5 mass across all monitoring days at Chassahowitzka (CHAS), Florida for the CMAQ 2002 Base G2 12 km base case simulation.
C-50
Figure C-12. (concluded) Time series of predicted and observed SO4, NO3, OMC, EC, Soil, CM, Sea Salt and PM2.5 mass across all monitoring days at Chassahowitzka (CHAS), Florida for the CMAQ 2002 Base G2 12 km base case simulation.

C-51
2.3.3 Everglades National Park (EVER), Florida 2.3.3.1 EVER Best 20 Percent Days
Figure C-13a. CMAQ 2002 Base G2 12 km Actual base case model performance for the Best 20 percent days at Everglades (EVER), Florida for SO4 (top left), NO3 (top right), OMC (bottom left) and EC (bottom right).
C-52
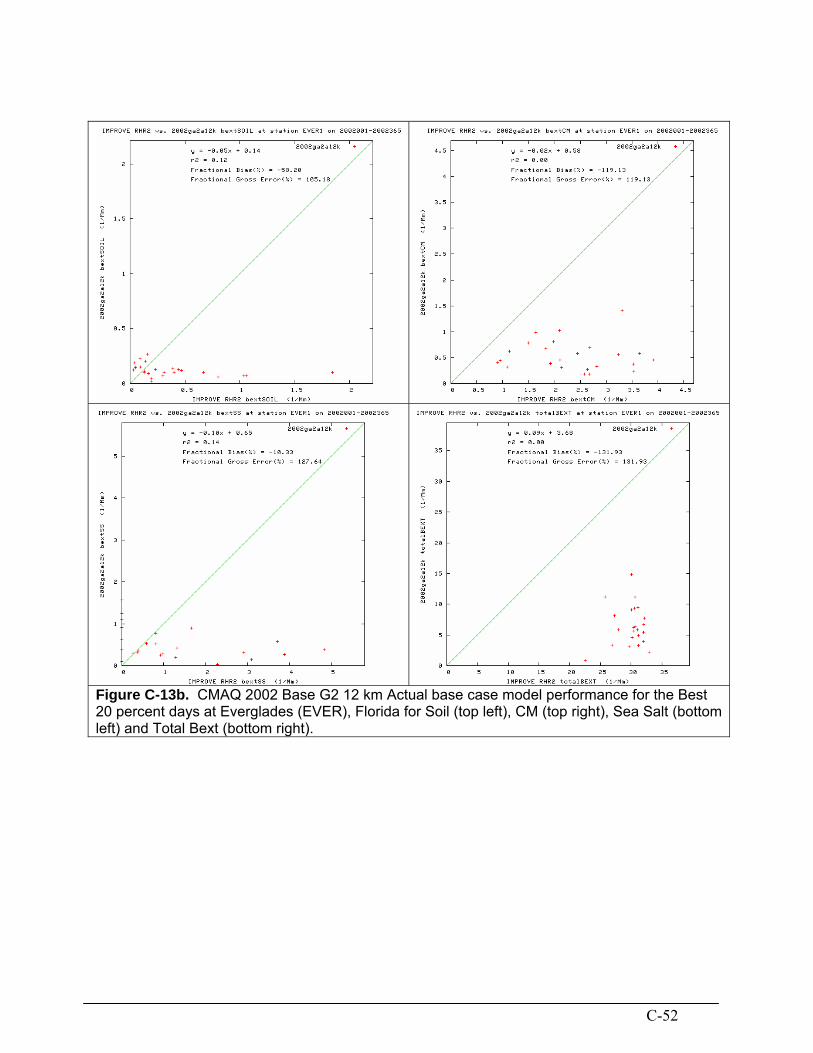
Figure C-13b. CMAQ 2002 Base G2 12 km Actual base case model performance for the Best 20 percent days at Everglades (EVER), Florida for Soil (top left), CM (top right), Sea Salt (bottom left) and Total Bext (bottom right).
C-53
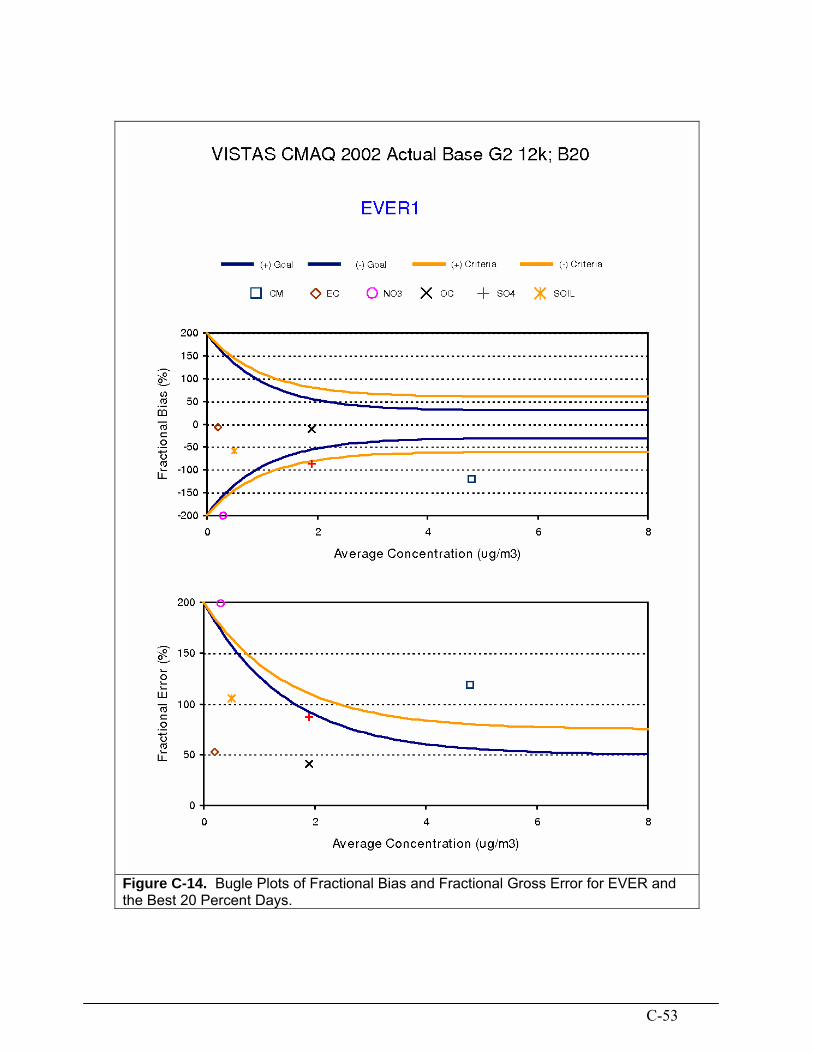
Figure C-14. Bugle Plots of Fractional Bias and Fractional Gross Error for EVER and the Best 20 Percent Days.

C-54
2.3.3.2 EVER Worst 20 Percent Days
Figure C-15a. CMAQ 2002 Base G2 12 km Actual base case model performance for the Worst 20 percent days at Everglades (EVER), Florida for SO4 (top left), NO3 (top right), OMC (bottom left) and EC (bottom right).
C-55
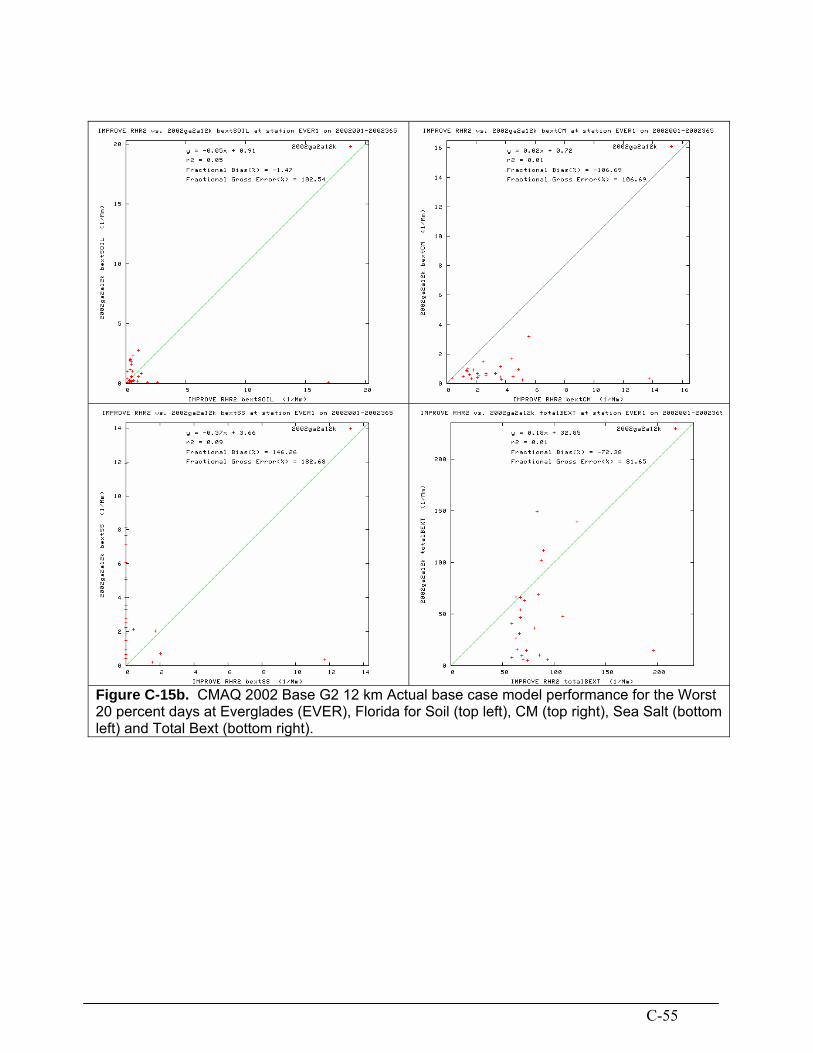
Figure C-15b. CMAQ 2002 Base G2 12 km Actual base case model performance for the Worst 20 percent days at Everglades (EVER), Florida for Soil (top left), CM (top right), Sea Salt (bottom left) and Total Bext (bottom right).

C-56
Figure C-16. Bugle Plots of Fractional Bias and Fractional Gross Error for EVER and the Worst 20 Percent Days.

C-57
2.3.3.3 EVER for All Days
Figure C-17. Time series of predicted and observed SO4, NO3, OMC, EC, Soil, CM, Sea Salt and PM2.5 mass across all monitoring days at Everglades (EVER), Florida for the CMAQ 2002 Base G2 12 km base case simulation.

C-58
Figure C-17. (concluded) Time series of predicted and observed SO4, NO3, OMC, EC, Soil, CM, Sea Salt and PM2.5 mass across all monitoring days at Everglades (EVER), Florida for the CMAQ 2002 Base G2 12 km base case simulation.

C-59
2.3.4 St. Marks Wildlife Refuge (SAMA), Florida 2.3.4.1 SAMA Best 20 Percent Days
Figure C-18a. CMAQ 2002 Base G2 12 km Actual base case model performance for the Best 20 percent days at St. Marks (SAMA), Florida for SO4 (top left), NO3 (top right), OMC (bottom left) and EC (bottom right).

C-60
Figure C-18b. CMAQ 2002 Base G2 12 km Actual base case model performance for the Best 20 percent days at St. Marks (SAMA), Florida for Soil (top left), CM (top right), Sea Salt (bottom left) and Total Bext (bottom right).

C-61
Figure C-19. Bugle Plots of Fractional Bias and Fractional Gross Error for SAMA and the Best 20 Percent Days.
C-62
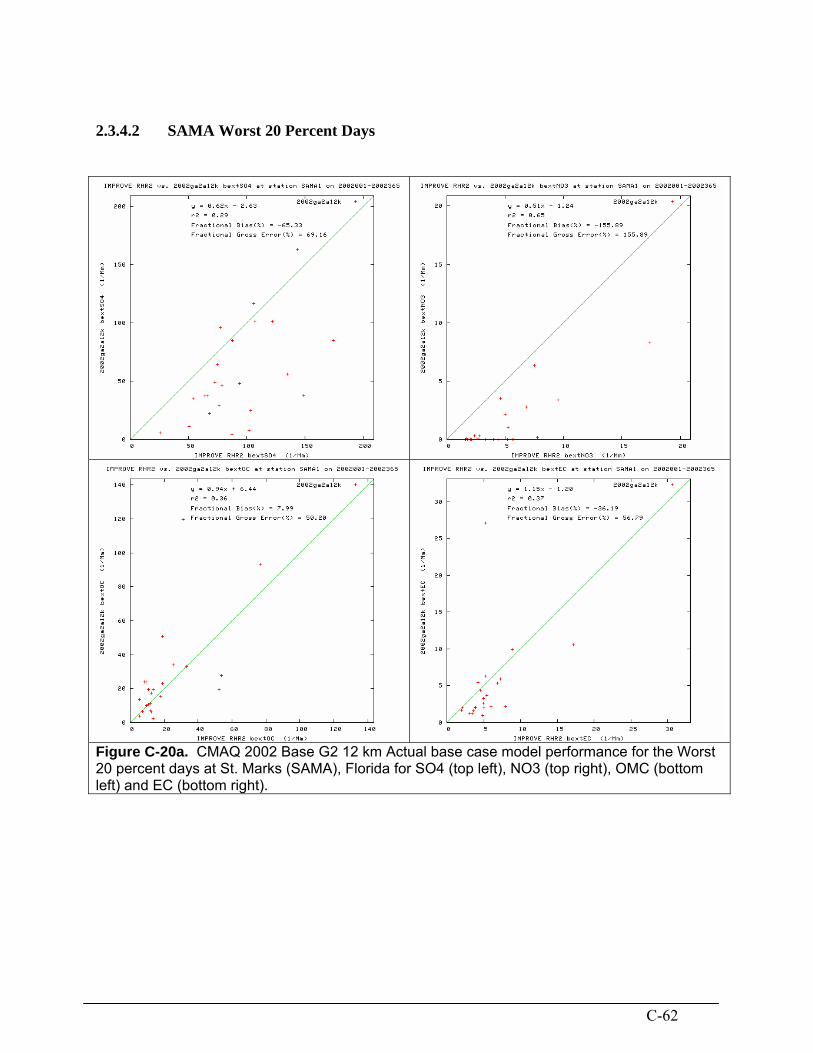
2.3.4.2 SAMA Worst 20 Percent Days
Figure C-20a. CMAQ 2002 Base G2 12 km Actual base case model performance for the Worst 20 percent days at St. Marks (SAMA), Florida for SO4 (top left), NO3 (top right), OMC (bottom left) and EC (bottom right).

C-63
Figure C-20b. CMAQ 2002 Base G2 12 km Actual base case model performance for the Worst 20 percent days at St. Marks (SAMA), Florida for Soil (top left), CM (top right), Sea Salt (bottom left) and Total Bext (bottom right).

C-64
Figure C-21. Bugle Plots of Fractional Bias and Fractional Gross Error for SAMA and the Worst 20 Percent Days.

C-65
2.3.4.3 SAMA for All Days
Figure C-22. Time series of predicted and observed SO4, NO3, OMC, EC, Soil, CM, Sea Salt and PM2.5 mass across all monitoring days at St. Marks (SAMA), Florida for the CMAQ 2002 Base G2 12 km base case simulation.

C-66
Figure C-22. (concluded) Time series of predicted and observed SO4, NO3, OMC, EC, Soil, CM, Sea Salt and PM2.5 mass across all monitoring days at St. Marks (SAMA), Florida for the CMAQ 2002 Base G2 12 km base case simulation.
C-67
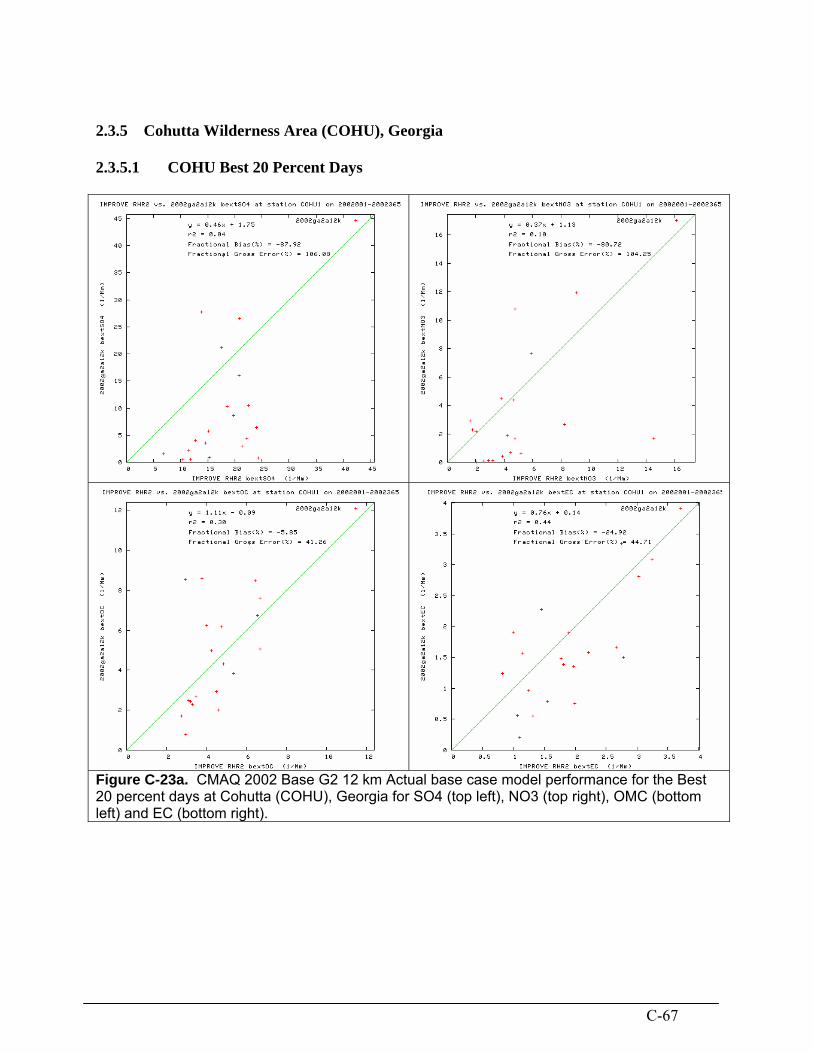
2.3.5 Cohutta Wilderness Area (COHU), Georgia 2.3.5.1 COHU Best 20 Percent Days
Figure C-23a. CMAQ 2002 Base G2 12 km Actual base case model performance for the Best 20 percent days at Cohutta (COHU), Georgia for SO4 (top left), NO3 (top right), OMC (bottom left) and EC (bottom right).

C-68
Figure C-23b. CMAQ 2002 Base G2 12 km Actual base case model performance for the Best 20 percent days at Cohutta (COHU), Georgia for Soil (top left), CM (top right), Sea Salt (bottom left) and Total Bext (bottom right).

C-69
Figure C-24. Bugle Plots of Fractional Bias and Fractional Gross Error for COHU and the Best 20 Percent Days.
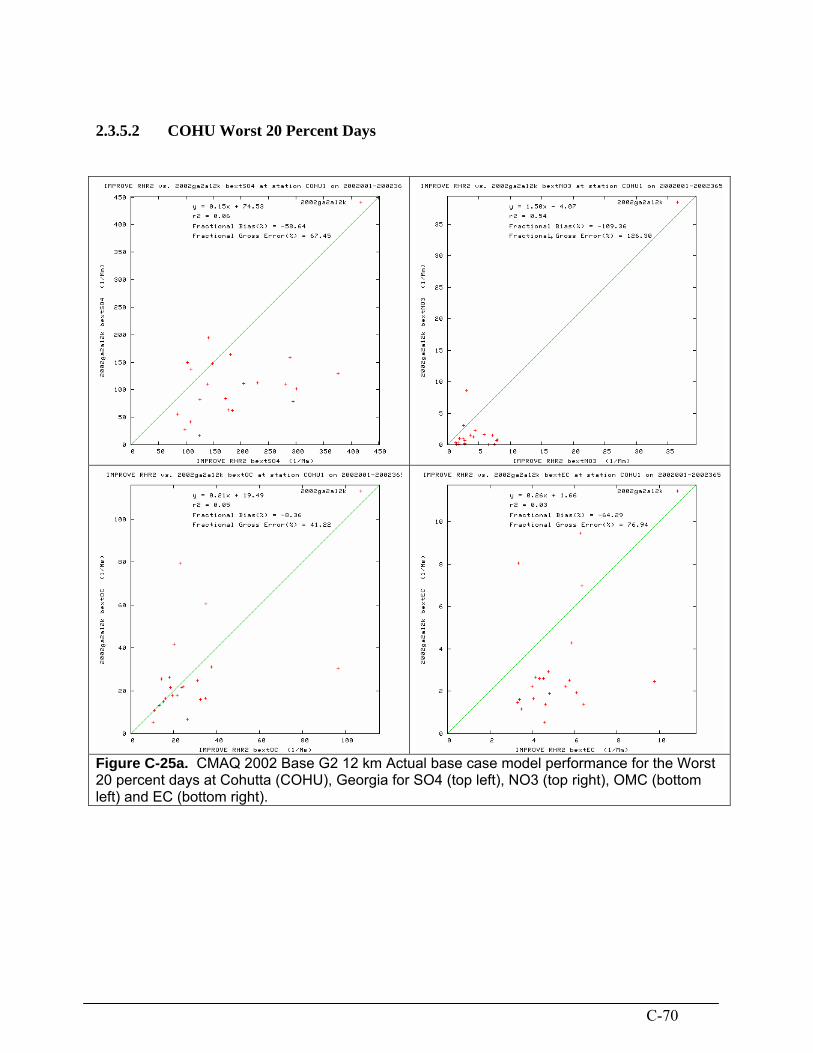
C-70
2.3.5.2 COHU Worst 20 Percent Days
Figure C-25a. CMAQ 2002 Base G2 12 km Actual base case model performance for the Worst 20 percent days at Cohutta (COHU), Georgia for SO4 (top left), NO3 (top right), OMC (bottom left) and EC (bottom right).

C-71
Figure C-25b. CMAQ 2002 Base G2 12 km Actual base case model performance for the Worst 20 percent days at Cohutta (COHU), Georgia for Soil (top left), CM (top right), Sea Salt (bottom left) and Total Bext (bottom right).

C-72
Figure C-26. Bugle Plots of Fractional Bias and Fractional Gross Error for COHU and the Worst 20 Percent Days.

C-73
2.3.5.3 COHU for All Days
Figure C-27. Time series of predicted and observed SO4, NO3, OMC, EC, Soil, CM, Sea Salt and PM2.5 mass across all monitoring days at Cohutta (COHU), Georgia for the CMAQ 2002 Base G2 12 km base case simulation.

C-74
Figure C-27. (concluded) Time series of predicted and observed SO4, NO3, OMC, EC, Soil, CM, Sea Salt and PM2.5 mass across all monitoring days at Cohutta (COHU), Georgia for the CMAQ 2002 Base G2 12 km base case simulation.
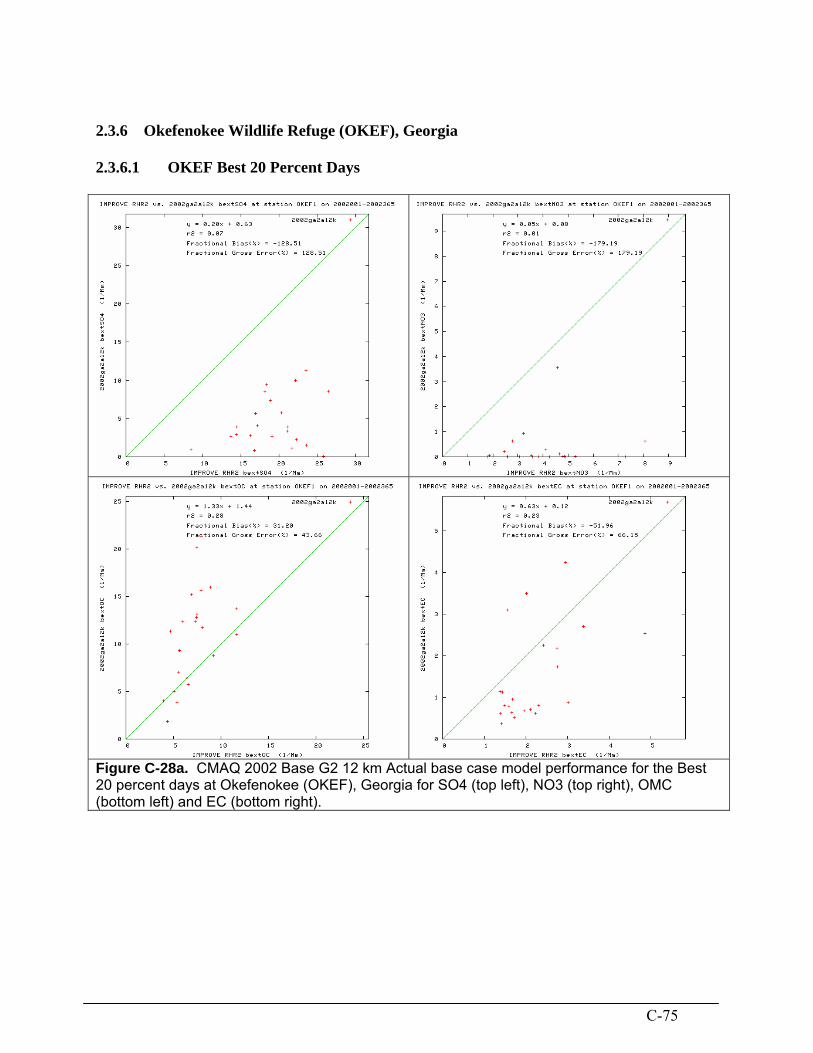
C-75
2.3.6 Okefenokee Wildlife Refuge (OKEF), Georgia 2.3.6.1 OKEF Best 20 Percent Days
Figure C-28a. CMAQ 2002 Base G2 12 km Actual base case model performance for the Best 20 percent days at Okefenokee (OKEF), Georgia for SO4 (top left), NO3 (top right), OMC (bottom left) and EC (bottom right).

C-76
Figure C-28b. CMAQ 2002 Base G2 12 km Actual base case model performance for the Best 20 percent days at Okefenokee (OKEF), Georgia for Soil (top left), CM (top right), Sea Salt (bottom left) and Total Bext (bottom right).

C-77
Figure C-29. Bugle Plots of Fractional Bias and Fractional Gross Error for OKEF and the Best 20 Percent Days.

C-78
2.3.6.2 OKEF Worst 20 Percent Days
Figure C-30a. CMAQ 2002 Base G2 12 km Actual base case model performance for the Worst 20 percent days at Okefenokee (OKEF), Georgia for SO4 (top left), NO3 (top right), OMC (bottom left) and EC (bottom right).

C-79
Figure C-30b. CMAQ 2002 Base G2 12 km Actual base case model performance for the Worst 20 percent days at Okefenokee (OKEF), Georgia for Soil (top left), CM (top right), Sea Salt (bottom left) and Total Bext (bottom right).

C-80
Figure C-31. Bugle Plots of Fractional Bias and Fractional Gross Error for OKEF and the Worst 20 Percent Days.

C-81
2.3.6.3 OKEF for All Days
Figure C-32. (concluded) Time series of predicted and observed SO4, NO3, OMC, EC, Soil, CM, Sea Salt and PM2.5 mass across all monitoring days at Okefenokee (OKEF), Georgia for the CMAQ 2002 Base G2 12 km base case simulation

C-82
Figure C-32. Time series of predicted and observed SO4, NO3, OMC, EC, Soil, CM, Sea Salt and PM2.5 mass across all monitoring days at Okefenokee (OKEF), Georgia for the CMAQ 2002 Base G2 12 km base case simulation.

C-83
2.3.7 Mammoth Cave National Park (MACA), Kentucky 2.3.7.1 MACA Best 20 Percent Days
Figure C-33a. CMAQ 2002 Base G2 12 km Actual base case model performance for the Best 20 percent days at Mammoth Cave (MACA), Kentucky for SO4 (top left), NO3 (top right), OMC (bottom left) and EC (bottom right).

C-84
Figure C-33b. CMAQ 2002 Base G2 12 km Actual base case model performance for the Best 20 percent days at Mammoth Cave (MACA), Kentucky for Soil (top left), CM (top right), Sea Salt (bottom left) and Total Bext (bottom right).

C-85
Figure C-34. Bugle Plots of Fractional Bias and Fractional Gross Error for MACA and the Best 20 Percent Days.

C-86
2.3.7.2 MACA Worst 20 Percent Days
Figure C-35a. CMAQ 2002 Base G2 12 km Actual base case model performance for the Worst 20 percent days at Mammoth Cave (MACA), Kentucky for SO4 (top left), NO3 (top right), OMC (bottom left) and EC (bottom right).

C-87
Figure C-35b. CMAQ 2002 Base G2 12 km Actual base case model performance for the Worst 20 percent days at Mammoth Cave (MACA), Kentucky for Soil (top left), CM (top right), Sea Salt (bottom left) and Total Bext (bottom right).

C-88
Figure C-36. Bugle Plots of Fractional Bias and Fractional Gross Error for MACA and the Worst 20 Percent Days.

C-89
2.3.7.3 MACA for All Days
Figure C-37. Time series of predicted and observed SO4, NO3, OMC, EC, Soil, CM, Sea Salt and PM2.5 mass across all monitoring days at Mammoth Cave (MACA), Kentucky for the CMAQ 2002 Base G2 12 km base case simulation.
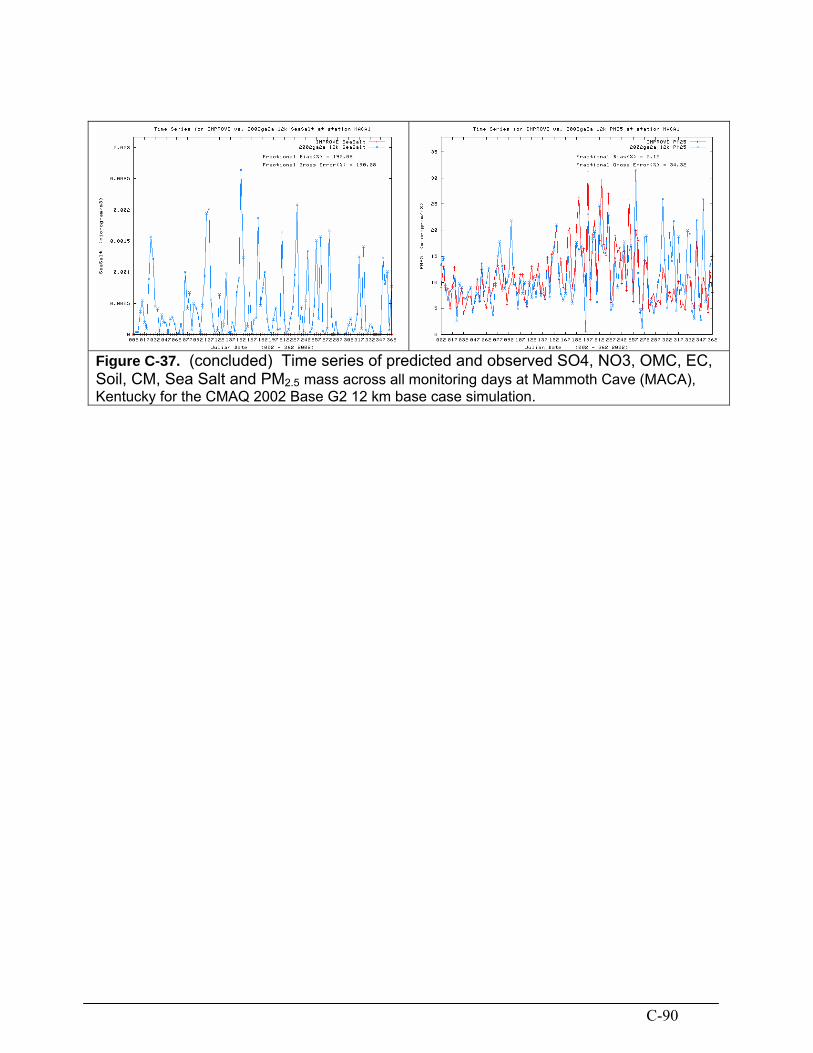
C-90
Figure C-37. (concluded) Time series of predicted and observed SO4, NO3, OMC, EC, Soil, CM, Sea Salt and PM2.5 mass across all monitoring days at Mammoth Cave (MACA), Kentucky for the CMAQ 2002 Base G2 12 km base case simulation.
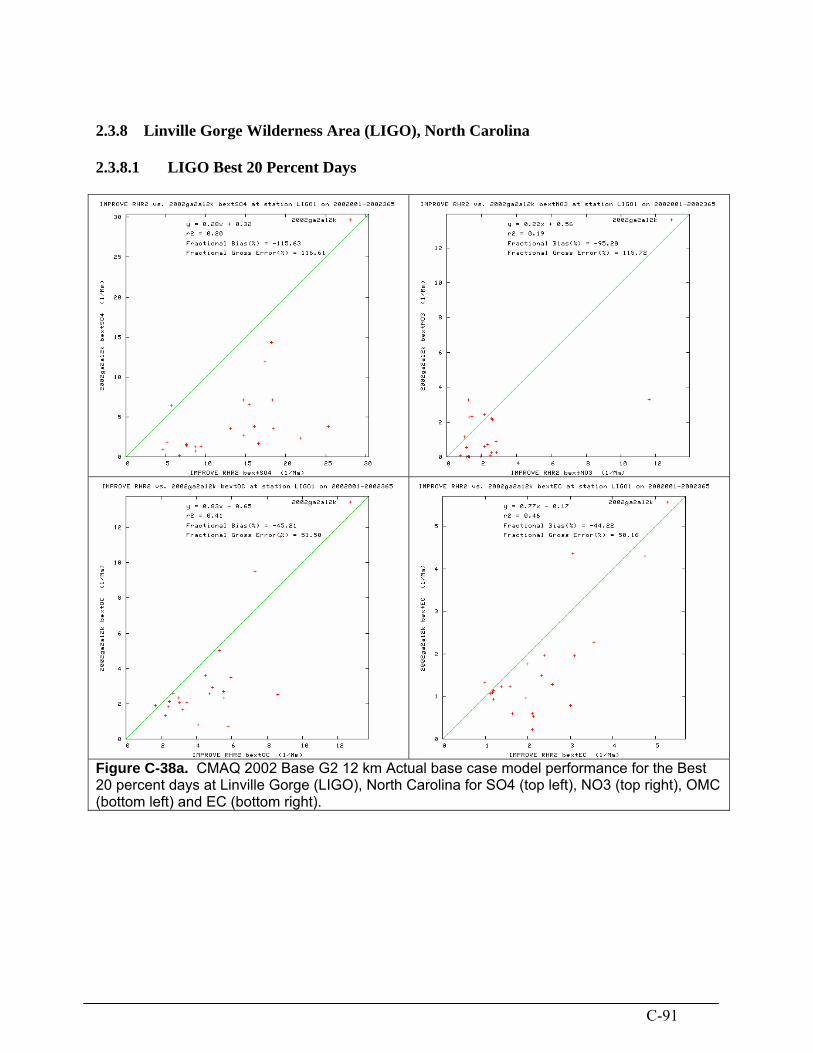
C-91
2.3.8 Linville Gorge Wilderness Area (LIGO), North Carolina 2.3.8.1 LIGO Best 20 Percent Days
Figure C-38a. CMAQ 2002 Base G2 12 km Actual base case model performance for the Best 20 percent days at Linville Gorge (LIGO), North Carolina for SO4 (top left), NO3 (top right), OMC (bottom left) and EC (bottom right).

C-92
Figure C-38b. CMAQ 2002 Base G2 12 km Actual base case model performance for the Best 20 percent days at Linville Gorge (LIGO), North Carolina for Soil (top left), CM (top right), Sea Salt (bottom left) and Total Bext (bottom right).

C-93
Figure C-39. Bugle Plots of Fractional Bias and Fractional Gross Error for LIGO and the Best 20 Percent Days.
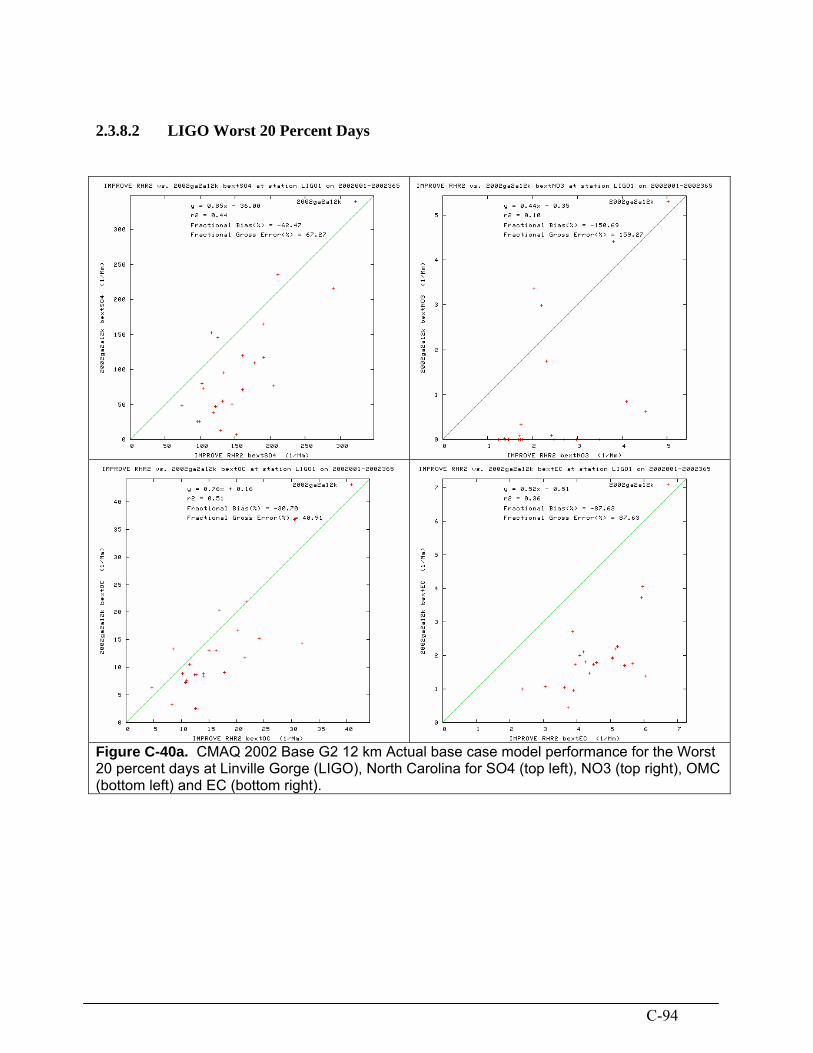
C-94
2.3.8.2 LIGO Worst 20 Percent Days
Figure C-40a. CMAQ 2002 Base G2 12 km Actual base case model performance for the Worst 20 percent days at Linville Gorge (LIGO), North Carolina for SO4 (top left), NO3 (top right), OMC (bottom left) and EC (bottom right).

C-95
Figure C-40b. CMAQ 2002 Base G2 12 km Actual base case model performance for the Worst 20 percent days at Linville Gorge (LIGO), North Carolina for Soil (top left), CM (top right), Sea Salt (bottom left) and Total Bext (bottom right).
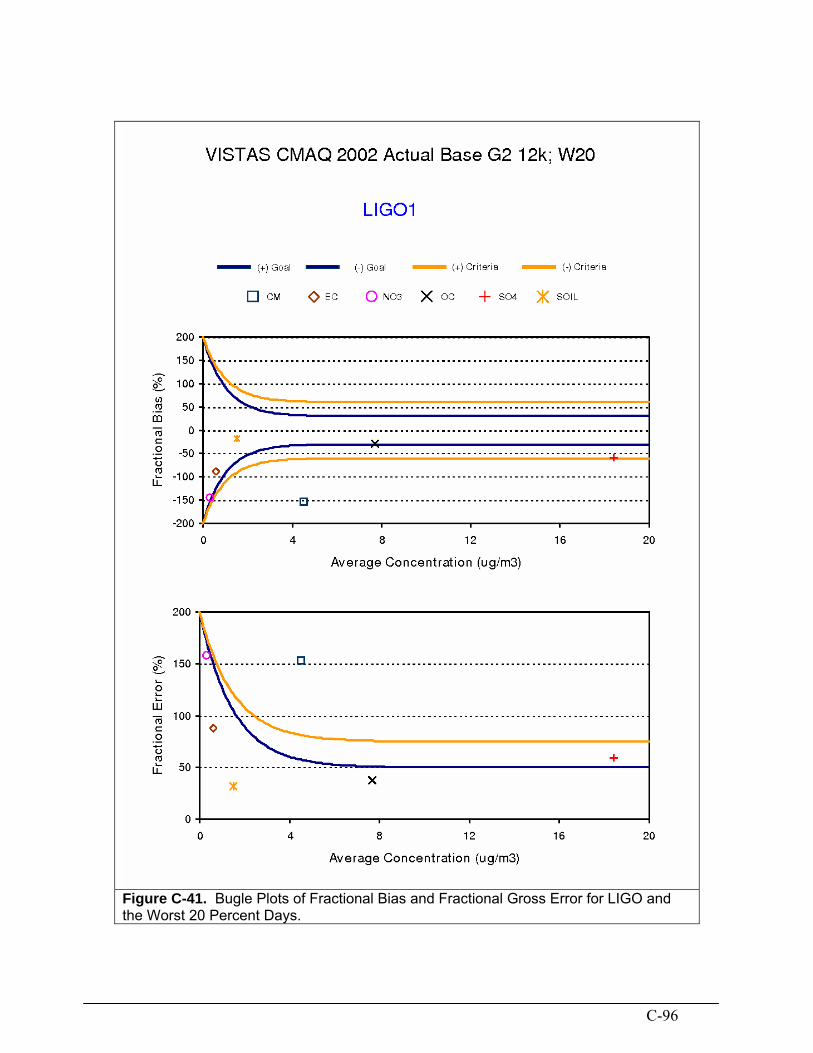
C-96
Figure C-41. Bugle Plots of Fractional Bias and Fractional Gross Error for LIGO and the Worst 20 Percent Days.
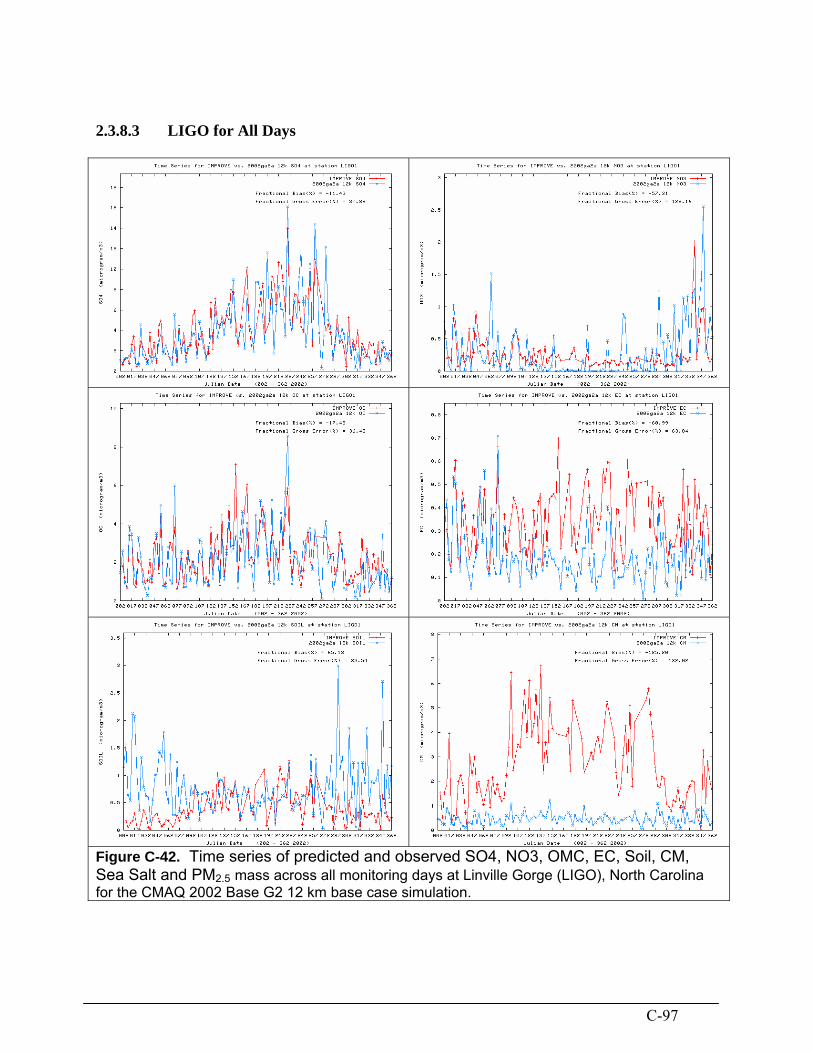
C-97
2.3.8.3 LIGO for All Days
Figure C-42. Time series of predicted and observed SO4, NO3, OMC, EC, Soil, CM, Sea Salt and PM2.5 mass across all monitoring days at Linville Gorge (LIGO), North Carolina for the CMAQ 2002 Base G2 12 km base case simulation.

C-98
Figure C-42. (concluded) Time series of predicted and observed SO4, NO3, OMC, EC, Soil, CM, Sea Salt and PM2.5 mass across all monitoring days at Linville Gorge (LIGO), North Carolina for the CMAQ 2002 Base G2 12 km base case simulation.

C-99
2.3.9 Shining Rock Wilderness Area (SHRO), North Carolina 2.3.9.1 SHRO Best 20 Percent Days
Figure C-43a. CMAQ 2002 Base G2 12 km Actual base case model performance for the Best 20 percent days at Shining Rock (SHRO), North Carolina for SO4 (top left), NO3 (top right), OMC (bottom left) and EC (bottom right).
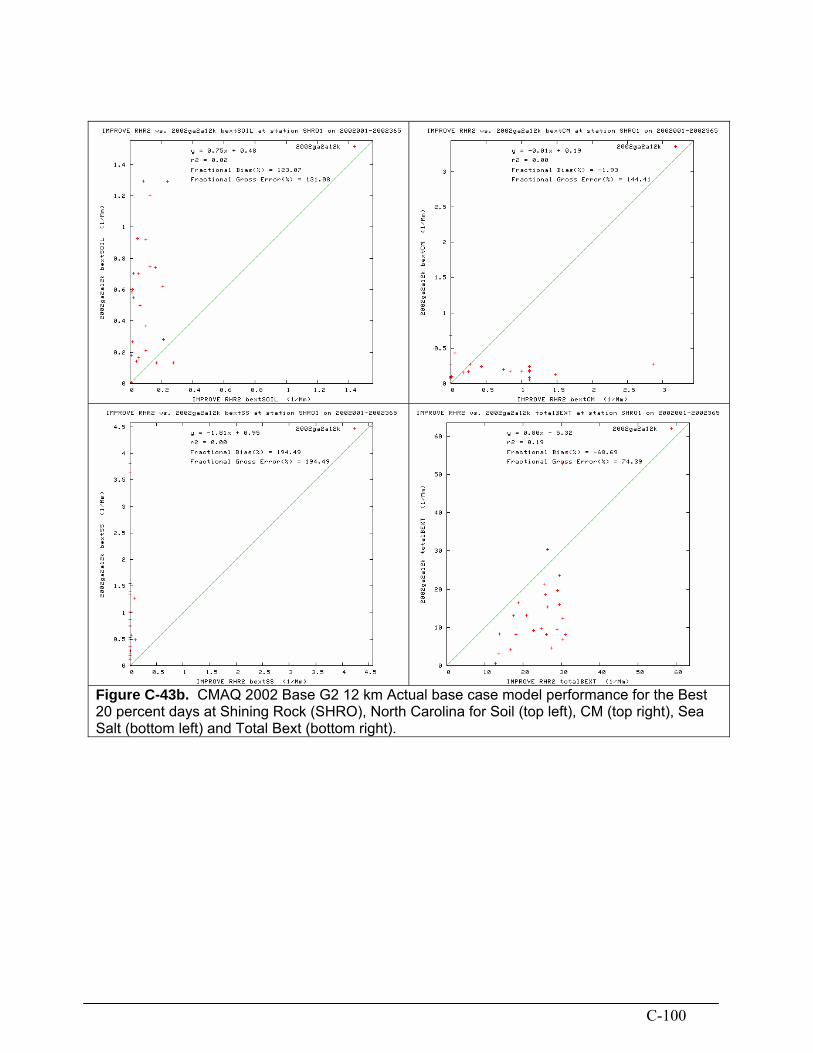
C-100
Figure C-43b. CMAQ 2002 Base G2 12 km Actual base case model performance for the Best 20 percent days at Shining Rock (SHRO), North Carolina for Soil (top left), CM (top right), Sea Salt (bottom left) and Total Bext (bottom right).

C-101
Figure C-44. Bugle Plots of Fractional Bias and Fractional Gross Error for SHRO and the Best 20 Percent Days.

C-102
2.3.9.2 SHRO Worst 20 Percent Days
Figure C-45a. CMAQ 2002 Base G2 12 km Actual base case model performance for the Worst 20 percent days at Shining Rock (SHRO), North Carolina for SO4 (top left), NO3 (top right), OMC (bottom left) and EC (bottom right).

C-103
Figure C-45b. CMAQ 2002 Base G2 12 km Actual base case model performance for the Worst 20 percent days at Shining Rock (SHRO), North Carolina for Soil (top left), CM (top right), Sea Salt (bottom left) and Total Bext (bottom right).

C-104
Figure C-46. Bugle Plots of Fractional Bias and Fractional Gross Error for SHRO and the Worst 20 Percent Days.
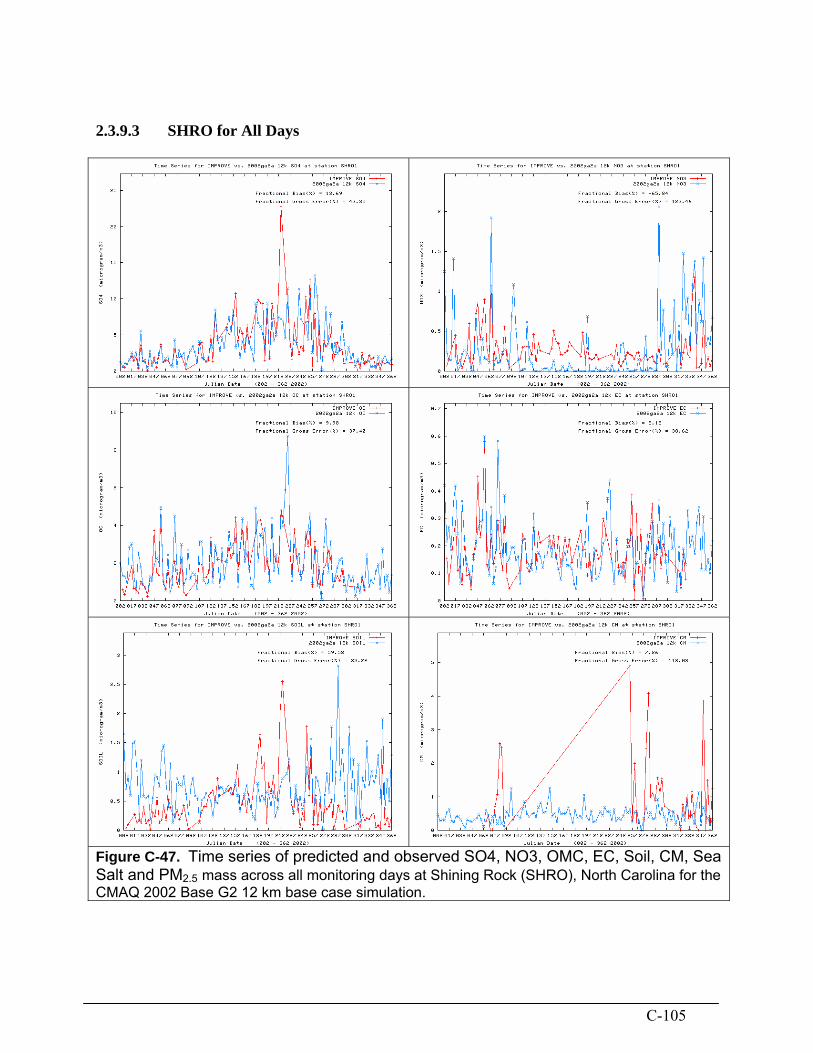
C-105
2.3.9.3 SHRO for All Days
Figure C-47. Time series of predicted and observed SO4, NO3, OMC, EC, Soil, CM, Sea Salt and PM2.5 mass across all monitoring days at Shining Rock (SHRO), North Carolina for the CMAQ 2002 Base G2 12 km base case simulation.
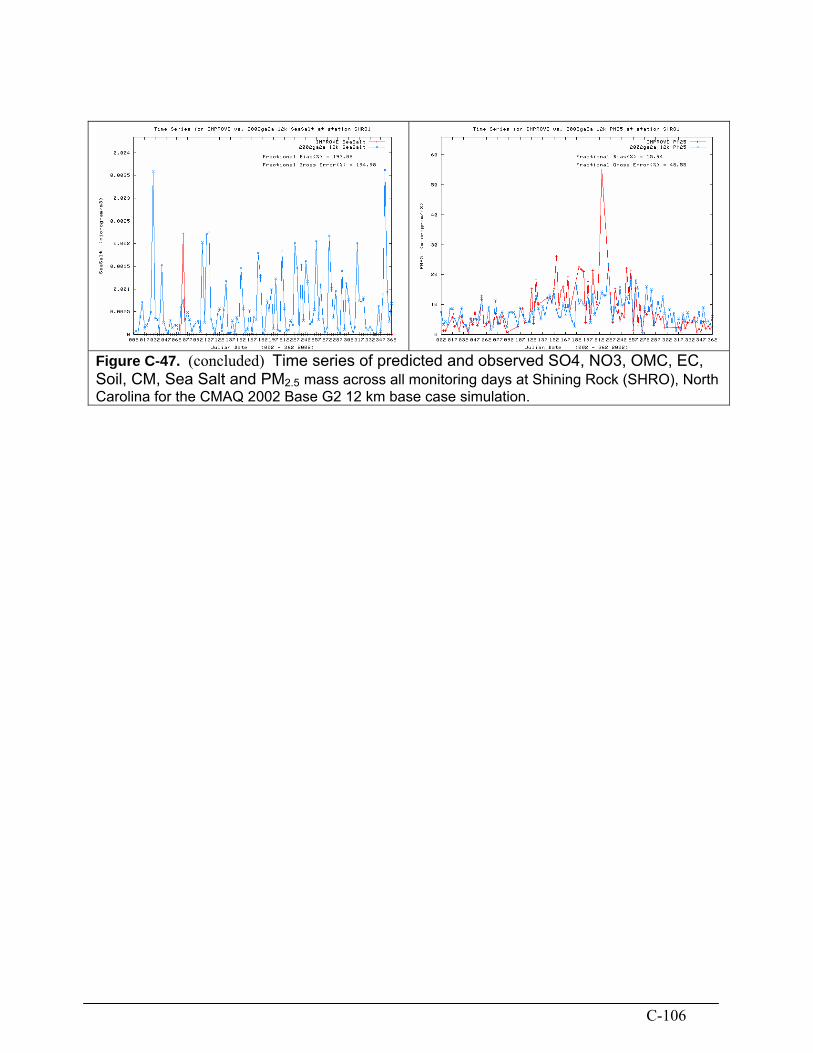
C-106
Figure C-47. (concluded) Time series of predicted and observed SO4, NO3, OMC, EC, Soil, CM, Sea Salt and PM2.5 mass across all monitoring days at Shining Rock (SHRO), North Carolina for the CMAQ 2002 Base G2 12 km base case simulation.

C-107
2.3.10 Swanquarter Wildlife Refuge (SWAN), North Carolina 2.3.10.1 SWAN Best 20 Percent Days
Figure C-48a. CMAQ 2002 Base G2 12 km Actual base case model performance for the Best 20 percent days at Swanquarter (SWAN), North Carolina for SO4 (top left), NO3 (top right), OMC (bottom left) and EC (bottom right).

C-108
Figure C-48b. CMAQ 2002 Base G2 12 km Actual base case model performance for the Best 20 percent days at Swanquarter (SWAN), North Carolina for Soil (top left), CM (top right), Sea Salt (bottom left) and Total Bext (bottom right).

C-109
Figure C-49. Bugle Plots of Fractional Bias and Fractional Gross Error for SWAN and the Best 20 Percent Days.

C-110
2.3.10.2 SWAN Worst 20 Percent Days
Figure C-50a. CMAQ 2002 Base G2 12 km Actual base case model performance for the Worst 20 percent days at Swanquarter (SWAN), North Carolina for SO4 (top left), NO3 (top right), OMC (bottom left) and EC (bottom right).

C-111
Figure C-50b. CMAQ 2002 Base G2 12 km Actual base case model performance for the Worst 20 percent days at Swanquarter (SWAN), North Carolina for Soil (top left), CM (top right), Sea Salt (bottom left) and Total Bext (bottom right).

C-112
Figure C-51. Bugle Plots of Fractional Bias and Fractional Gross Error for SWAN and the Worst 20 Percent Days.

C-113
2.3.10.3 SWAN for All Days
Figure C-52. Time series of predicted and observed SO4, NO3, OMC, EC, Soil, CM, Sea Salt and PM2.5 mass across all monitoring days at Swanquarter (SWAN), North Carolina for the CMAQ 2002 Base G2 12 km base case simulation.

C-114
Figure C-52. (concluded) Time series of predicted and observed SO4, NO3, OMC, EC, Soil, CM, Sea Salt and PM2.5 mass across all monitoring days at Swanquarter (SWAN), North Carolina for the CMAQ 2002 Base G2 12 km base case simulation.
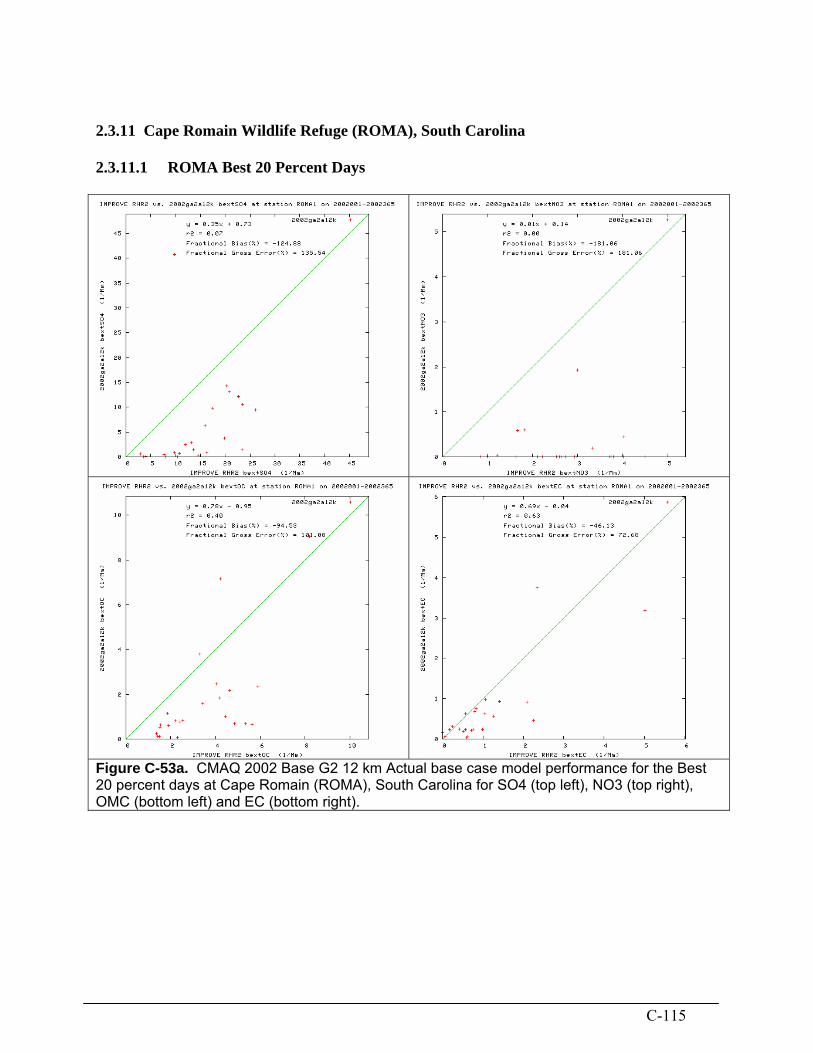
C-115
2.3.11 Cape Romain Wildlife Refuge (ROMA), South Carolina 2.3.11.1 ROMA Best 20 Percent Days
Figure C-53a. CMAQ 2002 Base G2 12 km Actual base case model performance for the Best 20 percent days at Cape Romain (ROMA), South Carolina for SO4 (top left), NO3 (top right), OMC (bottom left) and EC (bottom right).

C-116
Figure C-53b. CMAQ 2002 Base G2 12 km Actual base case model performance for the Best 20 percent days at Cape Romain (ROMA), South Carolina for Soil (top left), CM (top right), Sea Salt (bottom left) and Total Bext (bottom right).

C-117
Figure C-54. Bugle Plots of Fractional Bias and Fractional Gross Error for ROMA and the Best 20 Percent Days.

C-118
2.3.11.2 ROMA Worst 20 Percent Days
Figure C-55a. CMAQ 2002 Base G2 12 km Actual base case model performance for the Worst 20 percent days at Cape Romain (ROMA), South Carolina for SO4 (top left), NO3 (top right), OMC (bottom left) and EC (bottom right).

C-119
Figure C-55b. CMAQ 2002 Base G2 12 km Actual base case model performance for the Worst 20 percent days at Cape Romain (ROMA), South Carolina for Soil (top left), CM (top right), Sea Salt (bottom left) and Total Bext (bottom right).

C-120
Figure C-56. Bugle Plots of Fractional Bias and Fractional Gross Error for ROMA and the Worst 20 Percent Days.

C-121
2.3.11.3 ROMA for All Days
Figure C-57. Time series of predicted and observed SO4, NO3, OMC, EC, Soil, CM, Sea Salt and PM2.5 mass across all monitoring days at Cape Romain (ROMA), South Carolina for the CMAQ 2002 Base G2 12 km base case simulation.
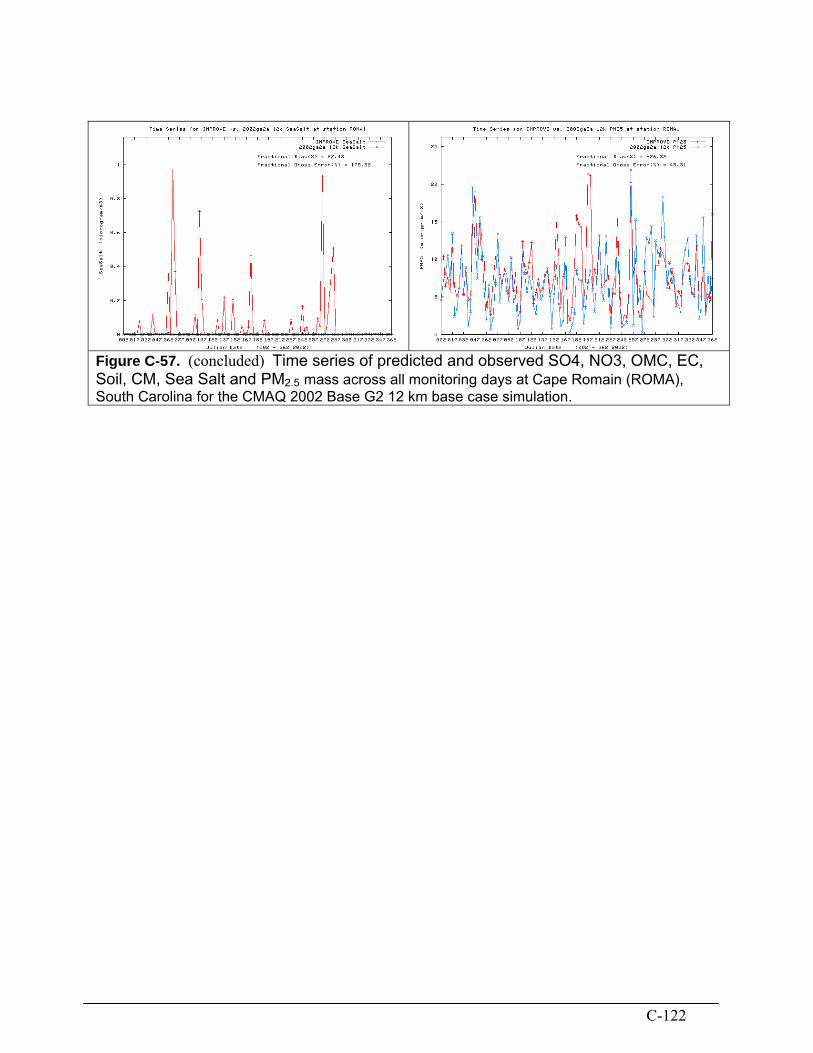
C-122
Figure C-57. (concluded) Time series of predicted and observed SO4, NO3, OMC, EC, Soil, CM, Sea Salt and PM2.5 mass across all monitoring days at Cape Romain (ROMA), South Carolina for the CMAQ 2002 Base G2 12 km base case simulation.

C-123
2.3.12 Great Smoky Mountains National Park (GRSM), Tennessee-North Carolina 2.3.12.1 GRSM Best 20 Percent Days
Figure C-58a. CMAQ 2002 Base G2 12 km Actual base case model performance for the Best 20 percent days at Great Smoky Mountains (GRSM), Tennessee-North Carolina for SO4 (top left), NO3 (top right), OMC (bottom left) and EC (bottom right).
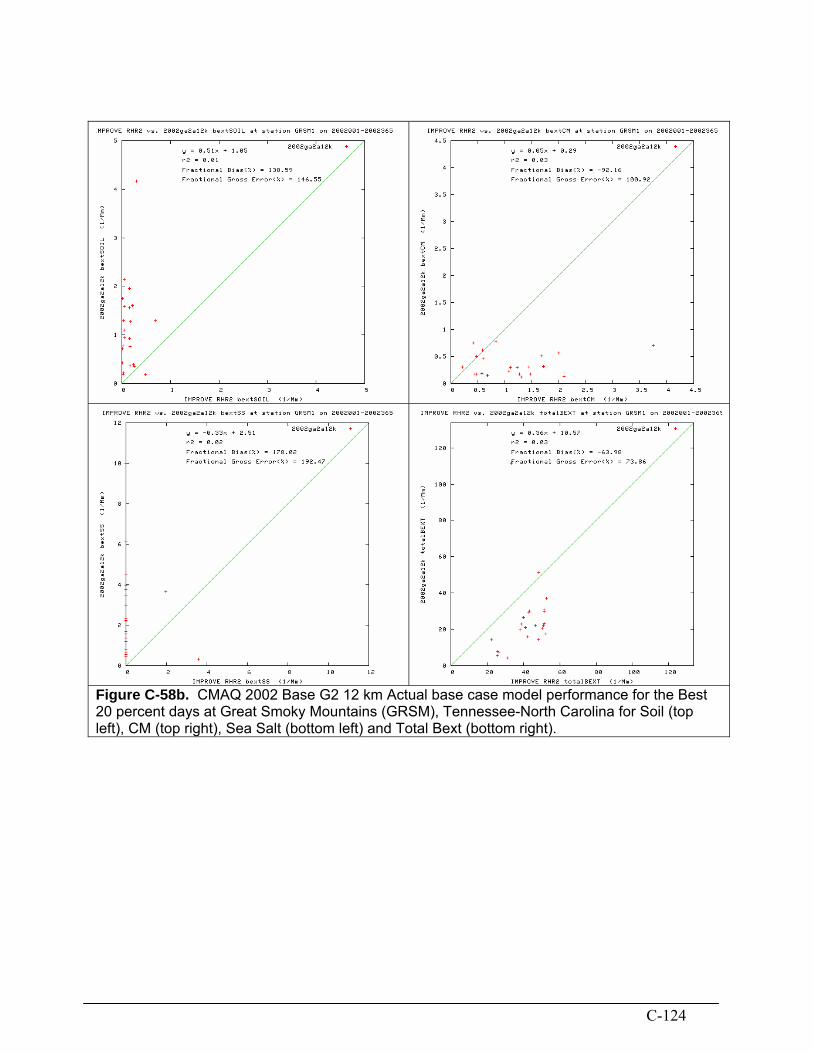
C-124
Figure C-58b. CMAQ 2002 Base G2 12 km Actual base case model performance for the Best 20 percent days at Great Smoky Mountains (GRSM), Tennessee-North Carolina for Soil (top left), CM (top right), Sea Salt (bottom left) and Total Bext (bottom right).

C-125
Figure C-59. Bugle Plots of Fractional Bias and Fractional Gross Error for GRSM and the Best 20 Percent Days.

C-126
2.3.12.2 GRSM Worst 20 Percent Days
Figure C-60a. CMAQ 2002 Base G2 12 km Actual base case model performance for the Worst 20 percent days at Great Smoky Mountains (GRSM), Tennessee-North Carolina for SO4 (top left), NO3 (top right), OMC (bottom left) and EC (bottom right).

C-127
Figure C-60b. CMAQ 2002 Base G2 12 km Actual base case model performance for the Worst 20 percent days at Great Smoky Mountains (GRSM), Tennessee-North Carolina for Soil (top left), CM (top right), Sea Salt (bottom left) and Total Bext (bottom right).

C-128
Figure C-61. Bugle Plots of Fractional Bias and Fractional Gross Error for GRSM and the Worst 20 Percent Days.
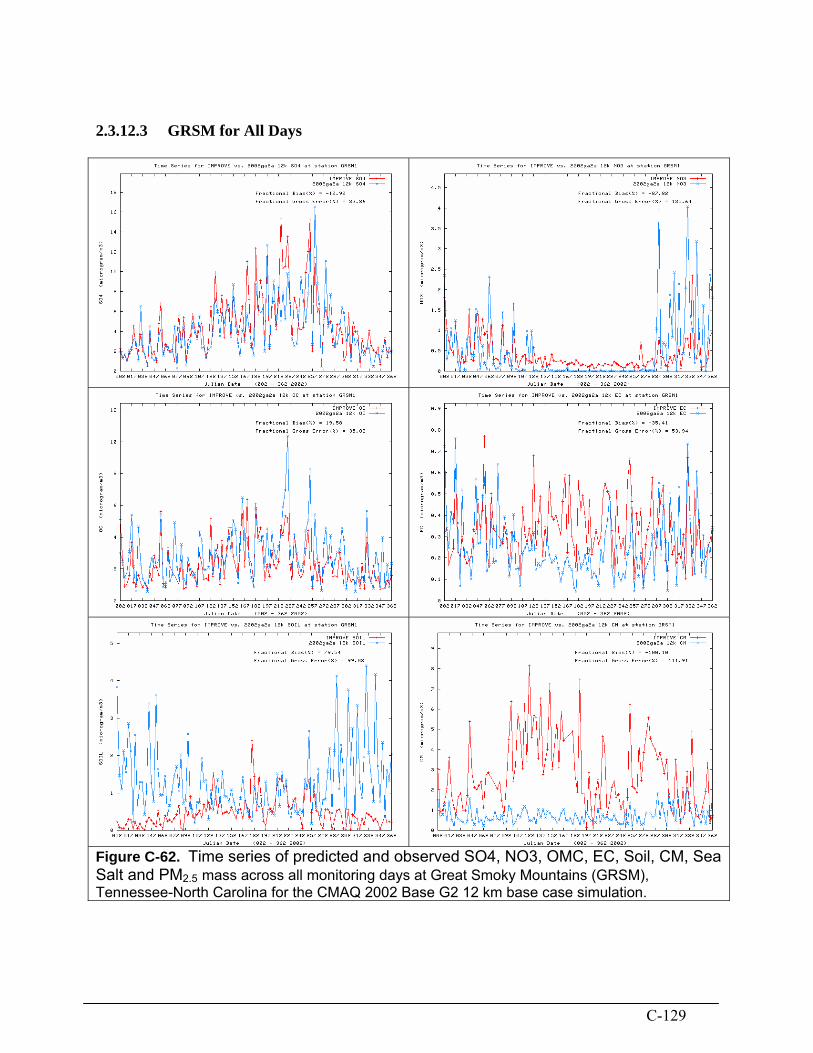
C-129
2.3.12.3 GRSM for All Days
Figure C-62. Time series of predicted and observed SO4, NO3, OMC, EC, Soil, CM, Sea Salt and PM2.5 mass across all monitoring days at Great Smoky Mountains (GRSM), Tennessee-North Carolina for the CMAQ 2002 Base G2 12 km base case simulation.
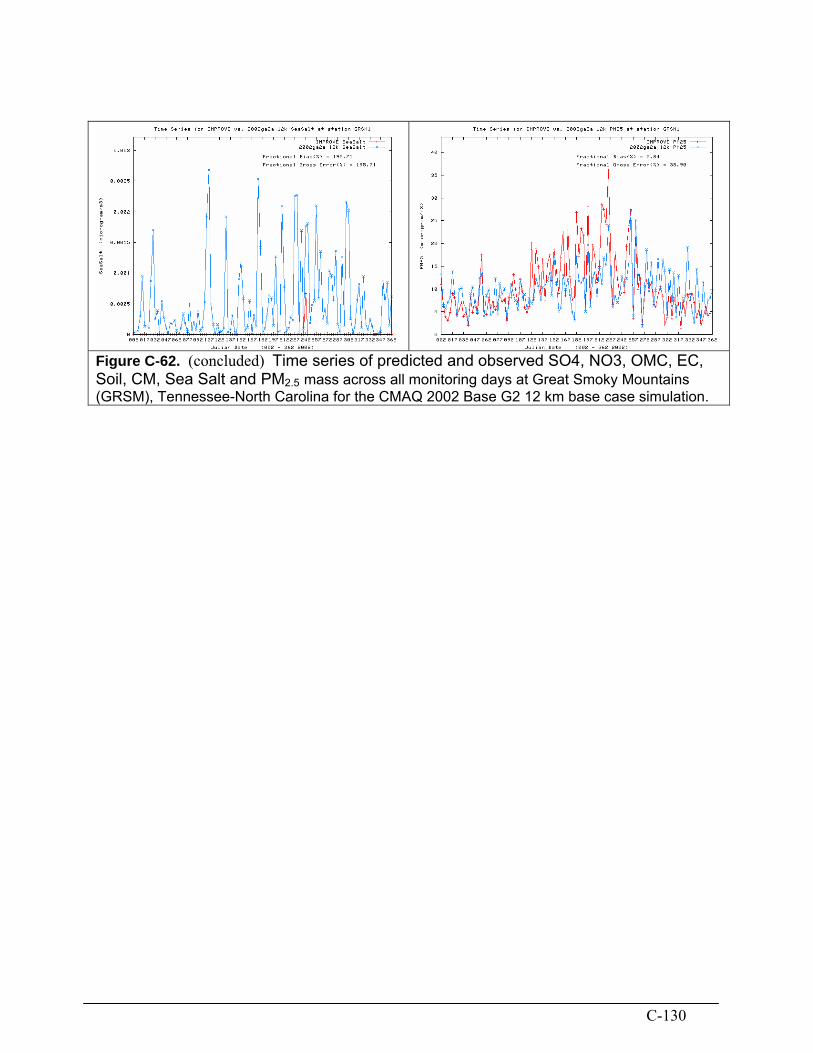
C-130
Figure C-62. (concluded) Time series of predicted and observed SO4, NO3, OMC, EC, Soil, CM, Sea Salt and PM2.5 mass across all monitoring days at Great Smoky Mountains (GRSM), Tennessee-North Carolina for the CMAQ 2002 Base G2 12 km base case simulation.

C-131
2.3.13 James River Face Wilderness Area (JARI), Virginia 2.3.13.1 JARI Best 20 Percent Days
Figure C-63a. CMAQ 2002 Base G2 12 km Actual base case model performance for the Best 20 percent days at James River (JARI), Virginia for SO4 (top left), NO3 (top right), OMC (bottom left) and EC (bottom right).

C-132
Figure C-63b. CMAQ 2002 Base G2 12 km Actual base case model performance for the Best 20 percent days at James River (JARI), Virginia for Soil (top left), CM (top right), Sea Salt (bottom left) and Total Bext (bottom right).
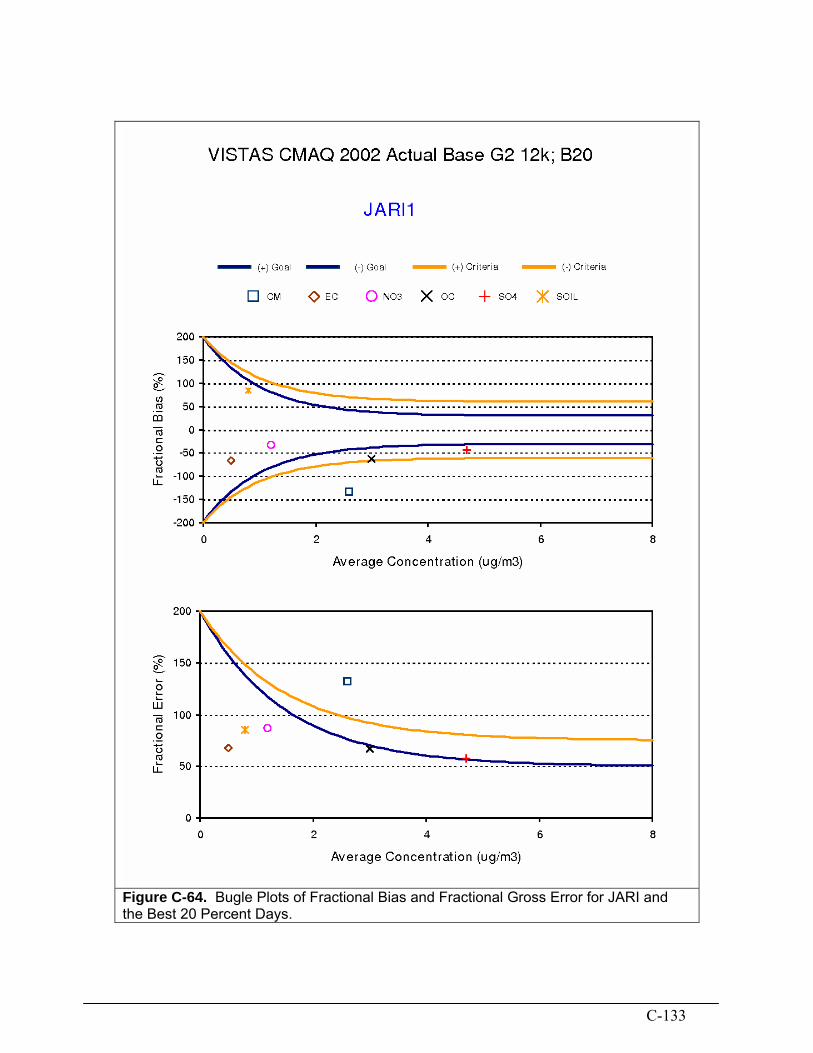
C-133
Figure C-64. Bugle Plots of Fractional Bias and Fractional Gross Error for JARI and the Best 20 Percent Days.

C-134
2.3.13.2 JARI Worst 20 Percent Days
Figure C-65a. CMAQ 2002 Base G2 12 km Actual base case model performance for the Worst 20 percent days at James River (JARI), Virginia for SO4 (top left), NO3 (top right), OMC (bottom left) and EC (bottom right).
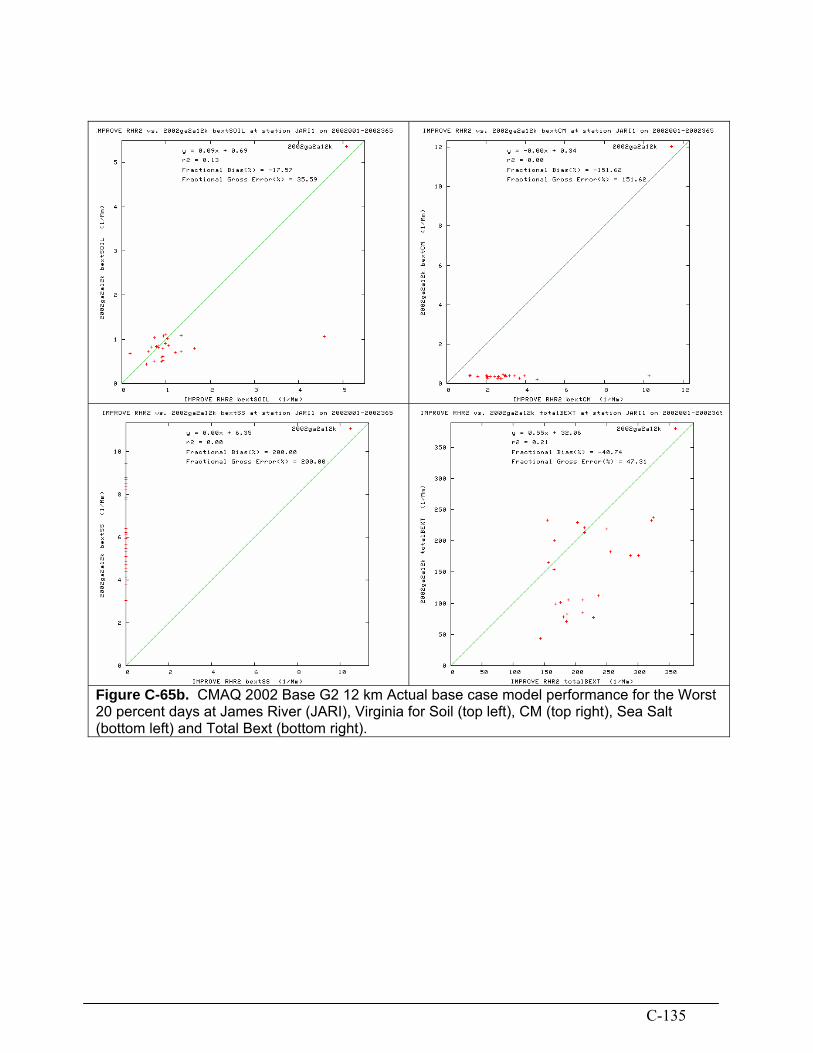
C-135
Figure C-65b. CMAQ 2002 Base G2 12 km Actual base case model performance for the Worst 20 percent days at James River (JARI), Virginia for Soil (top left), CM (top right), Sea Salt (bottom left) and Total Bext (bottom right).

C-136
Figure C-66. Bugle Plots of Fractional Bias and Fractional Gross Error for JARI and the Worst 20 Percent Days.

C-137
2.3.13.3 JARI for All Days
Figure C-67. Time series of predicted and observed SO4, NO3, OMC, EC, Soil, CM, Sea Salt and PM2.5 mass across all monitoring days at James River (JARI), Virginia for the CMAQ 2002 Base G2 12 km base case simulation.

C-138
Figure C-67. (concluded) Time series of predicted and observed SO4, NO3, OMC, EC, Soil, CM, Sea Salt and PM2.5 mass across all monitoring days at James River (JARI), Virginia for the CMAQ 2002 Base G2 12 km base case simulation.

C-139
2.3.14 Shenandoah National Park (SHEN), Virginia 2.3.14.1 SHEN Best 20 Percent Days
Figure C-68a. CMAQ 2002 Base G2 12 km Actual base case model performance for the Best 20 percent days at Shenandoah (SHEN), Virginia for SO4 (top left), NO3 (top right), OMC (bottom left) and EC (bottom right).

C-140
Figure C-68b. CMAQ 2002 Base G2 12 km Actual base case model performance for the Best 20 percent days at Shenandoah (SHEN), Virginia for Soil (top left), CM (top right), Sea Salt (bottom left) and Total Bext (bottom right).
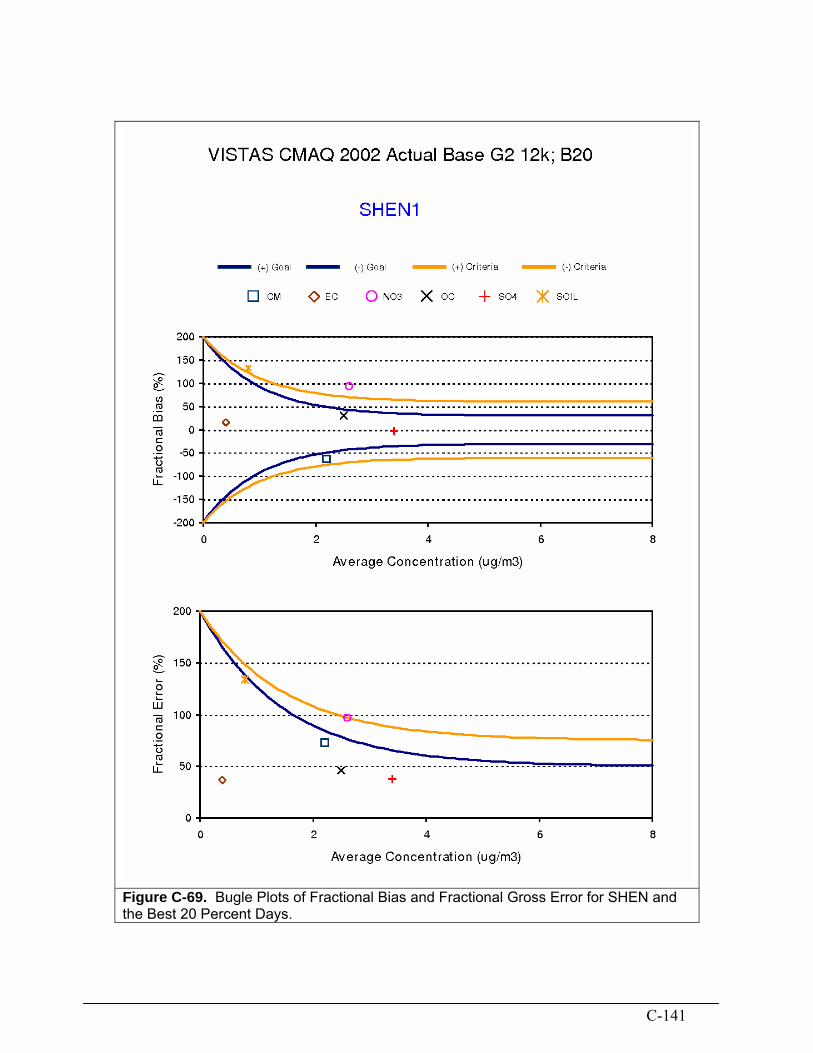
C-141
Figure C-69. Bugle Plots of Fractional Bias and Fractional Gross Error for SHEN and the Best 20 Percent Days.
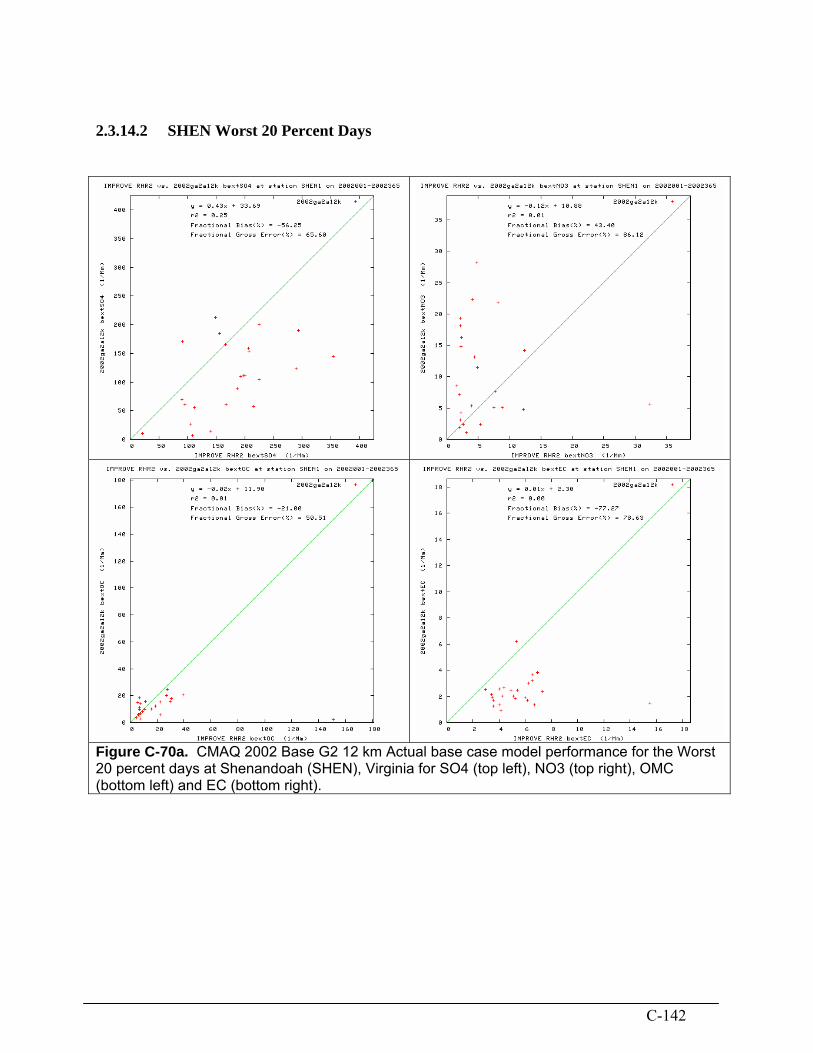
C-142
2.3.14.2 SHEN Worst 20 Percent Days
Figure C-70a. CMAQ 2002 Base G2 12 km Actual base case model performance for the Worst 20 percent days at Shenandoah (SHEN), Virginia for SO4 (top left), NO3 (top right), OMC (bottom left) and EC (bottom right).

C-143
Figure C-70b. CMAQ 2002 Base G2 12 km Actual base case model performance for the Worst 20 percent days at Shenandoah (SHEN), Virginia for Soil (top left), CM (top right), Sea Salt (bottom left) and Total Bext (bottom right).

C-144
Figure C-71. Bugle Plots of Fractional Bias and Fractional Gross Error for SHEN and the Worst 20 Percent Days.

C-145
2.3.14.3 SHEN for All Days
Figure C-72. Time series of predicted and observed SO4, NO3, OMC, EC, Soil, CM, Sea Salt and PM2.5 mass across all monitoring days at Shenandoah (SHEN), Virginia for the CMAQ 2002 Base G2 12 km base case simulation.

C-146
Figure C-72. (concluded) Time series of predicted and observed SO4, NO3, OMC, EC, Soil, CM, Sea Salt and PM2.5 mass across all monitoring days at Shenandoah (SHEN), Virginia for the CMAQ 2002 Base G2 12 km base case simulation.

C-147
2.3.15 Dolly Sods Wilderness Area (DOSO), West Virginia 2.3.15.1 DOSO Best 20 Percent Days
Figure C-73a. CMAQ 2002 Base G2 12 km Actual base case model performance for the Best 20 percent days at Dolly Sods (DOSO), West Virginia for SO4 (top left), NO3 (top right), OMC (bottom left) and EC (bottom right).

C-148
Figure C-73b. CMAQ 2002 Base G2 12 km Actual base case model performance for the Best 20 percent days at Dolly Sods (DOSO), West Virginia for Soil (top left), CM (top right), Sea Salt (bottom left) and Total Bext (bottom right).

C-149
Figure C-74. Bugle Plots of Fractional Bias and Fractional Gross Error for DOSO and the Best 20 Percent Days.

C-150
2.3.15.2 DOSO Worst 20 Percent Days
Figure C-75a. CMAQ 2002 Base G2 12 km Actual base case model performance for the Worst 20 percent days at Dolly Sods (DOSO), West Virginia for SO4 (top left), NO3 (top right), OMC (bottom left) and EC (bottom right).

C-151
Figure C-75b. CMAQ 2002 Base G2 12 km Actual base case model performance for the Worst 20 percent days at Dolly Sods (DOSO), West Virginia for Soil (top left), CM (top right), Sea Salt (bottom left) and Total Bext (bottom right).
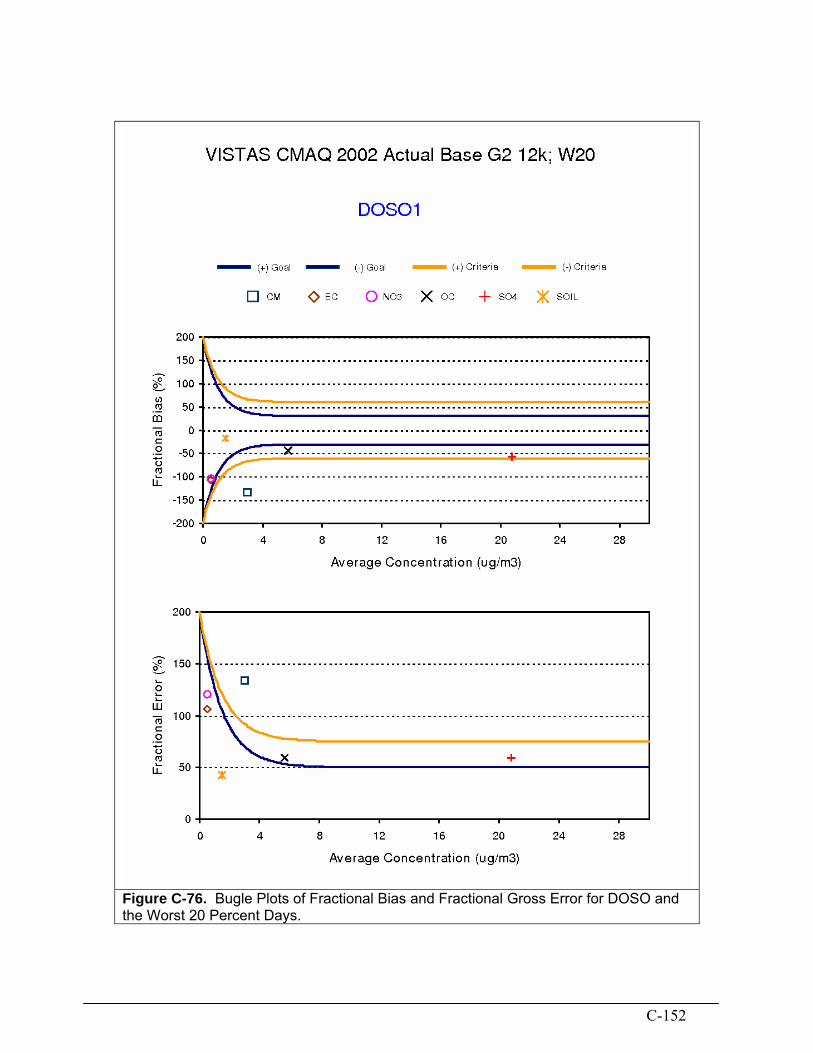
C-152
Figure C-76. Bugle Plots of Fractional Bias and Fractional Gross Error for DOSO and the Worst 20 Percent Days.
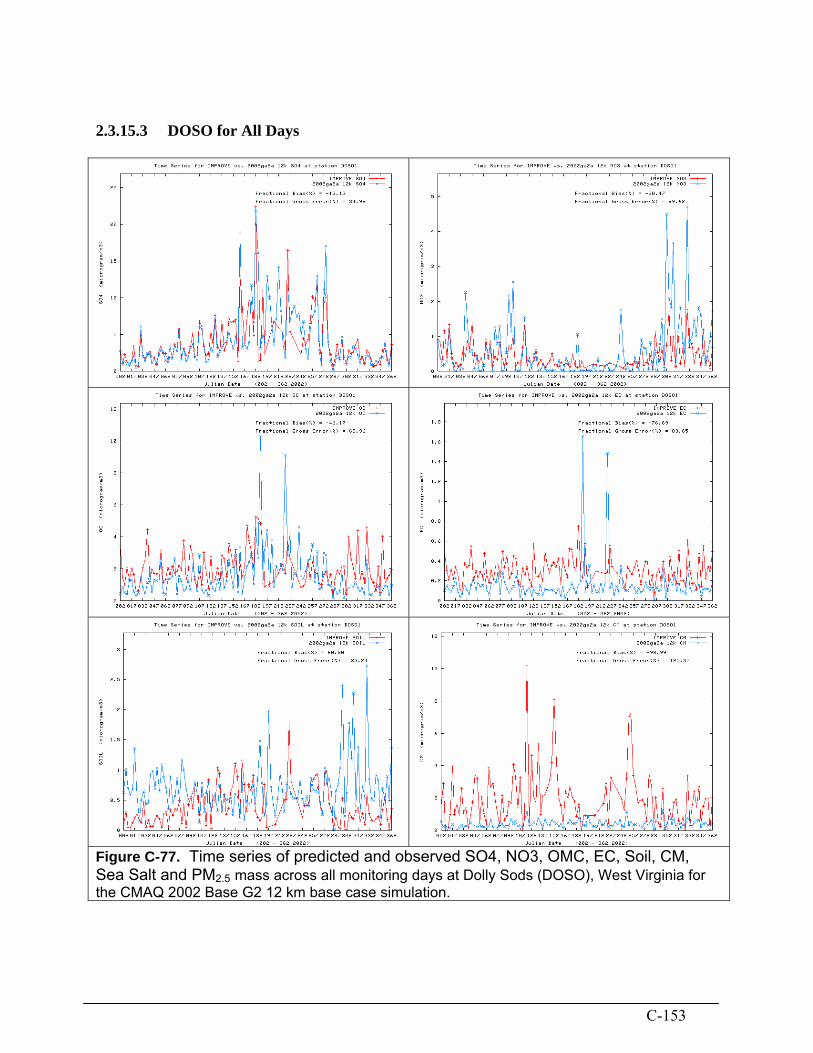
C-153
2.3.15.3 DOSO for All Days
Figure C-77. Time series of predicted and observed SO4, NO3, OMC, EC, Soil, CM, Sea Salt and PM2.5 mass across all monitoring days at Dolly Sods (DOSO), West Virginia for the CMAQ 2002 Base G2 12 km base case simulation.

C-154
Figure C-77. (concluded) Time series of predicted and observed SO4, NO3, OMC, EC, Soil, CM, Sea Salt and PM2.5 mass across all monitoring days at Dolly Sods (DOSO), West Virginia for the CMAQ 2002 Base G2 12 km base case simulation.

C-155
2.3.16 Breton Island Wildlife Refuge (BRET), Louisiana 2.3.16.1 BRET Best 20 Percent Days
Figure C-78a. CMAQ 2002 Base G2 12 km Actual base case model performance for the Best 20 percent days at Breton (BRET), Louisiana for SO4 (top left), NO3 (top right), OMC (bottom left) and EC (bottom right).

C-156
Figure C-78b. CMAQ 2002 Base G2 12 km Actual base case model performance for the Best 20 percent days at Breton (BRET), Louisiana for Soil (top left), CM (top right), Sea Salt (bottom left) and Total Bext (bottom right).

C-157
Figure C-79. Bugle Plots of Fractional Bias and Fractional Gross Error for BRET and the Best 20 Percent Days.

C-158
2.3.16.2 BRET Worst 20 Percent Days
Figure C-80a. CMAQ 2002 Base G2 12 km Actual base case model performance for the Worst 20 percent days at Breton (BRET), Louisiana for SO4 (top left), NO3 (top right), OMC (bottom left) and EC (bottom right).

C-159
Figure C-80b. CMAQ 2002 Base G2 12 km Actual base case model performance for the Worst 20 percent days at Breton (BRET), Louisiana for Soil (top left), CM (top right), Sea Salt (bottom left) and Total Bext (bottom right).

C-160
Figure C-81. Bugle Plots of Fractional Bias and Fractional Gross Error for BRET and the Worst 20 Percent Days.

C-161
2.3.16.3 BRET for All Days

C-162
Figure C-82. Time series of predicted and observed SO4, NO3, OMC, EC, Soil, CM, Sea Salt and PM2.5 mass across all monitoring days at Breton (BRET), Louisiana for the CMAQ 2002 Base G2 12 km base case simulation.

C-163
2.3.17 Caney Creek Wilderness Area (CACR), Arkansas 2.3.17.1 CACR Best 20 Percent Days
Figure C-83a. CMAQ 2002 Base G2 12 km Actual base case model performance for the Best 20 percent days at Caney Creek (CACR), Arkansas for SO4 (top left), NO3 (top right), OMC (bottom left) and EC (bottom right).

C-164
Figure C-83b. CMAQ 2002 Base G2 12 km Actual base case model performance for the Best 20 percent days at Caney Creek (CACR), Arkansas for Soil (top left), CM (top right), Sea Salt (bottom left) and Total Bext (bottom right).

C-165
Figure C-84. Bugle Plots of Fractional Bias and Fractional Gross Error for CACR and the Best 20 Percent Days.

C-166
2.3.17.2 CACR Worst 20 Percent Days
Figure C-85a. CMAQ 2002 Base G2 12 km Actual base case model performance for the Worst 20 percent days at Caney Creek (CACR), Arkansas for SO4 (top left), NO3 (top right), OMC (bottom left) and EC (bottom right).

C-167
Figure C-85b. CMAQ 2002 Base G2 12 km Actual base case model performance for the Worst 20 percent days at Caney Creek (CACR), Arkansas for Soil (top left), CM (top right), Sea Salt (bottom left) and Total Bext (bottom right).
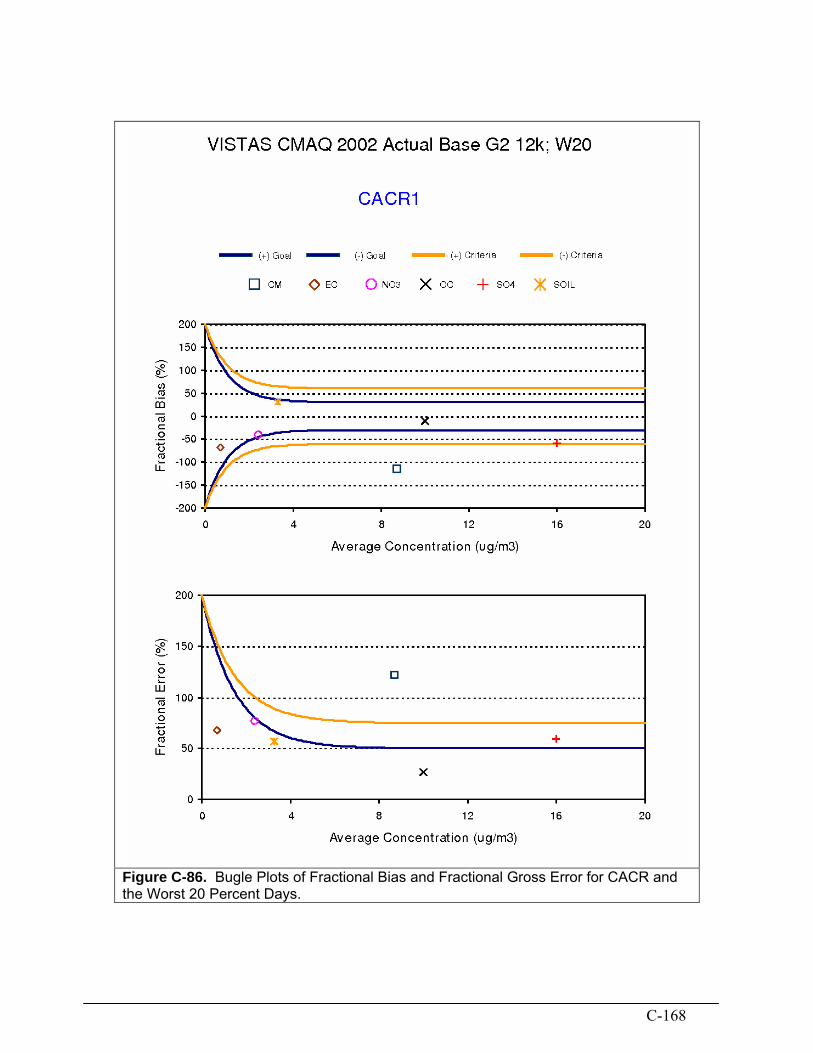
C-168
Figure C-86. Bugle Plots of Fractional Bias and Fractional Gross Error for CACR and the Worst 20 Percent Days.

C-169
2.3.17.3 CACR for All Days

C-170
Figure C-87. Time series of predicted and observed SO4, NO3, OMC, EC, Soil, CM, Sea Salt and PM2.5 mass across all monitoring days at Caney Creek (CACR), Arkansas for the CMAQ 2002 Base G2 12 km base case simulation.

C-171
2.3.18 Upper Buffalo Wilderness Area (UPBU), Arkansas 2.3.18.1 UPBU Best 20 Percent Days
Figure C-88a. CMAQ 2002 Base G2 12 km Actual base case model performance for the Best 20 percent days at Upper Buffalo (UPBU), Arkansas for SO4 (top left), NO3 (top right), OMC (bottom left) and EC (bottom right).

C-172
Figure C-88b. CMAQ 2002 Base G2 12 km Actual base case model performance for the Best 20 percent days at Upper Buffalo (UPBU), Arkansas for Soil (top left), CM (top right), Sea Salt (bottom left) and Total Bext (bottom right).
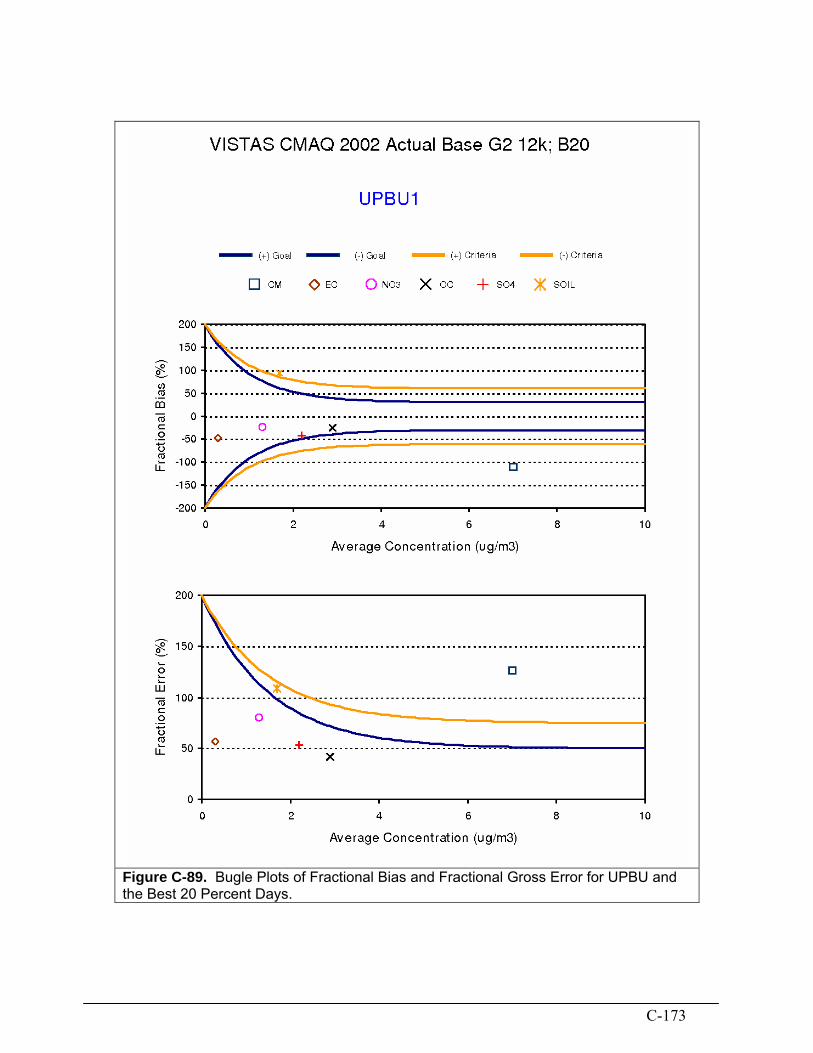
C-173
Figure C-89. Bugle Plots of Fractional Bias and Fractional Gross Error for UPBU and the Best 20 Percent Days.

C-174
2.3.18.2 UPBU Worst 20 Percent Days
Figure C-90a. CMAQ 2002 Base G2 12 km Actual base case model performance for the Worst 20 percent days at Upper Buffalo (UPBU), Arkansas for SO4 (top left), NO3 (top right), OMC (bottom left) and EC (bottom right).

C-175
Figure C-90b. CMAQ 2002 Base G2 12 km Actual base case model performance for the Worst 20 percent days at Upper Buffalo (UPBU), Arkansas for Soil (top left), CM (top right), Sea Salt (bottom left) and Total Bext (bottom right).

C-176
Figure C-91. Bugle Plots of Fractional Bias and Fractional Gross Error for UPBU and the Worst 20 Percent Days.
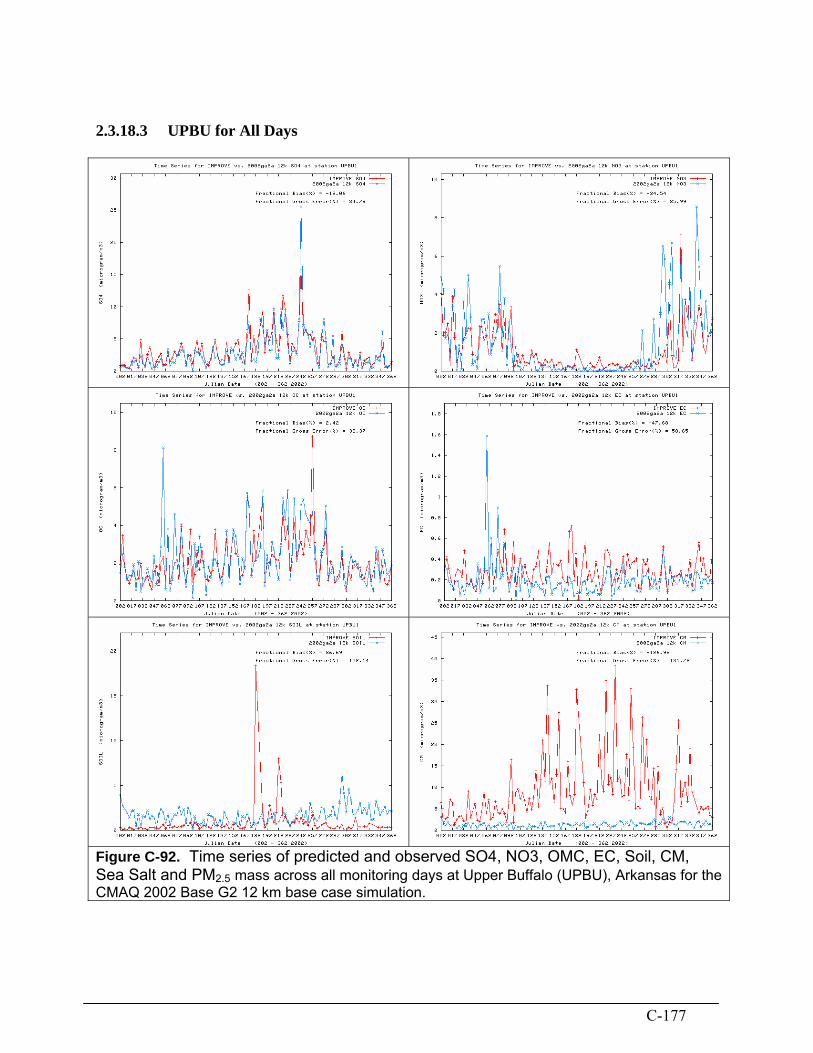
C-177
2.3.18.3 UPBU for All Days
Figure C-92. Time series of predicted and observed SO4, NO3, OMC, EC, Soil, CM, Sea Salt and PM2.5 mass across all monitoring days at Upper Buffalo (UPBU), Arkansas for the CMAQ 2002 Base G2 12 km base case simulation.
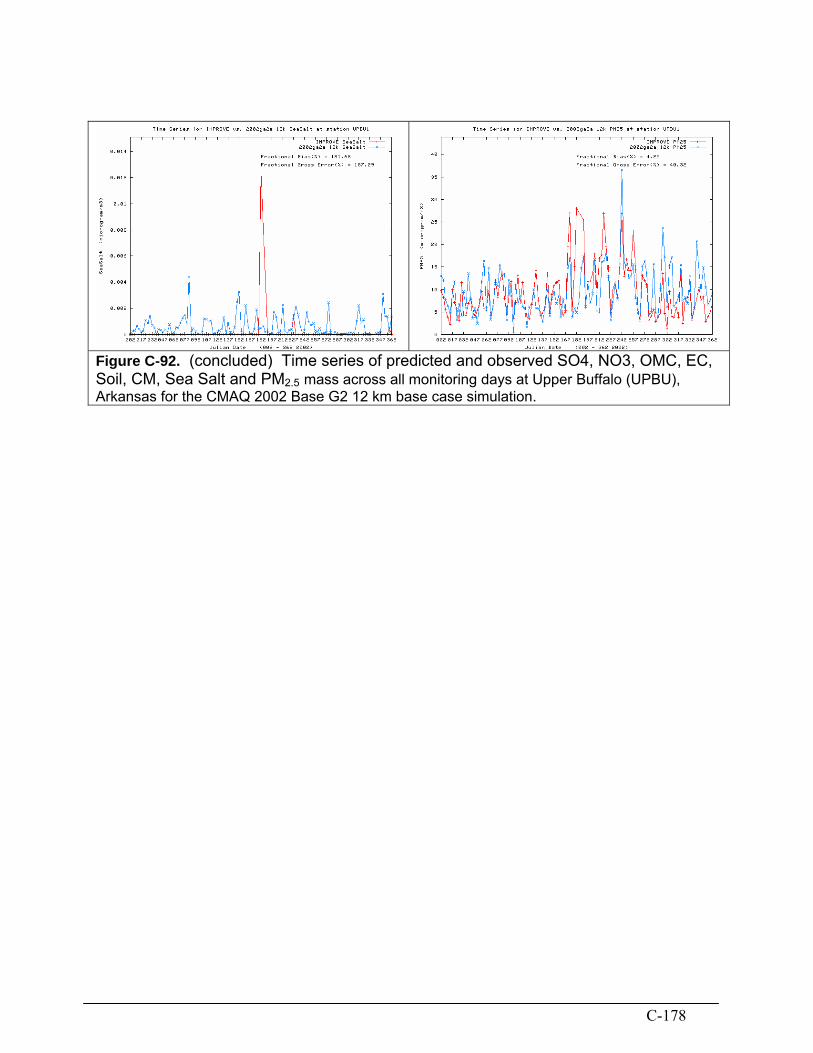
C-178
Figure C-92. (concluded) Time series of predicted and observed SO4, NO3, OMC, EC, Soil, CM, Sea Salt and PM2.5 mass across all monitoring days at Upper Buffalo (UPBU), Arkansas for the CMAQ 2002 Base G2 12 km base case simulation.

C-179
2.3.19 Mingo Wildlife Refuge (MING), Missouri Figure C- �96... .� � �. . �๓�๓ 〃 MING Best 20 Percent Days
Figure C-93a. CMAQ 2002 Base G2 12 km Actual base case model performance for the Best 20 percent days at Mingo (MING), Missouri for SO4 (top left), NO3 (top right), OMC (bottom left) and EC (bottom right).

C-180
Figure C-93b. CMAQ 2002 Base G2 12 km Actual base case model performance for the Best 20 percent days at Mingo (MING), Missouri for Soil (top left), CM (top right), Sea Salt (bottom left) and Total Bext (bottom right).

C-181
Figure C-94. Bugle Plots of Fractional Bias and Fractional Gross Error for MING and the Best 20 Percent Days.
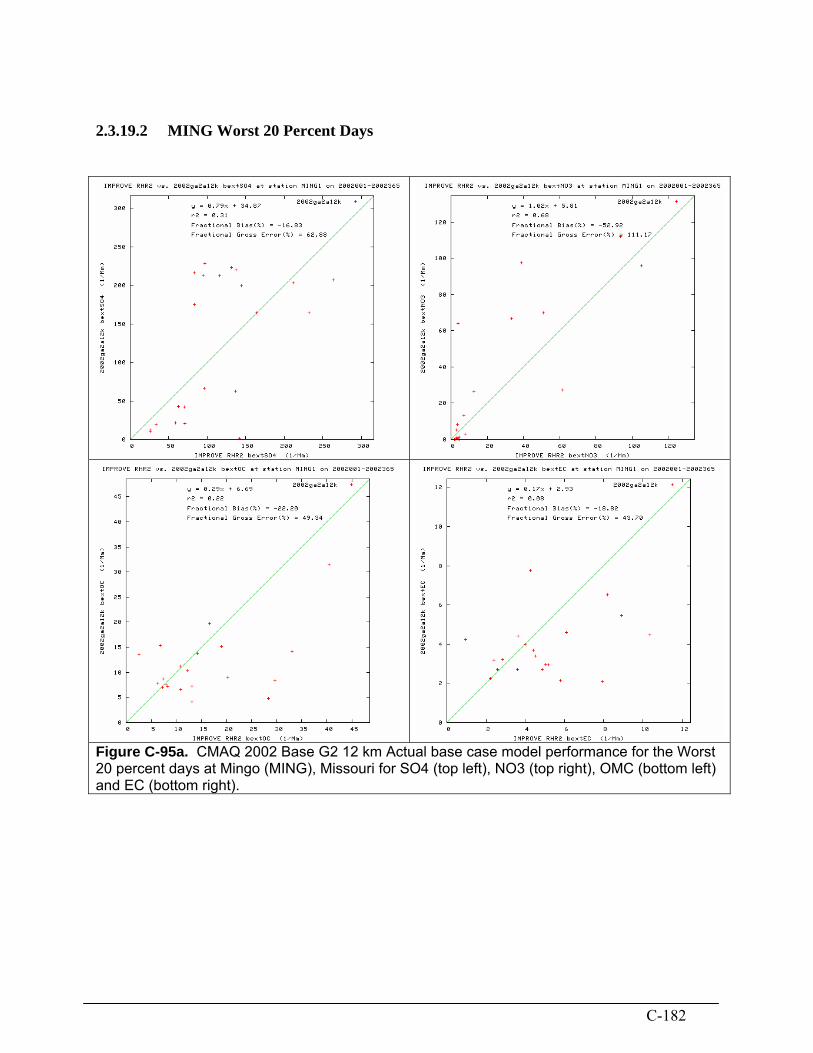
C-182
2.3.19.2 MING Worst 20 Percent Days
Figure C-95a. CMAQ 2002 Base G2 12 km Actual base case model performance for the Worst 20 percent days at Mingo (MING), Missouri for SO4 (top left), NO3 (top right), OMC (bottom left) and EC (bottom right).

C-183
Figure C-95b. CMAQ 2002 Base G2 12 km Actual base case model performance for the Worst 20 percent days at Mingo (MING), Missouri for Soil (top left), CM (top right), Sea Salt (bottom left) and Total Bext (bottom right).

C-184
Figure C-96. Bugle Plots of Fractional Bias and Fractional Gross Error for MING and the Worst 20 Percent Days.

C-185
2.3.19.3 MING for All Days
Figure C-97. Time series of predicted and observed SO4, NO3, OMC, EC, Soil, CM, Sea Salt and PM2.5 mass across all monitoring days at Mingo (MING), Missouri for the CMAQ 2002 Base G2 12 km base case simulation.

C-186
Figure C-97. (concluded) Time series of predicted and observed SO4, NO3, OMC, EC, Soil, CM, Sea Salt and PM2.5 mass across all monitoring days at Mingo (MING), Missouri for the CMAQ 2002 Base G2 12 km base case simulation.
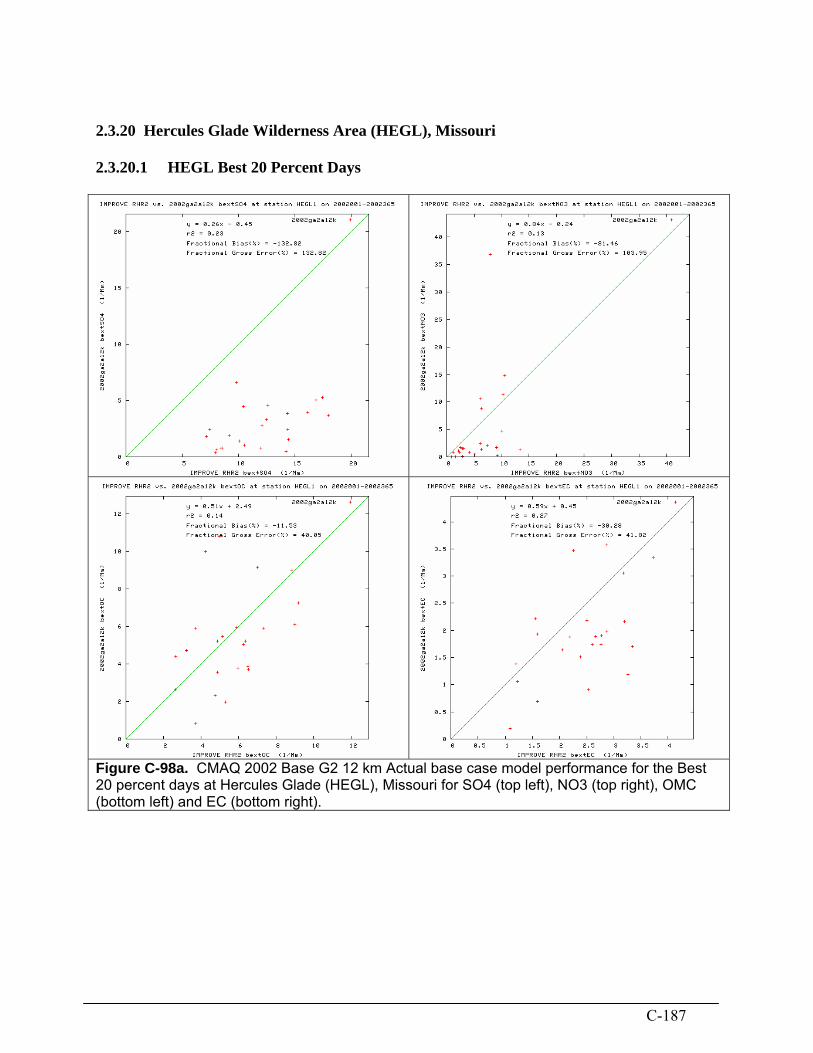
C-187
2.3.20 Hercules Glade Wilderness Area (HEGL), Missouri 2.3.20.1 HEGL Best 20 Percent Days
Figure C-98a. CMAQ 2002 Base G2 12 km Actual base case model performance for the Best 20 percent days at Hercules Glade (HEGL), Missouri for SO4 (top left), NO3 (top right), OMC (bottom left) and EC (bottom right).

C-188
Figure C-98b. CMAQ 2002 Base G2 12 km Actual base case model performance for the Best 20 percent days at Hercules Glade (HEGL), Missouri for Soil (top left), CM (top right), Sea Salt (bottom left) and Total Bext (bottom right).

C-189
Figure C-99. Bugle Plots of Fractional Bias and Fractional Gross Error for HEGL and the Best 20 Percent Days.
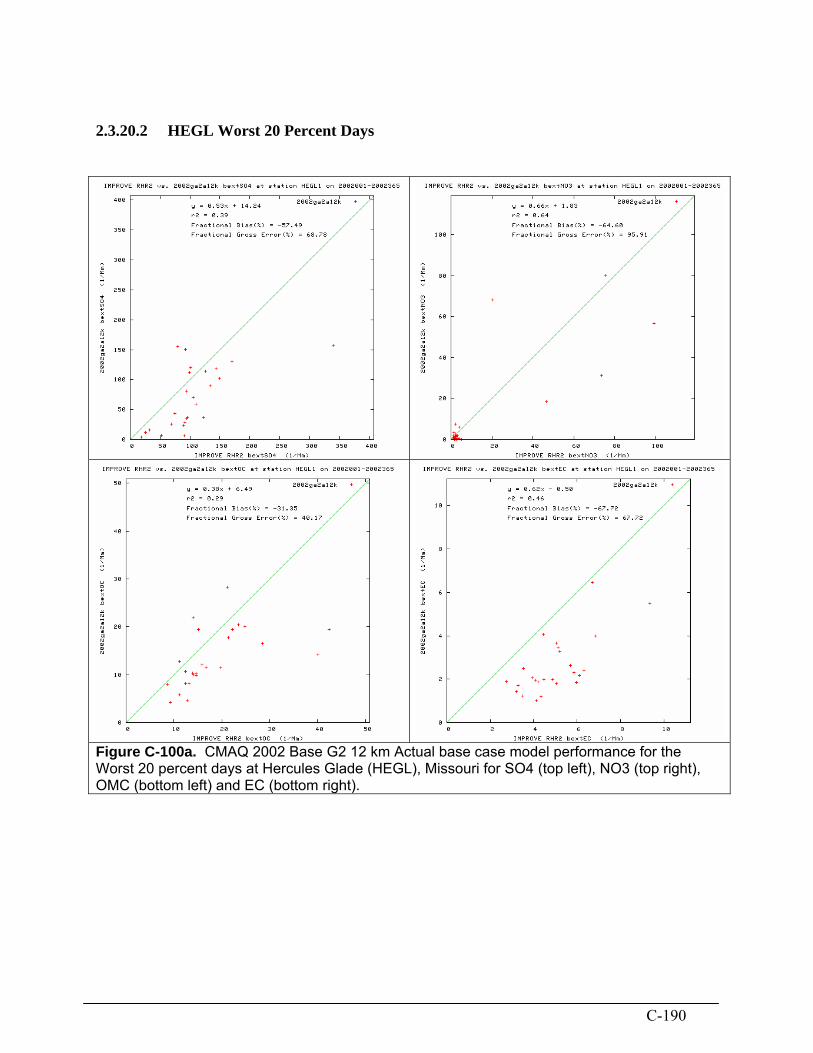
C-190
2.3.20.2 HEGL Worst 20 Percent Days
Figure C-100a. CMAQ 2002 Base G2 12 km Actual base case model performance for the Worst 20 percent days at Hercules Glade (HEGL), Missouri for SO4 (top left), NO3 (top right), OMC (bottom left) and EC (bottom right).

C-191
Figure C-100b. CMAQ 2002 Base G2 12 km Actual base case model performance for the Worst 20 percent days at Hercules Glade (HEGL), Missouri for Soil (top left), CM (top right), Sea Salt (bottom left) and Total Bext (bottom right).

C-192
Figure C-101. Bugle Plots of Fractional Bias and Fractional Gross Error for HEGL and the Worst 20 Percent Days.

C-193
2.3.20.3 HEGL for All Days
Figure C-102. Time series of predicted and observed SO4, NO3, OMC, EC, Soil, CM, Sea Salt and PM2.5 mass across all monitoring days at Hercules Glade (HEGL), Missouri for the CMAQ 2002 Base G2 12 km base case simulation.

C-194
Figure C-102. (concluded) Time series of predicted and observed SO4, NO3, OMC, EC, Soil, CM, Sea Salt and PM2.5 mass across all monitoring days at Hercules Glade (HEGL), Missouri for the CMAQ 2002 Base G2 12 km base case simulation.

C-195
2.3.21 Brigantine Wildlife Refuge (BRIG), New Jersey 2.3.21.1 BRIG Best 20 Percent Days
Figure C-103a. CMAQ 2002 Base G2 12 km Actual base case model performance for the Best 20 percent days at Brigantine (BRIG), New Jersey for SO4 (top left), NO3 (top right), OMC (bottom left) and EC (bottom right).
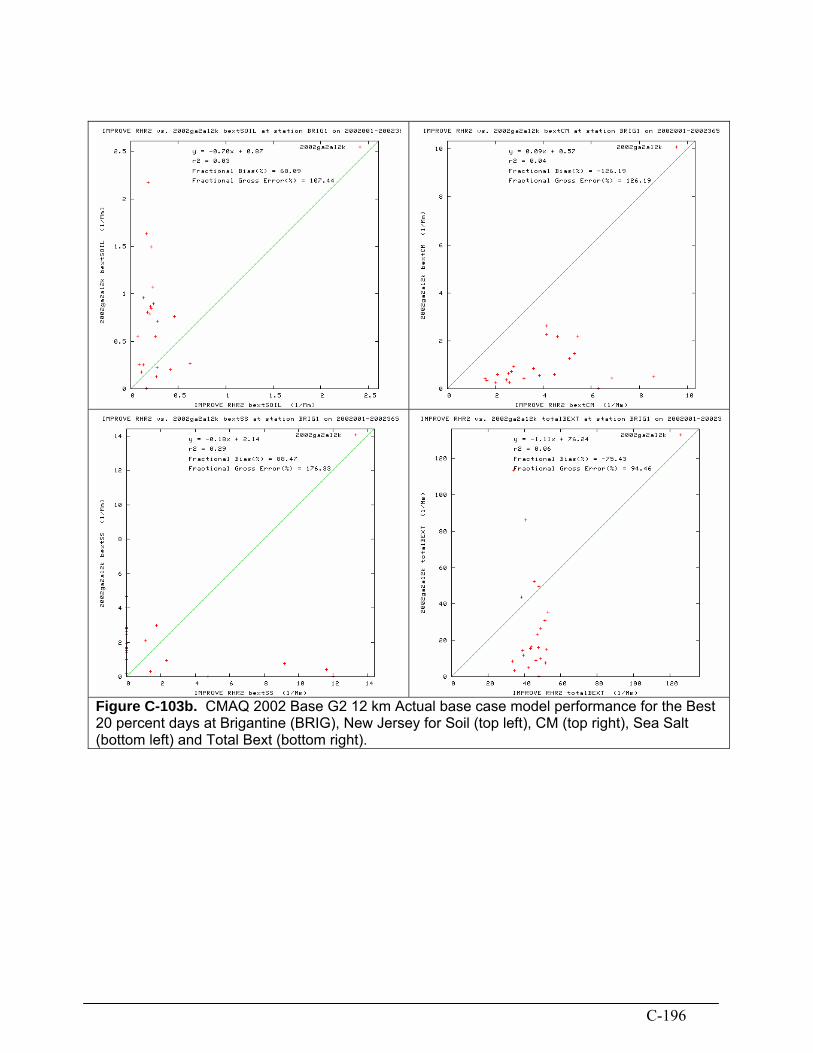
C-196
Figure C-103b. CMAQ 2002 Base G2 12 km Actual base case model performance for the Best 20 percent days at Brigantine (BRIG), New Jersey for Soil (top left), CM (top right), Sea Salt (bottom left) and Total Bext (bottom right).

C-197
Figure C-104. Bugle Plots of Fractional Bias and Fractional Gross Error for BRIG and the Best 20 Percent Days.
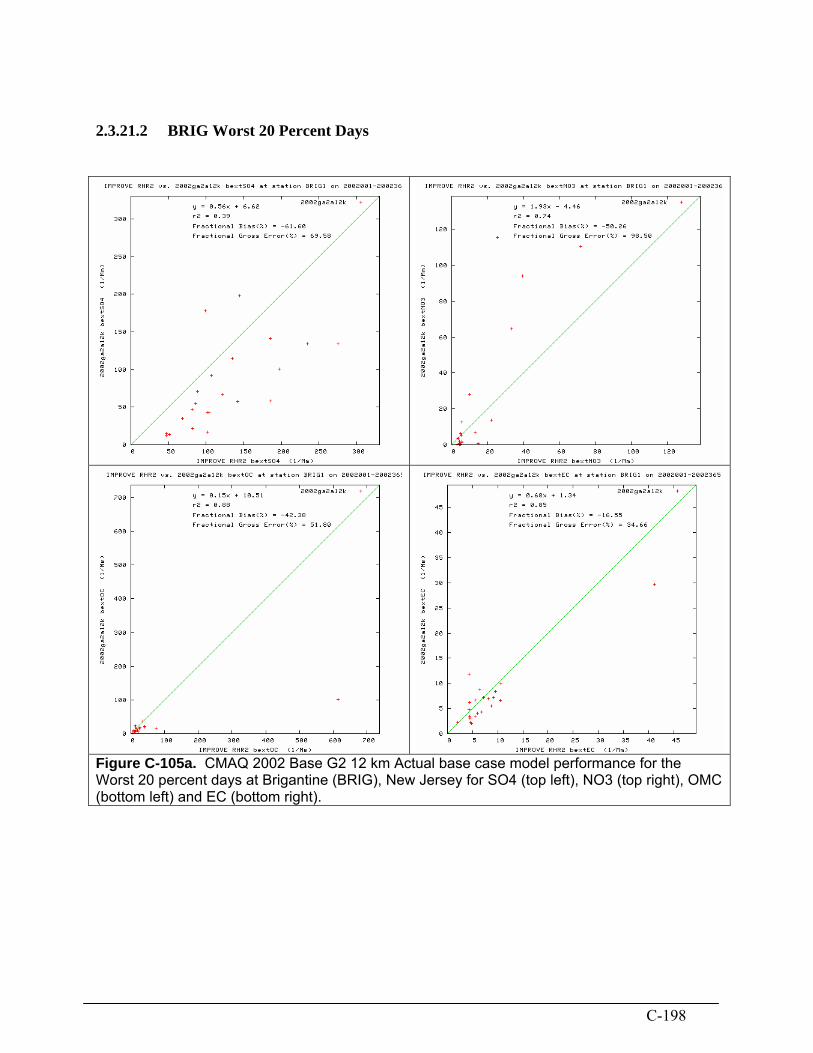
C-198
2.3.21.2 BRIG Worst 20 Percent Days
Figure C-105a. CMAQ 2002 Base G2 12 km Actual base case model performance for the Worst 20 percent days at Brigantine (BRIG), New Jersey for SO4 (top left), NO3 (top right), OMC (bottom left) and EC (bottom right).

C-199
Figure C-105b. CMAQ 2002 Base G2 12 km Actual base case model performance for the Worst 20 percent days at Brigantine (BRIG), New Jersey for Soil (top left), CM (top right), Sea Salt (bottom left) and Total Bext (bottom right).

C-200
Figure C-106. Bugle Plots of Fractional Bias and Fractional Gross Error for BGIG and the Worst 20 Percent Days.

C-201
2.3.21.3 BRIG for All Days
Figure C-107. Time series of predicted and observed SO4, NO3, OMC, EC, Soil, CM, Sea Salt and PM2.5 mass across all monitoring days at Brigantine (BRIG), New Jersey for the CMAQ 2002 Base G2 12 km base case simulation.
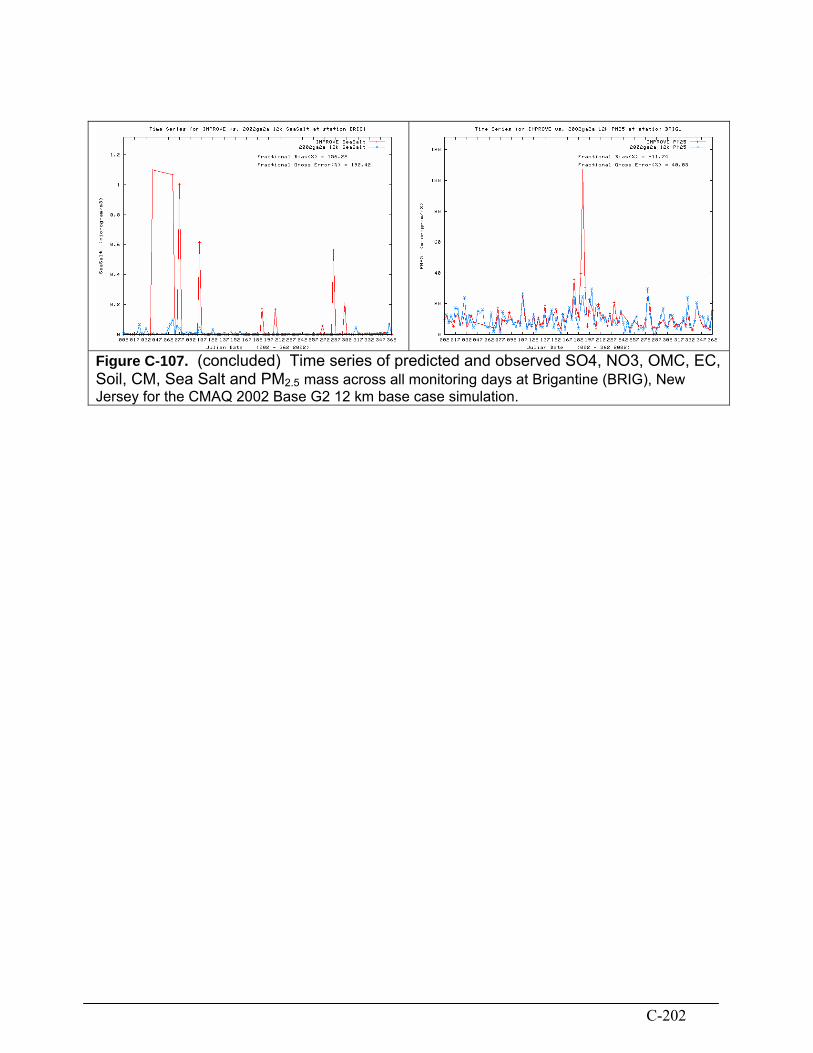
C-202
Figure C-107. (concluded) Time series of predicted and observed SO4, NO3, OMC, EC, Soil, CM, Sea Salt and PM2.5 mass across all monitoring days at Brigantine (BRIG), New Jersey for the CMAQ 2002 Base G2 12 km base case simulation.