aon hewitt presentation final
TRANSCRIPT
8/8/2019 Aon Hewitt Presentation Final
http://slidepdf.com/reader/full/aon-hewitt-presentation-final 1/21
Hewitt Merger with Aon Corporation
Presentation to Investors
July 12, 2010

8/8/2019 Aon Hewitt Presentation Final
http://slidepdf.com/reader/full/aon-hewitt-presentation-final 2/21
8/8/2019 Aon Hewitt Presentation Final
http://slidepdf.com/reader/full/aon-hewitt-presentation-final 3/21

8/8/2019 Aon Hewitt Presentation Final
http://slidepdf.com/reader/full/aon-hewitt-presentation-final 4/21
Strengthens Leadership Position in Risk and People
Substantially strengthens the core strategy of Aon – to be the“Preeminent Professional Services Firm” in the world focused on riskand people
Upon completion of the merger, Aon will be the global leader in Riskand Human Capital Solutions
4
#1 ADVISOR ON RISK GLOBALLY
#1 Primary Insurance Brokerage
#1 Reinsurance Brokerage
#1 Captive Management
Leader in Affinity Programs
» »
#1 IN HUMAN CAPITAL SOLUTIONS
#1 in Benefits Outsourcing
#1 in HR Business Process Outsourcing
Leader in HR Consulting
– Employee Benefits
– Retirement
– Investment Management
– Compensation
Market positions based on Business Insurance magazine 2009 Reader's Choice AwardsNelson Hall "HR Market Outsourcing Forecast 2009-2013“, November 2009

8/8/2019 Aon Hewitt Presentation Final
http://slidepdf.com/reader/full/aon-hewitt-presentation-final 5/21
Highlights of Transaction
Hewitt will merge with Aon for $50 per share, consisting, on a fullydiluted basis, of 50% cash and 50% Aon stock, based on the closingprice of Aon stock on July 9, 2010
Consideration reflects a multiple of 7.5x Hewitt’s FY2010 consensusestimates EBITDA
Creates global leader in human capital solutions with combined AonHewitt revenues of $4.3 billion
Expect to deliver $355 million of annual savings in 2013
Transaction is expected to be accretive on a GAAP EPS basis in2012, on an Adjusted EPS basis in 2011 and significantly accretive tocash earnings in 2011
Generates strong cash flow with increased financial flexibility
Expect to create $1.5 billion of shareholder value
5
8/8/2019 Aon Hewitt Presentation Final
http://slidepdf.com/reader/full/aon-hewitt-presentation-final 6/21
Strategic Rationale – Aon Hewitt
The merger of Hewitt with Aon will create a global leader in human capitalsolutions with the following strengths:
Combined Aon Hewitt revenues of $4.3 billion and 29,000 associates globally
Leading global brand and client service recognized worldwide
Complementary product and service portfolio across consulting, benefitsoutsourcing and HR business process outsourcing
Diversified presence across large corporate and middle market globally
Expected long-term operating margin in Aon Hewitt of 20%
Strong cash flow generation with increased financial flexibility
6

8/8/2019 Aon Hewitt Presentation Final
http://slidepdf.com/reader/full/aon-hewitt-presentation-final 7/21
Highly Complementary Product and Service Portfolio
Aon ConsultingFY09 Revenue
$1.3 billion
HewittFY09 Net Revenue
$3.0 billion
Aon HewittFY09 Net Revenue
$4.3 billion
Combination creates industry-leading product and service portfolio
High mix of recurring revenues
Business lines focused on growth segments of the market
7
HR BPO
$480
16%
HR BPO
$480
11%
Consulting
$1,012
33%
Consulting
$2,087
49%Consulting
$1,075
85%
BenefitsOutsourcing
$191
15%
BenefitsOutsourcing
$1,550
51%
BenefitsOutsourcing
$1,741
40%
8/8/2019 Aon Hewitt Presentation Final
http://slidepdf.com/reader/full/aon-hewitt-presentation-final 8/21
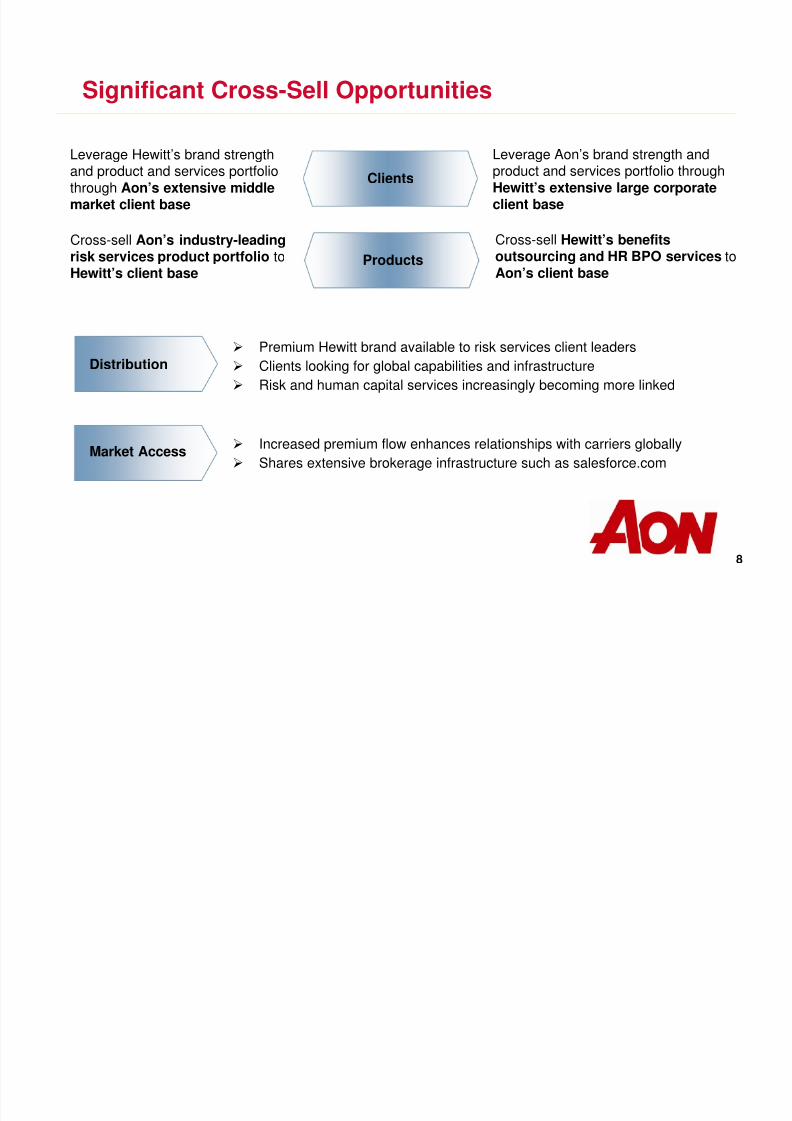
Significant Cross-Sell Opportunities
Leverage Hewitt’s brand strengthand product and services portfoliothrough Aon’s extensive middlemarket client base
Distribution
Increased premium flow enhances relationships with carriers globally
Shares extensive brokerage infrastructure such as salesforce.comMarket Access
Premium Hewitt brand available to risk services client leaders
Clients looking for global capabilities and infrastructure
Risk and human capital services increasingly becoming more linked
Cross-sell Aon’s industry-leadingrisk services product portfolio toHewitt’s client base
8
Clients
Leverage Aon’s brand strength andproduct and services portfolio throughHewitt’s extensive large corporateclient base
Products
Cross-sell Hewitt’s benefitsoutsourcing and HR BPO services toAon’s client base
8/8/2019 Aon Hewitt Presentation Final
http://slidepdf.com/reader/full/aon-hewitt-presentation-final 9/21
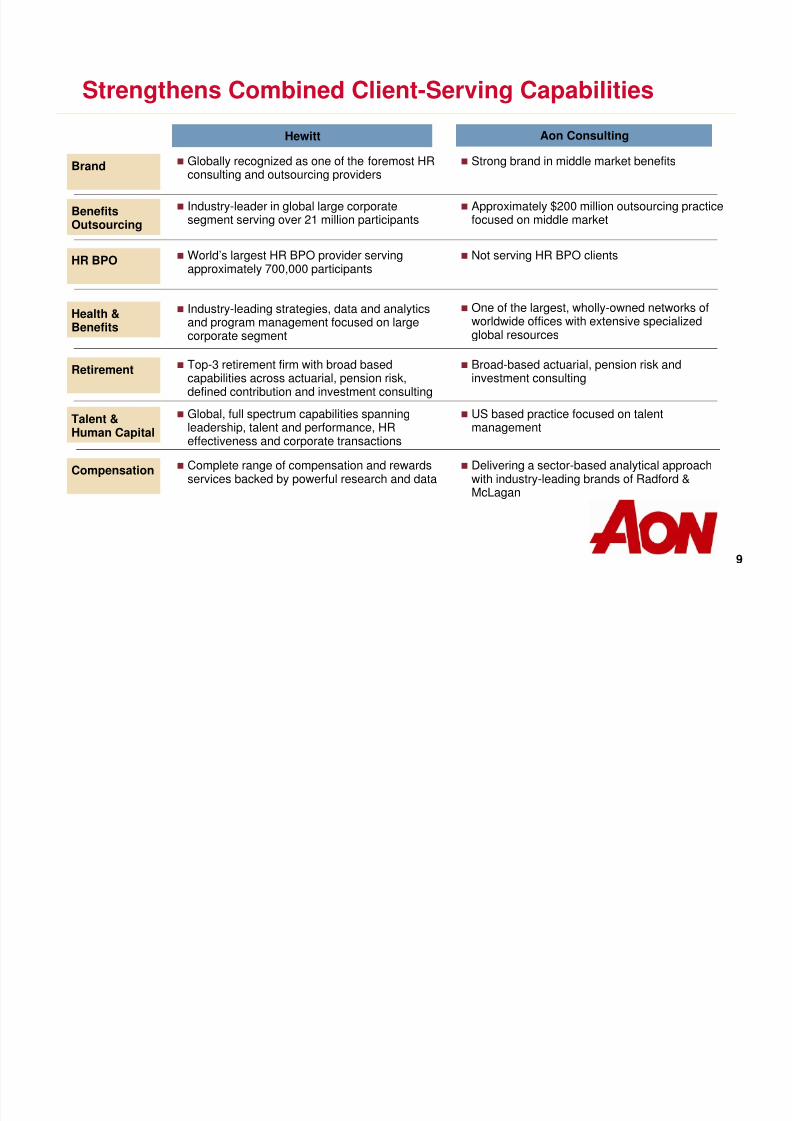
Hewitt
Brand Globally recognized as one of the foremost HRconsulting and outsourcing providers
BenefitsOutsourcing
Industry-leader in global large corporatesegment serving over 21 million participants
Health &Benefits
Industry-leading strategies, data and analytics
and program management focused on largecorporate segment
Strengthens Combined Client-Serving Capabilities
Retirement Top-3 retirement firm with broad basedcapabilities across actuarial, pension risk,defined contribution and investment consulting
Talent &
Human Capital
Global, full spectrum capabilities spanning
leadership, talent and performance, HReffectiveness and corporate transactions
HR BPO World’s largest HR BPO provider servingapproximately 700,000 participants
Compensation Complete range of compensation and rewardsservices backed by powerful research and data
Strong brand in middle market benefits
Approximately $200 million outsourcing practicefocused on middle market
Aon Consulting
One of the largest, wholly-owned networks of
worldwide offices with extensive specializedglobal resources
Broad-based actuarial, pension risk andinvestment consulting
US based practice focused on talent
management
Not serving HR BPO clients
Delivering a sector-based analytical approachwith industry-leading brands of Radford &McLagan
9
8/8/2019 Aon Hewitt Presentation Final
http://slidepdf.com/reader/full/aon-hewitt-presentation-final 10/21
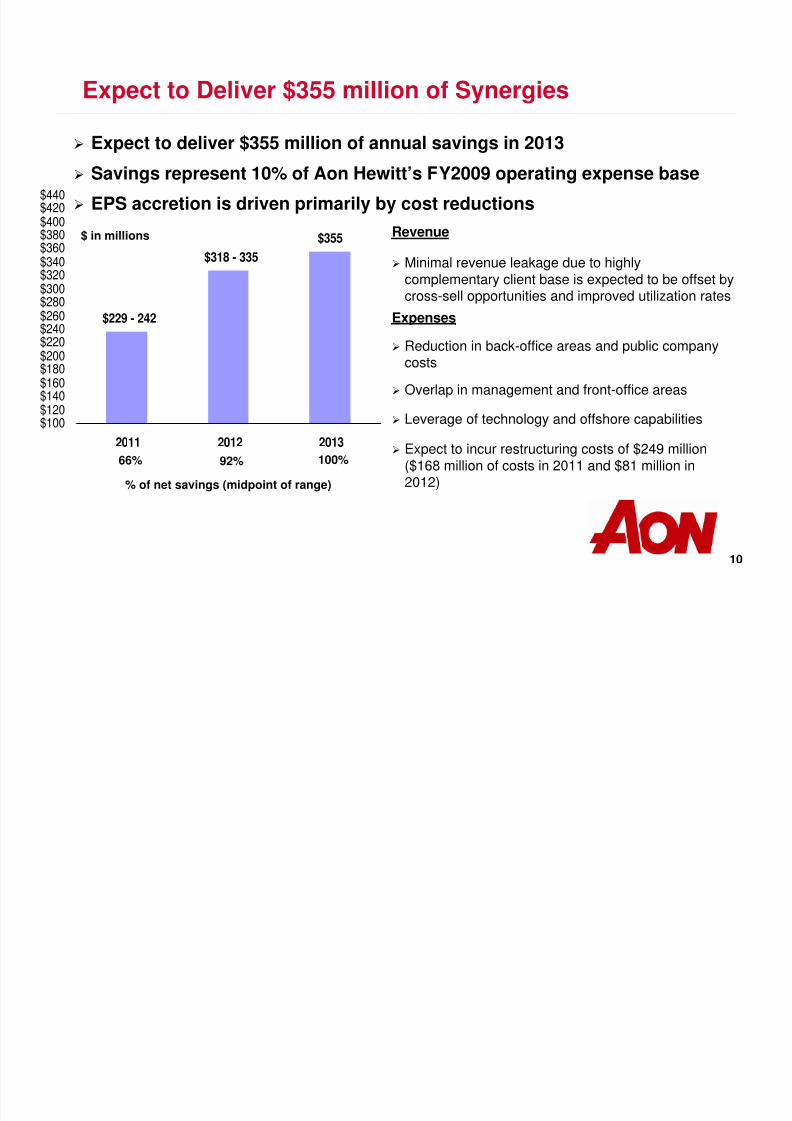
Expect to Deliver $355 million of Synergies
Expect to deliver $355 million of annual savings in 2013
Savings represent 10% of Aon Hewitt’s FY2009 operating expense base
EPS accretion is driven primarily by cost reductions
Revenue
Minimal revenue leakage due to highlycomplementary client base is expected to be offset bycross-sell opportunities and improved utilization rates
Expenses
Reduction in back-office areas and public companycosts
Overlap in management and front-office areas
Leverage of technology and offshore capabilities
Expect to incur restructuring costs of $249 million($168 million of costs in 2011 and $81 million in2012)
$ in millions
% of net savings (midpoint of range)
66% 92% 100%
$355
$229 - 242
$318 - 335
$100
$120$140$160$180$200$220$240$260$280$300$320$340$360$380$400$420$440
2011 2012 2013
10
8/8/2019 Aon Hewitt Presentation Final
http://slidepdf.com/reader/full/aon-hewitt-presentation-final 11/21
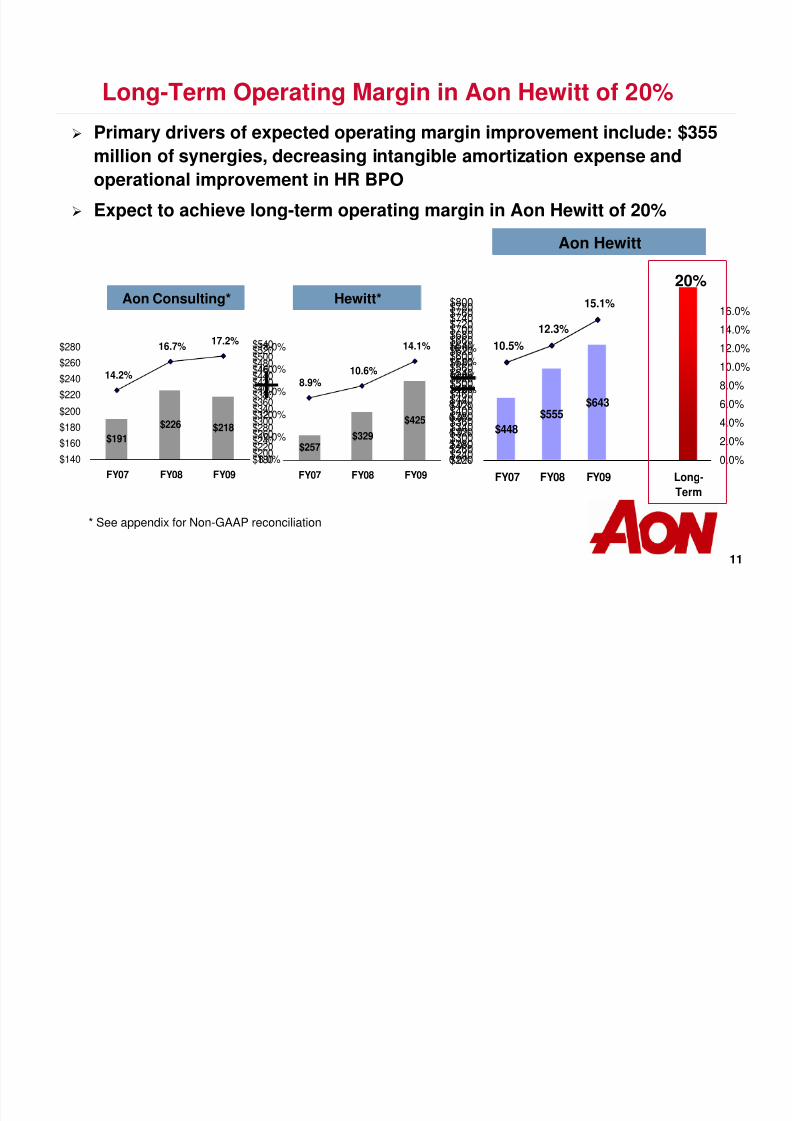
Long-Term Operating Margin in Aon Hewitt of 20%
$191 $226 $218
14.2%
16.7%17.2%
$140
$160$180
$200
$220
$240
$260
$280
FY07 FY08 FY09
8.0%
10.0%
12.0%
14.0%
16.0%
18.0%
$257$329
$425
8.9%10.6%
14.1%
$180$200$220$240$260$280
$300$320$340$360$380$400$420$440$460$480$500$520$540
FY07 FY08 FY09
0.0%
2.0%4.0%
6.0%
8.0%
10.0%
12.0%
14.0%
16.0%
Aon Consulting*
Aon Hewitt
Primary drivers of expected operating margin improvement include: $355
million of synergies, decreasing intangible amortization expense and
operational improvement in HR BPO
Expect to achieve long-term operating margin in Aon Hewitt of 20%
* See appendix for Non-GAAP reconciliation
Hewitt*
$448
$555$643
10.5%
12.3%
15.1%
$220$240$260$280$300$320$340$360$380$400$420$440$460$480$500$520$540$560$580$600$620$640$660$680$700$720$740
$760$780$800
FY07 FY08 FY09 Long-
Term
0.0%
2.0%
4.0%
6.0%
8.0%
10.0%
12.0%
14.0%
16.0%
20%
11

8/8/2019 Aon Hewitt Presentation Final
http://slidepdf.com/reader/full/aon-hewitt-presentation-final 12/21
8/8/2019 Aon Hewitt Presentation Final
http://slidepdf.com/reader/full/aon-hewitt-presentation-final 13/21
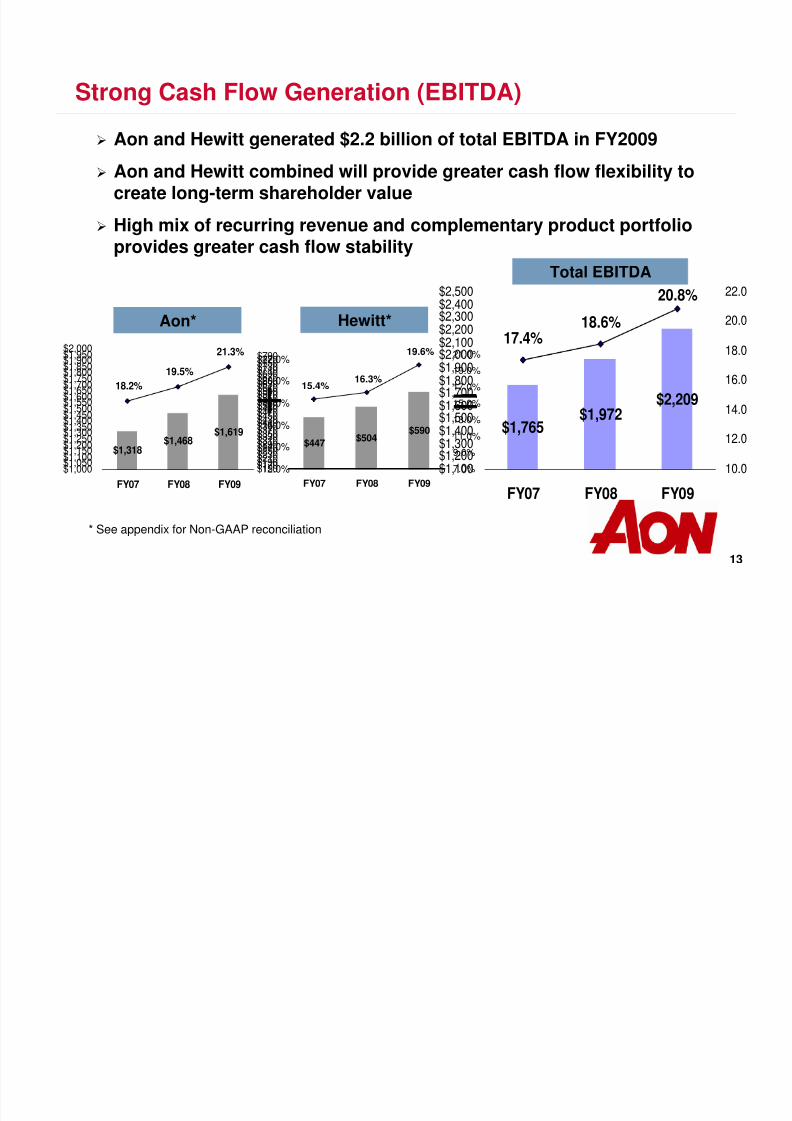
Strong Cash Flow Generation (EBITDA)
Aon* Hewitt*
Total EBITDA
Aon and Hewitt generated $2.2 billion of total EBITDA in FY2009
Aon and Hewitt combined will provide greater cash flow flexibility tocreate long-term shareholder value
High mix of recurring revenue and complementary product portfolioprovides greater cash flow stability
$1,318$1,468
$1,619
18.2%
19.5%
21.3%
$1,000$1,050$1,100$1,150$1,200$1,250$1,300$1,350
$1,400$1,450$1,500$1,550$1,600$1,650$1,700$1,750$1,800$1,850$1,900$1,950$2,000
FY07 FY08 FY09
12.0%
14.0%
16.0%
18.0%
20.0%
22.0%
$1,765
$1,972$2,209
17.4%
20.8%
18.6%
$1,100$1,200$1,300$1,400
$1,500$1,600$1,700$1,800$1,900$2,000$2,100$2,200$2,300$2,400$2,500
FY07 FY08 FY09
10.0
12.0
14.0
16.0
18.0
20.0
22.0
13
* See appendix for Non-GAAP reconciliation
$447$504 $590
15.4%16.3%
19.6%
$150$170$190$210$230$250$270$290$310$330$350$370$390
$410$430$450$470$490$510$530$550$570$590$610$630$650$670$690$710$730$750$770$790
FY07 FY08 FY09
7.0%
9.0%
11.0%
13.0%
15.0%
17.0%
19.0%
21.0%
8/8/2019 Aon Hewitt Presentation Final
http://slidepdf.com/reader/full/aon-hewitt-presentation-final 14/21
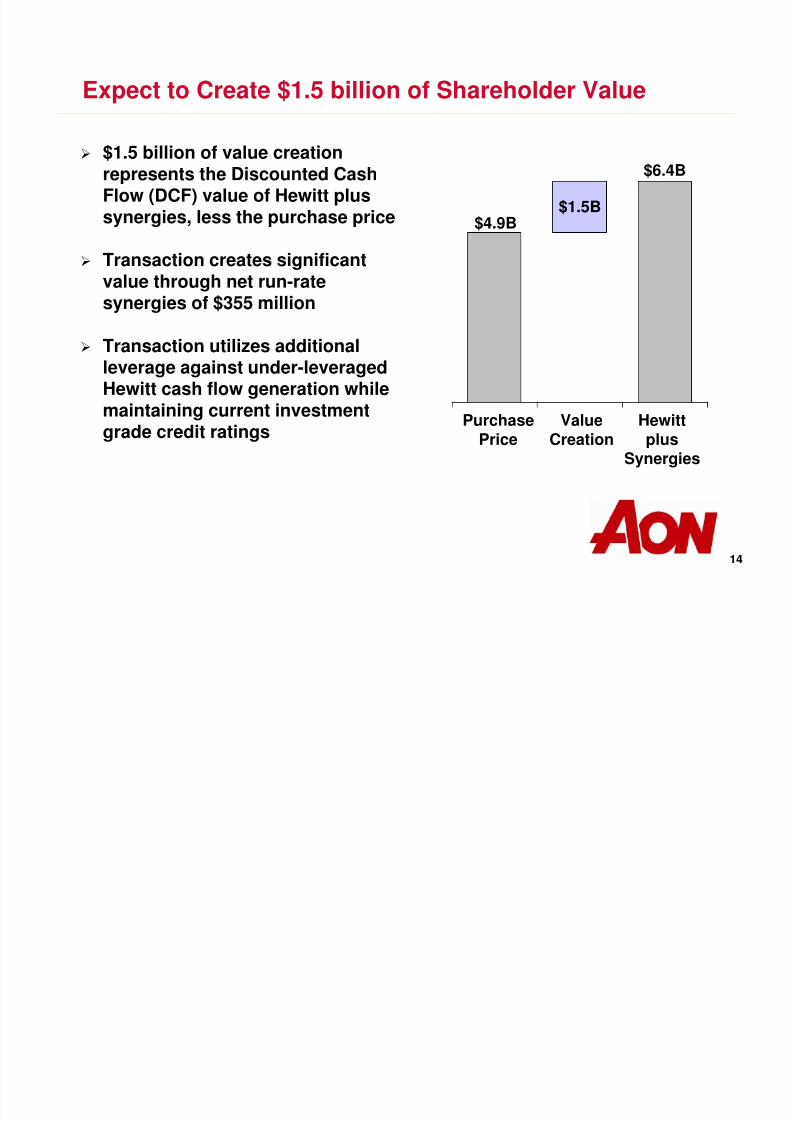
Expect to Create $1.5 billion of Shareholder Value
PurchasePrice
ValueCreation
Hewittplus
Synergies
$4.9B$1.5B
$6.4B $1.5 billion of value creation
represents the Discounted CashFlow (DCF) value of Hewitt plus
synergies, less the purchase price
Transaction creates significantvalue through net run-ratesynergies of $355 million
Transaction utilizes additionalleverage against under-leveragedHewitt cash flow generation whilemaintaining current investment
grade credit ratings
14

8/8/2019 Aon Hewitt Presentation Final
http://slidepdf.com/reader/full/aon-hewitt-presentation-final 15/21
Expect to Maintain Investment Grade Credit Ratings
Transaction will be financed with 50% cash and 50% stock in order tomaintain current investment grade credit ratings of BBB+/Baa2
Credit benefits of the transaction include:
- Increased revenue base
- Increased diversity of revenue base
- Increased EBITDA and EBITDA margins over the long-term
Financing commitments for 100% of cash consideration are in place via
a $1.5 billion bridge facility and a $1.0 billion bank term loan All of the financing is expected to be completed in the U.S. including:
- A $1.0 billion three-year bank term loan maturing 10% in year 1, 10% in year 2 and80% in year 3, with pricing at Libor + 250 bps
- A $1.5 billion bridge facility
The company expects to issue unsecured notes prior to drawing on thebridge facility
15

8/8/2019 Aon Hewitt Presentation Final
http://slidepdf.com/reader/full/aon-hewitt-presentation-final 16/21
Transaction Terms and Timing / Major Milestones
Transaction Terms: Hewitt will merge with Aon for $50 per share, consisting, on a fully diluted basis, of
50% cash and 50% Aon stock, based on the closing price of Aon stock on July 9,2010
Aggregate fully diluted equity value of the transaction is $4.9 billion consisting of$2.45 billion of cash and the issuance of 64.0 million shares
Consideration reflects a multiple of 7.5x Hewitt’s FY2010 consensus estimatesEBITDA
Timing / Major Milestones:
We expect to close the transaction by mid-November
Major completion milestones:
- Prepare and file joint proxy statement / prospectus- Receive regulatory approvals- Receive stockholder approvals
16

8/8/2019 Aon Hewitt Presentation Final
http://slidepdf.com/reader/full/aon-hewitt-presentation-final 17/21
17
Q & A

8/8/2019 Aon Hewitt Presentation Final
http://slidepdf.com/reader/full/aon-hewitt-presentation-final 18/21
Appendix 1 – Reconciliation of Operating Income
18
Ao n C o r p o r a tio n
($ in m i ll ions )
F Y 0 7 F Y 08 F Y 0 9
C o n s u lt in g rev e n u e 1 ,34 5$ 1 ,356$ 1 ,267$
In c o m e f ro m c on t in u in g o p e ra ti o ns b e fo re ta x e s - as re p o rted 18 0$ 2 0 8$ 2 0 3$
R es truc tu r ing 11$ 17$ 35$
Pen sion C u rt a ilm en t - 1 ( 2 0 )
In c o m e f ro m c on t in u in g o p e ra ti o ns be fo re ta x e s - as ad ju s te d 1 91$ 2 2 6$ 2 1 8$
O pe rat in g in c o m e % - a s ad ju sted 1 4.2 % 1 6 .7 % 1 7.2 %
8/8/2019 Aon Hewitt Presentation Final
http://slidepdf.com/reader/full/aon-hewitt-presentation-final 19/21
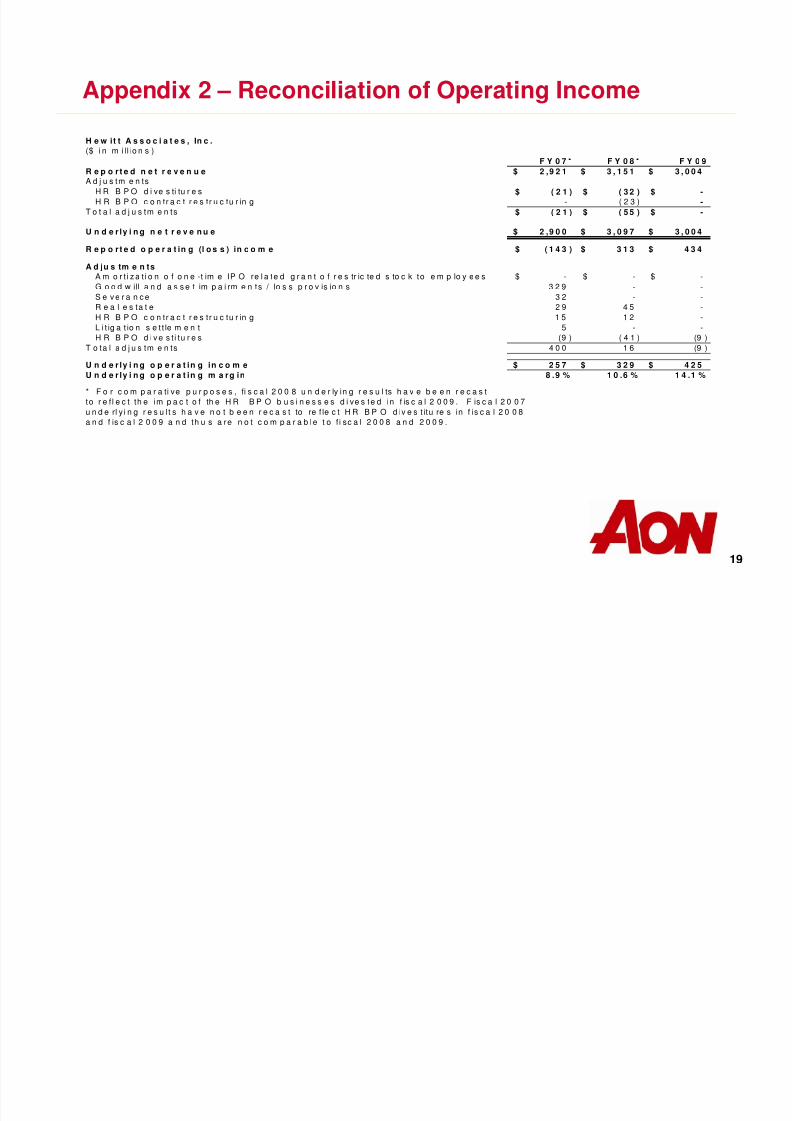
Appendix 2 – Reconciliation of Operating Income
19
H e w it t A s s o c i a t e s , In c .($ i n m i ll io n s )
F Y 0 7 * F Y 0 8 * F Y 0 9
R e p o r t e d n e t r e v e n u e 2 ,9 2 1$ 3 , 1 5 1$ 3 , 0 0 4$A d j u s tm e n ts
H R B P O d i ve s ti tu r e s ( 2 1 )$ ( 3 2 )$ -$H R B P O c o n tr a c t r e s t r u c tu r in g - ( 2 3 ) -
T o t a l a d j u s tm e n ts ( 2 1 )$ ( 5 5 )$ -$
U n d e r ly i n g n e t r e v e n u e 2 ,9 0 0$ 3 , 0 9 7$ 3 , 0 0 4$
R e p o r t e d o p e r a t in g (l o s s ) in c o m e ( 1 4 3 )$ 3 1 3$ 4 3 4$
A d ju s tm e n tsA m o r t i z a t i o n o f o n e -t im e IP O re l a te d g r a n t o f r e s tr ic te d s to c k to e m p lo y e e s -$ -$ -$
G o o d w ill a n d a s s e t im p a i rm e n ts / lo s s p r o v is io n s 3 2 9 - -
S e v e r a n c e 3 2 - -
R e a l e s ta t e 2 9 4 5 -
H R B P O c o n tr a c t r e s t r u c tu r in g 1 5 1 2 -
L i t ig a t io n s e t t le m e n t 5 - - H R B P O d i v e s t i tu r e s (9 ) ( 4 1 ) (9 )
T o ta l a d j u s tm e n ts 4 0 0 1 6 (9 )
U n d e r ly i n g o p e r a t in g in c o m e 2 5 7$ 3 2 9$ 4 2 5$
U n d e r ly i n g o p e r a t in g m a rg in 8 .9 % 1 0 .6 % 1 4 .1 %
* F o r c o m p a r a ti ve p u r p o s e s , fi s c a l 2 0 0 8 u n d e r ly in g r e s u l ts h a v e b e e n r e c a s t
to r e f l e c t th e im p a c t o f th e H R B P O b u s i n e s s e s d i ve s te d in f is c a l 2 0 0 9 . F is c a l 2 0 0 7
u n d e rl y i n g r e s u l t s h a v e n o t b e e n r e c a s t to re f le c t H R B P O d iv e s t itu re s in f is c a l 2 0 0 8
a n d f is c a l 2 0 0 9 a n d th u s a re n o t c o m p a r a b le t o f i sc a l 2 0 0 8 a n d 2 0 0 9 .
8/8/2019 Aon Hewitt Presentation Final
http://slidepdf.com/reader/full/aon-hewitt-presentation-final 20/21
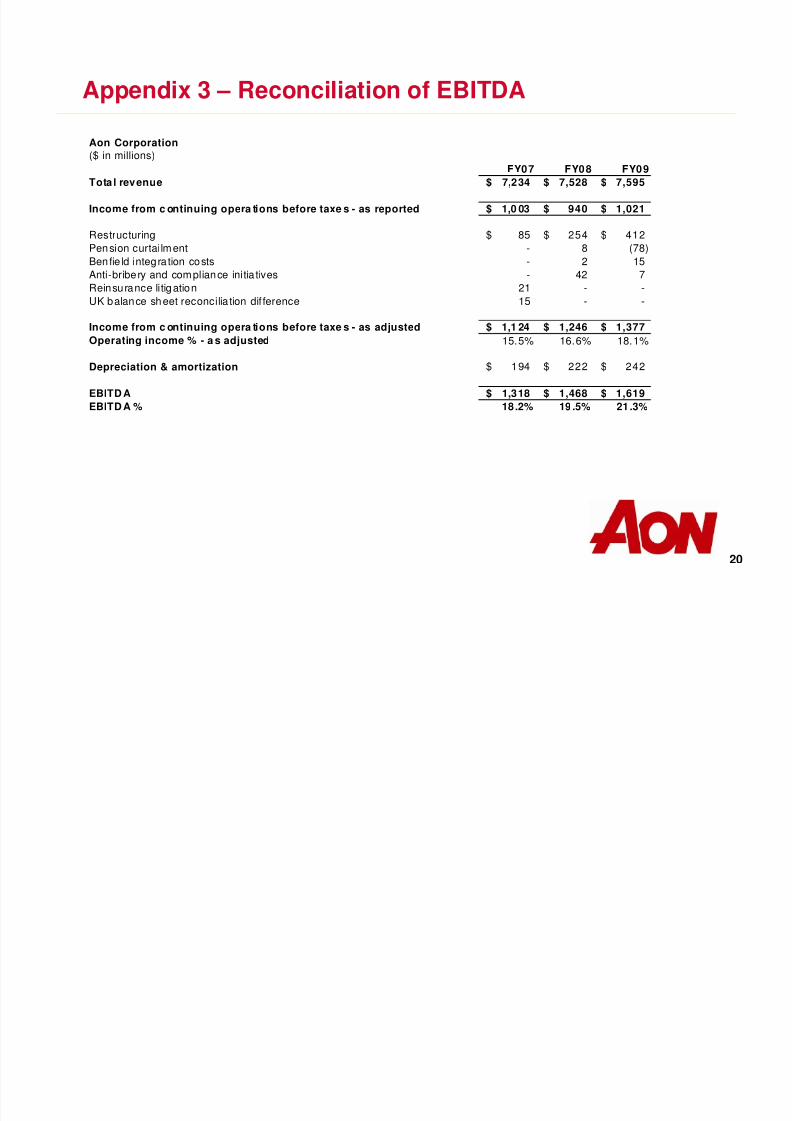
Appendix 3 – Reconciliation of EBITDA
20
Aon Corporation
($ in millions)
FY07 FY08 FY09
Tota l revenue 7,234$ 7,528$ 7,595$
Income from c ontinuing opera tions before taxe s - as reported 1,0 03$ 940$ 1,021$
Restructuring 85$ 254$ 412$
Pension curtailment - 8 (78)
Ben fie ld integration costs - 2 15
Anti-bribery and compliance initia tives - 42 7
Reinsurance litigation 21 - -
UK balance sheet reconcilia tion dif ference 15 - -
Income from c ontinuing opera tions before taxe s - as adjusted 1,1 24$ 1,246$ 1,377$Operating income % - a s adjusted 15.5% 16.6% 18.1%
Depreciation & amortization 194$ 222$ 242$
EBITD A 1,318$ 1,468$ 1,619$
EBITD A % 18.2% 19.5% 21.3%

8/8/2019 Aon Hewitt Presentation Final
http://slidepdf.com/reader/full/aon-hewitt-presentation-final 21/21
Appendix 4 – Reconciliation of EBITDA
21
Hew i tt A sso c ia t es , In c .
($ in m i l l ions )
F Y07 * F Y 08* F Y0 9
R ep o rted n et r even u e 2,9 21$ 3 ,151$ 3 ,004$
Ad jus tm en ts
HR B PO d ives t i tu res (21)$ ( 3 2 )$ -$
H R B PO c on tra c t re s truc tu r in g - ( 2 3 ) -
To ta l ad jus tm en ts (21)$ ( 5 5 )$ -$
U n d erly i ng n e t r eve nu e 2,9 00$ 3 ,097$ 3 ,004$
R ep o rted o p er at in g (l os s) in co m e (1 43)$ 313$ 4 3 4$
Ad ju s t m en t s
Am or tiza tion o f one -t im e IP O re la ted gran t o f res tr ic ted s toc k to em p loy ees -$ -$ -$
G ood w ill and as se t im pa i rm en ts / los s p rov is ion s 3 29 - -
Se vera n ce 32 - -
R ea l es ta t e 29 45 -
H R B PO c on tra c t re s truc tu r in g 15 12 - L i tig a tion s e ttle m e n t 5 - -
H R B PO d ive sti tu res (9 ) ( 4 1 ) (9 )
T o ta l ad jus tm ents 4 00 16 (9)
U n d erly i ng o p er at in g in co m e 2 57$ 3 2 9$ 4 2 5$
U n d erly i ng o p er at in g m arg in 8.9% 10.6 % 14 .1%
D ep re ciat io n & A m o rt iz a t io n 1 90$ 1 7 5$ 1 6 5$
EB IT D A 4 47$ 504$ 5 9 0$E B IT D A% 15 .4% 16.3% 19 .6%
* For com para t ive pu rposes , fi sca l 200 8 under ly ing resu l ts have been recas t
to re f lec t the impac t o f the HR BP O bus inesses d i ves ted in fisc a l 2 009 . F i sca l 20 07
unde rl y ing resu lts h ave no t b een recas t to re f le c t HR BPO d ives t itu res i n f isca l 2008
and f isc a l 2 009 and thu s a re no t comparab le to f isca l 2008 and 2009 .