annual report - ai-first company · annual report 2011-2012 1 ... been a cxo at several startups...
TRANSCRIPT


AAAAAnnual Rnnual Rnnual Rnnual Rnnual Reporeporeporeporeporttttt 2011-2012 2011-2012 2011-2012 2011-2012 2011-2012
11111
BOBOBOBOBOARD OF DIRECARD OF DIRECARD OF DIRECARD OF DIRECARD OF DIRECTTTTTORSORSORSORSORS
1. Stefan Hetges - Director & Chief Executive Officer
2. Samir Bhatia - Director & Chief Financial Officer
3. D R R Swaroop - Whole-Time Director
4. L Sridhar - Independent Director
5. Mallipudi Anand Pattabhiramkumar - Independent Director
6. Motaparthy Venkateswara Rao Kasi - Independent Director
AAAAAUDIT CUDIT CUDIT CUDIT CUDIT COMMITOMMITOMMITOMMITOMMITTEETEETEETEETEE
1. L Sridhar - Chairman
2. D R R Swaroop - Member
3. Motaparthy Venkateswara Rao Kasi - Member
BANKERSBANKERSBANKERSBANKERSBANKERS
Axis Bank Limited
STSTSTSTSTAAAAATUTTUTTUTTUTTUTORORORORORY AY AY AY AY AUDITUDITUDITUDITUDITORSORSORSORSORS
P. Murali & Co.Chartered Accountants6-3-655/2/3, SomajigudaHyderabad 500 082Andhra Pradesh, India
CCCCCOMPOMPOMPOMPOMPANANANANANY SECREY SECREY SECREY SECREY SECRETTTTTARARARARARYYYYY
V Ramana Reddy
REGISTERED & CREGISTERED & CREGISTERED & CREGISTERED & CREGISTERED & CORPORORPORORPORORPORORPORAAAAATE OFFICETE OFFICETE OFFICETE OFFICETE OFFICE
Plot No 8-2-269/A/2/1 to 6, 1st FloorWest Wing, Cyber Spazio, Road No 2Banjara Hills, Hyderabad - 500 033Andhra Pradesh, India
REGISTRREGISTRREGISTRREGISTRREGISTRAR AND SHARE AR AND SHARE AR AND SHARE AR AND SHARE AR AND SHARE TRTRTRTRTRANSFER AANSFER AANSFER AANSFER AANSFER AGENTGENTGENTGENTGENTSSSSS
Aarthi Consultants Private Ltd1-2-285, Domalguda, Hyderabad – 500 029Andhra Pradesh, IndiaTel: +91-40-27638111, Fax: [email protected]
Day : Friday
Date : 28th September, 2012
Time : 3.00 p.m
Venue : Ruby Hall, 5th Floor, Quality Inn Pearl,Lumbini Layout, Gachibowli,Hyderabad – 500 032Andhra Pradesh, India
1313131313ththththth ANNU ANNU ANNU ANNU ANNUAL GENERAL GENERAL GENERAL GENERAL GENERAL MEEAL MEEAL MEEAL MEEAL MEETINGTINGTINGTINGTING
CCCCCononononontttttenenenenentststststs PPPPPg Nog Nog Nog Nog No.....
Management Team 2
Notice 4
Directors’ Report 8
Management Discussion and Analysis Report 16
CEO & CFO Certificate, Declaration on Code of
Conduct and Certificate of Compliance 29
Consolidated Financial Statements 32
Standalone Financial Statements 61
Summary of Subsidiary Companies 88
Corporate Governance Report 91

AAAAAnnual Rnnual Rnnual Rnnual Rnnual Reporeporeporeporeporttttt 2011-2012 2011-2012 2011-2012 2011-2012 2011-2012
22222
Management TManagement TManagement TManagement TManagement Teameameameameam

AAAAAnnual Rnnual Rnnual Rnnual Rnnual Reporeporeporeporeporttttt 2011-2012 2011-2012 2011-2012 2011-2012 2011-2012
33333
SSSSStttttefan Hetefan Hetefan Hetefan Hetefan Hetgesgesgesgesges, Dir, Dir, Dir, Dir, Dirececececectttttor & Chief Exor & Chief Exor & Chief Exor & Chief Exor & Chief Executivecutivecutivecutivecutive Oe Oe Oe Oe Officfficfficfficfficererererer
Stefan Hetges started his career as a consultant at CambridgeTechnology Group. In 1993, he joined i-Cube as the firstemployee and was instrumental in the company’s growth andlater became responsible for i-Cube’s Europe an business. Thecompany grew to over $100 million in revenue and wentpublic in 1998. In 1999, i-Cube was acquired by razorfish. In2001, Stefan acquired the assets of i-Cube from razorfish in amanagement buy out and formed smartShift. Stefan has aMasters in Computer from University of Constance.
AAAAAnish Dhanda, Pnish Dhanda, Pnish Dhanda, Pnish Dhanda, Pnish Dhanda, Prrrrresidenesidenesidenesidenesidenttttt
Anish Dhanda is the President at CTE. He has over 19 yearsof domestic and international experience in businessstrategy, product design, technology innovation, sales &marketing, operations, and consulting. Anish has extensiveknowledge of technical and organizational development inboth startup and Fortune 500 organizations within thehealthcare, financial, media & entertainment, and IT/software industries. Anish started his career in productmanagement at Open Environment Corporation. He laterfounded netNumina Solutions and was instrumental inexpanding the Company to 180 employees. Prior to CTE,Anish was the CEO of DNSstuff.com, overseeing all aspectsof strategy, product management, engineering, andbusiness partnerships. He has also held senior executive rolesat New Tilt and GenArts. Anish received numerous honorsand awards, including Boston Magazine’s 40th anniversaryissue as one of the Forty People to Watch and the Premier100 IT Leaders in Computerworld. Anish holds BS in ElectricalEngineering from Lafayette College.
SSSSSamir Bhaamir Bhaamir Bhaamir Bhaamir Bhatia, Dirtia, Dirtia, Dirtia, Dirtia, Dirececececectttttor & Chief For & Chief For & Chief For & Chief For & Chief Financial Oinancial Oinancial Oinancial Oinancial Officfficfficfficfficererererer
Samir Bhatia has over 23 years of technology experience,profit & loss responsibility and building companies. He hasbeen a CxO at several startups including Founder Presidentat Tribiosys, Inc. a technology and processconsulting firmfor bio-techs and pharmaceuticals. He has launched manysoftware and electronic products from concept to successfulmarket penetration. More recently, as CIO at BostonAnalytics, a cross border research and analytics firm, he waspart of the executive management team with completefinancial responsibility and was instrumental in growing thecompany to 170 people.Samir holds Master’s degrees inComputer Science and Physics from Northeastern University.
AAAAArjun Choprrjun Choprrjun Choprrjun Choprrjun Chopra, Chief a, Chief a, Chief a, Chief a, Chief TTTTTechnology Oechnology Oechnology Oechnology Oechnology Officfficfficfficfficererererer
Arjun Chopra is the Chief Technology Officer at CTE. He isalso the CEO of Vox Holdings, a company he founded in 2006to spur the creation, consumption and monetizationof OpenSource Software. Arjun holds multiple technology patents,has worked extensively with Open Source Software for over
10 years and has held several technology development andmanagement positions in Consumer and Enterprise softwarecompanies, including Microsoft, Motive and IBCC. He has aBS in Computer Sciences with Highest Honors from TheUniversity of Texasat Austin, where he was an EndowedPresidential scholar, and an MBA from Harvard BusinessSchool, where he wasone of 32 nation-wide PD Soros Fellows.
JoerJoerJoerJoerJoerg g g g g WWWWWiririririrthmann, Sthmann, Sthmann, Sthmann, Sthmann, Senior enior enior enior enior VVVVVicicicicice Pe Pe Pe Pe Prrrrresidenesidenesidenesidenesident of St of St of St of St of Salesalesalesalesales, E, E, E, E, Eurururururopeopeopeopeope
Joerg Wirthmann joined CTE as part of the recent acquisitionof smartShift GmbH along with Stefan. At smartShift GmbH,Joerg was responsible for all world wide sales as well aschannel partnership establishment and management. Priorto smartShift GmbH, Joerg held senior sales positions atPeopleSoft, later acquired by Oracle,where he was in chargeof Oracle’s Application Business Unit. Joerg has over 15 yearsof experience in sales and management, with past positionsat leading IT enterprises, including IDS Scheer, People Soft,Unisys and Vantive. Joerg holds a Master’s Degree in ComputerScience from Technical University, Darmstadt and a Master’sin Business Administration from Schiller InternationalUniversity, Florida.
Jagdish NegJagdish NegJagdish NegJagdish NegJagdish Negi, Head of Ii, Head of Ii, Head of Ii, Head of Ii, Head of India salesndia salesndia salesndia salesndia sales
Jagdish Negi is responsible for leading CTE’s India Operationsand managing all project delivery out of the Hyderabad &Bangalore development centers. He has over 15 years ofexperience in the field of Telecom, Software developmentand delivery. Prior to CTE, Jagdish worked with Pune-basedPersistent Systems, where he managed multiple projects forUS based product development companies. He scaled hislast account from a 4-member unit to a 90+members teamwithin a short a span of six months. Prior to Persistent,Jagdish served in the Indian Air Force for 12 years and tookrelease while he was the head of the IT and InformationWarfare Cell in Maintenance Air Command. At IAF, heplanned, designed and implemented the biggest WANnetworks covering the whole of northern India. He was alsoinstrumental in conceptualization and development numberof software applications for the Operations, Maintenanceand Administration branches of the IAF. He holds a BS inComputer Science from National Institute of Technology,Allahabad.

AAAAAnnual Rnnual Rnnual Rnnual Rnnual Reporeporeporeporeporttttt 2011-2012 2011-2012 2011-2012 2011-2012 2011-2012
44444
NoticeNoticeNoticeNoticeNotice

AAAAAnnual Rnnual Rnnual Rnnual Rnnual Reporeporeporeporeporttttt 2011-2012 2011-2012 2011-2012 2011-2012 2011-2012
55555
NoticeNONONONONOTICETICETICETICETICE is hereby given that 13th Annual General Meeting of the Cambridge Technology Enterprises Limited will be heldon Friday, the 28th day of September, 2012 at 3:00 p.m. at Ruby Hall, 5th Floor, Quality Inn Pearl, Lumbini Layout, Gachibowli,Hyderabad 500 032 to transact the following business:-
OrOrOrOrOrdinardinardinardinardinary Business:y Business:y Business:y Business:y Business:
1. To receive, consider and adopt the Balance Sheet of the Company as at 31st March, 2012 and the Profit and LossAccount for the year ended on that date together with the Reports of Directors and Auditors’ thereon.
2. To appoint Stefan Hetges who retires by rotation and being eligible offers himself for re-appointment.
3. To appoint P. Murali & Co., Chartered Accountants, Hyderabad, the retiring Auditors, as Statutory Auditors of theCompany to hold office from the conclusion of this meeting till the conclusion of next Annual General Meeting andto authorize the Board to approve their remuneration.
Special Business:Special Business:Special Business:Special Business:Special Business:
4. To consider and if thought fit, to pass, with or without modification(s), the following resolution as an OrdinaryResolution:
“RESOLVED THAT Mallipudi Anand Pattabhiramkumar, who was appointed as an Additional Director of the Companyby the Board of Directors and who holds office upto the date of this Annual General Meeting in pursuance to section260 of the Companies Act, 1956 and in respect of whom the Company has, under section 257 of the said Act, receivednotice in writing proposing his candidature for the office of the Director, be and is hereby appointed as Director ofthe Company liable to retire by rotation”.
5. To consider and if thought fit, to pass, with or without modification(s), the following resolution as an OrdinaryResolution:
“RESOLVED THAT Motaparthy Venkateswara Rao Kasi, who was appointed as an Additional Director of the Companyby the Board of Directors and who holds office upto the date of this Annual General Meeting in pursuance to section260 of the Companies Act, 1956 and in respect of whom the Company has, under section 257 of the said Act, receivednotice in writing proposing his candidature for the office of the Director, be and is hereby appointed as Director ofthe Company liable to retire by rotation”.
For and on behalf of the Board
Sd/-Place: Hyderabad V Ramana ReddyDate : 13th August, 2012 Company Secretary

AAAAAnnual Rnnual Rnnual Rnnual Rnnual Reporeporeporeporeporttttt 2011-2012 2011-2012 2011-2012 2011-2012 2011-2012
66666
NotNotNotNotNotes:es:es:es:es:
1. A member of the Company entitled to attend and vote at the meeting is entitled to appoint a proxy to attend andvote instead of himself and the proxy need not be a member of the Company.
2. The Proxy form, in order to be effective, must be deposited at the registered office of the Company not less than 48hours before commencement of the meeting.
3. The Register of Members and Share Transfer books shall remain closed from Friday, the 21st day of September, 2012to Friday, the 28th day of September, 2012 (both days inclusive).
4. All documents referred to in the notice are open for inspection at the registered office of the Company between11.00 a.m. to 1.00 p.m. on any working day prior to the date of the meeting and also at the meeting venue.
5. The members holding shares in the dematerialized mode are requested to intimate all changes with respect to theirbank details, mandate, nomination, power of attorney, change of address, change in name etc., to their DepositoryParticipant (DP). These changes will be automatically reflected in the Company’s records which will help the Companyto provide efficient and better service to the members.
6. Members desiring to seek any information/clarifications on the annual accounts are requested to write to the Companyat least 7 (Seven) days before the date of AGM to enable the management to compile and keep the informationready.
7. Corporate members intending to send their Authorized Representatives to attend the meeting are requested tosend a duly certified copy of the Board Resolution authorizing their representatives to attend and vote at the meeting.
8. Members/proxies are requested to bring their copies of Annual Reports to the meeting. Copies of Annual Reportswill not be provided at the meeting.
9. Physical Share Transfers – PAN Copy:
Investors are requested to note that in terms of SEBI Directives, in case of private transaction involving transfer ofshares in physical form of listed companies, it shall be mandatory for the transferee(s) to furnish copy of PAN Card tothe Company/RTAs for registration of such transfer of shares.

AAAAAnnual Rnnual Rnnual Rnnual Rnnual Reporeporeporeporeporttttt 2011-2012 2011-2012 2011-2012 2011-2012 2011-2012
77777
EXPLANATORY STATEMENT(PURSU(PURSU(PURSU(PURSU(PURSUANT ANT ANT ANT ANT TTTTTO SECO SECO SECO SECO SECTION 173(2) OF TION 173(2) OF TION 173(2) OF TION 173(2) OF TION 173(2) OF THE CTHE CTHE CTHE CTHE COMPOMPOMPOMPOMPANIES AANIES AANIES AANIES AANIES ACCCCCTTTTT, 1956), 1956), 1956), 1956), 1956)
IIIIItttttem Noem Noem Noem Noem No. 4. 4. 4. 4. 4
Mallipudi Anand Pattabhiramkumar was appointed as an Additional Director to occupy the position as an IndependentDirector in Board meeting held on 13th February, 2012. In terms of 260 of the Companies Act, 1956, Mallipudi AnandPattabhiramkumar holds office up to the date of this Annual General Meeting of the Company.
Notice under section 257 of the Companies Act, 1956 has been received from a member of the Company along with therequisite deposit proposing the candidature of Mallipudi Anand Pattabhiramkumar, for the office of Director of the Company.
None of the directors except Mallipudi Anand Pattabhiramkumar is deemed to be interested or concerned in the saidresolution.
The profile of Mallipudi Anand Pattabhiramkumar is mentioned in the Corporate Governance section of this Annual Report,which may be treated as notice under section 302 of the Companies Act, 1956.
Your Directors commend the resolution for approval.
IIIIItttttem Noem Noem Noem Noem No.5.5.5.5.5
Motaparthy Venkateswara Rao Kasi was appointed as an Additional Director to occupy the position as an IndependentDirector in Board meeting held on 13th February, 2012. In terms of 260 of the Companies Act, 1956, Motaparthy VenkateswaraRao Kasi holds office up to the date of this Annual General Meeting of the Company.
Notice under section 257 of the said Act has been received from a member of the Company along with the requisitedeposit proposing the candidature of Motaparthy Venkateswara Rao Kasi, for the office of director whose term is liable toretire by rotation.
None of the directors except Motaparthy Venkateswara Rao Kasi is deemed to be interested or concerned in the saidresolution.
The profile of Motaparthy Venkateswara Rao Kasi is mentioned in the Corporate Governance section of this Annual Report,which may be treated as notice under section 302 of the Companies Act, 1956.
Your Directors commend the resolution for approval.
For and on behalf of the Board
Sd/-Place: Hyderabad V Ramana ReddyDate : 13th August, 2012 Company Secretary

AAAAAnnual Rnnual Rnnual Rnnual Rnnual Reporeporeporeporeporttttt 2011-2012 2011-2012 2011-2012 2011-2012 2011-2012
88888
DirDirDirDirDirectors’ Reportectors’ Reportectors’ Reportectors’ Reportectors’ Report

AAAAAnnual Rnnual Rnnual Rnnual Rnnual Reporeporeporeporeporttttt 2011-2012 2011-2012 2011-2012 2011-2012 2011-2012
99999
Directors’ ReportDear Shareholders,
We are happy to present on behalf of the Board of Directors, the 13th Directors’ Report along with the Balance Sheet, andProfit and Loss Account for the year ended 31st March, 2012.
FFFFFinancial Pinancial Pinancial Pinancial Pinancial Perererererfffffororororormancmancmancmancmanceeeee
Key elements of financial performance of Cambridge Technology Enterprises Limited (CTEL) on consolidated and standalone basis is as below:
(` in millions)
S.NoS.NoS.NoS.NoS.No..... P P P P Parararararticularsticularsticularsticularsticulars C C C C Consolidaonsolidaonsolidaonsolidaonsolidattttted Red Red Red Red Resultsesultsesultsesultsesults S S S S Standalone Rtandalone Rtandalone Rtandalone Rtandalone Resultsesultsesultsesultsesults
FY 2012FY 2012FY 2012FY 2012FY 2012 FY 2011FY 2011FY 2011FY 2011FY 2011 FY 2012FY 2012FY 2012FY 2012FY 2012 FY 2011FY 2011FY 2011FY 2011FY 2011
1 Revenue from operations 749.98 589.10 307.94 327.62
2 Expenses (736.81) (692.78) (196.09) (205.55)
3 Depreciation & Amortization (98.41) (108.49) (83.05) (96.75)
4 Profit from operations before interest, other income (85.24) (212.17) 28.79 25.32and exceptional items
5 Finance Charges (28.99) (22.12) (5.36) (9.52)
6 Other Income 23.02 50.42 20.65 2.85
7 Impairment of intangible assets (44.52) - (30.25) -
8 Impairment of goodwill (458.10) - - -
9 Prior period expenses 15.02 3.72 15.01 3.72
10 Change in carrying value of investments - - (37.78) -
11 Profit from Ordinary Activities Before Tax (578.81) (180.15) (8.93) 22.37
12 Tax Expense 9.49 (5.12) 10.53 (3.92)
13 Net Profit (569.32) (185.27) 1.60 18.45
14 Profit & Loss Account Balance Brought Forward (124.86) 60.42 199.21 180.76
15 Amount Available for Appropriation (694.19) (124.86) 200.82 199.21
16 Balance in Profit & Loss Account (694.19) (124.86) 200.82 199.21
a. CCCCConsolidaonsolidaonsolidaonsolidaonsolidattttted Red Red Red Red Results fesults fesults fesults fesults for FY 2012or FY 2012or FY 2012or FY 2012or FY 2012
Your Company has achieved a turnover of ` 749.98 Mn for the year ended 31st March, 2012, as against a turnover of` 589.10 Mn in the previous year and posted operating loss of ` 85.24 Mn versus an operating loss of ` 212.17 Mnrecorded in the previous financial year. Net Loss for the year ended 31st March, 2012 was ` 569.32 Mn, and the samewas ` 185.27 Mn, for the year ended 31st March, 2011. Detailed analysis of consolidated financial statements is givenin Management Discussion and Analysis Report forming part of this Annual Report.

AAAAAnnual Rnnual Rnnual Rnnual Rnnual Reporeporeporeporeporttttt 2011-2012 2011-2012 2011-2012 2011-2012 2011-2012
1010101010
b. SSSSStandalontandalontandalontandalontandalone Re Re Re Re Results fesults fesults fesults fesults for FY 2012or FY 2012or FY 2012or FY 2012or FY 2012
CTEL has achieved a turnover of ` 307.94 Mn for the year ended 31st March, 2012, as against a turnover of ` 327.62Mn in the previous year. The Company posted an operating profit of ` 28.79 Mn for the year under review, whereas itwas ` 25.32 Mn in the year ending 31st March, 2011. Net Profit for the year ended 31st March, 2012 was ` 1.60 Mn, andthe same was ` 18.45 Mn, for the year ended 31st March, 2011. Detailed analysis of standalone financial statements isgiven in Management Discussion and Analysis Report forming part of this Annual Report.
DividendDividendDividendDividendDividend
Keeping in view the difficult operating environment that prevailed in the year gone by and the expected cash flowrequirements for the future growth of the Company, your Directors were not able to recommend any dividend for thefinancial year ended 31st March, 2012.
EmploEmploEmploEmploEmployyyyyee See See See See Stttttock Option Sock Option Sock Option Sock Option Sock Option Schemechemechemechemecheme
The details of employee stock option as on 31st March, 2012 are given as Annexure-1 to this report, as per Securities andExchange Board of India (Employee Stock Option Scheme and Employee Stock Purchase Scheme) Guidelines, 1999.
CCCCCorororororporporporporporaaaaattttte Ge Ge Ge Ge Gooooovvvvvererererernancnancnancnancnance Re Re Re Re Reporeporeporeporeporttttt
A detailed report on the Corporate Governance practices of the Company is given as a separate section in this annualreport.
MMMMManagemenanagemenanagemenanagemenanagement Discussion and At Discussion and At Discussion and At Discussion and At Discussion and Analynalynalynalynalysis Rsis Rsis Rsis Rsis Reporeporeporeporeporttttt
A detailed Management Discussion and Analysis is provided in the annual report, as a separate report.
SubsidiarSubsidiarSubsidiarSubsidiarSubsidiary Cy Cy Cy Cy Companiesompaniesompaniesompaniesompanies
Your Company has two direct wholly owned subsidiary viz., smartShiftgroup Limited (formerly Cambridge TechnologyEnterprises – Mauritius Limited), Mauritius and Cambridge Technology India Private Limited (formerly Q-soft Systems &Solutions Private Limited), Bangalore and three step-down subsidiary Companies viz., Vox Holdings Inc., USA, SmartshiftGmbH, Germany and Cambridge Technology Enterprises Inc., USA as on 31st March, 2012.
The members may refer to the statement under Section 212 of the Companies Act, 1956 and information on the financialsof subsidiaries appended to the above statement under Section 212 of the Companies Act, 1956 in this Annual Report forfurther information on these subsidiaries.
The Ministry of Corporate Affairs vide its General circular has laid down a set of conditions upon fulfillment of which,Ministry has conferred automatic exemption from attaching subsidiary financials to the financials of the Company for thefinancial year 2011-12. Your company has complied with those conditions and hence consolidated financials with rupeeequivalents, where ever applicable are made available in this annual report.
The members desiring to obtain a copy of the financials of the Subsidiary Companies may write to the Company Secretaryat the registered office of the Company.
DirDirDirDirDirececececectttttorsorsorsorsors’’’’’ R R R R Responsibilitesponsibilitesponsibilitesponsibilitesponsibility Sy Sy Sy Sy Statatatatatttttemenemenemenemenementtttt
In terms of Section 217(2AA) of the Companies Act, 1956, your Directors confirm as under:
i. In preparation of Annual Accounts, the applicable Accounting Standards have been followed along with properexplanation relating to material departures;
ii. We have selected such accounting policies and applied them consistently and made judgments and estimates thatare reasonable and prudent so as to give a true and fair view of the state of affairs of the Company at the end of thefinancial year 2011-12 and of profit of the Company for that period;
AAAAAnnual Rnnual Rnnual Rnnual Rnnual Reporeporeporeporeporttttt 2011-2012 2011-2012 2011-2012 2011-2012 2011-2012
1111111111
iii. We have taken proper and sufficient care for the maintenance of adequate accounting records in accordance withthe provisions of this Act for safeguarding the assets of the Company and for preventing and detecting fraud andother irregularities; and
iv. We have prepared the annual accounts on an on-going concern basis.
FFFFFixixixixixed Ded Ded Ded Ded Depositsepositsepositsepositseposits
Your Company had not accepted any fixed deposits under Section 58A of the Companies Act, 1956 and hence no amountof principal or interest was outstanding as on the Balance Sheet date.
DirDirDirDirDirececececectttttorsorsorsorsors
Stefan Hetges, Whole-Time Director and CEO retire by rotation at the ensuing Annual General Meeting and being eligible,offers himself for re-appointment.
During the year under review Dr. Prem Singh Rana and Krishen Kumar Dhar, Independent directors, had expressed theirdesire to resign from the Board due to other pursuits, in the Board Meeting held on 3rd October, 2011. The Board placed onrecord its appreciation for the services rendered by them and accepted their resignations with w.e.f. 13th September,2011.
Mallipudi Anand Pattabhiramkumar and Motaparthy Venkateswara Rao Kasi have been appointed as Additional Directorsto occupy the position of independent Directors, in the Board Meeting held on 13th February, 2012. Both these AdditionalDirectors hold office upto the conclusion of this Annual General Meeting.
Mallipudi Anand Pattabhiramkumar and Motaparthy Venkateswara Rao Kasi are proposed to be appointed as Director inthe Annual General Meeting and notice under Section 257 of the Companies Act 1956 has been received from a memberproposing their appointment.
The brief profile of the Board members is given in the Corporate Governance section of this Annual Report.
AAAAAuditudituditudituditorsorsorsorsors
The Statutory Auditors of the Company P Murali & Co., Chartered Accountants retiring at this Annual General Meetinghave confirmed their eligibility and willingness to accept the office of Statutory Auditors, if re-appointed for the nextfinancial year. The Audit Committee and the Board of Directors recommend P Murali & Co., as the Statutory Auditors of theCompany for the financial year 2012-13 subject to the shareholders approval.
PPPPParararararticulars of Emploticulars of Emploticulars of Emploticulars of Emploticulars of Employyyyyeeseeseeseesees
Pursuant to the provisions of Section 217(2A) of the Companies Act, 1956 read with Companies (Particulars of Employees)Rules, 1975, the names and other particulars of employees are not applicable.
CCCCConseronseronseronseronservvvvvaaaaation of enertion of enertion of enertion of enertion of energygygygygy, t, t, t, t, technology absorechnology absorechnology absorechnology absorechnology absorption, fption, fption, fption, fption, forororororeigeigeigeigeign en en en en exxxxxchange earchange earchange earchange earchange earnings and outnings and outnings and outnings and outnings and outgo:go:go:go:go:
The particulars as prescribed under Section 217(1)(e) of the Companies Act, 1956 read with the Companies (Disclosure ofparticulars in the report of Board of Directors) Rules, 1988 are set out in Annexure – 2 to the Directors’ Report.

AAAAAnnual Rnnual Rnnual Rnnual Rnnual Reporeporeporeporeporttttt 2011-2012 2011-2012 2011-2012 2011-2012 2011-2012
1212121212
AAAAAckckckckcknononononowledgemenwledgemenwledgemenwledgemenwledgementtttt
Your Board places on record its sincere appreciation for the significant contribution made by the employees through theirdedication, hard work and commitment and standing by us through the difficult times and for the trust reposed in us byour clients.
Your Directors also acknowledge the support and wise counsel extended to us by the analysts, bankers, governmentagencies and shareholders at large. We look forward to having the same support in our endeavor to serve our clientsbetter.
For Cambridge Technology Enterprises Limited
Sd/- Sd/-D.R.R. Swaroop L. Sridhar
Whole- Time Director Director
Place : HyderabadDate : 13th August, 2012

AAAAAnnual Rnnual Rnnual Rnnual Rnnual Reporeporeporeporeporttttt 2011-2012 2011-2012 2011-2012 2011-2012 2011-2012
1313131313
Annexure to the Director’s ReportAAAAAnnennennennennexurxurxurxurxure - 1e - 1e - 1e - 1e - 1
Pursuant to the provisions of Guideline 12 of the Securities and Exchange Board of India (Employee Stock Option Schemeand Employee Stock Purchase Scheme), Guidelines, 1999, as amended, the details of stock options as on 31st March , 2012under CTEL Employee Stock Option Scheme 2006 and CTEL Employee Stock Option Scheme 2008 and CTEL ESOP Scheme2011 are as under:
SummarSummarSummarSummarSummary of stay of stay of stay of stay of status of ESOPtus of ESOPtus of ESOPtus of ESOPtus of ESOPs gs gs gs gs grrrrranananananttttted:ed:ed:ed:ed:
S.NoS.NoS.NoS.NoS.No..... P P P P Parararararticularsticularsticularsticularsticulars CCCCCTEL EmploTEL EmploTEL EmploTEL EmploTEL Employyyyyee See See See See Stttttockockockockock CCCCCTEL EmploTEL EmploTEL EmploTEL EmploTEL Employyyyyee See See See See Stttttockockockockock CCCCCTEL ESOPTEL ESOPTEL ESOPTEL ESOPTEL ESOPOption SOption SOption SOption SOption Scheme – 2006cheme – 2006cheme – 2006cheme – 2006cheme – 2006 Option S Option S Option S Option S Option Scheme - 2008cheme - 2008cheme - 2008cheme - 2008cheme - 2008 S S S S Scheme 2011cheme 2011cheme 2011cheme 2011cheme 2011
1 Approved options 1,500,000 1,500,000 1,045,000
2 Options Granted 1,236,542 1,500,000 624,000
3 Options vested 176,938 168,360 140,000
4 Options unvested 15,600 127,500 389,000
5 Options exercised 19,388 919,614 Nil
6 Options lapsed 1,024,616 284,526 95,000
7 Total number of options in force 192,538 295,860 529,000
8 Variation in terms of ESOP Clause for recovery of Not Applicable Not ApplicableFBT from employeesincorporated
9 Total number of shares arising as a Nil (exercised shares Nil (exercised shares Not Applicableresult of exercise of options issued from the CTEL issued from the CTEL
ESOP Trust) ESOP Trust)
11 Money realized by exercise of 2,532,092 Nil Niloptions (`)
12 Diluted EPS pursuant to issue Nil (exercised ESOPs were Not Applicable Not Applicableof shares on exercise of option issued from CTEL ESOPcalculated in accordance with Trust, already outstandingAS 20 in the issued capital
13 A description of the method and significant assumptions used during the year to estimate the fair values of theoptions:
D D D D Descrescrescrescrescriptioniptioniptioniptioniption D D D D Detailsetailsetailsetailsetails
i. Risk free interest rate 6.73% - 7.85%
ii. Expected life 3 – 4 years
iii. Expected volatility 63.77% to 72.66%
iv. Expected dividends 0 %
v. The price of the underlying share in market Market Priceat the time of option grant
A description of the method and significantassumptions used during the year to estimate thefair values of the options, including the followingweighted average information:
The Fair value of options was calculated using the BlackScholes option pricing model. The followingassumptions have been used:

AAAAAnnual Rnnual Rnnual Rnnual Rnnual Reporeporeporeporeporttttt 2011-2012 2011-2012 2011-2012 2011-2012 2011-2012
1414141414
A.A.A.A.A. EmploEmploEmploEmploEmployyyyyee - wise details of options gee - wise details of options gee - wise details of options gee - wise details of options gee - wise details of options grrrrranananananttttted ted ted ted ted to :o :o :o :o :
a. Senior managerial personnel:
Name of the EmploName of the EmploName of the EmploName of the EmploName of the Employyyyyeeeeeeeeee D D D D Desigesigesigesigesignananananationtiontiontiontion ExExExExExererererercise prcise prcise prcise prcise priciciciciceeeee NoNoNoNoNo. of options. of options. of options. of options. of optionsper optionper optionper optionper optionper option gggggrrrrrananananantttttededededed
Anish Dhanda President Enterprise America Rs. 8.85 1,00,000
Gregory Sabatino CTO - Enterprise America Rs. 8.85 1,00,000
TTTTTOOOOOTTTTTALALALALAL 2,00,0002,00,0002,00,0002,00,0002,00,000
b. Any other employee who received a grant in any one year of options amounting to 5% or more options grantedduring the year:
Name of the EmploName of the EmploName of the EmploName of the EmploName of the Employyyyyeeeeeeeeee D D D D Desigesigesigesigesignananananationtiontiontiontion ExExExExExererererercise prcise prcise prcise prcise priciciciciceeeee NoNoNoNoNo. of options. of options. of options. of options. of optionsper optionper optionper optionper optionper option gggggrrrrrananananantttttededededed
Anish Dhanda President Enterprise America Rs. 8.85 1,00,000
Gregory Sabatino CTO - Enterprise America Rs. 8.85 1,00,000
Jeremy D Koempel* Director - Creative Services, USA Rs. 7.00 65,000
TTTTTOOOOOTTTTTALALALALAL 2,65,0002,65,0002,65,0002,65,0002,65,000
*Resigned w.e.f 30th April, 2012
c. Identified employees who were granted options during any one year equal to or exceeding 1% of issued capital(excluding outstanding warrants and conversions) of the Company at the time of grant:
- Not Applicable -
BBBBB..... WWWWWeigheigheigheigheighttttted aed aed aed aed avvvvverererererage eage eage eage eage exxxxxererererercise prcise prcise prcise prcise pricicicicice fair ve fair ve fair ve fair ve fair value of options galue of options galue of options galue of options galue of options grrrrranananananttttted dured dured dured dured during the ying the ying the ying the ying the year whose:ear whose:ear whose:ear whose:ear whose:
1 Exercise price equals market price Yes
2 Exercise price is greater than market price Nil
3 Exercise price is less than market price Nil
C.C.C.C.C. The stock based compensation cost calculated as per the fair value method prescribed by SEBI, to be recognized inthe financial statements for the year 2011-12 would be ` Nil.

AAAAAnnual Rnnual Rnnual Rnnual Rnnual Reporeporeporeporeporttttt 2011-2012 2011-2012 2011-2012 2011-2012 2011-2012
1515151515
AAAAAnnennennennennexurxurxurxurxure – 2e – 2e – 2e – 2e – 2
CCCCConseronseronseronseronservvvvvaaaaation of enertion of enertion of enertion of enertion of energygygygygy, t, t, t, t, technology absorechnology absorechnology absorechnology absorechnology absorption, fption, fption, fption, fption, forororororeigeigeigeigeign en en en en exxxxxchange earchange earchange earchange earchange earnings and outnings and outnings and outnings and outnings and outgogogogogo
The particulars as prescribed under Section 217(1)(e) of the Companies Act, 1956 read with the Companies (Disclosure ofparticulars in the Report of Board of Directors) Rules 1988 are as under:
1. Conservation of Energy:
Software Industry is not power intensive. However, your company is working towards being environment friendlyand has taken adequate measures to conserve energy, wherever possible.
2. Technology Absorption:
Provision of state of the art communication facilities to all software development centers and total technology solutionsto its clients contribute to technology absorption and innovation.
3. Foreign Exchange Earnings and Outgo:
(` in millions)
P P P P Parararararticularsticularsticularsticularsticulars 2011-122011-122011-122011-122011-12 2010-112010-112010-112010-112010-11
Foreign Exchange Earnings 295.39 329.89
Foreign Exchange Outgo 78.51 75.72
For Cambridge Technology Enterprises Limited
Sd/- Sd/-D.R.R. Swaroop L. Sridhar
Whole-Time Director Director
Place : HyderabadDate : 13th August, 2012

AAAAAnnual Rnnual Rnnual Rnnual Rnnual Reporeporeporeporeporttttt 2011-2012 2011-2012 2011-2012 2011-2012 2011-2012
1616161616
Management DiscussionManagement DiscussionManagement DiscussionManagement DiscussionManagement Discussionandandandandand
Analysis ReportAnalysis ReportAnalysis ReportAnalysis ReportAnalysis Report

AAAAAnnual Rnnual Rnnual Rnnual Rnnual Reporeporeporeporeporttttt 2011-2012 2011-2012 2011-2012 2011-2012 2011-2012
1717171717
CCCCCTE and CloudTE and CloudTE and CloudTE and CloudTE and Cloud
The cloud continues to ‘pick up steam’ in 2012. The numberof customers using the cloud continues to grow, and, as aconsequence, CTE has focused on addressing thechallenges customers face as they look to leverage thisparadigm shift.
There are several options that companies are faced withtoday. Does the cloud make sense? What savings and ROIcan be expected? Which applications are good candidatesfor moving? What are the risks? What are the securityconsiderations? Compliance considerations? What aboutPrivate Clouds? CTE is focused on extending its strategyservices to help companies get the most benefits out of theCloud Computing revolution. CTE will work closely withcustomers to assist them in determining the optimal pathto the cloud.
CTE has also begun to develop a tremendous amount ofintellectual property to assist companies in transformingtheir existing applications to cloud-based solutions. Thesecould involve migrating business logic and data fromexisting system to 3rd party ‘Software-as-a-Service’applications like Salesforce.com and SuccessFactors, or bymoving existing applications like SAP or Pega to cloud-based implementations of the same.
CTE’s smartShift offering is focused on enhancing itspatented solutions to address these use cases, and CTE hasalready seen success with several customers here.
Once the applications are running in the cloud, CTE’sCloudEnable service offering will deliver SLA-driven 24/7Managed Services to the customers, so they can focus ontheir business and not have to worry about the security andavailability of their applications.
By focusing on the entire lifecycle of services, CTE continuesto offer a comprehensive suite of solutions to customerswho wish to truly leverage the cloud for their business.
TTTTTrrrrrends in IT serends in IT serends in IT serends in IT serends in IT servicvicvicvicvices in 2012es in 2012es in 2012es in 2012es in 2012
Some of the major trends in the post economic recessionworld include outsourcing and the expansion of cloudservices, especially transforming existing applications to thecloud, cloud maintenance and infrastructure services. Forinstance, the traditional in-house vis-à-vis outsourcedservices have gone through a major shift as more and moreapplications have moved to the cloud. In the last yearsmostly start-ups and new applications have been usingcloud services, enterprises start looking today on how toleverage the financial benefits on the cloud enterprise wide.Enterprise wide strategies and roadmaps need to bedesigned to build the future. Since this is blurring the lines
between in-house and web-based/outsourced services, ITmanagers are moving more towards a Cloud model. This isalso changing the whole notion about software lifecyclemanagement since application might move to SaaS modelsor in-house applications need to provide 24*7*365availability.
CCCCCTE’TE’TE’TE’TE’s offs offs offs offs offerererererings:ings:ings:ings:ings:
1.1.1.1.1. CloudCloudCloudCloudCloud, SAP and En, SAP and En, SAP and En, SAP and En, SAP and Enttttterererererprprprprprise Aise Aise Aise Aise Apppppplicaplicaplicaplicaplicationstionstionstionstions
MMMMMarararararket Opket Opket Opket Opket Opporporporporportunitiestunitiestunitiestunitiestunities
The overall trends in the SAP landscape in 2012 includean increasing thrust on application lifecyclemanagement, business intelligence and performancemanagement, enterprise information management,business process management, integration andcollaboration, custom development, security,compliance, identity and access management andmobile. In addition SAP has committed to Cloudservices and in recent acquisitions expands services tothe cloud. Existing application need to be madesecurity and transformation to in-memory databaseslike SAP HANA is happening today.
CTE provides an array of enterprise solutions includingApplication Transformation, Application Development,BPO, Training, Oracle DB/MW applicationmanagement, Oracle application support, and Hostingand Managed solutions.
2.2.2.2.2. AAAAApppppplicaplicaplicaplicaplication tion tion tion tion TTTTTrrrrransfansfansfansfansfororororormamamamamationtiontiontiontion
CTE can look at experience in transforming businessapplications to new technology paradigms fordecades. The experience combined with the uniqueapproach to analyze applications and rate thefeasibility to move them to the cloud, positions CTE asa valuable player for enterprises to establish cloudroadmaps and strategies.
With our technical knowledge and tools we offer alsothe implementation of the defined strategies so ourcustomers can worry about their core business whilewe modernize their IT to run with lower cost.
3.3.3.3.3. AAAAApppppplicaplicaplicaplicaplication Dtion Dtion Dtion Dtion Devevevevevelopmenelopmenelopmenelopmenelopmenttttt
CCCCCambrambrambrambrambridge Cidge Cidge Cidge Cidge Collaborollaborollaborollaborollaboraaaaativtivtivtivtive De De De De Delivelivelivelivelivererererery™y™y™y™y™
CTE’s unique CCD™ methodology combines intensiveworkshops, solution visualization, and spiral-basedRapid Application Development (RAD) to achievedemonstrable value in short business cycles. Thecompany further provides custom solutions when thedemand arises.

AAAAAnnual Rnnual Rnnual Rnnual Rnnual Reporeporeporeporeporttttt 2011-2012 2011-2012 2011-2012 2011-2012 2011-2012
1818181818
4.4.4.4.4. BPOBPOBPOBPOBPO
CTE provides BPO services across various verticalsincluding the energy sector, employee verificationservices, SAS and CRM support, image measurementservices as well as human genome services. Thecompany provides data entry and analysis services,customer support, database creation and employeeverification services. In 2011 CTE had added one moreclient to its portfolio, Click Software. The company hasalso expanded the strength of its Pictometry Projectteam beyond 130.
5.5.5.5.5. TTTTTrrrrraining including Cloud aining including Cloud aining including Cloud aining including Cloud aining including Cloud TTTTTrrrrranininganininganininganininganining
CTE’s training processes include both executiveworkshops and training for cloud computing.
a.a.a.a.a. CCCCCambrambrambrambrambridge Exidge Exidge Exidge Exidge Executivecutivecutivecutivecutive e e e e WWWWWorororororkshops (kshops (kshops (kshops (kshops (CECECECECEWWWWWs):s):s):s):s):
An integral part of CCI’s (CTE Center ofInnovation) unique Cambridge CollaborativeDelivery™ (CCD™) methodology, CEWs enablesclient enterprises to envision customizedbusiness solutions. Through CEWs, the CCIprovides a forum for rapid identification,development and presentation of innovative,technology-driven solutions to businessproblems.
bbbbb..... UnivUnivUnivUnivUniversitersitersitersitersity of Cloud:y of Cloud:y of Cloud:y of Cloud:y of Cloud:
On July 5, 2011 CTE launched The University ofCloud (UoC), in partnership with Q-Soft. Thiseducational program reflects CTE’s deep focusand expertise in Cloud-based technologies, withsuccesses in managing mission-critical Cloud-based applications for Fortune 500 organizationsand top-tier ISVs worldwide.
6.6.6.6.6. OrOrOrOrOracle DB/MW apacle DB/MW apacle DB/MW apacle DB/MW apacle DB/MW applicaplicaplicaplicaplication managemention managemention managemention managemention managementtttt
The intent of application management is to providethe customers with the Quality Support Services theyneed.
a.a.a.a.a. MMMMMiddlewiddlewiddlewiddlewiddlewararararare Me Me Me Me Managemenanagemenanagemenanagemenanagementtttt
CTE provides support around Oracle’s FusionMiddleware products, with special focus onEnterprise Application Server (Oracle ApplicationServer), Systems Management, BusinessIntelligence, User Interaction, IdentityManagement and Process Management tools.
bbbbb..... OrOrOrOrOracle Aacle Aacle Aacle Aacle Apppppplicaplicaplicaplicaplication Stion Stion Stion Stion Sererererervvvvver Super Super Super Super Supporporporporporttttt
Oracle application server support is anintegrated, standard-based software platformthat delivers personalized applications throughenterprise portals and mobile devices. It provides
Real-Time Business Intelligence, IntegratedApplications and Automated Business Processeswhich enables organizations of all sizes to bemore responsive to changing businessrequirements. CTE provides the followingservices:
� Oracle Application Server Deployment ScenarioPlanning, Installation and Configuration of allComponents, Administration Services /Maintenance;
� Implementation of Oracle HTTP Server, WebCache, Clustering Implementation of Security,Back-up Strategy;
� Deployment of J2EE and Oracle Forms andReports, PL / SQL, CGI and PERL Applications,Migration of Active Server Payer onto 9iAS/10gAS
� Performance Tuning of all 9iAS/10gASComponents
� Other activities like Application of Patches andBug Fixtures, Recovery of Database, etc.
7.7.7.7.7. OrOrOrOrOracle apacle apacle apacle apacle applicaplicaplicaplicaplication suption suption suption suption supporporporporporttttt
OrOrOrOrOracle Aacle Aacle Aacle Aacle Apppppplicaplicaplicaplicaplication Stion Stion Stion Stion Sererererervvvvver Super Super Super Super Supporporporporporttttt
Oracle application server support is an integrated,standard-based software platform that deliverspersonalized applications through enterprise portalsand mobile devices provide Real-Time BusinessIntelligence, Integrated Applications and AutomatedBusiness Processes, which enables organizations of allsizes to be more responsive to changing businessrequirements.
8.8.8.8.8. Hosting and MHosting and MHosting and MHosting and MHosting and Managed solutionsanaged solutionsanaged solutionsanaged solutionsanaged solutions
CTE provides a complete managed services solutionthat include hosting of the existing hardware,provisioning new hardware for internet & networkconnectivity, monitor servers, network, database andapplications to ensure system availability meeting theservice level expectation.
CCCCCTE’TE’TE’TE’TE’s hosting and managemens hosting and managemens hosting and managemens hosting and managemens hosting and management port port port port portft ft ft ft folio aolio aolio aolio aolio at at at at at aglancglancglancglancglance:e:e:e:e:
a.a.a.a.a. AAAAApppppplicaplicaplicaplicaplication Hosting and Mtion Hosting and Mtion Hosting and Mtion Hosting and Mtion Hosting and Mainainainainaintttttenancenancenancenancenance:e:e:e:e:
CTE installs, deploys, and maintains applicationsand databases. L1, L2, and L3 supports areprovided as part of maintenance and support.
bbbbb..... AAAAApppppplicaplicaplicaplicaplication and Dation and Dation and Dation and Dation and Database Mtabase Mtabase Mtabase Mtabase Monitonitonitonitonitorororororing Sing Sing Sing Sing Sererererervicvicvicvicvice:e:e:e:e:
CTE takes responsibility for monitoring ourcustomers’ applications and databases to ensurethat they operate properly and continuously on

AAAAAnnual Rnnual Rnnual Rnnual Rnnual Reporeporeporeporeporttttt 2011-2012 2011-2012 2011-2012 2011-2012 2011-2012
1919191919
a 24x7 basis. We also ensure support for optimumperformance, reliability and availability.
ccccc..... SSSSSererererervvvvver Mer Mer Mer Mer Managemenanagemenanagemenanagemenanagement:t:t:t:t:
CTE provides 24x7 operating system and serverhardware monitoring and management services,as well as the provisioning, monitoring, andmanagement of storage area networks (SANs).
ddddd..... FFFFFiririririrewewewewewall Mall Mall Mall Mall Managemenanagemenanagemenanagemenanagement:t:t:t:t:
CTE provides a well-managed firewall servicewhen hosting customer applications that requirea high degree of security protection andmonitoring. This solution includes the installationand configuration of the system, ongoingmanagement and the monitoring andmaintenance of the system.
eeeee..... NetNetNetNetNetwwwwwororororork Sk Sk Sk Sk Sererererervicvicvicvicvices:es:es:es:es:
CTE actively monitors and manages the datacenter network infrastructure, including theaccess-layer Ethernet switches that connect thecustomer servers. CTE provides hardwaremaintenance, change management and patchmanagement service on a 24x7 basis.
CTE network services provide co-locationcustomers with custom network design,installation and ongoing network supportservices.
CTE also performs 24x7 monitoring of networkinfrastructure components, such as core routersand switches, distribution and access switchesand load balancing switches.
fffff..... BackBackBackBackBackup Mup Mup Mup Mup Managemenanagemenanagemenanagemenanagement:t:t:t:t:
CTE provides 24x7 backup services for files anddatabases on CTE-managed servers. With ourbackup services, CTE provides other ongoingservices such as the backup and restoration offiles, monitoring backup processes, problemmanagement and change management.
ggggg..... CCCCCustustustustustomer Comer Comer Comer Comer Cararararare Pe Pe Pe Pe Pororororortal:tal:tal:tal:tal:
CTE provides a secure, web-based applicationand systems management portal. We providebest-of-breed tools that support the detectionand diagnosis of events affecting theperformance and availability of customers’applications and systems. We utilize a moreefficient process of handling service requests, to
facilitate collaborative management betweenmultiple interested parties.
h.h.h.h.h. CCCCConneconneconneconneconnectivittivittivittivittivityyyyy:::::
CTE offers several managed services that providehigh-speed Internet access and private-lineconnectivity (P2P). CTE offers multi-megabitInternet connectivity (IP Connectivity) at varyinglevels of bandwidth, price and redundancy tomeet the customer’s requirements
TTTTThrhrhrhrhreaeaeaeaeats:ts:ts:ts:ts:
The risks that face the company are the ones that face theindustry and these are monitored periodically. These risksinclude cut down in IT budgets, volatility in currencies andwithdrawal of tax benefits etc. Other risks that are closelymonitored are risks of client concentration, geographicalspread, competition and financial stability of our customersetc.

AAAAAnnual Rnnual Rnnual Rnnual Rnnual Reporeporeporeporeporttttt 2011-2012 2011-2012 2011-2012 2011-2012 2011-2012
2020202020
RRRRReview of Ceview of Ceview of Ceview of Ceview of Consolidaonsolidaonsolidaonsolidaonsolidattttted Balanced Balanced Balanced Balanced Balance Sheete Sheete Sheete Sheete Sheet
(` in millions)
P P P P Parararararticularsticularsticularsticularsticulars 3131313131ststststst M M M M Marararararch, 2012ch, 2012ch, 2012ch, 2012ch, 2012 3131313131ststststst M M M M Marararararch, 2011ch, 2011ch, 2011ch, 2011ch, 2011
Shareholder’s Funds
(a) Share Capital 196.31 196.31
(b) Reserves and Surplus (601.76) 66.07
Long term borrowings 741.82 647.43
Long term provisions 10.97 9.82
Deferred Tax Liabilities (Net) - 10.36
TTTTTOOOOOTTTTTALALALALAL 347.34347.34347.34347.34347.34 929.99929.99929.99929.99929.99
Consolidated Goodwill 260.96 719.06
Fixed Assets 40.92 165.44
Deferred tax asset 5.03 -
Current Assets, Loans and Advances
(a) Current Investment - 12.63
(b) Inventories 0.54 0.25
(c) Sundry Debtors 128.91 111.79
(d) Cash and Bank Balances 35.84 78.84
(e) Loans and Advances 76.79 65.32
(f ) Other current assets 101.43 63.03
Less: Current Liabilities and Provisions
(a) Current Liabilities (235.20) (215.21)
(b) Provisions (67.88) (71.18)
TTTTTOOOOOTTTTTALALALALAL 347.34347.34347.34347.34347.34 929.99929.99929.99929.99929.99
a. Paid up share capital
Paid up share capital of the Company stands at ` 196.31 Mn constituting 19,631,015 shares. There was no change inthe paid up capital from previous year.

AAAAAnnual Rnnual Rnnual Rnnual Rnnual Reporeporeporeporeporttttt 2011-2012 2011-2012 2011-2012 2011-2012 2011-2012
2121212121
b. Reserves and Surplus
Reserves and Surplus have come down from ` 66.07 Mn in FY 2010-11 to a negative ` 601.76 Mn in FY 2011-12.Contributing to the huge losses are:
1) Impairment of goodwill of ` 458.10. After thorough review and analysis of business potential of the carryingamount of the intangible asset and focus of the Company on specific business verticals, management is of thefirm view that the full amount of the intangible asset is not worth the future economic benefit because ofsignificant adverse changes in the economic climate and changes in the manner in which asset is used.
2) Recognition of Foreign Currency Translation Reserve of a negative ` 98.50 Mn for FY 2011-12, amount arisingfrom translation of balance sheets of subsidiaries stated in currency other than in INR.
3) Impairment of intangible assets of ` 44.52 Mn (` 30. 24 Mn in CTEL and ` 14.28 Mn in CTE Inc.). Management ofthe Company has decided that the significant changes with an adverse effect have taken place during the FY2011-12 in the technological, market, or economic environment in which the entity operates. Internally themanagement has reviewed the obsolescence of carrying value of reusable components not justifying thecarrying value in the light of change in the focus of the Company in new technologies in transformation toolsand cloud infrastructure.
c. Secured & Unsecured Loans
Secured Loans, secured against current assets and fixed assets of the Company, have gone up to ` 91.11 Mn in FY2011-12 from ` 74.05 Mn in FY 2010-11. The reduction in Bank borrowings by CTEL and Cambridge Technology IndiaPvt. Ltd. in the form of Cash Credit have been outweighed by other than bank borrowings by CTE Inc. to the tune of` 35.81 Mn and by smartShift GmbH to the tune of ` 13.67. On the other hand, the increase in the secured long termdebt is the loan standing on the records of smartShift group Limited (formerly Cambridge Technology Enterprise –Mauritius Ltd), Mauritius is due depreciation in Indian Rupee versus USD.
d. Goodwill
Management has decided to impair the acquisition goodwill amount and reflect the effect of the changed businessenvironment in the financial statements. The impact of the change is that the goodwill at the consolidated level ofthe company stands as on 31st March, 2012 at ` 260.96 Mn as compared to ` 719.06 Mn as on 31st March, 2011, animpairment of ` 458.10 Mn.
e. Fixed Assets
Gross fixed assets have gone down from ` 165.44 in FY 2010-11 to ` 40.92 Mn in the current financial year underreview, a decrease of ` 124.52 Mn. Significant transactions in fixed assets as below:
1) Tangible Assets: Modification of building in our Bangalore facility to accommodate more employees at a cost of` 6.21 Mn; addition of furniture & fixtures of ̀ 3.53 Mn; and computers of ̀ 14.76 Mn; office equipment of ̀ 5.21Mn. Depreciation for the period amounted to ` 15.70 Mn.
2) Intangible Assets: Computer software used in development of projects and re-usable components were carriedat a book value of ` 137.18 Mn as on 31st March, 2011. In view of the changes in technological & businessenvironment in which entity operates and focus of the Company a depreciation of ̀ 82.70 Mn and an impairmentof ` 44.52 Mn. was taken to represent the economic value of the intangible asset. With the said depreciationand impairment value, intangible asset other than goodwill on consolidation stand at zero as on 31st March,2012.

AAAAAnnual Rnnual Rnnual Rnnual Rnnual Reporeporeporeporeporttttt 2011-2012 2011-2012 2011-2012 2011-2012 2011-2012
2222222222
f. Debtors
Receivables exceeding more than 6 months have decreased from ` 35.04 Mn in FY 2010-11 to ` 18.12 Mn due tobetter collection practices adopted by the Company during the current financial year under review. Remaining debtorsare also considered good and realizable. Debtors of less than 6 months old have gone up from ` 76.75 Mn (48 days)in FY 2010-11 to ̀ 110.79 Mn (69 days) in FY 2011-12 because of delay from some critical customers. Establishment ofbetter debtor’s management practices has yielded debtors realizations faster, especially in our US subsidiaries.
g. Loans & Advances
Short term loans and advances have gone up by ` 11.47 Mn from ` 65.32 Mn in FY 2010-11, to ` 76.79 Mn during thecurrent year under review, majorly contributed by INR depreciation for the loans and advances payable by subsidiariesin foreign currencies.
h. Current Liabilities
Current Liabilities have gone up from ̀ 286.39 Mn from FY 2010-11 to ̀ 303.08 Mn as on 31st March, 2012, an increaseof about 6%, because of an increase of ̀ 49.48 Mn of other than bank borrowings by subsidiaries of the Company. Onthe other hand the bank borrowing in the form of cash credits by the Company and its Indian wholly owned subsidiaryCambridge Technology India Pvt. Ltd. has come down to ` 41.63 Mn from ` 74.05 Mn.
RRRRReview of Ceview of Ceview of Ceview of Ceview of Consolidaonsolidaonsolidaonsolidaonsolidattttted Ped Ped Ped Ped Prrrrrofit & Lofit & Lofit & Lofit & Lofit & Loss Aoss Aoss Aoss Aoss Accccccccccounounounounounttttt
(` in millions)
P P P P Parararararticularsticularsticularsticularsticulars 3131313131ststststst M M M M Marararararch, 2012ch, 2012ch, 2012ch, 2012ch, 2012 3131313131ststststst M M M M Marararararch, 2011ch, 2011ch, 2011ch, 2011ch, 2011
Income from Operations 749.98 589.10
Profit from Operations before other income, interest, and exceptional items (85.24) (212.17)
Other Income 23.02 50.42
Interest and finance charges (28.99) (22.12)
Impairment of intangible assets (44.52) -
Impairment of goodwill (458.10) -
Exceptional items 15.02 3.72
Profit before tax (578.81) (180.15)
Tax Expense 9.49 (5.12)
Net Profit for the year (569.32) (185.27)
a. Income from Operations
Operating revenue has increased by 27.31% from FY 2010-11 to ̀ 749.98 Mn during the year under review. Substantialcontribution to the revenues has come from CTE Inc. (` 562.21 Mn) and from smartShift GmbH (` 97.22 Mn). Coupledwith this, your Company has been concentrating on value added services like cloud computing, RIMS etc., which aretaking off, albeit slowly, as expected. Keeping in view managing the risk associated with depending upon limitedsources of revenue, management has decided to venture into new areas and new technologies.
AAAAAnnual Rnnual Rnnual Rnnual Rnnual Reporeporeporeporeporttttt 2011-2012 2011-2012 2011-2012 2011-2012 2011-2012
2323232323
b. Expenditure
i. Employee Cost
Employee cost including salaries, bonus, and other staff welfare expenses have gone up by 17.33%, from` 376.19 Mn in FY 2010-11 to ` 441.40 Mn during the current financial year. The increase in employee costs areless than the increase in revenues. Employee cost being the highest cost factor in the total cost, managementhas been focusing in cost rationalization on this front and improving bottom line.
ii. Contract Employee Cost
There was also a substantial reduction in contract employee cost by ̀ 52.98 Mn from ̀ 172.62 Mn in FY 2010-11to ̀ 119.64 Mn in FY 2011-12, i.e., a reduction of 30.69%. New projects are being executed by the Company withavailable resources and gradually reducing dependency on sub-contractors. This has ensured cost optimization.
iii. General and Administrative Expenses
General and administrative expenses have come gone up by 22.75%, to ` 173.36 Mn from ` 141.23 Mn in theprevious year. Major items that contributed to the increment were consultancy & professional charges by` 11.84 Mn, sales & marketing expenses by ̀ 8.11 Mn, communication expense by ̀ 8.06 Mn, office maintenanceexpense by ̀ 2.04 Mn because of relocation of registered office, and other miscellaneous expenses to the extentof ̀ 2.31 Mn. Major reductions in this category were insurance by ̀ 1.51 Mn, managerial remuneration by ̀ 1.05Mn, dues & subscriptions by ` 1.17 Mn.
c. Depreciation
There was a reduction in depreciation expenses from ̀ 108.50 Mn to ̀ 98.41 Mn in the current financial year, becauseof sale of tangible fixed assets and a to the extent of ` 8.21 Mn.
d. Other Income
There is a substantial decrease in other income from ` 50.42 Mn, during FY 2010-11 to ` 23.02 Mn in the currentperiod under review. That is reduction of 54.35%. The reduction is on account of miscellaneous income comingdown from ` 47.07 Mn in the previous year to ` 1.60 Mn in the current period. During FY 2010-11 the Companyforfeited share warrant application money proposed to be issued to Rosebury Investments Pte. Ltd., and Prime GeniusInvestments Pte. Ltd., after expiry of stipulated time for exercise of warrants. The steep down in miscellaneous incomewas compensated by increase in exchange fluctuation gain from ` 1.53 Mn during FY 2010-11 to ` 21.21 Mn duringFY 2011-12.
e. Interest and Finance charges
Interest and finance charges have increased by 31.06% from ` 22.12 Mn in FY 2010-11 to ` 28.99 Mn during thecurrent financial year. Interest on working capital loans has come down to ` 9.67 Mn in the current financial yearversus ̀ 20.09 Mn in the previous year, because of better cash flows, thereby reduced reliance of utilization of workingcapital facilities. On the other hand there was multifold increase in interest on other loans from ̀ 2.03 Mn in FY 2010-11 to ` 19.32 Mn in the period under review, on account of ` 741.82 Mn debts arisen in our wholly owned subsidiarysmartShiftgroup Limited (formerly Cambridge Technology Enterprises – Mauritius Limited), Mauritius.
f. Write off of intangible assets
Management of the Company has decided that the significant changes with an adverse effect have taken placeduring the FY 2011-12 in the technological, market, economic or legal environment in which the entity operates.

AAAAAnnual Rnnual Rnnual Rnnual Rnnual Reporeporeporeporeporttttt 2011-2012 2011-2012 2011-2012 2011-2012 2011-2012
2424242424
Internally the management has reviewed the obsolescence of carrying value of reusable components not justifyingthe carrying value in the light of change in the focus of the Company in new technologies. Now the major focus areasare transformation tools and Cloud Infrastructure. Management is of the firm opinion that the reusable componentslibrary can not be utilized in the new focus areas of the Company nor does expect to derive future economic benefitby the standalone use of reusable components. Hence, it was decided to write off the entire outstanding reusablecomponent library of ` 44.52 Mn as per accounting standards for the FY ended as on 31st March, 2012.
g. Impairment of goodwill
After thorough review and analysis of business potential of the carrying amount of the intangible asset and focus ofthe Company on specific business verticals, management is of the firm view that the full amount of the intangibleasset is not worth the future economic benefit because of significant adverse changes in the economic climate andchanges in the manner in which asset is used. Hence, management has decided to impair the acquisition goodwillamount and reflect the effect of the changed business environment in the financial statements. The impact of thechange is that the goodwill at the consolidated level of the company stands as on 31st March, 2012 at ` 260.96 Mn ascompared to ̀ 719.06 Mn as on 31st March, 2011 i.e., an impairment loss of ̀ 458.10 Mn for the year ended 31st March,2012.
h. Profit After Tax
There was a steep deterioration in the bottom line from a loss of ` 185.28 Mn in FY 2010-11 to a loss ` 569.33 Mnduring the current year, majorly contributed by the impairment goodwill of ̀ 458.10 Mn and impairment of intangibleassets of ` 44.52 Mn during the year under review. Had it not been for the impairment, the profit after tax would havebeen a loss of ̀ 66.71 Mn versus a loss of ̀ 185.28 Mn, a substantial improvement over the previous year. Managementis putting much emphasis on improving the profitability of the Company along with increased business.
RRRRReviewevieweviewevieweview of S of S of S of S of Standalone Balanctandalone Balanctandalone Balanctandalone Balanctandalone Balance Sheete Sheete Sheete Sheete Sheet
(` in millions)
P P P P Parararararticularsticularsticularsticularsticulars 3131313131ststststst M M M M Marararararch, 2012ch, 2012ch, 2012ch, 2012ch, 2012 3131313131ststststst M M M M Marararararch, 2011ch, 2011ch, 2011ch, 2011ch, 2011
Shareholder’s Funds
(a) Share Capital 196.31 196.31
(b) Reserves and Surplus 426.53 424.93
Long term provisions 6.55 5.30
Deferred Tax Liabilities 1.67 14.94
TTTTTOOOOOTTTTTALALALALAL 631.06631.06631.06631.06631.06 641.48641.48641.48641.48641.48
Fixed Assets 10.68 117.85
Non current investments 409.75 447.52
Current Assets, Loans and Advances
(a) Current Investment - 12.63
(b) Sundry Debtors 242.00 214.31
(c) Cash and Bank Balances 27.78 17.50
( d) Loans and Advances 8.88 8.27
(e) Other current assets 33.40 28.15
Less: Current Liabilities and Provisions
(a) Current Liabilities (73.91) (160.36)
(b) Provisions (27.53) (44.39)
TTTTTOOOOOTTTTTALALALALAL 631.06631.06631.06631.06631.06 641.48641.48641.48641.48641.48
AAAAAnnual Rnnual Rnnual Rnnual Rnnual Reporeporeporeporeporttttt 2011-2012 2011-2012 2011-2012 2011-2012 2011-2012
2525252525
a. Paid-up share capital
Paid-up share capital of the Company stands at ` 196.31 Mn constituting 19,631,015 shares. There was no change inthe paid up capital from previous year.
b. Reserves and Surplus
Reserves and Surplus had increased from ̀ 424.93 Mn in FY 2010-11 to ̀ 426.53 Mn in FY 2011-12. The increase in thereserves and surplus is exactly the net profit for the year of ` 1.60 Mn the Company made at standalone level. Therewas no change in the capital structure of the Company affecting reserves & surplus.
c. Secured Loan Funds (Short term borrowings)
Secured short term loan funds i.e., cash credit facility for working capital purposes, have come down by ` 19.38 Mn to` 30.39 Mn for the period under review from ` 49.76 Mn in the previous year. In the secured loan segment, there wasreduction in utilization of working capital facility from Banks secured against the current assets and fixed assets ofthe company. This was possible for better cash flows and cash management by the management.
Other current liabilities which are unsecured have come down by ` 65.26 Mn from ` 104.55 Mn in the previous yearto ` 39.30 Mn in the current year comprising ` 20.44 Mn payable to our associate company CTE Inc., versus ` 87.62Mn payable in the previous year; ̀ 18.70 Mn payable to CTEL ESOP Trust as against ̀ 16.17 Mn payable in the previousyear.
d. Trade payables
Trade payables have come down to ` 4.23 Mn for the period under review as against ` 6.05 Mn in FY 2010-11, that isa reduction of ` 1.82 Mn. Of these outstanding for a period more than 6 months have come down to ` 0.28 Mn in thecurrent year from ` 0.58 Mn in the previous year. And other trade payables were down by ` 1.51 Mn to ` 3.95 Mn inthis financial year.
e. Short term provisions
Short term provisions have dropped by ` 16.86 Mn from ` 44.39 Mn in the financial year 2010-11 as against ` 27.53Mn in the current year. ` 22.00 Mn of provision made in the previous year towards sub-contracting fee was notprovided during the current year. Included in the ` 27.53 Mn of current year provisions are provision for employeebenefits of ` 20.48 Mn, provision for income tax of ` 2.61 Mn, provision for statutory dues of ` 2.04 Mn, and others of` 2.40 Mn.
f. Fixed Assets
Gross fixed assets have gone up by ` 76.54 Mn to ` 385.74 Mn, mainly due to capitalization of internally developedsoftware, whereas net fixed assets have decreased from ` 136.74 Mn in FY 2010-11 to ` 117.85 Mn for the periodended 31st March, 2012. During the year Company has written off intangible asset of ` 30.25 Mn after reviewing theusability of the same in the light of changes in economic and technological developments in which Company isoperating.
g. Investments
Company has taken impairment in investment value to the tune of ` 37.78 Mn to ` 409.75 Mn in FY 2011-12 from` 447.52 Mn in FY 2010-11. At consolidated level Company has impaired acquisition goodwill of ̀ 458.10 Mn. Becauseof substantial impairment in goodwill value, it has become necessary to evaluate investment value of associatecompanies in which investment has been recorded, directly or indirectly. As a result Company diminished value ofinvestment by ̀ 37,776,016/-, because of less than proportionate decrease in value of smartShiftgroup Limited (SSG)(earlier Cambridge technology Enterprises – Mauritius Limited), Mauritius as whole in which CTEL is holding 100%equity.
AAAAAnnual Rnnual Rnnual Rnnual Rnnual Reporeporeporeporeporttttt 2011-2012 2011-2012 2011-2012 2011-2012 2011-2012
2626262626
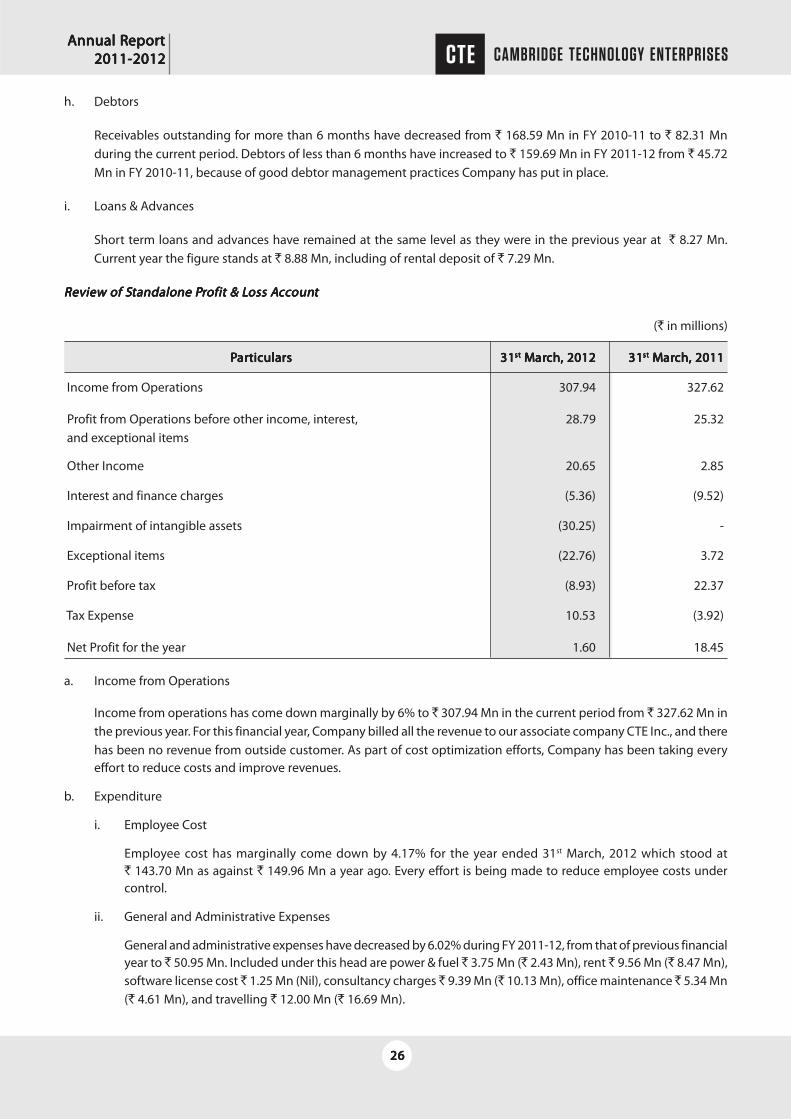
h. Debtors
Receivables outstanding for more than 6 months have decreased from ` 168.59 Mn in FY 2010-11 to ` 82.31 Mnduring the current period. Debtors of less than 6 months have increased to ` 159.69 Mn in FY 2011-12 from ` 45.72Mn in FY 2010-11, because of good debtor management practices Company has put in place.
i. Loans & Advances
Short term loans and advances have remained at the same level as they were in the previous year at ` 8.27 Mn.Current year the figure stands at ` 8.88 Mn, including of rental deposit of ` 7.29 Mn.
RRRRReview of Seview of Seview of Seview of Seview of Standalone Ptandalone Ptandalone Ptandalone Ptandalone Prrrrrofit & Lofit & Lofit & Lofit & Lofit & Loss Aoss Aoss Aoss Aoss Accccccccccounounounounounttttt
(` in millions)
P P P P Parararararticularsticularsticularsticularsticulars 3131313131ststststst M M M M Marararararch, 2012ch, 2012ch, 2012ch, 2012ch, 2012 3131313131ststststst M M M M Marararararch, 2011ch, 2011ch, 2011ch, 2011ch, 2011
Income from Operations 307.94 327.62
Profit from Operations before other income, interest, 28.79 25.32 and exceptional items
Other Income 20.65 2.85
Interest and finance charges (5.36) (9.52)
Impairment of intangible assets (30.25) -
Exceptional items (22.76) 3.72
Profit before tax (8.93) 22.37
Tax Expense 10.53 (3.92)
Net Profit for the year 1.60 18.45
a. Income from Operations
Income from operations has come down marginally by 6% to ` 307.94 Mn in the current period from ` 327.62 Mn inthe previous year. For this financial year, Company billed all the revenue to our associate company CTE Inc., and therehas been no revenue from outside customer. As part of cost optimization efforts, Company has been taking everyeffort to reduce costs and improve revenues.
b. Expenditure
i. Employee Cost
Employee cost has marginally come down by 4.17% for the year ended 31st March, 2012 which stood at` 143.70 Mn as against ` 149.96 Mn a year ago. Every effort is being made to reduce employee costs undercontrol.
ii. General and Administrative Expenses
General and administrative expenses have decreased by 6.02% during FY 2011-12, from that of previous financialyear to ` 50.95 Mn. Included under this head are power & fuel ` 3.75 Mn (` 2.43 Mn), rent ` 9.56 Mn (` 8.47 Mn),software license cost ` 1.25 Mn (Nil), consultancy charges ` 9.39 Mn (` 10.13 Mn), office maintenance ̀ 5.34 Mn(` 4.61 Mn), and travelling ` 12.00 Mn (` 16.69 Mn).

AAAAAnnual Rnnual Rnnual Rnnual Rnnual Reporeporeporeporeporttttt 2011-2012 2011-2012 2011-2012 2011-2012 2011-2012
2727272727
c. Depreciation
There is a reduction in depreciation from ` 96.75 Mn in FY 2010-11 to ` 83.05 Mn in FY 2011-12, majorly because ofnot considering depreciation on written off assets carrying a book value of ` 30.25 Mn.
d. Other Income
The other income during the FY 2011-12 was ` 20.65 Mn, whereas the same was ` 2.85 Mn in FY 2010-11. Substantialincrease in other income was explained by increase in exchange fluctuation gain of ` 20.47 Mn versus ` 2.20 Mn inthe previous year.
e. Interest
Interest costs have come down from ` 9.52 Mn in FY 2010-11 to ` 5.36 Mn in FY 2011-12, because of reduction inusage of working capital facilities from cash credit account and being able to manage operations with internal accruals.
f. Write off of intangible assets
Management of the Company has decided that the significant changes with an adverse effect have taken placeduring the FY 2011-12 in the technological, market, economic or legal environment in which the entity operates.Internally the management has reviewed the obsolescence of carrying value of reusable components not justifyingthe carrying value in the light of change in the focus of the Company in new technologies. Now the major focus areasare transformation tools and Cloud Infrastructure. Management is of the firm opinion that the reusable componentslibrary can not be utilized in the new focus areas of the Company nor does expect to derive future economic benefitby the standalone use of reusable components. Hence, it was decided to write off the entire outstanding reusablecomponent library of ` 30.25 Mn as per accounting standards for the FY ended as on 31st March, 2012.
g. Diminution in investments
Company has taken impairment in investment value to the tune of ` 37.78 Mn to ` 409.75 Mn in FY 2011-12 from` 447.52 Mn in FY 2010-11. At consolidated level Company has impaired acquisition goodwill of ̀ 458.10 Mn. Becauseof substantial impairment in goodwill value, it has become necessary to evaluate investment value of associatecompanies. After evaluating value of associate companies in the light of goodwill impairment, Company hasdiminished the value of investment by ` 37.78 Mn.
h. Profit After Tax
There was a substantial deterioration in the bottom line from a profit of ` 18.45 Mn in FY 2010-11 to a marginal profitof ` 1.60 Mn during the current year. Profit after tax was affected by writing off of intangible assets to the extent of` 30.25 Mn and diminution in investment value by ` 37.78 Mn. Without considering these two one-time-items, profitafter tax would have been ` 69.62 Mn.
IIIIInnnnntttttererererernal Cnal Cnal Cnal Cnal Cononononontrtrtrtrtrol syol syol syol syol systststststems and their adequacems and their adequacems and their adequacems and their adequacems and their adequacyyyyy:::::
CTEL’s Board and management team monitor and make enhancements to the Company’s systems for internal control andrisk management on an ongoing basis. The Company’s efforts towards this go beyond what is mandatorily required, withactive monitoring and review to ensure adequacy of control systems and to identify potential risks as well as recommendor implement measures to mitigate them.
CTEL’s internal control system is adequate considering the nature, size and complexity of its business. The company’sinternal control systems provide, among other things, reasonable assurance of recording the transactions of its operationsin all material respects and of providing protection against significant misuse or loss of company assets. These also enablethe company to adhere to procedures, guidelines, and regulations as applicable in a transparent manner.

AAAAAnnual Rnnual Rnnual Rnnual Rnnual Reporeporeporeporeporttttt 2011-2012 2011-2012 2011-2012 2011-2012 2011-2012
2828282828
Company’s internal control systems are supplemented by an internal audit program and periodic reviews by themanagement. CTEL has appointed an independent audit firm as its Internal Auditors, and the Audit Committee reviews itsfindings and recommendations at periodic intervals.
MMMMMaaaaattttterererererial devial devial devial devial developmenelopmenelopmenelopmenelopments in Human Rts in Human Rts in Human Rts in Human Rts in Human Resouresouresouresouresourccccces / Ies / Ies / Ies / Ies / Industrndustrndustrndustrndustrial Rial Rial Rial Rial Relaelaelaelaelations frtions frtions frtions frtions fronononononttttt, including number of people emplo, including number of people emplo, including number of people emplo, including number of people emplo, including number of people employyyyyededededed
Our employees are our most important and valuable assets. As of 31st March, 2012, CTEL and its subsidiaries had employedapproximately 500 employees. The key elements that define our culture include professional working environment, trainingand development, and compensation.

AAAAAnnual Rnnual Rnnual Rnnual Rnnual Reporeporeporeporeporttttt 2011-2012 2011-2012 2011-2012 2011-2012 2011-2012
2929292929
CEO & CFO Certificate,CEO & CFO Certificate,CEO & CFO Certificate,CEO & CFO Certificate,CEO & CFO Certificate,Declaration on Code of Conduct andDeclaration on Code of Conduct andDeclaration on Code of Conduct andDeclaration on Code of Conduct andDeclaration on Code of Conduct and
Certificate of ComplianceCertificate of ComplianceCertificate of ComplianceCertificate of ComplianceCertificate of Compliance

AAAAAnnual Rnnual Rnnual Rnnual Rnnual Reporeporeporeporeporttttt 2011-2012 2011-2012 2011-2012 2011-2012 2011-2012
3030303030
CEO / CFO Certification
I, Stefan Hetges, Chief Executive Officer and Samir Bhatia, Chief Financial Officer certify to the Board that:
(a) We have reviewed financial statements and the cash flow statement for the year and that to the best of our knowledgeand belief:
(i) these statements do not contain any materially untrue statement or omit any material fact or contain statementsthat might be misleading;
(ii) these statements together present a true and fair view of the Company’s affairs and are in compliance withexisting accounting standards, applicable laws and regulations.
(b) There are, to the best of our knowledge and belief, no transactions entered into by the Company during the yearwhich are fraudulent, illegal or violative of Company’s code of conduct.
(c) We accept responsibility for establishing and maintaining internal controls for financial reporting and that we haveevaluated the effectiveness of internal control systems of the Company pertaining to financial reporting and wehave disclosed to the auditors and the Audit Committee, deficiencies in the design or operation of such internalcontrols, if any, of which they are aware and the steps they have taken or propose to take to rectify these deficiencies.
(d) We have indicated to the auditors and the Audit committee:
(i) significant changes in internal control over financial reporting during the year;
(ii) significant changes in accounting policies during the year and that the same have been disclosed in the notesto the financial statements; and
(iii) instances of significant fraud of which they have become aware and the involvement therein, if any, of themanagement or an employee having a significant role in the Company’s internal control system over financialreporting.
Stefan Hetges Samir BhatiaChief Executive Officer Chief Financial Officer
Date: 13th August, 2012
CEO’s DeclarationI, Stefan Hetges, Chief Executive Officer do hereby declare that pursuant to the provisions of Clause 49(I) (D) (ii) of theListing Agreement, all the members of the Board and the Senior Management Personnel of the Company have furnishedtheir affirmation of compliance with the Code of Conduct of the Company.
Stefan HetgesDate: 13th August, 2012 Chief Executive Officer

AAAAAnnual Rnnual Rnnual Rnnual Rnnual Reporeporeporeporeporttttt 2011-2012 2011-2012 2011-2012 2011-2012 2011-2012
3131313131
Certificate of ComplianceToThe Members of Cambridge Technology Enterprises Ltd
I have examined the Compliance of conditions of Corporate Governance by Cambridge Technology Enterprises Limited(“the Company”), for the year ended on 31st March, 2012, as stipulated in Clause 49 of the Listing Agreement of the saidCompany with the Bombay Stock Exchange and the National Stock Exchange. The compliance of conditions of CorporateGovernance is the responsibility of the management. My examination was limited to procedures and implementationthereof, adopted by the Company for ensuring the compliance of the conditions of the Corporate Governance. It is neitheran audit nor an expression of opinion on the financial statements of the Company.
In my opinion and to the best of my information and according to the explanations given to me, I certify that the Companyhas complied with the conditions of Corporate Governance as stipulated in the above mentioned Listing Agreement.
I further state that such compliance is neither an assurance as to the future viability of the Company nor the efficiency oreffectiveness with which the management has conducted the affairs of the Company.
Sd/-Place: Hyderabad B. KrishnaveniDate : 13th August, 2012 Practising Company Secretary

AAAAAnnual Rnnual Rnnual Rnnual Rnnual Reporeporeporeporeporttttt 2011-2012 2011-2012 2011-2012 2011-2012 2011-2012
3232323232
Consolidated Financial StatementsConsolidated Financial StatementsConsolidated Financial StatementsConsolidated Financial StatementsConsolidated Financial Statements

AAAAAnnual Rnnual Rnnual Rnnual Rnnual Reporeporeporeporeporttttt 2011-2012 2011-2012 2011-2012 2011-2012 2011-2012
3333333333
Auditors’ Report on Consolidated FinancialsToThe Members ofCambridge Technology Enterprises Limited
1. We have audited the attached Consolidated Balance Sheet of CAMBRIDGE TECHNOLOGY ENTERPRISES LIMITED (‘theCompany’) and its wholly owned subsidiaries collectively referred to as “the Cambridge Group” as at 31st March, 2012and the Consolidated Profit & Loss Account for the year ended on the date annexed thereto and Consolidated Cashflow Statement for the period ended on that date. These Consolidated financial statements are the responsibility ofthe Company’s Management. Our responsibility is to express an opinion on these consolidated financial statementsbased on our audit.
2. We conducted our audit in accordance with auditing standards generally accepted in India. Those Standards requirethat we plan and perform the audit to obtain reasonable assurance about whether the financial statements areprepared, in all material respects, in accordance with an identified financial reporting framework and are free ofmaterial misstatement An audit includes examining, on a test basis, evidence supporting the amounts and disclosuresin the financial statements. An audit also includes assessing the accounting principles used and significant estimatesmade by management, as well as evaluating the overall financial statement. We believe that our audit provides areasonable basis for our opinion.
3. We did not audit the financial statements of Subsidiary Companies of Cambridge Technology Enterprises LimitedNamely Cambridge Technology India Pvt. Ltd and CTE-Mauritius Ltd and CTE Inc. (USA) and Voxholding Inc., (USA)and Smart Shift Gmbh (Germany) whose financial statements reflect total assets of Rs. 3276.55 Lakhs as at 31st March2012 and total revenue of Rs. 4444.095 Lakhs for the year ended on that date. These financial statements and otherfinancial information have been audited by other auditors whose reports have been furnished to us and our opinion,in so far as it relates to the amounts included in respect of the subsidiaries is based solely on the report of the otherauditors.
4. We report that the consolidated financial statements have been prepared by the Cambridge Group in accordancewith the requirements of Accounting Standard (AS) 21 for Consolidated Financial Statements, issued by the Instituteof Chartered Accountants of India and on the basis of the separate audited financial statements of the Company andits subsidiaries included in the consolidated financial statements.
5. On the basis of the information and explanations given to us and on the consideration of the separate audit reportson individual audited financial statements of the Company and its subsidiaries, we are of the opinion that, saidconsolidated financial statements gives a true and fair view in conformity with the accounting principles generallyaccepted in India.
(a) In the case of the Consolidated balance Sheet, of the consolidated state of affairs of the Cambridge Group as at31st March, 2012.
(b) In the case of the Consolidated Profit and Loss Account of the consolidated results of operations of the Companyand its subsidiaries for the year then ended
And
(c) In the case of the consolidated cash flows Statement, of the Consolidated Cash flows of the company and its subsidiariesfor the year then ended.
FFFFFor Por Por Por Por P.MUR.MUR.MUR.MUR.MURALI & CALI & CALI & CALI & CALI & COOOOO.,.,.,.,.,
CHARCHARCHARCHARCHARTERED ATERED ATERED ATERED ATERED ACCCCCCCCCCOUNTOUNTOUNTOUNTOUNTANTANTANTANTANTS.,S.,S.,S.,S.,
FRN: 007257SFRN: 007257SFRN: 007257SFRN: 007257SFRN: 007257S
PPPPPlaclaclaclaclace : He : He : He : He : Hyyyyyderderderderderabadabadabadabadabad PPPPP. M. M. M. M. Murururururali Mali Mali Mali Mali Mohana Rohana Rohana Rohana Rohana Raoaoaoaoao
DaDaDaDaDattttte : 28/05/2012e : 28/05/2012e : 28/05/2012e : 28/05/2012e : 28/05/2012 PPPPPararararartnertnertnertnertner
MMMMMembership No : 23412embership No : 23412embership No : 23412embership No : 23412embership No : 23412

AAAAAnnual Rnnual Rnnual Rnnual Rnnual Reporeporeporeporeporttttt 2011-2012 2011-2012 2011-2012 2011-2012 2011-2012
3434343434
Consolidated Balance Sheet as at 31st March, 2012
PPPPParararararticularsticularsticularsticularsticulars NotNotNotNotNoteeeee AAAAAs on 31-03-2012s on 31-03-2012s on 31-03-2012s on 31-03-2012s on 31-03-2012 AAAAAs on 31-03-2011s on 31-03-2011s on 31-03-2011s on 31-03-2011s on 31-03-2011NoNoNoNoNo..... `̀̀̀̀ `̀̀̀̀
I.I.I.I.I. EQUITEQUITEQUITEQUITEQUITY AND LIABILITIESY AND LIABILITIESY AND LIABILITIESY AND LIABILITIESY AND LIABILITIES
(1)(1)(1)(1)(1) SharSharSharSharShareholdereholdereholdereholdereholder’’’’’s Fs Fs Fs Fs Fundsundsundsundsunds(a) Share Capital 1 196,310,150 196,310,150(b) Reserves and Surplus 2 (601,764,359) 66,070,507
(2)(2)(2)(2)(2) Non-Non-Non-Non-Non-CCCCCurururururrrrrrenenenenent Liabilitiest Liabilitiest Liabilitiest Liabilitiest Liabilities(a) Long-Term Borrowings 3 741,820,000 647,425,000(b) Defferred Tax Liabilities (Net) 4 - 10,355,890(c) Long Term Provisions 5 10,967,044 9,821,884
(3)(3)(3)(3)(3) CCCCCurururururrrrrrenenenenent Liabilitiest Liabilitiest Liabilitiest Liabilitiest Liabilities(a) Short-Term Borrowings 6 91,106,673 74,049,767(b) Trade Payables 7 60,493,412 53,331,569(c) Other Current Liabilities 8 83,597,193 87,825,292(d) Short-Term Provisions 9 67,882,047 71,180,174
TTTTTotalotalotalotalotal 650,412,160650,412,160650,412,160650,412,160650,412,160 1,216,370,2331,216,370,2331,216,370,2331,216,370,2331,216,370,233II.II.II.II.II. AAAAAssetsssetsssetsssetsssets
(1)(1)(1)(1)(1) Non-Non-Non-Non-Non-curcurcurcurcurrrrrrenenenenent assetst assetst assetst assetst assets(a) Fixed assets
(i) Tangible assets 10 40,922,777 28,293,076(ii) Intangible assets 10 - 137,147,681(iii) Goodwill 260,960,675 719,064,720
(b) Defferred tax assets (net) 4 5,032,815 -(c) Other Non-Current assets 11 73,493,406 44,060,853
(2)(2)(2)(2)(2) CCCCCurururururrrrrrenenenenent assetst assetst assetst assetst assets(a) Current investments 12 - 12,632,564(b) Inventories 13 536,024 247,156(c) Trade receivables 14 128,906,470 111,788,879(d) Cash and Bank Balances 15 35,840,113 78,841,599(e) Short-Term Loans and Advances 16 76,786,265 65,320,950(f ) Other Current assets 17 27,933,616 18,972,755
TTTTTotalotalotalotalotal 650,412,160650,412,160650,412,160650,412,160650,412,160 1,216,370,2331,216,370,2331,216,370,2331,216,370,2331,216,370,233
Significant Accounting Ploicies Notes to 1 to 36Financial Statements
AS PER OUR REPORT OF EVEN DATE
FFFFFor Por Por Por Por P.M.M.M.M.Murururururali & Cali & Cali & Cali & Cali & Cooooo.,.,.,.,., FFFFFor Cor Cor Cor Cor Cambrambrambrambrambridge idge idge idge idge TTTTTechnology Enechnology Enechnology Enechnology Enechnology Enttttterererererprprprprprises Limitises Limitises Limitises Limitises LimitedededededFirm Regn. No: 007257SChartered Accountants
DRR SDRR SDRR SDRR SDRR Swwwwwarararararoopoopoopoopoop L.SrL.SrL.SrL.SrL.SridharidharidharidharidharWhole-Time Director Director
PPPPP.M.M.M.M.Murururururali Mali Mali Mali Mali Mohana Rohana Rohana Rohana Rohana RaoaoaoaoaoPartnerM.No. 023412 SSSSSamir Bhaamir Bhaamir Bhaamir Bhaamir Bhatiatiatiatiatia VVVVV.R.R.R.R.Ramana Ramana Ramana Ramana Ramana Reddyeddyeddyeddyeddy
Whole-Time Director & CFO Company SecretaryPlace : HyderabadDate : 28-05-2012

AAAAAnnual Rnnual Rnnual Rnnual Rnnual Reporeporeporeporeporttttt 2011-2012 2011-2012 2011-2012 2011-2012 2011-2012
3535353535
PPPPParararararticularsticularsticularsticularsticulars NotNotNotNotNoteeeee YYYYYear Endingear Endingear Endingear Endingear Ending YYYYYear Endingear Endingear Endingear Endingear EndingNoNoNoNoNo..... 31-03-201231-03-201231-03-201231-03-201231-03-2012 31-03-201131-03-201131-03-201131-03-201131-03-2011
`̀̀̀̀ `̀̀̀̀
I. Revenue from Operations 18 749,979,636 589,104,233
II. Other Income 19 23,016,735 50,416,899
III.III.III.III.III. TTTTTotal Rotal Rotal Rotal Rotal Revevevevevenue (I +II)enue (I +II)enue (I +II)enue (I +II)enue (I +II) 772,996,372772,996,372772,996,372772,996,372772,996,372 639,521,132639,521,132639,521,132639,521,132639,521,132
IV. Expenses :
Employee Benefit expenses 20 561,046,285 548,812,987
Other Operating Expenses 21 106,542,251 96,066,940
Administrative Expenses 22 69,220,031 47,902,064
Financial costs 23 28,990,937 22,120,066
Impairement good-will 458,104,044 -
Impaired Intangible assets 44,523,396 -
Depreciation and amortization expense 10 98,411,395 108,495,764
TTTTTotal Expensesotal Expensesotal Expensesotal Expensesotal Expenses 1,366,838,3381,366,838,3381,366,838,3381,366,838,3381,366,838,338 823,397,821823,397,821823,397,821823,397,821823,397,821
V. Profit before exceptional and extraordinary items and tax (III - IV) (593,841,966) (183,876,689)
VI. Exceptional Items (15,015,155) (3,718,187)
VII. Profit before extraordinary items and tax (V - VI) (578,826,811) (180,158,502)
VIII. Extraordinary Items - -
IX. Profit Before Tax (VII - VIII) (578,826,811)(578,826,811)(578,826,811)(578,826,811)(578,826,811) (180,158,502)(180,158,502)(180,158,502)(180,158,502)(180,158,502)
X. Tax expense:
(1) Current tax 5,588,018 7,445,343
(2) Deferred tax (15,081,373) (2,323,177)
XI. Profit (Loss) from the period from Continuing Operations (VII - VIII) (569,333,456)(569,333,456)(569,333,456)(569,333,456)(569,333,456) (185,280,668)
XII. Profit / (Loss) from Discontinuing Operations - -
XIII. Tax expense of Discounting Operations - -
XIV. Profit / (Loss) from Discontinuing operations (XII - XIII) - -
XV. Profit / (Loss) for the period (XI + XIV) (569,333,456)(569,333,456)(569,333,456)(569,333,456)(569,333,456) (185,280,668)(185,280,668)(185,280,668)(185,280,668)(185,280,668)
XVI. Earning per equity share :
(1) Basic - -
(2) Diluted - -
Profit and Loss statement for the year ended 31st March, 2012
Significant Accounting PloiciesNote to Financial Statements 1 to 36
AS PER OUR REPORT OF EVEN DATE
FFFFFor Por Por Por Por P.M.M.M.M.Murururururali & Cali & Cali & Cali & Cali & Cooooo....., FFFFFor Cor Cor Cor Cor Cambrambrambrambrambridge idge idge idge idge TTTTTechnology Enechnology Enechnology Enechnology Enechnology Enttttterererererprprprprprises Limitises Limitises Limitises Limitises LimitedededededFirm Regn. No: 007257SChartered Accountants
DRR SDRR SDRR SDRR SDRR Swwwwwarararararoopoopoopoopoop L.SrL.SrL.SrL.SrL.SridharidharidharidharidharWhole-Time Director Director
PPPPP.M.M.M.M.Murururururali Mali Mali Mali Mali Mohana Rohana Rohana Rohana Rohana RaoaoaoaoaoPartnerM.No. 23412 SSSSSamir Bhaamir Bhaamir Bhaamir Bhaamir Bhatiatiatiatiatia VVVVV.R.R.R.R.Ramana Ramana Ramana Ramana Ramana Reddyeddyeddyeddyeddy
Whole-Time Director & CFO Company SecretaryPlace : HyderabadDate : 28-05-2012

AAAAAnnual Rnnual Rnnual Rnnual Rnnual Reporeporeporeporeporttttt 2011-2012 2011-2012 2011-2012 2011-2012 2011-2012
3636363636
Consolidated Cashflow for the period ended 31st March, 2012
AAAAAmounmounmounmounmount in t in t in t in t in `̀̀̀̀
DDDDDetailsetailsetailsetailsetails FFFFFor the Por the Por the Por the Por the Perererereriod endediod endediod endediod endediod ended FFFFFor the Por the Por the Por the Por the Perererereriod endediod endediod endediod endediod endedwith 31with 31with 31with 31with 31ststststst M M M M Marararararchchchchch’’’’’ 2012 2012 2012 2012 2012 with 31with 31with 31with 31with 31ststststst M M M M Marararararchchchchch’2011’2011’2011’2011’2011
A.A.A.A.A. CCCCCash Fash Fash Fash Fash Flololololow frw frw frw frw from Operom Operom Operom Operom Operaaaaating Ating Ating Ating Ating Accccctivitiestivitiestivitiestivitiestivities
Net Profit / (Loss) before tax (593,841,966) (183,876,689)
Adjustment for :
Impairment of Fixed Assets 44,523,396 -
Impairment of Goodwill 458,104,044 -
Depreciation & Amortization 98,411,395 108,495,764
Dividend Income from Mutual Funds (157,613) (632,564)
Interest Income (48,898) (1,190,277)
Interest Expenses(net) 28,990,937 22,120,066
Provision for Gratuity & Leave encashment 1,145,160 3,830,730
Loss on sale of Assets (Net) 2,400,870 2,734,019
Undeclared dividend and dividend tax - -
Provision for bad and doubtful debts - -
Operating profit before working capital changes 39,527,32539,527,32539,527,32539,527,32539,527,325 (48,518,951)(48,518,951)(48,518,951)(48,518,951)(48,518,951)
Adjustment for:
Change in Trade receivables (17,117,591) 38,317,043
Change in Inventory (288,868) (84,112,538)
Change in Short-term loans and advances (20,426,176) (57,725,973)
Change in Current Liabilities and Provision 16,692,522 22,905,665
CCCCCash generash generash generash generash generaaaaattttted fred fred fred fred from operom operom operom operom operaaaaationstionstionstionstions 18,387,21418,387,21418,387,21418,387,21418,387,214 (129,134,754)(129,134,754)(129,134,754)(129,134,754)(129,134,754)
Income tax (paid)/ refunded (5,588,018) (3,727,156)
Net cash frNet cash frNet cash frNet cash frNet cash from operom operom operom operom operaaaaating acting acting acting acting activities Ativities Ativities Ativities Ativities A 12,799,19512,799,19512,799,19512,799,19512,799,195 (132,861,910)(132,861,910)(132,861,910)(132,861,910)(132,861,910)
BBBBB..... CCCCCash Fash Fash Fash Fash Flololololow frw frw frw frw from Iom Iom Iom Iom Innnnnvvvvvesting Aesting Aesting Aesting Aesting Accccctivitiestivitiestivitiestivitiestivities
(Purchase) / Sale of Fixed Assets (20,817,681) (51,102,991)
Payment for Acquisitions - -
Sale of Fixed Assets - -
(Purchase) / Sale of Investments (16,799,989) (12,632,564)
Interest received 48,898 1,190,277
Dividend Income from Mutual Funds 157,613 632,564
Sale of investments -
Purchase of Investments in subsidiary
Net cash frNet cash frNet cash frNet cash frNet cash from inom inom inom inom invvvvvesting acesting acesting acesting acesting activities Btivities Btivities Btivities Btivities B (37,411,160)(37,411,160)(37,411,160)(37,411,160)(37,411,160) (61,912,714)(61,912,714)(61,912,714)(61,912,714)(61,912,714)

AAAAAnnual Rnnual Rnnual Rnnual Rnnual Reporeporeporeporeporttttt 2011-2012 2011-2012 2011-2012 2011-2012 2011-2012
3737373737
AAAAAmounmounmounmounmount in t in t in t in t in `̀̀̀̀
DDDDDetailsetailsetailsetailsetails FFFFFor the Por the Por the Por the Por the Perererereriod endediod endediod endediod endediod ended FFFFFor the Por the Por the Por the Por the Perererereriod endediod endediod endediod endediod endedwith 31with 31with 31with 31with 31ststststst M M M M Marararararchchchchch’’’’’ 2012 2012 2012 2012 2012 with 31with 31with 31with 31with 31ststststst M M M M Marararararchchchchch’2011’2011’2011’2011’2011
C.C.C.C.C. CCCCCash Fash Fash Fash Fash Flololololowwwwws frs frs frs frs from Fom Fom Fom Fom Financing Ainancing Ainancing Ainancing Ainancing Accccctivitiestivitiestivitiestivitiestivities
Proceeds from issue of share warrents - -
Increase (Decrease) in Term Loan (net) - -
Increase (Decrease) in Unsecured Loan (net) 94,395,000 174,975,860
Increase (Decrease) in Long Term Provision (net) - -
Interest Paid (28,990,937) (22,120,066)
Increase (Decrease) in Share Capital - 91,358,400
Net cash used frNet cash used frNet cash used frNet cash used frNet cash used from financing acom financing acom financing acom financing acom financing activities Ctivities Ctivities Ctivities Ctivities C 65,404,063 65,404,063 65,404,063 65,404,063 65,404,063 244,214,194244,214,194244,214,194244,214,194244,214,194
DDDDD..... EffEffEffEffEffececececect of Ft of Ft of Ft of Ft of Forororororeigeigeigeigeign curn curn curn curn currrrrrencencencencency try try try try translaanslaanslaanslaanslation Dtion Dtion Dtion Dtion D (83,793,584) (83,793,584) (83,793,584) (83,793,584) (83,793,584) 805,494805,494805,494805,494805,494
Net change in cash (Net change in cash (Net change in cash (Net change in cash (Net change in cash (A+B+C+DA+B+C+DA+B+C+DA+B+C+DA+B+C+D))))) (43,001,485)(43,001,485)(43,001,485)(43,001,485)(43,001,485) 50,245,06450,245,06450,245,06450,245,06450,245,064
Cash and cash equivalents at beginning of year 78,841,599 28,596,534
Cash and cash equivalents at end of year 35,840,113 78,841,599
The above Cash Flow statement is prepared under the Indirect Method set out in the Accounting Standard in Cash FlowStatements (AS-3) issued by the ICAI.
FFFFFor Por Por Por Por P.M.M.M.M.Murururururali & Cali & Cali & Cali & Cali & Cooooo..... FFFFFor and on behalf of Bor and on behalf of Bor and on behalf of Bor and on behalf of Bor and on behalf of Boaroaroaroaroard of Dird of Dird of Dird of Dird of DirececececectttttorsorsorsorsorsChartered Accountants
PPPPP.M.M.M.M.Murururururali Mali Mali Mali Mali Mohana Rohana Rohana Rohana Rohana Raoaoaoaoao DDDDD.R.R. S.R.R. S.R.R. S.R.R. S.R.R. Swwwwwarararararoopoopoopoopoop L.SrL.SrL.SrL.SrL.SridharidharidharidharidharPartner Whole-Time Director DirectorMembership No. 23412
SSSSSamir Bhaamir Bhaamir Bhaamir Bhaamir Bhatiatiatiatiatia VVVVV.R.R.R.R.Ramana Ramana Ramana Ramana Ramana ReddyeddyeddyeddyeddyWhole-Time Director & CFO Company Secretary
Place: Hyderabad Date: 28-05-2012

AAAAAnnual Rnnual Rnnual Rnnual Rnnual Reporeporeporeporeporttttt 2011-2012 2011-2012 2011-2012 2011-2012 2011-2012
3838383838
NONONONONOTE NOTE NOTE NOTE NOTE NO. 1 : SHARE C. 1 : SHARE C. 1 : SHARE C. 1 : SHARE C. 1 : SHARE CAPITAPITAPITAPITAPITALALALALAL
S.NoS.NoS.NoS.NoS.No..... PPPPParararararticularsticularsticularsticularsticulars AAAAAs ons ons ons ons on AAAAAs ons ons ons ons on31-03-201231-03-201231-03-201231-03-201231-03-2012 31-03-201131-03-201131-03-201131-03-201131-03-2011
`̀̀̀̀ `̀̀̀̀
a Equity Share Capital
(a) Authorised - - - - -
(No. of Shares 30,000,000 Current Year) 300,000,000 300,000,000 300,000,000 300,000,000 300,000,000 300,000,000 300,000,000 300,000,000 300,000,000 300,000,000
(No. of Shares 30,000,000 Preious Year)
(b) Issued - - - - - - - - - -
(No. of Shares 1,963,015 Current Year) 196,310,150 196,310,150 196,310,150 196,310,150 196,310,150 196,310,150 196,310,150 196,310,150 196,310,150 196,310,150
(No. of Shares 1,963,015 Preious Year)
(c) Subscribed & Fully Paid Up - - - - - - - - - -
(No. of Shares 1,963,015 Current Year) 196,310,150 196,310,150 196,310,150 196,310,150 196,310,150 196,310,150 196,310,150 196,310,150 196,310,150 196,310,150
(No. of Shares 1,963,015 Preious Year)
TTTTTotal Eotal Eotal Eotal Eotal Equitquitquitquitquity Shary Shary Shary Shary Share capitale capitale capitale capitale capital 196,310,150 196,310,150
TTTTTotal Sharotal Sharotal Sharotal Sharotal Share Ce Ce Ce Ce Capitalapitalapitalapitalapital 196,310,150 196,310,150
b A RA RA RA RA Recececececoncilaoncilaoncilaoncilaoncilation of the number of shartion of the number of shartion of the number of shartion of the number of shartion of the number of shares outstanding aes outstanding aes outstanding aes outstanding aes outstanding atttttthe begthe begthe begthe begthe beginning and ainning and ainning and ainning and ainning and at the end of the rt the end of the rt the end of the rt the end of the rt the end of the reporeporeporeporeporting perting perting perting perting period:iod:iod:iod:iod:
EEEEEquitquitquitquitquity Shary Shary Shary Shary Shares of Rses of Rses of Rses of Rses of Rs.10 Each, F.10 Each, F.10 Each, F.10 Each, F.10 Each, Fully paid upully paid upully paid upully paid upully paid up
At the Beginning 196,310,150 158,244,150
Issued during the year - Bonus Issue - - - - - -
Issued during the year - Cash Issue - 38,066,000
Issued during the year - ESOP - - - - - -
Forfeited / Bought Back during the year - - - - - -
At the end 196,310,150 196,310,150
c DDDDDetails of Sharetails of Sharetails of Sharetails of Sharetails of Shareholder holding moreholder holding moreholder holding moreholder holding moreholder holding more than 5%e than 5%e than 5%e than 5%e than 5%sharsharsharsharshares of the ces of the ces of the ces of the ces of the companompanompanompanompanyyyyy::::: % of Share Holding
EEEEEquitquitquitquitquity Shary Shary Shary Shary Shares of Rses of Rses of Rses of Rses of Rs. 10 each Held B. 10 each Held B. 10 each Held B. 10 each Held B. 10 each Held Byyyyy
EEEEEquitquitquitquitquity Shary Shary Shary Shary Shares of Rses of Rses of Rses of Rses of Rs. 10 each Held B. 10 each Held B. 10 each Held B. 10 each Held B. 10 each Held Byyyyy
Share Holder Name
31-03-2012 31-03-2011
1. Internet Business Corporation 75,89,349 75,89,349 38.66% 38.66%
2. SmarShift AG 20,56,000 20,56,000 10.48% 10.48%
3. OurVox Holdings LLC 17,50,000 17,50,000 8.91% 8.91%
Notes to Financial Statements for the year ended March 31, 2012

AAAAAnnual Rnnual Rnnual Rnnual Rnnual Reporeporeporeporeporttttt 2011-2012 2011-2012 2011-2012 2011-2012 2011-2012
3939393939
NotNotNotNotNotes :es :es :es :es :
NONONONONOTE NOTE NOTE NOTE NOTE NO. 2 : RESER. 2 : RESER. 2 : RESER. 2 : RESER. 2 : RESERVES AND SURPLVES AND SURPLVES AND SURPLVES AND SURPLVES AND SURPLUSUSUSUSUS
S. NoS. NoS. NoS. NoS. No..... PPPPParararararticularsticularsticularsticularsticulars AAAAAs on 31-03-2012s on 31-03-2012s on 31-03-2012s on 31-03-2012s on 31-03-2012 AAAAAs on 31-03-2011s on 31-03-2011s on 31-03-2011s on 31-03-2011s on 31-03-2011
`̀̀̀̀ `̀̀̀̀
a) Capital Redemption reserve
As at the commencement of the year 499,000 499,000
Add: Additions during the year - - - - - -
Less: Utilised during the year - - - - - -
499,000 499,000
b) Securities Premium Reserve
As at the commencement of the year 225,215,578 225,215,578
Add: Additions during the year - - - - - -
Less: Utilised during the year - - - - - -
225,215,578 225,215,578
c) Surpuls :
i) Opening Balance - Profit and Loss Account (124,864,382) 60,416,286
Add: Transfer from Profit & Loss Account (569,333,456) (185,280,668)
Less: Transfer To General Reserve - - - - - -
Less: Goodwill Written Off ----- - - - - -
(694,197,839) (124,864,382)
ii) Dividend - - - - - -
iii) Transfer to / from reserves (133,281,099) (34,779,689)
(827,478,937) (159,644,071)
II A Reserve specifically represented by earmarked investments - -----
III Negative balance of reserves and surplus account - -----
TTTTTotal Rotal Rotal Rotal Rotal Reseresereseresereservvvvves and Sures and Sures and Sures and Sures and Surplusplusplusplusplus (601,764,359)(601,764,359)(601,764,359)(601,764,359)(601,764,359) 66,070,50766,070,50766,070,50766,070,50766,070,507
NONONONONOTE NOTE NOTE NOTE NOTE NO. 3 : L. 3 : L. 3 : L. 3 : L. 3 : LONG ONG ONG ONG ONG TERM BORRTERM BORRTERM BORRTERM BORRTERM BORROWINGSOWINGSOWINGSOWINGSOWINGS
S.NoS.NoS.NoS.NoS.No..... PPPPParararararticularsticularsticularsticularsticulars AAAAAs on 31-03-2012s on 31-03-2012s on 31-03-2012s on 31-03-2012s on 31-03-2012 AAAAAs on 31-03-2011s on 31-03-2011s on 31-03-2011s on 31-03-2011s on 31-03-2011`̀̀̀̀ `̀̀̀̀
Debentures - - - - - 424,175,000
(No. of Bonds, Face Value, rate of Interest has to be given) - 424,175,000
b) i) Term Loans
From Banks - - - - - -
From Financial Institutions - - - - - -
From Others 741,820,000 223,250,000
7777741,820,00041,820,00041,820,00041,820,00041,820,000 223,250,000 223,250,000 223,250,000 223,250,000 223,250,000
TTTTTotal Lotal Lotal Lotal Lotal Long ong ong ong ong TTTTTerererererm Bm Bm Bm Bm Borororororrrrrrooooowingswingswingswingswings 741,820,000 741,820,000 741,820,000 741,820,000 741,820,000 647,425,000 647,425,000 647,425,000 647,425,000 647,425,000

AAAAAnnual Rnnual Rnnual Rnnual Rnnual Reporeporeporeporeporttttt 2011-2012 2011-2012 2011-2012 2011-2012 2011-2012
4040404040
NONONONONOTE NOTE NOTE NOTE NOTE NO. 4 : DEFERRED . 4 : DEFERRED . 4 : DEFERRED . 4 : DEFERRED . 4 : DEFERRED TTTTTAAAAAX LIABILITX LIABILITX LIABILITX LIABILITX LIABILITY (NEY (NEY (NEY (NEY (NETTTTT)))))
S. NoS. NoS. NoS. NoS. No..... PPPPParararararticularsticularsticularsticularsticulars AAAAAs on 31-03-2012s on 31-03-2012s on 31-03-2012s on 31-03-2012s on 31-03-2012 AAAAAs on 31-03-2011s on 31-03-2011s on 31-03-2011s on 31-03-2011s on 31-03-2011
`̀̀̀̀ `̀̀̀̀
I Opening Deferred tax Liability 10,355,890 2,879,831
Add:
Deferred Tax Liability for the year (Due to SLM and WDV Difference) (15,388,705) -
Deferred Tax Liability for the year (Due to Others ) - 7,476,059
GrGrGrGrGross Doss Doss Doss Doss Defefefefeferererererrrrrred tax Liabilited tax Liabilited tax Liabilited tax Liabilited tax Liabilityyyyy (5,032,815) (5,032,815) (5,032,815) (5,032,815) (5,032,815) 10,355,890 10,355,890 10,355,890 10,355,890 10,355,890
Opening Deferred tax Asset -
Provision for Gratuity and Compensated Absences - -
Provision for Doubtful Debts - -
Provision for Other Disallowances - -
GrGrGrGrGross Doss Doss Doss Doss Defefefefeferererererrrrrred tax Aed tax Aed tax Aed tax Aed tax Assetssetssetssetsset - -
DDDDDefefefefeferererererrrrrred ed ed ed ed TTTTTax Liabilitax Liabilitax Liabilitax Liabilitax Liability / (y / (y / (y / (y / (AAAAAsset) - Netsset) - Netsset) - Netsset) - Netsset) - Net 5,032,815 5,032,815 5,032,815 5,032,815 5,032,815 10,355,890 10,355,890 10,355,890 10,355,890 10,355,890
NONONONONOTE NOTE NOTE NOTE NOTE NO. 5 : L. 5 : L. 5 : L. 5 : L. 5 : LONG ONG ONG ONG ONG TERM PRTERM PRTERM PRTERM PRTERM PROVISIONSOVISIONSOVISIONSOVISIONSOVISIONS
S. NoS. NoS. NoS. NoS. No..... PPPPParararararticularsticularsticularsticularsticulars AAAAAs on 31-03-2012s on 31-03-2012s on 31-03-2012s on 31-03-2012s on 31-03-2012 AAAAAs on 31-03-2011s on 31-03-2011s on 31-03-2011s on 31-03-2011s on 31-03-2011
`̀̀̀̀ `̀̀̀̀
I a) Provisions for employee benefits
- Provision for Gratuity 8,549,290 7,491,540
- Provision for Leave Encashment 2,417,754 2,330,344
b) Others - - - - - -
TTTTTotal Lotal Lotal Lotal Lotal Long ong ong ong ong TTTTTerererererm Pm Pm Pm Pm Prrrrrooooovisionsvisionsvisionsvisionsvisions 10,967,044 10,967,044 10,967,044 10,967,044 10,967,044 9,821,884 9,821,884 9,821,884 9,821,884 9,821,884
NONONONONOTE NOTE NOTE NOTE NOTE NO. 6 : SHOR. 6 : SHOR. 6 : SHOR. 6 : SHOR. 6 : SHORT T T T T TERM BORRTERM BORRTERM BORRTERM BORRTERM BORROWINGSOWINGSOWINGSOWINGSOWINGS
S.NoS.NoS.NoS.NoS.No..... PPPPParararararticularsticularsticularsticularsticulars AAAAAs on 31-03-2012s on 31-03-2012s on 31-03-2012s on 31-03-2012s on 31-03-2012 AAAAAs on 31-03-2011s on 31-03-2011s on 31-03-2011s on 31-03-2011s on 31-03-2011
`̀̀̀̀ `̀̀̀̀
I ShorShorShorShorShort tt tt tt tt terererererm borm borm borm borm borrrrrrooooowingswingswingswingswings
a)a)a)a)a) CCCCCash Cash Cash Cash Cash Crrrrreditseditseditseditsedits
Loan from Bank 41,626,673 74,049,767
b) Other than Bank 49,480,000 - - - - -
NotNotNotNotNotes:es:es:es:es:
PPPPPrrrrrimarimarimarimarimary secury secury secury secury securititititityyyyy::::: Hypothecation of entire current assets and movablefixed assets (except hire purchase vehicles) of the company, both presentand future.
CCCCCollaollaollaollaollattttterererereral secural secural secural secural securititititityyyyy::::: Extn of EM of land and Building of Cambridge TechnologyIndia Pvt Ltd., situated at Plot No.22 within Sy. No.14 of Electronic City,Bangalore, admeasuring 43518.94 Sft (4047.00 Sq.mts)
PPPPPersonal guarersonal guarersonal guarersonal guarersonal guarananananantttttee ee ee ee ee of Shri DRR Swaroop, Whole-Time director of the company
TTTTTotal Shorotal Shorotal Shorotal Shorotal Short t t t t TTTTTerererererm Bm Bm Bm Bm Borororororrrrrrooooowingswingswingswingswings 91,106,673 91,106,673 91,106,673 91,106,673 91,106,673 74,049,767 74,049,767 74,049,767 74,049,767 74,049,767

AAAAAnnual Rnnual Rnnual Rnnual Rnnual Reporeporeporeporeporttttt 2011-2012 2011-2012 2011-2012 2011-2012 2011-2012
4141414141
NONONONONOTE NOTE NOTE NOTE NOTE NO. 7 : . 7 : . 7 : . 7 : . 7 : TRTRTRTRTRADE PADE PADE PADE PADE PAAAAAYYYYYABLESABLESABLESABLESABLES
S. NoS. NoS. NoS. NoS. No..... PPPPParararararticularsticularsticularsticularsticulars AAAAAs on 31-03-2012s on 31-03-2012s on 31-03-2012s on 31-03-2012s on 31-03-2012 AAAAAs on 31-03-2011s on 31-03-2011s on 31-03-2011s on 31-03-2011s on 31-03-2011
`̀̀̀̀ `̀̀̀̀
I a) Trade Payables
(a) Outstanding for a period exceeding three years - -
(b) Outstanding for a period exceeding six months 27,306,581 16,332,628
(c) Others 33,186,831 36,998,941
TTTTTotal otal otal otal otal TTTTTrrrrrade Pade Pade Pade Pade Paaaaayyyyyablesablesablesablesables 60,493,411.88 60,493,411.88 60,493,411.88 60,493,411.88 60,493,411.88 53,331,569.00 53,331,569.00 53,331,569.00 53,331,569.00 53,331,569.00
NONONONONOTE NOTE NOTE NOTE NOTE NO. 8 : O. 8 : O. 8 : O. 8 : O. 8 : OTHER CURRENT LIABILITESTHER CURRENT LIABILITESTHER CURRENT LIABILITESTHER CURRENT LIABILITESTHER CURRENT LIABILITES
S.NoS.NoS.NoS.NoS.No..... PPPPParararararticularsticularsticularsticularsticulars AAAAAs on 31-03-2012s on 31-03-2012s on 31-03-2012s on 31-03-2012s on 31-03-2012 AAAAAs on 31-03-2011s on 31-03-2011s on 31-03-2011s on 31-03-2011s on 31-03-2011
`̀̀̀̀ `̀̀̀̀
I a) Other Payables (Specify the nature)
(i) Interest, Rates & Taxes 13,480,812 6,643,965
(ii) CTE-Trust (ESOP) 18,700,683 16,168,591
(iii) Advance Billings / Income Received in Advance 1,448,498 15,700,054
(iv) M & A Payable 17,555,837 15,321,894
(v) Miscellaneous / Rounding-up - 623,207
(vi) Electricity charges payable 113,394 -
(vii) Provision for Dividend 83,286 -
(viii) Share refund 75,939 75,939
(ix) TDS 8,148,721 13,803,119
(x) Salaries & Benefits 23,990,022 19,488,523
TTTTTotal Ootal Ootal Ootal Ootal Other Cther Cther Cther Cther Curururururrrrrrenenenenent Liabilitt Liabilitt Liabilitt Liabilitt Liabiliteseseseses 83,597,193 83,597,193 83,597,193 83,597,193 83,597,193 87,825,292 87,825,292 87,825,292 87,825,292 87,825,292
NONONONONOTE NOTE NOTE NOTE NOTE NO. 9 : SHOR. 9 : SHOR. 9 : SHOR. 9 : SHOR. 9 : SHORT T T T T TERM PRTERM PRTERM PRTERM PRTERM PROVISIONSOVISIONSOVISIONSOVISIONSOVISIONS
S.NoS.NoS.NoS.NoS.No..... PPPPParararararticularsticularsticularsticularsticulars AAAAAs on 31-03-2012s on 31-03-2012s on 31-03-2012s on 31-03-2012s on 31-03-2012 AAAAAs on 31-03-2011s on 31-03-2011s on 31-03-2011s on 31-03-2011s on 31-03-2011`̀̀̀̀ `̀̀̀̀
I a) Provisions for employee benefits
Bonus 28,984,157 14,503,905
Employee related payments 829,530 658,419
b) Others
Statutory Liabilities
Provision for incometax 8,862,401 6,484,642
Provision for Expenses
Audit fee 1,155,392 960,700
Provision for Outstanding Expenses 9,041,975 5,866,740
Provision for Sub-Contract Fee 19,008,593 42,705,768
TTTTTotal Shorotal Shorotal Shorotal Shorotal Short t t t t TTTTTerererererm Pm Pm Pm Pm Prrrrrooooovisionsvisionsvisionsvisionsvisions 67,882,047 67,882,047 67,882,047 67,882,047 67,882,047 71,180,174 71,180,174 71,180,174 71,180,174 71,180,174

AAAAAnnual Rnnual Rnnual Rnnual Rnnual Reporeporeporeporeporttttt 2011-2012 2011-2012 2011-2012 2011-2012 2011-2012
4242424242
Con
solid
ated
Fix
ed A
sset
s fo
r co
nsol
idat
ed b
alan
cesh
eet
NO
TE N
O :
10 T
AN
GIB
LE &
INTA
NG
IBLE
ASS
ETS
AS
AT
31-0
3-20
12
AAAA A mou
nmo
unmo
unmo
unmo
unt i
nt i
nt i
nt i
nt i
n ` ` ` ` `
Gr
Gr
Gr
Gr
Gr o
ss Blo
ckos
s Bloc
kos
s Bloc
kos
s Bloc
kos
s Bloc
k
D
epr
D ep
r
D
epr
D ep
r
D
epr ec
iaec
iaec
iaec
iaec
ia tion
/Atio
n/A
tion/
Atio
n/A
tion/
A mor
mor
mor
mor
mor ti
zatiza
tiza
tiza
tiza ti
ontion
tion
tion
tion
Net
Block
Net
Block
Net
Block
Net
Block
Net
Block
SlSlSlSl Sl . N
o. N
o. N
o. N
o. N
o .... .PPPP P a
rararar artic
ulars
ticula
rstic
ulars
ticula
rstic
ulars
AAAA A s ons o
ns o
ns o
ns o
nAAAA A d
dition
sdd
ition
sdd
ition
sdd
ition
sdd
ition
sAAAA A d
dition
sdd
ition
sdd
ition
sdd
ition
sdd
ition
sSa
le /
Sale
/Sa
le /
Sale
/Sa
le /
AAAA A s ons o
ns o
ns o
ns o
nDDDD D e
pepepep ep.... .
DDDD D epepepep ep
. F. F. F. F . Forororor or
DDDD D elet
ions
eletio
nsele
tions
eletio
nsele
tions
IIII I mpa
irmp
airmp
airmp
airmp
airme
nme
nme
nme
nme
n tttt tT TTT T o
tal
otal
otal
otal
otal
AAAA A s ons o
ns o
ns o
ns o
nAAAA A s
ons on
s on
s on
s on
01.04
.2011
01.04
.2011
01.04
.2011
01.04
.2011
01.04
.2011
dur
dur
dur
dur
dur in
gin
ging
ing ing
thr
thr
thr
thr
thr o
ugh
ough
ough
ough
ough
DDDD D elet
ions
eletio
nsele
tions
eletio
nsele
tions
31.03
.2012
31.03
.2012
31.03
.2012
31.03
.2012
31.03
.2012
AAAA A s o
ns
ons
ons
ons
onth
e yth
e yth
e yth
e yth
e yea
rea
rea
rea
rea
rDDDD D u
rururur urin
gin
gin
gin
gin
g L L L L L o
ss /
oss /
oss /
oss /
oss /
DDDD D eprep
rep
rep
rep
r eci-
eci-
eci-
eci-
eci-
31.03
.2012
31.03
.2012
31.03
.2012
31.03
.2012
31.03
.2012
31.03
.2011
31.03
.2011
31.03
.2011
31.03
.2011
31.03
.2011
the y
the y
the y
the y
the y
ear
ear
ear
ear
ear
Busin
ess
Busin
ess
Busin
ess
Busin
ess
Busin
ess
dur
dur
dur
dur
dur in
gin
ging
ing ing
01.04
.2011
01.04
.2011
01.04
.2011
01.04
.2011
01.04
.2011
2011
-201
220
11-2
012
2011
-201
220
11-2
012
2011
-201
2 th
e y th
e y th
e y th
e y th
e yea
rea
rea
rea
rea
rRRRR R e
vevevev ever
sal
ersa
ler
sal
ersa
ler
sal
aaa a a tiontio
ntio
ntio
ntio
nacacacac ac
quisi
tions
quisi
tions
quisi
tions
quisi
tions
quisi
tions
the y
the y
the y
the y
the y
ear
ear
ear
ear
ear
TTTT T angan
gan
gan
gan
g ible
Aib
le A
ible
Aib
le A
ible
A sse
tssse
tssse
tssse
tssse
ts
1111 1La
nd6,2
12,88
0-
--
6,212
,880
6,212
,880
6,212
,880
6,212
,880
6,212
,880
-
-
-
----- -
6,212
,880
6,212
,880
6,212
,880
6,212
,880
6,212
,880
6,212
,880
6,212
,880
6,212
,880
6,212
,880
6,212
,880
2222 2Bu
ilding
9
,520,2
306,2
11,49
0-
---- -15
,731,7
2015
,731,7
2015
,731,7
2015
,731,7
2015
,731,7
201,2
79,74
657
4,157
---- ----- -
1,853
,903
1,853
,903
1,853
,903
1,853
,903
1,853
,903
13,87
7,817
13,87
7,817
13,87
7,817
13,87
7,817
13,87
7,817
8,240
,484
8,240
,484
8,240
,484
8,240
,484
8,240
,484
3333 3Pla
nt & M
achin
ery
21,86
3,579
5,208
,907
- 1,
175,8
7925
,896,6
0725
,896,6
0725
,896,6
0725
,896,6
0725
,896,6
07 1
4,838
,405
5,928
,237
502,5
22
-20
,264,1
2020
,264,1
2020
,264,1
2020
,264,1
2020
,264,1
20 5,
632,4
87 5,
632,4
87 5,
632,4
87 5,
632,4
87 5,
632,4
877,0
25,17
47,0
25,17
47,0
25,17
47,0
25,17
47,0
25,17
4
4444 4Co
mpute
rs an
d Soft
ware
63,76
8,415
14
,765,1
93-
1,515
,961
77,01
7,647
77,01
7,647
77,01
7,647
77,01
7,647
77,01
7,647
59,50
3,204
7,33
1,193
3,010
,185
-
63,82
4,212
63,82
4,212
63,82
4,212
63,82
4,212
63,82
4,212
13,19
3,435
13,19
3,435
13,19
3,435
13,19
3,435
13,19
3,435
4,26
5,211
4,26
5,211
4,26
5,211
4,26
5,211
4,26
5,211
5 555 5Fu
rnitur
e & Fi
xtures
15
,884,9
513,5
30,12
4-
5,519
,811
13,89
5,264
13,89
5,264
13,89
5,264
13,89
5,264
13,89
5,264
13,3
35,62
51,8
74,38
83,3
20,90
7
-11
,889,1
0611
,889,1
0611
,889,1
0611
,889,1
0611
,889,1
062,0
06,15
82,0
06,15
82,0
06,15
82,0
06,15
82,0
06,15
82,5
49,32
62,5
49,32
62,5
49,32
62,5
49,32
62,5
49,32
6
TTTT T ota
l ot
al ot
al ot
al ot
al TTTT T a
ngang
ang
ang
ang ib
le A
ible
Aibl
e A
ible
Aibl
e A s
sets
ssets
ssets
ssets
ssets
117
,250,0
55 1
17,25
0,055
117
,250,0
55 1
17,25
0,055
117
,250,0
55
29,71
5,714
29
,715,7
14
29,71
5,714
29
,715,7
14
29,71
5,714
-8,2
11,65
18,2
11,65
18,2
11,65
18,2
11,65
18,2
11,65
1
138,7
54,11
8
138,7
54,11
8
138,7
54,11
8
138,7
54,11
8
138,7
54,11
888
,956,9
8088
,956,9
8088
,956,9
8088
,956,9
8088
,956,9
8015
,707,9
7515
,707,9
7515
,707,9
7515
,707,9
7515
,707,9
75 6
,833,6
14 6
,833,6
14 6
,833,6
14 6
,833,6
14 6
,833,6
14 - - - - -
97,83
1,341
97,83
1,341
97,83
1,341
97,83
1,341
97,83
1,341
40,92
2,777
40,92
2,777
40,92
2,777
40,92
2,777
40,92
2,777
28,29
3,076
28,29
3,076
28,29
3,076
28,29
3,076
28,29
3,076
IIII I nnnn nta
ngta
ngta
ngta
ngta
ngibl
e Aibl
e Aibl
e Aibl
e Aibl
e Asse
tssse
tssse
tssse
tssse
ts
6666 6Co
mpute
r Soft
ware
used
inDe
velop
ment
of Pro
ject
65,80
0,616
- -
65,80
0,616
65,80
0,616
65,80
0,616
65,80
0,616
65,80
0,616
55,87
9,749
9,920
,867
--
65,80
0,616
65,8
00,61
6
6
5,800
,616
65,8
00,61
6
6
5,800
,616
---- -9,9
20,86
79,9
20,86
79,9
20,86
79,9
20,86
79,9
20,86
7
7777 7Int
ernall
y dev
elopo
ed S
oftwa
re-Re
usab
le co
mpon
ents
librar
y31
6,747
,420
-
--
316,7
47,42
031
6,747
,420
316,7
47,42
031
6,747
,420
316,7
47,42
018
9,520
,606
72,78
2,553
-9,92
0,867
44,52
3,396
316,7
47,42
231
6,747
,422
316,7
47,42
231
6,747
,422
316,7
47,42
2---- -
127,2
26,81
412
7,226
,814
127,2
26,81
412
7,226
,814
127,2
26,81
4
TTTT T otal
Iot
al I
otal
Iot
al I
otal
I nnnn n tan
gta
ngta
ngta
ngta
ngib
le A
ible
Aib
le A
ible
Aib
le A s
sets
ssets
ssets
ssets
ssets
382,5
48,03
638
2,548
,036
382,5
48,03
638
2,548
,036
382,5
48,03
6---- -
---- ----- -
382,5
48,03
638
2,548
,036
382,5
48,03
638
2,548
,036
382,5
48,03
624
5,400
,355
245,4
00,35
524
5,400
,355
245,4
00,35
524
5,400
,355
82,70
3,420
82,70
3,420
82,70
3,420
82,70
3,420
82,70
3,420
-9,92
0,867
-9,92
0,867
-9,92
0,867
-9,92
0,867
-9,92
0,867
44,52
3,396
44,52
3,396
44,52
3,396
44,52
3,396
44,52
3,396
382,5
48,03
838
2,548
,038
382,5
48,03
838
2,548
,038
382,5
48,03
8---- -
137,1
47,68
113
7,147
,681
137,1
47,68
113
7,147
,681
137,1
47,68
1
TTTT T OOOO OTTTT T A
L FIX
ED A
SSE
AL FI
XED
ASSE
AL FI
XED
ASSE
AL FI
XED
ASSE
AL FI
XED
ASSE
TTTT T SSSS S49
9,798
,091
499,7
98,09
149
9,798
,091
499,7
98,09
149
9,798
,091
29,71
5,714
29,71
5,714
29,71
5,714
29,71
5,714
29,71
5,714
- - - - - 8,
211,6
51 8,
211,6
51 8,
211,6
51 8,
211,6
51 8,
211,6
5152
1,302
,154
521,3
02,15
452
1,302
,154
521,3
02,15
452
1,302
,154
334,3
57,33
533
4,357
,335
334,3
57,33
533
4,357
,335
334,3
57,33
598
,411,3
9598
,411,3
9598
,411,3
9598
,411,3
9598
,411,3
95 -3
,087,2
53 -3
,087,2
53 -3
,087,2
53 -3
,087,2
53 -3
,087,2
5344
,523,3
9644
,523,3
9644
,523,3
9644
,523,3
9644
,523,3
9648
0,379
,379
480,3
79,37
948
0,379
,379
480,3
79,37
948
0,379
,379
40,92
2,777
40,92
2,777
40,92
2,777
40,92
2,777
40,92
2,777
165,4
40,75
716
5,440
,757
165,4
40,75
716
5,440
,757
165,4
40,75
7
PRE
PRE
PRE
PRE
PRE V
IOUS
VIO
US
VIOUS
VIO
US
VIOUS
YYYY Y EAREA
REA
REA
REA
R40
0,946
,846
400,9
46,84
640
0,946
,846
400,9
46,84
640
0,946
,846
111,7
14,95
511
1,714
,955
111,7
14,95
511
1,714
,955
111,7
14,95
5---- -
12,86
3,710
12,86
3,710
12,86
3,710
12,86
3,710
12,86
3,710
499,7
98,09
149
9,798
,091
499,7
98,09
149
9,798
,091
499,7
98,09
123
6,174
,090
236,1
74,09
023
6,174
,090
236,1
74,09
023
6,174
,090
108,4
95,76
410
8,495
,764
108,4
95,76
410
8,495
,764
108,4
95,76
410
,312,5
1910
,312,5
1910
,312,5
1910
,312,5
1910
,312,5
19---- -
334,3
57,33
533
4,357
,335
334,3
57,33
533
4,357
,335
334,3
57,33
516
5,440
,757
165,4
40,75
716
5,440
,757
165,4
40,75
716
5,440
,757
164,7
72,75
616
4,772
,756
164,7
72,75
616
4,772
,756
164,7
72,75
6

AAAAAnnual Rnnual Rnnual Rnnual Rnnual Reporeporeporeporeporttttt 2011-2012 2011-2012 2011-2012 2011-2012 2011-2012
4343434343
NONONONONOTE NOTE NOTE NOTE NOTE NO. 11 : O. 11 : O. 11 : O. 11 : O. 11 : OTHER NON CURRENT ASSETHER NON CURRENT ASSETHER NON CURRENT ASSETHER NON CURRENT ASSETHER NON CURRENT ASSETTTTTSSSSS
S. NoS. NoS. NoS. NoS. No..... PPPPParararararticularsticularsticularsticularsticulars Non C Non C Non C Non C Non Curururururrrrrrenenenenenttttt
AAAAAs ons ons ons ons on AAAAAs ons ons ons ons on31-03-201231-03-201231-03-201231-03-201231-03-2012 31-03-201131-03-201131-03-201131-03-201131-03-2011
`̀̀̀̀ `̀̀̀̀
I (a) Taxes Recivable 15,685,753 25,353,518
(b) Unbilled Revenue 57,807,653 18,707,335
TTTTTotal Ootal Ootal Ootal Ootal Other Ather Ather Ather Ather Assetsssetsssetsssetsssets 73,493,406 73,493,406 73,493,406 73,493,406 73,493,406 44,060,853 44,060,853 44,060,853 44,060,853 44,060,853
NONONONONOTE NOTE NOTE NOTE NOTE NO. 12 : CURRENT INVESTMENT. 12 : CURRENT INVESTMENT. 12 : CURRENT INVESTMENT. 12 : CURRENT INVESTMENT. 12 : CURRENT INVESTMENTSSSSS
S. NoS. NoS. NoS. NoS. No..... PPPPParararararticularsticularsticularsticularsticulars A A A A As ons ons ons ons on AAAAAs ons ons ons ons on31-03-201231-03-201231-03-201231-03-201231-03-2012 31-03-201131-03-201131-03-201131-03-201131-03-2011
`̀̀̀̀ `̀̀̀̀
I Current Investments :
a) Investment in Mutual funds - 12,632,564
TTTTTotal Cotal Cotal Cotal Cotal Curururururrrrrrenenenenent It It It It Innnnnvvvvvestmenestmenestmenestmenestmentststststs - - - - - 12,632,564 12,632,564 12,632,564 12,632,564 12,632,564
NONONONONOTE NOTE NOTE NOTE NOTE NO. 13 : INVENT. 13 : INVENT. 13 : INVENT. 13 : INVENT. 13 : INVENTORIESORIESORIESORIESORIES
S. NoS. NoS. NoS. NoS. No..... PPPPParararararticularsticularsticularsticularsticulars A A A A As ons ons ons ons on AAAAAs ons ons ons ons on31-03-201231-03-201231-03-201231-03-201231-03-2012 31-03-201131-03-201131-03-201131-03-201131-03-2011
`̀̀̀̀ `̀̀̀̀
I Inventories :
a) Stores and spares 536,024 247,156
b) Loose tools - - - - - -
c) Others - - - - - -
TTTTTotal Iotal Iotal Iotal Iotal Innnnnvvvvvenenenenentttttorororororiesiesiesiesies 536,024 247,156
Notes to Financial Statements for the year ended March 31, 2012

AAAAAnnual Rnnual Rnnual Rnnual Rnnual Reporeporeporeporeporttttt 2011-2012 2011-2012 2011-2012 2011-2012 2011-2012
4444444444
NONONONONOTE NOTE NOTE NOTE NOTE NO. 14 : . 14 : . 14 : . 14 : . 14 : TRTRTRTRTRADE RECEIVADE RECEIVADE RECEIVADE RECEIVADE RECEIVABLESABLESABLESABLESABLES
S. NoS. NoS. NoS. NoS. No..... PPPPParararararticularsticularsticularsticularsticulars A A A A As ons ons ons ons on AAAAAs ons ons ons ons on31-03-201231-03-201231-03-201231-03-201231-03-2012 31-03-201131-03-201131-03-201131-03-201131-03-2011
`̀̀̀̀ `̀̀̀̀
I OOOOOutstanding futstanding futstanding futstanding futstanding for a peror a peror a peror a peror a period eiod eiod eiod eiod exxxxxccccceeding six moneeding six moneeding six moneeding six moneeding six months frths frths frths frths from the daom the daom the daom the daom the dattttteeeeethey arthey arthey arthey arthey are due fe due fe due fe due fe due for paor paor paor paor paymenymenymenymenymenttttt
(a) Secured, Considered Good 18,119,036 35,038,824
(b) Unsecured, Considered Good - - - - - -
(c) Doubtful - - - - - - - - - -
18,119,036 35,038,824
Less: Allowance for Bad & Doubtful Debts - -
18,119,036 35,038,824
OOOOOther Rther Rther Rther Rther Recececececeiveiveiveiveivables:ables:ables:ables:ables:
(a) Secured, Considered Good 110,787,434 76,750,055
(b) Unsecured, Considered Good - -
(c) Doubtful - -
110,787,434 76,750,055
Less : Allowance for bad & doubtful debts - -
110,787,434 76,750,055
TTTTTotal otal otal otal otal TTTTTrrrrrade Rade Rade Rade Rade Recececececeiveiveiveiveivablesablesablesablesables 128,906,470 128,906,470 128,906,470 128,906,470 128,906,470 111,788,879111,788,879111,788,879111,788,879111,788,879
NONONONONOTE NOTE NOTE NOTE NOTE NO. 15 : C. 15 : C. 15 : C. 15 : C. 15 : CASH AND BANK BALANCESASH AND BANK BALANCESASH AND BANK BALANCESASH AND BANK BALANCESASH AND BANK BALANCES
S. NoS. NoS. NoS. NoS. No..... PPPPParararararticularsticularsticularsticularsticulars A A A A As ons ons ons ons on AAAAAs ons ons ons ons on31-03-201231-03-201231-03-201231-03-201231-03-2012 31-03-201131-03-201131-03-201131-03-201131-03-2011
`̀̀̀̀ `̀̀̀̀
I Cash and cash eqivalents :
a) Balances with banks :
1) On Current Accounts 35,467,787 78,525,358
2) Un Paid Dividend Account 84,046 -
3) Other Bank Accounts 150,499 234,670
b) Cheques, Draft on hand - -
c) Cash on hand 137,781 81,571
Sub Total 35,840,113 35,840,113 35,840,113 35,840,113 35,840,113 78,841,599 78,841,599 78,841,599 78,841,599 78,841,599
TTTTTotal Cotal Cotal Cotal Cotal Cash and Cash and Cash and Cash and Cash and Cash Eash Eash Eash Eash Equivquivquivquivquivalenalenalenalenalentststststs 35,840,113 35,840,113 35,840,113 35,840,113 35,840,113 78,841,599 78,841,599 78,841,599 78,841,599 78,841,599

AAAAAnnual Rnnual Rnnual Rnnual Rnnual Reporeporeporeporeporttttt 2011-2012 2011-2012 2011-2012 2011-2012 2011-2012
4545454545
NONONONONOTE NOTE NOTE NOTE NOTE NO. 16 : L. 16 : L. 16 : L. 16 : L. 16 : LOOOOOANS AND ADVANS AND ADVANS AND ADVANS AND ADVANS AND ADVANCESANCESANCESANCESANCES
S. NoS. NoS. NoS. NoS. No..... PPPPParararararticularsticularsticularsticularsticulars C C C C Curururururrrrrrenenenenenttttt
AAAAAs ons ons ons ons on AAAAAs ons ons ons ons on31-03-201231-03-201231-03-201231-03-201231-03-2012 31-03-201131-03-201131-03-201131-03-201131-03-2011
`̀̀̀̀ `̀̀̀̀
I (a) Rental Deposit 9,245,001 7,025,427
(b) Electricity Deposit 268,648 -
(c) Fixed Deposit with Bank 376,230 658,333
(d) Gust House - Deposite - Srinagar Colony 66,000 -
(e) Fixed Deposit with Customs Dept. - 145,990
(f ) EMD 156,709 323,712
(g) Security Deposits with others 1,933,697 237,298
(h) FD with State Bank of Hyderabad 337,800 -
Sub Total 12,384,085 12,384,085 12,384,085 12,384,085 12,384,085 8,390,760 8,390,760 8,390,760 8,390,760 8,390,760
UnsecurUnsecurUnsecurUnsecurUnsecurededededed, C, C, C, C, Consideronsideronsideronsideronsidered Ged Ged Ged Ged Goodoodoodoodood
Loans and Advances to Employees 523,409 1,745,021
Others 63,432,932 54,548,905
Advances Recoverable in Cash or in kind 445,839 636,264
Sub Total 64,402,180 64,402,180 64,402,180 64,402,180 64,402,180 56,930,190 56,930,190 56,930,190 56,930,190 56,930,190
TTTTTotal Shorotal Shorotal Shorotal Shorotal Short t t t t TTTTTerererererm Lm Lm Lm Lm Loans and Aoans and Aoans and Aoans and Aoans and Advdvdvdvdvancancancancanceseseseses 76,786,265 76,786,265 76,786,265 76,786,265 76,786,265 65,320,950 65,320,950 65,320,950 65,320,950 65,320,950
NONONONONOTE NOTE NOTE NOTE NOTE NO. 17 : O. 17 : O. 17 : O. 17 : O. 17 : OTHER CURRENT ASSETHER CURRENT ASSETHER CURRENT ASSETHER CURRENT ASSETHER CURRENT ASSETTTTTSSSSS
S. NoS. NoS. NoS. NoS. No..... PPPPParararararticularsticularsticularsticularsticulars C C C C Curururururrrrrrenenenenenttttt
AAAAAs ons ons ons ons on AAAAAs ons ons ons ons on31-03-201231-03-201231-03-201231-03-201231-03-2012 31-03-201131-03-201131-03-201131-03-201131-03-2011
`̀̀̀̀ `̀̀̀̀
I Interest Accrued on Deposits 57,406 473,231
Input Taxes 18,492,366 15,463,277
Input Service tax & Advance Tax 2,000,000 -
Prepaid Expenses 3,886,704 -
TTTTTotal Ootal Ootal Ootal Ootal Other Ather Ather Ather Ather Assetsssetsssetsssetsssets 27,933,616 27,933,616 27,933,616 27,933,616 27,933,616 18,972,755 18,972,755 18,972,755 18,972,755 18,972,755

AAAAAnnual Rnnual Rnnual Rnnual Rnnual Reporeporeporeporeporttttt 2011-2012 2011-2012 2011-2012 2011-2012 2011-2012
4646464646
Notes to Financial Statements for the year ended March 31, 2012
NONONONONOTE NOTE NOTE NOTE NOTE NO. 18 : RE. 18 : RE. 18 : RE. 18 : RE. 18 : REVENUE FRVENUE FRVENUE FRVENUE FRVENUE FROM OPEROM OPEROM OPEROM OPEROM OPERAAAAATIONSTIONSTIONSTIONSTIONS
S.NoS.NoS.NoS.NoS.No..... PPPPParararararticularsticularsticularsticularsticulars YYYYYear Endedear Endedear Endedear Endedear Ended YYYYYear Endedear Endedear Endedear Endedear Ended31-03-201231-03-201231-03-201231-03-201231-03-2012 31-03-2011 31-03-2011 31-03-2011 31-03-2011 31-03-2011
`̀̀̀̀ `̀̀̀̀
I Revenue from operations in respect of non-finance company
(a) Sale of Services 749,979,636 589,104,233
TTTTTotal Rotal Rotal Rotal Rotal Revevevevevenue frenue frenue frenue frenue from Operom Operom Operom Operom Operaaaaationstionstionstionstions 749,979,636 749,979,636 749,979,636 749,979,636 749,979,636 589,104,233 589,104,233 589,104,233 589,104,233 589,104,233
NONONONONOTE NOTE NOTE NOTE NOTE NO. 19 : O. 19 : O. 19 : O. 19 : O. 19 : OTHER INCTHER INCTHER INCTHER INCTHER INCOMEOMEOMEOMEOME
S.NoS.NoS.NoS.NoS.No..... PPPPParararararticularsticularsticularsticularsticulars YYYYYear Endedear Endedear Endedear Endedear Ended YYYYYear Endedear Endedear Endedear Endedear Ended31-03-201231-03-201231-03-201231-03-201231-03-2012 31-03-2011 31-03-2011 31-03-2011 31-03-2011 31-03-2011
`̀̀̀̀ `̀̀̀̀
I Revenue from operations in respect to Finance company
(a) Exchange Fluctuation 21,210,507 1,526,522
(b) Miscellaneous income 1,599,717 47,067,536
(c) Interest 48,898 1,190,277
(d) Other Financial Services 157,613 632,564
23,016,73523,016,73523,016,73523,016,73523,016,735 50,416,899 50,416,899 50,416,899 50,416,899 50,416,899
NONONONONOTE NOTE NOTE NOTE NOTE NO. 20 : EML. 20 : EML. 20 : EML. 20 : EML. 20 : EMLOOOOOYYYYYEE BENEFIT EXPENSESEE BENEFIT EXPENSESEE BENEFIT EXPENSESEE BENEFIT EXPENSESEE BENEFIT EXPENSES
S.NoS.NoS.NoS.NoS.No..... PPPPParararararticularsticularsticularsticularsticulars YYYYYear Endedear Endedear Endedear Endedear Ended YYYYYear Endedear Endedear Endedear Endedear Ended31-03-201231-03-201231-03-201231-03-201231-03-2012 31-03-2011 31-03-2011 31-03-2011 31-03-2011 31-03-2011
`̀̀̀̀ `̀̀̀̀
I (a) Salaries & Wages 401,439,116 352,788,042
(b) Fees to contract employees 119,643,394 172,620,904
(c) Employees other benefit expenses 38,642,772 22,060,539
(d) Staff Welfare Expenses 1,321,003 1,343,502
TTTTTotal Emplootal Emplootal Emplootal Emplootal Employyyyyee Bee Bee Bee Bee Benefit Expensesenefit Expensesenefit Expensesenefit Expensesenefit Expenses 561,046,285 561,046,285 561,046,285 561,046,285 561,046,285 548,812,987 548,812,987 548,812,987 548,812,987 548,812,987

AAAAAnnual Rnnual Rnnual Rnnual Rnnual Reporeporeporeporeporttttt 2011-2012 2011-2012 2011-2012 2011-2012 2011-2012
4747474747
NONONONONOTE NOTE NOTE NOTE NOTE NO. 21 : O. 21 : O. 21 : O. 21 : O. 21 : OTHER OPERTHER OPERTHER OPERTHER OPERTHER OPERAAAAATING EXPENSESTING EXPENSESTING EXPENSESTING EXPENSESTING EXPENSES
S.NoS.NoS.NoS.NoS.No..... PPPPParararararticularsticularsticularsticularsticulars YYYYYear Endedear Endedear Endedear Endedear Ended YYYYYear Endedear Endedear Endedear Endedear Ended31-03-201231-03-201231-03-201231-03-201231-03-2012 31-03-201131-03-201131-03-201131-03-201131-03-2011
`̀̀̀̀ `̀̀̀̀
I (a) Cost of study material 6,856,194 7,730,141
(b) Power & Fuel 4,465,930 3,178,133
(c) Rent 20,125,221 18,223,554
(d) Sales and marketing expenses 25,985,318 17,876,911
(e) Travelling and conveyance 27,227,300 26,555,315
(f ) Insurance 3,683,673 5,190,155
(g) Computer hire charges 2,040,394 2,990,568
(h) Payment to Auditors:
(i) Statutory audit fees 1,530,851 1,619,893
(ii) For certification work including tax audit 75,000 125,000
(i) Net loss on sale of Asset 2,400,870 2,734,019
(j) Royalty /Technical/Know-howfees/License fees - 1,042,589
(k) Miscellaneous expenses 12,151,500 8,800,662
TTTTTotal Ootal Ootal Ootal Ootal Other Expensesther Expensesther Expensesther Expensesther Expenses 106,542,251 106,542,251 106,542,251 106,542,251 106,542,251 96,066,940 96,066,940 96,066,940 96,066,940 96,066,940

AAAAAnnual Rnnual Rnnual Rnnual Rnnual Reporeporeporeporeporttttt 2011-2012 2011-2012 2011-2012 2011-2012 2011-2012
4848484848
NONONONONOTE NOTE NOTE NOTE NOTE NO. 22 : ADMINSTR. 22 : ADMINSTR. 22 : ADMINSTR. 22 : ADMINSTR. 22 : ADMINSTRAAAAATIVE EXPENSESTIVE EXPENSESTIVE EXPENSESTIVE EXPENSESTIVE EXPENSES
S.NoS.NoS.NoS.NoS.No..... PPPPParararararticularsticularsticularsticularsticulars YYYYYear Endedear Endedear Endedear Endedear Ended YYYYYear Endedear Endedear Endedear Endedear Ended31-03-201231-03-201231-03-201231-03-201231-03-2012 31-03-201131-03-201131-03-201131-03-201131-03-2011
`̀̀̀̀ `̀̀̀̀
I (a) Cost of software licenses 1,250,582 - - - - -
(b) Office Maintenance 9,885,328 7,849,218
(c) Rates & Taxes (excluding Income Tax) 1,523,199 723,465
(d) Managerial Remuneration 1,200,000 2,250,000
(e) Consultancy Charges 33,624,516 21,788,356
(f ) Dues and Subscriptions Fee 1,422,459 2,588,728
(g) Communication Expenses 18,691,988 10,627,664
(h) Bank charges 1,051,959 1,364,633
(i) Director Sitting Fee 270,000 410,000
(j) Internal audit Fee 300,000 300,000
TTTTTotal Aotal Aotal Aotal Aotal Administrdministrdministrdministrdministraaaaativtivtivtivtive Expensese Expensese Expensese Expensese Expenses 69,220,031 69,220,031 69,220,031 69,220,031 69,220,031 47,902,064 47,902,064 47,902,064 47,902,064 47,902,064
NONONONONOTE NOTE NOTE NOTE NOTE NO. 23 : FINANCE C. 23 : FINANCE C. 23 : FINANCE C. 23 : FINANCE C. 23 : FINANCE COSTOSTOSTOSTOST
S.NoS.NoS.NoS.NoS.No..... PPPPParararararticularsticularsticularsticularsticulars YYYYYear Endedear Endedear Endedear Endedear Ended YYYYYear Endedear Endedear Endedear Endedear Ended31-03-201231-03-201231-03-201231-03-201231-03-2012 31-03-201131-03-201131-03-201131-03-201131-03-2011
`̀̀̀̀ `̀̀̀̀
I (a) Interest Expenses
- Interest on Working capital loan 9,667,546 20,092,762
- Interest on other loan 19,323,391 2,027,304
TTTTTotal Fotal Fotal Fotal Fotal Financinancinancinancinance Ce Ce Ce Ce Costostostostost 28,990,937 28,990,937 28,990,937 28,990,937 28,990,937 22,120, 22,120, 22,120, 22,120, 22,120,066066066066066

AAAAAnnual Rnnual Rnnual Rnnual Rnnual Reporeporeporeporeporttttt 2011-2012 2011-2012 2011-2012 2011-2012 2011-2012
4949494949
1.1.1.1.1. GrGrGrGrGroup oup oup oup oup ooooovvvvverererererviewviewviewviewview
Cambridge Technology Enterprises Limited (“theCompany”), its subsidiaries (collectively referred to as“the Group”) are primarily global technology servicesand outsourcing Group dedicated to serving themidsize market of enterprises and the midsize units ofGlobal 2000 enterprises across the spectrum ofbusiness industries. The Group is recognized as athought leader and innovator of comprehensiveService Oriented Architecture (SOA)-based enterprisetransformation and integration solutions and services.
2.2.2.2.2. SigSigSigSigSignificannificannificannificannificant act act act act accccccounounounounounting policiesting policiesting policiesting policiesting policies
2.12.12.12.12.1 Basis of prBasis of prBasis of prBasis of prBasis of preparepareparepareparaaaaation of financial station of financial station of financial station of financial station of financial statttttemenemenemenemenementststststs
The financial statements are prepared in accordancewith Indian Generally Accepted Accounting Principles(“GAAP”) under the historical cost convention on theaccrual basis. GAAP comprises mandatory accountingstandards as specified in the Companies (AccountingStandards) Rules, 2006 and the relevant provisions ofthe Indian Companies Act, 1956. Accounting policieshave been consistently applied except where a newlyissued accounting standard is initially adopted or arevision to an existing accounting standard adoptedor a revision to an existing accounting standardrequires a change in the accounting policy hitherto inuse. The management evaluates all recently issued orrevised accounting standards on an ongoing basis.
2.22.22.22.22.2 Basis of CBasis of CBasis of CBasis of CBasis of Consolidaonsolidaonsolidaonsolidaonsolidationtiontiontiontion
The Group financial statements are prepared inaccordance with the principles and proceduresrequired for the preparation and presentation ofconsolidated financial statements as laid down underthe accounting standard on Consolidated FinancialStatements issued by the Institute of CharteredAccountants of India. The Group financial statementsincorporate the financial information of CambridgeTechnology Enterprise Limited, its subsidiaries madeup to March 31, 2012. Subsidiaries are those entitiesthat are controlled by the Company. Control existswhen the Company has the power, directly orindirectly, to govern the financial and operatingpolicies of an enterprise so as to obtain benefits fromits activities. Subsidiaries are consolidated from thedate on which control is acquired by the Group and
no longer consolidated from the date such controlceases. The financial statements of the parent companyand subsidiaries have been combined on a line by linebasis by adding together the book values of like itemsof assets, liabilities, income and expenses aftereliminating intra-group balances and transactions andany resulting unrealized gain / loss arising from intragroup transactions. Unrealized losses resulting fromintra group transactions are also eliminated unless costcannot be recovered. Amounts reported in thefinancial statements of subsidiaries have beenadjusted, where necessary, to ensure consistency withthe accounting policies adopted by the Group.
2.32.32.32.32.3 UUUUUse of estimase of estimase of estimase of estimase of estimattttteseseseses
The preparation of the financial statements inconformity with GAAP requires Management to makeestimates and assumptions that affect the reportedbalances of assets and liabilities and disclosuresrelating to contingent assets and liabilities as at thedate of the financial statements and reported amountsof income and expenses during the period. Actualresults could differ from those estimates. Examples ofsuch estimates include provisions for doubtful debts,future obligations under employee retirement benefitplans, income taxes, and the useful lives of fixed assetsand intangible assets. Management periodicallyassesses using, external and internal sources, whetherthere is an indication that an asset may be impaired.Impairment occurs where the carrying value exceedsthe present value of future cash flows expected to arisefrom the continuing use of the asset and its eventualdisposal. The impairment loss to be expensed isdetermined as the excess of the carrying amount overthe higher of the asset’s net sales price or present valueas determined above. Contingencies are recordedwhen it is probable that a liability will be incurred, andthe amount can be reasonably estimated. Where noreliable estimate can be made, a disclosure is made ascontingent liability. Actual results could differ fromthose estimates.
2.42.42.42.42.4 RRRRRevevevevevenue renue renue renue renue recececececogogogogognitionnitionnitionnitionnition
Income from Software services and products
Revenue from professional services consist primarilyof revenue earned from services performed on a “timeand material” basis. The related revenue is recognized
Significant Accounting Policies(All amounts have been presented in Rupees unless otherwise specified)

AAAAAnnual Rnnual Rnnual Rnnual Rnnual Reporeporeporeporeporttttt 2011-2012 2011-2012 2011-2012 2011-2012 2011-2012
5050505050
as and when the services are performed. The Groupalso performs time bound fixed-price engagements,under which revenue is recognized using thepercentage of completion method of accounting. Thecumulative impact of any revision in estimates of thepercentage of work completed is reflected in the yearin which the change becomes known. Provisions forestimated losses on such engagements are madeduring the year in which a loss becomes probable andcan be reasonably estimated.
Amounts received or billed in advance of servicesperformed are recorded as advance from customers/unearned revenue. Unbilled revenue, included indebtors, represents amounts recognized based onservices performed in advance of billing in accordancewith contract terms. Unearned revenue is calculatedon the basis of the unutilized period of time at theBalance Sheet and represents revenue which isexpected to be earned in future periods in respect ofinternet, e-mail services, electronic data interchangeand web hosting services.
Revenue from the sale of user licenses for softwareapplications is recognized on transfer of the title in theuser license, except in case of multiple elementcontracts requiring significant implementationservices, where revenue is recognized as per thepercentage of completion method.
Revenue in respect of sale of courseware and otherreference material are recognized on delivery /dispatch of the material to the customer where as therevenue from the tuition activity is recognized over theperiod of the course programmes or as per the termsof the agreement, as the case may be.
Other income
Profit on sale of investments is recorded on transfer oftitle from the Group and is determined as thedifference between the sales price and the thencarrying value of the investment. Dividend income isrecognized when the right to receive dividend isestablished.
Interest is recognized using the time-proportionmethod, based on rates implicit in the transaction.
2.52.52.52.52.5 FFFFFixixixixixed Aed Aed Aed Aed Assetsssetsssetsssetsssets
Tangible assets
Tangible assets are stated at actual cost lessaccumulated depreciation. The actual cost capitalized
includes material cost, freight, installation cost, dutiesand taxes, finance charges and other incidentalexpenses incurred during the construction/installationstage.
Intangible assets
Intangible assets are recorded at consideration paidfor acquisition and other direct costs that can bedirectly attributed, or allocated on a reasonable andconsistent basis, to creating, producing and making theasset ready for its intended use.
Capital Work in progress
Assets under installation or under construction as atthe Balance sheet date are shown as capital work inprogress. Advances paid towards acquisition of assetsand expenditure incurred on development ofcomputer software included under capital work inprogress.
Depreciation
Depreciation on the Tangible Fixed Assets of the Groupis provided on Written down Value method as perSchedule XIV of the Companies Act, 1956 on pro-ratabasis except for the following block of assets.
Estimated useful lives
Computers 2 to 5 years
Buildings 15 to 20 years
Plant and Machinery 10 to 20 years
(Other than Computers)
Furniture, Fixtures and Interiors 5 to 10 years
Leasehold improvements Shorter of lease period OrEstimated useful lives
Individual assets acquired for less than Rs. 5,000 areentirely depreciated in the year of acquisition.
Amortization
Software- used in development for projects areamortized over the license period or estimated usefullife of two years, whichever is lower. Cost of internallygenerated software including the incidental costs isamortized over a period of three years.

AAAAAnnual Rnnual Rnnual Rnnual Rnnual Reporeporeporeporeporttttt 2011-2012 2011-2012 2011-2012 2011-2012 2011-2012
5151515151
The cost of and the accumulated depreciation for fixedassets sold, retired or otherwise disposed off areremoved from the stated values and the resulting gainsand losses are included in the profit and loss account.Lease payments under operating lease are recognisedas an expense in the profit and loss account. Animpairment loss is recognized wherever the carryingamount of the fixed assets exceeds its recoverableamount.
2.62.62.62.62.6 IIIIInnnnnvvvvvenenenenentttttorororororiesiesiesiesies
Finished goods comprising education and trainingmaterials are valued at cost or net realizable value,whichever is lower. Small value tools and consumablesare charged to consumption on purchase. Cost isdetermined using weighted average method.
2.72.72.72.72.7 GGGGGoodwilloodwilloodwilloodwilloodwill
Goodwill comprises of the excess of purchaseconsideration comprising of initial guaranteedconsideration and deferred earn outs over the bookvalue of the net assets of the acquired enterprise.Impairment of goodwill is evaluated annually, unlessit indicates some more frequent evaluation.Impairment recorded in the profit and loss account tothe extent the net discounted cash flows from thecontinuance of the acquisition are lower than itscarrying value.
2.82.82.82.82.8 FFFFFinancinancinancinancinance leasese leasese leasese leasese leases
Assets taken on lease are capitalized at fair value ornet present value of the minimum lease payments,whichever is lower. Depreciation on the assets takenon lease is charged at the rate applicable to similar typeof owned fixed assets refer accounting policy 2.4. Leasepayments made are apportioned between the financecharges and reduction of the outstanding liability inrespect of assets taken on lease.
2.92.92.92.92.9 IIIIInnnnnvvvvvestmenestmenestmenestmenestmentststststs
Investments are either classified as current or long-term, based on the Management’s intention at the timeof purchase. Current investments are carried at thelower of cost and fair value. Cost for overseasinvestments comprises the Indian Rupee value of theconsideration paid for the investment. Long-terminvestments are carried at cost and provisions recordedto recognize any decline, other than temporary, in thecarrying value of each investment.
2.102.102.102.102.10 FFFFForororororeigeigeigeigeign Cn Cn Cn Cn Curururururrrrrrencencencencency try try try try transacansacansacansacansactions and trtions and trtions and trtions and trtions and translaanslaanslaanslaanslationtiontiontiontion
Transactions in foreign currency are recorded atexchange rate prevailing on the date of transaction.Monetary assets and liabilities denominated in foreigncurrency are translated at the rate of exchange at thebalance sheet date and resultant gain or loss isrecognized in the profit and loss account. Non-monetary assets and liabilities are translated at the rateprevailing on the date of transaction.
In case of forward exchange contract or any otherfinancial instruments that is in substance a forwardexchange contract to hedge the foreign currency riskwhich is on account of firm commitment and/or is ahighly probable forecast transaction, the premium ordiscount arising at the inception of the contract isamortized as expense or income over the life of thecontract. Gains/losses on settlement of transactionarising on cancellation or renewal of such a forwardexchange contract is recognized as income or asexpense for the period.
In all other cases the gain or loss on contract iscomputed by multiplying the foreign currency amountof the forward exchange contract by the differencebetween the forward rate available at the reportingdate for the remaining maturity of the contract andthe contracted forward rate (or the forward rate lastused to measure a gain or loss on that contract for anearlier period), is recognized in the profit and lossaccount for the period.
Foreign subsidiaries are non-integral in nature. Assetsand Liabilities of such subsidiaries are translated at theyear end exchange rate; income and expenditure aretranslated at the average rate during the period. Theresultant translation adjustment is reflected as aseparate component of shareholders’ funds as a‘Currency Translation Reserve’.
2.112.112.112.112.11 EmploEmploEmploEmploEmployyyyyee See See See See Stttttock Option Sock Option Sock Option Sock Option Sock Option Schemechemechemechemecheme
Stock options granted to the employees under thestock option schemes established after June 19, 1999are evaluated as per the accounting treatmentprescribed by Employee Stock Option Scheme andEmployee Stock Purchase Scheme Guidelines 1999issued by Securities and Exchange Board of India andthe Guidance Note on Accounting for employee share-based payments issued by the Institute of Chartered

AAAAAnnual Rnnual Rnnual Rnnual Rnnual Reporeporeporeporeporttttt 2011-2012 2011-2012 2011-2012 2011-2012 2011-2012
5252525252
Accountants of India. Accordingly the Group measuresthe compensation cost relating to employee stockoptions using the intrinsic value method. Thecompensation cost is amortized on a straight line basisover the total vesting period of the stock options.
2.122.122.122.122.12 TTTTTaxaxaxaxaxes on Ies on Ies on Ies on Ies on Incncncncncomeomeomeomeome
Tax expense for the year comprises of current tax anddeferred tax.
Income taxes are computed using the tax effectaccounting method, where taxes are accrued in thesame period in which the related revenue andexpenses arise. A provision is made for income taxannually based on the tax liability computed, afterconsidering tax allowances and exemptions. Provisionsare recorded when it is estimated that a liability due todisallowances or other matters is probable. Minimumalternate tax (MAT) paid in accordance with the taxlaws, which gives rise to future economic benefits inthe form of adjustments of future income tax liability,is considered as an asset if there is convincing evidencethat the Group will pay normal tax after the tax holidayperiod. Accordingly, it is recognized as an asset in thebalance sheet when it is probable that the futureeconomic benefit associated with it will flow to theGroup and the asset can be measured reliably.
The differences that result between the profitconsidered for income taxes and the profit as per thefinancial statements are identified, and thereafter adeferred tax asset or deferred tax liability is recordedfor timing differences, namely the differences thatoriginate in one accounting period and reverse inanother, based on the tax effect of the aggregateamount being considered. The tax effect is calculatedon the accumulated timing differences at the end ofthe accounting period based on prevailing enacted orsubstantially enacted regulations. Deferred tax assetsare recognized only if there is virtual certainty that theywill be realized and are reviewed for theappropriateness of their respective carrying values ateach balance sheet date.
2.132.132.132.132.13 EarEarEarEarEarnings per sharnings per sharnings per sharnings per sharnings per shareeeee
In determining earnings per share, the Group considersthe net profit after tax and includes the post tax effectof any extra-ordinary / exceptional item is considered.The number of shares used in computing basic
earnings per share is the weighted average number ofshares outstanding during the period. The number ofshares used in computing diluted earnings per sharecomprises the weighted average shares considered forderiving basic earnings per share, and also theweighted average number of equity shares that couldhave been issued on the conversion of all dilutivepotential equity shares. The diluted potential equityshares are adjusted for the proceeds receivable, hadthe shares been actually issued at fair value (i.e. theaverage market value of the outstanding shares).Dilutive potential equity shares are deemed convertedas of the beginning of the period, unless issued at alater date.
2.142.142.142.142.14 RRRRRetiretiretiretiretiremenemenemenemenement benefits tt benefits tt benefits tt benefits tt benefits to emploo emploo emploo emploo employyyyyeeseeseeseesees
Gratuity
The Group provides for gratuity, a defined benefitretirement plan covering eligible employees, based onactuarial valuation made by an independent actuaryas at the balance sheet date. In accordance with thePayment of Gratuity Act, 1972, the gratuity planprovides a lump sum payment to vested employees atretirement, death, incapacitation or termination ofemployment, of an amount based on the respectiveemployees’ salary and the tenure of employment.
Provident fund
Contributions to defined Schemes such as ProvidentFund are charged as incurred on accrual basis. Eligibleemployees receive benefits from a provident fund,which is a defined contribution plan. Aggregatecontributions along with interest thereon are paid atretirement, death, incapacitation or termination ofemployment. Both the employee and the Group makemonthly contributions to the governmentadministered authority.
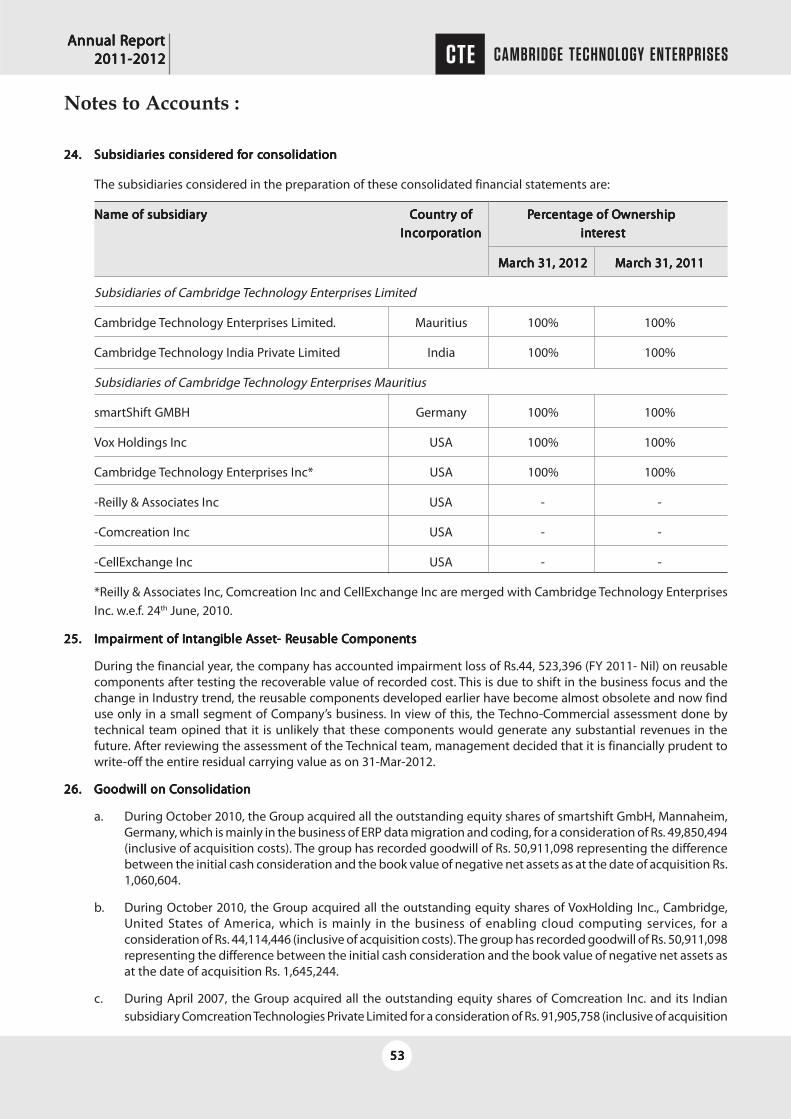
AAAAAnnual Rnnual Rnnual Rnnual Rnnual Reporeporeporeporeporttttt 2011-2012 2011-2012 2011-2012 2011-2012 2011-2012
5353535353
24.24.24.24.24. SubsidiarSubsidiarSubsidiarSubsidiarSubsidiaries cies cies cies cies consideronsideronsideronsideronsidered fed fed fed fed for cor cor cor cor consolidaonsolidaonsolidaonsolidaonsolidationtiontiontiontion
The subsidiaries considered in the preparation of these consolidated financial statements are:
Name of subsidiarName of subsidiarName of subsidiarName of subsidiarName of subsidiaryyyyy CCCCCounounounounountrtrtrtrtry ofy ofy ofy ofy of P P P P Pererererercccccenenenenentage of Otage of Otage of Otage of Otage of OwnershipwnershipwnershipwnershipwnershipIIIIIncncncncncorororororporporporporporaaaaationtiontiontiontion in in in in inttttterererererestestestestest
MMMMMarararararch 31, 2012ch 31, 2012ch 31, 2012ch 31, 2012ch 31, 2012 MMMMMarararararch 31, 2011ch 31, 2011ch 31, 2011ch 31, 2011ch 31, 2011
Subsidiaries of Cambridge Technology Enterprises Limited
Cambridge Technology Enterprises Limited. Mauritius 100% 100%
Cambridge Technology India Private Limited India 100% 100%
Subsidiaries of Cambridge Technology Enterprises Mauritius
smartShift GMBH Germany 100% 100%
Vox Holdings Inc USA 100% 100%
Cambridge Technology Enterprises Inc* USA 100% 100%
-Reilly & Associates Inc USA - -
-Comcreation Inc USA - -
-CellExchange Inc USA - -
*Reilly & Associates Inc, Comcreation Inc and CellExchange Inc are merged with Cambridge Technology EnterprisesInc. w.e.f. 24th June, 2010.
25.25.25.25.25. IIIIImpairmpairmpairmpairmpairmenmenmenmenment of It of It of It of It of Innnnntangtangtangtangtangible Aible Aible Aible Aible Assetssetssetssetsset- R- R- R- R- Reusable Ceusable Ceusable Ceusable Ceusable Componenomponenomponenomponenomponentststststs
During the financial year, the company has accounted impairment loss of Rs.44, 523,396 (FY 2011- Nil) on reusablecomponents after testing the recoverable value of recorded cost. This is due to shift in the business focus and thechange in Industry trend, the reusable components developed earlier have become almost obsolete and now finduse only in a small segment of Company’s business. In view of this, the Techno-Commercial assessment done bytechnical team opined that it is unlikely that these components would generate any substantial revenues in thefuture. After reviewing the assessment of the Technical team, management decided that it is financially prudent towrite-off the entire residual carrying value as on 31-Mar-2012.
26.26.26.26.26. GGGGGoodwill on Coodwill on Coodwill on Coodwill on Coodwill on Consolidaonsolidaonsolidaonsolidaonsolidationtiontiontiontion
a. During October 2010, the Group acquired all the outstanding equity shares of smartshift GmbH, Mannaheim,Germany, which is mainly in the business of ERP data migration and coding, for a consideration of Rs. 49,850,494(inclusive of acquisition costs). The group has recorded goodwill of Rs. 50,911,098 representing the differencebetween the initial cash consideration and the book value of negative net assets as at the date of acquisition Rs.1,060,604.
b. During October 2010, the Group acquired all the outstanding equity shares of VoxHolding Inc., Cambridge,United States of America, which is mainly in the business of enabling cloud computing services, for aconsideration of Rs. 44,114,446 (inclusive of acquisition costs). The group has recorded goodwill of Rs. 50,911,098representing the difference between the initial cash consideration and the book value of negative net assets asat the date of acquisition Rs. 1,645,244.
c. During April 2007, the Group acquired all the outstanding equity shares of Comcreation Inc. and its Indiansubsidiary Comcreation Technologies Private Limited for a consideration of Rs. 91,905,758 (inclusive of acquisition
Notes to Accounts :

AAAAAnnual Rnnual Rnnual Rnnual Rnnual Reporeporeporeporeporttttt 2011-2012 2011-2012 2011-2012 2011-2012 2011-2012
5454545454
costs).The group has recorded goodwill of Rs. 76,111,034 representing the difference between the initial cashconsideration and the book value of net assets as at the date of acquisition Rs. 15,794,724. Due to nonachievement of certain revenue and performance targets, the company waived off Rs. 9,320,000 from theconsideration balance due as on. Hence, the same is adjusted to the goodwill on consolidation.
d. During July 2007, the Company acquired all the outstanding shares of Reilly & Associates Inc., Michigan, UnitedStates of America for a initial cash consideration of Rs. 87,171,373 (inclusive of acquisition costs). The group hasrecorded goodwill of Rs. 95,938,450 representing the difference between the initial cash consideration and thebook value of negative net assets as at the date of acquisition of Rs. 8,767,077. Due to non achievement ofcertain revenue and performance targets, the company waived off Rs. 1,617,030 from the consideration balancedue as on. Hence, the same is adjusted to the goodwill on consolidation.
e. The goodwill on consolidation will be restated based on the future payment of earn outs based on theperformance criteria specified in the respective agreements.
27.27.27.27.27. IIIIImpairmpairmpairmpairmpairmenmenmenmenment of Gt of Gt of Gt of Gt of Goodwilloodwilloodwilloodwilloodwill :
AAAAAt Ct Ct Ct Ct Costostostostost IIIIImpairmpairmpairmpairmpairmenmenmenmenmenttttt C C C C Carararararrrrrrying Aying Aying Aying Aying Ammmmmttttt.....
Balance at 1 April 2011 719,064,720 - 719,064,720
Impairment loss during the FY - 458,104,045 458,104,045
Balance at 31 March 2012 719,364,720 458,104,045 260,960,675
For the purpose of impairment testing, goodwill is allocated to the subsidiary which represents the lowest levelwithin the Group at which the goodwill is monitored for internal management purpose.
During the financial year, the Group has recognised impairment loss on goodwill on consolidation ofRs.458,104,045(FY2011 – Nil) due to significant changes with an adverse effect have taken place during the period inthe technological, market and economic environment in which the entity operates and impacted it’s of the financialposition and financial performance of subsidiaries.
The balance of the goodwill on consolidation of Rs.260,960,675(FY2011 – Rs.719,364,720) is related to focusedtechnology and the recoverable amount is determined based on the cash flow projections derived from future financialbudgets. The key assumptions used in the calculations are as follows:- (a) Sales growth rate of 10% year to year forthree years. (b) Discount rate of 10%.
Based on the recoverable amount determined, goodwill on consolidation related to the focused technology is notimpaired for the current financial year.
a.a.a.a.a. IIIIInnnnnvvvvvestmenestmenestmenestmenestments sold durts sold durts sold durts sold durts sold during this ying this ying this ying this ying this year (Iear (Iear (Iear (Iear (Including Rncluding Rncluding Rncluding Rncluding Reineineineineinvvvvvestmenestmenestmenestmenestments)ts)ts)ts)ts)
P P P P Parararararticularsticularsticularsticularsticulars UnitsUnitsUnitsUnitsUnits CCCCCostostostostost VVVVValuealuealuealuealue
DSP Black Rock Mutual Fund 10,262.34 1000.80 10,270,551.87
Reliance Liquid Fund 222,860.05 11.1415 2,482,995.25
Birla Sun Life Mutual Fund 473,341.10 10.0068 4,736,629.75

AAAAAnnual Rnnual Rnnual Rnnual Rnnual Reporeporeporeporeporttttt 2011-2012 2011-2012 2011-2012 2011-2012 2011-2012
5555555555
28.28.28.28.28. EmploEmploEmploEmploEmployyyyyee See See See See Stttttock Option Sock Option Sock Option Sock Option Sock Option Schemechemechemechemecheme
The Group has three stock option plans that are currently operational.
CTEL ESOP 2006
The 2006 Plan was approved by the board of directors on April 13, 2006 and by the shareholders on April 21, 2006,under which scheme 1,236,542 options were granted till date of 31st March, 2012.
Changes in number of options outstanding were as follows:
A A A A As as as as as at Mt Mt Mt Mt Marararararch 31ch 31ch 31ch 31ch 31
20122012201220122012 2011 2011 2011 2011 2011
Options outstanding beginning of period 220,269 244,998
Granted during the year Nil 249,000
Less: Exercised Nil 7,766
Lapsed * 27,731 265,963
Options outstanding end of perOptions outstanding end of perOptions outstanding end of perOptions outstanding end of perOptions outstanding end of periodiodiodiodiod 192,538 220,269
* Options were lapsed for those who had left the company or didn’t exercise their options during the vesting periodof their options.
CTEL ESOP SCHEME 2008
The 2008 Plan was approved by the board of directors on March 20, 2008 and by the shareholders through postalballot results of which was declared on March 5, 2008, under which scheme 1,500,000 options were granted till dateof 31st March, 2012.
Changes in the number of options outstanding:
A A A A As as as as as at Mt Mt Mt Mt Marararararch 31ch 31ch 31ch 31ch 31
20122012201220122012 20112011201120112011
Options outstanding beginning of period 389,160 389,160
Granted during the year Nil Nil
Less: Exercised 197,657 Nil
Lapsed* 105,401 Nil
Options outstanding end of perOptions outstanding end of perOptions outstanding end of perOptions outstanding end of perOptions outstanding end of periodiodiodiodiod 296,904 389,160
*Options were lapsed for those who had left the company or didn’t exercise their options during the vesting periodof their options
CTEL ESOP SCHEME 2011
The 2011 Plan was approved by the board of directors on December 10, 2010 and by the shareholders throughpostal ballot results of which was declared on January 24, 2011, under which scheme 624,000 options were grantedtill date of 31st March, 2012.

AAAAAnnual Rnnual Rnnual Rnnual Rnnual Reporeporeporeporeporttttt 2011-2012 2011-2012 2011-2012 2011-2012 2011-2012
5656565656
Changes in the number of options outstanding:
A A A A As as as as as at Mt Mt Mt Mt Marararararch 31ch 31ch 31ch 31ch 31
20122012201220122012 20112011201120112011
Options outstanding beginning of period 295,000 -
Granted during the year 329,000 295,000
Less: Exercised Nil -
Lapsed* 95,000 -
Options outstanding end of perOptions outstanding end of perOptions outstanding end of perOptions outstanding end of perOptions outstanding end of periodiodiodiodiod 529,000 295,000
*Options were lapsed for those who had left the company or didn’t exercise their options during the vesting periodof their options
Pro forma Disclosure
In accordance with SEBI (Employee Stock Option Scheme and Employee Stock Purchase Scheme) Guidelines, 1999,had the compensation cost for associate stock option plans been recognized based on the fair value at the date ofgrant in accordance with Black Scholes’ model, the pro forma amounts of the Group’s net profit and earnings pershare would have been as follows:
(Amount in Rs.)
YYYYYear ended Mear ended Mear ended Mear ended Mear ended Marararararch 31,ch 31,ch 31,ch 31,ch 31,
20122012201220122012 20112011201120112011
Net Profit (as reported) (569,333,456) (185,280,668)
Add: Stock based employee compensation - -
Less: Stock based compensation expenses determined under fair - -value method (pro forma)
Net Profit (Pro forma) (569,333,456) (185,280,668)
Earnings per share (Rs.)
Basic - as reported - -
- as pro forma - -
Diluted - as reported - -
- as pro forma - -
The key assumptions used in Black-Scholes’ model for calculating fair value are: risk-free interest rate ranging from6.73% to 7.85% (2011 – 6.73% to 7.85%), expected life: 3 years to 4 years (2010 – 2.5 years to 4.5 years), expectedvolatility of shares 63.77% to 72.66% (2011 – 63.77% to 72.66%), dividend yield 0% (2011 – 0%). The range variablesdetailed herein represent the highs and the lows of the assumptions during the pendency of the grant dates.

AAAAAnnual Rnnual Rnnual Rnnual Rnnual Reporeporeporeporeporttttt 2011-2012 2011-2012 2011-2012 2011-2012 2011-2012
5757575757
29.29.29.29.29. RRRRRelaelaelaelaelattttted pared pared pared pared parttttty try try try try transacansacansacansacansactionstionstionstionstions
Key Management Personnel
Stefan Hetges Whole-Time Director and Chief Executive Officer
(w.e.f 15 November 2010)
D.R.R Swaroop Whole-Time Director
Samir Bhatia Whole-Time Director and Chief Financial Officer (w.e.f 14 February 2011)
Arjun Chopra Whole-Time Director (w.e.f 19 April 2010 up to 15 November 2010)
Enterprises over which significant influence exercised by key management personnel/close family member of keymanagement personnel
D.S. Unics Infotech Pvt Ltd D.R.R. Swaroop is a Director in the Company
Na Na Na Na Naturturturturture of e of e of e of e of TTTTTrrrrransacansacansacansacansactiontiontiontiontion YYYYYear ended Mear ended Mear ended Mear ended Mear ended Marararararch 31ch 31ch 31ch 31ch 31
20122012201220122012 20112011201120112011
Transactions with key management personnel
Remuneration :
-Bhaskar Panigrahi - 1,050,000
-D.R.R. Swaroop 1,200,000 1,200,000
-Stefan Hetges 7,790,760 2,303,033
-Samir Bhatia 4,809,040 531,570
-Arjun Chopra 5,820,371 2,470,800
Amount Payable to
-D.R.R. Swaroop - -
-Stefan Hetges 618,067 255,893
-Samir Bhatia 146,591 177,190
-Arjun Chopra 318,829 -
Short Term Bridge Loan -Cloud Computing Inc 35,812,000 -
30.30.30.30.30. RRRRRecececececonciliaonciliaonciliaonciliaonciliation of basic and diluttion of basic and diluttion of basic and diluttion of basic and diluttion of basic and diluted shared shared shared shared shares used in ces used in ces used in ces used in ces used in computing earomputing earomputing earomputing earomputing earnings per sharnings per sharnings per sharnings per sharnings per shareeeee
A A A A As as as as as at Mt Mt Mt Mt Marararararch 31,ch 31,ch 31,ch 31,ch 31,
20122012201220122012 20112011201120112011
Number of shares considered as basic weighted average shares outstanding 19,631,015 16,731,742
Add: Effect of dilutive issue of stock options - -
Number of shares considered as weighted average shares and potential 19,631,015 16,731,742shares outstanding

AAAAAnnual Rnnual Rnnual Rnnual Rnnual Reporeporeporeporeporttttt 2011-2012 2011-2012 2011-2012 2011-2012 2011-2012
5858585858
31.31.31.31.31. LLLLLeaseseaseseaseseaseseases
Operating Leases
The Group leases offices under operating lease agreements that are renewable on a periodic basis at the option of boththe lessor and the lessee. Rental expenses under those leases were Rs.15,265,012/- (Previous year Rs. 17,804,908/-)
Finance Leases
A subsidiary of the group has taken computers under finance lease. Future minimum lease payments under financeleases as at March 31, 2011 (Current Year Nil) are as follows:
L L L L Lease Obligaease Obligaease Obligaease Obligaease Obligationstionstionstionstions PPPPPrrrrresenesenesenesenesent vt vt vt vt value ofalue ofalue ofalue ofalue of FFFFFuturuturuturuturuture ine ine ine ine inttttterererererestestestestest MMMMMinimum leaseinimum leaseinimum leaseinimum leaseinimum leaseminimum leaseminimum leaseminimum leaseminimum leaseminimum lease papapapapaymenymenymenymenymentststststs
papapapapaymenymenymenymenymentststststs
Within one year of the balance sheet date 118,135 29,580 147,715
Due in period between one year and five years — — —
32.32.32.32.32. SSSSSegegegegegmenmenmenmenment rt rt rt rt reporeporeporeporeportingtingtingtingting
As required by the Accounting Standard – 17, ‘Segment reporting’, the Group is mainly engaged in the area of softwaredevelopment and related services. Hence segment reporting is not applicable to the Group and to the nature ofbusiness.
33.33.33.33.33. MMMMManageranageranageranageranagerial Rial Rial Rial Rial Remuneremuneremuneremuneremuneraaaaationtiontiontiontion
The key management personnel comprise our directors and statutory officers. Particulars of remuneration and otherbenefits provided to key management personnel during the year ended March 31, 2012 and 2011 are as follows:
(Amount in Rs.)
YYYYYear ended Mear ended Mear ended Mear ended Mear ended Marararararch 31,ch 31,ch 31,ch 31,ch 31,
20122012201220122012 20112011201120112011
Remuneration* 18,420,171 5,305,403
Perquisites & Allowances - -
Directors sitting fee 270,000 410,000
*Remuneration is net of accrual towards Gratuity, a defined benefit plan and provident fund which is managed forthe Group as a whole. Contributions to defined benefit plan and provident fund and other perquisites and allowanceshave been included in Schedule 14 and 15.
34.34.34.34.34. RRRRRetiretiretiretiretiremenemenemenemenement benefits tt benefits tt benefits tt benefits tt benefits to emploo emploo emploo emploo employyyyyeeseeseeseesees
Defined contribution plan
During year ended March 31, 2012, the Group contributed Rs.3,773,406/- to provident fund.
Defined benefit plan – gratuity and privilege leave

AAAAAnnual Rnnual Rnnual Rnnual Rnnual Reporeporeporeporeporttttt 2011-2012 2011-2012 2011-2012 2011-2012 2011-2012
5959595959
The amounts recognized in the balance sheet as at March 31, 2012 are as follows: (Amount in `)
3131313131ststststst M M M M Marararararch 2012ch 2012ch 2012ch 2012ch 2012 3131313131stststststMMMMMarararararch 2011ch 2011ch 2011ch 2011ch 2011
Present value of obligations 9,685,560 7,660,036
Fair value of plan assets - -
Net liability 9,685,560 7,660,036
Amount in balance sheet
Liability 9,685,560 7,660,036
Asset - -
Net Liability 9,685,560 7,660,036
The amounts recognized in the profit and loss account for the year ended March 31, 2012 are as follows:
3131313131ststststst M M M M Marararararch 2012ch 2012ch 2012ch 2012ch 2012 3131313131ststststst M M M M Marararararch 2011ch 2011ch 2011ch 2011ch 2011
Current service cost 685,662 711,523
Interest cost 612,080 465,811
Expected return on plan assets - -
Recognized net actuarial loss (net) 3,819,745 2,932,169
Total included in 'employee benefit expenses' (net) 5,117,487 4,109,503
Actual return on plan assets - -
Changes in present value of defined benefit obligation representing reconciliation of opening and closing balancesthereof are as follows:
3131313131ststststst M M M M Marararararch 2012ch 2012ch 2012ch 2012ch 2012 3131313131ststststst M M M M Marararararch 2011ch 2011ch 2011ch 2011ch 2011
Defined benefit obligation at beginning of the year 7,660,036 5,822,639
Current service cost 685,662 711,523
Interest cost 612,080 465,811
Benefits Paid (net) (3,091,963) (2,272,106)
Actuarial loss (net) 3,819,745 2,932,169
Defined benefit obligation at end of the year 9,685,560 7,660,036
Changes in the fair value of plan assets representing reconciliation of opening and closing balances thereof are asfollows:
3131313131ststststst M M M M Marararararch 2012ch 2012ch 2012ch 2012ch 2012 3131313131ststststst M M M M Marararararch 2011ch 2011ch 2011ch 2011ch 2011
Fair value of plan assets at beginning of the year - -
Expected return on plan assets - -
Actuarial gains - -
Contribution by employer 2,703,393 2,272,106
Benefits paid 2,703,393 2,272,106
Fair value of plan assets at the end of the year - -

AAAAAnnual Rnnual Rnnual Rnnual Rnnual Reporeporeporeporeporttttt 2011-2012 2011-2012 2011-2012 2011-2012 2011-2012
6060606060
The assumptions used in accounting for the gratuity plan are set out as below:
31 31 31 31 31ststststst M M M M Marararararch 2012ch 2012ch 2012ch 2012ch 2012 31 31 31 31 31ststststst M M M M Marararararch 2011ch 2011ch 2011ch 2011ch 2011
CTEL CTIPL CTEL CTIPL
Discount Rate 8.00% 8.00% 8.00% 8.00%
Expected return on plan assets 8.00% 8.00% 8.00% 8.00%
Salary Escalation 7.00% 7.00% 7.00% 7.00%
The estimates of future salary increase, considered in actuarial valuation, take account of inflation, seniority, promotionsand other relevant factors such as supply and demand in the employment market. The Group evaluates these assumptionsannually based on its long term plans of growth and industry standards.
35.35.35.35.35. CCCCCononononontingencies & Guartingencies & Guartingencies & Guartingencies & Guartingencies & Guaranananananttttteeseeseeseesees
During the year, the company has given corporate guarantee as against Senior Secured Convertible Debt Notes,Convertible Debt Notes and Redeemable Bonds issued by the subsidiary M/s. Cambridge Technology EnterprisesMauritius Limited to the extent of Rs.647.43 Millions (USD 14.50 Millions).
36.36.36.36.36. PPPPPrrrrrior yior yior yior yior year cear cear cear cear comparomparomparomparomparaaaaativtivtivtivtiveseseseses
Previous years' figures have been regrouped and reclassified wherever necessary to conform to current year'sclassification.
FFFFFor Por Por Por Por P.M.M.M.M.Murururururali & Cali & Cali & Cali & Cali & Cooooo..... FFFFFor and on behalf of boaror and on behalf of boaror and on behalf of boaror and on behalf of boaror and on behalf of boardddddChartered Accountants
PPPPP.M.M.M.M.Murururururali Mali Mali Mali Mali Mohana Rohana Rohana Rohana Rohana Raoaoaoaoao DDDDD.R.R.S.R.R.S.R.R.S.R.R.S.R.R.Swwwwwarararararoopoopoopoopoop L.SrL.SrL.SrL.SrL.SridharidharidharidharidharPartner Whole-Time Director DirectorMembership No : 23412
SSSSSamir Bhaamir Bhaamir Bhaamir Bhaamir Bhatiatiatiatiatia VVVVV. R. R. R. R. Ramana Ramana Ramana Ramana Ramana ReddyeddyeddyeddyeddyWhole-Time Director & CFO Company Secretary
Place: HyderabadDate: 28-05-2012

AAAAAnnual Rnnual Rnnual Rnnual Rnnual Reporeporeporeporeporttttt 2011-2012 2011-2012 2011-2012 2011-2012 2011-2012
6161616161
Standalone Financial StatementsStandalone Financial StatementsStandalone Financial StatementsStandalone Financial StatementsStandalone Financial Statements

AAAAAnnual Rnnual Rnnual Rnnual Rnnual Reporeporeporeporeporttttt 2011-2012 2011-2012 2011-2012 2011-2012 2011-2012
6262626262
Auditors’ Report on Standalone FinancialsToThe Members ofCambridge Technology Enterprises Limited
1. We have audited the attached Balance Sheet of CCCCCambrambrambrambrambridge idge idge idge idge TTTTTechnology Enechnology Enechnology Enechnology Enechnology Enttttterererererprprprprprises Limitises Limitises Limitises Limitises Limitededededed (the ‘Company’) as at31st March, 2012 and also the Profit & Loss Account and the Cash Flow Statement for the year ended on the dateannexed thereto (collectively referred as the ‘financial statements’). These financial statements are the responsibilityof the Company’s Management. Our responsibility is to express an opinion on these financial statements based onour audit.
2. We conducted our audit in accordance with auditing standards generally accepted in India. Those Standardsrequire that we plan and perform the audit to obtain reasonable assurance about whether the financial statementsare free of material misstatement. An audit includes examining on a test basis, evidence supporting the amountsand disclosures in the financial statement. An audit also includes assessing the accounting principles used andsignificant estimates made by management, as well as evaluating the overall statement presentation. We believethat our audit provides a reasonable basis of our opinion.
3. As required by the Companies (Auditor’s Report) order 2003 and as amended by the Companies (Auditor’sReport)(Amendment)order 2004, issued by the Central Government of India in terms of the sub-section(4A) of section227 of the Companies Act, 1956, we enclose in the annexure a statement on the matters specified in paragraphs 4and 5 of the said order.
4. Further to our comments in the Annexure referred to above, we report that:
(i) We have obtained all the information and explanations, which to the best of our knowledge and belief werenecessary for the purposes of our Audit;
(ii) In our opinion, proper books of account as required by law have been kept by the company so far as appearsfrom our examination of those books;
(iii) The financial statements dealt with by this report are in agreement with the books of account;
(iv) In our opinion, the financial statements dealt with by this report comply with the Accounting standards referredto in sub-section (3C) of Section 211 of Companies Act, 1956 ;
(v) On the basis of written representations received from the Directors, as on 31st March, 2012 and taken on recordby the Board of Directors, we report that none of the Directors is disqualified as on 31st March, 2012 from beingappointed Director in terms of clause(g) of sub-section(1) of section 274 of the Companies Act,1956;
(vi) In our opinion and to the best of our information and according to the explanations given to us, the saidaccounts give the information required by the Companies Act, 1956, in the manner so required, and alsogives a true and fair view in conformity with the accounting principles generally accepted in India;
(a) In the case of the Balance Sheet, of the state of affairs of the Company as at 31st March, 2012;
(b) In the case of the Profit & Loss Account, of the Profit for the period ended on that date;
And
(c) The Cash Flow Statement, of the cash flows for the year ended on that date.
FFFFFor Por Por Por Por P. MUR. MUR. MUR. MUR. MURALI & CALI & CALI & CALI & CALI & COOOOO.,.,.,.,.,CHARCHARCHARCHARCHARTERED ATERED ATERED ATERED ATERED ACCCCCCCCCCOUNTOUNTOUNTOUNTOUNTANTANTANTANTANTSSSSS
FRN : 007257SFRN : 007257SFRN : 007257SFRN : 007257SFRN : 007257S
PLAPLAPLAPLAPLACE : HCE : HCE : HCE : HCE : Hyyyyyderderderderderabadabadabadabadabad PPPPP.MUR.MUR.MUR.MUR.MURALI MOHANA RALI MOHANA RALI MOHANA RALI MOHANA RALI MOHANA RAAAAAOOOOO
DDDDDAAAAATE : 28/05/2012TE : 28/05/2012TE : 28/05/2012TE : 28/05/2012TE : 28/05/2012 PPPPPARARARARARTNERTNERTNERTNERTNER
MMMMMembership Noembership Noembership Noembership Noembership No. 23412. 23412. 23412. 23412. 23412

AAAAAnnual Rnnual Rnnual Rnnual Rnnual Reporeporeporeporeporttttt 2011-2012 2011-2012 2011-2012 2011-2012 2011-2012
6363636363
AAAAAnnennennennennexurxurxurxurxure te te te te to the Ao the Ao the Ao the Ao the Auditudituditudituditorsorsorsorsors’’’’’ R R R R Reporeporeporeporeport of evt of evt of evt of evt of even daen daen daen daen dattttte te te te te to the members of Co the members of Co the members of Co the members of Co the members of Cambrambrambrambrambridge idge idge idge idge TTTTTechnology Enechnology Enechnology Enechnology Enechnology Enttttterererererprprprprprises Limitises Limitises Limitises Limitises Limitededededed, on, on, on, on, onthe financial stathe financial stathe financial stathe financial stathe financial statttttemenemenemenemenements fts fts fts fts for the yor the yor the yor the yor the year ended Mear ended Mear ended Mear ended Mear ended Marararararch 31, 2012ch 31, 2012ch 31, 2012ch 31, 2012ch 31, 2012
Based on the audit procedures performed for the purpose of reporting a true and fair view on the financial statements ofthe Company and taking into consideration the information and explanations given to us and the books of account andother records examined by us in the normal course of audit, we report that:
I.I.I.I.I. (a) The Company has maintained proper records showing full particulars including quantitative details and situationof Fixed Assets.
(b) The Company has a regular programme of physical verification of its fixed assets by which fixed assets areverified in a phased manner over a period of three years. In our opinion, this periodicity of physical verificationis reasonable having regard to the size of the Company and the nature of its assets. No material discrepancieswere noticed on such verification.
(c) In our opinion, the Company has not disposed off substantial part of the Fixed Assets during the year.
II.II.II.II.II. The Company does not have any inventory. Accordingly, the provisions of clause 4(ii) of the Order are not applicable.
III.III.III.III.III. (a) The Company has not granted any loans, secured or unsecured to Companies, Firms or other Parties coveredin the register maintained U/s.301 of the Companies Act, 1956. Accordingly, the provisions of clause 4(iii)(b) to(d) of the Order are not applicable.
(b) The Company has not taken any loans, secured or unsecured from Companies, Firms or other Parties covered inthe register maintained U/s.301 of the Companies Act, 1956. Accordingly, the provisions of clause 4(iii)(f ) and4(iii)(g) of the Order are not applicable.
IVIVIVIVIV..... In our opinion and according to the information and explanations given to us, there are generally adequate internalcontrol systems commensurate with the size of the company and the nature of its business with regard to purchaseof inventory and fixed assets and for sale of goods and services. There is no continuing failure by the company tocorrect any major weaknesses in internal control.
VVVVV..... (a) In our opinion, the particulars of all contracts or arrangements that need to be entered into the registermaintained under section 301 of the Act have been so entered.
(b) In our opinion, there are no transactions in pursuance of contracts or arrangements entered in the registermaintained under section 301 of the Act, during the year aggregating rupees five lakhs or more in respect ofany party.
VI.VI.VI.VI.VI. The Company has not accepted any deposits from the public and hence the applicability of the clause of directivesissued by the Reserve Bank of India and provisions of section 58A, 58AA or any other relevant provisions of the Actand the rules framed there under does not arise.
VII.VII.VII.VII.VII. In our opinion, the Company has an internal audit system commensurate with its size and the nature of its business.
VIII.VIII.VIII.VIII.VIII. In respect of the Company, the Central Government has not prescribed maintenance of cost records under clause (d)of sub-section (I) of section 209 of the Companies Act, 1956.
IX.IX.IX.IX.IX. a) The Company is regular in depositing undisputed statutory dues including PF, Income Tax and Cess and anyother statutory dues with the appropriate authorities and at the last of the financial year there were no amountsoutstanding which were due for more than 6 months from the date they became payable.
b) According to the information and explanations given to us, no undisputed amounts are payable in respect ofPF, Sales Tax, Income Tax, wealth tax, service tax, customs duty, excise duty and cess and any other statutorydues as at the end of the period, for a period more than six months from the date they became payable.
X.X.X.X.X. The Company has been registered for a period of not less than 5 years, and the Company has no accumulated lossesat the end of the financial year and the company has not incurred cash losses in this financial year and the immediatelypreceding financial year.

AAAAAnnual Rnnual Rnnual Rnnual Rnnual Reporeporeporeporeporttttt 2011-2012 2011-2012 2011-2012 2011-2012 2011-2012
6464646464
XXXXXI.I.I.I.I. In our opinion, the Company has not defaulted in repayment of dues to a financial institution or a bank or debentureholders during the year.
XII.XII.XII.XII.XII. According to the information and explanations given to us, the Company has not granted any loans or advances onthe basis of security by way of pledge of shares, debentures and other securities and hence the applicability of theclause regarding maintenance of adequate documents in respect of loans does not arise.
XIII.XIII.XIII.XIII.XIII. This clause is not applicable to this Company as the Company is not covered by the provisions of special statuteapplicable to Chit Fund in respect of Nidhi/Mutual Benefit Fund/Societies.
XIVXIVXIVXIVXIV..... According to the information and explanations given to us, the company is not dealing or trading in shares, securities,Debentures and other investments and hence the provisions of clause 4(xiv) of the Companies (Auditor’s Report)Order 2003, are not applicable to the Company.
XXXXXVVVVV..... According to the information and explanations given to us, the Company has not given any guarantee for loanstaken by others from Banks or Financial Institutions, and hence the applicability of this clause regarding terms andconditions which are prejudicial to the interest of the company does not arise.
XXXXXVI.VI.VI.VI.VI. According to the information and explanations given to us, the term loans obtained by the Company were appliedfor purpose for which such loans were obtained by the Company.
XXXXXVII.VII.VII.VII.VII. On the basis of our examination of the books and accounts and according to the information and explanations givento us, in our opinion the funds raised on short term basis have not been used for long term investment and vice versa.
XXXXXVIII.VIII.VIII.VIII.VIII.According to the information and explanations given to us, the Company has not made any preferential allotment ofShares to parties and Companies covered in the Register maintained under section 301 of the Companies Act, 1956and hence the applicability of the clause regarding the price at which shares have been issued and whether the sameis prejudicial to the interest of the Company does not arise.
XIX.XIX.XIX.XIX.XIX. According to the information and explanations given to us, the company does not have any debentures and hencethe applicability of the clause regarding the creation of security or charge in respect of debentures issued does notarise.
XXXXXX.X.X.X.X. According to information and explanations given to us, the company has not raised money by way of public issuesduring the year; hence the clause regarding the disclosure by the management on the end use of money raised byPublic Issue is not applicable.
XXXXXXI.XI.XI.XI.XI. According to the information and explanations given to us, no fraud on or by the Company has been noticed orreported during the year under audit.
FFFFFor Por Por Por Por P.MUR.MUR.MUR.MUR.MURALI & CALI & CALI & CALI & CALI & COOOOO.,.,.,.,.,CHARCHARCHARCHARCHARTERED ATERED ATERED ATERED ATERED ACCCCCCCCCCOUNTOUNTOUNTOUNTOUNTANTANTANTANTANTSSSSS
FRN : 007257SFRN : 007257SFRN : 007257SFRN : 007257SFRN : 007257S
PPPPPlaclaclaclaclace : He : He : He : He : Hyyyyyderderderderderabadabadabadabadabad PPPPP. MUR. MUR. MUR. MUR. MURALI MOALI MOALI MOALI MOALI MOHANA RHANA RHANA RHANA RHANA RAAAAAOOOOODaDaDaDaDattttte : 28/05/2012e : 28/05/2012e : 28/05/2012e : 28/05/2012e : 28/05/2012 PPPPPARARARARARTNERTNERTNERTNERTNER
MMMMMembership Noembership Noembership Noembership Noembership No. 23412. 23412. 23412. 23412. 23412

AAAAAnnual Rnnual Rnnual Rnnual Rnnual Reporeporeporeporeporttttt 2011-2012 2011-2012 2011-2012 2011-2012 2011-2012
6565656565
Balance Sheet as at 31st March, 2012
PPPPParararararticularsticularsticularsticularsticulars NotNotNotNotNoteeeee AAAAAs ons ons ons ons on AAAAAs ons ons ons ons onNoNoNoNoNo..... 31-03-201231-03-201231-03-201231-03-201231-03-2012 31-03-201131-03-201131-03-201131-03-201131-03-2011
`̀̀̀̀ `̀̀̀̀
I.I.I.I.I. EQUITEQUITEQUITEQUITEQUITY AND LIABILITIESY AND LIABILITIESY AND LIABILITIESY AND LIABILITIESY AND LIABILITIES
(1)(1)(1)(1)(1) SharSharSharSharShareholdereholdereholdereholdereholder’’’’’s Fs Fs Fs Fs Fundsundsundsundsunds
(a) Share Capital 1 196,310,150 196,310,150
(b) Reserves and Surplus 2 426,530,300 424,928,693
(2)(2)(2)(2)(2) SharSharSharSharShare ape ape ape ape applicaplicaplicaplicaplication money pending allotmention money pending allotmention money pending allotmention money pending allotmention money pending allotmenttttt
(3)(3)(3)(3)(3) Non-Non-Non-Non-Non-CCCCCurururururrrrrrenenenenent Liabilitiest Liabilitiest Liabilitiest Liabilitiest Liabilities
(a) Defferred Tax Liabilities (Net) 3 1,672,569 14,937,747
(b) Long Term Provisions 4 6,548,370 5,297,957
(4)(4)(4)(4)(4) CCCCCurururururrrrrrenenenenent Liabilitiest Liabilitiest Liabilitiest Liabilitiest Liabilities
(a) Short-Term Borrowings 5 30,386,509 49,761,568
(b) Trade Payables 6 4,227,106 6,045,574
(c) Other Current Liabilities 7 39,295,681 104,551,439
(d) Short-Term Provisions 8 27,532,846 44,391,944
TTTTTotalotalotalotalotal 732,503,530732,503,530732,503,530732,503,530732,503,530 846,225,073846,225,073846,225,073846,225,073846,225,073
II.II.II.II.II. AAAAAssetsssetsssetsssetsssets
(1)(1)(1)(1)(1) Non-Non-Non-Non-Non-curcurcurcurcurrrrrrenenenenent assetst assetst assetst assetst assets
(a) Fixed assets
(i) Tangible assets 9 (a) 10,683,518 11,535,006
(ii) Intangible assets 9 (b) - 106,310,150
(iii) Capital work-in-progress
(b) Non-current investments 10 409,746,172 447,522,188
(2)(2)(2)(2)(2) CCCCCurururururrrrrrenenenenent assetst assetst assetst assetst assets
(a) Current investments 11 - 12,632,566
(b) Trade receivables 12 242,002,948 214,306,384
(c) Cash and Bank Balances 13 27,781,578 17,499,329
(d) Short-Term Loans and Advances 14 8,884,455 8,267,653
(e) Other Current assets 15 33,404,859 28,151,797
TTTTTotalotalotalotalotal 732,503,530732,503,530732,503,530732,503,530732,503,530 846,225,073846,225,073846,225,073846,225,073846,225,073
Significant Accounting PoliciesNotes to Financial Statements 1 to 37
AS PER OUR REPORT OF EVEN DATE
FFFFFor Por Por Por Por P.M.M.M.M.Murururururali & Cali & Cali & Cali & Cali & Cooooo.,.,.,.,., FFFFFor Cor Cor Cor Cor Cambrambrambrambrambridge idge idge idge idge TTTTTechnology Enechnology Enechnology Enechnology Enechnology Enttttterererererprprprprprises Limitises Limitises Limitises Limitises LimitedededededFirm Regn. No: 007257SChartered Accountants
PPPPP.M.M.M.M.Murururururali Mali Mali Mali Mali Mohana Rohana Rohana Rohana Rohana Raoaoaoaoao D R R SD R R SD R R SD R R SD R R Swwwwwarararararoopoopoopoopoop L SrL SrL SrL SrL SridharidharidharidharidharPartner Whole-Time Director Director M.No. 023412
Place : Hyderabad SSSSSamir Bhaamir Bhaamir Bhaamir Bhaamir Bhatiatiatiatiatia V RV RV RV RV Ramana Ramana Ramana Ramana Ramana ReddyeddyeddyeddyeddyDate : 28-05-2012 Whole-Time Director & CFO Company Secretary

AAAAAnnual Rnnual Rnnual Rnnual Rnnual Reporeporeporeporeporttttt 2011-2012 2011-2012 2011-2012 2011-2012 2011-2012
6666666666
PPPPParararararticuticuticuticuticularslarslarslarslars NotNotNotNotNoteeeee YYYYYear Endingear Endingear Endingear Endingear Ending YYYYYear Endingear Endingear Endingear Endingear EndingNoNoNoNoNo..... 31-03-201231-03-201231-03-201231-03-201231-03-2012 31-03-201131-03-201131-03-201131-03-201131-03-2011
I. Revenue from Operations 16 307,939,554 327,619,009
II. Other Income 17 20,647,243 2,853,771
III. III. III. III. III. TTTTTotal Rotal Rotal Rotal Rotal Revevevevevenue (I+II)enue (I+II)enue (I+II)enue (I+II)enue (I+II) 328,586,797328,586,797328,586,797328,586,797328,586,797 330,472,780330,472,780330,472,780330,472,780330,472,780
IV. Expenses:
Employee Benefit expenses 18 143,704,465 149,963,425
Other Operating Expenses 19 17,957,092 14,307,412
Administrative Expenses 20 34,432,223 41,279,584
Financial costs 21 5,361,212 9,516,678
Depreciation and amortization expense 9 83,053,646 96,749,919
Impaired Intangible Assets 9 30,245,860 -
TTTTTotal Expensesotal Expensesotal Expensesotal Expensesotal Expenses 314,754,498 314,754,498 314,754,498 314,754,498 314,754,498 311,817,018311,817,018311,817,018311,817,018311,817,018
V. Profit before exceptional and extraordinary items and tax (III - IV) 13,832,298 13,832,298 13,832,298 13,832,298 13,832,298 18,655,762
VI. Exceptional Items (Prior Period Expenses)
(a) Prior period expenses (15,015,155) (3,718,187)
(b) Change in the carrying value of investment 37,776,016 -
VII. Profit before extraordinary items and tax (V - VI) (8,928,563)(8,928,563)(8,928,563)(8,928,563)(8,928,563) 22,373,949
VIII. Extraordinary Items - -
IX. Profit Before Tax (VII - VIII) (8,928,563) (8,928,563) (8,928,563) (8,928,563) (8,928,563) 22,373,94922,373,94922,373,94922,373,94922,373,949
X. Tax expense:
(1) Current tax 2,735,008 4,002,363
(2) Deferred tax (13,265,178) (80,966)
XI. Profit(Loss) from the period from Continuing Operations (VII - VIII) 1,601,607 1,601,607 1,601,607 1,601,607 1,601,607 18,452,552
XII. Profit/(Loss) from Discontinuing Operations - -
XIII. Tax expense of Discounting Operations - -
XIV. Profit/(Loss) from Discontinuing operations (XII - XIII) - -
XV. Profit/(Loss) for the period (XI + XIV) 1,601,607 1,601,607 1,601,607 1,601,607 1,601,607 18,452,55218,452,55218,452,55218,452,55218,452,552
XVI. Earning per equity share:
(1) Basic 0.08 0.94
(2) Diluted 0.08 0.94
Profit and Loss statement for the year ended 31st March, 2012
Significant Accounting PoliciesNotes to Financial Statements 1 to 37
AS PER OUR REPORT OF EVEN DATE
FFFFFor Por Por Por Por P.M.M.M.M.Murururururali & Cali & Cali & Cali & Cali & Cooooo.,.,.,.,., FFFFFor Cor Cor Cor Cor Cambrambrambrambrambridge idge idge idge idge TTTTTechnology Enechnology Enechnology Enechnology Enechnology Enttttterererererprprprprprises Limitises Limitises Limitises Limitises LimitedededededFirm Regn. No: 007257SChartered Accountants
PPPPP.M.M.M.M.Murururururali Mali Mali Mali Mali Mohana Rohana Rohana Rohana Rohana Raoaoaoaoao D R R SD R R SD R R SD R R SD R R Swwwwwarararararoopoopoopoopoop L SrL SrL SrL SrL SridharidharidharidharidharPartner Whole-Time Director Director M.No. 023412
Place : Hyderabad SSSSSamir Bhaamir Bhaamir Bhaamir Bhaamir Bhatiatiatiatiatia V RV RV RV RV Ramana Ramana Ramana Ramana Ramana ReddyeddyeddyeddyeddyDate : 28-05-2012 Whole-Time Director & CFO Company Secretary

AAAAAnnual Rnnual Rnnual Rnnual Rnnual Reporeporeporeporeporttttt 2011-2012 2011-2012 2011-2012 2011-2012 2011-2012
6767676767
Standalone Cashflow for the period ended 31st March, 2012AAAAAmounmounmounmounmount in t in t in t in t in `̀̀̀̀
DDDDDetailsetailsetailsetailsetails FFFFFor the Por the Por the Por the Por the Perererereriodiodiodiodiod FFFFFor the Por the Por the Por the Por the Perererereriodiodiodiodiodended withended withended withended withended with ended with ended with ended with ended with ended with
3131313131ststststst M M M M Marararararchchchchch’’’’’ 2012 2012 2012 2012 2012 3131313131ststststst M M M M Marararararchchchchch’’’’’ 2011 2011 2011 2011 2011
A.A.A.A.A. CCCCCash Fash Fash Fash Fash Flololololow frw frw frw frw from Operom Operom Operom Operom Operaaaaating Ating Ating Ating Ating Accccctivitiestivitiestivitiestivitiestivities
Net Profit / (Loss) before tax (8,928,563) 22,373,950
Adjustment for :
Depreciation & Amortization 83,053,646 96,749,919
Dividend Income from Mutual Funds 157,613 (632,564)
Interest Income 19,085 (20,795)
Interest Expenses(net) 5,361,212 10,369,014
Provision for Gratuity & Leave encashment 1,250,413 1,018,518
Loss on sale of Assets (Net) 1,438,498 1,373,745
Undeclared dividend and dividend tax - -
Provision for bad and doubtful debts - -
Operating profit before working capital changes 82,351,90482,351,90482,351,90482,351,90482,351,904 131,231,786131,231,786131,231,786131,231,786131,231,786
Adjustment for:
Change in Trade receivables (27,696,565) (54,001,079)
Change in Inventory - -
Change in Short-term loans and advances (5,869,865) (9,393,474)
Change in Current Liabilities and Provision (83,933,325) (29,429,409)
CCCCCash generash generash generash generash generaaaaattttted fred fred fred fred from operom operom operom operom operaaaaationstionstionstionstions (35,147,850) (35,147,850) (35,147,850) (35,147,850) (35,147,850) 38,407,82438,407,82438,407,82438,407,82438,407,824
Income tax (paid)/ refunded (2,735,008) (4,002,363)
Net cash frNet cash frNet cash frNet cash frNet cash from operom operom operom operom operaaaaating acting acting acting acting activitiestivitiestivitiestivitiestivities AAAAA (37,882,858) (37,882,858) (37,882,858) (37,882,858) (37,882,858) 34,405,46134,405,46134,405,46134,405,46134,405,461
BBBBB..... CCCCCash Fash Fash Fash Fash Flololololow frw frw frw frw from Iom Iom Iom Iom Innnnnvvvvvesting Aesting Aesting Aesting Aesting Accccctivitiestivitiestivitiestivitiestivities
(Purchase) / Sale of Fixed Assets 22,669,494 (37,964,645)
Payment for Acquisitions - -
Sale of Fixed Assets - -
(Purchase) / Sale of Investments 50,408,582 (2,800,518)
Interest received (19,085) 20,795
Dividend Income from Mutual Funds (157,613) 632,564
Sale of investments -
Purchase of Investments in subsidiary
Net cash frNet cash frNet cash frNet cash frNet cash from inom inom inom inom invvvvvesting acesting acesting acesting acesting activitiestivitiestivitiestivitiestivities BBBBB 72,901,37872,901,37872,901,37872,901,37872,901,378 (40,111,803) (40,111,803) (40,111,803) (40,111,803) (40,111,803)

AAAAAnnual Rnnual Rnnual Rnnual Rnnual Reporeporeporeporeporttttt 2011-2012 2011-2012 2011-2012 2011-2012 2011-2012
6868686868
AAAAAmounmounmounmounmount in t in t in t in t in `̀̀̀̀
DDDDDetailsetailsetailsetailsetails FFFFFor the Por the Por the Por the Por the Perererereriodiodiodiodiod FFFFFor the Por the Por the Por the Por the Perererereriodiodiodiodiodended withended withended withended withended with ended withended withended withended withended with
3131313131ststststst M M M M Marararararchchchchch’’’’’ 2012 2012 2012 2012 2012 3131313131ststststst M M M M Marararararchchchchch’’’’’ 2011 2011 2011 2011 2011
C.C.C.C.C. CCCCCash Fash Fash Fash Fash Flololololowwwwws frs frs frs frs from Fom Fom Fom Fom Financing Ainancing Ainancing Ainancing Ainancing Accccctivitiestivitiestivitiestivitiestivities
Proceeds from issue of preference issue - -
Increase (Decrease) in working capital Loan (net) (19,375,059) (59,719,316)
Interest Paid (5,361,212) (10,369,014)
Increase (Decrease) in Share Capital - 91,358,400
Net cash used frNet cash used frNet cash used frNet cash used frNet cash used from financing acom financing acom financing acom financing acom financing activitiestivitiestivitiestivitiestivities CCCCC (24,736,271)(24,736,271)(24,736,271)(24,736,271)(24,736,271) 21,270,07021,270,07021,270,07021,270,07021,270,070
Net change in cash (Net change in cash (Net change in cash (Net change in cash (Net change in cash (A+B+CA+B+CA+B+CA+B+CA+B+C))))) 10,282,24910,282,24910,282,24910,282,24910,282,249 15,563,72815,563,72815,563,72815,563,72815,563,728
Cash and cash equivalents at beginning of year 17,499,329 1,935,602
Cash and cash equivalents at end of year 27,781,578 17,499,329
Standalone Cashflow for the period ended 31st March, 2012
The above Cash Flow statement is prepared under the Indirect Method set out in the Accounting Standard in Cash FlowStatements (AS-3) issued by the ICAI. For P.Murali & Co. FFFFFor and on behalf of Bor and on behalf of Bor and on behalf of Bor and on behalf of Bor and on behalf of Boaroaroaroaroard of Dird of Dird of Dird of Dird of DirececececectttttorsorsorsorsorsChartered Accountants
PPPPP.M.M.M.M.Murururururali Mali Mali Mali Mali Mohana Rohana Rohana Rohana Rohana Raoaoaoaoao DDDDD.R.R. S.R.R. S.R.R. S.R.R. S.R.R. Swwwwwarararararoopoopoopoopoop L.SrL.SrL.SrL.SrL.SridharidharidharidharidharPartner Whole-Time Director DirectorMembership No. 23412
SSSSSamir Bhaamir Bhaamir Bhaamir Bhaamir Bhatiatiatiatiatia VVVVV.R.R.R.R.Ramana Ramana Ramana Ramana Ramana ReddyeddyeddyeddyeddyWhole-Time Director & CFO Company Secretary
Place : HyderabadDate : 28-05-2012

AAAAAnnual Rnnual Rnnual Rnnual Rnnual Reporeporeporeporeporttttt 2011-2012 2011-2012 2011-2012 2011-2012 2011-2012
6969696969
NONONONONOTE NOTE NOTE NOTE NOTE NO. 1 : SHARE C. 1 : SHARE C. 1 : SHARE C. 1 : SHARE C. 1 : SHARE CAPITAPITAPITAPITAPITALALALALAL
S.NoS.NoS.NoS.NoS.No..... PPPPParararararticularsticularsticularsticularsticulars AAAAAs ons ons ons ons on AAAAAs ons ons ons ons on31-03-201231-03-201231-03-201231-03-201231-03-2012 31-03-201131-03-201131-03-201131-03-201131-03-2011
`̀̀̀̀ `̀̀̀̀
a Equity Share Capital
(a) Authorised
(No. of Shares 3,00,00,000 Current Year) 300,000,000 300,000,000 300,000,000 300,000,000 300,000,000
(No. of Shares 3,00,00,000 Previous Year) 300,000,000 300,000,000 300,000,000 300,000,000 300,000,000
(b) Issued 300,000,000 300,000,000 300,000,000 300,000,000 300,000,000 300,000,000 300,000,000 300,000,000 300,000,000 300,000,000
(No. of Shares 1,96,31,015 Current Year) 196,310,150 196,310,150 196,310,150 196,310,150 196,310,150
(No. of Shares 1,96,31,015 Previous Year) 196,310,150 196,310,150 196,310,150 196,310,150 196,310,150
(c) Subscribed & Fully Paid Up
(No. of Shares 1,96,31,015 Current Year) 196,310,150 196,310,150 196,310,150 196,310,150 196,310,150
(No. of Shares 1,96,31,015 Previous Year) 196,310,150 196,310,150 196,310,150 196,310,150 196,310,150
(d) Subscribed & not fully paid up - - - - - - - - - -
(e) Par Value per share Rs. 10/-
TTTTTotal Eotal Eotal Eotal Eotal Equitquitquitquitquity Shary Shary Shary Shary Share capitale capitale capitale capitale capital 196,310,150 196,310,150 196,310,150 196,310,150 196,310,150 196,310,150 196,310,150 196,310,150 196,310,150 196,310,150
TTTTTotal Sharotal Sharotal Sharotal Sharotal Share Ce Ce Ce Ce Capitalapitalapitalapitalapital 196,310,150 196,310,150 196,310,150 196,310,150 196,310,150 196,310,150 196,310,150 196,310,150 196,310,150 196,310,150
b A RA RA RA RA Recececececoncilaoncilaoncilaoncilaoncilation of the number of shartion of the number of shartion of the number of shartion of the number of shartion of the number of shares outstanding aes outstanding aes outstanding aes outstanding aes outstanding at thet thet thet thet the
begbegbegbegbeginning and ainning and ainning and ainning and ainning and at the end of the rt the end of the rt the end of the rt the end of the rt the end of the reporeporeporeporeporting perting perting perting perting period:iod:iod:iod:iod:
EEEEEquitquitquitquitquity Shary Shary Shary Shary Shares of Rses of Rses of Rses of Rses of Rs.10 each, F.10 each, F.10 each, F.10 each, F.10 each, Fully paid upully paid upully paid upully paid upully paid up
At the Beginning 19,631,015 15,824,415
Issued during the year - Bonus Issue - 3,806,600
19,631,01519,631,01519,631,01519,631,01519,631,015 19,631,01519,631,01519,631,01519,631,01519,631,015
c DDDDDetails of Sharetails of Sharetails of Sharetails of Sharetails of Shareholder holding moreholder holding moreholder holding moreholder holding moreholder holding more than 5% share than 5% share than 5% share than 5% share than 5% shares of the ces of the ces of the ces of the ces of the companompanompanompanompany :y :y :y :y : % of Share Holding
EEEEEquitquitquitquitquity Shary Shary Shary Shary Shares of Rses of Rses of Rses of Rses of Rs. 10 each Held B. 10 each Held B. 10 each Held B. 10 each Held B. 10 each Held Byyyyy
Share Holder Name
31-03-2012 31-03-2011
1. Internet Business Corporation 75,89,349 75,89,349 38.66% 38.66%
2. SmarShift AG 20,56,000 20,56,000 10.48% 10.48%
3. OurVox Holdings LLC 17,50,000 17,50,000 8.91% 8.91%
Notes to Financial Statements for the year ended March 31, 2012
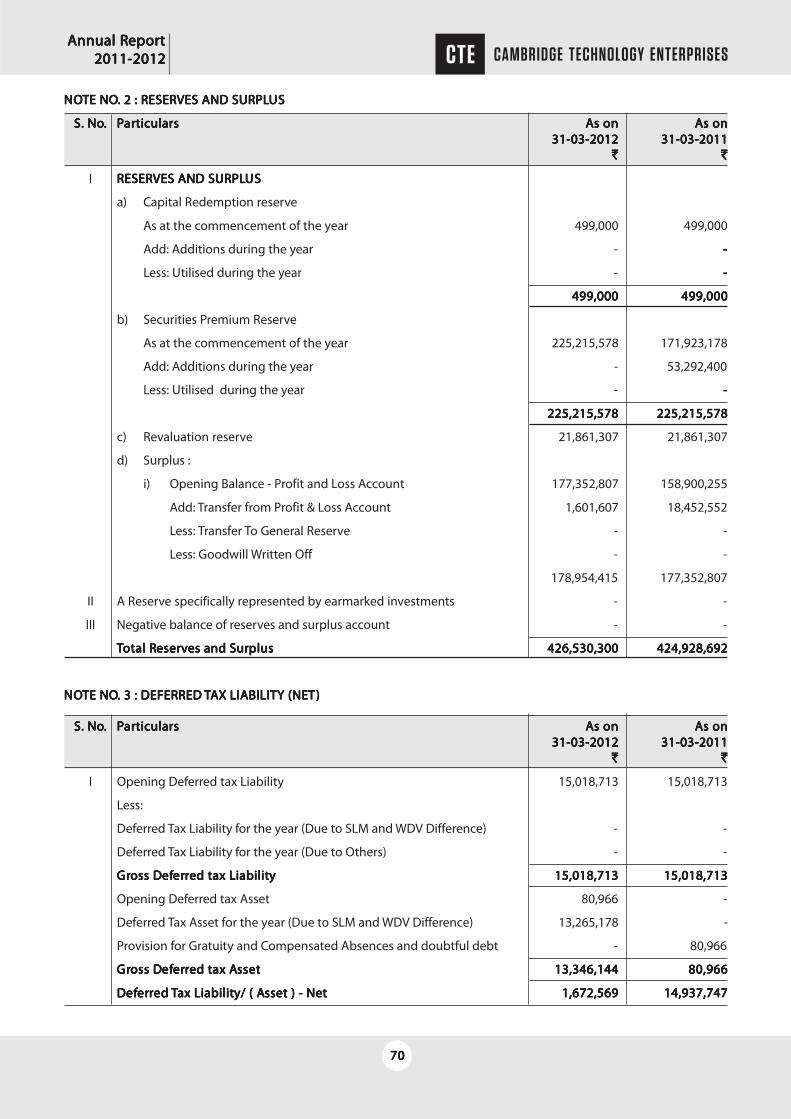
AAAAAnnual Rnnual Rnnual Rnnual Rnnual Reporeporeporeporeporttttt 2011-2012 2011-2012 2011-2012 2011-2012 2011-2012
7070707070
NONONONONOTE NOTE NOTE NOTE NOTE NO. 2 : RESER. 2 : RESER. 2 : RESER. 2 : RESER. 2 : RESERVES AND SURPLVES AND SURPLVES AND SURPLVES AND SURPLVES AND SURPLUSUSUSUSUS
S. NoS. NoS. NoS. NoS. No..... PPPPParararararticularsticularsticularsticularsticulars AAAAAs ons ons ons ons on AAAAAs ons ons ons ons on31-03-201231-03-201231-03-201231-03-201231-03-2012 31-03-201131-03-201131-03-201131-03-201131-03-2011
`̀̀̀̀ `̀̀̀̀
I RESERRESERRESERRESERRESERVES AND SURPLVES AND SURPLVES AND SURPLVES AND SURPLVES AND SURPLUSUSUSUSUS
a) Capital Redemption reserve
As at the commencement of the year 499,000 499,000
Add: Additions during the year - -----
Less: Utilised during the year - -----
499,000499,000499,000499,000499,000 499,000499,000499,000499,000499,000
b) Securities Premium Reserve
As at the commencement of the year 225,215,578 171,923,178
Add: Additions during the year - 53,292,400
Less: Utilised during the year - -----
225,215,578225,215,578225,215,578225,215,578225,215,578 225,215,578225,215,578225,215,578225,215,578225,215,578
c) Revaluation reserve 21,861,307 21,861,307
d) Surplus :
i) Opening Balance - Profit and Loss Account 177,352,807 158,900,255
Add: Transfer from Profit & Loss Account 1,601,607 18,452,552
Less: Transfer To General Reserve - -
Less: Goodwill Written Off - -
178,954,415 177,352,807
II A Reserve specifically represented by earmarked investments - -
III Negative balance of reserves and surplus account - -
TTTTTotal Rotal Rotal Rotal Rotal Reseresereseresereservvvvves and Sures and Sures and Sures and Sures and Surplusplusplusplusplus 426,530,300 426,530,300 426,530,300 426,530,300 426,530,300 424,928,692 424,928,692 424,928,692 424,928,692 424,928,692
NONONONONOTE NOTE NOTE NOTE NOTE NO. 3 : DEFERRED . 3 : DEFERRED . 3 : DEFERRED . 3 : DEFERRED . 3 : DEFERRED TTTTTAAAAAX LIABILITX LIABILITX LIABILITX LIABILITX LIABILITY (NEY (NEY (NEY (NEY (NETTTTT)))))
S. NoS. NoS. NoS. NoS. No..... PPPPParararararticularsticularsticularsticularsticulars AAAAAs ons ons ons ons on AAAAAs ons ons ons ons on31-03-201231-03-201231-03-201231-03-201231-03-2012 31-03-201131-03-201131-03-201131-03-201131-03-2011
`̀̀̀̀ `̀̀̀̀
I Opening Deferred tax Liability 15,018,713 15,018,713
Less:
Deferred Tax Liability for the year (Due to SLM and WDV Difference) - -
Deferred Tax Liability for the year (Due to Others) - -
GrGrGrGrGross Doss Doss Doss Doss Defefefefeferererererrrrrred tax Liabilited tax Liabilited tax Liabilited tax Liabilited tax Liabilityyyyy 15,018,713 15,018,713 15,018,713 15,018,713 15,018,713 15,018,71315,018,71315,018,71315,018,71315,018,713
Opening Deferred tax Asset 80,966 -
Deferred Tax Asset for the year (Due to SLM and WDV Difference) 13,265,178 -
Provision for Gratuity and Compensated Absences and doubtful debt - 80,966
GrGrGrGrGross Doss Doss Doss Doss Defefefefeferererererrrrrred tax Aed tax Aed tax Aed tax Aed tax Assetssetssetssetsset 13,346,144 13,346,144 13,346,144 13,346,144 13,346,144 80,96680,96680,96680,96680,966
DDDDDefefefefeferererererrrrrred ed ed ed ed TTTTTax Liabilitax Liabilitax Liabilitax Liabilitax Liability/ ( Ay/ ( Ay/ ( Ay/ ( Ay/ ( Asset ) - Netsset ) - Netsset ) - Netsset ) - Netsset ) - Net 1,672,569 1,672,569 1,672,569 1,672,569 1,672,569 14,937,747 14,937,747 14,937,747 14,937,747 14,937,747

AAAAAnnual Rnnual Rnnual Rnnual Rnnual Reporeporeporeporeporttttt 2011-2012 2011-2012 2011-2012 2011-2012 2011-2012
7171717171
NONONONONOTE NOTE NOTE NOTE NOTE NO. 4 : L. 4 : L. 4 : L. 4 : L. 4 : LONG ONG ONG ONG ONG TERM PRTERM PRTERM PRTERM PRTERM PROVISIONSOVISIONSOVISIONSOVISIONSOVISIONS
S. NoS. NoS. NoS. NoS. No..... PPPPParararararticularsticularsticularsticularsticulars AAAAAs ons ons ons ons on AAAAAs ons ons ons ons on31-03-201231-03-201231-03-201231-03-201231-03-2012 31-03-201131-03-201131-03-201131-03-201131-03-2011
`̀̀̀̀ `̀̀̀̀
I a) Provisions for employee benefits
- Provision for Gratuity 5,755,621 4,679,327
- Provision for Leave Encashment 792,749 618,630
TTTTTotal Lotal Lotal Lotal Lotal Long ong ong ong ong TTTTTerererererm Pm Pm Pm Pm Prrrrrooooovisionsvisionsvisionsvisionsvisions 6,548,370 6,548,370 6,548,370 6,548,370 6,548,370 5,297,9575,297,9575,297,9575,297,9575,297,957
NONONONONOTE NOTE NOTE NOTE NOTE NO.5 : SHOR.5 : SHOR.5 : SHOR.5 : SHOR.5 : SHORT T T T T TERM BORRTERM BORRTERM BORRTERM BORRTERM BORROWINGSOWINGSOWINGSOWINGSOWINGS
S.NoS.NoS.NoS.NoS.No..... PPPPParararararticularsticularsticularsticularsticulars AAAAAs ons ons ons ons on AAAAAs ons ons ons ons on31-03-201231-03-201231-03-201231-03-201231-03-2012 31-03-201131-03-201131-03-201131-03-201131-03-2011
`̀̀̀̀ `̀̀̀̀
I ShorShorShorShorShort tt tt tt tt terererererm borm borm borm borm borrrrrrooooowingswingswingswingswings
a)a)a)a)a) CCCCCash Cash Cash Cash Cash Crrrrredits and edits and edits and edits and edits and WWWWWorororororkkkkking Cing Cing Cing Cing Capital Dapital Dapital Dapital Dapital Demand Lemand Lemand Lemand Lemand Loan froan froan froan froan from Banksom Banksom Banksom Banksom Banks
- Secured 30,386,509 49,761,568
NotNotNotNotNotes:es:es:es:es:
PPPPPrrrrrimarimarimarimarimary secury secury secury secury securititititityyyyy::::: Hypothecation of entire current assets and movable fixed
assets (except hire purchase vehicles) of the company, both present and future.
CCCCCollaollaollaollaollattttterererereral secural secural secural secural securititititityyyyy::::: Extn of EM of land and Building of Cambridge Technology
India Pvt Ltd., situated at Plot No.22 within Sy. No.14 of Electronic City,
Bangalore, admeasuring 43518.94 Sft (4047.00 Sq.mts)
PPPPPersonal guarersonal guarersonal guarersonal guarersonal guarananananantttttee ee ee ee ee of Shri DRR Swaroop, Whole-Time director of the company
TTTTTotal Shorotal Shorotal Shorotal Shorotal Short t t t t TTTTTerererererm Bm Bm Bm Bm Borororororrrrrrooooowingswingswingswingswings 30,386,50930,386,50930,386,50930,386,50930,386,509 49,761,56849,761,56849,761,56849,761,56849,761,568
NONONONONOTE NOTE NOTE NOTE NOTE NO. 6 : . 6 : . 6 : . 6 : . 6 : TRTRTRTRTRADE PADE PADE PADE PADE PAAAAAYYYYYABLESABLESABLESABLESABLES
S. NoS. NoS. NoS. NoS. No..... PPPPParararararticularsticularsticularsticularsticulars AAAAAs ons ons ons ons on AAAAAs ons ons ons ons on31-03-201231-03-201231-03-201231-03-201231-03-2012 31-03-201131-03-201131-03-201131-03-201131-03-2011
`̀̀̀̀ `̀̀̀̀
I a) Trade Payables
(i) Outstanding for a period exceeding six months 278,890 583,677
(ii) Others 3,948,216 5,461,897
TTTTTotal otal otal otal otal TTTTTrrrrrade Pade Pade Pade Pade Paaaaayyyyyablesablesablesablesables 4,227,106 4,227,106 4,227,106 4,227,106 4,227,106 6,045,5746,045,5746,045,5746,045,5746,045,574
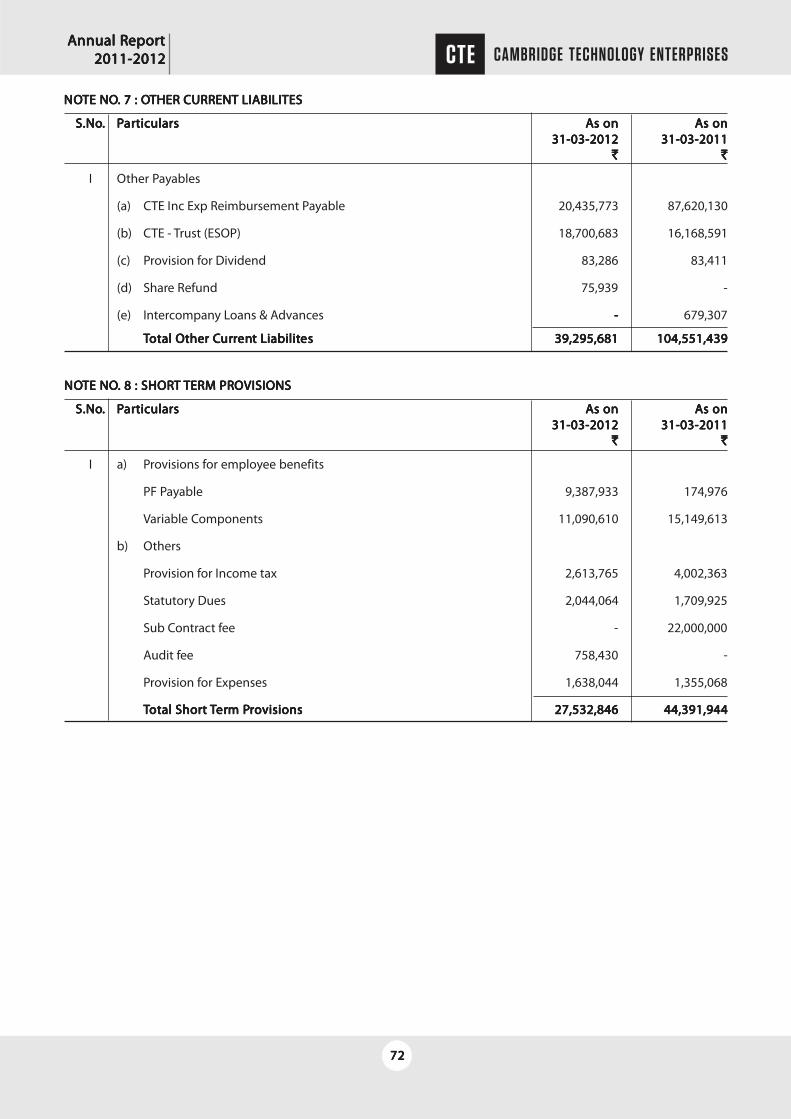
AAAAAnnual Rnnual Rnnual Rnnual Rnnual Reporeporeporeporeporttttt 2011-2012 2011-2012 2011-2012 2011-2012 2011-2012
7272727272
NONONONONOTE NOTE NOTE NOTE NOTE NO. 7 : O. 7 : O. 7 : O. 7 : O. 7 : OTHER CURRENT LIABILITESTHER CURRENT LIABILITESTHER CURRENT LIABILITESTHER CURRENT LIABILITESTHER CURRENT LIABILITES
S.NoS.NoS.NoS.NoS.No..... PPPPParararararticularsticularsticularsticularsticulars AAAAAs ons ons ons ons on AAAAAs ons ons ons ons on31-03-201231-03-201231-03-201231-03-201231-03-2012 31-03-201131-03-201131-03-201131-03-201131-03-2011
`̀̀̀̀ `̀̀̀̀
I Other Payables
(a) CTE Inc Exp Reimbursement Payable 20,435,773 87,620,130
(b) CTE - Trust (ESOP) 18,700,683 16,168,591
(c) Provision for Dividend 83,286 83,411
(d) Share Refund 75,939 -
(e) Intercompany Loans & Advances - - - - - 679,307
TTTTTotal Ootal Ootal Ootal Ootal Other Cther Cther Cther Cther Curururururrrrrrenenenenent Liabilitt Liabilitt Liabilitt Liabilitt Liabiliteseseseses 39,295,681 39,295,681 39,295,681 39,295,681 39,295,681 104,551,439 104,551,439 104,551,439 104,551,439 104,551,439
NONONONONOTE NOTE NOTE NOTE NOTE NO. 8 : SHOR. 8 : SHOR. 8 : SHOR. 8 : SHOR. 8 : SHORT T T T T TERM PRTERM PRTERM PRTERM PRTERM PROVISIONSOVISIONSOVISIONSOVISIONSOVISIONS
S.NoS.NoS.NoS.NoS.No..... PPPPParararararticularsticularsticularsticularsticulars AAAAAs ons ons ons ons on AAAAAs ons ons ons ons on31-03-201231-03-201231-03-201231-03-201231-03-2012 31-03-201131-03-201131-03-201131-03-201131-03-2011
`̀̀̀̀ `̀̀̀̀
I a) Provisions for employee benefits
PF Payable 9,387,933 174,976
Variable Components 11,090,610 15,149,613
b) Others
Provision for Income tax 2,613,765 4,002,363
Statutory Dues 2,044,064 1,709,925
Sub Contract fee - 22,000,000
Audit fee 758,430 -
Provision for Expenses 1,638,044 1,355,068
TTTTTotal Shorotal Shorotal Shorotal Shorotal Short t t t t TTTTTerererererm Pm Pm Pm Pm Prrrrrooooovisionsvisionsvisionsvisionsvisions 27,532,846 27,532,846 27,532,846 27,532,846 27,532,846 44,391,94444,391,94444,391,94444,391,94444,391,944

AAAAAnnual Rnnual Rnnual Rnnual Rnnual Reporeporeporeporeporttttt 2011-2012 2011-2012 2011-2012 2011-2012 2011-2012
7373737373
NO
TE N
O 9
(a) &
9 (b
) : T
AN
GIB
LE &
INTA
NG
IBLE
ASS
ETS
AS
AT
31-0
3-20
12
AAAA A mou
nm
oun
mou
nm
oun
mou
n t in
t i
n t i
n t i
n t i
n `̀̀̀̀
GrGrGrGr Gros
s Bl
ock
oss
Bloc
kos
s Bl
ock
oss
Bloc
kos
s Bl
ock
DDDD D eprep
rep
rep
rep
r eciaec
iaec
iaec
iaec
ia tio
n /A
tion /
Atio
n /A
tion /
Atio
n /A m
orm
orm
orm
orm
ortiz
atiz
atiz
atiz
atiz
a tio
ntio
ntio
ntio
ntio
n
SlSlSlSl Sl .... .PPPP P a
rararar artic
ular
stic
ular
stic
ular
stic
ular
stic
ular
sAAAA A s
on
s on
s on
s on
s on
AAA A A ddi
tions
dditi
ons
dditi
ons
dditi
ons
dditi
ons
Sale
/Sa
le /
Sale
/Sa
le /
Sale
/AAAA A s
on
s on
s on
s on
s on
DDDD D epepepep ep
. A. A. A. A . As o
ns o
ns o
ns o
ns o
nDDDD D e
pepepep ep. F. F. F. F . F
orororor orDDDD D e
letio
nsele
tions
eletio
nsele
tions
eletio
nsIIII I m
pair
mpa
irm
pair
mpa
irm
pair m
enm
enm
enm
enm
entttt t
TTTT T ota
lot
alot
alot
alot
alNe
t Blo
ckNe
t Blo
ckNe
t Blo
ckNe
t Blo
ckNe
t Blo
ckNe
t Blo
ckNe
t Blo
ckNe
t Blo
ckNe
t Blo
ckNe
t Blo
ckNoNoNoNo No
.... .01
.04.20
1101
.04.20
1101
.04.20
1101
.04.20
1101
.04.20
11du
rdu
rdu
rdu
rdu
r ing
ing
ing
ing
ing
DDDD D elet
ions
eletio
nsele
tions
eletio
nsele
tions
31.03
.2012
31.03
.2012
31.03
.2012
31.03
.2012
31.03
.2012
01.04
.2011
01.04
.2011
01.04
.2011
01.04
.2011
01.04
.2011
the y
the y
the y
the y
the y
ear
ear
ear
ear
ear
dur
dur
dur
dur
dur in
g th
ein
g th
ein
g th
ein
g th
ein
g th
eLLLL L o
ss /
oss /
oss /
oss /
oss /
DDDD D eprep
rep
rep
rep
r eciaec
iaec
iaec
iaec
ia tio
ntio
ntio
ntio
ntio
nAAAA A s
on
s on
s on
s on
s on
AAAA A s o
ns o
ns o
ns o
ns o
nth
e yth
e yth
e yth
e yth
e yea
rea
rea
rea
rea
rdu
rdu
rdu
rdu
rdu
r ing
the y
ing
the y
ing
the y
ing
the y
ing
the y
ear
ear
ear
ear
ear
2011
-12
2011
-12
2011
-12
2011
-12
2011
-12
per
per
per
per
per io
dio
dio
dio
dio
dRRRR R e
vevevev ever
sal
ersa
ler
sal
ersa
ler
sal
31.03
.2012
31.03
.2012
31.03
.2012
31.03
.2012
31.03
.2012
31.03
.2011
31.03
.2011
31.03
.2011
31.03
.2011
31.03
.2011
TTTT T ANG
IBLE
ASS
EAN
GIBL
E ASS
EAN
GIBL
E ASS
EAN
GIBL
E ASS
EAN
GIBL
E ASS
E TTTT TS:S:S:S: S:
1111 1 LA
ND LA
ND LA
ND LA
ND LA
ND
-
-
-
-
-
-
-
-
-
--
-
-
-
-
-
-
-
-
-
-
-
-
-
-
-
----- -
2222 2 BU
ILDIN
G BU
ILDIN
G BU
ILDIN
G BU
ILDIN
G BU
ILDIN
G
-
-
-
-
-
-
-
-
-
- -
-
-
-
-
-
-
-
-
-
-
-
-
-
-
-
-
3333 3 PL
ANT &
M PL
ANT &
M PL
ANT &
M PL
ANT &
M PL
ANT &
MAAAA A C
HINE
RCH
INER
CHIN
ERCH
INER
CHIN
ERYYYY Y
2,63
5,010
7
45,68
3
470
,316
2,91
0,377
2,91
0,377
2,91
0,377
2,91
0,377
2,91
0,377
493
,133
319,1
69
145
,122
-
6
67,18
0
667
,180
6
67,18
0
667
,180
6
67,18
0
2,24
3,197
2
,243,1
97
2,24
3,197
2
,243,1
97
2,24
3,197
2,14
1,877
2,14
1,877
2,14
1,877
2,14
1,877
2,14
1,877
4444 4 EL
EC EL
EC EL
EC EL
EC EL
ECTR
ICTR
ICTR
ICTR
ICTR
ICAL
EQUI
PAL
EQUI
PAL
EQUI
PAL
EQUI
PAL
EQUI
P MEN
TM
ENT
MEN
TM
ENT
MEN
T30
0,073
37,85
0
252
,233
8
5,690
8
5,690
8
5,690
8
5,690
8
5,690
119
,175
26,5
59
131
,172
-
14,56
2
14
,562
14,56
2
14
,562
14,56
2
7
1,128
71,1
28
7
1,128
71,1
28
7
1,128
18
0,898
18
0,898
18
0,898
18
0,898
18
0,898
5555 5 A A A A A
UTUTUTUT UTOM
OBILE
SOM
OBILE
SOM
OBILE
SOM
OBILE
SOM
OBILE
S
-
-
-
-
-
-
-
-
-
-
-
-
-
-
-
-
-
-
-
-
-
-
-
-
-
-
6666 6 O
FFIC
E EQU
IP O
FFIC
E EQU
IP O
FFIC
E EQU
IP O
FFIC
E EQU
IP O
FFIC
E EQU
IP MEN
TM
ENT
MEN
TM
ENT
MEN
T
1
,637,7
43
735
,836
6
23,44
5
1,
750,1
34
1,
750,1
34
1,
750,1
34
1,
750,1
34
1,
750,1
34
4
62,94
8
21
2,623
3
09,70
2
-
365
,868
3
65,86
8
365
,868
3
65,86
8
365
,868
1
,384,2
66
1,38
4,266
1
,384,2
66
1,38
4,266
1
,384,2
66
1
,174,7
95
1
,174,7
95
1
,174,7
95
1
,174,7
95
1
,174,7
95
7777 7 C C C C C
OMPU
TERS
OMPU
TERS
OMPU
TERS
OMPU
TERS
OMPU
TERS
19,8
01,34
8
1,69
0,340
1,
324,0
81
20,1
67,60
7
20,1
67,60
7
20,1
67,60
7
20,1
67,60
7
20,1
67,60
7
17,9
10,25
2
98
2,205
1,16
6,862
-
17,72
5,595
17,72
5,595
17,72
5,595
17,72
5,595
17,72
5,595
2
,442,0
12
2,44
2,012
2
,442,0
12
2,44
2,012
2
,442,0
12
1
,891,0
96
1
,891,0
96
1
,891,0
96
1
,891,0
96
1
,891,0
96
8888 8 FU
RNITU
RE FU
RNITU
RE FU
RNITU
RE FU
RNITU
RE FU
RNITU
RE
2
,917,9
32
1,79
6,445
1,
541,4
33
3,
172,9
44
3,
172,9
44
3,
172,9
44
3,
172,9
44
3,
172,9
44
9
59,01
4
50
9,458
5
32,53
3
-
935
,939
9
35,93
9
935
,939
9
35,93
9
935
,939
2
,237,0
05
2,23
7,005
2
,237,0
05
2,23
7,005
2
,237,0
05
1
,958,9
18
1
,958,9
18
1
,958,9
18
1
,958,9
18
1
,958,9
18
9999 9SO
FTSO
FTSO
FTSO
FTSO
FTWWWW W
ARE
ARE
ARE
ARE
ARE
20,7
23,96
4
3,05
7,829
-
2
3,781
,793
2
3,781
,793
2
3,781
,793
2
3,781
,793
2
3,781
,793
1
6,536
,541
4
,939,3
42
-
21,47
5,883
21,47
5,883
21,47
5,883
21,47
5,883
21,47
5,883
2
,305,9
10
2,30
5,910
2
,305,9
10
2,30
5,910
2
,305,9
10
4
,187,4
23
4
,187,4
23
4
,187,4
23
4
,187,4
23
4
,187,4
23
TTTT T OOOO OTTTT T A
LALALAL AL48
,016,0
7048
,016,0
7048
,016,0
7048
,016,0
7048
,016,0
70
8,06
3,983
8
,063,9
83
8,06
3,983
8
,063,9
83
8,06
3,983
4
,211,5
08
4,21
1,508
4
,211,5
08
4,21
1,508
4
,211,5
08
51,8
68,54
5
51,8
68,54
5
51,8
68,54
5
51,8
68,54
5
51,8
68,54
5
36,4
81,06
4
36,4
81,06
4
36,4
81,06
4
36,4
81,06
4
36,4
81,06
4
6,9
89,35
5
6,9
89,35
5
6,9
89,35
5
6,9
89,35
5
6,9
89,35
5
2,285
,391
2,2
85,39
1
2,285
,391
2,2
85,39
1
2,285
,391
-
-
-
-
-
41,18
5,027
41,18
5,027
41,18
5,027
41,18
5,027
41,18
5,027
10
,683,5
18
10,68
3,518
10
,683,5
18
10,68
3,518
10
,683,5
18
11
,535,0
06
11
,535,0
06
11
,535,0
06
11
,535,0
06
11
,535,0
06
INT
INT
INT
INT
INT A
NGIB
E FIX
ED A
SSE
ANGI
BE FI
XED
ASSE
ANGI
BE FI
XED
ASSE
ANGI
BE FI
XED
ASSE
ANGI
BE FI
XED
ASSE
TTTT T S :S :S :S : S :
10101010 10CCCC C o
mpu
tom
put
ompu
tom
put
ompu
t er Ser S
er S
er S
er S o
fofofof oftttt t wwww w
arararar areeee e
UUUU U sed
in D
sed i
n Dse
d in D
sed i
n Dse
d in D
evevevev evel
opm
enel
opm
enel
opm
enel
opm
enel
opm
entttt t
of P
of P
of P
of P
of P
rrrr r oje
coj
ecoj
ecoj
ecoj
ectstststs ts
43,9
18,53
5
--
4
3,918
,535
4
3,918
,535
4
3,918
,535
4
3,918
,535
4
3,918
,535
4
3,918
,535
- -
-
43
,918,5
35
43
,918,5
35
43
,918,5
35
43
,918,5
35
43
,918,5
35
-
-
-
-
-
-
-
-
-
-
11111111 11IIII I nnnn n
tttt t erererer erna
lly de
vna
lly de
vna
lly de
vna
lly de
vna
lly de
v elo
ped
elop
edel
oped
elop
edel
oped
SSSS S ofofofof oftttt t wwww w
arararar are -
Re -
Re -
Re -
Re -
R eus
able
eusa
ble
eusa
ble
eusa
ble
eusa
ble
CCCC C om
pone
nom
pone
nom
pone
nom
pone
nom
pone
n ts L
ibr
ts Lib
rts
Libr
ts Lib
rts
Libr a
rararar aryyyy y
293,8
02,97
8
--
293,8
02,97
829
3,802
,978
293,8
02,97
829
3,802
,978
293,8
02,97
8
187,4
92,82
6
76,06
4,292
- - - - -
3
0,245
,860
2
93,80
2,978
2
93,80
2,978
2
93,80
2,978
2
93,80
2,978
2
93,80
2,978
-
-
-
-
-
106
,310,1
52
106
,310,1
52
106
,310,1
52
106
,310,1
52
106
,310,1
52
TTTT T OOOO OTTTT T A
LALALAL AL33
7,721
,513
337,7
21,51
333
7,721
,513
337,7
21,51
333
7,721
,513
-
-
-
-
-
-
-
-
-
-
33
7,721
,513
33
7,721
,513
33
7,721
,513
33
7,721
,513
33
7,721
,513
23
1,411
,361
23
1,411
,361
23
1,411
,361
23
1,411
,361
23
1,411
,361
7
6,064
,292
7
6,064
,292
7
6,064
,292
7
6,064
,292
7
6,064
,292
-
-
-
-
-
3
0,245
,860
30
,245,8
60
30,24
5,860
30
,245,8
60
30,24
5,860
3
37,72
1,513
3
37,72
1,513
3
37,72
1,513
3
37,72
1,513
3
37,72
1,513
-
-
-
-
-
106
,310,1
52
106
,310,1
52
106
,310,1
52
106
,310,1
52
106
,310,1
52
TTTT T OOOO OTTTT T A
LALALAL AL38
5,737
,583
385,7
37,58
338
5,737
,583
385,7
37,58
338
5,737
,583
8
,063,9
83
8,06
3,983
8
,063,9
83
8,06
3,983
8
,063,9
83
4,21
1,508
4
,211,5
08
4,21
1,508
4
,211,5
08
4,21
1,508
38
9,590
,058
38
9,590
,058
38
9,590
,058
38
9,590
,058
38
9,590
,058
26
7,892
,425
26
7,892
,425
26
7,892
,425
26
7,892
,425
26
7,892
,425
8
3,053
,647
8
3,053
,647
8
3,053
,647
8
3,053
,647
8
3,053
,647
2,2
85,39
1
2,285
,391
2,2
85,39
1
2,285
,391
2,2
85,39
1
3
0,245
,860
30
,245,8
60
30,24
5,860
30
,245,8
60
30,24
5,860
3
78,90
6,540
3
78,90
6,540
3
78,90
6,540
3
78,90
6,540
3
78,90
6,540
10
,683,5
18
10,68
3,518
10
,683,5
18
10,68
3,518
10
,683,5
18
117
,845,1
58
117
,845,1
58
117
,845,1
58
117
,845,1
58
117
,845,1
58
PRE
PRE
PRE
PRE
PRE V
IOUS
VI
OUS
VIOU
S VI
OUS
VIOU
S YYYY YEA
REA
REA
REA
REA
R
3
09,19
3,333
309
,193,3
33
3
09,19
3,333
309
,193,3
33
3
09,19
3,333
79
,389,6
53
79,38
9,653
79
,389,6
53
79,38
9,653
79
,389,6
53
2,84
5,403
2
,845,4
03
2,84
5,403
2
,845,4
03
2,84
5,403
38
5,737
,583
38
5,737
,583
38
5,737
,583
38
5,737
,583
38
5,737
,583
17
2,450
,164
17
2,450
,164
17
2,450
,164
17
2,450
,164
17
2,450
,164
9
6,749
,919
9
6,749
,919
9
6,749
,919
9
6,749
,919
9
6,749
,919
1,3
07,65
8
1,307
,658
1,3
07,65
8
1,307
,658
1,3
07,65
8
-
-
-
-
-
267
,892,4
25
267
,892,4
25
267
,892,4
25
267
,892,4
25
267
,892,4
25 1
17,84
5,158
117
,845,1
58 1
17,84
5,158
117
,845,1
58 1
17,84
5,158
1
36,74
3,169
1
36,74
3,169
1
36,74
3,169
1
36,74
3,169
1
36,74
3,169
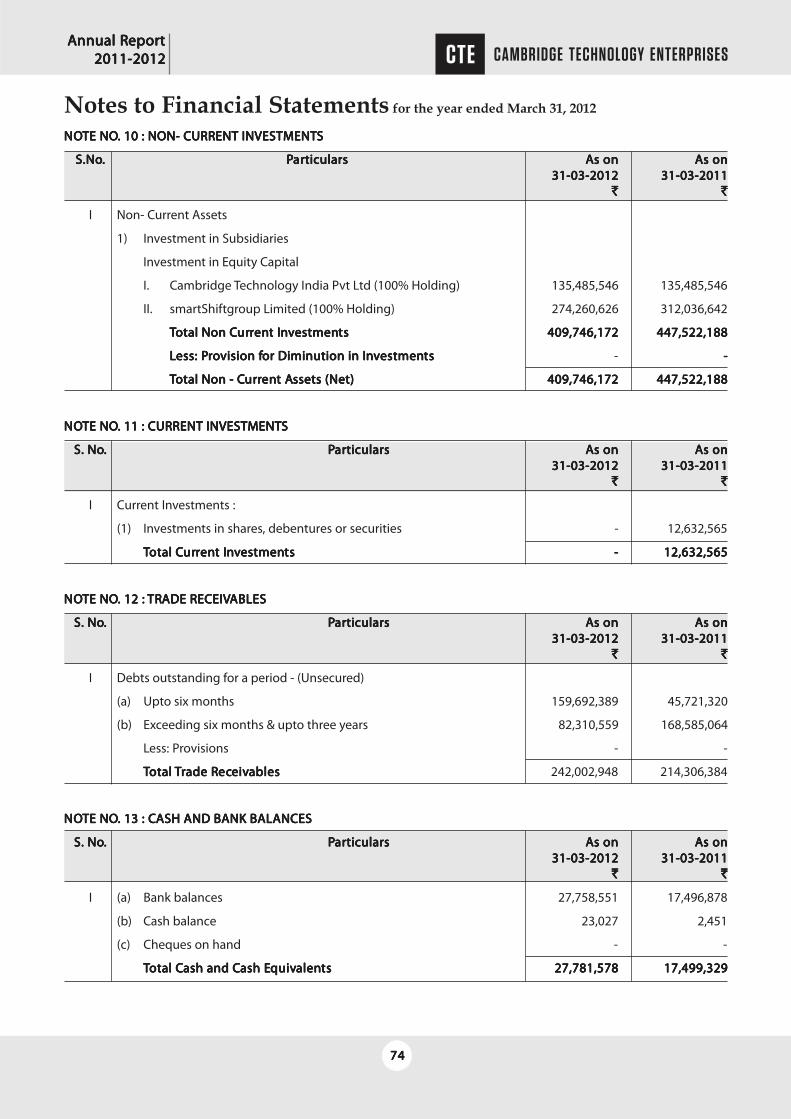
AAAAAnnual Rnnual Rnnual Rnnual Rnnual Reporeporeporeporeporttttt 2011-2012 2011-2012 2011-2012 2011-2012 2011-2012
7474747474
Notes to Financial Statements for the year ended March 31, 2012
NONONONONOTE NOTE NOTE NOTE NOTE NO. 10 : NON- CURRENT INVESTMENT. 10 : NON- CURRENT INVESTMENT. 10 : NON- CURRENT INVESTMENT. 10 : NON- CURRENT INVESTMENT. 10 : NON- CURRENT INVESTMENTSSSSS
S.NoS.NoS.NoS.NoS.No..... P P P P Parararararticularsticularsticularsticularsticulars AAAAAs ons ons ons ons on AAAAAs ons ons ons ons on31-03-201231-03-201231-03-201231-03-201231-03-2012 31-03-201131-03-201131-03-201131-03-201131-03-2011
`̀̀̀̀ `̀̀̀̀
I Non- Current Assets
1) Investment in Subsidiaries
Investment in Equity Capital
I. Cambridge Technology India Pvt Ltd (100% Holding) 135,485,546 135,485,546
II. smartShiftgroup Limited (100% Holding) 274,260,626 312,036,642
TTTTTotal Non Cotal Non Cotal Non Cotal Non Cotal Non Curururururrrrrrenenenenent It It It It Innnnnvvvvvestmenestmenestmenestmenestmentststststs 409,746,172 409,746,172 409,746,172 409,746,172 409,746,172 447,522,188447,522,188447,522,188447,522,188447,522,188
LLLLLess: Pess: Pess: Pess: Pess: Prrrrrooooovision fvision fvision fvision fvision for Diminution in Ior Diminution in Ior Diminution in Ior Diminution in Ior Diminution in Innnnnvvvvvestmenestmenestmenestmenestmentststststs - - - - - -
TTTTTotal Non - Cotal Non - Cotal Non - Cotal Non - Cotal Non - Curururururrrrrrenenenenent At At At At Assets (Net)ssets (Net)ssets (Net)ssets (Net)ssets (Net) 409,746,172 409,746,172 409,746,172 409,746,172 409,746,172 447,522,188447,522,188447,522,188447,522,188447,522,188
NONONONONOTE NOTE NOTE NOTE NOTE NO. 11 : CURRENT INVESTMENT. 11 : CURRENT INVESTMENT. 11 : CURRENT INVESTMENT. 11 : CURRENT INVESTMENT. 11 : CURRENT INVESTMENTSSSSS
S. NoS. NoS. NoS. NoS. No..... P P P P Parararararticularsticularsticularsticularsticulars AAAAAs ons ons ons ons on AAAAAs ons ons ons ons on31-03-201231-03-201231-03-201231-03-201231-03-2012 31-03-201131-03-201131-03-201131-03-201131-03-2011
`̀̀̀̀ `̀̀̀̀
I Current Investments :
(1) Investments in shares, debentures or securities - 12,632,565
TTTTTotal Cotal Cotal Cotal Cotal Curururururrrrrrenenenenent It It It It Innnnnvvvvvestmenestmenestmenestmenestmentststststs - - - - - 12,632,56512,632,56512,632,56512,632,56512,632,565
NONONONONOTE NOTE NOTE NOTE NOTE NO. 12 : . 12 : . 12 : . 12 : . 12 : TRTRTRTRTRADE RECEIVADE RECEIVADE RECEIVADE RECEIVADE RECEIVABLESABLESABLESABLESABLES
S. NoS. NoS. NoS. NoS. No..... P P P P Parararararticularsticularsticularsticularsticulars AAAAAs ons ons ons ons on AAAAAs ons ons ons ons on31-03-201231-03-201231-03-201231-03-201231-03-2012 31-03-201131-03-201131-03-201131-03-201131-03-2011
`̀̀̀̀ `̀̀̀̀
I Debts outstanding for a period - (Unsecured)
(a) Upto six months 159,692,389 45,721,320
(b) Exceeding six months & upto three years 82,310,559 168,585,064
Less: Provisions - -
TTTTTotal otal otal otal otal TTTTTrrrrrade Rade Rade Rade Rade Recececececeiveiveiveiveivablesablesablesablesables 242,002,948 214,306,384
NONONONONOTE NOTE NOTE NOTE NOTE NO. 13 : C. 13 : C. 13 : C. 13 : C. 13 : CASH AND BANK BALANCESASH AND BANK BALANCESASH AND BANK BALANCESASH AND BANK BALANCESASH AND BANK BALANCES
S. NoS. NoS. NoS. NoS. No..... P P P P Parararararticularsticularsticularsticularsticulars AAAAAs ons ons ons ons on AAAAAs ons ons ons ons on31-03-201231-03-201231-03-201231-03-201231-03-2012 31-03-201131-03-201131-03-201131-03-201131-03-2011
`̀̀̀̀ `̀̀̀̀
I (a) Bank balances 27,758,551 17,496,878
(b) Cash balance 23,027 2,451
(c) Cheques on hand - -
TTTTTotal Cotal Cotal Cotal Cotal Cash and Cash and Cash and Cash and Cash and Cash Eash Eash Eash Eash Equivquivquivquivquivalenalenalenalenalentststststs 27,781,57827,781,57827,781,57827,781,57827,781,578 17,499,32917,499,32917,499,32917,499,32917,499,329

AAAAAnnual Rnnual Rnnual Rnnual Rnnual Reporeporeporeporeporttttt 2011-2012 2011-2012 2011-2012 2011-2012 2011-2012
7575757575
NONONONONOTE NOTE NOTE NOTE NOTE NO. 14 : SHOR. 14 : SHOR. 14 : SHOR. 14 : SHOR. 14 : SHORT T T T T TERM LTERM LTERM LTERM LTERM LOOOOOANS AND ADVANS AND ADVANS AND ADVANS AND ADVANS AND ADVANCESANCESANCESANCESANCES
S. NoS. NoS. NoS. NoS. No..... P P P P Parararararticularsticularsticularsticularsticulars Non C Non C Non C Non C Non Curururururrrrrrenenenenenttttt
AAAAAs ons ons ons ons on AAAAAs ons ons ons ons on31-03-201231-03-201231-03-201231-03-201231-03-2012 31-03-201131-03-201131-03-201131-03-201131-03-2011
`̀̀̀̀ `̀̀̀̀
I OOOOOthersthersthersthersthers
(a) Advances to Vendors 53,846 521,101
(b) Advances to Employees 455,198 1,542,986
(c) Deposits 8,375,411 6,203,566
TTTTTotal Shorotal Shorotal Shorotal Shorotal Short t t t t TTTTTerererererm Lm Lm Lm Lm Loans and Aoans and Aoans and Aoans and Aoans and Advdvdvdvdvancancancancanceseseseses 8,884,455 8,884,455 8,884,455 8,884,455 8,884,455 8,267,653 8,267,653 8,267,653 8,267,653 8,267,653
NONONONONOTE NOTE NOTE NOTE NOTE NO. 15 : O. 15 : O. 15 : O. 15 : O. 15 : OTHER ASSETHER ASSETHER ASSETHER ASSETHER ASSETTTTTS (S (S (S (S (CURRENTCURRENTCURRENTCURRENTCURRENT)))))
S. NoS. NoS. NoS. NoS. No..... P P P P Parararararticularsticularsticularsticularsticulars Non C Non C Non C Non C Non Curururururrrrrrenenenenenttttt
AAAAAs ons ons ons ons on AAAAAs ons ons ons ons on31-03-201231-03-201231-03-201231-03-201231-03-2012 31-03-201131-03-201131-03-201131-03-201131-03-2011
`̀̀̀̀ `̀̀̀̀
I (a) MAT Entitlement Receivable 13,185,753 18,891,607
(b) Input Service Tax 3,321,261 4,636,698
(c) Advance Tax & TDS Receivables 2,278,759 118,405
(d) Unbilled Revenue 8,104,180 -
(e) Prepaid Expenses 4,014,906 2,005,087
(f ) Others 2,500,000 2,500,000
TTTTTotal Ootal Ootal Ootal Ootal Other Ather Ather Ather Ather Assetsssetsssetsssetsssets 33,404,859 33,404,859 33,404,859 33,404,859 33,404,859 28,151,79728,151,79728,151,79728,151,79728,151,797
NONONONONOTE NOTE NOTE NOTE NOTE NO. 16 : RE. 16 : RE. 16 : RE. 16 : RE. 16 : REVENUE FRVENUE FRVENUE FRVENUE FRVENUE FROM OPEROM OPEROM OPEROM OPEROM OPERAAAAATIONSTIONSTIONSTIONSTIONS
S.NoS.NoS.NoS.NoS.No..... P P P P Parararararticularsticularsticularsticularsticulars YYYYYear Endedear Endedear Endedear Endedear Ended YYYYYear Endedear Endedear Endedear Endedear Ended31-03-201231-03-201231-03-201231-03-201231-03-2012 31-03-201131-03-201131-03-201131-03-201131-03-2011
`̀̀̀̀ `̀̀̀̀
I Revenue from operations in respect of non-finance company
(a) Sale of Services 307,939,554 327,619,009
TTTTTotal Rotal Rotal Rotal Rotal Revevevevevenue frenue frenue frenue frenue from Operom Operom Operom Operom Operaaaaationstionstionstionstions 307,939,554 307,939,554 307,939,554 307,939,554 307,939,554 327,619,009 327,619,009 327,619,009 327,619,009 327,619,009
NONONONONOTE NOTE NOTE NOTE NOTE NO. 17 : O. 17 : O. 17 : O. 17 : O. 17 : OTHER INCTHER INCTHER INCTHER INCTHER INCOMEOMEOMEOMEOME
S.NoS.NoS.NoS.NoS.No..... P P P P Parararararticularsticularsticularsticularsticulars YYYYYear Endedear Endedear Endedear Endedear Ended YYYYYear Endedear Endedear Endedear Endedear Ended31-03-201231-03-201231-03-201231-03-201231-03-2012 31-03-201131-03-201131-03-201131-03-201131-03-2011
`̀̀̀̀ `̀̀̀̀
I (a) Interest Income (on Bank Deposits) 19,085 20,795
(b) Dividend Received on Mutual funds 157,613 632,564
(c) Net gain/loss on foreign currency translation and transaction(other than considered as finance cost) 20,470,545 2,200,412
TTTTTotal Ootal Ootal Ootal Ootal Other Ither Ither Ither Ither Incncncncncomeomeomeomeome 20,647,243 20,647,243 20,647,243 20,647,243 20,647,243 2,853,771 2,853,771 2,853,771 2,853,771 2,853,771

AAAAAnnual Rnnual Rnnual Rnnual Rnnual Reporeporeporeporeporttttt 2011-2012 2011-2012 2011-2012 2011-2012 2011-2012
7676767676
NONONONONOTE NOTE NOTE NOTE NOTE NO. 18 : EML. 18 : EML. 18 : EML. 18 : EML. 18 : EMLOOOOOYYYYYEE BENEFIT EXPENSESEE BENEFIT EXPENSESEE BENEFIT EXPENSESEE BENEFIT EXPENSESEE BENEFIT EXPENSES
S.NoS.NoS.NoS.NoS.No..... P P P P Parararararticularsticularsticularsticularsticulars YYYYYear Endedear Endedear Endedear Endedear Ended YYYYYear Endedear Endedear Endedear Endedear Ended31-03-201231-03-201231-03-201231-03-201231-03-2012 31-03-201131-03-201131-03-201131-03-201131-03-2011
`̀̀̀̀ `̀̀̀̀
I (a) Salaries & Wages 133,377,652 142,154,673
(b) Contribution to Provident & Other Funds 9,076,397 6,486,617
(c) Staff Welfare Expenses 1,250,416 1,322,135
TTTTTotal Emplootal Emplootal Emplootal Emplootal Employyyyyee Bee Bee Bee Bee Benefit Expensesenefit Expensesenefit Expensesenefit Expensesenefit Expenses 143,704,465 143,704,465 143,704,465 143,704,465 143,704,465 149,963,425 149,963,425 149,963,425 149,963,425 149,963,425
NONONONONOTE NOTE NOTE NOTE NOTE NO. 19 : O. 19 : O. 19 : O. 19 : O. 19 : OTHER OPERTHER OPERTHER OPERTHER OPERTHER OPERAAAAATING EXPENSESTING EXPENSESTING EXPENSESTING EXPENSESTING EXPENSES
S.NoS.NoS.NoS.NoS.No..... P P P P Parararararticularsticularsticularsticularsticulars YYYYYear Endedear Endedear Endedear Endedear Ended YYYYYear Endedear Endedear Endedear Endedear Ended31-03-201231-03-201231-03-201231-03-201231-03-2012 31-03-201131-03-201131-03-201131-03-201131-03-2011
`̀̀̀̀ `̀̀̀̀
I (a) Consumption of Stores & Spares - -
(b) Power & Fuel 3,751,509 2,433,054
(c) Rent 9,561,770 8,466,976
(d) Insurance 497,619 348,612
(e) Dues & Subscriptions 326,373 322,366
(f ) Miscellaneous Expenditure 83,441 312,659
(Miscellaneous Expenditure of 2011 consists of Tenderapplication fees amount of Rs.131,093)
(g) Payment to Auditors:
(i) As Auditor 675,000 675,000
(ii) For Taxation Matters 75,000 75,000
(iii) For Internal Auditor 300,000 300,000
(h) Net loss on sale of Assets 1,438,498 1,373,745
(i) Cost of Software licenses 1,247,882 -
TTTTTotal Ootal Ootal Ootal Ootal Other Expensesther Expensesther Expensesther Expensesther Expenses 17,957,09217,957,09217,957,09217,957,09217,957,092 14,307,41214,307,41214,307,41214,307,41214,307,412

AAAAAnnual Rnnual Rnnual Rnnual Rnnual Reporeporeporeporeporttttt 2011-2012 2011-2012 2011-2012 2011-2012 2011-2012
7777777777
NONONONONOTE NOTE NOTE NOTE NOTE NO. 20 : ADMINSTR. 20 : ADMINSTR. 20 : ADMINSTR. 20 : ADMINSTR. 20 : ADMINSTRAAAAATIVE EXPENSESTIVE EXPENSESTIVE EXPENSESTIVE EXPENSESTIVE EXPENSES
S.NoS.NoS.NoS.NoS.No..... P P P P Parararararticularsticularsticularsticularsticulars YYYYYear Endedear Endedear Endedear Endedear Ended YYYYYear Endedear Endedear Endedear Endedear Ended31-03-201231-03-201231-03-201231-03-201231-03-2012 31-03-201131-03-201131-03-201131-03-201131-03-2011
`̀̀̀̀ `̀̀̀̀
I (a) Telephone, Postage and Others 2,692,083 3,059,239
(b) Travelling & Conveyance 11,997,830 16,688,749
(c) Office Maintenance 4,088,333 3,565,532
(d) Printing & Stationery Expenses 461,705 566,066
(e) Security Charges 792,664 478,860
(f ) Rates & Taxes (excluding Income Tax) 815,992 411,933
(g) Managerial Remuneration 1,200,000 2,250,000
(h) Consultancy Charges 9,388,945 10,128,701
(i) Bank Charges 502,447 852,336
(j) Seminar & Conference 196,281 29,612
(k) Interest on TDS 363,979 539,796
(l) Director Sitting Fee 270,000 410,000
(m) Computer hire charges 1,661,964 2,298,760
TTTTTotal Aotal Aotal Aotal Aotal Administrdministrdministrdministrdministraaaaativtivtivtivtive Expensese Expensese Expensese Expensese Expenses 34,432,223 34,432,223 34,432,223 34,432,223 34,432,223 41,279,584 41,279,584 41,279,584 41,279,584 41,279,584
NONONONONOTE NOTE NOTE NOTE NOTE NO. 21 : FINANCE C. 21 : FINANCE C. 21 : FINANCE C. 21 : FINANCE C. 21 : FINANCE COSTOSTOSTOSTOST
S.NoS.NoS.NoS.NoS.No..... P P P P Parararararticularsticularsticularsticularsticulars YYYYYear Endedear Endedear Endedear Endedear Ended YYYYYear Endedear Endedear Endedear Endedear Ended31-03-201231-03-201231-03-201231-03-201231-03-2012 31-03-201131-03-201131-03-201131-03-201131-03-2011
`̀̀̀̀ `̀̀̀̀
I (a) Interest Expenses
- Interest on Working capital Loan 5,359,389 7,489,374
- Interest on Other Loans 1,823 2,027,304
TTTTTotal Fotal Fotal Fotal Fotal Financinancinancinancinance Ce Ce Ce Ce Costostostostost 5,361,212 5,361,212 5,361,212 5,361,212 5,361,212 9,516,678 9,516,678 9,516,678 9,516,678 9,516,678

AAAAAnnual Rnnual Rnnual Rnnual Rnnual Reporeporeporeporeporttttt 2011-2012 2011-2012 2011-2012 2011-2012 2011-2012
7878787878
Significant Accounting Policies(All amounts have been presented in Rupees unless otherwise specified)
1.1.1.1.1. CCCCCompanompanompanompanompany oy oy oy oy ovvvvverererererviewviewviewviewview
Cambridge Technology Enterprises Limited, “the Company” is an information technology services provider dedicatedto serving the midsize market of enterprises and the midsize units of Global 2000 enterprises across the spectrum ofbusiness industries. The Company was incorporated on January 28, 1999 in Hyderabad, Andhra Pradesh, India.
2.2.2.2.2. SigSigSigSigSignificannificannificannificannificant act act act act accccccounounounounounting policiesting policiesting policiesting policiesting policies
2.12.12.12.12.1 Basis of prBasis of prBasis of prBasis of prBasis of preparepareparepareparaaaaation of financial station of financial station of financial station of financial station of financial statttttemenemenemenemenementststststs
The financial statements are prepared in accordance with Indian Generally Accepted Accounting Principles (“GAAP”)under the historical cost convention on the accrual basis. GAAP comprises mandatory accounting standards asspecified in the Companies (Accounting Standards) Rules, 2006 and the relevant provisions of the Indian CompaniesAct, 1956. Accounting policies have been consistently applied except where a newly issued accounting standard isinitially adopted or a revision to an existing accounting adopted or a revision to an existing accounting standardrequires a change in the accounting policy hitherto in use. The management evaluates all recently issued or revisedaccounting standards on an ongoing basis.
2.22.22.22.22.2 UUUUUse of estimase of estimase of estimase of estimase of estimattttteseseseses
The preparation of the financial statements in conformity with GAAP requires Management to make estimates andassumptions that affect the reported balances of assets and liabilities and disclosures relating to contingent assetsand liabilities as at the date of the financial statements and reported amounts of income and expenses during theperiod. Actual results could differ from those estimates. Examples of such estimates include provisions for doubtfuldebts, future obligations under employee retirement benefit plans, income taxes, and the useful lives of fixed assetsand intangible assets. Management periodically assesses using, external and internal sources, whether there is anindication that an asset may be impaired. Impairment occurs where the carrying value exceeds the present value offuture cash flows expected to arise from the continuing use of the asset and its eventual disposal. The impairmentloss to be expensed is determined as the excess of the carrying amount over the higher of the asset’s net sales priceor present value as determined above. Contingencies are recorded when it is probable that a liability will be incurred,and the amount can be reasonably estimated. Where no reliable estimate can be made, a disclosure is made ascontingent liability. Actual results could differ from those estimates.
2.32.32.32.32.3 RRRRRevevevevevenue renue renue renue renue recececececogogogogognitionnitionnitionnitionnition
Income from Software services and products
Revenue from professional services consist primarily of revenue earned from services performed on a “time andmaterial” basis. The related revenue is recognized as and when the services are performed. The Company also performstime bound fixed-price engagements, under which revenue is recognized using the percentage of completion methodof accounting. The cumulative impact of any revision in estimates of the percentage of work completed is reflectedin the year in which the change becomes known. Provisions for estimated losses on such engagements are madeduring the year in which a loss becomes probable and can be reasonably estimated.
Amounts received or billed in advance of services performed are recorded as advance from customers/unearnedrevenue. Unbilled revenue, included in debtors, represents amounts recognized based on services performed inadvance of billing in accordance with contract terms. Unearned revenue is calculated on the basis of the unutilizedperiod of time at the Balance Sheet and represents revenue which is expected to be earned in future periods inrespect of internet, e-mail services, electronic data interchange and web hosting services.
Revenue from the sale of user licenses for software applications is recognized on transfer of the title in the userlicense, except in case of multiple element contracts requiring significant implementation services, where revenue isrecognized as per the percentage of completion method.

AAAAAnnual Rnnual Rnnual Rnnual Rnnual Reporeporeporeporeporttttt 2011-2012 2011-2012 2011-2012 2011-2012 2011-2012
7979797979
Other income
Profit on sale of investments is recorded on transfer of title from the Company and is determined as the differencebetween the sales price and the then carrying value of the investment. Dividend income is recognized when theCompany’s right to receive dividend is established.
Interest is recognized using the time-proportion method, based on rates implicit in the transaction.
2.42.42.42.42.4 FFFFFixixixixixed Aed Aed Aed Aed Assetsssetsssetsssetsssets
Tangible assets
Tangible assets are stated at actual cost less accumulated depreciation. The actual cost capitalized includes materialcost, freight, installation cost, duties and taxes, finance charges and other incidental expenses incurred during theconstruction/installation stage.
Intangible assets
Intangible assets are recorded at consideration paid for acquisition and other direct costs that can be directly attributed,or allocated on a reasonable and consistent basis, to creating, producing and making the asset ready for its intendeduse.
Capital Work in progress
Assets under installation or under construction as at the Balance sheet date are shown as capital work in progress.Advances paid towards acquisition of assets are also included under capital work in progress.
Depreciation
Depreciation on the Tangible Fixed Assets of the Company is provided on Written down Value method as per ScheduleXIV of the Companies Act, 1956 on pro-rata basis. Individual assets acquired for less than Rs. 5,000 are entirelydepreciated in the year of acquisition. Leasehold improvements are written off over the lower of, the remainingprimary period of lease or the life of the asset.
Amortization
Software- used in development for projects are amortized over the license period or estimated useful life of twoyears, whichever is lower. Cost of internally developed software including the incidental costs is amortized over aperiod of three years.
The cost of and the accumulated depreciation for fixed assets sold, retired or otherwise disposed off are removedfrom the stated values and the resulting gains and losses are included in the profit and loss account. Lease paymentsunder operating lease are recognised as an expense in the profit and loss account. An impairment loss is recognizedwherever the carrying amount of the fixed assets exceeds its recoverable amount.
2.52.52.52.52.5 FFFFFinancinancinancinancinance leasese leasese leasese leasese leases
Assets taken on lease are capitalized at fair value or net present value of the minimum lease payments, whichever islower. Depreciation on the assets taken on lease is charged at the rate applicable to similar type of owned fixedassets refer accounting policy 2.4. Lease payments made are apportioned between the finance charges and reductionof the outstanding liability in respect of assets taken on lease.
2.62.62.62.62.6 IIIIInnnnnvvvvvestmenestmenestmenestmenestmentststststs
Investments are either classified as current or long-term, based on the Management’s intention at the time of purchase.Current investments are carried at the lower of cost and fair value. Cost for overseas investments comprises theIndian Rupee value of the consideration paid for the investment. Long-term investments are carried at cost andprovisions recorded to recognize any decline, other than temporary, in the carrying value of each investment.

AAAAAnnual Rnnual Rnnual Rnnual Rnnual Reporeporeporeporeporttttt 2011-2012 2011-2012 2011-2012 2011-2012 2011-2012
8080808080
2.72.72.72.72.7 FFFFForororororeigeigeigeigeign Cn Cn Cn Cn Curururururrrrrrencencencencency try try try try transacansacansacansacansactions and trtions and trtions and trtions and trtions and translaanslaanslaanslaanslationtiontiontiontion
Transactions in foreign currency are recorded at exchange rate prevailing on the date of transaction. Monetary assetsand liabilities denominated in foreign currency are translated at the rate of exchange at the balance sheet date andresultant gain or loss is recognized in the profit and loss account. Non-monetary assets and liabilities are translated atthe rate prevailing on the date of transaction.
2.82.82.82.82.8 EmploEmploEmploEmploEmployyyyyee See See See See Stttttock Option Sock Option Sock Option Sock Option Sock Option Schemechemechemechemecheme
Stock options granted to the employees under the stock option schemes established after June 19, 1999 are evaluatedas per the accounting treatment prescribed by Employee Stock Option Scheme and Employee Stock Purchase SchemeGuidelines 1999 issued by Securities and Exchange Board of India and the Guidance Note on Accounting for employeeshare-based payments issued by the Institute of Chartered Accountants of India. Accordingly the Company measuresthe compensation cost relating to employee stock options using the intrinsic value method. The compensation costis amortized on a straight line basis over the total vesting period of the stock options.
2.92.92.92.92.9 TTTTTaxaxaxaxaxes on Ies on Ies on Ies on Ies on Incncncncncomeomeomeomeome
Tax expense for the year comprises of current tax and deferred tax.
Income taxes are computed using the tax effect accounting method, where taxes are accrued in the same period inwhich the related revenue and expenses arise. A provision is made for income tax annually based on the tax liabilitycomputed, after considering tax allowances and exemptions. Provisions are recorded when it is estimated that aliability due to disallowances or other matters is probable. Minimum alternate tax (MAT) paid in accordance with thetax laws, which gives rise to future economic benefits in the form of adjustments of future income tax liability, isconsidered as an asset if there is convincing evidence that the Company will pay normal tax after the tax holidayperiod. Accordingly, it is recognized as an asset in the balance sheet when it is probable that the future economicbenefit associated with it will flow to the Company and the asset can be measured reliably.
The differences that result between the profit considered for income taxes and the profit as per the financial statementsare identified, and thereafter a deferred tax asset or deferred tax liability is recorded for timing differences, namelythe differences that originate in one accounting period and reverse in another, based on the tax effect of the aggregateamount being considered. The tax effect is calculated on the accumulated timing differences at the end of theaccounting period based on prevailing enacted or substantially enacted regulations. Deferred tax assets are recognizedonly if there is virtual certainty that they will be realized and are reviewed for the appropriateness of their respectivecarrying values at each balance sheet date.
2.102.102.102.102.10 EarEarEarEarEarnings per sharnings per sharnings per sharnings per sharnings per shareeeee
In determining earnings per share, the Company considers the net profit after tax and includes the post tax effect ofany extra-ordinary / exceptional item is considered. The number of shares used in computing basic earnings pershare is the weighted average number of shares outstanding during the period. The number of shares used incomputing diluted earnings per share comprises the weighted average shares considered for deriving basic earningsper share, and also the weighted average number of equity shares that could have been issued on the conversion ofall dilutive potential equity shares. The diluted potential equity shares are adjusted for the proceeds receivable, hadthe shares been actually issued at fair value (i.e. the average market value of the outstanding shares). Dilutive potentialequity shares are deemed converted as of the beginning of the period, unless issued at a later date.
2.112.112.112.112.11 RRRRRetiretiretiretiretiremenemenemenemenement benefits tt benefits tt benefits tt benefits tt benefits to emploo emploo emploo emploo employyyyyeeseeseeseesees
Gratuity
The Company provides for gratuity, a defined benefit retirement plan covering eligible employees, based on actuarialvaluation made by an independent actuary as at the balance sheet date. In accordance with the Payment of GratuityAct, 1972, the gratuity plan provides a lump sum payment to vested employees at retirement, death, incapacitationor termination of employment, of an amount based on the respective employees’ salary and the tenure of employment.
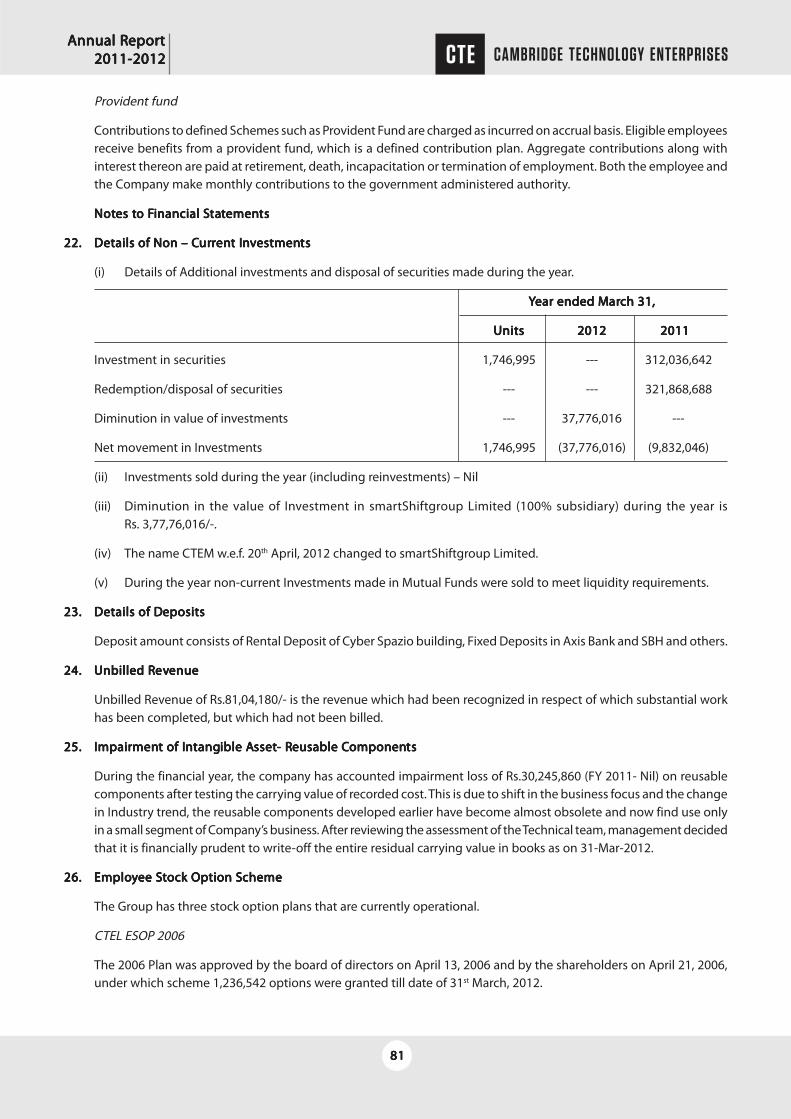
AAAAAnnual Rnnual Rnnual Rnnual Rnnual Reporeporeporeporeporttttt 2011-2012 2011-2012 2011-2012 2011-2012 2011-2012
8181818181
Provident fund
Contributions to defined Schemes such as Provident Fund are charged as incurred on accrual basis. Eligible employeesreceive benefits from a provident fund, which is a defined contribution plan. Aggregate contributions along withinterest thereon are paid at retirement, death, incapacitation or termination of employment. Both the employee andthe Company make monthly contributions to the government administered authority.
NotNotNotNotNotes tes tes tes tes to Fo Fo Fo Fo Financial Sinancial Sinancial Sinancial Sinancial Statatatatatttttemenemenemenemenementststststs
22.22.22.22.22. DDDDDetails of Non – Cetails of Non – Cetails of Non – Cetails of Non – Cetails of Non – Curururururrrrrrenenenenent It It It It Innnnnvvvvvestmenestmenestmenestmenestmentststststs
(i) Details of Additional investments and disposal of securities made during the year.
YYYYYear ended Mear ended Mear ended Mear ended Mear ended Marararararch 31,ch 31,ch 31,ch 31,ch 31,
UnitsUnitsUnitsUnitsUnits 20122012201220122012 20112011201120112011
Investment in securities 1,746,995 --- 312,036,642
Redemption/disposal of securities --- --- 321,868,688
Diminution in value of investments --- 37,776,016 ---
Net movement in Investments 1,746,995 (37,776,016) (9,832,046)
(ii) Investments sold during the year (including reinvestments) – Nil
(iii) Diminution in the value of Investment in smartShiftgroup Limited (100% subsidiary) during the year isRs. 3,77,76,016/-.
(iv) The name CTEM w.e.f. 20th April, 2012 changed to smartShiftgroup Limited.
(v) During the year non-current Investments made in Mutual Funds were sold to meet liquidity requirements.
23.23.23.23.23. DDDDDetails of Details of Details of Details of Details of Depositsepositsepositsepositseposits
Deposit amount consists of Rental Deposit of Cyber Spazio building, Fixed Deposits in Axis Bank and SBH and others.
24.24.24.24.24. Unbilled RUnbilled RUnbilled RUnbilled RUnbilled Revevevevevenueenueenueenueenue
Unbilled Revenue of Rs.81,04,180/- is the revenue which had been recognized in respect of which substantial workhas been completed, but which had not been billed.
25.25.25.25.25. IIIIImpairmpairmpairmpairmpairmenmenmenmenment of It of It of It of It of Innnnntangtangtangtangtangible Aible Aible Aible Aible Assetssetssetssetsset- R- R- R- R- Reusable Ceusable Ceusable Ceusable Ceusable Componenomponenomponenomponenomponentststststs
During the financial year, the company has accounted impairment loss of Rs.30,245,860 (FY 2011- Nil) on reusablecomponents after testing the carrying value of recorded cost. This is due to shift in the business focus and the changein Industry trend, the reusable components developed earlier have become almost obsolete and now find use onlyin a small segment of Company’s business. After reviewing the assessment of the Technical team, management decidedthat it is financially prudent to write-off the entire residual carrying value in books as on 31-Mar-2012.
26.26.26.26.26. EmploEmploEmploEmploEmployyyyyee See See See See Stttttock Option Sock Option Sock Option Sock Option Sock Option Schemechemechemechemecheme
The Group has three stock option plans that are currently operational.
CTEL ESOP 2006
The 2006 Plan was approved by the board of directors on April 13, 2006 and by the shareholders on April 21, 2006,under which scheme 1,236,542 options were granted till date of 31st March, 2012.

AAAAAnnual Rnnual Rnnual Rnnual Rnnual Reporeporeporeporeporttttt 2011-2012 2011-2012 2011-2012 2011-2012 2011-2012
8282828282
Changes in number of options outstanding were as follows:
A A A A As as as as as at Mt Mt Mt Mt Marararararch 31ch 31ch 31ch 31ch 31
20122012201220122012 2011 2011 2011 2011 2011
Options outstanding beginning of period 220,269 244,998
Granted during the year Nil 249,000
Less: Exercised Nil 7,766
Lapsed* 27,731 265,963
Options outstanding end of period 192,538 220,269
*Options were lapsed for those who had left the company or didn't exercise their options during the vesting period oftheir options
CTEL ESOP SCHEME 2008
The 2008 Plan was approved by the board of directors on March 20, 2008 and by the shareholders through postal ballotresults of which was declared on March 5, 2008, under which scheme 1,500,000 options were granted till date of 31st
March, 2012.
Changes in the number of options outstanding:
A A A A As as as as as at Mt Mt Mt Mt Marararararch 31ch 31ch 31ch 31ch 31
20122012201220122012 20112011201120112011
Options outstanding beginning of period 389,160 389,160
Granted during the year Nil Nil
Less: Exercised 197,657 Nil
Lapsed* 105,401 Nil
Options outstanding end of perOptions outstanding end of perOptions outstanding end of perOptions outstanding end of perOptions outstanding end of periodiodiodiodiod 296,904 389,160
*Options were lapsed for those who had left the company or didn’t exercise their options during the vesting period oftheir options
CCCCCTEL ESOP SCHEME 2011TEL ESOP SCHEME 2011TEL ESOP SCHEME 2011TEL ESOP SCHEME 2011TEL ESOP SCHEME 2011
The 2011 Plan was approved by the board of directors on December 10, 2010 and by the shareholders through postalballot results of which was declared on January 24, 2011, under which scheme 624,000 options were granted till date of31st March, 2012.
Changes in the number of options outstanding:
A A A A As as as as as at Mt Mt Mt Mt Marararararch 31ch 31ch 31ch 31ch 31
20122012201220122012 20112011201120112011
Options outstanding beginning of period 295,000 Nil
Granted during the year 329,000 295,000
Less: Exercised Nil Nil
Lapsed* 95,000 Nil
Options outstanding end of perOptions outstanding end of perOptions outstanding end of perOptions outstanding end of perOptions outstanding end of periodiodiodiodiod 529,000 295,000
*Options were lapsed for those who had left the company or didn’t exercise their options during the vesting period oftheir options

AAAAAnnual Rnnual Rnnual Rnnual Rnnual Reporeporeporeporeporttttt 2011-2012 2011-2012 2011-2012 2011-2012 2011-2012
8383838383
Pro forma Disclosure
In accordance with SEBI (Employee Stock Option Scheme and Employee Stock Purchase Scheme) Guidelines, 1999, hadthe compensation cost for associate stock option plans been recognized based on the fair value at the date of grant inaccordance with Black Scholes’ model, the pro forma amounts of the Group’s net profit and earnings per share would havebeen as follows:
(Amount in Rs.)
YYYYYear ended Mear ended Mear ended Mear ended Mear ended Marararararch 31,ch 31,ch 31,ch 31,ch 31,
20122012201220122012 20112011201120112011
Net Profit (as reported) 1,601,607 18,452,553
Add: Stock based employee compensation - -
Less: Stock based compensation expenses determined under fair value method (pro forma) - -
Net Profit (Pro forma) 1,601,607 18,452,553
Earnings per share (Rs.)
Basic - as reported 0.08 1.10
- as pro forma 0.08 1.10
Diluted - as reported 0.08 1.10
- as pro forma 0.08 1.10
The key assumptions used in Black-Scholes’ model for calculating fair value are: risk-free interest rate ranging from 6.73%to 7.85% (2011 – 6.73% to 7.85%), expected life: 3 years to 4 years (2010 – 2.5 years to 4.5 years), expected volatility ofshares 63.77% to 72.66% (2011 – 63.77% to 72.66%), dividend yield 0% (2011 – 0%). The range variables detailed hereinrepresent the highs and the lows of the assumptions during the pendency of the grant dates.
27.27.27.27.27. RRRRRelaelaelaelaelattttted pared pared pared pared parttttty try try try try transacansacansacansacansactionstionstionstionstions
Key Management Personnel
Stefan Hetges Whole-Time Director and Chief Executive Officer
D.R.R Swaroop Whole-Time Director
Samir Bhatia Whole-Time Director and Chief Financial Officer
Enterprises over which Control exists
smartShiftgroup Limited (Formerly CTE - Wholly owned subsidiary w.e.f 13 August 2010Mauritius Limited)
Cambridge Technology Enterprises Inc Wholly owned subsidiary of CTEM w.e.f 1 October 2010
('CTE Inc')
smartShift, GmbH - Germany Wholly owned subsidiary of CTEM w.e.f 1st Oct, 2010.
Vox Holding Inc. - USA Wholly owned subsidiary of CTEM w.e.f 1st Oct,2010
Cambridge Technology India Private Limited Wholly owned subsidiary w.e.f October 2008('CTIPL')
Comcreation Inc Wholly owned subsidiary of CTE Inc, w.e.f 2007-08,Reilly & Associates Inc got merged with CTE Inc. w.e.f 24th June 2010.CellExchange Inc

AAAAAnnual Rnnual Rnnual Rnnual Rnnual Reporeporeporeporeporttttt 2011-2012 2011-2012 2011-2012 2011-2012 2011-2012
8484848484
Enterprises over which significant influence exercised by key management personnel/close family member of keymanagement personnel
D.S. Unics Infotech Pvt Ltd D.R.R. Swaroop is a Director in the Company
NaNaNaNaNaturturturturture of e of e of e of e of TTTTTrrrrransacansacansacansacansactiontiontiontiontion YYYYYear ended Mear ended Mear ended Mear ended Mear ended Marararararch 31ch 31ch 31ch 31ch 31
20122012201220122012 20112011201120112011
Transactions with key management personnel
Remuneration*
-D.R.R. Swaroop 1,200,000 1,200,000
Amount Payable
-D.R.R. Swaroop - -
Transactions with enterprises over which Control exists
Sale of services - CTE Inc. 299,835,374 291,040,373
Sale of services- smart Shift Inc. - 6,732,986
Expenses reimbursement, net- CTE Inc. 20,435,773 87,620,130
Balance receivable/(payable) 172,248,974 92,119,668
Loans and advances
Loans and advances given
-Cambridge Technology India Pvt. Ltd. 14,711,955 18,247,473
Repayment of loans and advances
- Cambridge Technology India Pvt. Ltd. 14,032,648 17,618,399
Balance outstanding
- Cambridge Technology India Pvt. Ltd. - (679,307)
Investment made in shares 409,746,172 447,522,188
Sale of Investment in CTE Inc to smartShiftgroup Limited (Formerly CTE - Mauritius Ltd., - 321,868,688
28.28.28.28.28. RRRRRecececececonciliaonciliaonciliaonciliaonciliation of basic and diluttion of basic and diluttion of basic and diluttion of basic and diluttion of basic and diluted shared shared shared shared shares used in ces used in ces used in ces used in ces used in computing earomputing earomputing earomputing earomputing earnings per sharnings per sharnings per sharnings per sharnings per shareeeee
A A A A As as as as as at Mt Mt Mt Mt Marararararch 31,ch 31,ch 31,ch 31,ch 31,
20122012201220122012 20112011201120112011
Number of shares considered as basic weighted average shares outstanding 19,631,015 16,731,742
Add: Effect of dilutive issue of stock options - -
Number of shares considered as weighted average shares and potential 19,631,015 16,731,742shares outstanding

AAAAAnnual Rnnual Rnnual Rnnual Rnnual Reporeporeporeporeporttttt 2011-2012 2011-2012 2011-2012 2011-2012 2011-2012
8585858585
29.29.29.29.29. LLLLLeeeeeasesasesasesasesases
Operating Lease
The Company leases office premises under operating lease agreement that is renewable on a periodic basis at theoption of the both the lessor and the lessee. Rental expense under those leases was Rs.9,148,802/- (Previous yearRs.8,096,792).
Finance Leases
The Company is not having any finance lease agreements as at March 31, 2012.
30.30.30.30.30. SSSSSegegegegegmenmenmenmenment rt rt rt rt reporeporeporeporeportingtingtingtingting
As required by the Accounting Standard - 17, 'Segment reporting', the Company is mainly engaged in the area ofsoftware development and related services. Hence segment reporting is not applicable to the Company and to thenature of business.
31.31.31.31.31. MMMMManageranageranageranageranagerial Rial Rial Rial Rial Remuneremuneremuneremuneremuneraaaaationtiontiontiontion
The key management personnel comprise our directors and statutory officers. Particulars of remuneration and otherbenefits provided to key management personnel during the year ended March 31, 2012 and 2011 are as follows:
YYYYYear ended Mear ended Mear ended Mear ended Mear ended Marararararch 31,ch 31,ch 31,ch 31,ch 31,
20122012201220122012 20112011201120112011
Remuneration* 1,200,000 2,250,000
Perquisites and Allowances - -
Directors sitting fee 270,000 410,000
*Remuneration is net of accrual towards Gratuity, a defined benefit plan and provident fund which is managed forthe Company as a whole. Contributions to defined benefit plan and provident fund and other perquisites andallowances have been included in Schedule 13 and 14.
32.32.32.32.32. DDDDDetails of advetails of advetails of advetails of advetails of advancancancancances and loans ges and loans ges and loans ges and loans ges and loans giviviviviven ten ten ten ten to subsidiaro subsidiaro subsidiaro subsidiaro subsidiary Cy Cy Cy Cy Companiesompaniesompaniesompaniesompanies
Name of subsidiar Name of subsidiar Name of subsidiar Name of subsidiar Name of subsidiaryyyyy Balanc Balanc Balanc Balanc Balanceeeee M M M M Maximumaximumaximumaximumaximum outstanding outstanding outstanding outstanding outstanding balanc balanc balanc balanc balance outstandinge outstandinge outstandinge outstandinge outstanding as a as a as a as a as at Mt Mt Mt Mt Marararararch 31,ch 31,ch 31,ch 31,ch 31, as a as a as a as a as at Mt Mt Mt Mt Marararararch 31,ch 31,ch 31,ch 31,ch 31,
20122012201220122012 20112011201120112011 20122012201220122012 20112011201120112011
CTIPL(Cambridge Technology India Pvt. Ltd.) - (679,307) 9,234,869 5,550,000
33.33.33.33.33. RRRRRetiretiretiretiretiremenemenemenemenement benefits tt benefits tt benefits tt benefits tt benefits to emploo emploo emploo emploo employyyyyeeseeseeseesees
Defined contribution plan
During year ended March 31, 2012, the Company contributed Rs.2,537,905/- to provident fund (Previous YearRs. 979,213/- was contributed to provident fund).
Defined benefit plan - gratuity and privilege leave
The amounts recognized in the balance sheet as at March 31, 2012 are as follows:
31st M31st M31st M31st M31st Mar'12ar'12ar'12ar'12ar'12 31st M31st M31st M31st M31st Mar'11ar'11ar'11ar'11ar'11
Present value of funded obligations 6,548,370 4,552,227
Fair value of plan assets - -
Net liability 6,548,370 4,552,227
Amount in balance sheet
Liability 6,548,370 4,552,227
Asset - -
Net Liability 6,548,370 4,552,227

AAAAAnnual Rnnual Rnnual Rnnual Rnnual Reporeporeporeporeporttttt 2011-2012 2011-2012 2011-2012 2011-2012 2011-2012
8686868686
The amounts recognized in the profit and loss account for the year ended March 31, 2012 are as follows :
3131313131ststststst M M M M Mar' 2012ar' 2012ar' 2012ar' 2012ar' 2012 3131313131ststststst M M M M Mar' 2011ar' 2011ar' 2011ar' 2011ar' 2011
Current service cost 558,504 413,936
Interest cost 363,458 330,675
Expected return on plan assets - -
Recognized net actuarial loss 2,824,230 1,309,215
Net Benefit Expense 3,746,192 2,053,826
Changes in present value of defined benefit obligation representing reconciliation of opening and closing balances thereofare as follows:
31stM31stM31stM31stM31stMar'2012ar'2012ar'2012ar'2012ar'2012 31st M31st M31st M31st M31st Mar'2011ar'2011ar'2011ar'2011ar'2011
Defined benefit obligation at beginning of the year 4,552,227 4,133,440
Current service cost 558,504 413,936
Interest cost 363,458 330,675
Benefits paid (1,750,049) (1,635,039)
Actuarial loss/(gains) 2,824,230 1,309,215
Defined benefit obligation at end of the year 6,548,370 4,552,227
Changes in the fair value of plan assets representing reconciliation of opening and closing balances thereof are as follows:
3131313131ststststst M M M M Mar'2012ar'2012ar'2012ar'2012ar'2012 31 31 31 31 31ststststst M M M M Mar' 2011ar' 2011ar' 2011ar' 2011ar' 2011
Fair value of plan assets at beginning of the year - -
Expected return on plan assets - -
Actuarial gains - -
Contribution by employer 1,750,049 1,635,039
Benefits paid 1,750,049 1,635,039
Fair value of plan assets at the end of the year - -
The assumptions used in accounting for the gratuity plan are set out as below:
Discount Rate 8.00% 8.00%
Expected return on plan assets 8.00% 8.00%
Salary Escalation 7.00% 7.00%
The estimates of future salary increase, considered in actuarial valuation, take account of inflation, seniority, promotionsand other relevant factors such as supply and demand in the employment market. The Company evaluates theseassumptions annually based on its long term plans of growth and industry standards.

AAAAAnnual Rnnual Rnnual Rnnual Rnnual Reporeporeporeporeporttttt 2011-2012 2011-2012 2011-2012 2011-2012 2011-2012
8787878787
34.34.34.34.34. SupSupSupSupSupplemenplemenplemenplemenplementartartartartary Iy Iy Iy Iy Infnfnfnfnfororororormamamamamationtiontiontiontion
(i)(i)(i)(i)(i) CCCCCononononontingencies & Guartingencies & Guartingencies & Guartingencies & Guartingencies & Guaranananananttttteeseeseeseesees
Previous year, the company has given corporate guarantee as against Senior Secured Convertible Debt Notes,Convertible Debt Notes and Redeemable Bonds issued by the subsidiary M/s. Cambridge Technology EnterprisesMauritius Limited to the extent of Rs.647.43 Millions (USD 14.50 Millions).
(ii)(ii)(ii)(ii)(ii) EarEarEarEarEarnings in fnings in fnings in fnings in fnings in forororororeigeigeigeigeign curn curn curn curn currrrrrencencencencency (FOB), on acy (FOB), on acy (FOB), on acy (FOB), on acy (FOB), on accrual basiscrual basiscrual basiscrual basiscrual basis
YYYYYear ended Mear ended Mear ended Mear ended Mear ended Marararararch 31,ch 31,ch 31,ch 31,ch 31,
20122012201220122012 20112011201120112011
Software development and services 299,835,374 325,199,009
TTTTTotalotalotalotalotal 299,835,374299,835,374299,835,374299,835,374299,835,374 325,199,009325,199,009325,199,009325,199,009325,199,009
(iii)(iii)(iii)(iii)(iii) ExpenditurExpenditurExpenditurExpenditurExpenditure in fe in fe in fe in fe in forororororeigeigeigeigeign curn curn curn curn currrrrrencencencencencyyyyy, on ac, on ac, on ac, on ac, on accrual basiscrual basiscrual basiscrual basiscrual basis
YYYYYear ended Mear ended Mear ended Mear ended Mear ended Marararararch 31,ch 31,ch 31,ch 31,ch 31,
20122012201220122012 20112011201120112011
Subcontracting Expenses - -
Traveling & Others 2,442,011 10,667,860
TTTTTotalotalotalotalotal 2,442,0112,442,0112,442,0112,442,0112,442,011 10,667,86010,667,86010,667,86010,667,86010,667,860
35.35.35.35.35. PPPPPaaaaayyyyyables tables tables tables tables to micro micro micro micro micro eno eno eno eno enttttterererererprprprprprises and small enises and small enises and small enises and small enises and small enttttterererererprprprprprisesisesisesisesises
There were no overdue principal amounts (and interest thereon) payable to micro enterprises and small enterprises,as at March 31, 2012.
36.36.36.36.36. QQQQQuanuanuanuanuantitatitatitatitatitativtivtivtivtive detailse detailse detailse detailse details
The Company is engaged in the development and maintenance of computer software. The production and sale ofsuch software cannot be expressed in any generic unit. Hence, it is not practicable to give the quantitative details ofsales and certain other information as required under paragraphs 3, 4A, 4C and 4D of Part II of Schedule VI to theCompanies Act, 1956.
37.37.37.37.37. PPPPPrrrrrior yior yior yior yior year cear cear cear cear comparomparomparomparomparaaaaativtivtivtivtiveseseseses.....
Previous years' figures have been regrouped and reclassified wherever necessary to confirm to current year'sclassification.
FFFFFor Por Por Por Por P. M. M. M. M. Murururururali & Cali & Cali & Cali & Cali & Cooooo..... FFFFFor and on behalf of boaror and on behalf of boaror and on behalf of boaror and on behalf of boaror and on behalf of boardddddCharCharCharCharChartttttererererered Aed Aed Aed Aed Accccccccccounounounounountantantantantantststststs
PPPPP.M.M.M.M.Murururururali Mali Mali Mali Mali Mohana Rohana Rohana Rohana Rohana Raoaoaoaoao DDDDD.R.R. S.R.R. S.R.R. S.R.R. S.R.R. Swwwwwarararararoopoopoopoopoop L. SrL. SrL. SrL. SrL. SridharidharidharidharidharPartner Whole-Time Director DirectorMembership No: 23412
SSSSSamir Bhaamir Bhaamir Bhaamir Bhaamir Bhatiatiatiatiatia VVVVV. R. R. R. R. Ramana Ramana Ramana Ramana Ramana ReddyeddyeddyeddyeddyWhole-Time Director & CFO Company Secretary
Place: HyderabadDate: 28-05-2012

AAAAAnnual Rnnual Rnnual Rnnual Rnnual Reporeporeporeporeporttttt 2011-2012 2011-2012 2011-2012 2011-2012 2011-2012
8888888888
SummarSummarSummarSummarSummary of Subsidiary of Subsidiary of Subsidiary of Subsidiary of Subsidiary Companiesy Companiesy Companiesy Companiesy Companies

AAAAAnnual Rnnual Rnnual Rnnual Rnnual Reporeporeporeporeporttttt 2011-2012 2011-2012 2011-2012 2011-2012 2011-2012
8989898989
CA
MBR
IDG
E TE
CH
NO
LOG
Y EN
TER
PRIS
ES L
IMIT
EDFi
nanc
ial S
tate
men
t on
Subs
idia
ries
purs
uant
to a
ppro
val o
f the
Cen
tral
Gov
ernm
ent u
nder
Sec
tion
212(
8) o
f the
Com
pani
es A
ct, 1
956
as o
n 31
st M
arch
, 201
2.
(Am
ount
in R
s.)
SlSlSlSl Sl.N
o.N
o.N
o.N
o.N
o .... .N
ame
of t
he C
Nam
e of
the
CN
ame
of t
he C
Nam
e of
the
CN
ame
of t
he C
omp
anom
pan
omp
anom
pan
omp
anyyyy y
CCCC Cam
br
amb
ram
br
amb
ram
br i
dge
idge
idge
idge
idge
CCCC CTE
-MTE
-MTE
-MTE
-MTE
-Mau
rau
rau
rau
rau
r iti
usit
ius
itiu
sit
ius
itiu
sCCCC C
TE I
TE I
TE I
TE I
TE I n
cn
cnc
nc nc .... .
VVVV V oooo oxh
oldi
ngs
xhol
ding
sxh
oldi
ngs
xhol
ding
sxh
oldi
ngs
Smar
Smar
Smar
Smar
Smar
tShi
ftS
hif
tShi
ftS
hif
tShi
f tttt tTTTT T e
chno
logy
echn
olog
yec
hnol
ogy
echn
olog
yec
hnol
ogy
LLLL L tttt td
(Md
(Md
(Md
(Md
(Mau
rau
rau
rau
rau
r iti
us)
itiu
s)it
ius)
itiu
s)it
ius)
(USA
(USA
(USA
(USA
(USA
)))) )IIII I n
cn
cnc
nc nc .
, (U
SA.,
(USA
., (U
SA.,
(USA
., (U
SA)))) )
Gm
bH
,G
mb
H,
Gm
bH
,G
mb
H,
Gm
bH
,IIII I n
dia
Pnd
ia P
ndia
Pnd
ia P
ndia
Pvtvtvtvt vt
.L.L.L.L .Lt ttt t dddd d
.,.,.,., .,(((( ( GGGG G
erererer erm
anm
anm
anm
anm
any)y)y)y) y)
1Is
sued
and
Sub
scrib
ed4,
571,
000
89,3
77,7
992,
193,
729
25,6
28,6
021,
708,
500
2Re
serv
es19
,522
,477
(144
,014
,239
)(4
12,6
73,7
83)
(30,
522,
570)
81,7
97
3To
tal A
sset
s16
7,32
0,92
969
4,65
2,92
621
9,19
0,30
21,
558,
886
58,1
00,8
18
4To
tal L
iabi
litie
s14
3,22
7,45
274
9,28
9,36
662
9,67
0,35
66,
452,
854
56,3
10,5
23
5In
vest
men
ts (e
xcep
t inv
estm
ent i
n su
bsid
iarie
s)-
--
--
6Tu
rnov
er82
,452
,101
-56
2,68
7,82
1-
136,
136,
668
7Pr
ofit
/ (Lo
ss) B
efor
e Ta
xatio
n10
,438
,366
(378
,187
,890
)(3
12,2
18,7
54)
1,27
6,31
4(7
,427
,740
)
8Pr
ovis
ion
for t
axat
ion
1,27
8,90
2-
764,
606
--
9Pr
ofit
/ (Lo
ss) A
fter
taxa
tion
9,15
9,46
4(3
78,1
87,8
90)
(312
,983
,361
)1,
276,
314
(7,4
27,7
40)
10Pr
opos
ed D
ivid
end
--
--
-

AAAAAnnual Rnnual Rnnual Rnnual Rnnual Reporeporeporeporeporttttt 2011-2012 2011-2012 2011-2012 2011-2012 2011-2012
9090909090
CA
MBR
IDG
E TE
CH
NO
LOG
Y EN
TER
PRIS
ES L
IMIT
EDSt
atem
ent p
ursu
ant t
o Se
ctio
n 21
2 (1
) (e)
of t
he C
ompa
nies
Act
, 195
6 as
on
31st M
arch
, 201
2
(Am
ount
in R
s.)
SlSlSlSl Sl.N
o.N
o.N
o.N
o.N
o .... .N
ame
of t
he C
Nam
e of
the
CN
ame
of t
he C
Nam
e of
the
CN
ame
of t
he C
omp
anom
pan
omp
anom
pan
omp
anyyyy y
CCCC Cam
br
amb
ram
br
amb
ram
br i
dge
idge
idge
idge
idge
CCCC CTE
-MTE
-MTE
-MTE
-MTE
-Mau
rau
rau
rau
rau
r iti
usit
ius
itiu
sit
ius
itiu
sCCCC C
TE I
TE I
TE I
TE I
TE I n
cn
cnc
nc nc .... .
VVVV V oooo oxh
oldi
ngs
xhol
ding
sxh
oldi
ngs
xhol
ding
sxh
oldi
ngs
Smar
Smar
Smar
Smar
Smar
tShi
ftS
hif
tShi
ftS
hif
tShi
f tttt tTTTT T e
chno
logy
echn
olog
yec
hnol
ogy
echn
olog
yec
hnol
ogy
LLLL L tttt td
(Md
(Md
(Md
(Md
(Mau
rau
rau
rau
rau
r iti
us)
itiu
s)it
ius)
itiu
s)it
ius)
(USA
(USA
(USA
(USA
(USA
)))) )IIII I n
cn
cnc
nc nc .
, (U
SA.,
(USA
., (U
SA.,
(USA
., (U
SA)))) )
Gm
bH
,G
mb
H,
Gm
bH
,G
mb
H,
Gm
bH
,IIII I n
dia
Pnd
ia P
ndia
Pnd
ia P
ndia
Pvtvtvtvt vt
. L. L. L. L . Lt ttt t dddd d
.,.,.,., .,(((( ( GGGG G
erererer erm
anm
anm
anm
anm
any)y)y)y) y)
1Fi
nanc
ial y
ear o
f the
Sub
sidi
ary
Com
pany
31.3
.201
231
.3.2
012
31.3
.201
231
.3.2
012
31.3
.201
2
2N
umbe
r of s
hare
s in
the
Subs
idia
ry C
ompa
ny h
eld
by C
ambr
idge
Tech
nolo
gy E
nter
pris
es L
td o
n th
e ab
ove
date
457,
100
1,74
7,02
54,
287,
976
4,00
0,00
0N
A(P
aid
upca
pita
l Eur
o25
,000
)
3H
oldi
ng C
ompa
ny’s
inte
rest
in p
erce
ntag
e do
wn
fore
ign
Subs
idia
ry10
0%10
0%10
0% S
tep
100%
Ste
p10
0% S
tep
dow
n fo
reig
ndo
wn
fore
ign
dow
n fo
reig
nSu
bsid
iary
Subs
idia
rySu
bsid
iary
4N
et a
ggre
gate
am
ount
of P
rofit
/(Lo
ss) o
f the
Sub
sidi
ary
so fa
r as
they
can
cern
the
mem
bers
of t
he C
ambr
idge
Tec
hnol
ogy
Ente
rpris
es L
td:
a)a)a)a) a)
Dea
lt w
ith in
the
acco
unts
of C
ambr
idge
Tec
hnol
ogy
Ente
rpris
es L
td-
--
--
bbbb b)))) )
Not
dea
lt w
ithin
the
acco
unts
of C
ambr
idge
Tec
hnol
ogy
ente
rpris
es9,
159,
464
(3
78,1
87,8
90)
(312
,983
,361
)(1
,276
,314
)(7
,427
,740
)
Ltd
(Rs)
5N
et a
ggre
gate
am
ount
of P
rofit
/ (L
oss)
for t
he P
revi
ous
finan
cial
yea
rs o
fth
e Su
bsid
iary
so
far a
s th
ey c
ance
rn th
e m
embe
rs o
f the
Cam
brid
geTe
chno
logy
Ent
erpr
ises
Ltd
:-
--
--
a)a)a)a) a)
Dea
lt w
ith in
the
acco
unts
of C
ambr
idge
Tec
hnol
ogy
Ente
rpris
es L
td-
--
--
bbbb b)))) )
Not
dea
lt w
ithin
the
acco
unts
of C
ambr
idge
Tech
nolo
gy E
nter
pris
es
Ltd
(Rs)
1,49
2,86
1
(1
2,14
3,96
2)(2
01,0
04,4
74)
(620
,259
)9,
007,
862
6Ch
ange
s in
the
inte
rest
of C
ambr
idge
Tec
hnol
ogy
Ente
rpris
es L
tdbe
twee
n th
e la
st fi
nanc
ial y
ear a
nd 3
1st M
arch
,201
1-
--
--
7M
ater
ial c
hang
es b
etw
een
the
end
of th
e la
st fi
nanc
ial y
ear a
nd-
--
--
31st M
arch
,201
2

AAAAAnnual Rnnual Rnnual Rnnual Rnnual Reporeporeporeporeporttttt 2011-2012 2011-2012 2011-2012 2011-2012 2011-2012
9191919191
Corporate GoverCorporate GoverCorporate GoverCorporate GoverCorporate Governance Reportnance Reportnance Reportnance Reportnance Report

AAAAAnnual Rnnual Rnnual Rnnual Rnnual Reporeporeporeporeporttttt 2011-2012 2011-2012 2011-2012 2011-2012 2011-2012
9292929292
Corporate Governance ReportYour Company has complied in all respects, with the requirements of the Corporate Governance Code as per Clause 49 ofthe Listing Agreement with the Stock Exchanges. A report on the implementation of the Corporate Governance Code ofthe Listing Agreement by your Company is furnished below:-
CCCCCompanompanompanompanompanyyyyy’’’’’s Ps Ps Ps Ps Philosophhilosophhilosophhilosophhilosophy on Cy on Cy on Cy on Cy on Corororororporporporporporaaaaattttte Ge Ge Ge Ge Gooooovvvvvererererernancnancnancnancnanceeeee
Cambridge Technology Enterprises Limited (“CTEL” or “the Company”) shall endeavor to adhere to values of good corporategovernance and ethical business practices to maintain sound standards of Business Conduct and Corporate Governance.
The Company’s philosophy of corporate governance is to consistently communicate and make timely disclosures, so as toensure transparency, integrity and accountability to enhance the value of the stakeholders and achieve sustainable growthof the Company.
1.1.1.1.1. BBBBBoaroaroaroaroard of Dird of Dird of Dird of Dird of Dirececececectttttorsorsorsorsors
a.a.a.a.a. CCCCComposition of the Bomposition of the Bomposition of the Bomposition of the Bomposition of the Boaroaroaroaroarddddd
As on 31st March, 2012, the Board of CTEL consists of six Directors comprising three Executive and threeIndependent Directors. Every Director informs the Company on annual basis about their position on Board andBoard Committee he occupies in other companies including Chairmanships and notifies changes as and whenthey take place.
The composition of the Board of Directors as on 31st March, 2012 is:
Name Name Name Name Name AAAAAgegegegege NoNoNoNoNo. of other. of other. of other. of other. of other CCCCCommittommittommittommittommitteeeeeeeeee ChairChairChairChairChairmanshipmanshipmanshipmanshipmanship
DirDirDirDirDirececececectttttorshipsorshipsorshipsorshipsorships MMMMMembershipembershipembershipembershipembership(1)(1)(1)(1)(1) in Cin Cin Cin Cin Committommittommittommittommitteeseeseeseesees(2)(2)(2)(2)(2)
WWWWWholeholeholeholehole-----TTTTTime Dirime Dirime Dirime Dirime Dirececececectttttororororor
Stefan Hetges 49 Nil Nil Nil
Samir Bhatia 51 Nil 1 Nil
DRR Swaroop 53 Nil 2 Nil
I I I I Independenndependenndependenndependenndependent Dirt Dirt Dirt Dirt Dirececececectttttorsorsorsorsors
L. Sridhar 59 Nil 2 2
Mallipudi Anand Pattabhiramkumar(3) 45 1 2 Nil
Motaparthy Venkateswara Rao Kasi(3) 50 Nil 2 1
(1) Including memberships in Committees of CTEL(2) Including chairmanships in Committees of CTEL(3) Independent Director since 13th February, 2012

AAAAAnnual Rnnual Rnnual Rnnual Rnnual Reporeporeporeporeporttttt 2011-2012 2011-2012 2011-2012 2011-2012 2011-2012
9393939393
bbbbb..... DirDirDirDirDirececececectttttor's aor's aor's aor's aor's attttttttttendancendancendancendancendance ae ae ae ae at Bt Bt Bt Bt Boaroaroaroaroard and Ad and Ad and Ad and Ad and Annual Gnnual Gnnual Gnnual Gnnual Generenerenerenereneral Mal Mal Mal Mal Meetingeetingeetingeetingeeting
During the financial year 2011-12, six Board meetings were held. Director's attendance at Board and AnnualGeneral Meeting are as below:
NoNoNoNoNo. of B. of B. of B. of B. of Boaroaroaroaroard Md Md Md Md Meetingseetingseetingseetingseetings NoNoNoNoNo. of B. of B. of B. of B. of Boaroaroaroaroarddddd AAAAAttttttttttendancendancendancendancendanceeeee Name Name Name Name Name held durheld durheld durheld durheld during theing theing theing theing the meetingsmeetingsmeetingsmeetingsmeetings in lastin lastin lastin lastin last
tttttenurenurenurenurenure of Dire of Dire of Dire of Dire of Dirececececectttttororororor aaaaattttttttttendedendedendedendedended AAAAAGMGMGMGMGM
Stefan Hetges 6 5 Present
Samir Bhatia 6 3 Present
D R R Swaroop 6 6 Present
L. Sridhar 6 6 Present
Mallipudi Anand Pattabhiramkumar@ 1 1 NA
Motaparthy Venkateswara Rao Kasi@ 1 1 NA
Dr. Prem Singh Rana$ 3 3 NA
Krishen Kumar Dhar$ 3 2 NA
@Appointed w.e.f.13th February, 2012
$ Resigned w.e.f 13th September, 2011
2.2.2.2.2. CCCCCommittommittommittommittommittees of the Bees of the Bees of the Bees of the Bees of the Boaroaroaroaroarddddd
The Board has constituted the following Committees:
a. Audit Committee
As on 31st March, 2012, the Audit Committee of CTEL consists of three Directors comprising two IndependentDirectors and a Whole-Time Director
The composition of the Audit Committee as on 31st March, 2012 is:
1. L Sridhar - Chairman
2. DRR Swaroop - Member
3. Motaparthy Venkateswara Rao Kasi - Member since 8th March, 2012
4. Dr. Prem Singh Rana - Chairman(resigned w.e.f 13th September, 2011)
The role of the Audit Committee is as under:
i. Overseeing the Company's financial reporting process and the disclosure of its financial information, toensure that the financial statement is correct, sufficient and credible;
ii. Recommending the appointment/removal of external auditors, fixing audit fees and approving paymentsfor any other services;
iii. Reviewing with the Management the annual financial statements before submission to the Board;
iv. Reviewing with the Management, external and internal auditors, the adequacy of internal control systems;
v. Reviewing the adequacy of internal audit function, including the structure of the internal audit department,staffing and seniority of the official heading the department, reporting structure, coverage and frequencyof internal audit;

AAAAAnnual Rnnual Rnnual Rnnual Rnnual Reporeporeporeporeporttttt 2011-2012 2011-2012 2011-2012 2011-2012 2011-2012
9494949494
f. Discussing with internal auditors of any significant findings and follow-up thereon;
g. Reviewing the findings of any internal investigations by the internal auditors into matters where there isa suspected fraud or irregularity or a failure of internal control systems of a material nature and reportingthe matter to the Board;
h. Discussing with external auditors before the audit commences, the nature and scope of audit as well ashave post-audit discussions to ascertain any area of concern;
i. Reviewing the Company's financial and risk management policies.
j. To look into the reasons for substantial defaults in the payments to the depositors, debenture holders,shareholders (in case of non-payment of declared dividends) and creditors.
The Company Secretary acts as Secretary to the Committee.
During the financial year 2011-12, five Audit Committee meetings were held. Member's attendance at CommitteeMeeting is as below:
C C C C Committommittommittommittommittee Mee Mee Mee Mee Membersembersembersembersembers PPPPPositionositionositionositionosition MMMMMeetings heldeetings heldeetings heldeetings heldeetings held MMMMMeetingseetingseetingseetingseetingsdurdurdurdurduring ting ting ting ting tenurenurenurenurenureeeee aaaaattttttttttendedendedendedendedended
of the Mof the Mof the Mof the Mof the Memberemberemberemberember
L. Sridhar$ Chairman 5 5
DRR Swaroop Member 5 5
Dr Prem Singh Rana# Member 3 3
Motaparthy Venkateswara Rao Kasi@ Member Nil NA$Chairman w.e.f 8th March, 2012# Chairman till 13th September, 2011@Member since 8th March, 2012
bbbbb..... IIIIInnnnnvvvvvestestestestestor Ror Ror Ror Ror Relaelaelaelaelation & Shartion & Shartion & Shartion & Shartion & Shareholders' Ceholders' Ceholders' Ceholders' Ceholders' Committommittommittommittommitteeeeeeeeee
As on 31st March, 2012, the Investor Relation & Shareholders Committee of CTEL consists of three Directorscomprising two Independent Directors and a Whole-Time Director. The committee meets as and when required.
The composition of the Investor Relation & Shareholders Committee as on 31st March, 2012 is:
1. L Sridhar - Chairman
2. DRR Swaroop - Member
3. Mallipudi Anand Pattabhiramkumar - Member w.e.f 8th March, 2012
4. Krishen Kumar Dhar - Chairman(resigned w.e.f 13th September, 2011)
The Investor Relation & Shareholders Committee is empowered with all the functions of the Board in relation tohandling and redressal of shareholders' complaints. The committee reviews the following matters:
i. Review of investor complaints and their redressal to the satisfaction of the shareholder.
ii. Review of the corporate actions viz., dividend payment, rights issue, split, bonus issue etc.
iii. Monitoring of the work done by the Company's Registrar and Share Transfer Agents.
The Company Secretary acts as Secretary to the Committee.

AAAAAnnual Rnnual Rnnual Rnnual Rnnual Reporeporeporeporeporttttt 2011-2012 2011-2012 2011-2012 2011-2012 2011-2012
9595959595
During the financial year 2011-12, two Investor Relation & Shareholders' Committee meetings were held. Member'sattendance at Investor Relation & Shareholders' Committee is as below:
C C C C Committommittommittommittommittee Mee Mee Mee Mee Membersembersembersembersembers PPPPPositionositionositionositionosition MMMMMeetings heldeetings heldeetings heldeetings heldeetings held MMMMMeetingseetingseetingseetingseetingsdurdurdurdurduring ting ting ting ting tenurenurenurenurenureeeee aaaaattttttttttendedendedendedendedended
of Mof Mof Mof Mof Memberemberemberemberember
L Sridhar# Chairman 2 2
D R R Swaroop Member 2 2
Krishen Kumar Dhar$ Chairman 2 1
Mallipudi Anand Pattabhiramkumar@ Member Nil NA#Chairman from 8th March, 2012$Chairman till 13th September, 2011@Member since 8th March, 2012
ccccc..... CCCCCompensaompensaompensaompensaompensation Ction Ction Ction Ction Committommittommittommittommitteeeeeeeeee
As on 31st March, 2012, the Compensation Committee of CTEL consists of three Directors comprising twoIndependent Directors and a Whole-Time Director. The committee meets as and when required.
The composition of the Compensation Committee as on 31st March, 2012 is:
1. Dr. Prem Singh Rana - Chairman till 13th September, 2011
2. Krishen Kumar Dhar - Member till 13th September, 2011
3. Motaparthy Venkateswara Rao Kasi - Chairman w.e.f 8th March, 2012
4. Mallipudi Anand Pattabhiramkumar - Member w.e.f 8th March, 2012
5. Samir Bhatia - Member
The object of the Compensation Committee is to ensure administration of ESOPs granted to employees of theCompany including its subsidiaries expeditiously including transfer of shares on exercise of ESOPs.
TTTTTerererererms of Rms of Rms of Rms of Rms of Refefefefeferererererencencencencenceeeee
The Compensation Committee shall meet as and when required for the purpose of proper administration andimplementation of the ESOP Schemes formulated by the Company from time to time.
The main function of the Committee will include implementation, administration and superintendence of theESOP Scheme formulated by the Company from time to time and formulation of the detailed terms andconditions for the same including:
i. The quantum of options to be granted under an ESOP Scheme per employee and in aggregate;
ii. The eligibility criteria;
iii. The schedule for vesting of Employee Stock Options;
iv. The conditions under which the Employee Stock Option vested in employees may lapse in case oftermination of employment for misconduct;
v. The procedure for making a fair and reasonable adjustment to the number of Employee Stock Optionsand to the Exercise Price in case of a corporate action such as rights issues, bonus issues, merger, sale ofdivision and others;

AAAAAnnual Rnnual Rnnual Rnnual Rnnual Reporeporeporeporeporttttt 2011-2012 2011-2012 2011-2012 2011-2012 2011-2012
9696969696
vi. The procedure and terms for the Grant, Vest and Exercise of Employee StockOption in case of employeeswho are on long leave;
vii. The procedure for cashless exercise of Employee Stock Options, if required;
viii. Approve forms, writings and/or agreements for use in pursuance of the ESOP Schemes;
ix. Frame suitable policies and systems to ensure that there is no violation of (a) Securities and Exchange Boardof India (Insider Trading) Regulations, 1992 and (b) Securities and Exchange Board of India (Prohibition ofFraudulent and UnfairTrade Practices relating to the Securities Market) Regulations, 1995, by any employee;
x. Frame any other byelaws, rules or procedures as it may deem fit foradministering ESOP.
The Company Secretary acts as Secretary to the Committee.
During the financial year 2011-12, two Compensation Committee meetings were held. Member's attendanceat Compensation Committee is as below:
C C C C Committommittommittommittommittee Mee Mee Mee Mee Membersembersembersembersembers PPPPPositionositionositionositionosition MMMMMeetings heldeetings heldeetings heldeetings heldeetings held MMMMMeetingseetingseetingseetingseetingsdurdurdurdurduring ting ting ting ting tenurenurenurenurenureeeee aaaaattttttttttendedendedendedendedended
of Mof Mof Mof Mof Memberemberemberemberember
Dr Prem Singh Rana# Chairman 2 2
Krishen Kumar Dhar# Member 2 1
Motaparthy Venkateswara Rao Kasi@ Chairman Nil NA
Mallipudi Anand Pattabhiramkumar@ Member Nil NA
Samir Bhatia Member 2 2
#Chairman/ Member till 13th September, 2011 @Chairman/ Member w.e.f 8th March, 2012
3.3.3.3.3. CCCCCode of Code of Code of Code of Code of Conduconduconduconduconducttttt
In compliance with Clause 49 of the Listing Agreements, the Company has adopted a Code of Conduct for conduct ofthe business with highest standards of integrity, honesty and ethical conduct and uses their office in good faith andin the best interest of the Company. This Code is applicable to all the members of the Board, and senior management.
A copy of the said Code of Conduct is available on our website, www.ctepl.com. All the members of the Board andsenior management have affirmed compliance to the Code of Conduct for the financial year ended 31st March, 2012.
4.4.4.4.4. DisclosurDisclosurDisclosurDisclosurDisclosureseseseses
a. Related Party Transactions:
Related party transactions, monetary transactions between the Company and directors, the Management,subsidiary or relatives are disclosed in the financial statements for the year ended 31st March, 2012.

AAAAAnnual Rnnual Rnnual Rnnual Rnnual Reporeporeporeporeporttttt 2011-2012 2011-2012 2011-2012 2011-2012 2011-2012
9797979797
b. Remuneration and Shareholding and Stock Options held by Directors:
Following table provides remuneration provided to Directors for their services during the year 2011-12 alongwith their shareholding and stock options:
(Amount in `)
Name Name Name Name Name SSSSSalaralaralaralaralaryyyyy AAAAAllollollollollowwwwwancancancancances /es /es /es /es / SittingSittingSittingSittingSitting NoNoNoNoNo. of. of. of. of. of SSSSStttttockockockockockCCCCCommissionommissionommissionommissionommission FFFFFeeseeseeseesees SharSharSharSharShares heldes heldes heldes heldes held OptionsOptionsOptionsOptionsOptions
DRR Swaroop 1,200,000 - - 186,474 Nil
L Sridhar - - 1,30,000 Nil Nil
Dr. P S Rana# - - 80,000 Nil Nil
Krishen Kumar Dhar# - - 30,000 Nil Nil
Mallipudi Anand Pattabhiramkumar$ - - 10,000 Nil Nil
Motaparthy Venkateswara Rao Kasi$ - - 10,000 Nil Nil
#Resigned w.e.f 13th September, 2011$Appointed w.e.f 13th February, 2012
5.5.5.5.5. PPPPPrrrrrofile of Dirofile of Dirofile of Dirofile of Dirofile of Dirececececectttttorsorsorsorsors
As per Clause 49(I)(G) of the Listing agreement, following are the brief profiles of newly appointed directors duringthe financial year 2011-12:
MMMMMallipudi Aallipudi Aallipudi Aallipudi Aallipudi Anand Pnand Pnand Pnand Pnand Paaaaattabhirttabhirttabhirttabhirttabhiramkamkamkamkamkumarumarumarumarumar, I, I, I, I, Independenndependenndependenndependenndependent Dirt Dirt Dirt Dirt Dirececececectttttororororor
Mallipudi Anand Pattabhiramkumar is a serial entrepreneur having founded and invested in a significant amount ofBusinesses. He has been responsible for raising significant amount of money towards the funding of these variousventures that run the gamut from Management Consulting, Technology, Animation and Entertainment, F&B, Retailand Infrastructure.
A first generation entrepreneur, Anand wore numerous hats ranging from Operations, Business Development toCapital Raising and eventual M&A or IPO activities. His success's include Cambridge Samsung Partners (a VC companywith numerous successful spin-offs with record IRR's), Surya Ray Elixirs (a holding company for F&B sports outlets andnight clubs going strong with 12 operational outlets and expanding in various cities across India) and PRA Holdings(a privately held holding company with investments in Power, RE, Hospitality and Retail).
Anand studied at Business School Lausanne, Switzerland and Babson College. He also has a diploma in ProductionManagement from Ecole Technique de Ste.Croix, Switzerland. He serves on the Leadership Board at University ofPennsylvania's Wharton School.
Anand is one of the founders of Rosetta Corporation, an infrastructure development company providing EPC supportto the Highway Development and Power Industries.
Anand is actively involved in a non-profit endeavor that supports children with Mental and Physical Disabilities,Anokhi Asha .
MMMMMotaparotaparotaparotaparotaparthththththy y y y y VVVVVenkenkenkenkenkaaaaattttteswesweswesweswararararara Ra Ra Ra Ra Rao Kao Kao Kao Kao Kasi, Iasi, Iasi, Iasi, Iasi, Independenndependenndependenndependenndependent Dirt Dirt Dirt Dirt Dirececececectttttororororor
Motaparthy Venkateswara Rao Kasi, a graduate in Pharmacy with Post graduation in Management has variedexperience of over 25 years. He is a serial entrepreneur and had set up companies to manufacture telecom &transmission towers, industrial fasteners, and industrial chemical equipment. Currently he is the President of VKRCollege and Chairman of VKR, VNR, and AGK Engineering College. He is also Chief Executive Officer of NTR MemorialTrust. He is actively associated with Industries Associations like FAPCCI, IALA and Non Profit Organization - AnokhiAasha.

AAAAAnnual Rnnual Rnnual Rnnual Rnnual Reporeporeporeporeporttttt 2011-2012 2011-2012 2011-2012 2011-2012 2011-2012
9898989898
AAAAAdditional Shardditional Shardditional Shardditional Shardditional Shareholderseholderseholderseholderseholders’’’’’ I I I I Infnfnfnfnfororororormamamamamationtiontiontiontion
CCCCCononononontactactactactact It It It It Infnfnfnfnfororororormamamamamationtiontiontiontion
1.1.1.1.1. RRRRRepreprepreprepresenesenesenesenesenting Oting Oting Oting Oting Officfficfficfficfficers:ers:ers:ers:ers:
i. Chief Financial OfficerSamir Bhatia
ii. Company Secretary & Compliance OfficerV Ramana Reddy
2.2.2.2.2. Listing on SListing on SListing on SListing on SListing on Stttttock Exock Exock Exock Exock Exchangeschangeschangeschangeschanges, S, S, S, S, Stttttock Cock Cock Cock Cock Codes and Sodes and Sodes and Sodes and Sodes and Stttttock daock daock daock daock data.ta.ta.ta.ta.
E E E E Equitquitquitquitquity Shary Shary Shary Shary Shareseseseses SSSSStttttock Cock Cock Cock Cock Codeodeodeodeode
The Bombay Stock Exchange Ltd. 532801
The National Stock Exchange of India Ltd. CTE
3.3.3.3.3. IIIIInnnnntttttererererernananananational Stional Stional Stional Stional Securecurecurecurecurities Idenities Idenities Idenities Idenities Identificatificatificatificatification Number (“ISINtion Number (“ISINtion Number (“ISINtion Number (“ISINtion Number (“ISIN”)”)”)”)”)
ISIN is a unique identification number allotted to the Company’s scrip. This number has to be quoted in each transactionrelating to the dematerialized equity shares of the Company. The ISIN allotted to the Company’s equity shares is INE627H01017.
4.4.4.4.4. CIN NumberCIN NumberCIN NumberCIN NumberCIN Number
The Corporate Identity Number (“CIN”) of the Company, as allotted by the Ministry of Company Affairs isL72200AP1999PLC030997.
5.5.5.5.5. RRRRRegegegegegistristristristristrar and Sharar and Sharar and Sharar and Sharar and Share e e e e TTTTTrrrrransfansfansfansfansfer Aer Aer Aer Aer Agengengengengents:ts:ts:ts:ts:
Aarthi Consultants Private Ltd1-2-285, DomalgudaHyderabad – 500 029T +91-40-27638111F [email protected]
6.6.6.6.6. PPPPPersons holding morersons holding morersons holding morersons holding morersons holding more than 1% of the share than 1% of the share than 1% of the share than 1% of the share than 1% of the shareseseseses
Persons holding 1 per cent or more of the shares in the Company as on 31st March, 2012:
S.NoS.NoS.NoS.NoS.No..... NameNameNameNameName NoNoNoNoNo. of. of. of. of. of % of paid up% of paid up% of paid up% of paid up% of paid upsharsharsharsharshares heldes heldes heldes heldes held capitalcapitalcapitalcapitalcapital
PPPPPrrrrromotomotomotomotomotersersersersers
1 Internet Business Capital Corporation 7,589,349 38.66
2 CellExchange Inc. 810,424 4.13
SUBSUBSUBSUBSUB-----TTTTTOOOOOTTTTTALALALALAL 8,399,7738,399,7738,399,7738,399,7738,399,773 42.7942.7942.7942.7942.79

AAAAAnnual Rnnual Rnnual Rnnual Rnnual Reporeporeporeporeporttttt 2011-2012 2011-2012 2011-2012 2011-2012 2011-2012
9999999999
PPPPPublicublicublicublicublic
1 Smartshift AG 2,056,600 10.48
2 Our Vox Holdings LLC 1,750,000 8.91
3 Raymond J Lane 500,000 2.55
4 D R R Swaroop(Trustee-ESOP Trust) 454031 2.31
5 Bhaskar Panigrahi 454,423 2.31
6 Master Capital Services Ltd 451,046 2.30
7 Girish Rajeshwar Chaitanya 335,690 1.71
8 Devinder Prakash Kalra 288,162 1.47
SUBSUBSUBSUBSUB-----TTTTTOOOOOTTTTTALALALALAL 6,289,9526,289,9526,289,9526,289,9526,289,952 32.0432.0432.0432.0432.04
OOOOOthersthersthersthersthers 4,941,2904,941,2904,941,2904,941,2904,941,290 25.1725.1725.1725.1725.17
GRGRGRGRGRAND AND AND AND AND TTTTTOOOOOTTTTTALALALALAL 1963101519631015196310151963101519631015 100.00100.00100.00100.00100.00
7.7.7.7.7. SSSSStttttock Daock Daock Daock Daock Datatatatata
The 52 week high and low closing prices recorded in BSE and NSE during the financial year 2011-12 is as under:
SSSSStttttock Exock Exock Exock Exock Exchangechangechangechangechange BSEBSEBSEBSEBSE NSENSENSENSENSE
High ` 17.90 (7th April, 2011) ` 17.90 (8th April, 2011)
Low ` 6.2 (23rd August, 2011) ` 6.15 (12th August, 2011)
8.8.8.8.8. DistrDistrDistrDistrDistribution of Sharibution of Sharibution of Sharibution of Sharibution of Shareholding as on 31st Meholding as on 31st Meholding as on 31st Meholding as on 31st Meholding as on 31st Marararararch, 2012.ch, 2012.ch, 2012.ch, 2012.ch, 2012.
RRRRRangeangeangeangeange NoNoNoNoNo. of. of. of. of. of % of% of% of% of% of NoNoNoNoNo. of. of. of. of. of % of% of% of% of% of(no(no(no(no(no. of shar. of shar. of shar. of shar. of shares)es)es)es)es) SharSharSharSharShareholderseholderseholderseholderseholders SharSharSharSharShareholderseholderseholderseholderseholders sharsharsharsharshares heldes heldes heldes heldes held SharSharSharSharShareholdingeholdingeholdingeholdingeholding
1-500 6,446 84.8 969,567 4.94
5,01-1,000 557 7.34 461,028 2.35
1,001-2,000 264 3.47 406,720 2.06
20,01-3,000 108 1.42 280,702 1.43
3,001-4,000 42 0.55 150,502 0.77
4,001-5,000 50 0.66 237,173 1.21
5,001-10,000 71 0.93 518,421 2.64
10,001 and above 63 0.83 16,606,902 84.6
TTTTTOOOOOTTTTTALALALALAL 7,6017,6017,6017,6017,601 100.00100.00100.00100.00100.00 19,631,01519,631,01519,631,01519,631,01519,631,015 100.00100.00100.00100.00100.00
9.9.9.9.9. DDDDDemaemaemaemaemattttterererererializaializaializaializaialization of shartion of shartion of shartion of shartion of shareseseseses
In order to facilitate easy access of dematerialized system to the investors, the Company has signed up with NationalSecurities Depository Limited (NSDL) and Central Depository Services (India) Limited (CDSL) and has establishedconnectivity with the depositories through our Registrars - Aarthi Consultants Private Ltd, Hyderabad.

AAAAAnnual Rnnual Rnnual Rnnual Rnnual Reporeporeporeporeporttttt 2011-2012 2011-2012 2011-2012 2011-2012 2011-2012
100100100100100
Total number Demat and physical shares as on 31st March, 2012 is as below :
S.NoS.NoS.NoS.NoS.No..... MMMMModeodeodeodeode NoNoNoNoNo. of shar. of shar. of shar. of shar. of shareseseseses % of t% of t% of t% of t% of total paid upotal paid upotal paid upotal paid upotal paid up
1 Demat (NSDL) 13,958,747 71.11
2 Demat (CDSL) 4,891,174 24.92
3 Physical 781,094 3.98
TTTTTOOOOOTTTTTALALALALAL 19,631,01519,631,01519,631,01519,631,01519,631,015 100100100100100
10.10.10.10.10. SSSSSecrecrecrecrecretaretaretaretaretarial Aial Aial Aial Aial Audituditudituditudit
For the year ended 31st March, 2012, a qualified Practicing Company Secretary carried out secretarial audits to reconcilethe total admitted equity share capital with National Securities Depository Ltd (NSDL) and Central Depository Services(India) Limited (CDSL) and total issued and listed capital. The audit reports confirm that the total issued/paid upcapital is in agreement with the total number of shares in physical form and the total number of dematerializedshares held with NSDL and CDSL.
11.11.11.11.11. Unclaimed DividendsUnclaimed DividendsUnclaimed DividendsUnclaimed DividendsUnclaimed Dividends
There are no unclaimed dividends, due to be transferred to the Investor Education and Protection Fund administeredby the Central Government. Furnished below is a table of important dates:
F F F F Financial yinancial yinancial yinancial yinancial year inear inear inear inear in DaDaDaDaDattttte ofe ofe ofe ofe of Last daLast daLast daLast daLast dattttte fe fe fe fe fororororor TTTTTotalotalotalotalotal DDDDDue daue daue daue daue dattttte fe fe fe fe forororororwhich Dividendwhich Dividendwhich Dividendwhich Dividendwhich Dividend DDDDDeclareclareclareclareclaraaaaationtiontiontiontion claiming unpaidclaiming unpaidclaiming unpaidclaiming unpaidclaiming unpaid UnclaimedUnclaimedUnclaimedUnclaimedUnclaimed trtrtrtrtransfansfansfansfansfer ter ter ter ter tooooo
declardeclardeclardeclardeclarededededed of dividendof dividendof dividendof dividendof dividend dividenddividenddividenddividenddividend amounamounamounamounamount as ont as ont as ont as ont as on EEEEEducaducaducaducaducation andtion andtion andtion andtion and31st M31st M31st M31st M31st Marararararch, 2012ch, 2012ch, 2012ch, 2012ch, 2012 PPPPPrrrrrotototototececececection Ftion Ftion Ftion Ftion Fundundundundund
2007-08 23rd October, 2008 22nd October, 2015 ` 84,046/- 21st November, 2015
Members are requested to correspond with the Registrar and Share Transfer Agent M/s Aarthi Consultants Pvt Ltd,Hyderabad for en-cashing the unclaimed dividend if any, standing to their credit. No claims shall lie against theCompany for the amounts of dividend so transferred nor shall any payment be made in respect of such claims afterthe period of seven years from the date of declaration of such dividend.
12.12.12.12.12. GGGGGenerenerenerenereneral Bal Bal Bal Bal Body Mody Mody Mody Mody Meetingseetingseetingseetingseetings
a.a.a.a.a. Last thrLast thrLast thrLast thrLast three Aee Aee Aee Aee Annual Gnnual Gnnual Gnnual Gnnual Generenerenerenereneral Mal Mal Mal Mal Meetingseetingseetingseetingseetings.....
YYYYYearearearearear DaDaDaDaDattttte and e and e and e and e and TTTTTimeimeimeimeime LLLLLocaocaocaocaocationtiontiontiontion
2010-11 30th September 2011 The Federation of Andhra Pradesh Chambers of Commerce and Industry(FAPCCI), Federation House, 11-6-841, Red Hills, FAPCCI Marg, Hyderabad500004
2009-10 30th September, 2010 Hotel Swagath-De-Royal, #2-36, Kothaguda, X Roads, Kondapur,Hyderabad - 500 081
2008-09 30th September, 2009 At KLN Prasad Auditorium, Federation House, 11-6-841, Red Hills,Hyderabad - 500 004

AAAAAnnual Rnnual Rnnual Rnnual Rnnual Reporeporeporeporeporttttt 2011-2012 2011-2012 2011-2012 2011-2012 2011-2012
101101101101101
13.13.13.13.13. MMMMMeans of Ceans of Ceans of Ceans of Ceans of Communicaommunicaommunicaommunicaommunicationtiontiontiontion
i. Quarterly Results: Tentative dates for declaration of financial results.
1st Quarter - 6th week from end of June, 2012
2nd Quarter - 6th week from end of September, 2012
3rd Quarter - 6th week from end of December, 2012
4th Quarter - 6th week from end of March, 2013
ii. Newspapers wherein results are normally published: Financial Express & Andhra Prabha.
iii. Website wherein the financial results and official news releases are displayed and made available for investors:www.ctepl.com
2.2.2.2.2. SSSSSofofofofoftttttwwwwwararararare De De De De Devevevevevelopmenelopmenelopmenelopmenelopment Lt Lt Lt Lt Locaocaocaocaocationstionstionstionstions
a. IIIIIndiandiandiandiandia
i. Plot No 8-2-269/A/2/1 to 6, 1st Floor, West Wing, “CYBER SPAZIO” Road No 2, Banjara Hills,Hyderabad – 00 033
ii. SHAURYA”, Plot No. 739, 13th Cross, 7th Block, Jayanagar, Bangalore-560070.
iii. #22 , 1st Main Road, Electronic city 1st Phase (Opp. Tata Power, Near to NHAI Toll Gate),Bangalore – 560 100
iv. #2987, 13th Main Road, Z Block, 1st Street, Shanti Colony, Anna Nagar, Chennai 600-040
v. “The Avenue”, Room No.1009, 10th Floor, International Airport Road, Opp. The Leela, Andheri (East),Mumbai – 400059
b. USAUSAUSAUSAUSA
i. 1 Main Street, Suite 530, Cambridge, Massachusetts 02142
ii. 120 SE 6th Avenue, Suite 230, Topeka, Kansas 66603
c. GGGGGererererermanmanmanmanmanyyyyy
i. Willy Brandt Platz 6, 68161, Mannheim, Germany
AAAAAnnual Rnnual Rnnual Rnnual Rnnual Reporeporeporeporeporttttt 2011-2012 2011-2012 2011-2012 2011-2012 2011-2012
102102102102102
This pag
e has
been le
ft blan
k inten
tionall
y

CCCCCAAAAAMBRIDGE MBRIDGE MBRIDGE MBRIDGE MBRIDGE TECHNOLTECHNOLTECHNOLTECHNOLTECHNOLOGY ENTERPRISES LIMITEDOGY ENTERPRISES LIMITEDOGY ENTERPRISES LIMITEDOGY ENTERPRISES LIMITEDOGY ENTERPRISES LIMITEDRegd. Office : Plot No. 8-2-269/A/2/1 to 6, 1st Floor, West Wing, Cyber Spazio, Road No. 2, Banjara Hills, Hyderabad - 500 033
PRPRPRPRPROOOOOXXXXXY FORMY FORMY FORMY FORMY FORM
I /We _____________________________________ of (Place) ___________________________________________________
being a member/members of Cambridge Technology Enterprises Ltd under Folio No./Client No. ____________________
hereby appoint Mr./Ms. ______________________________ of (Place)____________________________ or failing him/
her Mr./Ms. _______________________________ of (Place) ________________________________ as my/our proxy to
vote for me/us and on my / our behalf at the 13th Annual General Meeting of the Company to be held on Friday, the 28th day
of September, 2012 and at any adjournment(s) thereof.
Signed this _________________________ day of _________________ 2012.
Note: The proxy form must be returned so as to reach the Registered Office of the company not less than 48 hours beforethe time for holding the aforesaid meeting.
No. of Equity Shares held:
�
�
Affix a Re 1/-Revenue
Stamp & signacross.
AAAAATTTTTTENDTENDTENDTENDTENDANCE SLIPANCE SLIPANCE SLIPANCE SLIPANCE SLIP
Please complete this attendance slip and hand over at the entrance of the meeting hall. Joint shareholders desiring toattend the meeting may obtain additional attendance slips on request, provided such request is received by the companybefore 28th September, 2012.
I hereby record my presence at 13th Annual General Meeting of the Company held at Friday, the 28th day of September,2012 at 3:00 p.m. at Ruby Hall, 5th Floor, Quality Inn Pearl, Lumbini Layout, Gachibowli, Hyderabad - 500 032.
Name(s) of the Shareholders (In Block Capitals) _______________________________________________________________
Name of the Proxy (In Block Capitals)_______________________________________________________________________
Folio No./*Client ID No. __________________________________ *DP ID No. ______________________________________
Signature(s) if Shareholder: __________________________________/ if Proxy:___________________________________
Note: No duplicate attendance slip will be issued at the Meeting Hall. You are requested to bring your copy of the AnnualReport to the Meeting.*Applicable to only shareholders holding shares in demat form.
CCCCCAAAAAMBRIDGE MBRIDGE MBRIDGE MBRIDGE MBRIDGE TECHNOLTECHNOLTECHNOLTECHNOLTECHNOLOGY ENTERPRISES LIMITEDOGY ENTERPRISES LIMITEDOGY ENTERPRISES LIMITEDOGY ENTERPRISES LIMITEDOGY ENTERPRISES LIMITEDRegd. Office : Plot No. 8-2-269/A/2/1 to 6, 1st Floor, West Wing, Cyber Spazio, Road No. 2, Banjara Hills, Hyderabad - 500 033
AAAAAnnual Rnnual Rnnual Rnnual Rnnual Reporeporeporeporeporttttt 2011-2012 2011-2012 2011-2012 2011-2012 2011-2012
104104104104104
This pag
e has
been le
ft blan
k inten
tionall
y
