annual disclosure report for the fiscal year ended … provides its annual disclosure report for the...
TRANSCRIPT

Liberty University
Annual Disclosure Report for the Fiscal Year Ended
June 30} 2012
10/31/2012
1

Table of Contents I. INTRODUCTION ................................................................................................................................. 3
A. CUSIP Numbers ................................................................................................................................ 3
B. Annual Disclosure Report ................................................................................................................. 3
C. Other Matters .................................................................................................................................. 4
II. MANAGEMENT'S DISCUSSION OF CONSOLIDATED OPERATIONS .................................................... 5
Ill. ACADEMICS ................................................................................................................................... 6
A. Residential Academic Schools and Programs ................................................................................... 6
B. Liberty University Online Academic Schools and Programs ............................................................ 8
C. Student Enrollment and Retention ................................................................................................ 11
D. Student Application and Academic Quality ................................................................................... 13
E. Tuition and Fees ............................................................................................................................. 14
F. Financial Aid ................................................................................................................................... 15
IV. FINANCES ..................................................................................................................................... 18
A. Financial Condition ......................................................................................................................... 18
B. Contributions and Gifts .................................................................................................................. 23
C. lnvestments ...... .-............................................................................................................................. 23
D. Endowment Assets ......................................................................................................................... 25
APPENDIX A: Financial Statements for Fiscal Year Ending June 30, 2012 ............................................... 26
2

I. INTRODUCTION Pursuant to the Continuing Disclosure Agreements dated December 21,2010 and January
19,2012 (collectively, the "Disclosure Agreement") executed and delivered in connection with the
issuance by the Virginia College Building Authority of Educational Facilities Revenue Bonds (Liberty
University Projects) Series 2010 (the "Series 2010 Bonds") and the $100,000,000 Liberty University
5.1000% Taxable Bonds Series 2012 (the "Series 2012 Bonds), Liberty University (the "University")
hereby provides its annual disclosure report for the fiscal year ended June 30, 2012 (the "Annual
Disclosure Report").
A. CUSIP Numbers Each maturity ofthe Series 2010 Bonds is identified by the corresponding CUSIP Number set
forth below:
Maturity Date Series CUSIP
03-01-2012 Series 2010 927781WR1 03-01-2013 Series 2010 927781WS9 03-01-2014 Series 2010 927781WT7 03-01-2015 Series 2010 927781WU4 03-01-2016 Series 2010 927781WV2 03-01-2017 Series 2010 927781WWO 03-01-2018 Series 2010 927781WX8 03-01-2019 Series 2010 927781WY6 03-01-2019 Series 2010 927781XG4 03-01-2020 Series 2010 927781WZ3 03-01-2021 Series 2010 927781XA7 03-01-2021 Series 2010 927781XH2 03-01-2022 Series 2010 927781XB5 03-01-2023 Series 2010 927781XC3 03-01-2024 Series 2010 927781XD1 03-01-2024 Series 2010 927781XJ8 03-01-2025 Series 2010 927781XE9 03-01-2029 Series 2010 927781XL3 03-01-2029 Series 2010 927781XM1 03-01-2034 Series 2010 927781XK5 03-01-2041 Series 2010 927781XE9
The CUSPI Number set forth for the Series 2012 Bonds is 531543ACO with a maturity date on March 1, 2042
Note: The CUSIP Numbers above are provided for the convenience of the Bondholders. The University is not
responsible for the accuracy of such numbers.
B. Annual Disclosure Report The University's Annual Disclosure Report includes this Introduction, the information required
by section 4 of the Disclosure Agreement as set forth in Appendix D to the Official Statement dated
December 8, 2010 ("Series 2010 Bonds"), the information required be section xx of the Continuing
Disclosure Agreement set forth in the Official Statement dated January 11, 2012 ("Series 2012 Bonds")
and the University's consolidated financial statements for the fiscal years ended June 30, 2012 and 2011
(the "University's FY 2012 Audited Financial Statements"). A copy ofthe University's FY 2012 Audited
Financial Statements is available in Appendix A of this document and has been posted on the Municipal
3
Securities Rulemaking Board's Electronic Municipal Market Access system ("EMMA") at
http://emma.msrb.org. Please note that this Annual Disclosure Report is intended to be read in
conjunction with the University's FY 2012 Audited Financial Statements.
C. Other Matters This Annual Disclosure Report is provided solely pursuant to the Disclosure Agreement. The
filing of the Annual Disclosure Report does not constitute or imply any representation (i) that all ofthe
information provided is material to investors, (ii) regarding any other financial, operating or other
information about the University or the Bonds, or (iii) that no changes, circumstances or events have
occurred since the end of the fiscal year to which this Annual Disclosure Report relates (other than as
contained in this Annual Disclosure Report), or that no other information exists, which may have a
bearing on the security for the Bonds, or an investor's decision to buy, sell or hold the Bonds. The
information contained in this Annual Disclosure Report has been obtained from sources which are
believed to be reliable. No statement in this Annual Disclosure Report should be construed as a
prediction or representation about future financial performance of the University.
This Annual Disclosure Report, which includes the University's FV2012 Audited Financial
Statements, contains certain forward-looking statements that involve risks and uncertainties. Any
statements that express, or involve discussions as to expectations, beliefs, plans, objectives,
assumptions, future events or performance (often, but not always, through the use of words of phrases
such as "will result/' "expect to/' "will continue/' "anticipates/' "plans/' "intends/' "estimated/'
"projects/' and "outlook") are not historical and may be forward-looking. Forward-looking statements
are subject to known and unknown risks, uncertainties and other factors which may cause actual results
to be materially different from those expressed or implied by such forward-looking statements.
Although the University believes that the expectations reflected in the forward-looking statements are
reasonable, the University cannot guarantee future results, levels of activity, performance or
achievements. Moreover, neither the University nor any other person assumes responsibility for the
accuracy or completeness of these statements. Accordingly, investors should not rely on forward
looking statements in this Annual Disclosure Report. The University undertakes no obligation to publicly
update or revise any forward-looking statements in this Annual Disclosure Report, whether as a result of
new information, future events or otherwise.
Dated: 10/31/2012
THE BOARD OF TRUSTEES OF LIBERTY UNIVERSITY
By:~~·~ Chief Financial Officer
4

II. MANAGEMENT'S DISCUSSION OF CONSOLIDATED OPERATIONS
A. Fiscal Year Ended June 30, 2012
Fiscal year 2012 was a year of investment and continued growth. Liberty was able to continue to grow enrollment while continuing to increase tuition and fees, maintain a relatively flat institutional discount, and improve entrance quality indicators while continuing to improve expendable net assets. Continued growth in LU Online enrollment and a stable residential program enrollment increased annual headcount by 22.1% from 77,778 students in fiscal year 2011 to 95,753 students in fiscal year 2012. Total revenues increased 20.1% from $523.3 million in fiscal year 2011 to $630.9 in fiscal year 2012. The institutional discount rate was 20.7% during fiscal years 2011 and 2012. Total expenditures increased 29.1% from $323.2 million in fiscal year 2011 to $417.1 million in fiscal year 2012. Operating expenditures per student increased by 4.8% over fiscal year 2011 to $4,355. Long term debt increased from $128.3 million in fiscal year 2011 to $226.3 million in fiscal year 2012 due to the issuance of the Series 2012 Taxable Bonds. Expendable Financial Resources improved from $450.4 million in fiscal year 2011 to $709.6 million in fiscal year 2012. Total net assets increased by 44.6% from $637.5 million in fiscal year 2011 to $851.3 million in fiscal year 2012.
5

III. ACADEMICS
A. Residential Academic Schools and Programs The University offers 148 undergraduate programs and specializations, 53 graduate programs
and specializations and one doctoral programs of study. Listed below is a short description of the various schools and colleges of the University:
College of General Studies. The College of General Studies oversees the general education curriculum and introductory courses across all of the University's undergraduate programs. The College of General Studies provides undergraduate students, particularly during their first two years of study, with the academic preparation to help them succeed when pursuing a degree from one of the University's schools and colleges listed below.
College of Arts and Sciences. The College of Arts and Sciences is comprised of the Departments of Biology & Chemistry, Center for Creation Studies, English and Modern Languages, Family and Consumer Sciences, Health Sciences, History, Mathematics, Music & Humanities, Nursing, Philosophy, Psychology and Theatre Arts. The College of Arts and Sciences offers programs leading to the degrees of Bachelor of Arts, Bachelor of Science, Bachelor of Music, Bachelor of Science in Nursing, Master of Arts, Master of Science, Master of Science in Nursing, Master of Public Health and Doctor of Philosophy.
School of Aeronautics. The School of Aeronautics is an accredited, FAA-certified program offering a Bachelor of Science degree in aeronautics. Students may specialize in commercial/corporate aviation, military aviation, missions aviation or unmanned aerial systems. Additional program offerings include an Associate of Arts degree in Aviation Maintenance Technician or Flight Attendant. A certificate program is also available for students interested in a career as an Aviation Maintenance Technician.
School of Business. The School of Business is comprised of the Departments of Accounting, Finance & Economics, International Business, Human Resource Management, Marketing and Management. The Department of Accounting offers an Associate of Arts Degree, a Bachelor of Science and a Master of Science in Accounting. The other Departments offer a Bachelor of Science in Business degree with specializations depending on the Department and an Associate of Arts in Business. Graduate programs include the Master of Business Administration (with specializations in Accounting, Healthcare Management, Human Resources, International Business, Leadership, Marketing, Project Management, Public Administration and Public Relations) and Master of Arts in Management and Leadership.
Helms School of Government. The Helms School of Government offers the Associate of Arts in Government, Associate of Arts in Criminal Justice, Bachelor of Science in Government (with specializations in politics and policy and pre-law), Bachelor of Arts in Government (with specializations in politics and policy, pre-law, international relations and strategic and intelligence studies), Bachelor of Science in Criminal Justice and Bachelor of Arts in International Relations.
Liberty University Baptist Theological Seminary. The Liberty University Baptist Theological Seminary offers the Master of Divinity, Master of Religious Education, Master of Religious Education in Military Chaplaincy, Master of Theology, Master of Arts in Ethnomusicology, Doctor of Ministry, Doctor of Philosophy in Pastoral Counseling and Doctor of Philosophy in Theology & Apologetics. In addition,
6

the Seminary offers 11 focused professional Master of Arts programs in Children's Ministry, Christian Leadership, Discipleship Ministries, Evangelism and Church Planting, Global Apologetics, Intercultural Studies, Marketplace Chaplaincy, Pastoral Counseling, Religion, Theological Studies and Worship Studies. The Liberty University Baptist Theological Seminary is also fully accredited.
School of Communication. The School of Communication is comprised of the Department of Communication Studies and the Center for Cinematic Arts. The School of Communications offers a Bachelor of Science in Communication Studies (with specializations in Advertising & Public Relations, Digital Media, Journalism, Speech Communication and Cinematic Arts), Bachelor of Science in Studio and Digital Art (with specializations in Graphic Design and Studio Art) and Master of Arts in Communication Studies (with concentrations in Media & Communication Studies and Interpersonal & Organizational Communication).
School of Education. The School of Education provides programs designed to produce teachers and administrative educators to work at the pre-school through high school level. The School of Education is comprised of the Departments of Teacher Education, Sport Management and Graduate Education. The School of Education's Teacher Licensure Program is accredited by the National Council for Accreditation of Teacher Education and approved by the Virginia Department of Education. The Teacher Education Department provides licensure programs for elementary/middle schools, special education and secondary schools. The School of Education also offers the degrees of Master of Arts in Teaching, Master of Education, Bachelor of Science and Associate of Arts in Education (non-licensure), Bachelor of Science in Sport Management and Master of Science in Sport Management (with specializations in Sport Administration and Outdoor Recreation Management).
The School of Engineering and Computational Sciences. The School of Engineering and Computational Sciences has programs in electrical engineering, electrical engineering with an intelligence specialization, industrial engineering, computer engineering, computer science, computer science with an intelligence specialization, and web technology and design. Graduates of the program receive a Bachelor of Science in one of the program areas.
Liberty University School of Law. The Liberty University School of Law offers the Juris Doctor degree and is fully accredited by the American Bar Association.
School of Religion. The School of Religion offers an Associate of Arts in Religion, a religion major leading to a Bachelor of Science (with specializations in Biblical Studies, Children's Ministries, Intercultural Studies, Pastoral Leadership, Women's Ministries and Youth Ministries), an Intercultural Studies major leading to a Bachelor of Science, a Pastoral Leadership and Biblical Exposition major leading to Bachelor of Arts, a philosophy and religion major leading to a Bachelor of Arts (with specializations in Philosophy and Biblical Studies), and a major in Worship and Music Studies leading to a Bachelor of Science degree (with specializations in Biblical Studies, Christian Music Artist and Songwriter, Intercultural Studies, Pastoral Leadership, Theatre Ministries, Women's Ministries, Worship Leadership, Worship Technology and Youth Ministry). The School of Religion also sponsors the Center for Christian/Community Service, Center for Global Engagement, the Center for Ministry Training, the Center for Youth Ministries and the Center for Women's Ministries.
The following table provides information on the distribution of resident undergraduate, graduate and doctoral students among the academic programs offered by the University as of Fall 2011:
7

Number of Academic Program Students Percent1
Health Sciences/Nursing 1,951 15%
Religion 1,703 13%
General Arts & Sciences 1A45 11%
Communications 1A02 11%
Psychology 1,217 10%
Business 1,315 10%
Education 1,152 9%
Government 912 7%
Pre Med & Biology 582 5%
Engineering/Computational 500 4%
Law 287 2%
Aeronautics 294 2%
Notes: 1. The numbers in each column may not equallOO% due to rounding.
B. Liberty University Online Academic Schools and Programs
In 1985, the University established its off-campus distance learning program to provide educational course offerings to students around the world. Prior to the Internet, all distance learning courses used videotaped lectures and other accompanying course materials.
The University's on-line distance learning program has grown to be a significant part of the University's operations. In June 2007, the program became known as Liberty University Online; and in January 2008, LU Online was ranked third nationally by the Online Education Database based on quality factors such as retention, graduation rate, student-faculty ratio and the number of years accredited and in operation. The number of full-time and part-time students participating in LU Online undergraduate and graduate programs at the University grew from 27,556 in fiscal year 2008 to 82,609 in fiscal year 2012.
Although LU Online courses differ from residential course offerings due to methodologies of instruction, LU Online courses are comparable to residential courses in content. LU Online utilizes the online software platform Blackboard so that students can have Internet access to reading materials, other online resources and interaction with professors and other students. The focus of courses offered by LU Online is primarily business, education, psychology, religion, counseling and nursing. LU Online offers 43 undergraduate programs and specializations, 66 graduate programs and specializations and nine post-masters and doctoral programs.
Undergraduate degrees include the Bachelor of Science in Accounting, Bachelor of Science in Aeronautics, Bachelor of Science in Business Administration (with various specializations), Bachelor of Science in Criminal Justice, Bachelor of Science in Business Management Information Systems, Bachelor of Science in Interdisciplinary Studies, Bachelor of Science in Early Childhood Education in Interdisciplinary Studies, Bachelor of Science in Elementary Education in Interdisciplinary Studies,
8

Bachelor of Science in Special Education in Interdisciplinary Studies, Bachelor of Science in Nursing, Bachelor of Science in Paralegal Studies, Bachelor of Science in Psychology (with various specializations) and Bachelor of Science in Religion. LU Online also offers the Associate of Arts degree in Accounting, Business, Criminal Justice, Early Childhood Education, Education (non-licensure), Interdisciplinary Studies, Management Information Systems, Paralegal Studies, Psychology and Religion.
Graduate programs include the Master of Science in Accounting, Master of Arts in Management and Leadership, Master of Science in Sport Management, Master of Business Administration (with various specializations), Master of Arts in Human Services (with various specializations), Master of Arts in Marriage and Family Therapy, Master of Arts in Professional Counseling, Master of Arts in Teaching (including Elementary, Secondary and Special Education), Master of Education (with various specializations), Master of Science in Nursing, Master of Public Health - Nutrition, Master of Arts in Public Policy, Master of Arts in Christian Ministry, Master of Arts in Global Studies, Master of Arts in Theological Studies, Master of Arts in Religion, Master of Divinity (with various specializations), Master of Religious Education, Master of Theology (non-thesis) and Master of Arts in Ethnomusicology.
Doctoral programs include the Doctor of Philosophy in Pastoral Care and Counseling, Doctor of Philosophy in Professional Counseling, Doctor of Education in Curriculum & Instruction, Doctor of Education in Educational Leadership, Doctor of Ministry and Doctor of Philosophy in Theology & Apologetics.
The LU Online curriculum is structured to encourage undergraduate and graduate degree
completion and approximately 95% of the students are working toward a degree. The University
believes that LU Online enhances student matriculation and retention by fostering academic and
spiritual commitment and a sense of community unique to online and distance education. The
University has operated its online and distance education programs for much of its existence, and its
internal culture has been long geared to meet the needs of students who desire a Christian-based
education but who are unable to attend classes in Lynchburg, Virginia.
The University's commitment to academic excellence through accreditation by the Southern
Association of Colleges and Schools ("SACS") has created rigorous course development and
administration standards that require both online and residential courses to have the same outcome
oriented curriculum. While the online programs afford the flexibility of studying at one's own pace and
shorter 8-week classes, academic progress of each student is closely monitored by a staff dedicated to
ensuring that students are progressing through each course satisfactorily and to ensure the academic or
administrative issues that may be impeding the students' progress are identified and resolved as quickly
as possible. All student course work is available 24 hours a day, seven days a week online and a
significant amount of the course work is being made available through mobile devices. A 360-degree
support network of academic, administrative and spiritual services-from application to graduation-is
available online and includes academic advisors, IT helpdesk, career center, library services and writing
center, and an online ministry network offering counseling and prayer.
In addition, the University believes that the vibrant residential campus provides LU Online with
the academic credibility usually afforded to "bricks and mortar" academic programs. As the largest
Christian evangelical university in the United States and with a NCAA Division I athletics program, the
9

University further allows LU Online students to establish a connection and affinity with the University
that may be difficult to re-create solely with an online academic program, as many of the University's
athletic and spiritual activities are available online. Finally, the University encourages degree
completion by addressing student cost concerns by providing the lowest undergraduate tuition rate of
any leading online university in the country with a large student headcount.
The following table provides information on the distribution of LU Online undergraduate, graduate and doctoral students among the academic programs offered by the University as of Fall 2012:
Number of Academic Program Students Percent1
Psychology 21,998 27% Religion 18,977 23% Business 15,743 19% Education 12,526 15% General Arts & Sciences 4,394 5% Government 3,958 5% Health Sciences/Nursing 2,219 3% Engineering/Computational 1,403 2% Multidisciplinary Studies 1,370 2% Aeronautics 121 <1%
Notes: 1. The numbers in each column may not equallOO% due to rounding.
10

C. Student Enrollment and Retention
The following table provides resident program headcount information reflecting the total number of full-time and part-time students in resident undergraduate and graduate degree programs for Fall semesters of fiscal years 2008-2012:
Resident Program Fall Headcount1
2008 2009 2010 2011 2012
Undergraduate 9,959 10,869 11,527 11,810 12,145
Graduate2 503 440 391 345 427
Fall Semester Total 10,462 11,309 11,918 12,155 12,572
1. Resident Program reporting has been updated to reflect the fall-semester full-time and part-time
students. Previous year continuing disclosure documents contained the annualized resident program
head count. Management believes that enrollment for full-time and part-time students for the fall
semester better represents the Resident Program.
2. Includes all students enrolled in the Liberty University School of Law and the Liberty University
Baptist Theological Seminary.
The following table provides LU Online annual student headcount information reflecting the
total number of full-time and part-time students enrolled in LU Online programs during each of the past
five fiscal years:
LU Online Annual Headcount
Fiscal Year: 2008 2009 2010 2011 2012
Undergraduate 14,067 18,381 26,954 35,137 45,620
Graduate 13,489 18,359 24,524 29,734 36,989
Total 27,556 36,740 51,478 64,871 82,609
Approximately 41% of the University's resident student enrollment by headcount for the 2011-2012 academic year were Virginia residents; however, the University has resident students from all 50 states, the District of Columbia and numerous foreign countries.
The University maintains an active student retention program designed to assist the student body in adjusting to life at the University. Although the University believes its efforts are generally successful, students decide to leave the University for many different reasons. For the Fall periods 2007-2008 to 2011-2012, resident student retention rates for undergraduate students, graduate students and freshman to sophomore only were as follows:
11

Resident Undergraduate, Graduate and Freshman Fall-Fall Retention Rates
Fall to Fall Periods Undergraduate Graduate Freshmen Fall 2010 to Fall 2011 (FY12) 82.1% 82.5%1 80.6%
Fall 2009 to Fall 2010 (FY11) 81.7% 94.4% 77.0%
Fall 2008 to Fall 2009 (FY10) 78.4% 94.0% 77.0%
Fall 2007 to Fall 2008 (FY09) 77.6% 81.4% 72.8%
Fall 2006 to Fall2007 (FY08) 78.2% 76.5% 74.8%
Notes: 1. The reduction in the Fall 2011 resident graduate retention rate is primarily due to the
elimination by the state of Virginia of tuition assistance grants for certain graduate programs.
The six-year graduation rate for full-time, first-time undergraduate students who
entered the University in Fall 2005 seeking a Bachelor's degree or certificate was 48%.
12

D. Student Application and Academic Quality
Data on the number of residential applications, acceptances, and matriculants at the University for the Fall Semesters ofthe years 2008-2012 are set forth in the following table:
Applications\ Acceptances, and Matriculants
2008 2009 2010 2011 2012 Freshmen Applications 17,010 22,957 26,979 23,659 22,415 Accepted 4,545 6,179 6,290 5,048 5,507 Matriculated 2,235 2,589 2,823 2,511 2,636 % of students accepted from applications 27% 27% 23% 21% 25% % of students matriculated from students accepted 49% 42% 45% 50% 48%
Transfer Applications 2,327 2,800 3,142 2,402 3,003 Accepted 991 1,145 1,324 1,051 1,388 Matriculated 647 715 796 646 745 % of students accepted from applications 43% 41% 42% 44% 46% % of students matriculated from students accepted 65% 62% 60% 61% 54%
Graduate2
Applications 222 197 212 191 322 Accepted 114 100 150 142 220 Matriculated 73 88 116 112 158 % of students accepted from applications 51% 51% 71% 74% 68% % of students matriculated from students accepted 64% 88% 77% 79% 72%
Law3
Applications 293 491 466 459 414 Accepted 118 188 200 241 200 Matriculated 74 109 119 135 99 % of students accepted from applications 40% 38% 43% 53% 48% % of students matriculated from students accepted 63% 58% 60% 56% 50%
Seminary4
Applications 231 216 226 185 249 Accepted 130 132 145 127 159 Matriculated 100 108 128 107 143 % of students accepted from total applications 56% 61% 64% 69% 64% % of students matriculated from students accepted 77% 82% 88% 84% 90%
Notes: 1. An applicant is an individual who has fulfilled the institution's requirements to be considered for admission
(including payment or waiving of application fee, if any) and who has been notified of one of the following actions: admission, non-admission, placement on waiting list, or application withdrawn by applicant or institution. The University began enforcing the payment of a $40 application fee for students applying for admission for Fall2010 which management believes contributed to the decline in applications from 2010 to 2011. In 2011, the University modified its criteria for determining when an individual has fulfilled the necessary requirements to be considered for admission. The purpose of the change was to more closely align the University's definition of an "applicant" with the definition provided by the U.S. Department of Education and with current practices of other colleges and universities. The applications reported in years 2008 through 2010 were not restated and are reported only for comparison purposes.
2. Excludes the Liberty University School of Law and Liberty University Baptist Theological Seminary. 3. Includes J.D graduate law program in the Liberty University School of Law. 4. Includes all professional and graduate programs in the Liberty University Baptist Theological Seminary.
13

The University continues to enroll students of increasingly high academic quality. The Educational Testing Service Scholastic Aptitude Test (SAT) scores and American College Testing Program {ACT) scores for first-time incoming resident freshman students for the past five fall semesters is set forth in the following table:
College Entrance Examinations
2008 2009 2010 2011 2012
SAT Scores
Average:
Verbal 504 510 511 524 529
Math 491 497 497 514 516
Total 995 1,007 1,008 1,038 1,045
ACT Scores
Average:
English 21.5 21.8 21.9 22.7 22.9
Math 20.6 21.0 20.8 21.7 21.6
Reading 22.4 22.4 22.6 23.2 23.5
Science 21.0 21.1 21.2 22.0 22.0
Composite ACT 21.5 21.7 21.8 22.5 22.6
E. Tuition and Fees
Undergraduate tuition and fees for full-time study for the past four academic years and the current academic year are set forth in the following table:
Residential Undergraduate Student Tuition, Fees, and Charges
Academic Year Tuition1 Fees2 Room and Board3 Total Cost %Change
2007-2008 $14,850 $950 $5,400 $21,200 2.20%
2008-2009 15,450 990 5,800 22,240 4.90%
2009-2010 15,992 1,210 5,996 23,198 4.30%
2010-2011 16,792 1,271 6,296 24,359 5.00%
2011-2012 17,806 1,348 6,680 25,834 6.06%
Notes: 1. Tuition is based on 18 credit hours maximum per semester. The charge for enrollment in
more than 18 credit hours is $594 per credit hour for the 2011-2012 academic year. 2. Reflects annual activity, technology and transportation fees. 3. Reflects base room and board.
14

Professional school tuition for full-time resident students for the past four academic years and the current year is shown in the following table:
Tuition for Full-time Study at Professional Schools
Academic Year Law Seminary
2007-2008 $24,160 $3,000
2008-2009 25,359 3,200
2009-2010 26,637 3,400
2010-2011 27,839 3,600
2011-2012 29,088 3,800
Undergraduate students enrolled full-time or part-time in programs offered through LU Online pay tuition on a credit hour basis plus applicable fees. For Fall 2011 (Fiscal Year 2012), the rate for full-time and part-time students was $304 and $342 per credit hour, respectively. Students in the University's graduate programs (full-time or part-time, resident or online) also pay tuition on a credit hour basis plus applicable fees based on the degree program. For example, the tuition for Fall 2011 (Fiscal Year 2012) for non-seminary master's and doctorate programs ranged from $438 to $476 per credit hour. Full-time students enrolled in certain master's programs at the seminary pay tuition at a block rate, plus applicable fees. The block rate for Fall 2011 (Fiscal Year 2012) was $1,900 for resident students and $2,200 for online students.
The University expects that tuition, fees and room and board charges will increase on an annual basis to keep pace with rising costs.
F. Financial Aid
The University participates in certain federal and state student financial aid programs and offers certain scholarships funded principally through institutional resources. The various types of aid available to students ofthe University are summarized as follows:
Federal Student Aid. The federal student aid programs available to students of the University include Pell Grants, Supplemental Educational Opportunity Grants, Academic Competitiveness Grants, National SMART Grants, TEACH Grants, Perkins Loans, Direct Stafford Loans, PLUS Loans, and the Work-Study Program. Effective Fall 2010, the University is using the William D. Ford Federal Direct Loan Program for all loans made directly from the U.S. Department of Education as lender.
State Student Aid. Students of the University who are domiciliary residents of the Commonwealth of Virginia may be eligible for state student aid made available through the Virginia Guaranteed Assistance Program, the Tuition Assistance Grant Program, and the College Scholarship Assistance Program.
15

Institutional Student Aid. The scholarship programs offered by the university are made available to students with financial need or with abilities in athletics, music and academics, to students whom the University believes are compatible with the general philosophy ofthe University and to employees of the University and their dependents. A goal of such programs is to attract and retain a student body that will enhance the philosophical purpose of the University.
For the year ended June 30, 2012, financial aid was awarded to approximately 89% of all students totaling approximately $928.5 million. Financial aid awards are typically packaged as a combination of federal, state and university-funded loans, grants and scholarships. Awards from institutional sources (non-federal and non-state) equated to approximately 21% of the University's gross tuition and fees revenue for fiscal year 2012. These awards were approximately 16% of the total amount of financial aid distributed in fiscal year 2012.
The total amount of financial aid awarded by the University to students during a fiscal year may exceed the University's total revenues for that fiscal year. This occurs when a portion of the financial aid award is distributed or refunded to students, parents and third parties after the students' direct expenses (such as tuition, fees and on campus room and board) are fully paid. A large portion of these refunds is then used by the students to pay for other expenses such as travel, books, supplies, rent (for off- campus students) and miscellaneous purchases. For fiscal year 2012, approximately $345 million was refunded to students, parents or third parties by the University.
The financial assistance provided to the University's students from University and nonUniversity sources for the five financial aid award years ended June 30, 2012 is described in the following table:
16

Award Year
University Sources:
Unrestricted Funds
Restricted Funds
Total Scholarships
Loans to Students
Federal Loan Funds
Private Loan Funds
Total Student loans
Other Funds
VA Tuition Asst. Grant
PELL Grant
Other
Total Other Funds
Total Financial Aid
Notes:
Financial Aid to Students
(in thousands)1'
2
2008
84,077
621
84,697
165,246
25,891
191,137
9,494
18,660
14,302
42,456
318,290
2009
97,726
483
98,209
250,177
21,380
271,557
11,113
24,761
17,443
53,317
423,083
2010
107,610
439
108,050
370,685
12,908
383,594
11,891
57,339
28,446
97,676
589,319
1. The numbers in each column may not equal totals due to rounding.
2010
124,682
89
124,771
486,648
13,254
499,902
11,389
82,499
29,915
123,803
748,476
2012
148,519
118
148,637
613,622
16,499
630,121
12,264
98,692
38,799
149,756
928,514
2. Amounts for financial aid award years include adjustments that may have been made after the end of the applicable fiscal year and therefore are not necessarily the same as amounts recorded for financial statement purposes at June 30 of each year.
The University and its students rely on a substantial amount of support from the federal and state student financial aid assistance programs. If a significant reduction on the level of federal and state assistance were to occur, such reduction could have a material adverse effect on the University and its operations. Amounts received and expended by the University under various federal and state financial aid assistance programs are subject to audit by various federal and state agencies and therefore subject to adjustment. Non-compliance with federal or state requirements relating to student assistance programs could result in the University's loss of eligibility to participate in those programs.
17

IV. FINANCES
A. Financial Condition
1. Accounting and Financial Statements
The table below provides information from the University's consolidated statements of financial position and statements of activities for the five years ended June 30, 2008-2012, derived from the audited consolidated financial statements of the University. The financial information below for fiscal years 2012 and 2011 should be read in conjunction with the u·niversity's consolidated financial statements as of June 30, 2012 set forth in Appendix A. For a description ofthe University's significant accounting policies, see Note 2 ofthe Notes to the Consolidated Financial Statements. Except as disclosed herein, since June 30, 2011, there has been no material adverse change in the consolidated financial condition or consolidated changes in net assets of the University.
18

2. Summary of Consolidated Financial Statements
Consolidated Statements of Financial Position
(in thousands)1
For Fiscal Years Ended June 30,
Assets: Cash and cash equivalents
Restricted cash and cash equivalents Accounts receivable, less allowances for doubtful accounts Accounts receivable from related organizations
Notes receivable
Contributions receivable, net
Prepaid lease payments
Other prepaid expenses and other assets
Investments, at fair value
Property, plant, and equipment, net
Total assets
Liabilities: Accounts Payable:
Vendors
Other
Accrued liabilities
Accrued interest payable
Deferred revenue and deposits
Gift annuity payable
Liability under split interest agreements
Obligations under capital leases
Long-term debt
Total liabilities
Net Assets: Unrestricted
Temporarily restricted
Permanently restricted
Total net assets
Total liabilities and net assets
$ 19,174
18,564
1,326
430
103
6,749
2,237
80,586
213,930
s 343,098
$ 750
904
6,891
11
41,873
10,843
3,021
25,340
39,328
s 128,962
$ 209,347
1,309
3,480
s 214,136
s 343,098
$ 27,540 $ 207,355
250
27,628 24,466
1,988 1,611
1,068 493
582 360
6,678 6,607
4,968 6,189
105,249 87,784
237,197 278,607
s 412,898 s 613,722
$ 2,854 $ 8,597
1,441 5,912
5,794 6,214
9 180
54,296 71,603
12,409 14,709
2,879 2,863
5,326 3,524
37,485 64,816
s 122,492 s 178,418
$ 282,160 $ 426,575
1,790 1,749
6,455 6,980
s 290,406 s 435,304
s 412,898 s 613,722
1. The numbers in each column may not equal totals due to rounding
19
$ 403,620
95,234
1,344
604
560
9,425
120,840
310,559
s 942,186
$ 8,194
6,367
7,337
3,049
131,135
15,650
2,265
2,385
128,337
s 304,719
$ 627,798
2,442
7,227
s 637,467
$ 384,417
27,097
1,580
825
428
9,739
492,352
361,214
s 1,277,653
$ 17,971
7,452
12,933
3,818
136,189
17,696
2,285
1,667
226,344
s 426,355
$ 837,925
4,839
8,532
s 851,297
s 942,186 s 1,277,653

Consolidated Statements of Activities
(in thousands)1
For Fiscal Years Ended June 30,
Revenues:
Tuition and fees:
Gross tuition and fees $ 266,506 $ 329,082 $ 434,629 $ 535,484
Institutional scholarships {86,968} {95,656} {99,413} {111,035}
Tuition and fees, net $ 179,538 $ 233,426 $ 335,216 $ 424,449
Contributions $ 25,412 $ 13,745 $ 10,029 $ 12,904
Grants and contracts 603 655 1,792 1,578
Investment income, net 4,944 2,999 5,255 7,581
Realized and unrealized gains (losses), net (2,739) (5,838} 685 (4,750)
Auxiliary services 37,971 40,533 50,803 53,146
Athletic association 1,102 1,020
Proceeds from life insurance
Other sources 15,289 17,902 21,620 31,301
Change in split interest agreements (1,137) (1,287) (417) {874)
Net assets released from restrictions
Total revenues s 260,983 s 303,155 s 424,983 s 525,335
Expenses:
Program services:
Instruction $ 60,490 $ 70,549 $ 82,239 $ 94,712
Academic support 8,960 9,994 18,285 22,365
Student services 42,893 44,804 56,103 64,758
Auxiliary services 29,233 36,007 39,699 44,675
Public services 5,399 4,123 4 841 4 545
Total program services $ 146,974 $ 165,476 $ 201,166 $ 231,056
Supporting services:
Institutional support $ 46,363 $ 57,633 $ 78,895 $ 92,096
Development and external relations 4,264 3,774
Research 2 2 24 19
Total supporting services 50,629 61,409 78,919 92,115
Total expenses $ 197,603 $ 226,885 $ 280,085 $ 323,171
Change in net assets $ 63,380 $ 76,270 $ 144,898 $ 202,164
Net Assets- beginning of year, as previously reported 150,756 214,136 290,406 435,304
Reclassification of net assets
Net Assets - beginning of year, as restated 150,756 214,136 290,406 435,304
Net assets at end of year $ 214,136 $ 290.406 $ 435,304 $ 637,467
Notes: 1. The numbers in each column may not equal totals due to rounding.
20
$ 660,220
{136,787}
$ 523,433
$ 14,160
2,080
6,974
(3,894)
56,896
30,491
746
s 630,885
$ 114,973
24,126
80,068
45,787
5,538
$ 270,493
$ 146,538
25
146,563
$ 417,056
$ 213,829
637,467
637,467
$ 851,297

3. Indebtedness
At June 30, 2012, the University had outstanding long-term indebtedness of approximately $226.3 million (excluding capital lease obligations) consisting of various term notes, tax-exempt revenue bonds issued in December 2010 by the Virginia College Building Authority for the benefit of the University ("Series 2010 Bonds"), and taxable bonds issued in December 2012 by Liberty University ("Series 2012 Bonds"). In fiscal year 2011, the University refinanced approximately $47.8 million of its long-term debt and repaid $8.1 million in loans under its remaining term notes using a portion ofthe $119.7 million in proceeds from the issuance of the Series 2010 Bonds. As part of the debt refinancing, the University closed its $50.0 million bank credit line. Liens on University property associated with retired debt were released.
The outstanding long-term indebtedness of the University as of June 30, 2011 and June 30, 2012 were as follows:
Term notes payable, collateralized by property
Series 2009 bonds
Capital lease obligations
Equipment loans
Other notes payable
Series 2010 bonds
Series 2012 bonds
Total
June 30, 2011 June 30, 2012
(in thousands)
$ $
2,385 1,667
3,526 3,971
3,767 3,217
121,044 120,088
99,068
$ 130,722 $ 228,011
Interest on long-term debt amounted to approximately $3.8 million and $2.8 million for the years ended June 30, 2012 and 2011, respectively. The first interest payment on the Series 2010 Bonds was due September 1, 2011. The annual debt service (principal repayment and interest) on the Series 2010 Bonds is approximately $7.8 million. The first interest payment on the Series 2012 Bonds was not due until September 1, 2012. The annual interest payment on the Series 2012 Bonds is $5.1 million.
21

Notes:
4. NetAssets
The following table shows the net assets available to the University, classified as unrestricted, temporarily restricted or permanently restricted, for the five fiscal years ended June 30 2008-2012.
Net Assets
{in thousands/
FY 2008 FY 2009 FY 2010 FY 2011 FY 2012
Unrestricted: Board designated for long-term investment $ $ 819 $44,100 $ 46,934 $ 50,014
Board designated for investment in plant
Invested in plant facilities 213,930 237,197 278,607 310,559 361,214
Undesignated (4,583) 44,144 104,262 270,305 426,696
Total $282,160 $426,969 $ 627,798 $ 837,925
Temporarily Restricted:
Scholarships $ 413 $ 442 $ 58 $ 259 $ 96
Split interest agreement funds 87 890 1,199 1,607 3,318 Construction and improvement to buildings and facilities 809 458 422 576 1,425
Total $ 1,309 $1,790 $1,679 $ 2,442 $ 4,839
Permanently Restricted $ 3,480 $6,455 $6,656 $ 7,227 $ 8,532
1. The numbers in each column may not equal totals due to rounding. 2. The amounts included as permanently restricted net assets consist of endowment funds to be
held in perpetuity. The related income, based on donor-imposed restrictions, is to be used for certain purposes. As of June 30, 2012, the amount of permanently restricted net assets designated for specified purposes (in thousands) was as follows:
Scholarships $ 5,353 Business/government department Religion department 32 Endowment for Church planning 113 Grounds improvements 4 Endowments 3,030
Permanently restricted net assets $ 8,532
22

B. Contributions and Gifts
Net contributions and gifts to the university for the five fiscal years ended June 30, 2008-2012 are set forth in the following table:
Contributions, Net, and Donated Gifts in Kind
(in thousands)1
FY 2008 FY 2009 FY 2010 FY 2011 FY 2012
Unrestricted $ 23,083 $ 12,198 $ 9,429 $ 11,535 $ 11,511
Temporarily restricted 2,058 1,438 570 1,178 1,337
Permanently restricted 272 109 31 192 1,312
Total Contributions, Net, and Donated
Gifts in Kind $ 25,412 $ 13,745 $ 10,029 $ 12,904 $ 14,159
Notes: 1. The numbers in each column may not equal totals due to rounding.
For the year ended June 30, 2012, approximately 20% and 0% of contributions were made by two major donations (both donations were for the exact same amount) and related organizations, respectively. For the year ended June 30, 2011, approximately 14% and 7% of contributions were made by one major donor and related organizations, respectively.
C. Investments
On June 30, 2011, the Board of Trustees of Liberty University and the Chancellor/President's Office adopted an Investment Policy Statement (IPS) declaring that the fundamental objective of the Board and the Chancellor is to strengthen Liberty's financial position in order to fulfill its primary function as an educational institution. Specifically, the ultimate goal is to provide a framework for the continuation of core University operations in the event of a major downturn while maintaining essential planned capital projects. The IPS will provide a structure that will allow for sufficient flexibility in the management process to capture investment opportunities as they may occur, while setting reasonable parameters to provide prudence and care in the execution of the investment program. The Executive Committee will direct any drawdown of Endowment funds.
As of June 30, 2012, the University's investment plus cash and cash equivalents totaled approximately $876.8 million and investments were diversified among a variety of asset classes as set forth in the table below:
23

Investment
Investment Portfolio:1
Cash Equivalents2
Real Estate
Certificates of deposit
Corporate bonds
Municipal bonds
Mutual funds
Common stocks
Total
Cash and cash equivalents
Total
Notes:
Asset Allocation
(in thousands)
Market Value at
June 30, 2011
$
$
$
$
58,652
1,060
7,223
165
55
50,630
3 055
120,840
403,620
524,460
Market Value at
June 30, 2012
$
$
$
$
142,081
566
7,401
151,874
3,459
100,683
86,289
492,352
384,417
876,768
1. Investments are recorded at fair value based on quoted market prices or estimated fair value pursuant to ASC 820.
2. Cash equivalents utilized within a managed portfolio are accounted for as investments.
The University maintains cash balances at several financial institutions. Total cash balances at each institution are insured by the Federal Deposit Insurance Corporation up to $250,000 for interest bearing accounts and unlimited on non-interest bearing accounts. At June 30, 2012 and 2011, the University had uninsured cash and cash equivalents balances totaling approximately $51.7 and $58.3 million, respectively.
24

D. Endowment Assets
The university's endowment includes both donor-restricted endowment funds and quasiendowment funds. While quasi-endowment assets can be utilized by the University, if necessary, for operating expenditures at the discretion of the Board of Trustees, the assets contributed to the University as donor-restricted endowments generally cannot be so utilized.
The market values of the University's endowment assets for the five years ending June 30, 2008-2012 are summarized below:
Endowed Assets
(in thousands)
FY 2008 FY 2009 FY 2010 FY 2011 FY 2012
Endowment $ 3,480 $ 6,613 $ 6,838 $ 7,199 $ 8,632
Quasi-Endowment 819 43,877 46,934 50,014
Total $ 3,480 $ 7,432 s 50,715 s 54,132 s 58,647
25

APPENDIX A: Financial Statements for Fiscal Year Ending June 30, 2012
26

Consolidated Financial State111ents Years Ended June 30, 2012 and 2011
Liberty University, Inc.

Report f~l lmlepemlellt Auditors
Cousolidatetl Financial Statemellls:
Liberty University, Inc.
Table of C olltents
Consolidated Statements o{Financial Position
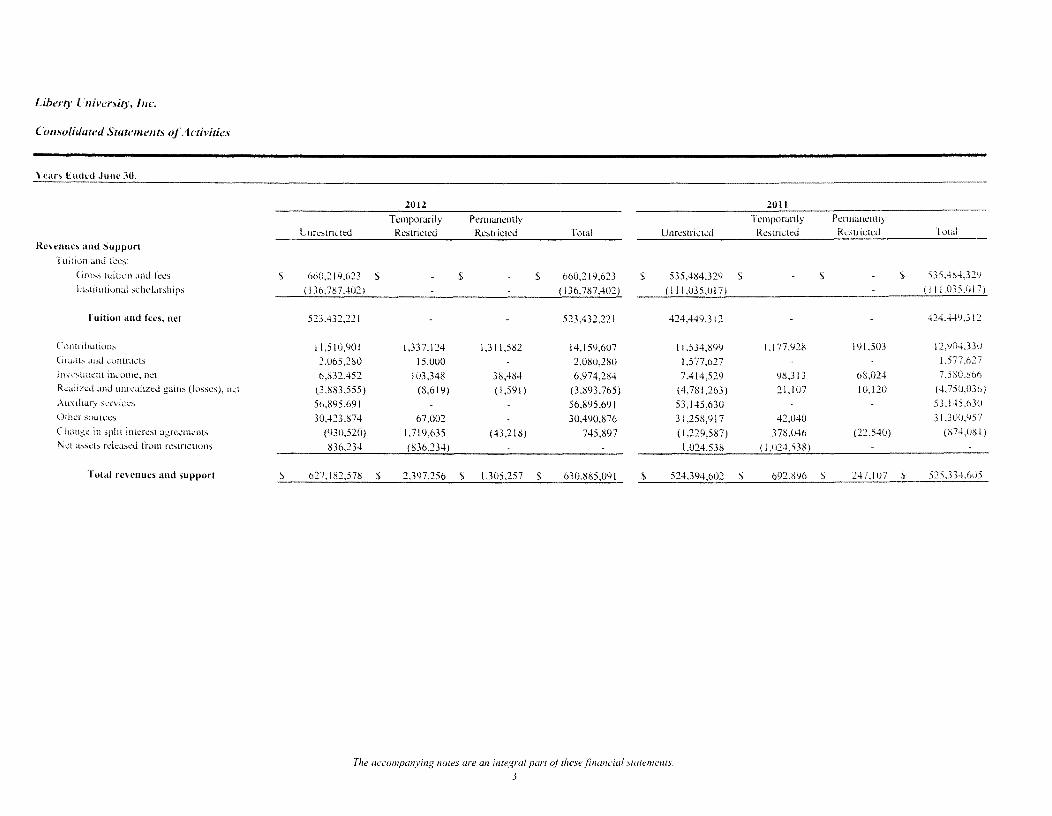
Consolidated Statements o{Activities
Consolidated Statements of Cash Flows
Notes to Consolidated Financial Statements
Supplemental Information
Liberty University Statement ojFinancial Position
Page
3-4
5-6
7-22
23

Board of Trustees Liberty University, luc.
Report of lntlependent Auditors
We have audited the accompanying consolidated statements of financial position of Liberty Ulliversity, btc., a nonprofit corporation, as of June 30,2012 and 2011and the related consolidated statements of activities and cash t1ows, for the years then ended. These consolidated financial statements are the responsibility of Liberty University, Inc.'s management. Our responsibility is to express an opinion on these consolidated financial statements based on our audits.
We conducted our audits in accordance with auditing standards generally accepted in the United States of America. Those standards require that we plan and perform the audits to obtain reasonable assurance about whether the consolidated financial statements are free of material misstatement. An audit includes examining, on a test basis, evidence supporting the amounts and disclosures in the financial statements. An audit also includes assessing the accounting principles used and significant estimates made by management, as well as evaluating the overall consolidated financial statement presentation. We believe that our audits provide a reasonable basis for our opinion.
In our opinion, the consolidated financial statements referred to above present fairly, in all material respects, the consolidated financial position of Liberty University, file. as of June 30, 2012 and 2011, and the changes in its consolidated net assets and its cash t1ows for the years then ended in confom1ity with accounting principles generally accepted in the United States of America.
Our audit was conducted for the purpose of fonning an opinion on the consolidated financial statements as a whole. The unconsolidated statement of financial position for Liberty University on page 23 is presented for purposes of compliance with various states' code for charitable gift annuity certificate holders and is not a required part of the consolidated financial statements. Such information is the responsibility of management and was derived from and related directly to the underlying accounting and other records used to prepare the consolidated financial statements. The infonnation has been subjected to the auditing procedures applied in the audit of the consolidated financial statements and certain additional procedures, including comparing and reconciling such information directly to the underlying accounting and other records used to prepare the consolidated financial statements or to the consolidated tinancial statements themselves. and other additional procedures in accordance with auditing standards generally accepted in the United States of America. In our opinion, the int(m11ation is fairly stated in all material respects in relation to the consolidated financial statements as a whole.
Danville, Virginia ( ktober 19, 20 12

Liberty University, Inc.
Consolidated Statements of Financial Position
.June 2012
Assets
Cash and cash equiYalents $ 384,416.844 Accounts receivable - less allowance for doubtful
accounts of$17,214,000 and $7,920,000 respectively 27,097,237 Accounts receivable trom related organizations [ ,580,282 Notes receivable 825,135 Contributions receivable 428200 Other prepaid expenses and other assets 9,738,922 Investments, at fair value 492,351,618 Property, plant, and equipment, net 361,214,278
Total assets $ 1,277.652,516
Liabilities and Net Assets Liabilites Accounts payable - vendors $ 17,971,241 Accounts payable - other 7,452,328 Accrued liabilities 12,933,060 Accrued interest payable 3,817,771 Deferred revenue and deposits 136,188,748 Gift annuities payable 17,696,115 Liability under split interest agreements 2,285,448 Obligations under capital leases 1,667,277 Long-term debt 226,343,735
Total liabilities 426,355,723
Net assets Unrestricted 837,925,037 Temporarily restricted 4,839,282 Permanently restricted 8,532,474
T otalnet assets 851
Total liabilities and net assets $ 1.277.652.516
lite accolllJ)(liiVing notes ure an integral part o/these financial statements.
2
20ll
$ 403,619,549
95,233,904 1.344,002
604,166 560,000
9,424,869 120,840,275 310.559,418
$ 942,186,183
$ 8,194,452 6,366,638 7,337,059 3,048,713
131,135,167 15,649,787 2,265,483 2,384,937
128,336,531
304,718.767
627,798,173 2,442,026 7.227,217
16
$ 942,186,183
Liberty lnivenitv. Inc.
Comolitiuted .\'wtements of Activities
\ ean Endt•d June
Re' enue> aud Support
lurllon and f.:c-s:
Gro" tuniun and l"cs ':>
hbtllutiunal >l'illllarships
ruition and fees, net
Currtnbuuon'
Grant"~ and \...'Unlracb
ln><':,lmcnt irh:om<:, net
R.:alr.ccd and unrealized gain' ( lo,scs ), nd
Au,rlrar) >cn.icc>
Oth.:r '"urcc'
Changt' in spin intcn::,t agre~tncnts
'.ct a,,.,;t:, n:kcL,cd lhm1 n:stric:tions
rutal rcHnucs and support 'l>
Temporarily Pcnnanently Unn:strictcd
660.~ 19,6~3 $ $ $ 660,219,623 s 535,41:;4,3~')
523,432.~21 523,432,221 424,449.312
I l.510,40 I 1,337.124 1,311,51:>2 14,159,607 11,534.899
2,065,280 15,000 2,080,280 1,577,627
6,S32.452 103,341') 38,484 6,974,21')4 7.414,529
(3.111>3,555) (8,619) ( 1,591) (3,1')93,765) (4,711 I ,263)
56,i>95.69 I 56.!195,69 I 53,145,630
30.423.!174 67,002 30,490,1;76 31,2511,917
(930,520) I ,719,635 (43,2 U\) 745,897 ( 1.224,587)
1.024.531$
627 .182.57!1 s 2.397.256 $ 1,305,257 $ 630.11115.0'11 $ 524,394,602
The accompanying 110/es are WI integral part ofthesl! jimmcial swtements. 3
Re-stricted Rcstrict.:d Total
$ $ '), 535,41:>4.32'1
4~4,44'1,3 12
1,177.9~8 1'11,503 12.'1U4.330
1.577,627
')8,313 6!1,02-l- 7.580.1566
21,107 10,120 (4, 750,036)
53.145.n30
42,040 31.300.957
3711,(!46 (22,540) (!174,01:\l)
( !.024.538)
'l> 692.X96 j, 247.107 'l> 525334.605

Liberty Cniver!>ity, Inc.
Consolidateti Statemetlls ofActivitie!>'
Year~ Ended .June
Lnrestn-:tcd
Elpcmcs
Progr3_n1 s~n i12es
ln~tn~<:tlon s 114,973,24') A-:ad.:mtc support 24,126,235 Stud.:nt sen tees 1\0,0611,414 :\u~!liary services 45,7117,095 Publ!cc ><:n tees
Total program service>
Supporting H'n ices
1nstmllwna1 support l4(J,531S,499 R.:,carch
Total supporting sen ices
Total e).pcnscs
Changes in net assets 210, 126,1:164
1\et as>ds bt•ginning of year
1\ cl as>cts at end of) ear ) t\37.925,037
Temporarily Pem1anently U nrcstricted
$ $ $ 114,973,24') s ')4,712,436
24,126,235 22,365,477
il0,06~,414 64,757,9') 1
45,787,0'>5 44,674,')71)
146,531l,499 92,095,656
1
1 92,115.107
14 323,171,074
2,397,256 1,305,257 213,1Q9,377 201 ,223,52!1
s 4Jl39,282 $ 1:1.532,474 s 851.296.79 3 $ 627.79ll,173
The accompanying notes are an integral par! of these financial stateme/lls.
4
Temporarily
R.:strictcd Restnctcd Total
s s '>4.712,436
22,365.477
64,757,991
44,674,971>
23 L055.'!6 7
92JJ95,656
I 9,451
92.115.107
323. 171.1!74
692,896 247,107 21!2, 163,53
1.749.131! 6,9X0.110 435.3U3.11K5
s 2.442,026 ~ 7.227.217 ~ 6}7,467.41

Liberty Univer."iity. Inc.
Consolitlatetl Statemellts l~j' Cash Flows
Years Ended June 2012
Cash flows from operating activities Changes in net assets $ 213,R29,378 Adjustments to reconcile changes in net assets to net cash
Depreciation and amortization of property, plant and equipment 17,196,413
Amortization of prepaid lease payments Change in value of split-interest a~:,rreements (745,R97) Bad debt expense on accounts receivable l6,92l,l39 Donations of property, plant and equipment (505,200) Non cash donation of investment (3,278,726) Other non cash donation (79,726) Forgiveness of related party debt 200,000 Cash received for permanently restricted contributions (l ,311 ,582) Realized/unrealized losses on investments, net 3,893,765 Loss on disposal of property, plant, and equipment 3,047,748 Permanently restricted earnings (38,484) Net (increase) decrease in:
Accounts receivable 51,106,290 Accounts receivable from related organizations (127,042) Notes receivable (220,969) Contributions receivable 131,800 Other prepaid expenses and other assets (314,053)
Net increase (decrease) in: Accounts payable 9,102,198 Accrued liabilities 5,596,001 Accrued interest payable 769,058 Gift annuities payable 4,358,751 Liability under split interest agreements 626,434 Student deposits 5,053,581
:\fet cash from operating activities 325,210,877
Cash flows from investing activities Purchases of property, plant, and equipment ( 69,602, 009) Proceeds from sale of property, plant, and equipment 634,055 Purchases of investments (975,681 '741) Proceeds from sales and maturities of investments 604,09o,29t
Net cash from investing activities $ (440,553,404)
/he accotnpi111t·ing notes are llll integral parr o(tlwseji!lancial statemellfs.
5
2011
$ 202,163.531
17,576,072 35,518
874,081 5,646,321
(355,651)
636,539 (191,503)
4,750,037 511,823 (68,024)
(76,323,615) 145,257
( 111' 190) (200,000)
(3,235,732)
(1,469,937) 1,122,665 2,868,975 2,304,636 (481 ,060)
59,532,549
215,731,292
(45,279,940) 3,333,5 I 7
(235,938,787) 198,242,054
$ (79,643, 156)

Liberty U11iversity, 111c.
C onsolidatetl Statements of Cash Flows
Y cars Ended June 2012
Cash flows from financing activities: Payments on gift annuities $ (2,312,423) Payments on split interest agreements (187,365) Pemmnently restricted earnings 38,484 Payments on obligations under capital leases (717,660) Proceeds from issuance of long-term debt 99,676,312 Payments on long-term debt (1,669,108) Cash received for pem1anently restricted contributions 1 ,3ll ,582
Net cash from financing activities 96,139,822
Net change in cash and cash equivalents (19,202,705)
Cash and cash equivalents at beginning of year 403,619,549
Cash and cash equivalents at end of year $ 384,416,844
Supplemental disclosures of cash flows information: Cash paid during the year for interest $ 1,864,914 Noncash transactions:
Acquisition of property, plant and equipment with accounts payable $ 1,760,281
Contribution of property, plant and equipment $ 505,200 Donation of investment $ 3,278,726 Other non cash donation $ 79,726 Forgiveness of related party notes receivable $ 200,000
file accompanving notes are an imegral part o(rhcsejinancial stafe!llcnts.
6
20ll
$ (2,238,326) (226,307)
68,024 ( 1' 139,255)
121,962,197 (58,441,306)
191,503
60,176,530
196,264,666
207,354,883
$ 403,619,549
$ 2,980,641
$ 2,055,628 $ 900,000 $ 355,651 $ $ 636,539

Liberty University, Inc.
Notes to Consolidated Financial St(ltemems
June 2012 and 2011
l. Organization and Nature of Activities
Liberty University, [nc. (the University) is a non-stock, nonprofit institution of higher education, initially established in 1971. The University is a Christian academic community in the tradition of evangelical institutions of higher education, with the primary mission of providing quality collegiate education. The University provides associate, baccalaureate, master, and doctoral programs for both liberal arts and professional disciplines in resident and external formats. These programs seek to transmit and expand knowledge, as well as provide opportunities for research and service. The University is accredited by the Southern Association of Colleges and Schools. The affairs of the University are governed by the Board of Trustees.
2. Summary of Significant Accounting Policies
Principles of Consolidation
The consolidated financial statements include the accounts of Liberty University, Inc. and its wholly-owned subsidiaries, C&C Jetting, LLC, LU Plaza Holdings, LLC, LU Candlers Station Holdings, LLC, Liberty Mountain Capital, Inc, Liberty Mountain Conference Center, LLC, LU Racquet Sports, LLC, and Falwell Aviation, Inc (collectively the "University"). C&C Jetting, LLC provides charter air service to the University. LU Plaza Holdings, LLC and Candlers Station Holdings, LLC are retail shopping centers held by the University and classified as quasi-endowments. Liberty Mountain Capital, Inc is a C-corporation owned by the University for investment purposes. Liberty Mountain Conference Center operates as a conference center f()r the University and community. LU Racquet Sports operates as an indoor tennis t~lCility, providing services to the University and community. Falwell Aviation, Inc is a C-corporation that provides charter air and repair and maintenance services to the public as well as flight instruction tor the University's School of Aeronautics. All significant intercompany transactions and balances have been eliminated in the consolidation.
Basis of Accounting
The financial statements of the University have been prepared on the accrual basis of accounting. These financial statements have been prepared to tocus on the University as a whole and to present balances and transactions according to the existence or absence of donor-imposed restrictions. Net assets and revenues, gains and losses are dassilied based on the existence or absence of donor-imposed restrictions. Accordingly, net assets and changes therein arc classified as follows:
Uurestrictetl net assets Net assets not subject to donor-imposed restrictions.
Temporarily restrictetlllet assets Net assets subject to donor-imposed restrictions that may or will be met by actions of the University and/or the passage of time.
Permanellfly re."itrictetlnet assets Net assets subject to donor-imposed restrictions that neither expire by the passage of time nor can be fullilled or otherwise removed by actions of the University. Generally, the donors of these assets pennit the University to use all or part nf the income earned on related investments for general llf specific purposes.
7

Revenues are reported as increases in unrestricted net assets unless use of the related assets is limited by donor-imposed restrictions and these restrictions are not met within the current reporting period. Expenses are reported as decreases in unrestricted net assets. Expirations of temporary restrictions on net assets (i.e., the donor-stipulated purpose has been fulfilled and/or the stipulated time period has elapsed) are reported as reclassifications from temporarily restricted net assets to unrestricted net assets (see Note 10). Temporary restrictions on gifts to acquire long-lived assets are considered met in the period the assets are acquired or placed in service.
Cash and Cash Equivalents
At June 30, 2012 and 2011, cash equivalents consist of $2,858,296 and $9,4 71,821, respectively, of money market funds. The University considers all highly liquid investments purchased with an original maturity of three months or less to be cash equivalents. Cash equivalents utilized within a managed portfolio are accounted for as investments.
Accounts Receivable
Accounts receivable represent the amount receivable tor tuition and other student fees and expenses. The University provides for uncollectible accounts annually based on a percentage of collections within 90 days of year-end. Bad debt expense totaled $16,921,139 and $5,646,321 for the years ended June 30, 2012 and 2011, respectively. When accounts are deemed uncollectible they are charged against the allowance for doubtful accounts.
Contributions Receivable and Contributions Revenue
Contributions, including unconditional promises to give, are recognized as revenue by the University in the period received. Conditional promises to give are not recognized until the conditions on which they depend are substantially met. Contributions of assets other than cash are recorded at their estimated fair value at the date of gift, except that contributions of works of art, historical treasures, and similar assets held as part of collections are not recognized or capitalized.
Contributions to be received atler one year are discounted at a rate commensurate with the risks involved. Amortization of the discount is recorded as additional contribution revenue and used in accordance with donor-imposed restrictions, if any, on the contributions. An allowance is established for uncollectible contributions based upon management's judgment and analysis of the creditworthiness of the donors, past collection experience, and other relevant factors.
Investments
Investments are recorded at fair value. The fair values of investments are determined based on quoted market prices or estimated fair values. The net realized and unrealized gains and losses on investments are ret1ected in the statements of activities. Investment income is reported net of related investment expenses.
Property, Plant, and Equipment
Property, plant, and equipment consisting of land and land improvements, buildings, and furniture and equipment are stated at cost at the date of acquisition or at tair value at the date of gift, less accumulated depreciation and amortization. Depreciation and amortization are recorded using the straight-line method over the estimated useful lives of the assets, which range from 3 years for furniture and equipment to 45 years for buildings. Property and equipment held under capital leases are amortized straight-line over the shorter of the lease term or estimated useful life of the asset.

Deferred Revenue and Deposits
Student deposits consist primarily of student payments received tor University summer and t1lll sessions received during the current year which are designated to be used in future periods and will be recognized as revenue within one year. Revenues are recognized as instruction takes place and the related expenses are incurred.
Functional Expenses
The University allocates expenses on a functional basis among its various programs and supporting services. Expenses that can be identified with a specific program or supporting service are allocated directly. Other expenses that are common to several functions are allocated by various statistical bases.
Income Taxes
The Internal Revenue Service has ruled that the University qualifies under Section 50l(c) (3) of the Internal Revenue Code and is, theretore, not generally subject to income taxes under present tax laws. Management believes that any income tax liability resulting from unrelated business income tor the years ended June 30, 2012 and 20 II would not have a significant impact on the University's results of activities. Certain subsidiaries of the University are taxed as separate entities. The University has determined that it does not have any material unrecognized tax benefits or obligations as of June 30, 2012. Fiscal years ending on or after June 30, 2009, remain subject to examination by federal and state tax authorities.
Concentration of Credit Risk
Financial instruments that potentially subject the University to concentration of credit risk consist of interest-bearing transaction accounts and accounts receivable. The University places its interest-bearing transaction accounts with high credit quality financial institutions.
Student receivables are limited in risk due to the large number of students, those that pay in advance and get grants to cover tuition and related expenses.
For the year ended June 30, 2012, approximately 20% of contributions were made by two major donors. For the year ended June 30, 20 II, approximately 14% and 7% of contributions were made by one major donor and related organizations, respectively.
Advertising Expenses
The University expenses advertising costs as incurred. Advertising expense was $5,499,602 and $2,025,305 at June 30, 2012 and 20 II, respectively.
Use of Estimates
The preparation of tinancial statements in confonnity with accounting principles generally accepted in the United States of America requires management to make estimates and assumptions that aftect the reported amounts of assets and liabilities and disclosure of contingent assets and liabilities at the date of the financial statements and the reported amounts of revenues and expenses during the reporting period. Actual results could differ from those estimates and assumptions.
Reclassifications
Certain items in the 2011 comparative totals have been reclassitied to conform to the 2012 presentation.
9

Subse<tncnt EYcnts
In preparing these consolidated financial statements, the University has evaluated events and transactions for potential recognition or disclosure through October 19, 2012, the date the consolidated financial statements were available to be issued.
3. Contributions ReceiYable
4.
Contributions receivable at June 30 are expected to be received are as follows:
Less than one year One to five years
$
$
2012
170,000 $
428,200 $
2011
460,000 I
560,000
Management has evaluated the contributions receivable and based on historical collection rates and experience with the specified donors, has determined that an allowance for uncollectible pledges is not necessary.
Investments
[nvestments at June 30 consist of the following:
2012 2011 Cost Fair Value Cost Fair Value
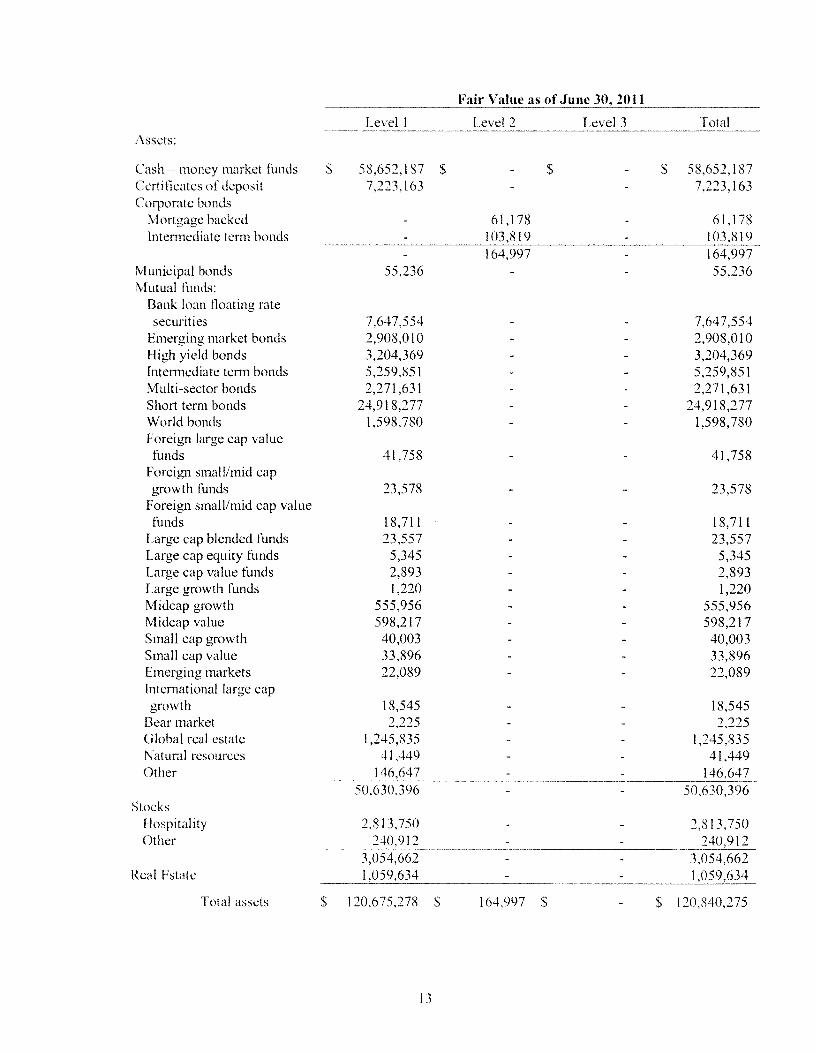
Cash equivalents $ 142,080,679 $ 142,080,679 $ 58,652,187 $ 58,652,187 Real estate/other 565,634 565,634 1,059,634 1,059,634 Certificates of deposit 7,400,812 7,400,812 7,223,163 7,223,163 Corporate bonds 151,405,843 151,874,394 114,505 164,997 Municipal bonds 3,478,770 3,458,928 48,917 55,236 Mutual funds 100,050,685 I 00,682,600 50,758,025 50,630,396 Common stocks 84,577,901 86,288,571 3,039,745 3,054,662
$ 489,560,324 $ 492,351,618 $ 120,896, I 76 $ 120,840,275
The University's investment strategy incorporates certain financial instruments that involve, to varying degrees, elements of market risk and credit risk. Management does not anticipate that losses resulting from market or credit risks would materially affect the financial position of the University.
10

5. Fair Value Measurements
ASC Topic 820. Fair Value .Heasurements and Disclosures, delincs t~1ir value as the price that would be r~:-'Ceived to sell an asset or paid to transfer a liability (i.e., the "exit price") in an orderly transaction between market participants at the measurement date. ASC Topic 820 emphasizes the tair value is a market-based measurement, not an entity-specific measurement. The framework for measuring tair value under the bruidance is based on a fair value hierarchy that distinguishes between observable inputs (i.e., inputs that are based on market data obtained from independent sources) and unobservable inputs (i.e., inputs that require the University to make its own assumptions about market participant assumptions because little or no market data exists). The three levels of the tair value hierarchy are described below:
Levell
Level2
Level3
Inputs to the valuation methodology are unadjusted quoted prices for identical assets or liabilities in active markets that the University has the ability to access.
Inputs to the valuation methodology include: • Quoted prices for similar assets or liabilities in active markets; • Quoted prices for identical assets or liabilities in inactive markets; • Inputs other than quoted prices that are observable for the asset or liability; • Inputs that are derived principally from or corroborated by observable market data by
correlation or other means.
Inputs to the valuation methodology are unobservable and significant to the fair value measurement.
The asset or liability's fair value measurement level within the fair value hierarchy is based on the lowest level of any input that is significant to the fair value measurement. Valuation techniques are used to maximize the use of observable inputs and minimize the use of unobservable inputs.
Mutual funds and common stocks are valued at the closing price reported on the active market on which the individual securities are traded. Corporate bonds are valued at amortized cost and real estate is recorded at the appraised value. All assets have been valued using a market approach, except for Level 3 assets. Level 3 assets are valued using the income approach. Fair values for assets in Level 2 are calculated using quoted market prices for similar assets in markets that are not active. Fair values for assets in Level 3 are determined by the net asset value of the fund provided by the tund manager. There were no changes in the valuations techniques during the current year.
II

Fair Value as of June 2012
Level 1 Level 2 Level3 Total Assets:
Cash money market funds $ 142,080,6 78 $ s $ 142,080,6 78 Certiticates of deposit 7,400,812 7.400,812 Government and agency bonds 17,885,815 17,885,815 Municipal bonds 3,458,928 3,458,928 !Vlortgage funds 2,409,299 2,409,299 Bank loan tloating rate securities 4,217,190 4,217,190
High yield bonds 64,347,174 64,347,174 Investment grade bonds 63,014,917 63,014,917 Mutual funds
Government and agency bond funds 47,728,238 47,728,238
Corporate bond funds 47,154,413 47,154,413 Equity funds 5,799,949 5,799,949
100,682,600 100,682,600 Stocks
Financial institutions 15,483,407 15,483,407 Energy and utilities 4,829,324 4,829,324 Oil and gas exploration 4,289,040 4,289,040 Global energy and materials 7,430,310 7,430,310 Gold trusts 18,189,880 18,189,880 Hospitality
Other 565,634 565,634 Hedge funds
Long/short equity funds 20,622,900 Fund of funds I lO
Total assets $ 305,239,228 $ 156,6 73,280 $ 30,439,110 $ 492,351,618
Liabilities:
Annuities payable $ $ $ 17,696,115 $ 17,696,115 Liability under split-interest
agreements
Total liabilities $ $
12
Fair Value as of June 2011
Levd I Levd 2 Level 3 Total Assets:
Cash - money market funds $ 58,652,187 $ $ $ 58,652,187 Certiticates of deposit 7,223,163 7,223,163 Corporate bonds
Mortgage backed 61,178 61,178 Intermediate term bonds 1 19 I 19
164,997 164,997 Municipal bonds 55,236 55,236 Mutual funds:
Bank loan tloating rate securities 7,647,554 7,647,554
Emerging market bonds 2,908,010 2,908,010 High yield bonds 3,204,369 3,204,369 Intermediate term bonds 5,259,851 5,259,851 Multi-sector bonds 2,271,631 2,271,631 Short term bonds 24,918,277 24,918,277 World bonds 1,598,780 1,598,780 Foreign large cap value funds 41,758 41,758
Foreign small/mid cap growth funds 23,578 23,578
Foreign small/mid cap value funds 18,711 18,711
Large cap blended funds 23,557 23,557 Large cap equity funds 5,345 5,345 Large cap value funds 2,893 2,893 Large growth funds 1,220 1,220 Midcap growth 555,956 555,956 Midcap value 598,217 598,217 Small cap growth 40,003 40,003 Small cap value 33,896 33,896 Emerging markets 22,089 22,089 International large cap growth 18,545 18,545
Bear market 2,225 2,225 Global real estate 1,245,835 1,245,835 Natural resources 41,449 41,449 Other 1 I
50,630,396 50,630,396 Stocks
Ilospitality 2,813,750 2,813,750 Other 12 12
3,054,662 3,054,662 Real Estate I I
Total assets $ 120,675.278 $ 164,997 $ $ 120,840,275
13

Fair Value as of .June
Liabilities:
Annuities payable S Liability under split-interest agreements
Total liabilities $
Level t
$
Lcvel2 Level 3 Total
$ 15,649,787 15,649,787
s 17,915,270 s 17,915,270
The University invests in hedge funds that pursue multiple strategies to diversify risks and reduce volatility. These funds have investments in assets located both in and outside the United States. Investments in this category, for which there are no readily determinable t~1ir values, are classified as Level 3 because the valuations are based on signiticant unobservable inputs. The fair values of these investments have been estimated using the net asset value per share of the investments as provided by the hedge fund managers. Redemptions are generally pennitted after some period of time after initial investment, either on a quarterly, semi-annual, or annual basis, subject to certain restrictions, which include a notice period of 30 to 90 days.
The following table illustrates the activity of Level 3 assets and liabilities:
Liability under Annuities split-interest
Hedge funds Qai::able agreements
Balance- June 30, 2010 $ $ 14,709,397 $ 2,863,197 Contributions 3,700,761 Payouts (2,238,326) (226,307) Change in lair value 1
Balance - June 30, 2011 15,649,787 2,265,483
Contributions/purchases 30,000,000 3,361,904 604,627 Payouts (2,411,510) (352,803) Change in tair value 439,110 1,095,934 (231,859)
Balance -June 30, 2012 $ 30,439,110 $ 17,696,115 $ 2,285,448
The t~tir value option was chosen to measure all financial assets and liabilities in order to mitigate volatility in reported changes in net assets.
6. Property, Plant, and Equipment and Leases
Property, plant, and equipment, net, consist of the following at June 30:
2012 2011
Land and land improvements $ 96,618,400 $ 90,36 7,090 Buildings 285,977.278 263,932,384 Fumiture and equipment I 00,817,828 81,216,646 Construction in progress I I 1
Total property. plant, and equipment 514,163,027 450,851 ,461
r .ess accumulated depreciation and amortization
Property, plant, and equipment $ .\61,214.278 $ 310.559,418
14

The University is obligated under various capital and operating leases ft1r certain property, plant, and equipment. The following schedule analyzes property, plant, and equipment under leases that have been accounted for as capital leases in the accompanying statements of financial position and included above in buildings and furniture and equipment:
2012 1
Property, plant, and equipment under capital leases $ 3,452,078 $ 4,476,190 Less accumulated amortization 1
Property, plant and equipment under capital leases, net $ 1,314,226 $ 2,155,400
------~--~------------~~---
At June 30,2012, minimum rental payments due under capital and operating leases with original tenus in excess of one year are as follows:
Capital Operating Leases Leases
Years ending June 30: 2013 $ 791,442 $ 389,241 2014 791,442 334,351 2015 197,860 284,030 2016 261,964 2017 243,399 Thereafter 1 11
Total minimum lease payments $ 1,780,744 $ 2,628,551
Less imputed interest (rates ranging from 5% through 9%)
Obligations under capital leases $ 1,667,277
Total interest expense on capital leases for the years ended June 30, 2012 and 2011 was $112,213 and $156,030, respectively. Total rent expense under operating leases was $1,083,033 and $2,365,688 for the years ended June 30, 2012 and 2011, respectively. Taxes, insurance and maintenance expenses relating to all leases are obligations of the University.
7. Deferred Revenue and Deposits
Deferred revenue and deposits consists primarily of student related charges including tuition and fees which are deferred until earned. The deferral is calculated based on number of class days used or unused. The deposits are primarily monies deposited with the university, toward a tenn for which charges have not been recorded to the individual. Deferred revenue and deposits consist of the following at June 30:
2012 2011
Deferred Other $ I ,266,828 $ 722,097 Deferred Student Fall 33,918,166 34,661,883 Deferred Student Summer 45,559,133 41,414,763 Deposits 1
Total $ 136,188.7.+8 $ 131,135,168
15

8. Liabilities under Split-Interest Agreements
The University receives gitts from donors who receive income from the assets until their deaths. These split-interest agreements consist primarily of charitable gift annuities and charitable remainder unitrusts. These agreements provide either fixed annual payments or fixed annual returns to the original donor or a designated beneticiary. The assets received from the donor are recorded at fair market value upon receipt of the gift and the liability is recorded using a discount rate retlecting expected rates of return in the marketplace and the expected lives of the donors. Fixed payout percentages range from 5% to 11.8%.
The University received contributions under split-interest agreements of approximately $3,436,000 and $ L 730,000 for the years ended June 30, 2012 and 2011, respectively.
9. Long-Term Debt
Long-term debt consists of the following at June 30:
Term note payable, due June 2013, with monthly principal and interest (at initial rate of 5% and variable prime rate adjusted monthly thereafter beginning after the 1st month) payments of$27,810 and a lump sum payment of principal and accrued interest due on maturity. The interest rate at 6/30112 was 3.25%. the note is collateralized by an airplane.
Term note payable, due July 2017, with monthly principal and interest at a rate of 7. 75%. The loan is repaid as part of the fees collected by Sodexo for dining services. Liberty University agrees to pay $0.33 per meal towards repayment ofthe loan.
Term loan with a bank collateralized by an aircraft, with an interest rate of 3. 75%, payable in monthly installments of $3,870 through December 2018.
Term loan with a bank collateralized by aircraft with an interest rate of 3. 75%, payable in monthly installments of $6,769 through July 2018.
Bond issue 2010, unsecured and issued at a premium of approximately $2 million, with various principal and interest payments due each March 1st and September 1st in amounts ranging from $464,000 to S 1,800,000 through :2025. Semi-annual sinking fund payments will be due from March 2026 through March 2041 in amounts ranging from $3,500,000 to $52,725,000. Interest rates range [rom 2.00% to 5.25%.
Uncollateralized term loan with a bank with an interest rate of prime less 0.25% (3.00% at June 30, :20 12), payable in monthly installments of $5,535 through September :2013 with a balloon payment of approximately $576,000 due October 20 I 3.
16
2012 2011
$ 2,746,799 $ 2,936,259
2,580,953 3,084,642
267,070
440,479
1:20,088,412 121,043,941
635,838 68:2,091

Term loan with a bank collateralized by an aircraft with an interest rate of 5.25%, payable in monthly installments of $1,345 through April 2021.
Tcm1 loan with a bank collateralized by personal property with an interest rate of London Interbank Otfer Rate (LIBOR) plus 1.75% with a 3.50% minimum (3.5% at June 30, 2012), payable in monthly installments of $1,199 through August 2015.
Tem1 loan with a bank collateralized by two aircraft with an interest Rate of 5.00%, payable in monthly installments of $4,354 through March 2019.
Notes payable secured by vehicles. The monthly payments are $788 with a tixed rate of 4.92% and matures May 2016.
Bond issue 2012, unsecured and issued at a discount of approximately $950,000, with interest only payments due each March 1 '1 and September I stat a tixed rate of 5.1 %. Principal is due in full in 2042.
Total long-term debt
I I 123.317
42,999 55,612
297,928 334,023
61,733 76,636
99,068,003
$ 226,343,735 $ 128,336,521
On January 19,2012 series 2012 taxable bonds were issued for $100,000,000. The proceeds of the sale of the bonds will be used by the University for tinancing costs and expenses relating to the planning, acquisition, development, constmction, renovation, improvement, equipping and installation of higher education facilities.
During the year ended June 30, 2011, the Virginia College Building Authority issued $119,705,000 of Educational Facilities Revenue Bonds Series 2010 on behalfofthe University. A portion of the proceeds from this bond issue were used to pay in tull the $30,000,000 tax-exempt bond issue from 2010 and the remainder of the tunds were used for capital building projects. The bond issues carry certain covenants based on tacility use which must be maintained by the University. At June 30, 2012, all covenants were met.
There are six certificates of deposit from Carter Bank and Trust in an amount totaling $4,221 ,617 which are pledged as collateral to secure a performance bond with the City of Lynchburg for various campus construction projects.
Between June 2011 and June 2012, 22 letters of credit in amounts ranging from $2,500 to $1,350,000 and totaling $1,744,840 have been issued on behalf of the University to local municipalities (City of Lynchburg and Campbell County) for various constmction projects. The expiration dates occur between July 2012 and June 2014.
The aggregate annual maturities of long-term debt are as follows:
Years ending June 30: 2013 2014 2015 2016 2017 Thcreatler
Total
17
$
$
5,541,802 3,438,081 2,918,150 3,008,960 3,008,330
12
226,343,735

Interest on long-term debt amounted to $3,822,883 and $2,787,514 for the years ended June 30, 2012 and 2011, respectively.
10. Net Assets Released from Restrictions
Net assets are released from donor restrictions by incurring expenses satisfying the restricted purpose or by the occurrence of other events specified by donors. Net assets restricted for the construction of a building are released when the building is placed in service. Total net assets released or reclassitied were $836,234 and $1,024,538 for the years ended June 30,2012 and 2011, respectively.
ll. Net Assets
The amounts included as temporarily restricted net assets at June 30 consist of the following:
Scholarships Split interest agreement funds Construction and improvements
Temporarily restricted net assets
$
2012
96,391 $ 3,318,046 1,424,845
4,839,282 $
2011
259,032 1,607,249
575,745
2,442,026
The amounts included as permanently restricted net assets at June 30 consist of endowment funds to be held in perpetuity and amounts which have been permanently restricted by the donor under charitable remainder unitrust agreements. The related income, based on donor-imposed restrictions, is to be used as follows:
Scholarships Religion department Endowment tor church planting Grounds improvement General University use
Permanently restricted net assets
12. Liberty University Endowments
s
$
2012
5,353,142 $ 32,075
113,121 3,944
3,030,192
8,532,474 $
2011
4,371,180 32,075
103,047 3,944
2,716,971
7,227,217
The University's endowment consists of 80 individual funds. The endowment includes both donorrestricted endowment funds and quasi-endowment funds. As required by generally accepted accounting principles (GAAP), net assets associated with these endowment funds are classitied and reported based on the existence or absence of donor-imposed restrictions.
At June 30, 2012, the endowment net asset composition by type of fund was as follows:
Donor-restricted endowments Quasi-endowments
$
Unrestricted
$
IS
Temporarily Restricted
334,476 $
Permanently Restricted Total
8,297,687 s 8,632, 163 I I
14

At June 30, :2011, the ..:ndowment net asset composition by type of fund was as follows:
Unrestticted Temporarily Restricted
Pennanently Restricted Total
Donor-restricted endowments Quasi-endowments
$ $ 249,301 $ 6,949,21 t $ 7,198,512
$ 121
The management of donor-restricted endowment funds is governed by state law under the Uniform Prudent Management of Institutional Funds Act (UPMIF A) as adopted by the Virginia state legislature in 2008. The law gives guidance for investment and spending practices, giving consideration for donor-intent and the organization's overall resources and charitable purpose. Based on its interpretation of the law and in compliance with donor intent, the University classities as permanently restricted net assets (a) the original value of gifts donated to the permanent endowment, (b) the original value of subsequent gifts to the permanent endowment, and (c) accumulations to the permanent endowment made in accordance with the direction of the applicable donor gift instrument at the time the accumulation is added to the fund. The portion of the donor-restricted endowment that is not classified as permanently restricted net assets is classitied as temporarily restricted net assets until those amounts are appropriated for expenditure. The University appropriates amounts for expenditure based upon accumulated earnings in the funds and donor requirements. The primary objective is to maximize total return. The University utilizes diversitied investment classes that provide the opportunity to achieve the return objectives without exposing the funds to unnecessary risk.
A summary of the activity in endowment tunds for the year ended June 30, 2012 is as follows:
Temporarily Permanently Unrestricted Restricted Restricted Total
Endowment net assets, beginning of year $ 46,933,609 $ 249,301 $ 6,949,211 $ 54,132,121
Investment return: Investment income 2,199,854 133,443 38,483 2,371,780
Net realized and unrealized loss (275,738) (2,960) (1,591) (280,289)
Total investment return t 16
Contributions 1' 165,363 1,311,584 2,476,947
Other changes: Scholarship awards
Endowment net assets, end of year $ 50,014,451 s 334,476 $ 8.297.687 $ 58,646,614
All of the above temporarily restricted net assets are from purpose-restricted endowments.
19

A summary of the activity in endowment funds tor the year ended June 30, 20 II is as to !lows:
Temporarily Pennanently Unrestricted Restricted Restricted Total
Endowment net assets, beginning of year $
Investment return: Investment income 3,076,567 121,689 68,024 3,266,280
Net realized and unrealized gain (loss) 191 269
Total investment return 131
Contributions 191,833 191,833
Other changes: Scholarship awards
Endowment net assets, end of year $ 46,933,609 $ 249,301 $ 6,949,211 $ 54,132,121
All of the above temporarily restricted net assets are from purpose-restricted endowments.
13. Employee Benefit Plans
The University participates in defined contribution retirement annuity plans with TIAA-CREF, Fidelity Investments, Guidestone tor all faculty, start: and hourly employees. Before January 1, 2012, the University matched 5% of a plan participant's contributions. In order to receive the match, a participant had to contribute at least 5% of gross pay to the plan. Participants could make contributions in excess of 5%, but these contributions were not matched by the University. As of January 1, 2012, the University began matching plan participants' contributions up to 5% of gross pay. Effective January 1, 2012, the University further amended the plan to include a five year vesting schedule tor new eligible staff employees. Eligible faculty employees and all participating employees prior to January 1, 2012 are tully vested at enrollment. The University contributed $2,956,856 and $2,756,652 under these plans during the years ended June 30, 2012 and 2011, respectively.
The University is self-insured tor employee health care claims up to the lesser of $125,000 per covered individual or an aggregate amount of approximately $14,900,000 per year. The University has purchased coverage from a commercial insurance carrier to provide tor any claims in excess of these amounts. At June 30, 2012 and 20 II, the University had provided an accrual of $1,645,757 and $1,388,392, respectively, tor claims incurred but not paid based on management's estimate of the University's self-insured liability. Participants are tully vested at enrollment. For the years ended June 30. 2012 and 2011, the University incurred claims, premium expenses, and administrative fees related to its health care plan totaling $12,411,276 and $10,894,915, respectively.
14. Compensated Absences
The University provides paid personal/sick days to all henetited tull-time employees at a rate of five days per year. The policy does not allow for the accumulation of sick leave. Unused personal sick day benefits are not paid to employees while employed or upon tcnnination.
20

The University provides tor vacation days accrued based on years of employment and paid at the employee's base pay rate at the time of vacation. The policy does not allow tor carryover or payment of unused days into the next calendar year and unused days are not paid to employees while employed or upon tennination
15. Related Party Transactions
The University provides printing, postal, telephone, custodial and security services to related parties. The University has recorded receivables in connection with these services in its statements of financial position for the years ended June 30 as tollows:
Liberty Christian Academy Liberty Godparent Home Thomas Road Baptist Church
$
$
2012
759,368 $
66,325 754,589
1,580,282 $
2011
659,275 44,763
639,964
1,344,002
Management believes the tees received from, and paid to, related parties during 2012 and 2011 approximated market rates and, accordingly, were consistent with those that would be paid in an arm's-length transaction. Management anticipates that similar transactions with related parties will occur in 2012.
During the year ended June 30, 2011, Thomas Road Baptist Church (TRBC) donated rent related to space occupied by the University in the amount of$710,326. The University purchased the property from TRBC in December 20 l 0, therefore, there are no transactions related to this property for the year ended June 30, 2012.
During the year ended June 30, 2012, the University made donations of $200,000 to Lynchburg Christian Academy (LCA). During the year ended June 30, 2011 the University made donations to TRBC in the amount of $60,000.
16. Commitments and Contingencies
The University is subject to certain claims that arise in the ordinary course of operations. Many of these claims are in the early stages of the evaluation process. Accordingly, it is not possible at the present time to estimate the ultimate legal and financial liability, if any, with respect to certain lawsuits. rn the opinion of management, after consultation with counsel, adequate insurance exists, so the eventual outcome of such claims is not expected to have a material adverse effect on the University's financial position or its operations. However, depending on the amount and timing of such resolution, an unfavorable resolution of some or all of these matters could materially affect the future results of operations or cash t1ows in a particular period.
The University's students receive a substantial amount of support from tederal and state student tinancial assistance programs. A significant reduction in the level of this support, if this were to occur, may have an adverse effect on the University's programs and activities. Amounts received and expended by the University under various tedcral and state programs arc subject to audit by various tederal and state agencies and therefore subject to adjustment.
In September 20 II the University was awarded a grant by the Virginia Tobacco Commission for S 12 million. This grant is to be matched by the University and is for the purpose of establishing a School of
21

17.
Osteopathic Medicine and to expand the existing School of Health Sciences. The school will be built in Campbell County adjacent to the University's main campus. The first phase of the project is expected to be completed by fall 2013.
There are several commitments and contingencies related to the University's construction projects, which are listed below. Listed by project is the entire estimated project cost, contract amount in place, remainder of a specific contract related to the project to complete and total remainder of project to be completed.
Contract in Contract to Project to Project Estimated Cost Place Complete Complete
Jerry Falwell Library $ 60,000,000 plus $ 49,281,991 $ 46,276,026 $ 53,904,445 Baseball Complex 16,000,000 7,473,931 5,386,592 14,366,298 Basketball Practice Facility 7,500,000 6,070,755 4,045,252 5,240,183 Candler's Mt. lM Fields 3,500,000 N/A N/A 3,392,511
Other Sources
For the years ended June 30, 2012 and 20 II, the University had other sources income of $30,491,048 and $31,300,957 respectively. These amounts include various non-mandatory student fees, tines, vehicle registration fees, sales and commissions, rental income, advertising income, and various sporting event related income.
18. Subsequent Events
In October 2012, the University was awarded a grant by the Virginia Tobacco Commission for $8.5 million. This grant is for Phase II of the Liberty University Center for Medical and Health Sciences and is to be used for the purchase of equipment.
Subsequent to June 30, 2012, the University purchased, with cash the Wingate Hotel, Lynchburg, Virginia for approximately $9 million. At the present time, the University plans to continue operating this property as a Wingate Hotel. The University has also entered into contracts tor the construction of two new educational facilities at a cost of approximately $41 million as well as contracts to purchase two additional properties at a cost of approximately $19.5 million to be used tor administrative purposes and student housing.
* * * * *
T)

Supplemelltary Information

Liberty Univer.,'ity, Inc.
Statements of Financilll Position
June 2012
Assets
Cash and cash equivalents $ 383.606,590 Accounts receivable - less allowance tor doubtful
accounts of $17.214,291 and $7,920.270 respectively 29,564,672 Accounts receivable from related organizations 1.5R0.282 Notes receivable 1,605,475 Contributions receivable, net 428,200 Other prepaid expenses and other assets 9,081,030 Investments, at fair value 529,413,461 Property, plant, and equipment, net 327,890,824
Total assets $ I ,283,170,534
Liabilities and Net Assets Liabilites: Accounts payable- vendors $ 27,406,293 Accounts payable- other 7,308,391 Accrued liabilities 12,839,163 Accrued interest payable 3,817,771 Deferred revenue and deposits 135,332,947 Gift annuities payable 17,696,115 Liability under split interest agreements 2,285,448 Obligations under capital leases 1,667,277 Long-term debt 224,545,900
Total liabilities 432,899,305
Net assets Unrestricted 836,899,471 Temporarily restricted 4,839,282 Permanently restricted 8,532,476
Total net assets 1.229
Total liabilities and net assets $ I ,283,170,534
1111! uccomptmring notes ,tre wz integral part o/rhese jinancial statements.
23
2011
403,164,042
95,622,788 lA53,240 1,465,896
560,000 8,500,84R
156,000,759 277,985,801\
944,753,381
14,848,541 6,235,199 7,299,043 3,048,713
130,761,113 15,649,787 2,265.483 2,384,937
127,141,487
309,634,303
625,844,248 2,372,023 6,902,807
119.078
944,753,381