pillar 3 disclosure report quarter ended march 2020
TRANSCRIPT

Pillar 3 Disclosure Report
Quarter ended March 2020
Maybank Singapore Limited
Incorporated in Singapore
Company Registration Number: 201804195C

TABLE OF CONTENTS
1 INTRODUCTION ...................................................................................................... 1
2 CAPITAL ADEQUACY ................................................................................................ 2
2.1 Key Metrics ..................................................................................................... 3
3 COMPOSITION OF CAPITAL........................................................................................ 5
3.1 Main Features of Regulatory Capital Instruments ....................................................... 5
4 LEVERAGE RATIO ................................................................................................... 8
4.1 Leverage Ratio ................................................................................................. 8
4.2 Leverage Ratio Common Disclosure Template ........................................................... 8
5 OVERVIEW OF RISK-WEIGHTED ASSETS (“RWA”) .......................................................... 10
6 CREDIT RISK ........................................................................................................ 12
6.1 IRBA – RWA Flow Statement for Credit Risk Exposures ............................................... 12

1
1 INTRODUCTION
The Monetary Authority of Singapore (“MAS”) has designated Maybank Singapore Limited (“MSL”) as a
Domestic Systemically Important Bank (“D-SIB”) in Singapore since 2015. As such, MSL is subject to the
reporting of MAS Notice 637 Risk Based Capital Adequacy Requirements for Banks Incorporated in
Singapore.
The following disclosures are made pursuant to Notice 637 “Notice on Risk Based Capital Adequacy
Requirements for Banks Incorporated in Singapore” (“MAS Notice 637”) issued by MAS.
MSL recognises the importance of MAS Notice 637 in promoting market discipline by requiring disclosures
of key information relating to regulatory capital and risk exposures on a consistent and comparable basis
that will enable stakeholders to better understand and assess a reporting bank’s business and risk profile
vis-à-vis other banks.
For the purpose of calculating its risk-weighted assets, MSL applies the Internal Ratings-Based Approach
(“IRBA”) and Standardised Approach (“SA”) to relevant credit exposures to ascertain its credit risk-
weighted assets. For market risk and operational risk, MSL applies the SA and Basic Indicator Approach
to compute the market risk-weighted assets and operational risk-weighted assets respectively.
The numbers in this document are presented in Singapore dollars and rounded to the nearest million,
unless otherwise stated.

2
2 CAPITAL ADEQUACY
MSL’s approach to capital management is driven by its strategic objectives and takes into account all
relevant regulatory, economic and commercial environments in which MSL and the Maybank Group
operate. MSL regards having a strong capital position as essential to the bank’s business strategy and
competitive position. As such, implications on the bank’s capital position are taken into account by the
Board and senior management prior to implementing any major business decisions in order to preserve
the bank’s overall capital strength.
The quality and composition of capital are key factors in the Board and senior management’s evaluation
of the bank’s capital adequacy position. MSL places strong emphasis on the quality of its capital and
accordingly holds a higher amount of its capital in the form of common equity which is permanent and
has the highest loss absorption capability on a going concern basis.
The Board maintains oversight of the regulatory capital of MSL in line with regulatory requirements under
the MAS Notice 637 and expectations of various stakeholders such as regulators. To date, MSL has
complied with all externally-imposed regulatory capital requirements throughout the financial period.

3
2.1 Key Metrics
The following table provides an overview of the key prudential regulatory metrics related to regulatory
capital, leverage ratio and liquidity standards for MSL.
The Board has approved a capital restructuring with share buyback of S$400 million and issuance of Tier
2 subordinated debt of S$500 million. The exercise has been completed in March 2020. The share
buyback, coupled with a dividend payout, has resulted in a lower CET1 capital in March 2020.
SGD million
(a) (b) (c) (d) (e)
31 Mar 2020
31 Dec 2019
30 Sep 2019
30 Jun 2019
31 Mar 2019
Available amount (amounts)
1 CET1 capital 2,003 2,517 2,381 2,385 2,413
2 Tier 1 capital 2,003 2,517 2,381 2,385 2,413
3 Total capital 2,544 2,559 2,426 2,431 2,456
Risk weighted assets (amounts)
4 Total RWA 13,714 13,836 14,549 14,175 14,288
Risk-based capital ratios as a percentage of
RWA
5 CET1 ratio (%) 14.6 18.2 16.4 16.8 16.9
6 Tier 1 ratio (%) 14.6 18.2 16.4 16.8 16.9
7 Total capital ratio (%) 18.5 18.5 16.7 17.1 17.2
Additional CET1 buffer requirements as a
percentage of RWA
8 Capital conservation buffer requirement (2.5%
from 2019) (%) 2.5 2.5 2.5 2.5 2.5
9 Countercyclical buffer requirement (%) 0.0 0.0 0.0 0.0 0.0
10 Bank G-SIB and/or D-SIB additional requirements
(%) - - - - -
11 Total of bank CET1 specific buffer requirements
(%) (row 8 + row 9 + row 10) 2.5 2.5 2.5 2.5 2.5
12 CET1 available after meeting the Reporting
Bank’s minimum capital requirements (%) 6.6 8.5 6.7 7.1 7.2
Leverage Ratio (SGD million / %)
13 Total Leverage Ratio exposure measure 39,110 39,882 38,832 36,789 37,375
14 Leverage Ratio (%) (row 2 / row 13) 5.1 6.3 6.1 6.5 6.5
Liquidity Coverage Ratio (SGD million / %)1
15 Total High Quality Liquid Assets 16,611 15,792 13,700 12,916 13,182
16 Total net cash outflow 11,162 12,527 11,797 11,451 13,578
17 Liquidity Coverage Ratio (%) 153 129 117 113 97
1 MSL is subject to the reporting of MAS Notice 649 Liquidity Coverage Ratio on Country Group basis (consisting of Malayan Banking Berhad, Singapore Branch and Maybank Singapore Limited). Data presented are based on simple averages of daily observations for the respective quarter.

4
SGD million
(a) (b) (c) (d) (e)
31 Mar 2020
31 Dec 2019
30 Sep 2019
30 Jun 2019
31 Mar 2019
Net Stable Funding Ratio (SGD million / %)2
18 Total available stable funding 39,987 41,109 40,192 37,323 37,397
19 Total required stable funding 34,439 34,319 34,816 35,357 35,126
20 Net Stable Funding Ratio (%) 116 120 115 106 106
2 MSL is subject to the reporting of MAS Notice 652 Net Stable Funding Ratio on Country Group basis (consisting of Malayan Banking Berhad, Singapore Branch and Maybank Singapore Limited).

5
3 COMPOSITION OF CAPITAL
3.1 Main Features of Regulatory Capital Instruments
1 Issuer Maybank Singapore Limited Maybank Singapore Limited
2 Unique identifier (eg CUSIP, ISIN or Bloomberg identifier for private placement)
NA BBG00ST505V9
3 Governing law(s) of the instrument Singapore Singapore
4 Transitional Basel III rules Common Equity Tier 1 Tier 2
5 Post-transitional Basel III rules Common Equity Tier 1 Tier 2
6 Eligible at solo/group/group&solo Group and Solo Group and Solo
7 Instrument type (types to be specified by each jurisdiction) Ordinary Shares Tier 2 Subordinated Notes
8 Amount recognised in regulatory capital (Currency in millions, as of most recent reporting date)
S$2,000 million S$500 million
9 Par value of instrument NA NA
10 Accounting classification Shareholder's Equity Liability – amortised cost
11 Original date of issuance 05 November 2018 26 March 2020
12 Perpetual or dated Perpetual Dated
13 Original maturity date No maturity 26 March 2030
14 Issuer call subject to prior supervisory approval No Yes
15 Optional call date, contingent call dates and redemption amount NA 26 March 2025
16 Subsequent call dates, if applicable NA NA
Coupons / dividends
17 Fixed or floating dividend/coupon NA Fixed
18 Coupon rate and any related index NA 3.70%, subject to reset if call option is not exercised in accordance with the Subscription Agreement
19 Existence of a dividend stopper NA No
20 Fully discretionary, partially discretionary or mandatory Fully discretionary Mandatory
21 Existence of step up or other incentive to redeem NA No
22 Noncumulative or cumulative NA NA
6
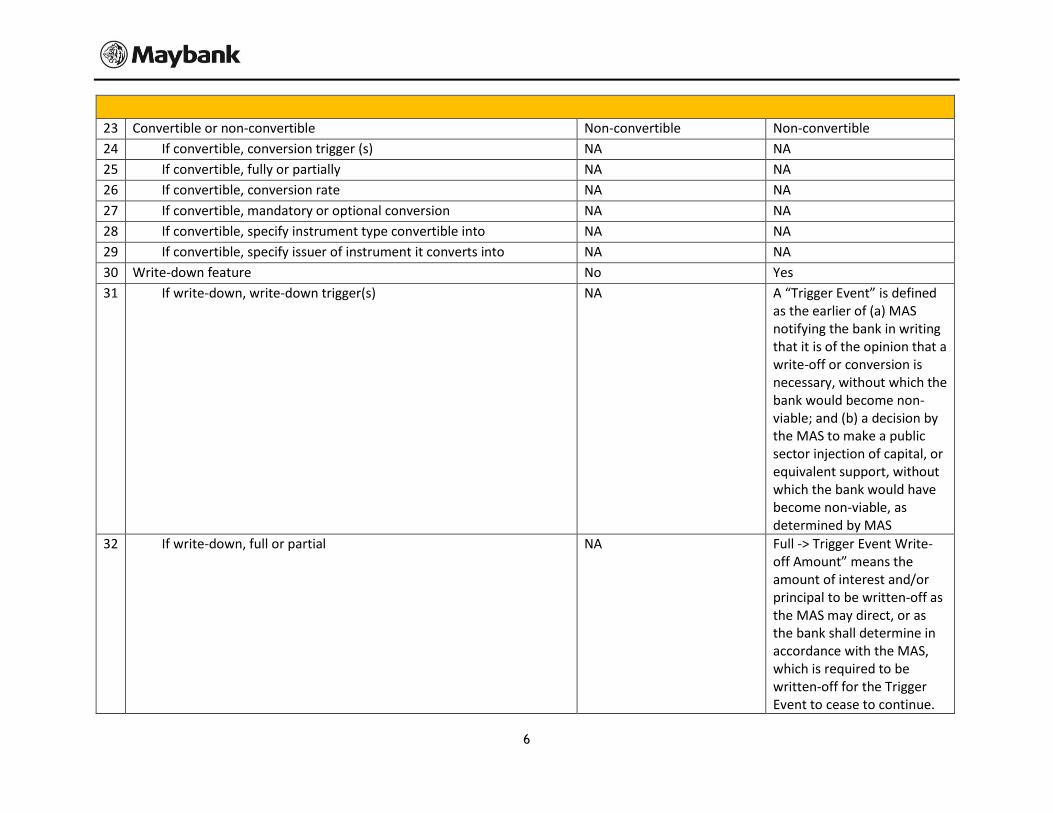
23 Convertible or non-convertible Non-convertible Non-convertible
24 If convertible, conversion trigger (s) NA NA
25 If convertible, fully or partially NA NA
26 If convertible, conversion rate NA NA
27 If convertible, mandatory or optional conversion NA NA
28 If convertible, specify instrument type convertible into NA NA
29 If convertible, specify issuer of instrument it converts into NA NA
30 Write-down feature No Yes
31 If write-down, write-down trigger(s) NA A “Trigger Event” is defined as the earlier of (a) MAS notifying the bank in writing that it is of the opinion that a write-off or conversion is necessary, without which the bank would become non-viable; and (b) a decision by the MAS to make a public sector injection of capital, or equivalent support, without which the bank would have become non-viable, as determined by MAS
32 If write-down, full or partial NA Full -> Trigger Event Write-off Amount” means the amount of interest and/or principal to be written-off as the MAS may direct, or as the bank shall determine in accordance with the MAS, which is required to be written-off for the Trigger Event to cease to continue.

7
For the avoidance of doubt, the write-off will be effected in full even in the event that the amount written-off is not sufficient for the Trigger Event to cease to continue
33 If write-down, permanent or temporary NA Permanent
34 If temporary write-down, description of write-up mechanism NA NA
35 Position in subordination hierarchy in liquidation (specify instrument type immediately senior to instrument in the insolvency creditor hierarchy of the legal entity concerned)
Represents the most subordinated claim upon occurrence of liquidation of the bank
Subject to the insolvency laws of Singapore and other applicable laws, in the event of a winding-up of the bank, the rights of the Noteholders to payment of principal and interest on the Notes and any other obligations in respect of the Notes: (i) are subordinated in right of payment to the claims of all unsubordinated creditors of the Issuer, (ii) rank senior in right of payment to the rights and claims of creditors in respect of Subordinated Indebtedness, and (iii) rank pari passu in right of payment with the rights and claims of creditors in respect of Tier 2 capital securities.
36 Non-compliant transitioned features No No
37 If yes, specify non-compliant features NA NA

8
4 LEVERAGE RATIO
The leverage ratio has been introduced under the Basel III framework as a non-risk based backstop limit
to supplement the risk-based capital requirements. Its primary aim is to constrain the build-up of excess
leverage in the banking sector.
The bank’s leverage ratio as at March 2020 has decreased by 1.2 percentage point to 5.1% as compared
to the previous quarter mainly due to capital restructuring. The ratio is well above the 3% regulatory
minimum ratio prescribed by MAS, effective 1 January 2018.
4.1 Leverage Ratio
SGD million 31 Mar 2020
31 Dec 2019
Capital and Total exposures
Tier 1 Capital 2,003 2,517
Total Exposures 39,110 39,882
Leverage Ratio (%)
Leverage ratio 5.1 6.3
4.2 Leverage Ratio Common Disclosure Template
The following table provides a detailed breakdown of the components of the leverage ratio denominator.
SGD million Amount
Item 31 Mar 2020
31 Dec 2019
Exposure measures of on-balance sheet items
1 On-balance sheet items (excluding derivative transactions and SFTs, but including on-balance sheet collateral for derivative transactions or SFTs)
31,422 32,309
2 Asset amounts deducted in determining Tier 1 capital (23) (23)
3 Total exposure measures of on-balance sheet items (excluding derivative transactions and SFTs)
31,399 32,286
Derivative exposure measures
4 Replacement cost associated with all derivative transactions (net of the eligible cash portion of variation margins)
62 35
5 Potential future exposure associated with all derivative transactions
25 50
6 Gross-up for derivative collaterals provided where deducted from the balance sheet assets in accordance with the Accounting Standards
- -
7 Deductions of receivables for the cash portion of variation margins provided in derivative transactions
- -
8 CCP leg of trade exposures excluded - -
9 Adjusted effective notional amount of written credit derivatives - -

9
SGD million Amount
Item 31 Mar 2020
31 Dec 2019
10 Further adjustments in effective notional amounts and deductions from potential future exposures of written credit derivatives
- -
11 Total derivative exposure measures 87 85 SFT exposure measures
12 Gross SFT assets (with no recognition of accounting netting), after adjusting for sales accounting
4,799 5,412
13 Eligible netting of cash payables and cash receivables - -
14 SFT counterparty exposures * 39
15 SFT exposure measures where a Reporting Bank acts as an agent in the SFTs
- -
16 Total SFT exposure measures 4,799 5,451 Exposure measures of off-balance sheet items
17 Off-balance sheet items at notional amount 10,965 10,051
18 Adjustments for calculation of exposure measures of off-balance sheet items
(8,140) (7,991)
19 Total exposure measures of off-balance sheet items 2,825 2,060 Capital and Total exposures
20 Tier 1 capital 2,003 2,517
21 Total exposures 39,110 39,882 Leverage ratio
22 Leverage ratio 5.1% 6.3%
* represents amounts of less than S$0.5 million
10
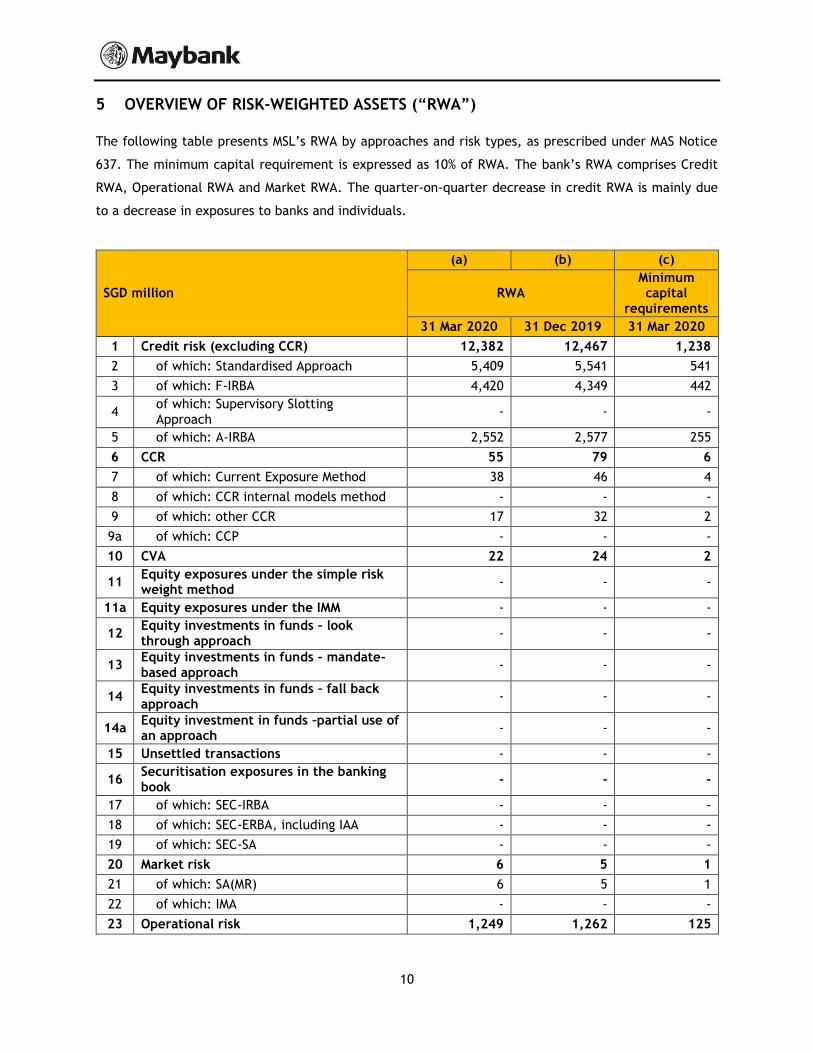
5 OVERVIEW OF RISK-WEIGHTED ASSETS (“RWA”)
The following table presents MSL’s RWA by approaches and risk types, as prescribed under MAS Notice
637. The minimum capital requirement is expressed as 10% of RWA. The bank’s RWA comprises Credit
RWA, Operational RWA and Market RWA. The quarter-on-quarter decrease in credit RWA is mainly due
to a decrease in exposures to banks and individuals.
SGD million
(a) (b) (c)
RWA Minimum capital
requirements
31 Mar 2020 31 Dec 2019 31 Mar 2020
1 Credit risk (excluding CCR) 12,382 12,467 1,238
2 of which: Standardised Approach 5,409 5,541 541
3 of which: F-IRBA 4,420 4,349 442
4 of which: Supervisory Slotting Approach
- - -
5 of which: A-IRBA 2,552 2,577 255
6 CCR 55 79 6
7 of which: Current Exposure Method 38 46 4
8 of which: CCR internal models method - - -
9 of which: other CCR 17 32 2
9a of which: CCP - - -
10 CVA 22 24 2
11 Equity exposures under the simple risk weight method
- - -
11a Equity exposures under the IMM - - -
12 Equity investments in funds – look through approach
- - -
13 Equity investments in funds – mandate-based approach
- - -
14 Equity investments in funds – fall back approach
- - -
14a Equity investment in funds –partial use of an approach
- - -
15 Unsettled transactions - - -
16 Securitisation exposures in the banking book
- - -
17 of which: SEC-IRBA - - -
18 of which: SEC-ERBA, including IAA - - -
19 of which: SEC-SA - - -
20 Market risk 6 5 1
21 of which: SA(MR) 6 5 1
22 of which: IMA - - -
23 Operational risk 1,249 1,262 125

11
SGD million
(a) (b) (c)
RWA Minimum capital
requirements
31 Mar 2020 31 Dec 2019 31 Mar 2020
24 Amounts below the thresholds for deduction (subject to 250% risk weight)
- - -
25 Floor adjustment - - -
26 Total 13,714 13,836 1,371

12
6 CREDIT RISK
6.1 IRBA – RWA Flow Statement for Credit Risk Exposures
The table below presents the drivers of movement in Credit RWA under IRBA for the quarter.
The bank’s RWAs increased by S$46 million quarter-on-quarter mainly driven by a deterioration in the
asset quality of corporate exposures.
SGD million (a)
RWA amounts
1 RWA as at end of previous quarter 6,927
2 Asset size (31)
3 Asset quality 64
4 Model updates -
5 Methodology and policy -
6 Acquisitions and disposals -
7 Foreign exchange movements 12
8 Other -
9 RWA as at end of quarter 6,973