annual disclosure presentation, 2016 -...
TRANSCRIPT

NCM_ADP_2016 05.11.2017 1
Annual Disclosure Presentation, 2016 Niemann Capital Management, Inc. claims compliance with the Global Investment Performance Standards (GIPS®) and has prepared and presented this report in compliance with the GIPS standards. Niemann Capital Management, Inc. has been independently verified for the period April 2, 1994 through December 31, 2016 by Ashland Partners & Company LLP. A copy of the verification report(s) is/are available upon request. Verification assesses whether (1) a firm has complied with all the composite construction requirements of the GIPS standards on a firm-wide basis and (2) the firm’s policies and procedures are designed to calculate and present performance in compliance with the GIPS standards. Verification does not ensure the accuracy of any specific composite presentation. Niemann Capital Management, Inc. is a registered investment adviser. The firm maintains a complete list and description of composites, which is available upon request. As of December 31, 2016, NCM had total discretionary assets under management of $188,542,367 and the total amount of assets managed based on non-discretionary model portfolios provided by NCM was approximately $274,194,000. This additional total firm asset information is provided as supplemental information to the GIPS disclosure presentations contained in the following pages of this document. Results are based on fully discretionary accounts under management, including those accounts no longer with the firm. As of January 1, 2003, Composite policy requires the temporary removal of any portfolio incurring a client initiated significant cash inflow or outflow of 10% or greater of portfolio assets. The temporary removal of such an account occurs at the beginning of the month in which the significant cash flow occurs and the account re-enters the composite the first full month after the cash flow. Additional information regarding the treatment of significant cash flows is available upon request. Past performance is not indicative of future results. The U.S. Dollar is the currency used to express performance. Returns are presented net of management fees and include the reinvestment of all income. Net of fee performance was calculated using actual management fees and ABP fees charged by Schwab and Fidelity as defined and described below. The annual composite dispersion is an equal-weighted standard deviation calculated for the accounts in the composite the entire year. Policies for valuing portfolios, calculating performance, and preparing compliant presentations are available upon request.
The management fee schedule is as follows: 2.30% on the first $500,000; 1.65% on the next $500,000; 1.10% on the next $2,000,000 and 1.00% on all assets over $3 million. Actual investment advisory fees incurred by clients may vary. Additionally, the following composites contain one or more accounts which are charged a performance-based fee: Risk Managed Mutual Fund Composite, Global Opportunity Mutual Fund Composite, and Dynamic Mutual Fund Composite. For the Tactical Global Bond strategy the annual fees are 1.80%. This strategy does not offer tiered fee breaks. Niemann Analytics, Inc., an SEC-registered investment adviser that is owned by Donald Niemann, NCM’s founder, controlling owner and chief investment officer, is a sub-adviser to NCM. This arrangement does not increase the fees that NCM charges clients.

NCM_ADP_2016 05.11.2017 2
Each of NCM’s clients selects either a subsidiary of Fidelity Investments (“Fidelity”) or a division of Charles Schwab & Co. (“Schwab”) as the custodian for accounts that NCM manages for that client. Fidelity or Schwab charges each such client a flat asset-based fee (the “ABP Fee”) that is generally based on the amount of assets in that account, in lieu of transaction-based commissions, for most brokerage services that Fidelity or Schwab, as the case may be, provide to that account. The ABP Fee schedules of Fidelity and Schwab are below.
Fidelity Account Assets: From 0.00 To 500,000.00 0.20% Plus From 500,000.01 To 1,000,000.00 0.15% Plus From 1,000,000.01 To 2,000,000.00 0.10% Plus From 2,000,000.01 To 3,000,000.00 0.07% Plus From 3,000,000.01 To 5,000,000.00 0.05% Plus Amounts over 5,000,000 0.01% Fidelity does not charge a minimum ABP Fee. Schwab Account Assets: From 0.00 To 500,000 0.20% Plus From 500,001 To 1,000,000 0.15% Plus From 1,000,001 To 2,000,000 0.10% Plus From 2,000,001 To 3,000,000 0.07% Plus From 3,000,001 To 5,000,000 0.05% Plus Amounts over 5,000,000 0.03% Schwab charges a minimum annual ABP Fee of $250.

NCM_ADP_2016 05.11.2017 3
Annual Disclosure Presentation 2016 Risk Managed Sector Composite
Total Firm
Year Assets U.S. Dollars Number of Composite Custom Composite Composite 3 Yr Benchmark 3 Yr Non Fee Wrap Fee
End (millions) (millions) Accounts (net of fees)Benchmark Dispersion Ex-Post Std Dev Ex-Post Std Dev Based % Based %
2016 189 4.3 40 1.61% 18.66% 1.16% 11.43% 13.20% 9.82% 3.62%
2015 159 4.6 42 0.03% ( 6.10%) 0.83% 12.31% 11.62% 8.41%
2014 181 5.4 42 3.90% 4.68% 0.77% 11.17% 10.61% 7.04%
2013 188 5.0 40 31.43% 29.04% 0.90% 10.90% 14.80% 1.28%
2012 209 7.0 62 3.86% 15.26% 0.50% 9.90% 18.20% 2.33%
2011 542 12.0 132 (11.27%) ( 5.10%) 0.60% 12.50% 22.40% 2.35%
2010 1,464 23.0 232 0.20% 20.63% 0.60% 13.00% 26.90% 1.40%
2009 1,524 27.0 276 10.31% 42.69% 0.60% 1.33%
2008 1,045 7.0 104 (11.81%) (44.23%) 1.10% 2.59%
2007 1,170 2.0 13 12.78% 8.18% 0.90% 2.12%
2006 958 2.0 13 13.25% 13.44% 0.90% 1.90%
2005 681 2.0 13 21.27% 13.28% 1.10% 1.81%
2004 488 1.0 15 12.19% 15.70% 0.70% 1.51%
2003 352 1.0 19 25.86% 36.24% 0.90% 1.48%
2002 233 1.0 23 ( 2.33%) (17.94%) 0.70% 1.32%
2001 174 1.0 28 (16.38%) ( 6.67%) 1.00% 3.07%
2000 116 4.0 28 14.61% 9.11% 1.40% 15.84%
1999 84 4.0 29 29.18% 24.55% 1.50% 13.23%
1998 44 3.0 30 20.72% 14.47% 1.20% 24.39%
1997 27 3.0 30 8.26% 21.30% 2.20% 26.03%
1996 14 2.0 27
Composite Assets Annual Performance Results
Risk Managed Sector Composite was created January 24, 1996. Risk Managed Sector Composite contains fully discretionary accounts with a moderate risk strategy that invests in a mixture of equity funds, bond funds, and money market funds. Utilizing an approach designed to seek to moderate risk exposure, the objective of the Risk Managed Sector strategy is to identify and focus portfolio assets into industry sectors expected to perform best in the current market cycle. It’s important to note that sectors can be volatile, and as powerful fundamentals unfold, these funds will often dominate the lists of largest gainers and losers. To mitigate this volatility, the Risk Managed Sector strategy emphasizes capital preservation over investment return and will rotate to cash in adverse market conditions. Risk Managed Sector strategy can be fully invested, partially in cash or completely in cash. The Risk Managed Sector strategy is typically allocated into 5 to 10 positions from a variety of both domestic and international sector funds. This is a moderate risk strategy that seeks equity-type returns with reduced volatility. For comparison purposes, the Risk Managed Sector Composite is measured against a Custom Benchmark that we construct for each product universe we manage by assuming an equal investment in each of the choices available within that universe (except money market and fixed accounts). Further, the “portfolio” comprising the custom benchmark is rebalanced daily, which creates the un-weighted return of the universe itself. We believe that this benchmark is the yardstick against which measurement of performance and risk makes sense. As of January 1, 2004, the Custom Benchmark has been restated historically to exclude funds that are closed to new investors and funds not traded by Niemann Capital Management, Inc. This benchmark has been changed to improve comparability. Further information regarding this benchmark is available upon request. Some accounts pay an all-inclusive bundled fee based on a percentage of assets under management. Other than brokerage commissions this fee may include investment management, portfolio monitoring, consulting services, and in some cases, custodial services. Fee schedules are provided by independent sponsors and are available upon request from the respective program sponsor. Bundled fee accounts make up a percentage of composite assets for each year end as listed. Results are net of actual advisory fees and assume all dividends and capital gains are reinvested. Please see disclosure on page 1 of this document.

NCM_ADP_2016 05.11.2017 4
Risk Managed Composite Total Firm
Year Assets U.S. Dollars Number of Composite Custom Composite Composite 3 Yr Custom 3 Yr Non Fee Wrap Fee
End (millions) (millions) Accounts (net of fees) Benchmark Dispersion Ex-Post Std Dev Ex-Post Std Dev Based Based
2016 189 38 250 6.82% 10.25% 0.68% 11.61% 11.06% 2.11% 2.16%
2015 159 35 213 ( 0.67%) ( 2.53%) 0.62% 12.54% 10.21% 2.25%
2014 181 34 179 8.18% 4.50% 0.6% 11.5% 9.5% 2.16%
2013 188 31 151 43.56% 29.27% 1.5% 11.7% 13.3% 1.01%
2012 209 28 173 3.62% 13.61% 0.5% 10.7% 16.7% 0.53%
2011 542 62 400 (13.21%) ( 3.03%) 0.4% 12.5% 20.1% 0.38%
2010 1,464 171 786 ( 1.22%) 19.50% 0.5% 13.1% 23.1% 0.21%
2009 1,524 201 880 17.49% 31.66% 0.6% 5.11%
2008 1,045 185 1,015 (18.16%) (37.18%) 0.4% 0.11%
2007 1,170 219 981 7.59% 7.14% 0.5% 0.13%
2006 958 207 961 9.12% 12.05% 0.5% 0.23%
2005 681 187 967 6.42% 6.86% 0.8% 0.18%
2004 488 147 679 9.93% 12.57% 0.9% 0.46%
2003 352 92 476 29.24% 31.28% 1.1% 0.17%
2002 233 69 479 ( 7.92%) (21.64%) 0.7% 0.91%
2001 174 30 121 5.35% ( 9.85%) 0.9% 2.30%
2000 116 5 37 29.50% ( 0.41%) 1.5% 2.07%
1999 84 3 23 27.50% 25.19% 1.1% 1.99%
1998 44 1 20 29.50% 12.59% 2.0% 0.75%
1997 27 <1 11 20.28% 17.35% N.A. 3.26%
1996 14 <1 <= Five 100.00%
Composite Assets Annual Performance Results
N.A. - Information is not statistically meaningful due to an insufficient number of portfolios in the composite for the entire year. Risk Managed Composite was created September 30, 1996. Risk Managed Composite contains fully discretionary accounts with a moderate risk strategy that invests in a mixture of equity funds and money market funds. The objective of the Risk Managed strategy is to reduce portfolio risk and overall loss while seeking to achieve superior returns to its benchmark over a complete market cycle. To accommodate this more conservative approach, Risk Managed is typically invested in 10 to 20 positions from a broad universe of domestic equities, and will employ money market or cash fund positions during adverse market conditions. Risk Managed can be fully invested, partially in cash or completely in cash. While Risk Managed may limit the overall losses suffered during major market declines, it may also limit returns in advancing markets. Risk Managed is a conservative strategy emphasizing capital preservation over investment return. For comparison purposes, the Risk Managed Composite is measured against a Custom Benchmark that we construct for each product universe we manage by assuming an equal investment in each of the choices available within that universe (except money market and fixed accounts). Further, the “portfolio” comprising the custom benchmark is rebalanced daily, which creates the un-weighted return of the universe itself. We believe that this benchmark is the yardstick against which measurement of performance and risk makes sense. As of January 1, 2004, the Custom Benchmark has been restated historically to exclude funds that are closed to new investors and funds not traded by Niemann Capital Management, Inc. This benchmark has been changed to improve comparability. Further information regarding this benchmark is available upon request. Some accounts pay an all-inclusive bundled fee based on a percentage of assets under management. Other than brokerage commissions this fee may include investment management, portfolio monitoring, consulting services, and in some cases, custodial services. Fee schedules are provided by independent sponsors and are available upon request from the respective program sponsor. Bundled fee accounts make up a percentage of composite assets for each year end as listed. Results are net of actual advisory fees and assume all dividends and capital gains are reinvested. Please see disclosure on page 1 of this document.

NCM_ADP_2016 05.11.2017 5
Global Opportunity Strategy Composite
Total Firm
Year Assets U.S. Dollars Number of Composite Custom Composite Composite 3 Yr Benchmark 3 Yr Non Fee Wrap Fee
End (millions) (millions) Accounts (net of fees) Benchmark Dispersion Ex-Post Std Dev Ex-Post Std Dev Based Based
2016 189 70 356 6.87% 7.88% 0.67% 10.54% 8.20% 3.54% 29.27%
2015 159 56 327 ( 0.07%) ( 2.37%) 0.57% 11.19% 7.70% 4.46%
2014 181 73 388 2.96% 3.08% 0.6% 9.9% 7.4% 4.25%
2013 188 81 434 29.98% 17.55% 2.2% 10.3% 10.4% 3.23%
2012 209 105 742 3.68% 12.37% 0.7% 10.9% 12.8% 1.45%
2011 542 295 1,974 (16.89%) ( 2.39%) 0.5% 14.1% 15.7% 0.75%
2010 1,464 947 4,706 ( 2.05%) 14.42% 0.4% 14.3% 19.8% 0.27%
2009 1,524 894 4,149 15.86% 30.46% 0.5% 0.35%
2008 1,045 438 2,251 (11.38%) (33.93%) 0.6% 0.74%
2007 1,170 365 1,583 7.90% 7.16% 0.5% 0.53%
2006 958 288 1,284 13.51% 13.30% 1.0% 0.59%
2005 681 151 749 13.97% 8.93% 1.3% 0.67%
2004 488 81 327 11.04% 13.07% 1.2% 0.86%
2003 352 43 150 43.99% 33.51% 0.9% 1.21%
2002 233 26 133 (11.06%) (20.15%) 0.6% 1.33%
2001 174 28 110 3.28% (11.44%) 1.0% 3.36%
2000 116 18 73 11.52% ( 3.72%) 1.1% 1.41%
1999 84 9 42 37.67% 31.01% 1.2% 2.97%
1998 44 2 14 24.41% 10.44% N.A. 9.25%
1997 27 <1 <=5 13.30% 13.49% N.A.
1996 14 <1 <=5
Composite Assets Annual Performance Results
N.A. - Information is not statistically meaningful due to an insufficient number of portfolios in the composite for the entire year. Global Opportunity Mutual Fund Composite was created November 12, 1996.
Global Opportunity Composite: contains fully discretionary accounts with a moderate risk strategy that can invest in a mixture of domestic and international equity funds, bond funds and money market funds. The objective of Global Opportunity is to exploit intermediate-term trends in both international and domestic markets while seeking to limit risk. Global Opportunity is typically allocated in positions from a broad universe of domestic and international equities, bonds and/or alternatives. The strategy can employ money market, cash or bonds in adverse market conditions, attempting to reduce portfolio volatility. Global Opportunity can be fully invested, partially in cash or completely in cash. Often the portfolio will not follow U.S. stock market trends. Global Opportunity is a growth strategy that employs multiple asset-class options worldwide, and emphasizes capital preservation over investment return. As of Jan 1, 2013, the Equity Plus Composite was renamed Global Opportunity Composite. For comparison purposes, the Global Opportunity Composite is measured against a Custom Benchmark. The Custom Benchmark performance is computed as the average performance of all funds available for investing in this composite, and is rebalanced daily. As of January 1, 2004, the Custom Benchmark has been restated historically to exclude funds that are closed to new investors and funds not traded by Niemann Capital Management, Inc. This benchmark has been changed to improve comparability. Further information regarding this benchmark is available upon request. Some accounts pay an all-inclusive bundled fee based on a percentage of assets under management. Other than brokerage commissions this fee may include investment management, portfolio monitoring, consulting services, and in some cases, custodial services. Fee schedules are provided by independent sponsors and are available upon request from the respective program sponsor. Bundled fee accounts make up a percentage of composite assets for each year end as listed. Results are net of actual advisory fees and assume all dividends and capital gains are reinvested. Please see disclosure on page 1 of this document.

NCM_ADP_2016 05.11.2017 6
Dynamic Composite Total Firm
Year Assets U.S. Dollars Number of Composite Custom Composite Composite 3 Yr Benchmark 3 Yr Non Fee Wrap Fee
End (millions) (millions) Accounts (net of fees) Benchmark Dispersion Ex-Post Std Dev Ex-Post Std Dev Based Based
2016 189 52 256 6.96% 10.22% 0.6% 14.92% 11.08% 4.15% 32.56%
2015 159 36 206 ( 1.07%) 0.03% 0.6% 15.21% 10.22% 7.48%
2014 181 37 202 4.98% 4.23% 0.8% 13.15% 9.56% 7.13%
2013 188 34 176 40.74% 29.21% 0.9% 12.95% 13.31% 3.62%
2012 209 27 171 16.83% 13.61% 0.9% 14.3% 16.7% 7.73%
2011 542 55 321 ( 7.30%) ( 3.03%) 0.6% 18.9% 20.0% 3.43%
2010 1,464 122 588 8.87% 19.53% 0.6% 23.8% 23.2% 2.06%
2009 1,524 121 630 26.70% 32.35% 0.8% 1.58%
2008 1,045 111 797 (39.83%) (37.63%) 0.6% 1.50%
2007 1,170 189 754 15.06% 7.29% 0.7% 0.69%
2006 958 152 666 13.93% 12.10% 0.8% 0.68%
2005 681 120 604 9.72% 7.00% 4.9% 0.56%
2004 488 75 384 13.34% 12.03% 0.9% 0.58%
2003 352 35 203 47.39% 32.09% 1.3% 0.76%
2002 233 18 177 (12.13%) (22.05%) 0.7% 0.35%
2001 174 14 106 7.73% (10.19%) 1.0% 5.42%
2000 116 4 29 24.50% ( 0.64%) 1.5% 0.83%
1999 84 2 10 79.40% 26.52% 1.5%
1998 44 1 15 21.45% 12.23% 1.8%
1997 27 1 12
Composite Assets Annual Performance Results
Dynamic Composite was created February 20, 1997. Dynamic Composite contains fully discretionary accounts with an aggressive strategy that remains fully invested in equity funds which are rotated to achieve maximum appreciation in all market conditions. The objective of the Dynamic strategy is to exploit intermediate trends in domestic markets by being fully invested in domestic equities. As a result, Dynamic takes an aggressive approach, seeking to out-perform domestic benchmarks over a complete market cycle. Dynamic is typically allocated into 10 to 20 positions from a broad universe of domestic equities, encompassing a variety of asset classes and sectors. This is a high-risk strategy emphasizing investment return over capital preservation by keeping portfolio assets actively invested in domestic equities at all times. For comparison purposes, the Dynamic Composite is measured against a Custom Benchmark that we construct for each product universe we manage by assuming an equal investment in each of the choices available within that universe (except money market and fixed accounts). Further, the “portfolio” comprising the custom benchmark is rebalanced daily, which creates the un-weighted return of the universe itself. We believe that this benchmark is the yardstick against which measurement of performance and risk makes sense. As of January 1, 2004, the Custom Benchmark has been restated historically to exclude funds that are closed to new investors and funds not traded by Niemann Capital Management, Inc. This benchmark has been changed to improve comparability. Further information regarding this benchmark is available upon request. Some accounts pay an all-inclusive bundled fee based on a percentage of assets under management. Other than brokerage commissions this fee may include investment management, portfolio monitoring, consulting services, and in some cases, custodial services. Fee schedules are provided by independent sponsors and are available upon request from the respective program sponsor. Bundled fee accounts make up a percentage of composite assets for each year end as listed. Results are net of actual advisory fees and assume all dividends and capital gains are reinvested. Please see disclosure on page 1 of this document.

NCM_ADP_2016 05.11.2017 7
Dynamic International Strategy Composite Total Firm
Year Assets U.S. Dollars Number of Composite Custom Composite Composite 3 Yr Benchmark 3 Yr Non Fee
End (millions) (millions) Accounts (net of fees) Benchmark Dispersion Ex-Post Std Dev Ex-Post Std Dev Based
2016 189 <1 6 0.35% 4.50% 0.6% 12.68% 9.24% N.A.
2015 159 <1 4 (10.03%) ( 2.99%) 0.0% 12.88% 8.77% N.A.
2014 181 <1 4 ( 8.27%) ( 1.95%) 0.1% 12.97% 9.18% N.A.
2013 188 <1 <=5 17.53% 14.46% N.A. 15.55% 12.18% N.A.
2012 209 1 7 8.72% 14.14% 0.2% 16.7% 14.9% N.A.
2011 542 5 49 (28.35%) ( 9.29%) 0.4% 22.8% 18.5% 0.26%
2010 1,464 14 86 11.14% 14.19% 0.9% N.A. N.A. 0.09%
2009 1,524 7 53 60.95% 41.60% 0.7% N.A. N.A. 0.15%
2008 1,045 4 51 0.16%
Composite Assets Annual Performance Results
N.A. - Information is not statistically meaningful due to insufficient history. Dynamic International Mutual Fund Composite was created January 22, 2008. Dynamic International Composite contains fully discretionary accounts with an aggressive strategy that remains fully invested in equity funds which are rotated to seek to achieve maximum appreciation in all market conditions. The objective of the Dynamic International strategy is to exploit intermediate trends in international markets by being fully invested in international equities. As a result, Dynamic International takes an aggressive approach, seeking to outperform international benchmarks over a complete market cycle. Dynamic International is typically allocated into 5 to 10 positions from a broad universe of international equities, encompassing a variety of asset classes and sectors. This is a high-risk strategy emphasizing investment return over capital preservation by keeping portfolio assets actively invested in international equities at all times. For comparison purposes, the Dynamic International Composite is measured against a Custom Benchmark that we construct for each product universe we manage by assuming an equal investment in each of the choices available within that universe (except money market and fixed accounts). Further, the “portfolio” comprising the custom benchmark is rebalanced daily, which creates the un-weighted return of the universe itself. We believe that this benchmark is the yardstick against which measurement of performance and risk makes sense. Further information regarding these benchmarks is available upon request. Results are net of actual advisory fees and assume all dividends and capital gains are reinvested. Please see disclosure on page 1 of this document.
Dynamic Sector Composite Total Firm
Year Assets U.S. Dollars Number of Composite Custom Composite Composite 3 Yr Benchmark 3 Yr Non Fee
End (millions) (thousands) Accounts (net of fees) Benchmark Dispersion Ex-Post Std Dev Ex-Post Std Dev Based
2016 189 2,233 22 1.23% 19.58% 0.35% 14.01% 13.11% N.A.
2015 159 2,742 28 ( 0.06%) ( 0.06%) 0.38% 14.60% 11.64% N.A.
2014 181 2,859 28 0.37% 5.52% 0.5% 12.78% 10.58% 7.04%
2013 188 2,346 22 33.93% 29.33% 0.8% 12.69% 14.66% N.A.
2012 209 822 10 17.31% 15.62% 0.8% 13.5% 18.3% 4.46%
2011 542 1885 15 ( 4.18%) ( 4.83%) 0.8% 18.7% 22.3% 8.53%
2010 1,464 2995 24 9.24% 20.68% 0.6% N.A. N.A. 10.12%
2009 1524 2558 27 22.84% 43.53% 1.3% N.A. N.A. 5.98%
2008 1045 941 15 1.67%
Composite Assets Annual Performance Results
N.A. - Information is not statistically meaningful due to insufficient history. Dynamic Sector Mutual Fund Composite was created February 20, 2008. Dynamic Sector Mutual Fund Composite contains fully discretionary accounts with an aggressive strategy that remains fully invested in equity funds which are rotated to seek to achieve maximum appreciation in all market conditions. The objective of the Dynamic strategy is to exploit intermediate trends in domestic markets by being fully invested in domestic equities. As a result, Dynamic takes an aggressive approach, seeking to out-perform domestic benchmarks over a complete market cycle. Dynamic is typically allocated into 10 to 20 positions from a broad universe of domestic equities, encompassing a variety of asset classes and sectors. This is a high-risk strategy emphasizing investment return over capital preservation by keeping portfolio assets actively invested in domestic equities at all times. For comparison purposes is measured against a Custom Benchmark that we construct for each product universe we manage by assuming an equal investment in each of the choices available within that universe (except money market and fixed accounts). Further, the “portfolio” comprising the custom benchmark is rebalanced daily, which creates the un-weighted return of the universe itself. We believe that this benchmark is the yardstick against which measurement of performance and risk makes sense. Further information regarding these benchmarks is available upon request. Results are net of actual advisory fees and assume all dividends and capital gains are reinvested. Please see disclosure on page 1 of this document.

NCM_ADP_2016 05.11.2017 8
Tactical Global Bond Strategy Composite Year Assets U.S. Dollars Number of Composite Blended Bond Composite Composite 3 Yr Blended Bond Non Fee
End (millions) (thousands) Accounts (net of fees) Benchmark Dispersion Ex-Post Std Dev 3 Yr Ex-Post Std Dev Based
2016 189 366 <=5 10.39% 5.28% N.A. 6.17% 3.42% 2.75%
2015 159 126 <=5 ( 0.05%) 0.89% 0.05% 5.83% 3.36% 15.69%
2014 181 233 <=5 8.54% 4.22% 1.0% 4.66% 2.88% 56.52%
2013 188 215 <=5 -4.67% -1.90% N.A. 4.89% 3.59% 56.09%
2012 209 604 6 8.26% 6.10% N.A. N.A. N.A. 19.45%
2011 542 108 <=5 8.06% 3.66% N.A. N.A. N.A. 100.00%
N.A. - Information is not statistically meaningful due to insufficient history. Tactical Global Bond Strategy Composite was created January 25, 2011. Tactical Global Bond Strategy Composite contains fully discretionary accounts with a moderate to conservative strategy that invests in fixed income securities expected to perform the best on a risk adjusted basis in the current market environment. Utilizing an approach designed to moderate risk exposure, the objective of the Tactical Global Bond Strategy is to identify and focus portfolio assets into fixed income securities expected to perform the best on a risk adjusted basis in the current market environment. The strategy is designed to deliver total returns that approximate the iShares Barclay's Aggregate Bond Index Fund and the Lipper Global Income Funds Index over the course of a complete market cycle. Niemann Capital Management, Inc. strives to accomplish this goal by monitoring risk levels of current positions and prospective investments against various fixed income categories, using a risk adjusted scoring algorithm to rank each security relative to all other securities held or considered for investment. The strategy seeks to keep assets focused in top ranking securities. The collection of exchange-traded funds and mutual funds considered for investment cover maturity lengths of all time frames, U.S. treasuries, investment grade corporates, high yield corporates and numerous international fixed income securities. The Tactical Global Bond Strategy is a conservative to moderate investment tool that provides income and the potential for moderate capital growth through a balanced mix of fixed income investments. The strategy will employ money market/cash positions during adverse market conditions to preserve assets. Tactical Global Bond can be fully invested, partially in cash or completely in cash. For comparison purposes, the Tactical Global Bond composite is measured against an equally weighted average of the Lipper Global Income Funds Index and the iShares Barclay's Aggregate Bond Index Fund. Lipper Global Income Funds Index consists of funds that state in their prospectus they invest primarily in U.S. dollar and non-U.S. dollar debt securities of issuers located in at least three countries, one of which may be the United States. The iShares Barclays Aggregate Bond Fund seeks investment results that correspond generally to the price and yield performance, before fees and expenses, of the total United States investment grade bond market as defined by the Barclays Capital U.S. Aggregate Bond Index. The Barclays Capital Aggregate Bond Index, which used to be called the "Lehman Aggregate Bond Index," is a broad based index, maintained by Barclays Capital, which took over the index business of the now defunct Lehman Brothers, and is often used to represent investment grade bonds being traded in United States. The Barclays Capital Aggregate Bond Index is a market capitalization-weighted index, meaning the securities in the index are weighted according to the market size of each bond type. Most U.S. traded investment grade bonds are represented. Municipal bonds, and Treasury Inflation-Protected Securities are excluded, due to tax treatment issues. The index includes Treasury securities, Government agency bonds, Mortgage-backed bonds, Corporate bonds, and a small amount of foreign bonds traded in U.S. Further information regarding these benchmarks is available upon request. Results are net of actual advisory fees and assume all dividends and capital gains are reinvested. Please see disclosure on page 1 of this document.

NCM_ADP_2016 05.11.2017 9
Risk Managed International Strategy Composite Total Firm
Year Assets U.S. Dollars Number of Composite Custom Composite Composite 3 Yr Benchmark 3 Yr Non Fee
End (millions) (thousands) Accounts (net of fees) Benchmark Dispersion Ex-Post Std Dev Ex-Post Std Dev Based
2016 189 39 <=5 6.44% 4.50% N.A. 10.0% 9.2% 100.00%
2015 159 86 <=5 ( 6.10%) ( 2.99%) N.A. N.A. N.A. 100.00%
2014 181 94 <=5 ( 7.44%) ( 1.94%) N.A. N.A. N.A. 100.00%
2013 188 35 <=5 10.90% 8.87% N.A. N.A. N.A. 100.00%
Composite Assets Annual Performance Results
N.A. - Information is not statistically meaningful due to insufficient history. Risk Managed International Mutual Fund Composite was created June 17, 2013. Risk Managed International Composite contains fully discretionary accounts with a moderate risk strategy that invests in a mixture of equity funds and money market funds which are rotated to seek to achieve maximum appreciation in all market conditions. The objective of the Risk Managed International (RMI) is to exploit intermediate-term trends in the international equity market while seeking to limit risk. RMI is typically invested in 5 to 10 positions from a broad universe of international equity ETFs, and will employ money market/cash positions during adverse market conditions to preserve assets. RMI can be fully invested, partially in cash or completely in cash. While RMI may limit the overall losses suffered during major declines, it may also limit returns in advancing markets. However, the strategy seeks to outperform its benchmark over complete market cycles. RMI is a moderate risk strategy, emphasizing capital preservation over investment return. For comparison purposes, the Risk Managed International Composite is measured against a Custom Benchmark that we construct for each product universe we manage by assuming an equal investment in each of the choices available within that universe (except money market and fixed accounts). Further, the “portfolio” comprising the custom benchmark is rebalanced daily, which creates the un-weighted return of the universe itself. We believe that this benchmark is the yardstick against which measurement of performance and risk makes sense. Further information regarding these benchmarks is available upon request. Results are net of actual advisory fees and assume all dividends and capital gains are reinvested. Please see disclosure on page 1 of this document.
Risk Managed GEMS Composite (closed 10-30-2013) End (millions) (thousands) Accounts (net of fees) Index Dispersion Ex-Post Std Dev 3 Yr Ex-Post Std Dev
2013 188 N.A. 0 N.A. N.A. N.A. N.A. N.A.
2012 209 135 <=5 ( 2.37%) 15.15% N.A. N.A. N.A.
2011 542 <1 <=5 N.A. N.A. N.A. N.A. N.A. N.A. - Information is not statistically meaningful due to insufficient history. Risk Managed GEMS Strategy Composite was created Dec 30, 2011. Risk Managed GEMS Strategy Composite contains fully discretionary accounts with a moderate to aggressive strategy that remains invested in a mixture of EGShares and money market funds which are rotated to seek to achieve maximum appreciation in all market conditions. EGShares is an exchange-traded fund offering from Emerging Global Advisors (EGA) which focuses on emerging market sectors. Utilizing an approach designed to moderate risk exposure, the objective of the Risk Managed GEMS strategy is to identify and focus portfolio assets into Global Emerging Market Sectors (GEMS) expected to perform the best on a risk adjusted basis in the current market conditions. Niemann Risk Managed GEMS is designed to deliver market-like total returns over the course of a complete market cycle while working to limit losses during volatile periods through the use of risk management controls. The strategy strives to accomplish this goal through the use of quantitative tools designed to monitor the risk/return characteristics of the markets overall as well as each of the emerging sectors available to the strategy. This is a moderate to high risk strategy. The investment process encompasses a systematic, rules-driven methodology. This methodology is based on Niemann’s proprietary quantitative analysis that ranks all the funds within a defined universe on a risk-adjusted return basis. For comparison purposes, the Risk Managed GEMS Composite is measured against the MSCI Emerging Markets Index. The MSCI Emerging Markets Index is a free float-adjusted market capitalization index that is designed to measure equity market performance of emerging markets. The MSCI Emerging Markets Index consists of the following 21 emerging market country indices: Brazil, Chile, China, Colombia, Czech Republic, Egypt, Hungary, India, Indonesia, Korea, Malaysia, Mexico, Morocco, Peru, Philippines, Poland, Russia, South Africa, Taiwan, Thailand, and Turkey*. Further information regarding this benchmark is available upon request. Results are net of actual advisory fees and assume all dividends and capital gains are reinvested. Please see disclosure on page 1 of this document.

NCM_ADP_2016 05.11.2017 10
Annual Disclosure Presentation 2016, Risk Managed & Dynamic VAs
Risk Managed VAs Risk Managed Prudential Annuities VA Composite
Total Firm
Year Assets U.S. Dollars Number of Composite Custom Composite Composite 3 Yr Custom Benchmark
End (millions) (millions) Accounts (net of fees) Benchmark Dispersion Ex-Post Std Dev 3 Yr Ex-Post Std Dev
2016 189 <= 1 7 4.13% 6.26% 1.02% 10.10% 7.52%
2015 159 1.3 10 ( 5.53%) ( 1.94%) 0.90% 9.86% 7.59%
2014 181 1.3 9 ( 0.89%) 4.36% 1.52% 9.09% 7.74%
2013 188 1.4 10 22.35% 18.10% 2.10% 8.96% 10.42%
2012 209 2 14 4.14% 12.31% 0.89% 9.41% 12.79%
2011 542 3 27 (11.08%) ( 2.27%) 0.50% 12.20% 15.10%
2010 1,464 13 76 ( 1.22%) 12.92% 0.60% 12.56% 20.30%
2009 1,524 17 91 12.00% 27.87% 0.7%
2008 1,045 25 135 (21.41%) (35.05%) 0.3%
2007 1,170 34 138 8.28% 5.57% 0.5%
2006 958 34 152 10.41% 11.96% 0.7%
2005 681 34 201 8.80% 5.90% 0.7%
2004 488 32 149 2.65% 10.20% 1.3%
2003 352 30 121 37.73% 29.59% 0.9%
2002 233 25 120 (10.39%) (22.04%) 1.7%
2001 174 25 83 ( 9.33%) (25.63%) 0.6%
2000 116 21 60 ( 1.15%) ( 8.95%) 0.6%
1999 84 21 56 21.64% 30.84% 0.8%
1998 44 13 39 31.85% 8.99% 0.5%
1997 27 8 25 13.65% 12.40% 0.4%
1996 14 6 20 13.44% 12.35% 0.7%
1995 3 2 6
Composite Assets Annual Performance Results
Risk Managed Prudential Annuities VA Composite was created October 20, 1995. See disclosure on Page 14 - All Risk Managed VA Composites. Results are net of actual advisory fees and assume all dividends and capital gains are reinvested. Please see disclosure on page 1 of this document.

NCM_ADP_2016 05.11.2017 11
Risk Managed Pacific Life VA Composite (closed 11-03-2016)
Total Firm
Year Assets U.S. Dollars Number of Composite Custom Composite Composite 3 Yr Custom Benchmark
End (millions) (millions) Accounts (net of fees) Benchmark Dispersion Ex-Post Std Dev 3 Yr Ex-Post Std Dev
2016 189 0 0 N.A. N.A. N.A. N.A. N.A.
2015 159 <1 <=5 ( 4.13%) ( 3.23%) 0.01% 9.16% 7.27%
2014 181 <1 <=5 3.27% 2.96% N.A. 8.60% 7.20%
2013 188 <1 <=5 18.47% 15.57% N.A. 8.25% 9.90%
2012 209 <1 <=5 3.68% 12.17% N.A. 8.84% 12.69%
2011 542 1 11 ( 6.54%) ( 2.25%) 0.60% 12.70% 15.00%
2010 1,464 2 16 2.15% 14.76% 0.70% 15.81% 19.47%
2009 1,524 6 41 21.51% 33.00% 0.5%
2008 1,045 7 65 (33.91%) (31.99%) 0.3%
2007 1,170 22 117 1.99% 6.21% 0.4%
2006 958 21 113 12.75% 12.25% 0.5%
2005 681 13 101 9.28% 7.45% 0.8%
2004 488 8 50 12.22% 12.26% 1.2%
2003 352 5 41 29.54% 29.58% 0.7%
2002 233 4 41 (12.23%) (22.07%) N.A.
2001 174 <1 <=5
Composite Assets Annual Performance Results
N.A. - Information is not statistically meaningful due to an insufficient number of portfolios in the composite for the entire year. Risk Managed Pacific Life VA Composite was created June 18, 2001. See disclosure on Page 14 - All Risk Managed VA Composites. Results are net of actual advisory fees and assume all dividends and capital gains are reinvested. Please see disclosure on page 1 of this document.
Risk Managed Nationwide MarketFlex VA Composite Total Firm
Year Assets U.S. Dollars Number of Composite Custom Composite Composite 3 Yr Custom Benchmark
End (millions) (millions) Accounts (net of fees) Benchmark Dispersion Ex-Post Std Dev 3 Yr Ex-Post Std Dev
2016 189 <=1 <=5 1.17% 7.48% N.A. 11.92% 6.97%
2015 159 1.2 <=5 ( 5.37%) ( 4.85%) 0.97% 11.45% 6.91%
2014 181 1.3 <=5 3.67% 1.73% 0.98% 9.72% 7.26%
2013 188 1 <=5 26.43% 15.22% N.A. 9.09% 10.23%
2012 209 2 11 6.88% 9.49% 0.76% 9.69% 12.94%
2011 542 4 19 ( 9.73%) ( 5.26%) 0.55% 12.16% 16.58%
2010 1464 6 25 4.33% 17.42% 0.60% 14.14% 24.66%
2009 1524 9 41 11.58% 34.92% 0.5%
2008 1045 9 46 (21.47%) (37.57%) 0.5%
2007 1170 9 39 4.81% 5.18% 0.6%
2006 958 8 37 10.93% 11.67% 0.4%
2005 681 7 42 5.63% 8.84% 0.6%
2004 488 6 29
Composite Assets Annual Performance Results
Risk Managed Nationwide MarketFlex VA Composite was created August 26, 2004. See disclosure on Page 14 - All Risk Managed VA Composites Results are net of actual advisory fees and assume all dividends and capital gains are reinvested. Please see disclosure on page 1 of this document.

NCM_ADP_2016 05.11.2017 12
Risk Managed Security Benefit VA Composite
Total Firm
Year Assets U.S. Dollars Number of Composite Custom Composite Composite 3 Yr Custom Benchmark
End (millions) (millions) Accounts (net of fees) Benchmark Dispersion Ex-Post Std Dev 3 Yr Ex-Post Std Dev
2016 189 <=1 <=5 6.26% 4.52% 0.00% 12.53% 8.15%
2015 159 <=1 <=5 ( 6.11%) ( 6.60%) 0.00% 11.67% 7.55%
2014 181 <=1 <=5 1.96% ( 0.82%) 0.51% 9.94% 7.36%
2013 188 1 6 24.47% 13.96% 0.60% 9.20% 9.90%
2012 209 1 9 7.49% 6.34% 0.40% 9.80% 11.90%
2011 542 1 13 (10.81%) ( 6.73%) 0.30% 11.80% 16.00%
2010 1464 8 60 1.92% 8.42% 0.30% 14.10% 18.90%
2009 1524 18 134 12.03% 21.13% 0.5%
2008 1045 16 129 (22.50%) (35.39%) 0.4%
2007 1170 15 77 5.86% 3.26% 0.3%
2006 958 9 44
Composite Assets Annual Performance Results
Risk Managed Security Benefit VA Composite was created April 6, 2006. See disclosure on Page 14 - All Risk Managed VA Composites Results are net of actual advisory fees and assume all dividends and capital gains are reinvested. Please see disclosure on page 1 of this document.
Risk Managed Sun Life VA Composite (closed 12-30-2011)
Total Firm
Year Assets U.S. Dollars Number of Composite Custom Composite Composite 3 Yr Custom Benchmark
End (millions) (millions) Accounts (net of fees) Benchmark Dispersion Ex-Post Std Dev 3 Yr Ex-Post Std Dev
2012 209 0 0 N.A. N.A. N.A. N.A. N.A.
2011 542 <1 <=5 (8.70%) (5.47%) N.A. 13.1% 21.6%
2010 1464 <1 <=5 (1.89%) 13.97% N.A. 12.7% 20.8%
2009 1524 4 <=5 18.77% 31.54% N.A.
2008 1045 3 6 (18.44%) (34.12%) 0.2%
2007 1170 2 <=5 0.01% 7.06% N.A.
2006 958 3 <=5 17.58% 10.95% N.A.
2005 681 3 <=5 2.69% 4.10% N.A.
2004 488 3 <=5 10.76% 19.06% N.A.
Composite Assets Annual Performance Results
N.A. - Information is not statistically meaningful due to an insufficient number of portfolios in the composite for the entire year. Risk Managed Sun Life VA Composite was created October 27, 2003. See disclosure on Page 14 - All Risk Managed VA Composites. Results are net of actual advisory fees and assume all dividends and capital gains are reinvested. Please see disclosure on page 1 of this document.

NCM_ADP_2016 05.11.2017 13
Risk Managed Genworth Financial VA Composite (closed 3-16-2012) Total Firm
Year Assets U.S. Dollars Number of Composite Custom Composite Composite 3 Yr Custom Benchmark
End (millions) (thousands) Accounts (net of fees) Benchmark Dispersion Ex-Post Std Dev 3 Yr Ex-Post Std Dev
2012 209 0 0 N.A. N.A. N.A. N.A. N.A.
2011 542 270 <=5 (11.50%) ( 2.97%) N.A. 11.8% 17.9%
2010 1464 322 <=5 2.66% 14.02% N.A. 15.0% 19.8%
2009 1524 336 <=5 20.98% 30.72% N.A.
2008 1045 282 <=5 (35.03%) (36.84%) N.A.
2007 1170 899 <=5 5.41% 10.24% N.A.
2006 958 852 <=5 12.51% 10.11% N.A.
2005 681 1,074 6 8.96% 7.06% 1.0%
2004 488 1,387 6 3.11% 7.52% 0.7%
2003 352 1,341 6 24.18% 28.27% 0.6%
2002 233 879 <=5 (11.28%) (17.15%) N.A.
Composite Assets Annual Performance Results
N.A. - Information is not statistically meaningful due to an insufficient number of portfolios in the composite for the entire year. Risk Managed Genworth Financial VA Composite was created November 26, 2001. See disclosure on Page 14 - All Risk Managed VA Composites. Results are net of actual advisory fees and assume all dividends and capital gains are reinvested. Please see disclosure on page 1 of this document.
Risk Managed Genworth Financial Choice VA Composite (closed 1-14-2013) Total Firm
Year Assets U.S. Dollars Number of Composite Custom Composite Composite 3 Yr Custom Benchmark
End (millions) (millions) Accounts (net of fees) Benchmark Dispersion Ex-Post Std Dev 3 Yr Ex-Post Std Dev
2013 188 0 0 N.A. N.A. N.A. N.A. N.A.
2012 209 2 9 3.52% 13.26% 0.7% 9.8% 13.5%
2011 542 3 12 (10.67%) (3.26%) 0.7% 11.5% 16.5%
2010 1464 8 23 1.57% 13.43% 0.6% 13.7% 20.1%
2009 1524 8 24 17.39% 31.92% 0.6%
2008 1045 6 23 (25.37%) (35.31%) 0.4%
2007 1170 6 19 12.10% 8.67% 0.6%
2006 958 6 20 9.36% 9.34% 0.4%
2005 681 2 20 7.59% 7.32% 0.3%
2004 488 2 7
Composite Assets Annual Performance Results
Risk Managed Genworth Financial Choice VA Composite was created July 15, 2004. See disclosure on Page 14 - All Risk Managed VA Composites. Results are net of actual advisory fees and assume all dividends and capital gains are reinvested. Please see disclosure on page 1 of this document.

NCM_ADP_2016 05.11.2017 14
All Risk Managed VA Composites contain fully discretionary accounts with a moderate risk strategy that invests in a mixture of equity funds, bond funds, and money market funds. The objective of the Risk Managed Variable Annuity strategy is to reduce portfolio risk and overall loss while seeking to achieve superior returns to its benchmark over a complete market cycle. To accommodate this more conservative approach, the Risk Managed Variable Annuity is typically invested in 5 to 10 positions from a broad universe of domestic and international equities, and will employ money market/cash or short mutual fund positions during adverse market conditions. The Risk Managed Variable Annuity cannot be net short in the portfolio. The Risk Managed Variable Annuity can be fully invested, partially in cash, completely in cash, or even partially short as a hedge against existing long positions. While the Risk Managed Variable Annuity may limit the overall losses suffered during major market declines, it may also limit returns in advancing markets. Risk Managed is our more conservative strategy emphasizing capital preservation over investment return. For comparison purposes, each Risk Managed VA Composite is measured against a Custom Benchmark that we construct for each product universe we manage by assuming an equal investment in each of the choices available within that universe (except money market and fixed accounts). Further, the “portfolio” comprising the custom benchmark is rebalanced daily, which creates the un-weighted return of the universe itself. As of January 1, 2004, the Custom Benchmark for each composite has been restated historically to exclude funds that are closed to new investors and funds not traded by Niemann Capital Management, Inc. This benchmark has been changed to improve comparability. This change does not apply to composites created after January 1, 2004. Further information regarding this benchmark is available upon request.

NCM_ADP_2016 05.11.2017 15
Dynamic VAs
Dynamic Nationwide BOA VA Composite (closed 04-21-2015)
Total Firm
Year Assets U.S. Dollars Number of Composite Custom Composite Composite 3 Yr Custom Benchmark
End (millions) (millions) Accounts (net of fees) Benchmark Dispersion Ex-Post Std Dev 3 Yr Ex-Post Std Dev
2015 159 0 0 N.A. N.A. N.A. N.A. N.A.
2014 181 <1 <=5 -0.30% 2.79% N.A. 10.25% 10.00%
2013 188 <1 <=5 17.80% 24.87% N.A. 14.59% 13.28%
2012 209 <1 <=5 11.76% 14.88% N.A. 16.8% 15.7%
2011 542 <1 <=5 (16.00%) ( 4.12%) N.A. 20.1% 18.9%
2010 1464 2 8 12.53% 15.36% 0.2% 24.6% 23.6%
2009 1524 2 9 30.89% 34.44% 0.5%
2008 1045 2 12 (46.00%) (42.13%) 0.9%
2007 1170 4 17 22.32% 12.11% 1.0%
2006 958 4 22 18.01% 13.73% 1.1%
2005 681 3 38 13.37% 10.35% 2.8%
2004 488 6 28 10.08% 13.13% 3.7%
2003 352 8 21 43.05% 35.15% 2.6%
2002 233 9 26 (14.20%) (23.71%) 0.3%
2001 174 12 22 ( 6.16%) (16.65%) 0.5%
2000 116 12 25 4.70% (10.09%) 0.5%
1999 84 10 20 52.31% 30.22% 0.7%
1998 44 5 15 23.20% 7.96% 0.6%
1997 27 4 13 18.68% 15.57% 0.4%
1996 14 2 9
Composite Assets Annual Performance Results
Dynamic Nationwide BOA VA Composite was created July 16, 1996. See disclosure on Page 20 - All Dynamic VA Composites. Results are net of actual advisory fees and assume all dividends and capital gains are reinvested. Please see disclosure on page 1 of this document.

NCM_ADP_2016 05.11.2017 16
Dynamic Nationwide Future VA Composite Total Firm
Year Assets U.S. Dollars Number of Composite Custom Composite Composite 3 Yr Custom Benchmark
End (millions) (millions) Accounts (net of fees) Benchmark Dispersion Ex-Post Std Dev 3 Yr Ex-Post Std Dev
2016 189 1.2 8 8.16% 8.74% 0.91% 12.63% 10.34%
2015 159 1.2 9 ( 3.69%) ( 2.03%) 0.64% 10.97% 9.82%
2014 181 1.9 11 ( 0.98%) 4.28% 0.78% 10.48% 9.86%
2013 188 4 20 17.18% 26.04% 1.00% 13.70% 13.30%
2012 209 4 22 12.29% 14.86% 0.8% 16.3% 15.7%
2011 542 5 32 (12.72%) ( 4.30%) 1.1% 20.6% 19.5%
2010 1464 7 44 9.66% 15.63% 0.4% 25.3% 23.6%
2009 1524 9 58 31.73% 34.15% 5.5%
2008 1045 13 91 (47.37%) (41.80%) 0.6%
2007 1170 30 106 17.45% 10.64% 1.2%
2006 958 27 99 19.22% 14.93% 2.0%
2005 681 23 122 12.63% 11.13% 1.7%
2004 488 17 62 8.15% 14.12% 2.9%
2003 352 10 30 43.11% 33.72% 0.6%
2002 233 6 24 (15.45%) (23.75%) 0.3%
2001 174 6 16 ( 5.93%) (16.13%) 0.6%
2000 116 4 11 6.11% ( 8.90%) 0.8%
1999 84 2 7
Composite Assets Annual Performance Results
Dynamic Nationwide Future VA Composite was created February 5, 1999. See disclosure on Page 20 - All Dynamic VA Composites. Results are net of actual advisory fees and assume all dividends and capital gains are reinvested. Please see disclosure on page 1 of this document.

NCM_ADP_2016 05.11.2017 17
Dynamic Prudential Annuities VA Composite Total Firm
Year Assets U.S. Dollars Number of Composite Custom Composite Composite 3 Yr Custom Benchmark
End (millions) (millions) Accounts (net of fees) Benchmark Dispersion Ex-Post Std Dev 3 Yr Ex-Post Std Dev
2016 189 1.1 <=5 7.94% 6.29% 1.06% 12.88% 7.90%
2015 159 1.4 8 ( 5.26%) ( 1.95%) 0.85% 11.73% 8.02%
2014 181 2.3 11 2.65% 4.65% 1.27% 10.89% 8.26%
2013 188 2 11 28.76% 19.96% 2.60% 11.53% 11.22%
2012 209 2 14 11.35% 12.76% 1.68% 13.30% 13.96%
2011 542 4 27 (12.45%) ( 2.99%) 0.43% 18.61% 16.45%
2010 1464 5 27 6.12% 13.63% 0.50% 20.02% 22.16%
2009 1524 5 33 25.59% 29.07% 0.90%
2008 1045 11 83 (33.72%) (36.19%) 0.20%
2007 1170 19 99 7.28% 6.04% 0.50%
2006 958 16 89 12.20% 12.65% 0.60%
2005 681 11 97 12.20% 6.75% 0.64%
2004 488 4 27 7.31% 10.83% 2.40%
2003 352 8 23 46.48% 32.84% 0.90%
2002 233 4 23 (13.30%) (24.76%) 0.60%
2001 174 3 10 (10.73%) (29.70%) 0.50%
2000 116 2 7 1.38% (11.32%) N.A.
1999 84 <1 <=5
Composite Assets Annual Performance Results
N.A. - Information is not statistically meaningful due to an insufficient number of portfolios in the composite for the entire year. Dynamic Prudential Annuities VA Composite was created December 8, 1999. See disclosure on Page 20 - All Dynamic VA Composites. Results are net of actual advisory fees and assume all dividends and capital gains are reinvested. Please see disclosure on page 1 of this document.

NCM_ADP_2016 05.11.2017 18
Dynamic Pacific Life VA Composite (closed 11-03-2016)
Total Firm
Year Assets U.S. Dollars Number of Composite Custom Composite Composite 3 Yr Custom Benchmark
End (millions) (millions) Accounts (net of fees) Benchmark Dispersion Ex-Post Std Dev 3 Yr Ex-Post Std Dev
2016 189 0 0 N.A. N.A. N.A. N.A. N.A.
2015 159 <1 <=5 0.01% -3.19% N.A. 11.39% 8.20%
2014 181 <1 <=5 6.22% 3.12% N.A. 10.50% 8.35%
2013 188 <1 <=5 25.93% 20.50% N.A. 13.34% 12.50%
2012 209 <1 <=5 12.68% 12.87% N.A. 15.9% 16.1%
2011 542 <1 <=5 ( 7.28%) ( 4.17%) N.A. 18.2% 20.9%
2010 1464 <1 <=5 16.92% 15.96% N.A. 16.9% 16.0%
2009 1524 2 8 31.04% 27.48% 1.3%
2008 1045 3 14 (47.61%) (35.76%) 0.5%
2007 1170 12 43 13.69% 7.12% 1.2%
2006 958 12 49 15.70% 12.75% 1.1%
2005 681 9 45 13.99% 8.40% 0.7%
2004 488 4 9 14.77% 13.43% 0.8%
2003 352 3 8 39.54% 31.95% 0.2%
2002 233 2 <=5 (20.31%) (25.10%) N.A.
2001 174 1 <=5 ( 2.37%) (16.47%) N.A.
2000 116 1 <=5
Composite Assets Annual Performance Results
N.A. - Information is not statistically meaningful due to an insufficient number of portfolios in the composite for the entire year. Dynamic Pacific Life VA Composite was created February 17, 2000. See disclosure on Page 20 - All Dynamic VA Composites. Results are net of actual advisory fees and assume all dividends and capital gains are reinvested. Please see disclosure on page 1 of this document.
Dynamic Nationwide MarketFlex VA Composite (closed 04-15-2016) Dynamic Nationwide MarketFlex VA Composite was created August 13, 2004. See disclosure on next page
Total Firm
Year Assets U.S. Dollars Number of Composite Custom Composite Composite 3 Yr Custom Benchmark
End (millions) (millions) Accounts (net of fees) Benchmark Dispersion Ex-Post Std Dev 3 Yr Ex-Post Std Dev
2016 189 0 0 N.A. N.A. N.A. N.A. N.A.
2015 159 <1 <=5 ( 6.57%) ( 5.02%) N.A. 13.74% 7.36%
2014 181 <1 <=5 5.97% 2.06% N.A. 11.49% 7.62%
2013 188 <1 <=5 29.45% 18.02% N.A. 11.50% 12.60%
2012 209 <1 <=5 12.81% 8.65% N.A. 13.70% 16.30%
2011 542 <1 <=5 (13.24%) ( 5.68%) N.A. 20.20% 18.50%
2010 1464 2 <=5 11.88% 16.31% N.A. 11.90% 16.30%
2009 1524 3 14 26.67% 33.82% 0.50%
2008 1045 5 34 (34.44%) (38.68%) 0.40%
2007 1170 9 45 7.60% 5.24% 0.60%
2006 958 10 51 7.59% 12.20% 0.50%
2005 352 9 46 915.00% 884.00% 0.60%
Composite Assets Annual Performance Results
N.A. - Information is not statistically meaningful due to an insufficient number of portfolios in the composite for the entire year. Dynamic Nationwide MarketFlex VA Composite was created August 13, 2004. See disclosure on Page 20 - All Dynamic VA Composites. Results are net of actual advisory fees and assume all dividends and capital gains are reinvested. Please see disclosure on page 1 of this document.

NCM_ADP_2016 05.11.2017 19
Dynamic Nationwide Achiever/Future II VA Composite
Total Firm
Year Assets U.S. Dollars Number of Composite Custom Composite Composite 3 Yr Custom Benchmark
End (millions) (millions) Accounts (net of fees) Benchmark Dispersion Ex-Post Std Dev 3 Yr Ex-Post Std Dev
2016 189 <=1 <=5 6.70% 7.11% 0.58% 12.34% 8.31%
2015 159 <=1 6 ( 0.01%) ( 2.65%) 0.67% 11.12% 7.98%
2014 181 1.9 10 2.61% 2.31% 0.74% 10.17% 8.00%
2013 188 3 19 18.92% 19.63% 0.80% 14.34% 10.72%
2012 209 4 26 9.98% 12.38% 0.40% 16.52% 12.64%
2011 542 5 39 ( 9.41%) ( 3.48%) 0.44% 18.98% 19.98%
2010 1464 8 54 7.01% 12.23% 0.90% 24.32% 22.31%
2009 1524 8 60 26.49% 31.31% 1.40%
2008 1045 9 80 (46.88%) (40.53%) 0.50%
2007 1170 17 77 19.08% 10.64% 1.00%
2006 958 8 33
2005 681 1,617 <=5 5.52% 5.27% N.A.
2004 488 1,530 <=5 16.15% 14.19% N.A.
2003 352 246 <=5
Composite Assets Annual Performance Results
N.A. - Information is not statistically meaningful due to an insufficient number of portfolios in the composite for the entire year. Dynamic Nationwide Achiever/Future II VA Composite was created March 22, 2006. See disclosure on Page 20 - All Dynamic VA Composites. Results are net of actual advisory fees and assume all dividends and capital gains are reinvested. Please see disclosure on page 1 of this document.
Dynamic Security Benefit VA Composite
Total Firm
Year Assets U.S. Dollars Number of Composite Custom Composite Composite 3 Yr Custom Benchmark
End (millions) (thousands) Accounts (net of fees) Benchmark Dispersion Ex-Post Std Dev 3 Yr Ex-Post Std Dev
2016 189 151 <=5 6.60% 5.13% N.A. 15.14% 8.89%
2015 159 142 <=5 ( 5.72%) ( 7.26%) N.A. 13.57% 8.23%
2014 181 149 <=5 4.56% ( 0.42%) N.A. 11.57% 8.21%
2013 188 142 <=5 31.85% 16.44% N.A. 11.65% 10.92%
2012 209 107 <=5 12.57% 6.68% N.A. 14.08% 13.26%
2011 542 298 <=5 (13.49%) ( 7.57%) N.A. 20.38% 18.18%
2010 1464 387 <=5 6.36% 9.46% N.A. 21.43% 20.35%
2009 1524 951 8 29.53% 23.07% 0.90%
2008 1045 546 6 (34.62%) (37.56%) 0.50%
2007 1170 1,243 9 7.99% 2.02% 0.70%
2006 958 909 7
2005 681 1,617 <=5 5.52% 5.27% N.A.
2004 488 1,530 <=5 16.15% 14.19% N.A.
2003 352 246 <=5
Composite Assets Annual Performance Results
N.A. - Information is not statistically meaningful due to an insufficient number of portfolios in the composite for the entire year. Dynamic Security Benefit VA Composite was created April 06, 2006. See disclosure on Page 20 - All Dynamic VA Composites. Results are net of actual advisory fees and assume all dividends and capital gains are reinvested. Please see disclosure on page 1 of this document.

NCM_ADP_2016 05.11.2017 20
Dynamic Sun Life VA Composite (closed 11-4-2013) Total Firm
Year Assets U.S. Dollars Number of Composite Custom Composite Composite 3 Yr Custom Benchmark
End (millions) (thousands) Accounts (net of fees) Benchmark Dispersion Ex-Post Std Dev 3 Yr Ex-Post Std Dev
2013 188 0 0 N.A. N.A. N.A. N.A. N.A.
2012 209 98 <=5 13.26% 12.63% N.A. 15.5% 16.0%
2011 542 86 <=5 (5.90%) (6.88%) N.A. 15.7% 16.5%
2010 1464 91 <=5 11.67% 14.09% N.A. 11.7% 14.1%
2009 1524 81 <=5 30.72% 32.66% N.A.
2008 1045 417 <=5 (49.05%) (40.90%) N.A.
2007 1170 3,402 <=5 13.91% 8.15% N.A.
2006 958 1,883 <=5 19.92% 12.71% N.A.
2005 681 1,617 <=5 5.52% 5.27% N.A.
2004 488 1,530 <=5 16.15% 14.19% N.A.
2003 352 246 <=5
Composite Assets Annual Performance Results
N.A. - Information is not statistically meaningful due to an insufficient number of portfolios in the composite for the entire year. Dynamic Sun Life VA Composite was created November 4, 2003. See disclosure on Page 19 - All Dynamic VA Composites. Results are net of actual advisory fees and assume all dividends and capital gains are reinvested. Please see disclosure on page 1 of this document. All Dynamic VA Composites contain fully discretionary accounts with an aggressive strategy that remains fully invested in equity funds which are rotated to seek to achieve maximum appreciation in all market conditions. The objective of the Dynamic Variable Annuity is to exploit intermediate trends in the markets by being fully invested in both domestic and international equities. As a result, the Dynamic Variable Annuity takes an aggressive approach, seeking to out-perform its benchmark over a complete market cycle. The Dynamic Variable Annuity is typically allocated into 5 to 10 positions from a broad universe of domestic and international equities, encompassing a variety of asset classes and sectors. Dynamic is a high-risk strategy emphasizing investment return over capital preservation by keeping portfolio assets actively invested at all times. For comparison purposes, each Dynamic VA Composite is measured against a Custom Benchmark that we construct for each product universe we manage by assuming an equal investment in each of the choices available within that universe (except money market and fixed accounts). Further, the “portfolio” comprising the custom benchmark is rebalanced daily, which creates the un-weighted return of the universe itself. As of January 1, 2004, the Custom Benchmark for each composite has been restated historically to exclude funds that are closed to new investors and funds not traded by Niemann Capital Management, Inc. This benchmark has been changed to improve comparability. This change does not apply to composites created after January 1, 2004. Further information regarding this benchmark is available upon request.
NCM_ADP_2016 05.11.2017 21
Annual Disclosure Presentation 2016, Risk Managed & Dynamic VULs
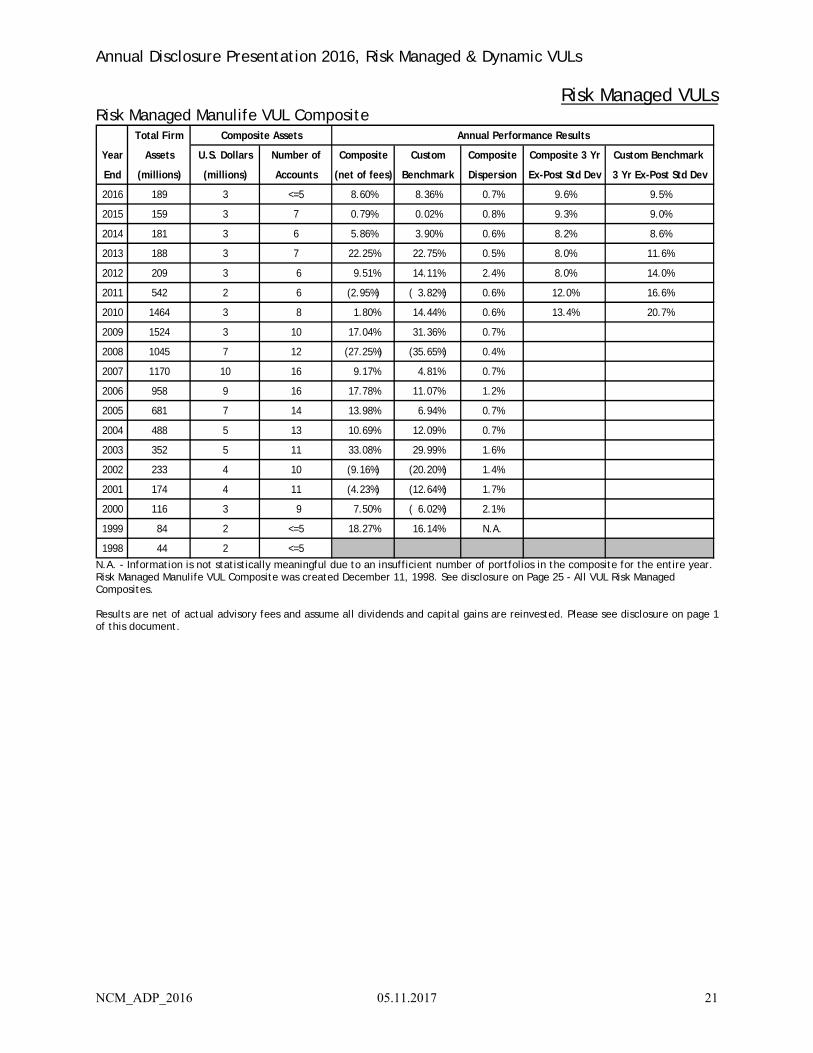
Risk Managed VULs Risk Managed Manulife VUL Composite
Total Firm
Year Assets U.S. Dollars Number of Composite Custom Composite Composite 3 Yr Custom Benchmark
End (millions) (millions) Accounts (net of fees) Benchmark Dispersion Ex-Post Std Dev 3 Yr Ex-Post Std Dev
2016 189 3 <=5 8.60% 8.36% 0.7% 9.6% 9.5%
2015 159 3 7 0.79% 0.02% 0.8% 9.3% 9.0%
2014 181 3 6 5.86% 3.90% 0.6% 8.2% 8.6%
2013 188 3 7 22.25% 22.75% 0.5% 8.0% 11.6%
2012 209 3 6 9.51% 14.11% 2.4% 8.0% 14.0%
2011 542 2 6 (2.95%) ( 3.82%) 0.6% 12.0% 16.6%
2010 1464 3 8 1.80% 14.44% 0.6% 13.4% 20.7%
2009 1524 3 10 17.04% 31.36% 0.7%
2008 1045 7 12 (27.25%) (35.65%) 0.4%
2007 1170 10 16 9.17% 4.81% 0.7%
2006 958 9 16 17.78% 11.07% 1.2%
2005 681 7 14 13.98% 6.94% 0.7%
2004 488 5 13 10.69% 12.09% 0.7%
2003 352 5 11 33.08% 29.99% 1.6%
2002 233 4 10 (9.16%) (20.20%) 1.4%
2001 174 4 11 (4.23%) (12.64%) 1.7%
2000 116 3 9 7.50% ( 6.02%) 2.1%
1999 84 2 <=5 18.27% 16.14% N.A.
1998 44 2 <=5
Composite Assets Annual Performance Results
N.A. - Information is not statistically meaningful due to an insufficient number of portfolios in the composite for the entire year. Risk Managed Manulife VUL Composite was created December 11, 1998. See disclosure on Page 25 - All VUL Risk Managed Composites. Results are net of actual advisory fees and assume all dividends and capital gains are reinvested. Please see disclosure on page 1 of this document.

NCM_ADP_2016 05.11.2017 22
Risk Managed John Hancock VUL Composite Total Firm
Year Assets U.S. Dollars Number of Composite Custom Composite Composite 3 Yr Custom Benchmark
End (millions) (millions) Accounts (net of fees) Benchmark Dispersion Ex-Post Std Dev 3 Yr Ex-Post Std Dev
2016 189 <=1 <=5 8.64% 8.36% N.A. 9.69% 9.52%
2015 159 <=1 <=5 ( 0.20%) ( 2.44%) N.A. 9.35% 9.01%
2014 181 1.2 <=5 5.09% 3.90% 0.16% 8.23% 8.58%
2013 188 1 <=5 21.38% 22.75% N.A. 7.93% 11.61%
2012 209 1 <=5 9.55% 14.11% N.A. 7.76% 14.04%
2011 542 5 <=5 ( 3.80%) ( 3.82%) N.A. 11.39% 16.33%
2010 1464 8 6 2.03% 14.44% 0.50% 13.07% 20.66%
2009 1524 8 6 18.68% 31.36% 5.90%
2008 1045 7 7 (26.70%) (35.65%) 1.10%
2007 1170 4 <=5 5.37% 4.81% N.A.
2006 958 9 6 15.10% 8.66% 0.90%
2005 681 8 6 6.03% 7.16% 1.00%
2004 488 8 7 10.44% 10.39% 1.00%
2003 352 7 10 26.54% 29.03% 0.80%
2002 233 5 10 ( 9.46%) (18.79%) 1.20%
2001 174 6 9 ( 5.86%) (10.41%) 0.40%
2000 116 4 6 2.31% ( 7.14%) N.A.
1999 84 3 <=5 18.13% 19.30% N.A.
1998 44 3 <=5
Composite Assets Annual Performance Results
N.A. - Information is not statistically meaningful due to an insufficient number of portfolios in the composite for the entire year. Risk Managed John Hancock VUL Composite was created December 14, 1998. See disclosure on Page 25 - All VUL Risk Managed Composites. Results are net of actual advisory fees and assume all dividends and capital gains are reinvested. Please see disclosure on page 1 of this document.

NCM_ADP_2016 05.11.2017 23
Risk Managed Security Life of Denver VUL Composite
Total Firm
Year Assets U.S. Dollars Number of Composite Custom Composite Composite 3 Yr Custom Benchmark
End (millions) (millions) Accounts (net of fees) Benchmark Dispersion Ex-Post Std Dev 3 Yr Ex-Post Std Dev
2016 189 <1 <=5 3.85% 10.34% 0.82% 7.46% 9.43%
2015 159 <1 <=5 ( 4.37%) ( 3.19%) N.A. 8.31% 9.02%
2014 181 <1 <=5 7.01% 6.49% N.A. 7.62% 8.30%
2013 188 <1 <=5 20.42% 23.65% N.A. 8.33% 11.27%
2012 209 2 6 3.93% 13.88% 3.12% 8.84% 13.82%
2011 542 10 14 ( 3.84%) ( 1.77%) 1.98% 10.51% 17.14%
2010 1464 14 24 2.29% 16.45% 0.70% 13.22% 20.47%
2009 1524 18 43 14.51% 29.72% 0.90%
2008 1045 14 38 (26.52%) (34.60%) 0.50%
2007 1170 20 41 9.41% 6.66% 0.70%
2006 958 17 27 14.03% 12.45% 0.50%
2005 681 14 23 17.53% 10.11% 0.53%
2004 488 9 17 10.38% 13.83% 0.30%
2003 352 6 12 30.76% 29.43% 0.50%
2002 233 3 8 ( 6.83%) (20.29%) 0.30%
2001 174 3 8 ( 8.53%) (14.49%) N.A.
2000 116 <1 <=5
Composite Assets Annual Performance Results
N.A. - Information is not statistically meaningful due to an insufficient number of portfolios in the composite for the entire year. Risk Managed Security Life of Denver VUL Composite was created December 5, 2000. See disclosure on Page 25 - All VUL Risk Managed Composites. Results are net of actual advisory fees and assume all dividends and capital gains are reinvested. Please see disclosure on page 1 of this document.
Risk Managed Pacific Life VUL Composite (closed 06-10-2016)
Total Firm
Year Assets U.S. Dollars Number of Composite Custom Composite Composite 3 Yr Custom Benchmark
End (millions) (thousands) Accounts (net of fees) Benchmark Dispersion Ex-Post Std Dev 3 Yr Ex-Post Std Dev
2016 189 0 0 N.A. N.A. N.A. N.A. N.A.
2015 159 387 <=5 ( 0.03%) ( 3.23%) N.A. 9.13% 7.27%
2014 181 394 <=5 4.72% 2.96% N.A. 8.96% 7.20%
2013 188 380 <=5 18.39% 15.57% N.A. 8.90% 9.90%
2012 209 395 <=5 2.61% 12.17% N.A. 9.15% 12.69%
2011 542 740 <=5 ( 4.91%) ( 2.25%) N.A. 10.68% 17.14%
2010 1,464 920 <=5 2.41% 14.76% N.A. 15.64% 19.47%
2009 1,524 1,019 6 24.37% 33.00% 1.40%
2008 1,045 1,316 7 (32.82%) (31.99%) 0.20%
2007 1,170 1,288 8 4.13% 6.21% 0.50%
2006 958 1,171 7 13.47% 12.25% 0.00%
2005 681 902 7 11.25% 7.45% 0.30%
2004 488 836 6 13.51% 12.26% 0.30%
2003 352 448 <=5 30.67% 29.58% N.A.
2002 233 354 <=5
Composite Assets Annual Performance Results
N.A. - Information is not statistically meaningful due to an insufficient number of portfolios in the composite for the entire year. Risk Managed Pacific Life VUL Composite was created May 17, 2002. See disclosure on Page 25 - All VUL Risk Managed Composites. Results are net of actual advisory fees and assume all dividends and capital gains are reinvested. Please see disclosure on page 1 of this document.

NCM_ADP_2016 05.11.2017 24
Risk Managed Phoenix VUL Composite (closed 3-26-2013)
Total Firm
Year Assets U.S. Dollars Number of Composite Custom Composite Composite 3 Yr Custom Benchmark
End (millions) (thousands) Accounts (net of fees) Benchmark Dispersion Ex-Post Std Dev 3 Yr Ex-Post Std Dev
2013 188 0 0 N.A. N.A. N.A. N.A. N.A.
2012 209 542 <=5 3.34% 13.32% N.A. 9.4% 13.3%
2011 542 576 <=5 (7.47%) (0.88%) N.A. 12.6% 17.2%
2010 1464 626 <=5 4.13% 16.02% N.A. 12.6% 19.9%
2009 1524 1206 <=5 14.69% 31.25% N.A.
2008 1045 1060 <=5 (22.78%) (34.45%) N.A.
2007 1170 763 <=5 9.19% 7.70% N.A.
2006 958 709 <=5 17.64% 12.68% N.A.
2005 681 813 <=5 12.51% 7.16% N.A.
2004 488 732 <=5 12.50% 12.00% N.A.
2003 352 657 <=5
Composite Assets Annual Performance Results
N.A. - Information is not statistically meaningful due to an insufficient number of portfolios in the composite for the entire year. Risk Managed Phoenix VUL Composite was created August 14, 2003. See disclosure on Page 25 - All VUL Risk Managed Composites. Results are net of actual advisory fees and assume all dividends and capital gains are reinvested. Please see disclosure on page 1 of this document.
Risk Managed Hartford VUL Composite (closed 12-16-2013)
Total Firm
Year Assets U.S. Dollars Number of Custom Composite Composite 3 Yr Custom Benchmark
End (millions) (millions) Accounts Composite Benchmark Dispersion Ex-Post Std Dev 3 Yr Ex-Post Std Dev
2013 188 0 0 N.A. N.A. N.A. N.A. N.A.
2012 209 <1 <=5 6.36% 15.92% N.A. 10.1% 14.2%
2011 542 1 <=5 ( 8.40%) ( 3.14%) N.A. 10.9% 17.0%
2010 1464 1 7 0.25% 14.18% 0.6% 14.9% 21.2%
2009 1524 1 6 22.16% 32.14% 1.1%
2008 1045 5 10 (27.23%) (36.05%) 0.4%
2007 1170 7 10 10.99% 8.38% 1.6%
2006 958 6 10 16.34% 15.51% 0.7%
2005 681 10 12 13.49% 9.77% 2.8%
2004 488 9 14 9.13% 12.44% 0.7%
2003 352 10 18 34.02% 29.86% 1.0%
2002 233 6 10 (11.92%) (16.23%) 0.4%
2001 174 6 7 ( 5.01%) (12.05%) 0.5%
2000 116 6 6 ( 3.57%) ( 4.76%) N.A.
1999 84 3 <=5
Composite Assets Annual Performance Results
N.A. - Information is not statistically meaningful due to an insufficient number of portfolios in the composite for the entire year. Risk Managed Hartford VUL Composite was created April 7, 1999. See disclosure on Page 25 - All VUL Risk Managed Composites. Results are net of actual advisory fees and assume all dividends and capital gains are reinvested. Please see disclosure on page 1 of this document.

NCM_ADP_2016 05.11.2017 25
All VUL Risk Managed Composites contain fully discretionary accounts with a moderate risk strategy that invests in a mixture of equity funds, bond funds, and money market funds. The objective of the Risk Managed Variable Universal Life (VUL) strategy is to reduce portfolio risk and overall loss while seeking to achieve superior returns to its benchmark over a complete market cycle. To accommodate this more conservative approach, the Risk Managed VUL is typically invested in 5 to 10 positions from a broad universe of domestic and international equities, and will employ money market/cash or short* mutual fund positions during adverse market conditions. This strategy cannot be net short in the portfolio. The Risk Managed VUL can be fully invested, partially in cash, completely in cash, or even partially short as a hedge against existing long positions. While the Risk Managed VUL may limit the overall losses suffered during major market declines, it may also limit returns in advancing markets. Risk Managed is our more conservative strategy emphasizing capital preservation over investment return. For comparison purposes is measured against a Custom Benchmark that we construct for each product universe we manage by assuming an equal investment in each of the choices available within that universe (except money market and fixed accounts). Further, the “portfolio” comprising the custom benchmark is rebalanced daily, which creates the un-weighted return of the universe itself. As of January 1, 2004, the Custom Benchmark for each composite has been restated historically to exclude funds that are closed to new investors and funds not traded by Niemann Capital Management, Inc. This benchmark has been changed to improve comparability. This change does not apply to composites created after January 1, 2004. Further information regarding this benchmark is available upon request.

NCM_ADP_2016 05.11.2017 26
Dynamic VULs Dynamic Manulife VUL Composite
Total Firm
Year Assets U.S. Dollars Number of Composite Custom Composite Composite 3 Yr Custom Benchmark
End (millions) (thousands) Accounts (net of fees) Benchmark Dispersion Ex-Post Std Dev 3 Yr Ex-Post Std Dev
2016 189 5,469 6 -0.59% 8.06% 0.6% 12.2% 10.9%
2015 159 5,392 6 5.42% 0.02% 0.4% 11.2% 10.3%
2014 181 4,983 6 9.75% 3.80% 0.8% 10.0% 10.0%
2013 188 4,477 6 26.95% 27.41% 0.6% 12.4% 13.7%
2012 209 3,346 7 21.51% 14.94% 4.9% 14.9% 16.7%
2011 542 2,654 7 ( 2.66%) ( 5.79%) 1.1% 20.1% 18.5%
2010 1464 3,631 9 9.92% 15.46% 0.3% 23.7% 23.7%
2009 1524 3,233 9 22.28% 33.03% 0.6%
2008 1045 2,455 7 (41.63%) (40.07%) 0.2%
2007 1170 3,983 <=5 19.08% 4.99% N.A.
2006 958 3,282 <=5 18.69% 12.49% N.A.
2005 681 2,447 <=5 14.72% 8.20% N.A.
2004 488 910 <=5 13.50% 13.23% N.A.
2003 352 220 <=5 44.29% 34.10% N.A.
2002 233 155 <=5 (17.69%) (24.00%) N.A.
2001 174 130 <=5
Composite Assets Annual Performance Results
N.A. - Information is not statistically meaningful due to an insufficient number of portfolios in the composite for the entire year. Dynamic Manulife VUL Composite was created February 14, 2001. See disclosure on Page 27 - All Dynamic VUL Composites. Results are net of actual advisory fees and assume all dividends and capital gains are reinvested. Please see disclosure on page 1 of this document.
Dynamic Pacific Life VUL Composite (closed 2-21-2012)
Total Firm
Year Assets U.S. Dollars Number of Composite Custom Composite Composite 3 Yr Custom Benchmark
End (millions) (thousands) Accounts (net of fees) Benchmark Dispersion Ex-Post Std Dev 3 Yr Ex-Post Std Dev
2012 209 0 0 N.A. N.A. N.A. N.A. N.A.
2011 542 81 <=5 (7.08%) (4.17%) N.A. 18.8% 20.0%
2010 1464 89 <=5 16.88% 15.96% N.A. 25.6% 21.3%
2009 1524 147 <=5 32.44% 27.48% N.A.
2008 1045 297 6 (46.83%) (35.76%) 0.1%
2007 1170 1192 12 16.31% 7.12% 0.8%
2006 958 1255 9 17.08% 12.75% 0.5%
2005 681 565 <=5 16.93% 8.40% N.A.
Composite Assets Annual Performance Results
N.A. - Information is not statistically meaningful due to an insufficient number of portfolios in the composite for the entire year. Dynamic Pacific Life VUL Composite was created September 1, 2004. See disclosure on Page 27 - All Dynamic VUL Composites. Results are net of actual advisory fees and assume all dividends and capital gains are reinvested. Please see disclosure on page 1 of this document.

NCM_ADP_2016 05.11.2017 27
Dynamic Security Life of Denver VUL Composite (closed 2-12-2013) Total Firm
Year Assets U.S. Dollars Number of Composite Custom Composite Composite 3 Yr Custom Benchmark
End (millions) (thousands) Accounts (net of fees) Benchmark Dispersion Ex-Post Std Dev 3 Yr Ex-Post Std Dev
2013 188 0 0 N.A. N.A. N.A. N.A. N.A.
2012 209 149 <=5 12.07% 13.78% N.A. 15.6% 13.6%
2011 542 385 <=5 (11.82%) 0.49% N.A. 19.2% 16.8%
2010 1464 1353 <=5 11.38% 17.07% N.A. 22.1% 21.7%
2009 1524 1311 6 24.58% 29.69% N.A.
2008 1045 1758 14 (37.96%) (39.10%) 0.6%
2007 1170 3607 12 15.64% 8.76% 0.6%
2006 958 1680 6 17.67% 12.45% N.A.
2005 681 162 <=5
Composite Assets Annual Performance Results
N.A. - Information is not statistically meaningful due to an insufficient number of portfolios in the composite for the entire year. Dynamic Security Life of Denver VUL Composite was created January 12, 2005. See disclosure on Page 27 - All Dynamic VUL Composites. Results are net of actual advisory fees and assume all dividends and capital gains are reinvested. Please see disclosure on page 1 of this document. All Dynamic VUL Composites contain fully discretionary accounts with an aggressive strategy that remains fully invested in equity funds which are rotated to seek to achieve maximum appreciation in all market conditions. The objective of the Dynamic Variable Universal Life (VUL) strategy is to seek to exploit intermediate trends in global markets by being fully invested in domestic and international equities. As a result, the Dynamic VUL takes an aggressive approach, seeking to out-perform its benchmark over a complete market cycle. The Dynamic VUL is typically allocated into 5 to 10 positions from a broad universe of domestic and international equities, encompassing a variety of asset classes and sectors. The Dynamic VUL is a high-risk strategy emphasizing investment return over capital preservation by keeping portfolio assets actively invested at all times. For comparison purposes is measured against a Custom Benchmark that we construct for each product universe we manage by assuming an equal investment in each of the choices available within that universe (except money market and fixed accounts). Further, the “portfolio” comprising the custom benchmark is rebalanced daily, which creates the un-weighted return of the universe itself. As of January 1, 2004, the Custom Benchmark for each composite has been restated historically to exclude funds that are closed to new investors and funds not traded by Niemann Capital Management, Inc. This benchmark has been changed to improve comparability. This change does not apply to composites created after January 1, 2004. Further information regarding this benchmark is available upon request.
3108 Silver Sage Drive Suite 101 | Carson City, NV 89701 | Phone: 800.622.1626 | www.ncm.net
NCM_ADP_2016