angle tracking - datavetenskap - umeå universitet€¦ · · 2004-11-29ptu control pan-tilt unit...
TRANSCRIPT

2004 21-Angle Tracking.doc
MECH4721 SENSORS & SIGNALS 1of18
ANGLE TRACKING
Amplitude Measurement • Amplitude threshold is used to determine that a target is within the beam • This gives a very rough measure of the target direction (within one
beamwidth) if the target RCS is not too high and target return enters the antenna sidelobes
Antenna
Range
Target 1
Target 2
G1
G2
Antenna pattern
Figure 1: Antenna Gain as a function of Angle
Modulated Reflection
Modulated TransmissionTarget
ModulatedTransmitter
BandpassFilter
AmplifierDetector
Antenna
Figure 2: Schematic Diagram of an Active Sensor
• Both pulsed and CW techniques can be used. • Can be applied at microwave frequencies or in the infrared band. • Complex modulation schemes are generally used to:
• Discriminate against ambient solar radiation • Eliminate interference from fluorescent lights • Reduce the probability of interference from other sensors
• Cross-range resolution decreases with range as shown in the diagram

2004 21-Angle Tracking.doc
MECH4721 SENSORS & SIGNALS 2of18
Figure 3: Cross-Range Resolution as a function of Range
• Applications
• Radio tags • CW or modulated IR proximity detectors for industrial & robotic
applications
Near Infrared Proximity Detectors • Commonly used for short range robotic applications • Are not normally used to measure range, just the presence of a target
within the beam. • Operate in the near IR (at a wavelength just longer than visible light,
typically 880nm) • Visible to CCD’s so can be observed using a video camera. • A typical receiver made by Sharp Electronics (GP1U52X) is shown here
with a near infrared LED transmitter.
Figure 4: Infrared Proximity Detector
• This receiver package includes a photodiode, amplifiers, filters and a
limiter. • The receiver responds to a burst modulated 40kHz signal with an on-off
period of 600+600µs. The digital output goes low is a target is detected.

2004 21-Angle Tracking.doc
MECH4721 SENSORS & SIGNALS 3of18
ANGLE TRACKING • Using the antenna beam pattern, it is possible to get a more accurate
bearing on the target by sweeping the beam across it and noting changes in the signal amplitude.
Time
Ampl
itude
Q 1
Q 2
Q 3 Q 1Q 2
Q 3Beam movingacross Target
• Increases the angular resolution with only a marginal effect on the range
accuracy • Reduces the “effective” beamwidth of the antenna • Extremely accurate angle measurements can be achieved by null steering
the antenna • For a point target, the theoretical improvement in accuracy in thermal
noise is limited only by the signal to noise ratio of the measurement
nr
dBt fNSk β
θσ/)/(2
3= deg
where: θ3dB – Antenna Beamwidth (deg) k – Constant dependant on the tracking type S/N – Signal to noise ratio fr – Radar pulse repetition frequency (Hz) βn – Angle servo bandwidth (Hz)
Tracking Techniques • Lobe Switching • Conical Scan • Monopulse • Triangulation (possibly)

2004 21-Angle Tracking.doc
MECH4721 SENSORS & SIGNALS 4of18
Lobe Switching (Sequential Lobing)
Figure 5: Sequential Lobing
• Sequential Transmission from two antennas with overlapping but offset
beam patterns. • Sequential returns will be amplitude modulated if the target is not on
boresight. • This AM can be used to generate an angle error estimate, or used to drive
the antenna to null the error • Two additional switching positions are needed to obtain the angular error
in the orthogonal axis, so 4 pulses are required to control the antenna in 2D.
• This technique can be used for EM or acoustic tracking systems • Most non scanning collision avoidance radars use this technique with
either 2 or 3 lobes to determine the angular offset of cars • A passive version of lobe switching is often used for direction finding
applications
2004 21-Angle Tracking.doc
MECH4721 SENSORS & SIGNALS 5of18
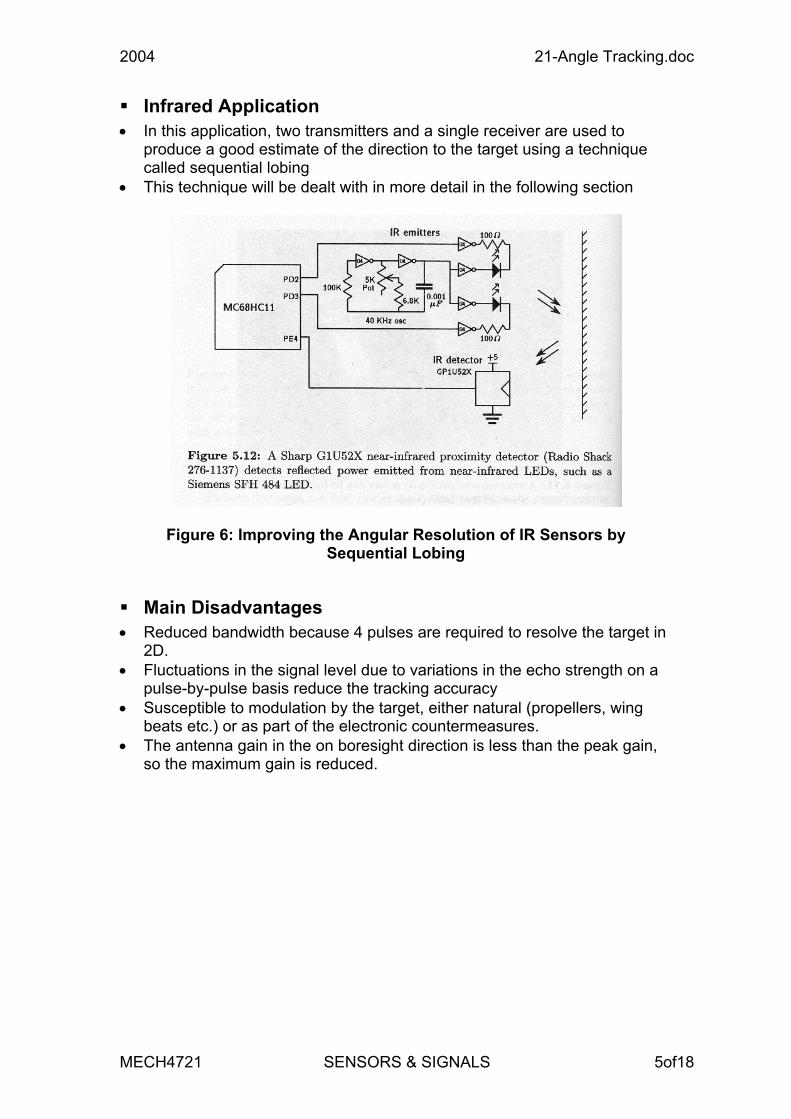
Infrared Application • In this application, two transmitters and a single receiver are used to
produce a good estimate of the direction to the target using a technique called sequential lobing
• This technique will be dealt with in more detail in the following section
Figure 6: Improving the Angular Resolution of IR Sensors by Sequential Lobing
Main Disadvantages • Reduced bandwidth because 4 pulses are required to resolve the target in
2D. • Fluctuations in the signal level due to variations in the echo strength on a
pulse-by-pulse basis reduce the tracking accuracy • Susceptible to modulation by the target, either natural (propellers, wing
beats etc.) or as part of the electronic countermeasures. • The antenna gain in the on boresight direction is less than the peak gain,
so the maximum gain is reduced.

2004 21-Angle Tracking.doc
MECH4721 SENSORS & SIGNALS 6of18
Conical Scan
Figure 7: Conical Scanning
• A single beam displaced in angle by less than the antenna beamwidth is
nutated on its axis. (Nutated means spinning without rotating the polarisation) • Beam displacement is often achieved by incorporating a rotating sub-
reflector in a Cassegrain antenna as shown in the figure
Figure 8: Cassegrain Conical Scan Antenna • The scan rate is generally limited to between 5 and 25 pulses per
revolution for long range operation, but at short range where the PRF is higher, many more pulses are received.

2004 21-Angle Tracking.doc
MECH4721 SENSORS & SIGNALS 7of18
• Amplitude modulation of target returns will be a function of the position of the boresight with respect to the target.
• Phase detectors (multipliers) using quadrature phase references for the two orthogonal axes demodulate the received signal to generate the angle tracking error
Figure 9: Block Diagram of a Conical Scan Radar
• Typically used in tracking radars • Simple to implement, uses a single beam and a single receiver and
transmitter • Beacon tracking can be implemented without the transmitter and without
the range gating circuitry
Figure 10: Conscan Tracker on Pedestal
2004 21-Angle Tracking.doc
MECH4721 SENSORS & SIGNALS 8of18
Main Disadvantages • Reduced bandwidth because of the number of pulses required for tracking. • Fluctuations in the echo signal amplitude induce tracking errors • Sensitive to target modulation • Modified conscan techniques have been developed to eliminate the
modulation problem: Dual Conscan (Russian Design) COSRO (Conscan on receive only)
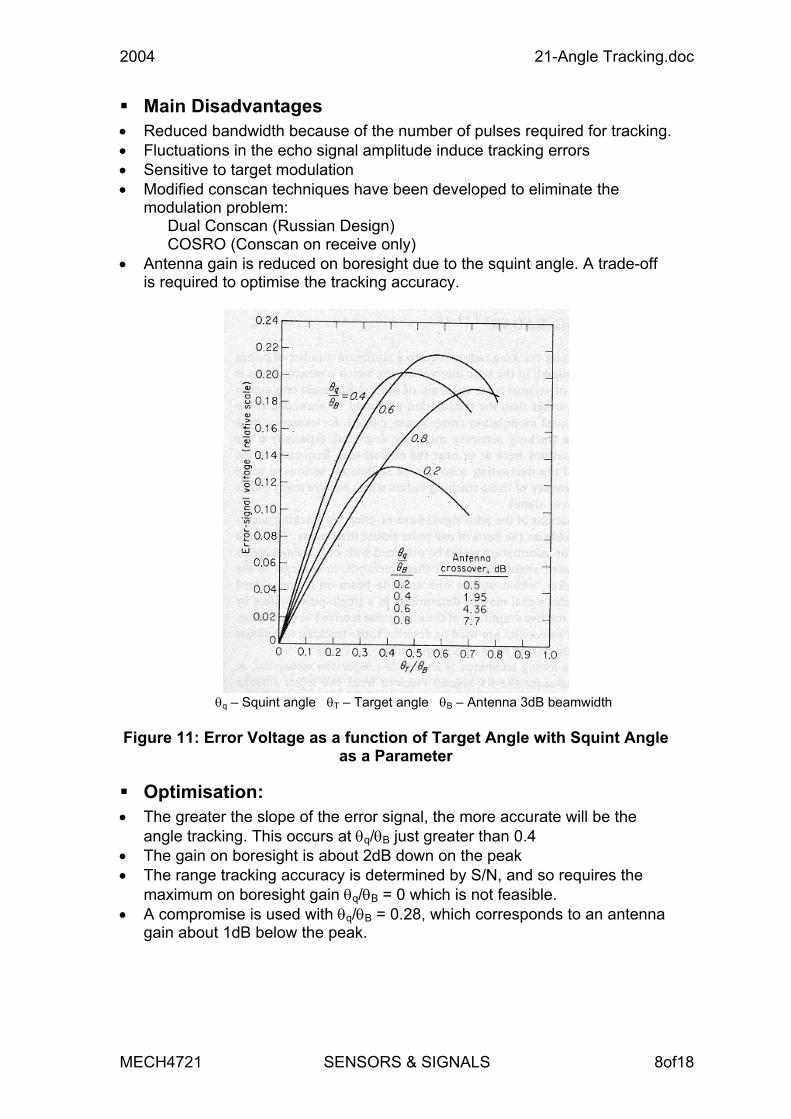
• Antenna gain is reduced on boresight due to the squint angle. A trade-off is required to optimise the tracking accuracy.
θq – Squint angle θT – Target angle θB – Antenna 3dB beamwidth
Figure 11: Error Voltage as a function of Target Angle with Squint Angle
as a Parameter
Optimisation: • The greater the slope of the error signal, the more accurate will be the
angle tracking. This occurs at θq/θB just greater than 0.4 • The gain on boresight is about 2dB down on the peak • The range tracking accuracy is determined by S/N, and so requires the
maximum on boresight gain θq/θB = 0 which is not feasible. • A compromise is used with θq/θB = 0.28, which corresponds to an antenna
gain about 1dB below the peak.

2004 21-Angle Tracking.doc
MECH4721 SENSORS & SIGNALS 9of18
Other considerations • Automatic Gain Control (AGC) that is required to normalise the pulse
amplitude for range tracking must be carefully designed not to interfere with the conscan modulation.
Measuring the Error Function of a Conically Scanned Antenna
• A conscan antenna is mounted on a pan-tilt unit and swept past a point source of radiation (in the far field of the antenna)
• The received signal level at the output of the antenna is logged as a function of time (or angle)
94GHz Source
PTU ControlPan-Tilt
Unit
PC stores the angleerror voltages from the receiver and the
PTU angle
Angle Error Voltages
Conical ScanReceiver
Figure 12: Mechanism for Measuring Conscan Error Transfer Function
• As shown in the figure (a) below, • The AC component of the signal level starts out low, when the offset is
large • It then increases to a peak when the beam squint angle equals the
target offset on the one side • On axis, the beam offset is symmetrical so there is no modulation, and
so the AC component reduces to zero • At the cross-over point the phase of the modulation is reversed but the
shape of the modulation is the mirror image due to the symmetry of the process
• In the figure (b) below, both the modulation signal and the reference signal are shown. Note the 180° phase shift at crossover
• In figure (c), the synchronously demodulated signal is shown. Note that there is a DC component and an AC component at twice the modulation frequency
• Figure (d) shows the filtered demodulated signal showing only the DC which is the conscan error signal

2004 21-Angle Tracking.doc
MECH4721 SENSORS & SIGNALS 10of18
(a) (b)
(c) (d)
Figure 13: Conscan Demodulation Process Showing the following: a) Modulated signal as antenna sweeps past source b) Modulated signal and reference signal showing phase reversal c) The demodulation product of the signal and the reference. d) Filtered demodulated error signal mapped to angle
Amplitude Comparison Monopulse • Two overlapping antenna beams for each of the two orthogonal axes are
generated from a single reflector illuminated by 4 adjacent feed horns
Figure 14: Monopulse Sum Channel Beam Pattern

2004 21-Angle Tracking.doc
MECH4721 SENSORS & SIGNALS 11of18
• The sum pattern Σ of the 4 horns is used on transmit and for range
measurement on receive.
Figure 15:Monopulse Difference Channel Beam Patterns
• On receive the four horns produce 3D beam patterns as shown in the
figure above. • When viewed from the front, the beam patterns are as shown in the cross
section shown below.
Figure 16: Combining Beams to Produce Sum and Difference Channel Signals
• The difference patterns ∆Az and ∆El are produced on receive using a
microwave hybrid circuit called a monopulse comparator • The monopulse comparator comparator uses phasor additions and
subtractions of the RF signals to produce output signals whose amplitude and phase relationships are maintained

2004 21-Angle Tracking.doc
MECH4721 SENSORS & SIGNALS 12of18
Figure 17: Hybrid Configuration to Produce Sum and Difference Channel
Signals at the Transmit Frequency • The difference channel signals are normalised with respect to the sum
channel to produce an error signal that is independent of the echo amplitude
Figure 18: Normalised Sum and Difference Channel Gains

2004 21-Angle Tracking.doc
MECH4721 SENSORS & SIGNALS 13of18
• This ratio can be obtained using an AGC circuit that operates on the two
difference channels and is driven by the sum channel, or by division in a digital tracker.
• A standard envelope detector generates the sum channel voltage signal from the sum channel IF
• Phase detectors demodulate the azimuth and elevation error signals using the sum channel IF signal as a reference to produce the two error voltages
• The sum and difference channel voltage signals can be modelled quite accurately using the following formulae:
)28.2sin(707.0)14.1(cos2
∆=∆=
dif
sum
EE
where Esum – Normalised sum channel output voltage Edif – Difference channel output voltage (normalised to sum channel)
∆ - Angle from the beam axis normalised wrt to the half power sum channel beamwidth
• New error measurements are produced with every pulse, hence MONOPULSE
Figure 19: Schematic Diagram of a Monopulse Front End
Uses • In combination with range trackers as shown in the schematic above,
monopulse techniques are generally used for modern tracking radar systems
• The technique can be used for direction finding (DF) systems or beacon tracking
• Can be used by EM or acoustic systems. • Quadrant detectors that apply the same basic principles are generally
used by laser trackers

2004 21-Angle Tracking.doc
MECH4721 SENSORS & SIGNALS 14of18
Comparison between Conscan and Monopulse • Greater S/N for the same size target with monopulse due to the higher on-
boresight antenna gain, only the gains of the difference channel signals are reduced by the beam squint angle.
• Steeper error slope near the origin results in superior tracking accuracy • Because new tracking information is generated with each new pulse,
tracking is not degraded by fluctuations in echo amplitude.
Figure 20: Error Signal Slope as a function of Squint Angle
Instrument Landing System (ILS) • An inverted application of the monopulse, dual beam concept • The ILS facilities are a highly accurate and dependable means of
navigating an aircraft to the runway in low visibility • It consists of
• A localiser transmitter • A glide path transmitter • An outer marker (can be replaced by a non directional beacon or other
fix) • The approach lighting system
• A category I ILS provides guidance information down to a decision height (DH) of 200ft.
• With good equipment ILS can even be used for Category II approaches, 100ft on the radar altimeter.
• The ILS provides both lateral and vertical guidance necessary to fly a precision approach if glide slope information is provided.
2004 21-Angle Tracking.doc
MECH4721 SENSORS & SIGNALS 15of18
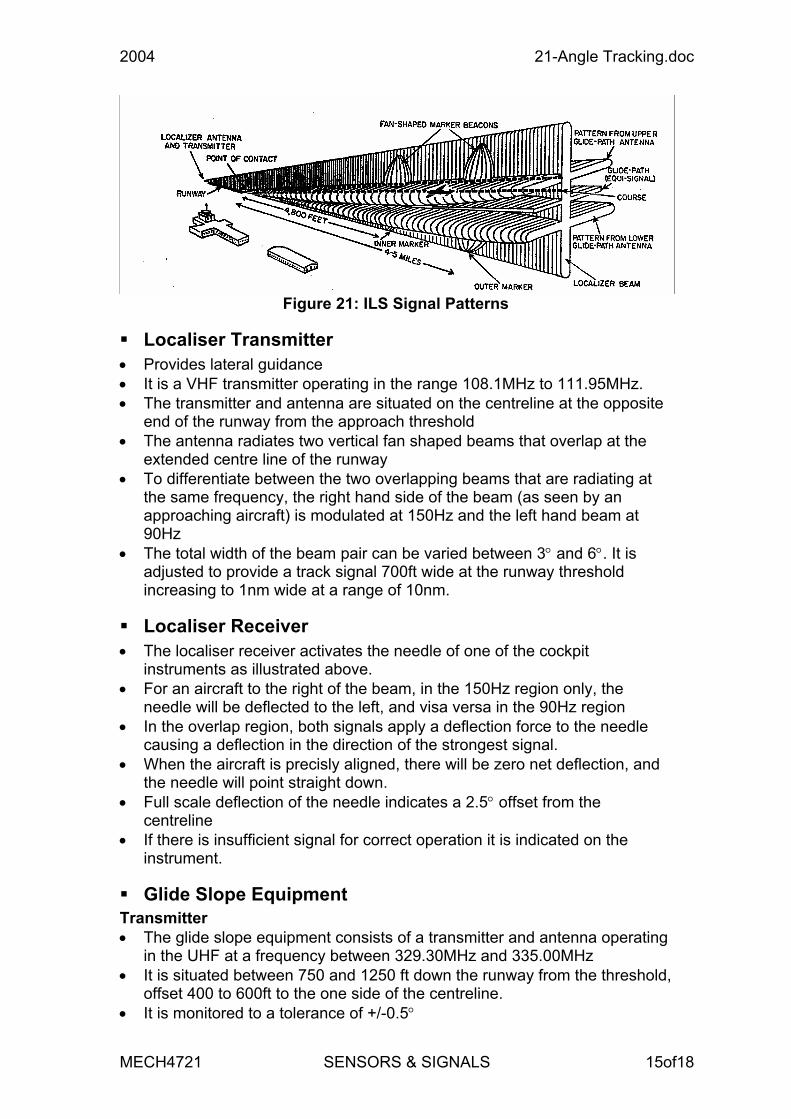
Figure 21: ILS Signal Patterns
Localiser Transmitter • Provides lateral guidance • It is a VHF transmitter operating in the range 108.1MHz to 111.95MHz. • The transmitter and antenna are situated on the centreline at the opposite
end of the runway from the approach threshold • The antenna radiates two vertical fan shaped beams that overlap at the
extended centre line of the runway • To differentiate between the two overlapping beams that are radiating at
the same frequency, the right hand side of the beam (as seen by an approaching aircraft) is modulated at 150Hz and the left hand beam at 90Hz
• The total width of the beam pair can be varied between 3° and 6°. It is adjusted to provide a track signal 700ft wide at the runway threshold increasing to 1nm wide at a range of 10nm.
Localiser Receiver • The localiser receiver activates the needle of one of the cockpit
instruments as illustrated above. • For an aircraft to the right of the beam, in the 150Hz region only, the
needle will be deflected to the left, and visa versa in the 90Hz region • In the overlap region, both signals apply a deflection force to the needle
causing a deflection in the direction of the strongest signal. • When the aircraft is precisly aligned, there will be zero net deflection, and
the needle will point straight down. • Full scale deflection of the needle indicates a 2.5° offset from the
centreline • If there is insufficient signal for correct operation it is indicated on the
instrument.
Glide Slope Equipment Transmitter • The glide slope equipment consists of a transmitter and antenna operating
in the UHF at a frequency between 329.30MHz and 335.00MHz • It is situated between 750 and 1250 ft down the runway from the threshold,
offset 400 to 600ft to the one side of the centreline. • It is monitored to a tolerance of +/-0.5°

2004 21-Angle Tracking.doc
MECH4721 SENSORS & SIGNALS 16of18
• It consists of two overlapping horizontal fan beams modulated at 90 and 150Hz respectively.
• The thickness of the overlap is 1.4°, or 0.7° above and below the optimum glide slope
• The glide slope may be adjusted between 2 and 4.5° above the horizontal plane depending on any obstructions along the approach path.
• Because of the antenna construction, no false signals can be obtained at angles below the selected glide slope, but are generated at multiples of the glide slope angle.
• The first is at about 6°. It can be identified because the instrument response is the reciprocal of the correct response.
Receiver • The glide slope signal activates the glide slope needle in a manner
analogous to that of the localiser. • If there is sufficient signal, the needle will show full deflection until the
aircraft reaches the point of signal overlap, at this time the needle will show partial deflection in the direction of the strongest signal
• When both signals are equal, the needle shows horizontally indicating that the aircraft is precisely on the glide path.
• With 1.4° of overlap, the glide slope area is approximately 1500ft thick at 10nm reducing to less than 1ft at touchdown
• A single instrument provides indication for both vertical and lateral guidance.
Triangulation • The basic technique is thousands of years old • Techniques include:
• Bearing only • Range only • Hybrid range and bearing
30.96°
168.11°
94.09°
R 62.65 mmR 71.59 mm
R 45.28 mm
Triangulationusing Angles
Triangulationusing Range (TOF)
Figure 22: Position by Triangulation
2004 21-Angle Tracking.doc
MECH4721 SENSORS & SIGNALS 17of18
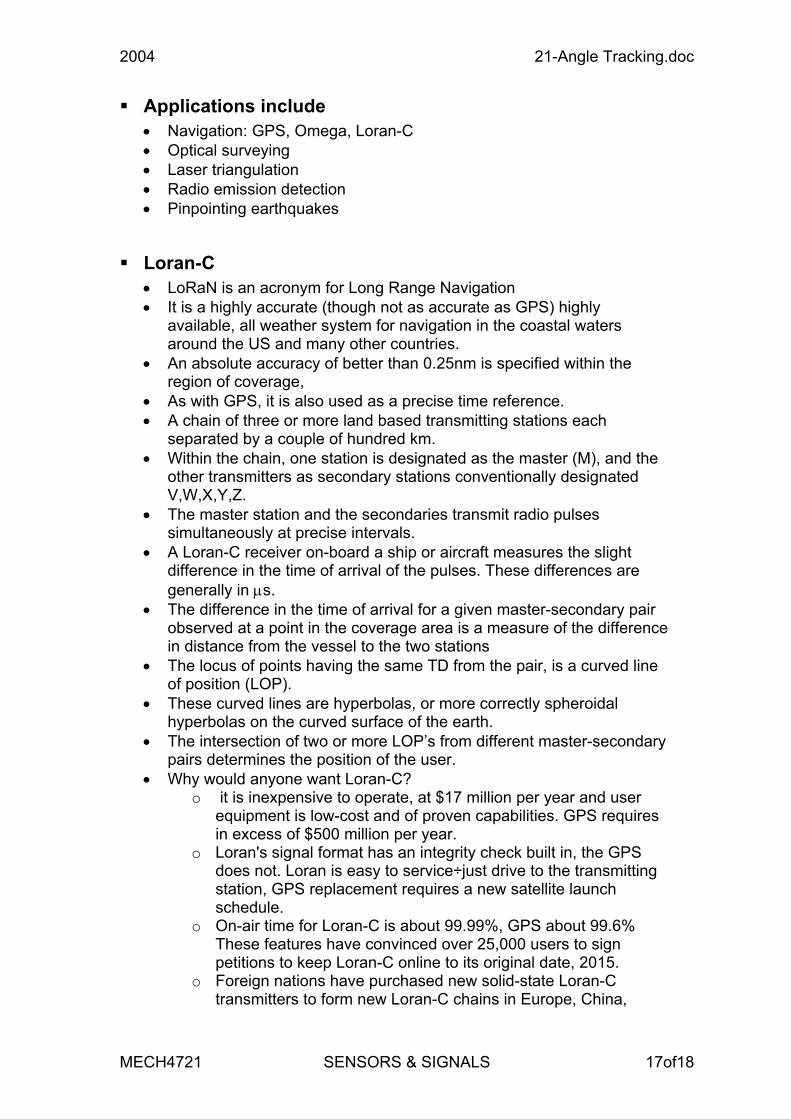
Applications include • Navigation: GPS, Omega, Loran-C • Optical surveying • Laser triangulation • Radio emission detection • Pinpointing earthquakes
Loran-C • LoRaN is an acronym for Long Range Navigation • It is a highly accurate (though not as accurate as GPS) highly
available, all weather system for navigation in the coastal waters around the US and many other countries.
• An absolute accuracy of better than 0.25nm is specified within the region of coverage,
• As with GPS, it is also used as a precise time reference. • A chain of three or more land based transmitting stations each
separated by a couple of hundred km. • Within the chain, one station is designated as the master (M), and the
other transmitters as secondary stations conventionally designated V,W,X,Y,Z.
• The master station and the secondaries transmit radio pulses simultaneously at precise intervals.
• A Loran-C receiver on-board a ship or aircraft measures the slight difference in the time of arrival of the pulses. These differences are generally in µs.
• The difference in the time of arrival for a given master-secondary pair observed at a point in the coverage area is a measure of the difference in distance from the vessel to the two stations
• The locus of points having the same TD from the pair, is a curved line of position (LOP).
• These curved lines are hyperbolas, or more correctly spheroidal hyperbolas on the curved surface of the earth.
• The intersection of two or more LOP’s from different master-secondary pairs determines the position of the user.
• Why would anyone want Loran-C? o it is inexpensive to operate, at $17 million per year and user
equipment is low-cost and of proven capabilities. GPS requires in excess of $500 million per year.
o Loran's signal format has an integrity check built in, the GPS does not. Loran is easy to service÷just drive to the transmitting station, GPS replacement requires a new satellite launch schedule.
o On-air time for Loran-C is about 99.99%, GPS about 99.6% These features have convinced over 25,000 users to sign petitions to keep Loran-C online to its original date, 2015.
o Foreign nations have purchased new solid-state Loran-C transmitters to form new Loran-C chains in Europe, China,

2004 21-Angle Tracking.doc
MECH4721 SENSORS & SIGNALS 18of18
Japan and Russia. This land-based navigation system is viewed as a desireable, stable complement to the future GNSS of the world civilian community.
o And Loran is totally unclassified and is operated by host country authorities÷not the U.S. military.
• Why does the military, who designed the GPS system, not rely on it totally?
o The ease of which GPS can be jammed either on purpose or by unexpected interferences is certainly a major reason. The on-purpose jamming is well documented by the U.S. military, the International Association of Lighthouses and the Civil Aviation Authority (UK).
o A one watt jammer about 5x5x10cm with a 10cm antenna can block out a 60km diameter circle. Picture that near your local airport (such a unit costs about $100.USD).
o If you want a jammer for GPS and Glonass, (the Russian equivalent to the GPS), such units were offered for sale by the Aviaconversia Company, Russia, which displayed them at a recent Moscow Air Show. Their jamming range was said to be 200km. What was the reaction by the FAA? "Nothing new" because there are "hundreds of these devices on the market".
References [1] M.Skolnik, Radar Handbook, McGraw Hill, 1970 [2] N.Currie (ed), Radar reflectivity Measurement: Techniques & Applications, Artech House, 1989. [3] M.Skolnik, Introduction to Radar Systems, McGraw Hill, 1980 [4] Navigation Systems- The Instrument Landing System, http://www.allstar.fiu.edu/aero/ils.html, 29/02/2000. [5] Marine Radio Beacons, http://www.navcen.uscg.mil/policy/loran/h-book/book-1.txt, 28/02/2000. [6] Loran C, http://www.landings.com/_landings/reviews-opinions/loran-c.html, 18/04/2001 [7] H.Jacobowitz, Electronics Made Simple, Doubleday, 1965