analysis of telecommunication markets of india, …438913/fulltext… · · 2011-09-06analysis of...
TRANSCRIPT
UPM-ETSI Industriales – C/ José Gutiérrez Abascal, 2 28006 Madrid (España)
POLIMI – Piazza Leonardo da Vinci, 32 20133 Milano (Italy)
KTH – SE 100 44 Stockholm (Sweden)
0
Title:
Analysis of
Telecommunication
Markets of India,
Singapore and Thailand
and Research Their
Global Competitiveness
Author:
Ju-Han Huang
Tutor:
Staffan Laestadius, KTH
Company:
Telefonica International Wholesale Services
Stockholm, June, 15th, 2011
UPM-ETSI Industriales – C/ José Gutiérrez Abascal, 2 28006 Madrid (España)
POLIMI – Piazza Leonardo da Vinci, 32 20133 Milano (Italy)
KTH – SE 100 44 Stockholm (Sweden)
1
Analysis of Telecommunication Markets of India,
Singapore and Thailand and Research Their Global
Competitiveness
JU-HAN HAUGN
Master of Science Thesis
Stockholm, Sweden 2011
UPM-ETSI Industriales – C/ José Gutiérrez Abascal, 2 28006 Madrid (España)
POLIMI – Piazza Leonardo da Vinci, 32 20133 Milano (Italy)
KTH – SE 100 44 Stockholm (Sweden)
2
Master of Science Thesis INDEX 2011
Analysis of Telecommunication Markets of India,
Singapore and Thailand and Research Their Global
Competitiveness
JU-HAN HUANG
Approved
2011-June-15
Examiner
IMIM Scientific Committee
Supervisor
Staffan Laestadius
Commissioner
N/A
Contact person
JU-HAN HUANG
UPM-ETSI Industriales – C/ José Gutiérrez Abascal, 2 28006 Madrid (España)
POLIMI – Piazza Leonardo da Vinci, 32 20133 Milano (Italy)
KTH – SE 100 44 Stockholm (Sweden)
3
Acknowledgement
This master thesis was completed in a Spanish Telecom company,
Telefonica International Wholesale Services, based in Madrid, Spain. During
these days, I have furthered my knowledge and acquired practical
experiences of business development of South East Asian region.
I would like to thank my academic professor Staffan Laestadius from the KTH
Royal Institute of Technology who have given me suggestions and feedbacks
about my thesis. Then, the professor Cali Nurr from KTH coordinated
meticulously with other two schools I studied: Politecnico Di Milano in Italy
and Universidad Politécnica De Madrid in Madrid. Besides, thank my
managers of business development department of South East Asian region,
David, and Maria, instructed me on sales of Telecom business with
wholesalers over the world. Thank Human Resource Manager of TIWS,
Veronica, for gaving me this opportunity to compose my master thesis in
TIWS. Finally, I want to thank my parents Shih Zong Huang and Li Hua Chu.
They always support me in my life no matter what happens.
Ju-Han, Huang
Madrid, Spain
15 June 2011
UPM-ETSI Industriales – C/ José Gutiérrez Abascal, 2 28006 Madrid (España)
POLIMI – Piazza Leonardo da Vinci, 32 20133 Milano (Italy)
KTH – SE 100 44 Stockholm (Sweden)
4
Abstract
The objective of this paper is to investigate the telecommunication markets in
India, Singapore and Thailand in order to find the potentiality of the markets
which could be considered by the company to expand its business in
telecommunication field and also to take a proper strategy. Michael Porter
proposed a model that allows analyzing why some nations are more
competitive than others are, and why some industries within nations are more
competitive than others are. (Porter, 1990) Porter believed that there are four
main determinants which can shape the nation‘s competitiveness. In this
paper ―Diamond model‖ was practiced to analyze three considerable different
telecom markets: India, Singapore and Thailand. The Indian telecom
industry is the world's fastest growing industry. Singapore is a miniscule
nation with slight population and nature resource scarcity but Singapore has
developed its national ICT industry successful ranks in 2nd place out of 138
countries in 2010-2011. Thailand‘s mobile penetration rate has reached to
100% but its 3G service still could not move forward. The research found that
Singapore‘s telecom industry is highly competitive in the global environment.
India‘s telecom industry within its nation is more competitive than the other
industries. On the contrary, Thailand‘s telecom industry develops not as
superior as other industries such as its manufacturing or trading. At the end,
predictions for the short time and suggestions of these objective markets
have been commented to contribute to telecom business development in
Asian region for target audience.
UPM-ETSI Industriales – C/ José Gutiérrez Abascal, 2 28006 Madrid (España)
POLIMI – Piazza Leonardo da Vinci, 32 20133 Milano (Italy)
KTH – SE 100 44 Stockholm (Sweden)
5
Table of Content
Abstract ................................................................................................................ 4
Content ................................................................................................................. 5
List of Figure ....................................................................................................... 13
List of Table......................................................................................................... 15
List of Acronyms .................................................................................................. 16
1. Introduction ................................................................................................ 21
1.1. Research Background ......................................................................................... 21
1.2. Research Objective ............................................................................................ 22
1.3. Target Audience ................................................................................................. 22
1.4. Research Question & Limitation ......................................................................... 23
2. The Research Process and Methodology ...................................................... 24
2.1. Research Process ............................................................................................... 24
2.1.1.Analysis of Wholesale Business Model of Telecom Industry ............................................... 25
2.1.2.Define Problem and Research Objective.............................................................................. 25
2.1.3.The Development of Theory ................................................................................................ 26
2.1.4.Choice of Country, and Market ............................................................................................ 26
2.1.5.Search for Empirical Information, and Presentation of Data ............................................... 27
2.1.6.Analysis National Telecom Industries .................................................................................. 28
2.1.7. Comparison of Telecom Industry of India, Singapore, Thailand and Global Telecom Market 29
2.1.8.Comparison with the Networked Readiness Index 2010-2011 of World Economic Forum . 29
2.1.9.Conclusion and Recommendation ....................................................................................... 30
2.2. Methodology ..................................................................................................... 30
3. Theoretical Framework ................................................................................ 37
3.1. Trade theories and international competitiveness of countries ........................... 37
3.2. National Diamond .............................................................................................. 45
3.2.1.Factor Conditions ................................................................................................................. 48
UPM-ETSI Industriales – C/ José Gutiérrez Abascal, 2 28006 Madrid (España)
POLIMI – Piazza Leonardo da Vinci, 32 20133 Milano (Italy)
KTH – SE 100 44 Stockholm (Sweden)
6
3.2.2.Demand Conditions .............................................................................................................. 51
3.2.3.Related and Supporting Industries ....................................................................................... 52
3.2.4.Corporate strategy, Structure and Rivalry ........................................................................... 54
3.2.5.Chance .................................................................................................................................. 54
3.2.6.Government ......................................................................................................................... 55
3.3. SWOT Analysis ................................................................................................... 56
3.3.1.SWOT .................................................................................................................................... 56
3.3.2.SWOT--CLPV ......................................................................................................................... 58
3.3.2.1.Leverage effect (strengths + opportunities): ................................................................ 59
3.3.2.2.Inhibition (opportunities + weaknesses): ..................................................................... 59
3.3.2.3.Vulnerability (strengths + threats): .............................................................................. 60
3.3.2.4.Problematic (weaknesses + threats): ........................................................................... 60
3.3.3.SWOT Analysis Steps ............................................................................................................ 60
4. Business Model of Spanish International Wholesale Telecommunication
Company............................................................................................................. 61
4.1. Introduction ...................................................................................................... 61
4.2. Services of International Wholesale Services ...................................................... 62
4.3. Analysis of Business Model of IWS (International Wholesale Services) ................ 63
4.3.1.Data Business ....................................................................................................................... 63
4.3.1.1.SDH/ SONET Services ............................................................................................... 64
4.3.1.2.DWDM Service ......................................................................................................... 65
4.3.1.3.The Network ............................................................................................................ 66
4.3.2.Voice Business ...................................................................................................................... 71
4.3.2.1.Traditional business model of international voice .................................................. 71
4.3.2.2.Bilateral Agreement ................................................................................................. 73
4.3.2.3.Hubbing Business ..................................................................................................... 75
4.3.2.4.Tromboning ............................................................................................................. 76
4.3.2.5.Simbox ..................................................................................................................... 77
4.4. IWS (Spanish International Wholesale Services) Dimension ................................. 79
4.4.1.VOIP Evolution ..................................................................................................................... 79
4.4.2.Sales Model .......................................................................................................................... 79
4.4.3.NGN Model (Next Generation Network) .............................................................................. 80
UPM-ETSI Industriales – C/ José Gutiérrez Abascal, 2 28006 Madrid (España)
POLIMI – Piazza Leonardo da Vinci, 32 20133 Milano (Italy)
KTH – SE 100 44 Stockholm (Sweden)
7
5. Research Findings: India ............................................................................... 81
5.1. The Country Overview ....................................................................................... 81
5.1.1.Economic factors .................................................................................................................. 81
5.2. Telecom market in India ..................................................................................... 81
5.2.1.Fixed operators .................................................................................................................... 82
5.2.2.Fixed Line Market Share ....................................................................................................... 83
5.2.3.Other Fixed Line Operators .................................................................................................. 83
5.2.4.Mobile Operators ................................................................................................................. 84
5.2.5.Mobile market share ............................................................................................................ 84
5.2.6.Mobile sector ....................................................................................................................... 85
5.2.7.The circles/ service areas ..................................................................................................... 86
5.3. Licenses ............................................................................................................. 87
5.4. The market share of operators in India ............................................................... 88
5.5. Major Telecom Operators in India ...................................................................... 89
5.5.1.Bharti Airtel .......................................................................................................................... 89
5.5.1.1.Local infrastructure in India ......................................................................................... 90
5.5.1.2.Global transmission services of Bharti ......................................................................... 90
5.5.1.3.Services of Bharti .......................................................................................................... 90
5.5.1.4.MPLS Bharti Airtel ........................................................................................................ 91
5.5.1.5.Global IP Transit Services ............................................................................................. 91
5.5.1.6.Other Services of Bharti ............................................................................................... 91
5.5.2.Group Tata ........................................................................................................................... 92
5.5.2.1.Introduction of Group Tata .......................................................................................... 92
5.5.2.2.Tata Communications ................................................................................................... 92
5.5.2.3.Global Transmission Services of Tata ........................................................................... 93
5.5.2.4.Global Service MPLS of Tata ......................................................................................... 93
5.5.2.5.Tata MPLS Network Coverage in Asia .......................................................................... 94
5.5.2.6.Features of MPLS Network Tata ................................................................................... 94
5.5.2.7.Value Added Services of Tata ....................................................................................... 95
5.5.2.8.Other Services of Tata .................................................................................................. 95
5.5.3.Group Reliance ..................................................................................................................... 96
5.5.3.1.Introduction of Group Reliance .................................................................................... 96
UPM-ETSI Industriales – C/ José Gutiérrez Abascal, 2 28006 Madrid (España)
POLIMI – Piazza Leonardo da Vinci, 32 20133 Milano (Italy)
KTH – SE 100 44 Stockholm (Sweden)
8
5.5.3.2.Reliance Globalcom ...................................................................................................... 96
5.5.3.3.Services of Reliance Globalcom .................................................................................... 96
5.5.4.BSNL ..................................................................................................................................... 97
5.5.5.IDEA CELLULAR LTD. ............................................................................................................. 97
5.5.6.VODAFONE ESSAR ................................................................................................................ 97
5.5.7.AIRCEL .................................................................................................................................. 97
6. Research Findings: Singapore ....................................................................... 99
6.1. The Country Overview ....................................................................................... 99
6.2. The economy of Singapore ................................................................................. 99
6.3. Telecom Market of Singapore ............................................................................. 99
6.4. The Number of Telecom Providers in Singapore (till May 2011) ......................... 100
6.5. Fixed Line Market in Singapore ......................................................................... 101
6.5.1.Fixed Telephone Providers in Singapore ............................................................................ 101
6.5.2.Fixed Line Market Share in Singapore ................................................................................ 101
6.5.3.Statistics of Fixed Line of Singapore ................................................................................... 102
6.6. Mobile Market in Singapore ............................................................................. 103
6.6.1.The Mobile Market Share in Singapore .............................................................................. 103
6.6.2.Statistics of Mobile Market of Singapore ........................................................................... 104
6.6.3.International Telephone Calls ............................................................................................ 104
6.7. Data Market in Singapore................................................................................. 105
6.8. Operators in Singapore .................................................................................... 106
6.8.1.Singapore Telecommunications Limited (SingTel) ............................................................. 106
6.8.1.1.Network of SingTel ..................................................................................................... 106
6.8.2.StarHub Limited ................................................................................................................. 107
6.8.3.M1 Limited ......................................................................................................................... 107
7. Research Findings: Thailand ....................................................................... 108
7.1. The Country Overview ..................................................................................... 108
7.2. Economics of Thailand ..................................................................................... 108
7.3. Telecom Market Overview of Thailand ............................................................. 108
UPM-ETSI Industriales – C/ José Gutiérrez Abascal, 2 28006 Madrid (España)
POLIMI – Piazza Leonardo da Vinci, 32 20133 Milano (Italy)
KTH – SE 100 44 Stockholm (Sweden)
9
7.4. Fixed Operators ............................................................................................... 109
7.4.1.Thailand Fixed Line ............................................................................................................. 109
7.4.2.Fixed Line Market Share ..................................................................................................... 109
7.5. Mobile Operators ............................................................................................ 111
7.5.1.Percentage of Mobile Users ............................................................................................... 111
7.5.2.Total Market Share of Mobile Service in Thailand from 2009 Q3 – 2010 Q3 .................... 113
7.5.3.Mobile Sector in Thailand .................................................................................................. 113
7.5.4.Coverage and areas ............................................................................................................ 114
7.6. Data Market in Thailand ................................................................................... 114
7.7. International telephone services market in Thailand ......................................... 114
7.8. Interconnection ............................................................................................... 115
7.8.1.Interconnection Carriers .................................................................................................... 115
7.9. International Internet Gateways ...................................................................... 116
7.10. Submarine Cables in Thailand ........................................................................... 116
7.11. BTO Network in Thailand (Build Transfer Operate) ............................................ 117
7.12. Telecom Operators in Thailand ......................................................................... 117
7.12.1.AIS Introduction (Advanced Info Service) ........................................................................ 117
7.12.2.DTAC (Total Access Communication Public Company Limited) ....................................... 118
7.12.3.True (formerly Orange) ................................................................................................. 118
7.12.3.1.TIG (True International Gateway) ............................................................................. 118
7.12.4.Hutch ................................................................................................................................ 119
7.12.5.TOT (TOT Public Company Limited) ................................................................................. 119
7.12.6.CAT ................................................................................................................................... 119
8. Analysis ..................................................................................................... 120
8.1. Diamond Theory Analysis of Telecom Industry of India ..................................... 120
8.1.1.Factor conditions: .............................................................................................................. 121
8.1.2.Demand conditions: ........................................................................................................... 123
8.1.3.Related and supporting industries ..................................................................................... 124
8.1.4.Firm strategy, structure and rivalry: .................................................................................. 126
8.1.5.Government : ..................................................................................................................... 128
UPM-ETSI Industriales – C/ José Gutiérrez Abascal, 2 28006 Madrid (España)
POLIMI – Piazza Leonardo da Vinci, 32 20133 Milano (Italy)
KTH – SE 100 44 Stockholm (Sweden)
10
8.1.5.1.DoT,Department of Telecom ................................................................................... 128
8.1.5.2.WPC,Wireless Planning and Coordination Wing ..................................................... 128
8.1.5.3.TEC,Telecom Engineering Center ............................................................................ 129
8.1.5.4.TRAI,Telecom Regulatory Authority of India ........................................................... 130
8.1.6.Chance: ............................................................................................................................... 130
8.2. Diamond Theory Analysis of Telecom Industry of Singapore .............................. 131
8.2.1.Factors conditions .............................................................................................................. 132
8.2.2.Demand conditions ............................................................................................................ 134
8.2.3.Related and supporting industries ..................................................................................... 135
8.2.4.Firm strategy, structure and rivalry.................................................................................... 136
8.2.5.Government ....................................................................................................................... 137
8.2.6.Chance ................................................................................................................................ 137
8.3. Diamond Theory Analysis of Telecom Industry of Thailand ................................ 138
8.3.1.Factor conditions ................................................................................................................ 139
8.3.2.Demand conditions ............................................................................................................ 140
8.3.3.Related and supporting industries ..................................................................................... 143
8.3.4.Firm strategy, structure and rivalry.................................................................................... 144
8.3.5.Government: ...................................................................................................................... 145
8.3.6.Chance ................................................................................................................................ 147
8.4. SWOT Analysis of India Telecom Industry ......................................................... 148
8.4.1.Strengths ............................................................................................................................ 148
8.4.2.Weaknesses ........................................................................................................................ 148
8.4.3.Opportunities ..................................................................................................................... 148
8.4.4.Threats ............................................................................................................................... 149
8.5. SWOT Analysis of Singapore Telecom Industry .................................................. 150
8.5.1.Strengths ............................................................................................................................ 150
8.5.2.Weaknesses ........................................................................................................................ 150
8.5.3.Opportunities ..................................................................................................................... 151
8.5.4.Threats ............................................................................................................................... 151
8.6. SWOT Analysis of Thailand Telecom Industry .................................................... 153
8.6.1.Strengths ............................................................................................................................ 153
8.6.2.Weaknesses ........................................................................................................................ 153

UPM-ETSI Industriales – C/ José Gutiérrez Abascal, 2 28006 Madrid (España)
POLIMI – Piazza Leonardo da Vinci, 32 20133 Milano (Italy)
KTH – SE 100 44 Stockholm (Sweden)
11
8.6.3.Opportunities ..................................................................................................................... 154
8.6.4.Threats ............................................................................................................................... 154
8.7. The Comparison of India, Singapore and Thailand ............................................. 156
9. Conclusion and Recommendations ............................................................. 166
9.1. India Telecom Market ...................................................................................... 166
9.1.1.Data Market Increases Substantial, but Voice Services Still the Main Foundation of Revenue:166
9.1.2.Wireless Will Take the Leadership In the Network Business ............................................. 167
9.1.3.Integrated Operators Show Up .......................................................................................... 167
9.1.4. ... Digital Citizens and Service Driven Enterprises are the Keys Although They Are in a Small
Amount ....................................................................................................................................... 169
9.1.5.The Driver of Dramatically Change – Economy Growth ..................................................... 169
9.1.6.The Market of Small and Medium Enterprises .................................................................. 170
9.1.7.Three Orientations of the Enterprise Clients ..................................................................... 170
9.1.8.Collaboration and Upgraded the Levels of Telecom Services with Indian Partners .......... 172
9.1.9.Competitive in the Telecom Market of India. New Merges Will Be an Important Strategy173
9.1.10.The Rate Should Be In a Stability In Indian Market .......................................................... 173
9.1.11.Market Consolidation Situation ....................................................................................... 173
9.1.12.3G Launch ......................................................................................................................... 174
9.1.13.Mobile Number of Portability Will Occur in Stages. ........................................................ 174
9.2. Singapore Telecom Market............................................................................... 174
9.2.1.Sufficient Capital in Singapore: .......................................................................................... 174
9.2.2.Mobile Integrated Services in the Emerging ...................................................................... 175
9.2.3.Singapore is the 2nd at the Rank of Global Information Technology Report (GITR) ......... 175
9.2.4. Next Generation Nationwide Broadband Network is the Main Point of Development of ICT
of Singapore………………………………………………………………………………………………………………………..175
9.2.5.Expansion to Pacific Asia Fast ............................................................................................ 176
9.3. Thailand Telecom Market ................................................................................. 176
9.3.1.To Invest in Broadband for Offsetting the Loss of Fixed Line Market of Thailand ............. 176
9.3.2. .... To Increase the Capacity for Meeting the Needs of Internet Backbone and International
Bandwidth ................................................................................................................................. 177
9.3.3. ..... To Increase the Stability and Quality of Telecom Services Through Submarine Cables in
Thailand ....................................................................................................................................... 177
UPM-ETSI Industriales – C/ José Gutiérrez Abascal, 2 28006 Madrid (España)
POLIMI – Piazza Leonardo da Vinci, 32 20133 Milano (Italy)
KTH – SE 100 44 Stockholm (Sweden)
12
9.3.4.True Group Acquired Hutchison of Thailand Going to Change the Market Structure ....... 177
9.3.5.TOT Awarded the Contract of 3G Infrastructure................................................................ 178
9.3.6.Positive Thai Telecom Reform – Mobile Number Portability (MNP) ................................. 179
9.3.7.3G Could Re Shape the Thai Telecom Market .................................................................... 180
9.3.8.NBTC Starts to Running ...................................................................................................... 180
9.3.9.Improve the Quality of Service ........................................................................................... 181
9.3.10. Concluding Summary………………………………………………………………………………………………….183
Bibliography ...................................................................................................... 184
Appendix .......................................................................................................... 192

UPM-ETSI Industriales – C/ José Gutiérrez Abascal, 2 28006 Madrid (España)
POLIMI – Piazza Leonardo da Vinci, 32 20133 Milano (Italy)
KTH – SE 100 44 Stockholm (Sweden)
13
List of Figure FIGURE 1 RESEARCH PROCESS ........................................................................................................................ 24
FIGURE 2 RESEARCH FRAMEWORK .................................................................................................................. 31
FIGURE 3 THE COMPARISON OF THE BASIC AMONG COUNTRIES ............................................................................. 32
FIGURE 4 THE COMPARISON OF THE KNOWLEDGE RESOURCE AMONG COUNTRIES ..................................................... 33
FIGURE 5 THE COMPARISON OF THE HUMAN RESOURCE AMONG COUNTRIES ........................................................... 34
FIGURE 6 THE COMPARISON OF GDP, ICT TRADE, INVESTMENT IN TELECOMS AND ICT REVENUE AMONG COUNTRIES .... 35
FIGURE 7 THE COMPARISON OF TELECOM MARKETS OF OBJECTIVE COUNTRIES AND GLOBAL MARKET ............................ 36
FIGURE 8 NATIONAL DIAMOND THEORY FRAMEWORK ........................................................................................ 47
FIGURE 9 SWOT ANALYSIS ........................................................................................................................... 57
FIGURE 10 PROFILE OF SERVICE OF IWS .......................................................................................................... 62
FIGURE 11 DATA SERVICE OF IWS .................................................................................................................. 63
FIGURE 12 DWDM SERVICE ......................................................................................................................... 66
FIGURE 13 NETWORK OF IWS ....................................................................................................................... 66
FIGURE 14 EUROPE NETWORK OF IWS ............................................................................................................ 67
FIGURE 15 CONSORTIUM CABLES OF IWS ........................................................................................................ 69
FIGURE 16 TRANSATLANTIC REGION ................................................................................................................ 70
FIGURE 17 VOICE BUSINESS MODEL OF IWS .................................................................................................... 72
FIGURE 18 INBOUND AND OUTBOUND TRAFFIC OF VOICE BUSINESS ...................................................................... 73
FIGURE 19 BILATERAL TRAFFIC OF VOICE BUSINESS ............................................................................................ 74
FIGURE 20 HUBBING BUSINESS ...................................................................................................................... 75
FIGURE 21 TROMBONING ............................................................................................................................. 76
FIGURE 22 SIMBOX ...................................................................................................................................... 78
FIGURE 23 ACTUAL SITUATION AND NGN MODEL ............................................................................................. 80
FIGURE 24 FIXED MARKET SHARE IN INDIA (35.96 MILLION LINES) ....................................................................... 83
FIGURE 25 MARKET SHARE OF MOBILE MARKET IN INDIA (652.42 MILLION LINES) ................................................. 85
FIGURE 26 CIRCLES OR TELECOMMUNICATIONS SERVICE AREA IN INDIA ................................................................. 87
FIGURE 27 THE FIXED LINE MARKET SHARE IN SINGAPORE ................................................................................ 102
FIGURE 28 THE MOBILE MARKET SHARE OF SINGAPORE ................................................................................... 103
FIGURE 29 FIXED LINE MARKET SHARE TOTAL IN THAILAND ............................................................................... 110
FIGURE 30 FIXED LINE MARKET SHARE METROPOLITAN IN THAILAND .................................................................. 110
FIGURE 31 FIXED LINE MARKET SHARE PROVINCIAL AREA IN THAILAND ............................................................... 111
FIGURE 32 THE MARKET SHARE OF PRE-PAID MOBILE IN THAILAND .................................................................... 112
UPM-ETSI Industriales – C/ José Gutiérrez Abascal, 2 28006 Madrid (España)
POLIMI – Piazza Leonardo da Vinci, 32 20133 Milano (Italy)
KTH – SE 100 44 Stockholm (Sweden)
14
FIGURE 33 THE MARKET SHARE OF POST PAID MOBILE IN THAILAND .................................................................. 112
FIGURE 34 THE RATIO OF THE REVENUE OF INTERCONNECTION OF CARRIERS ........................................................ 115
FIGURE 35 ALLOCATION OF INDIAN RELEVANT AND SUPPORTING INDUSTRIES OF TELECOMMUNICATION .................... 125
FIGURE 36 EMPLOYEED INFOCOMM MANPOWER 2000-2010 IN SINGAPORE ...................................................... 133
FIGURE 37 EMPLOYED INFOCOMM MANPOWER BY QUALIFICATION, 1999-2010 ANNUAL, SINGAPORE ................... 133
FIGURE 38 REVENUE BY DOMESTIC AND EXPORT MARKET 1998-2009 ANNUAL SINGAPORE .................................. 135
FIGURE 39 TOTAL INFOCOMM REVENUE BY SEGMENT 2000-2009 ANNUAL, SINGAPORE ...................................... 136
FIGURE 40 SWOT OF TELECOM INDUSTRY OF INDIA ........................................................................................ 149
FIGURE 41 SWOT OF TELECOM INDUSTRY OF SINGAPORE ................................................................................ 151
FIGURE 42 SWOT OF TELECOM INDUSTRY OF THAILAND .................................................................................. 155
FIGURE 43 THE NETWORKED READINESS INDEX 2010-2011 OF INDIA ................................................................ 163
FIGURE 44 THE NETWORKED READINESS INDEX 2010-2011 OF SINGAPORE ........................................................ 164
FIGURE 45 THE NETWORKED READINESS INDEX 2010-2011 OF THAILAND .......................................................... 165
FIGURE 46 THAILAND MOBILE MARKET SHARE FROM 3Q2009 – 3Q2010 ...................................................... 193
FIGURE 47 AVERAGE RATES OF INTERNATIONAL TELEPHONE SERVICE IN THAILAND 1Q2009 – 2Q2010 ................ 194
FIGURE 48 DATA MARKET IN THAILAND 2002-2010 .................................................................................... 195
UPM-ETSI Industriales – C/ José Gutiérrez Abascal, 2 28006 Madrid (España)
POLIMI – Piazza Leonardo da Vinci, 32 20133 Milano (Italy)
KTH – SE 100 44 Stockholm (Sweden)
15
List of Table TABLE 1 CURRENT PRODUCT CAPACITY OF IWS ................................................................................................. 65
TABLE 2 CONSEQUENCES AND INITIATIVES OF TROMBONING ................................................................................ 77
TABLE 3 CONSEQUENCES AND WEAKNESSES OF SIMBOX ..................................................................................... 78
TABLE 4 THE MARKET SHARE OF OPERATORS IN INDIA IN FIXED, MOBILE, AND DATA BUSINESS ................................. 88
TABLE 5 STATISTICS OF NUMBER OF TELECOM OPERATORS IN THE MARKET IN SINGAPORE ...................................... 101
TABLE 6 FIXED LINE MARKET SHARE IN SINGAPORE .......................................................................................... 103
TABLE 7 THE MOBILE MARKET IN SINGAPORE ................................................................................................. 104
TABLE 8 THE TELECOM DATA MARKET IN SINGAPORE ....................................................................................... 105
TABLE 9 DIAMOND THEORY ANALYSIS OF TELECOM INDUSTRY OF INDIA ............................................................... 121
TABLE 10 DIAMOND THEORY ANALYSIS OF TELECOM INDUSTRY OF SINGAPORE ..................................................... 132
TABLE 11 DIAMOND THEORY ANALYSIS OF TELECOM INDUSTRY OF THAILAND ....................................................... 138
TABLE 12 THE COMPARISON OF THE BASIC OF INDIA, SINGAPORE AND THAILAND .................................................. 156
TABLE 13 THE COMPARISON OF KNOWLEDGE RESOURCE OF INDIA, SINGAPORE AND THAILAND ............................... 157
TABLE 14 THE COMPARISON OF HUMAN RESOURCE OF INDIA, SINGAPORE AND THAILAND...................................... 157
TABLE 15 THE COMPARISON OF TELECOM MARKET OF INDIA, SINGAPORE AND THAILAND ...................................... 159
TABLE 16 GDP AND ICT TRADE, TELECOM INVESTMENT, ICT REVENUE IN 2010 OF INDIA, SINGAPORE AND THAILAND160
TABLE 17 NETWORKED READINESS INDEX 2010-2011 .................................................................................... 161
TABLE 18 THE COMPARISON OF TRADITIONAL OPERATORS AND INTEGRATED OPERATORS ....................................... 168
TABLE 19 TIMELINE OF INDIAN PREDICTED MARKET DEVELOPMENT .................................................................... 172
TABLE 20 THE INDIAN TELECOM SERVICES PERFORMANCE INDICATORS (OCTOBER - DECEMBER 2010) ..................... 192
TABLE 21 THE MOBILE MARKET OF SINGTEL .................................................................................................. 193
TABLE 22 FIXED LINE SUBSCRIBERS IN THAILAND 2003-2010 ......................................................................... 194
TABLE 23 MOBILE GROW RATE IN THAILAND 2002-2010 (%) ....................................................................... 194
TABLE 24 MOBILE MARKET REVENUE IN THAILAND FROM 1Q 2008 – 3Q 2010 .................................................. 195
UPM-ETSI Industriales – C/ José Gutiérrez Abascal, 2 28006 Madrid (España)
POLIMI – Piazza Leonardo da Vinci, 32 20133 Milano (Italy)
KTH – SE 100 44 Stockholm (Sweden)
16
List of Acronyms
3G Third Generation
AIS Advanced Info Service
APCN 2 Asia-Pacific Cable Network 2
ARPU Average Revenue Per User
BTO Build Transfer Operate
BSNL Bharat Sanchar Nigam Ltd.
BTO Build Transfer Operate
CAT CAT Telecom Public Company Limited
CAPEX Capital expenditures
CBWFQ Class Based Weighted Fair Queuing
CDMA Code Division Multiple Access
CDMA 2000 1X Code Division Multiple Access 2000 1X
CDMA 2000 1X
EV-DO
Evolution-Data Optimized
CDN Content Delivery Network
CE Customer Edge
CoS Class of Service
DLD Domestic Long Distance
DWDM Dense Wavelength Division Multiplexing
EAC-C2C East Asia Crossing
eBGP External BGP
UPM-ETSI Industriales – C/ José Gutiérrez Abascal, 2 28006 Madrid (España)
POLIMI – Piazza Leonardo da Vinci, 32 20133 Milano (Italy)
KTH – SE 100 44 Stockholm (Sweden)
17
FDI Foreign Direct Investment
GSM Global System for Mobile Communications
HDLC High Level Data Link Control
IC Interconnection
ICT Information and Communication Technologies
ICMP Internet Control Message Protocol
IDD International Direct Dialing
IIG International Internet Gateway
ILD International Long Distance
iN2015 Intelligent Nation 2015
IP Internet Protocol
IPLC International Private Leased Circuit
IPTV Internet Protocol Television
IRU Indefeasible Rights of Use
ISP Internet Service Provider
IWS International Wholesale Services
LAN Local Area Network
LDP Label Distribution Protocol
LSP Label Switch Path
LSR Label Switch Router
MGW Media Getway
UPM-ETSI Industriales – C/ José Gutiérrez Abascal, 2 28006 Madrid (España)
POLIMI – Piazza Leonardo da Vinci, 32 20133 Milano (Italy)
KTH – SE 100 44 Stockholm (Sweden)
18
MED Multi Exit Discriminator
MNP Mobile Number Portability
MNO Mobile Network Operator
MP-BGP MultiProtocol BGP
MPLS MultiProtocol Label Switching
NAT Network Address Translation
NESDB National Economic and Social Development Board
NGN Next Generation Network
NIX National Internet Exchange
NLD National Long Distance
NMS Network Management Service
NNI Network to Network Interconnection
NTC National Telecommunications Commission
NTNL Mahanagar Telephone Nigam Ltd.
OPEX Operational expenditure
OTF OpenType standard for Digital Typography
OTM Optical Translation Management
POP Point of Presence
PFE Packet Forwarding Engine
PIC Physical Interface Card
PoI Point of Interconnection
UPM-ETSI Industriales – C/ José Gutiérrez Abascal, 2 28006 Madrid (España)
POLIMI – Piazza Leonardo da Vinci, 32 20133 Milano (Italy)
KTH – SE 100 44 Stockholm (Sweden)
19
PSTN Public Switched Telephone Network
PPP Point to Point Protocol
QoS Quality of Service
RD Route Distinguisher
RT Route Target
RIP Routing Information Protocol
RSP Roting Switch Porcessor
RT Route Target
SAFE South Africa Far East Cable
SAT- 3 South Atlantic 3
SDH Synchronous Digital Hierarchy
SIP Session Initialtion Portocal
SIPA Software Industry Promote Agency
SBC Session Border Controller
SJC South-East Asia Japan Cable
SLA Service Level Agreement
SONET Synchronous Optical Network
SMS Short Message Service
SMW3 South-East Asia – Middle East – Western Europe 3
SMW4 South-East Asia – Middle East – Western Europe 4
SNMP Simple Network Management Protocol
UPM-ETSI Industriales – C/ José Gutiérrez Abascal, 2 28006 Madrid (España)
POLIMI – Piazza Leonardo da Vinci, 32 20133 Milano (Italy)
KTH – SE 100 44 Stockholm (Sweden)
20
SS Soft Switch
Tbps TeraBytes Per Second
TDM Time Division Multiplex
TEC Telecom Engineering Center
TEN Telefonica Empresas Nacional
TGN Tyco Global Network
TOT TOT Public Company Limited
VIP Versatile Interface Processor
VLAN Virtual LAN
VOIP Voice over Internet Protocol
VPN Virtual Private Network
VRF VPN Routing and Forwarding
VSAT Very Small Aperture Terminal
WAN Wide Area Network
WASC West Africa Submarine Cable
WCDMA Wideband Code Division Multiple Access
WiMAX Worldwide Interoperability for Microwave Access
WLL-F Wireless in Local Loop-Fixed
WPC Wireless Power Consortium
WRED Weighted Random Early Detect
UPM-ETSI Industriales – C/ José Gutiérrez Abascal, 2 28006 Madrid (España)
POLIMI – Piazza Leonardo da Vinci, 32 20133 Milano (Italy)
KTH – SE 100 44 Stockholm (Sweden)
21
1. Introduction
1.1. Research Background
The IWS Group is one of the most professional telecom operators in the
world which has business in Europe, Latin America and Africa covered over
25 countries. By the end of December 2010, IWS has reached the number of
customers 287.6 million due to its invincible business of the Latin America.
However, Asia‘s economy has rocketed in recent years which could not be
disregard and the prosperity is continuing for the next thirty years. Since the
economic boom makes the market growing fast, IWS group is ambitious to
expand its business further into the Asian market.
The economy of Asia covers more than 4 billion people which is 60% of
the population of the world. Annual growth of per capita GDP is 7.95% in
2010. Not only China, India, Japan, Singapore, South Korea have
developed the strong economy in these days, but also other countries such
as Thailand, Malaysia, Philippines, Vietnam, Pakistan, Laos, and Indonesia
start to present the high potential of long-term growth. Asia is the fastest
growing economy in the world currently.
To develop Asian telecom market is the major task for the telecommunication
carriers currently. Indian Telecommunication is the world's fastest growing
industry. India will have 1.159 billion mobile subscribers by 2013 by the
projection. Singapore is building its nation to become an island with Wi-Fi
UPM-ETSI Industriales – C/ José Gutiérrez Abascal, 2 28006 Madrid (España)
POLIMI – Piazza Leonardo da Vinci, 32 20133 Milano (Italy)
KTH – SE 100 44 Stockholm (Sweden)
22
service free everywhere. Thailand‘s telecom sector seems stuck in a reform
while the mobile penetration rate has passed 100%. Because these three
countries have different factors which are interesting influenced the telecom
economies, the competitiveness of the Information and Communication
Technologies industry of India, Singapore and Thailand are interesting to
analyze.
1.2. Research Objective
The objective of this paper is to investigate the telecommunication markets in
India, Singapore and Thailand in order to find the potentiality of the markets
which could be considered by the company to expand its business in
telecommunication field and also to take a proper strategy. At meanwhile, the
global competitiveness of telecommunication industry of these three
countries will be discussed. The analysis is based on the relevant theory of
competitiveness includes the Diamond theory (Porter, 1990) from Michael
Porter and SWOT analysis. Practical information were collected accordingly.
1.3. Target Audience
The IWS Group is the main audience for this paper. From its view of
wholesale business model, data were collected and analyzed to help IWS
International Wholesale Services with the Asian business expansion.
UPM-ETSI Industriales – C/ José Gutiérrez Abascal, 2 28006 Madrid (España)
POLIMI – Piazza Leonardo da Vinci, 32 20133 Milano (Italy)
KTH – SE 100 44 Stockholm (Sweden)
23
1.4. Research Question & Limitation
Michael Porter proposed a model that allows analyzing why some nations are
more competitive than others are, and why some industries within nations are
more competitive than others are. (Porter, 1990) Porter believes that there are
four main determinants which can shape the nation‘s competitiveness.
By analyzing these determinants of telecommunication industry, there are
many strengths and weaknesses presented from these research objects. We
can compare these research objects with each other to examine in great detail
in order to understand their competitiveness.
How are the effectiveness and competitiveness of telecom markets of these
research objects. If a particular industry sector‘s competitiveness could be
determined by these factors Porter indicated in his theory and if the result we
obtained reflects and represents this particular industry sector‘s national
competitiveness relatively in the practical environment.
The research limitation will be that some data could not be quantified in some
topics from these research objects. For example, how to measure the
determinant ―Chance‖. It could be analyzed in a general way and acquire
concepts but It may be difficult to compare with each other among these
research objects in a absolute standard such as a numerical comparison.
UPM-ETSI Industriales – C/ José Gutiérrez Abascal, 2 28006 Madrid (España)
POLIMI – Piazza Leonardo da Vinci, 32 20133 Milano (Italy)
KTH – SE 100 44 Stockholm (Sweden)
24
2. The Research Process and Methodology
2.1. Research Process
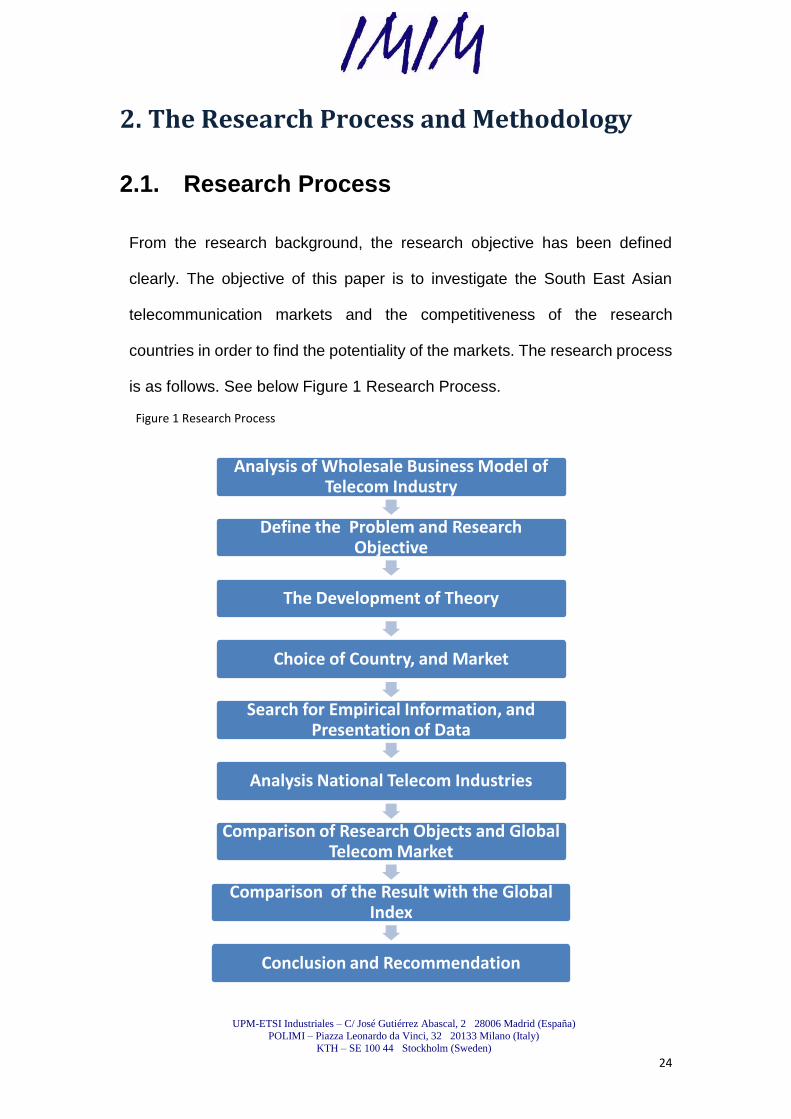
From the research background, the research objective has been defined
clearly. The objective of this paper is to investigate the South East Asian
telecommunication markets and the competitiveness of the research
countries in order to find the potentiality of the markets. The research process
is as follows. See below Figure 1 Research Process.
Figure 1 Research Process
Analysis of Wholesale Business Model of Telecom Industry
Define the Problem and Research Objective
The Development of Theory
Choice of Country, and Market
Search for Empirical Information, and Presentation of Data
Analysis National Telecom Industries
Comparison of Research Objects and GlobalTelecom Market
Comparison of the Result with the Global Index
Conclusion and Recommendation
UPM-ETSI Industriales – C/ José Gutiérrez Abascal, 2 28006 Madrid (España)
POLIMI – Piazza Leonardo da Vinci, 32 20133 Milano (Italy)
KTH – SE 100 44 Stockholm (Sweden)
25
2.1.1. Analysis of Wholesale Business Model of Telecom
Industry
It is essential to understand the business model of wholesale services of
telecom industry. The business model of IWS (International Wholesale
Services) will be studied in this paper which mainly is in two categories voice
and data business.
2.1.2. Define Problem and Research Objective
The objective of this paper is to investigate the telecommunication markets in
India, Singapore and Thailand in order to find the potentiality of the markets
which could be considered by the company to expand its business in
telecommunication field and also to take a proper strategy. IWS has the
strong business in Latin American but it may be weak in the East. For the
long run, IWS should take actions to expand to Asia. The largest telecom
markets all over the world, China and India, are in Asia. At meanwhile, the
global competitiveness of telecommunication industry of these three
countries will be discussed. The analysis is based on the relevant theory of
competitiveness includes the Diamond theory (Porter, 1990) from Michael
Porter and SWOT analysis. Practical information will be collected
accordingly.
UPM-ETSI Industriales – C/ José Gutiérrez Abascal, 2 28006 Madrid (España)
POLIMI – Piazza Leonardo da Vinci, 32 20133 Milano (Italy)
KTH – SE 100 44 Stockholm (Sweden)
26
2.1.3. The Development of Theory
This paper conducts the assessment of competitive advantages of Telecom
markets of India, Singapore and Thailand by Porter's diamond theory
framework. In this paper it will discuss the difference between the comparative
advantages and Porter‘s Diamond theory. It will also discover the International
trade theories from different scholiasts. Trade theories have been developed
and shaped in many different aspects in different time. There were few
dramatic revolutions. Then, Porter proposed the National Competitive
Advantages Theory. Porter believed that an industry‘s competitive advantages
are strong connected to the nation‘s competitive advantages. Although trade
theories keep in an evolution, Porter‘s national diamond has summarized the
important points for the current trade pattern in the global economy.
Furthermore, we will discuss the advantages of using the SWOT analysis
although some people have doubted that it may mislead judgments. The
extended theory SWOT—CLPV is modified from the traditional SWOT theory.
The SWOT --CLPV analysis is more objective and accurate on analysis of
the reality of a business method.
2.1.4. Choice of Country, and Market
In IWS, the south east Asia business development unit covers business
includes Bangladesh, China, Hong Kong, India, Pakistan, Singapore,
Philippines, Thailand, and Taiwan. The Indian telecommunication industry is
the world's fastest growing industry. Although China owns the world‘s largest
UPM-ETSI Industriales – C/ José Gutiérrez Abascal, 2 28006 Madrid (España)
POLIMI – Piazza Leonardo da Vinci, 32 20133 Milano (Italy)
KTH – SE 100 44 Stockholm (Sweden)
27
fixed-line and mobile subscribers but it is dominated by three state-run
businesses. Hence, the market is not liberalized and transparent. Therefore,
India is more interesting to research. Singapore is a tiny country with small
area, little population and scarcity of nature resource which is in the contrary
to the large country India in every aspects. How Singapore develops its
national Information and Telecommunication Technologies to compete with
other countries is a considerable issue. Thailand‘s mobile penetration rate
has reached to 100% but its 3G service still could not move forward. These
three countries have different factors and conditions. We will discuss how
these factors influence their Information and Telecommunication industry.
The research sequence will be in alphabetical order. The first will be India
investigated followed by Singapore and Thailand.
2.1.5. Search for Empirical Information, and Presentation of
Data
Data and information were collected from the internet, the library, statistic
organizations, journals and research professional reports. Data presented by
country primary includes the country overview, national economy,
telecom market, fixed &mobile & data market share, International
telephone services market, interconnection, telecom infrastructure,
international internet Gateway, submarine cables, business model and major
telecom suppliers and carriers. There are a lot of statists which illustrate the
practical market of the object countries. Data and information are latest and
UPM-ETSI Industriales – C/ José Gutiérrez Abascal, 2 28006 Madrid (España)
POLIMI – Piazza Leonardo da Vinci, 32 20133 Milano (Italy)
KTH – SE 100 44 Stockholm (Sweden)
28
most of them are from year 2010 or the first quarter of 2011. This paper also
present a large number of diagrams, figures, tables for displaying the
direction or the trend of research topics. These numbers and data are very
help for analyzing and understanding the pragmatic markets.
2.1.6. Analysis National Telecom Industries
Diamond theory helps to analyze the competitiveness of telecom industry.
Six key elements: ―factors conditions‖, ―demand conditions‖, ―related and
supporting industries‖ and ―corporate strategy, structure and rivalry‖,
―government‖ and ―opportunity‖ play important role in evaluation the telecom
industry. (Porter, 1990) These factors are interlocked and mutual
influenced. Diamond system could help to strengthen the system. Any
factor will inevitably affect the others. When enterprises or industries obtain
one of these diamond advantages, this factor would also help to create
or enhance advantages of other factors.
SWOT analysis is the theory of business strategic planning which contains
strengths, weaknesses, opportunities, and threats parts. By analyzing
the industry, largely in consideration of the internal conditions as strengths
and weaknesses, it is easier to see if the enterprises are competitive
within the industry. By probing the opportunities and threats of the industry, it
assists enterprises or industries to understand the external environment and
further to predict the future of industry.
UPM-ETSI Industriales – C/ José Gutiérrez Abascal, 2 28006 Madrid (España)
POLIMI – Piazza Leonardo da Vinci, 32 20133 Milano (Italy)
KTH – SE 100 44 Stockholm (Sweden)
29
Final, At last, this paper will check the result we evaluated and compare it
with the global rank of ICT competitiveness from the organization ―World
Economic Forum‖ for validating the reliability of the Porter‘s theory.
2.1.7. Comparison of Telecom Industry of India, Singapore,
Thailand and Global Telecom Market
After studying the empirical data and the entire telecom market of each
country, this paper will precede the comparison of these three countries in
many factors and to explore the strength of their competitive advantages.
Further these three countries will be compared with the global telecom
market and to measure their weights in the international environment. By
using the same indexes for these objective countries, the difference and the
rank will be presented from the comparison. The comparative advantages of
each research country will be discovered.
2.1.8. Comparison with the Networked Readiness Index
2010-2011 of World Economic Forum
After analyzing the determinants of these research objects, we will have the
result and the rank of the competitiveness of telecom industry of these
countries we research. Then, we will compare the result with a global ranking:
Networked Readiness Index 2010-2011 from World Economic Forum to
UPM-ETSI Industriales – C/ José Gutiérrez Abascal, 2 28006 Madrid (España)
POLIMI – Piazza Leonardo da Vinci, 32 20133 Milano (Italy)
KTH – SE 100 44 Stockholm (Sweden)
30
prove that if the result we analyzed matches the global ranking from the
global research organization. Hence, we can validate that if the six
determinants of Porter‘s National Diamond Competitiveness of a industry
sector‘s can represent the capabilities of an industry‘s competitiveness in the
global environment.
2.1.9. Conclusion and Recommendation
By analyzing the telecommunication market of objective countries, results will
present that if their national industries have the completive advantages in the
global environment. If the intensity of the factors analyzed in telecom industry
could represent the intensity of the global competiveness of the nation in
telecom industry. Besides, there are some perditions for the near future
expressed and strategies suggested by concluding from the analysis for
helping the main audience to develop the telecommunication market in India,
Singapore and Thailand.
2.2. Methodology
The research framework of this paper applied to the methodology ―interpreter‖
which use the induction. This paper adopts rich subjective quality and
quantity data for validation the theory. By studying Porter‘s National Diamond,
we set up the research framework as follow figure
UPM-ETSI Industriales – C/ José Gutiérrez Abascal, 2 28006 Madrid (España)
POLIMI – Piazza Leonardo da Vinci, 32 20133 Milano (Italy)
KTH – SE 100 44 Stockholm (Sweden)
31
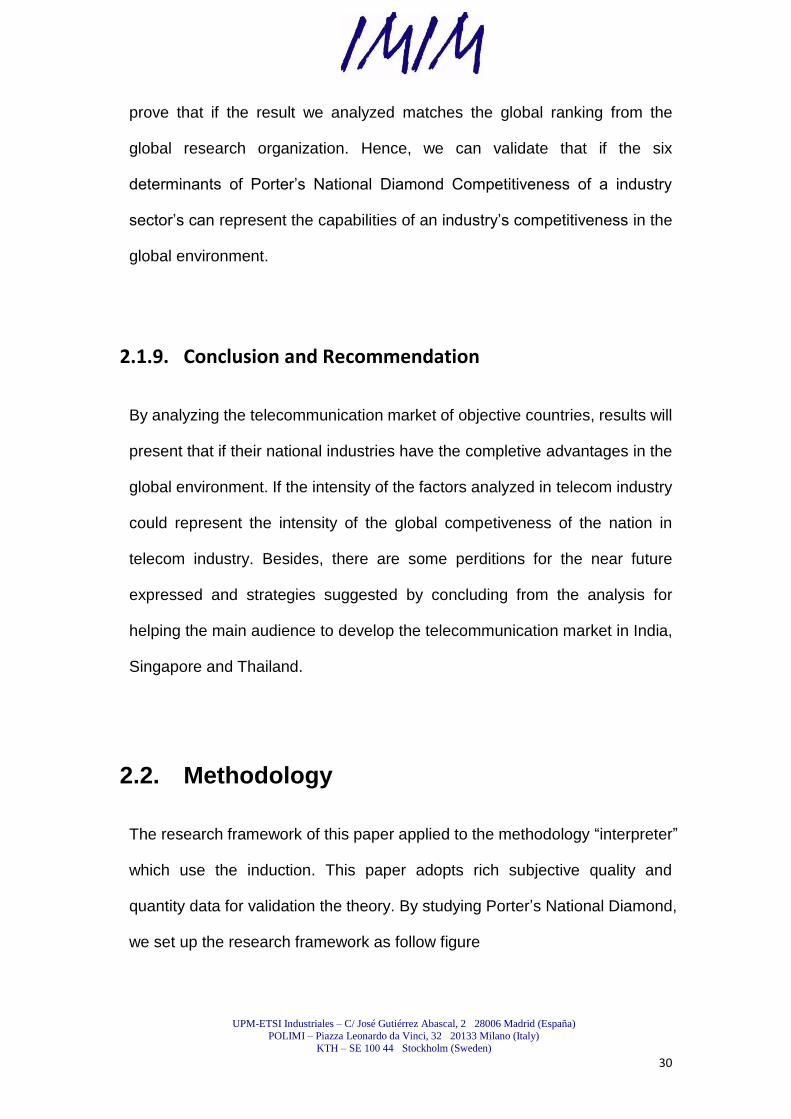
. See figure 2 Research framework. There are six categories: factor
conditions, demand conditions, related and supporting industries, corporate
strategy, structure and rivalry, government and chance. Under the six main
classifications, there are sub classes. For factor conditions, it covers human
resources, knowledge resources, capital resources, education investments
and so on. For demand conditions, we will study the market of fixed line,
mobile, data and international services. For related industries, we will
research the proportion of ICT industry to the total GDP and so on. For the
corporate strategy, structure and rivalry, policy, competitors, and incentive
system will be discovered. As to government, we will indicate the
organization, projects, supporting of the government. For chance, we will
discuss the new opportunities and new projects and so on.
Figure 2 Research Framework
National Diamond
Chance
New opportunities
New Projects or Policies
Government
Organization
New projects
Government Education
Government Supporting
Corporate Strategy, Structure,
and Rivalry
Policy and Strategy
Competitors
Incentive System
Related and Supporting Industries
Related Industries
ICT imports and Exports
ICT Revenues
Infrastructure
Demand Conditions
Domestic Market
Fixed Line
Mobile
Internet
International calls
Factor Conditions
Areas and Population
Language
Human Resources
Knowledge Resources
General Education
Education on Technology and Science
Capital Resource
UPM-ETSI Industriales – C/ José Gutiérrez Abascal, 2 28006 Madrid (España)
POLIMI – Piazza Leonardo da Vinci, 32 20133 Milano (Italy)
KTH – SE 100 44 Stockholm (Sweden)
32
We will collect data of telecommunication industry of these research objects
to precede analysis on these determinants. Then, we use SWOT tool to
analyze the telecom industry of these countries to understand their strengths,
weaknesses, opportunities and threats.
Next, we will compare these countries chosen by numerical index in many
aspects with each other.
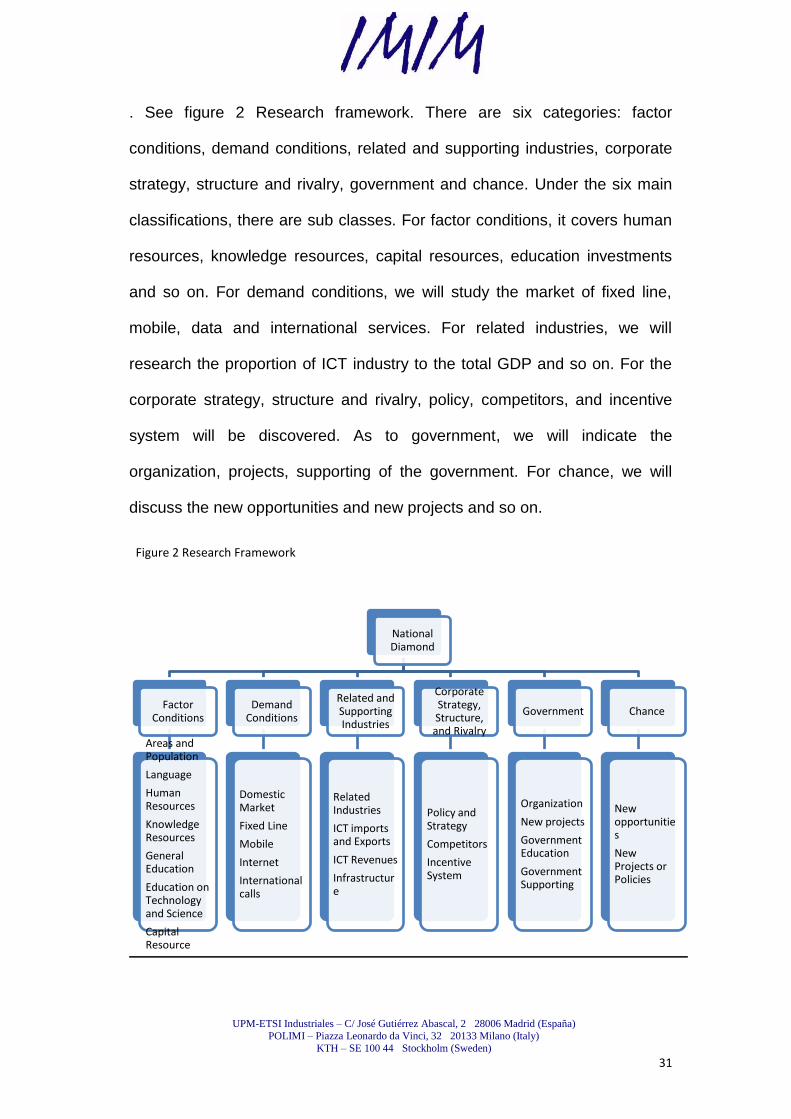
First, the indexes of the comparison of the basic of research countries chosen
include ―areas‖, ―populations‖ and ―languages‖. These indexes could display
the nature resources of research countries. The official languages could
indicate if the civilians of research countries have the competitiveness on
international business. See the below figure.
Figure 3 The comparison of the basic among countries
Basic
Areas
Population
Official Languages
UPM-ETSI Industriales – C/ José Gutiérrez Abascal, 2 28006 Madrid (España)
POLIMI – Piazza Leonardo da Vinci, 32 20133 Milano (Italy)
KTH – SE 100 44 Stockholm (Sweden)
33
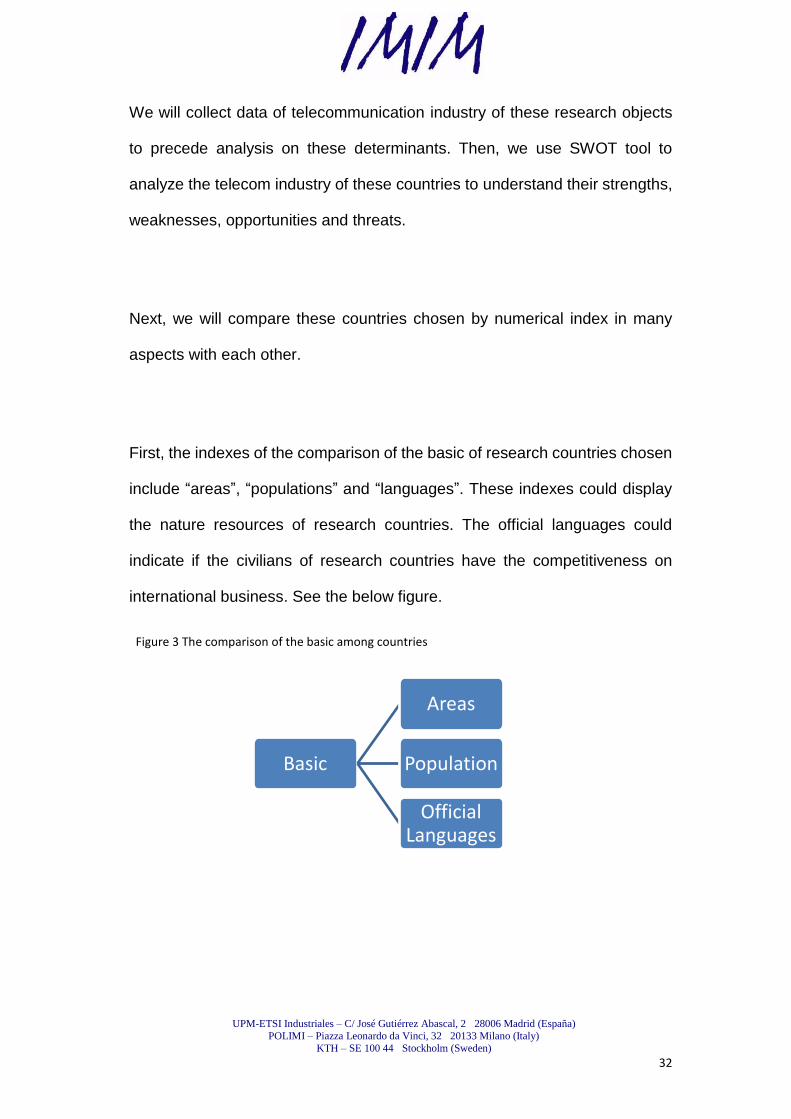
Second, the indexed of the comparison of the knowledge resource of
objective countries are into two categories ―General Education‖ and
―Education on Technology and Science‖. The ―General Education‖ covers the
indexes of puil/ teacher ratio, literacy rate, and public expenditure on
education (as % of GDP and as % of total government expenditure). This
could indicate that the percentage of population of a country have education
and the percentage that government have invested in education. The
―Education on Technology and Science‖ covers indexes of researchers per
million inhabitants, and expenditure on R&D as a % of GDP. The above
illustrates that the knowledge resource a country owns. Please see the below
figure 4 The comparison of the knowledge resource among countries.
Figure 4 The comparison of the knowledge resource among countries
knowledge Resource
General Education
Pupil / teacher ratio (primary)
Literacy rate
Public expenditure on
education
as % of GDP
as % of total government expenditure
Education on Technology and
Science
Researchers per 1million
inhabitants
Expenditure on R&D as a % of
GDP
UPM-ETSI Industriales – C/ José Gutiérrez Abascal, 2 28006 Madrid (España)
POLIMI – Piazza Leonardo da Vinci, 32 20133 Milano (Italy)
KTH – SE 100 44 Stockholm (Sweden)
34
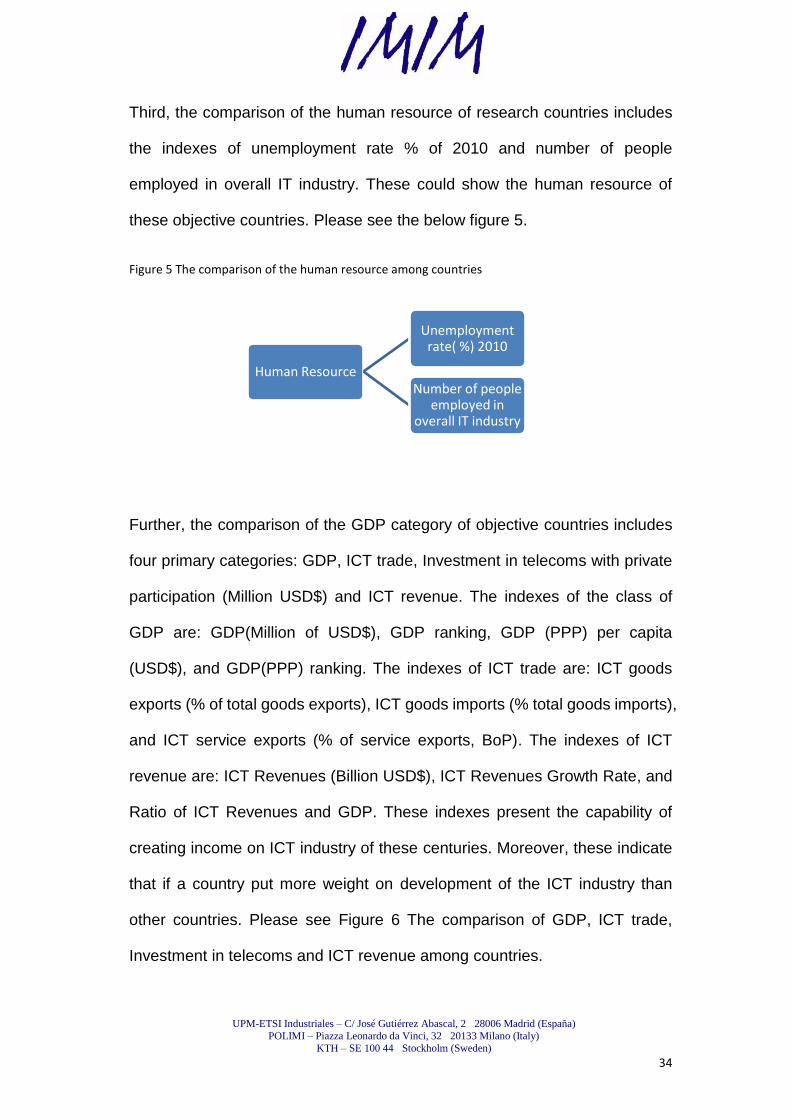
Third, the comparison of the human resource of research countries includes
the indexes of unemployment rate % of 2010 and number of people
employed in overall IT industry. These could show the human resource of
these objective countries. Please see the below figure 5.
Figure 5 The comparison of the human resource among countries
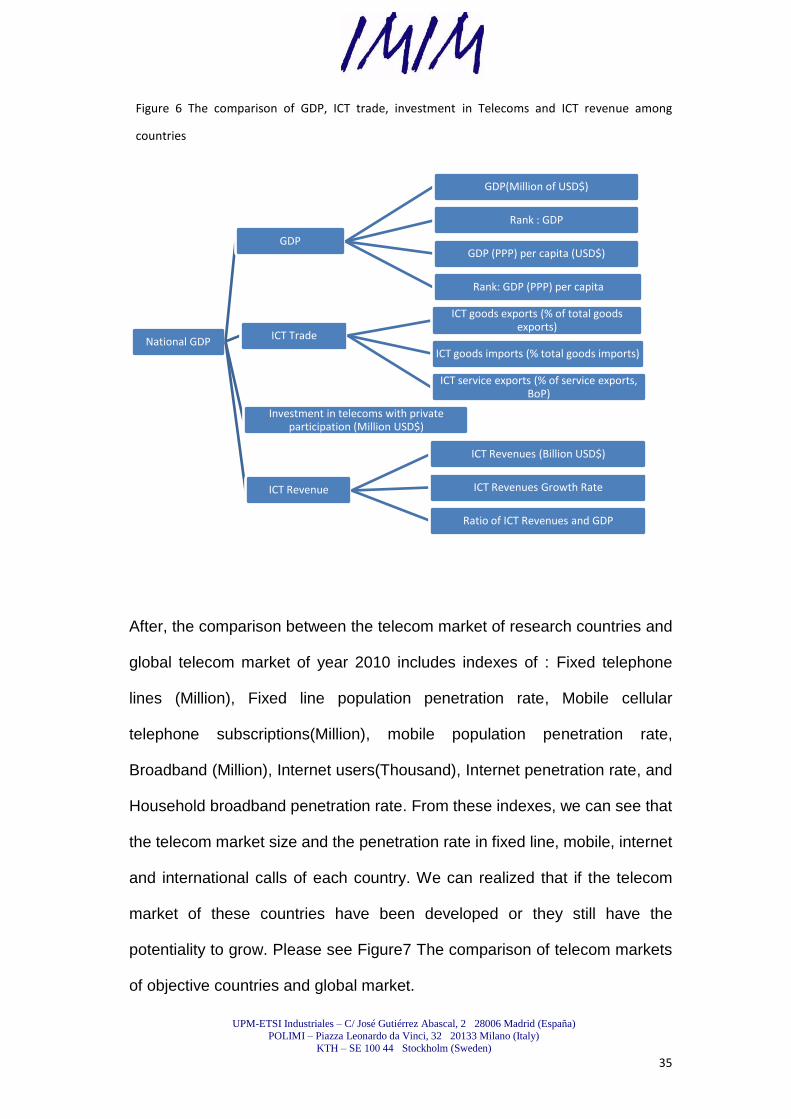
Further, the comparison of the GDP category of objective countries includes
four primary categories: GDP, ICT trade, Investment in telecoms with private
participation (Million USD$) and ICT revenue. The indexes of the class of
GDP are: GDP(Million of USD$), GDP ranking, GDP (PPP) per capita
(USD$), and GDP(PPP) ranking. The indexes of ICT trade are: ICT goods
exports (% of total goods exports), ICT goods imports (% total goods imports),
and ICT service exports (% of service exports, BoP). The indexes of ICT
revenue are: ICT Revenues (Billion USD$), ICT Revenues Growth Rate, and
Ratio of ICT Revenues and GDP. These indexes present the capability of
creating income on ICT industry of these centuries. Moreover, these indicate
that if a country put more weight on development of the ICT industry than
other countries. Please see Figure 6 The comparison of GDP, ICT trade,
Investment in telecoms and ICT revenue among countries.
Human Resource
Unemployment rate( %) 2010
Number of people employed in
overall IT industry
UPM-ETSI Industriales – C/ José Gutiérrez Abascal, 2 28006 Madrid (España)
POLIMI – Piazza Leonardo da Vinci, 32 20133 Milano (Italy)
KTH – SE 100 44 Stockholm (Sweden)
35
Figure 6 The comparison of GDP, ICT trade, investment in Telecoms and ICT revenue among
countries
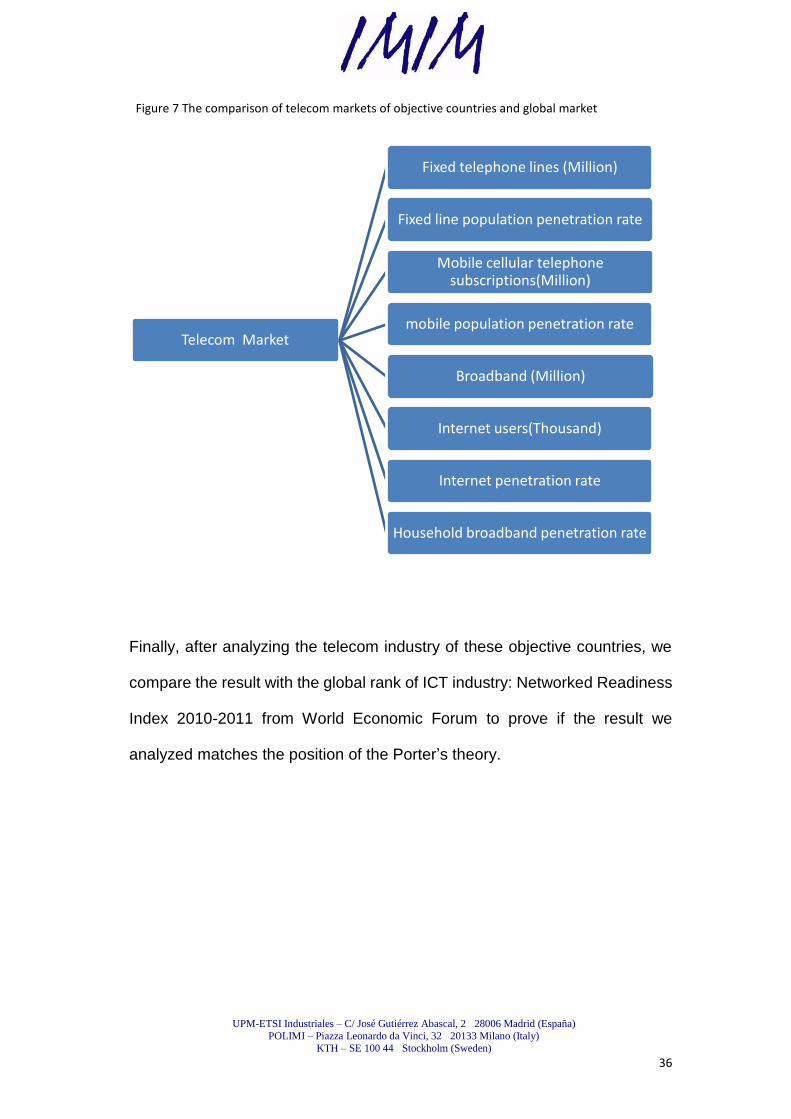
After, the comparison between the telecom market of research countries and
global telecom market of year 2010 includes indexes of : Fixed telephone
lines (Million), Fixed line population penetration rate, Mobile cellular
telephone subscriptions(Million), mobile population penetration rate,
Broadband (Million), Internet users(Thousand), Internet penetration rate, and
Household broadband penetration rate. From these indexes, we can see that
the telecom market size and the penetration rate in fixed line, mobile, internet
and international calls of each country. We can realized that if the telecom
market of these countries have been developed or they still have the
potentiality to grow. Please see Figure7 The comparison of telecom markets
of objective countries and global market.
National GDP
GDP
GDP(Million of USD$)
Rank : GDP
GDP (PPP) per capita (USD$)
Rank: GDP (PPP) per capita
ICT Trade
ICT goods exports (% of total goods exports)
ICT goods imports (% total goods imports)
ICT service exports (% of service exports, BoP)
Investment in telecoms with private participation (Million USD$)
ICT Revenue
ICT Revenues (Billion USD$)
ICT Revenues Growth Rate
Ratio of ICT Revenues and GDP
UPM-ETSI Industriales – C/ José Gutiérrez Abascal, 2 28006 Madrid (España)
POLIMI – Piazza Leonardo da Vinci, 32 20133 Milano (Italy)
KTH – SE 100 44 Stockholm (Sweden)
36
Figure 7 The comparison of telecom markets of objective countries and global market
Finally, after analyzing the telecom industry of these objective countries, we
compare the result with the global rank of ICT industry: Networked Readiness
Index 2010-2011 from World Economic Forum to prove if the result we
analyzed matches the position of the Porter‘s theory.
Telecom Market
Fixed telephone lines (Million)
Fixed line population penetration rate
Mobile cellular telephone subscriptions(Million)
mobile population penetration rate
Broadband (Million)
Internet users(Thousand)
Internet penetration rate
Household broadband penetration rate
UPM-ETSI Industriales – C/ José Gutiérrez Abascal, 2 28006 Madrid (España)
POLIMI – Piazza Leonardo da Vinci, 32 20133 Milano (Italy)
KTH – SE 100 44 Stockholm (Sweden)
37
3. Theoretical Framework
3.1. Trade theories and international
competitiveness of countries
Harvard Professor Michael Porter (Michel E. Porter) proposed ―National
competitive‖ theory (Porter, 1990) from micro- competition perspective to
explain international trade theory to make up the weakness of comparative
advantage (Wolff, Resnick, 1987). The initiator of trade theory was the British
scholiast Adam Smith. He advocated ―Theory of Absolute Advantage‖ which
is also well known as ―Theory of Absolute Cost‖ or ―Theory of Territorial
Division of Labor‖. (Smith, 1776) He addressed that the different
occupations within a country should be expanded to the concept of the
―division of labor‖ between countries. Thus, the theory of the international
division of labor was formed by him. ―Absolute advantage theory‖ (Smith,
1776) is the earliest theory which advocated the liberalized trade. Adam
Smith represented the requirements of the industrial class in that time. In
1776, he published his masterpiece ―The Wealth of Nations ―(Smith, 1776)
which has attacked to the comments of mercantilism, and advocated
libertarianism in his book. He believed that every country has its own
favorable condition to produce certain products which has the ―absolutely
advantages‖. (Smith, 1776) Hence, each country should specialize in its
specific type of production and exchange with other countries. He considered
that this consequence would be favorable to every country. However, if a
country has absolute advantages in every aspect while another country has
UPM-ETSI Industriales – C/ José Gutiérrez Abascal, 2 28006 Madrid (España)
POLIMI – Piazza Leonardo da Vinci, 32 20133 Milano (Italy)
KTH – SE 100 44 Stockholm (Sweden)
38
absolute disadvantages in every aspect, how should they do? Smith's theory
could not answer this question.
Another economic scholiast David Ricardo advocated ―Theory of
Comparative Cost‖(Ricardo, 1817) after Adam Smith. He assumed that the
international trade is based on the relative difference of production
technology instead of absolute difference, and the difference of relative costs.
Every country should export products with comparative advantage and import
products with comparative weakness. (Wolff, Resnick, 1987). David
Ricardo‘s theory provided a solid theoretical basis on that only when the
government does not intervene in the foreign trade, the effectiveness could
be achieved. (Ricardo, 1817) Only under the liberated system, each country
can allocate its capital and labor resource into its own best interest. David
Ricardo is the liberalized trade theorist. The theory also assumed that ‖labor
is homogeneous‖ (Salvatore, 2002). However, his labor theory of value has
devalued after the rise of the ―Neoclassical Economics‖. The comparative
advantages only depended on the production costs of goods between the
two countries. If to compare with two countries with‖ 2 × 2 trade model‖
(Jones & Scheinkman, 1977) with highly abstract, there is no difference of
the comparative cost of production of such a situation between the two
countries. Then, the situation of equal advantages or equal disadvantages
presented. That was the flaw of Ricardo‘s theory.
UPM-ETSI Industriales – C/ José Gutiérrez Abascal, 2 28006 Madrid (España)
POLIMI – Piazza Leonardo da Vinci, 32 20133 Milano (Italy)
KTH – SE 100 44 Stockholm (Sweden)
39
Balassa further developed the theory of comparative advantages on the
objectives of the developing countries. Balassa proposed the hypothesis of
foreign trade advantage transfer based on the neo-classical trade theory.
(Balassa, 1981). Hence, it was formed ―the ladder of comparative
advantages‖. (Balassa, 1981) He expected that the commodity structure of
import and export, and national comparative advantages would change by
the accumulation of production factors. The difference between the traditional
theory which categorized into developed and developing countries and his
theory was that there were many escalating stages during the international
subsidization and economic development. Divided by the development
stages, the existence in today's world economy roughly can be categorized
into the following types regions: First level was the developed; the second
level was the newly industrialized countries, such as the Asian Tigers and
Latin America such as Brazil, Argentina and Mexico; The third level was
a newly industrialized countries and sub-regions such as the ASEAN
countries China and India except Singapore; Finally, the last level was the
other developing countries and regions. The process of updating the
development ladder was continuous but not interrupted. The development
pattern of the ladder would show that the developed countries and newly
industrialized countries would develop from their new industries, and transfer
the industries which lost advantages to the lower level of countries. Dollar
extended the previous theory and stressed that the source of comparative
advantages of the developing countries was incentive system and
technologies advance. (Dollar,1993) If the system could support continuous,
the country would increase the income for the community. To accumulate
UPM-ETSI Industriales – C/ José Gutiérrez Abascal, 2 28006 Madrid (España)
POLIMI – Piazza Leonardo da Vinci, 32 20133 Milano (Italy)
KTH – SE 100 44 Stockholm (Sweden)
40
the knowledge capital would bring the long-term advantages for developing
countries.
Austen Chamberlain was one of important revolutionists of the classical
economics. Chamberlain also proposed the‖ comparative advantages‖.
Chamberlain abandoned the idea of that competition as a normal
phenomenon and monopoly was regarded as an exception under
that ―perfect competition‖. He analyzed the cause of equilibrium, effects of
welfare by using marginal analysis. (Chamberlain, 1993) Hence, ―the theory
of economics of imperfect‖ competition was formed. (Robinson, 1933) It
indicated that ―monopolistic competition‖. Moreover, another theorist, John
Maynard Keynes, claimed that the economic crisis existed and it could be
destructive to the economy. (Keynes, 1992).
The logical of ―Expectation revolution‖ current had substantial influence on
the economic variation. (Fazzari, 1985) On one hand, ―money supply‖ could
lead to the random change of the ―money stock‖ which resulted in fluctuation
of economy. On the other hand, money supply caused the variation of the
total demand because the variation was completed through the ―Aggregate
Demand Curve‖. (Fazzari, 1985) From the point of view of monetary policy,
the government tried to intervene the macro economic policy was ineffective.
The ―government failure‖ existed but ―market failure‖ did not exist.
UPM-ETSI Industriales – C/ José Gutiérrez Abascal, 2 28006 Madrid (España)
POLIMI – Piazza Leonardo da Vinci, 32 20133 Milano (Italy)
KTH – SE 100 44 Stockholm (Sweden)
41
In the eighty of twenty century, Paul R. Krugman and Elhanan Helpman
introduced the ―Economies of scale‖ (HELPMAN & KRUGMAN, 1989) to
analyze the comparative advantages. They developed ―Monopolistic
competition model‖ by free entry and average cost pricing. The number of
diversified products was regarded as derivativeness of the interaction
between the return of scale and size of market. In ninety, James R.Tybout
further summarized the ―increasing internal returns to scale‖ as the source of
comparative advantages.(Eckel , 2008) However, the scholiast Dollar
assumed that ―Economies of scale‖ (Helpman & Krugman, 1989) could not
explain sufficiently about the comparative advantages. Only for the
developed countries which have the similar factors, the economies of scale
could only explain the specialization of these countries. Nevertheless, the
difference of the technology was the reasonable explanation of the
specialization of these countries.
Paul R. Krugman and Elhanan Helpman further developed the theory of
comparative advantages from the aspect of research. They developed Paul R.
Krugman and Elhanan Helpman ‗s ―Dynamic General Equilibrium Theory‖
(Helpman & Krugman, 1989) to research trans stages of global trade.
―Dynamic Equilibrium Analysis‖ was not only further promoted but also more
innovated. Their model explicitly addressed the requirement of private
investment and research activities.
UPM-ETSI Industriales – C/ José Gutiérrez Abascal, 2 28006 Madrid (España)
POLIMI – Piazza Leonardo da Vinci, 32 20133 Milano (Italy)
KTH – SE 100 44 Stockholm (Sweden)
42
Yang Xiaokai expanded the theory of comparative advantages from the
aspect of specialization and ―division of labor‖. (Yang, 2001) Derivative
comparative advantages would increase with the degree of division of
labor. He analyzed the comparative advantages from the interaction of
transaction costs and division of labor and placed specialization
and division in the core of analysis.
Eli F Heckscher and Bertil Gotthard Ohlin, the Swedish economists, have
inherited the David Ricardo‘s comparative cost theory and developed ―factor
endowment theory‖ which was also call Heckscher-Ohiln theory (H—O
theory). (Jones, 1956) They explained the cause of the international trade
from the abundance of production factors. Ohlin believed that the absolute
difference of the price of products was caused by the absolute difference of
the cost of products. The absolute difference of cost was caused by the
difference of first production factor. The production factors were different from
the different countries. Second, the proportion of production factors was
different (different intensity) during the production process when the industry
produced products. Although ―factor endowment theory‖ has been
questioned by the American Russian economist Wassily Leontief, it is quite
important to the international trade theory. Ohlin theory helped us to analyze,
judge and predict the global trade patterns, and to develop strategy.
In addition, the production factors of a country were variable. The quality,
quantity and structure of production factors changed by increasing the
UPM-ETSI Industriales – C/ José Gutiérrez Abascal, 2 28006 Madrid (España)
POLIMI – Piazza Leonardo da Vinci, 32 20133 Milano (Italy)
KTH – SE 100 44 Stockholm (Sweden)
43
productivity,technological and educational developments. Modern technology
revolution has changed the production elements, and promoted the human
capital, technology innovation, capital, and other intangible
and physical factors. Therefore, people should not only face the
one-sided static comparative advantages of factor endowments but also hold
the scientific attitude from Ohlin theory. (Jones, 1956)
The development of foreign trade of any country was constrained by the
―national resource endowments‖ and ―comparative costs‖. The developing
countries had weak positions of its factor endowments in the global economy.
They owned production factors of the sunsetting industry but lacked of the
core factors of knowledge economy.
International competitiveness was that a country compares its competitiveness
which was the capability to create added value and national wealth with
sustained growth with other countries under the worldwide economy. It was a
quantitative concept which reflected the national competitiveness of the
whole region under the process of economy globalization.
International competitiveness of a nation consisted of three parts: core
competitiveness, basic competitiveness and environmental competitiveness.
It included eight major elements: the national economic strength,
internationalization, government, financial system, infrastructure, business
UPM-ETSI Industriales – C/ José Gutiérrez Abascal, 2 28006 Madrid (España)
POLIMI – Piazza Leonardo da Vinci, 32 20133 Milano (Italy)
KTH – SE 100 44 Stockholm (Sweden)
44
management, science and technology, quality of the citizens. General, these
eight elements were relevant to the core competitiveness.
The development process of the international competitiveness was basic in
four stages. It was essential to find out the competitive advantages of the
nation. Each country no matter small or big had its own advantages. To
sufficient develop its advantages and avoid its disadvantages was critical. To
sufficient utilize capital was the next stage. The capital included tangible,
intangible and human resources. The human resources was more important
gradually. The process of competition was seeking for maximum of
advantages of its industry value chain. It was difficult to advance to the higher
lever if there was only capital competition but there was no process
competition. Then, industries needed to adjust their structures and re
positioned for adapting to the evolution of the information technology. The
government played a critical role by regulating the favorable policies for
guiding industries to adjustment themselves and developed the better
connection between the infrastructure, science and technology, education
and government. Last, to promote the value concept could maintain
nation‘s sustainment of competitiveness. The strategy for meeting the new
challenges was to inspire and motivate people and let them realize their own
value, hence human capital could be developed well.
Porter has mentioned five competitiveness(Porter, 1980) in his previous
theory in 1980. After, he strengthened the point about competitiveness. He
UPM-ETSI Industriales – C/ José Gutiérrez Abascal, 2 28006 Madrid (España)
POLIMI – Piazza Leonardo da Vinci, 32 20133 Milano (Italy)
KTH – SE 100 44 Stockholm (Sweden)
45
described that an enterprise could select and implement a basic strategy
to create and maintain its competitive advantage (Porter, 1985) with value
chain analysis (Porter, 1985). Finally, Michael Porter proposed
that the competitive advantage of a nation is the competitive advantage of its
enterprises and industries. (Porter, 1990) It was the reason that a country‘s
bloom and decline which mainly lied in its capability of competitive advantage
gaining in the international market. Porter practiced the trade theory by
logical reasoning but not the mathematical methods from the traditional
international trade theory. (Ketels, 2006).
The competitive advantage principal was formed from the advantage of the
leading industry. The key factors of being more competitive were whether
the labor productivity was able to increase, and whether its source was
sufficient to innovate for the national innovation system.
3.2. National Diamond
Porter proposed four basic vital factors and another two auxiliary variables in
―Competitive Advantage of Nations―. (Porter, 1990)
―Factor conditions‖ - included the human resources, natural resources,
knowledge resources, capital resources and infrastructure.
―Demand conditions‖ - essentially referred to the demand of domestic
market.
UPM-ETSI Industriales – C/ José Gutiérrez Abascal, 2 28006 Madrid (España)
POLIMI – Piazza Leonardo da Vinci, 32 20133 Milano (Italy)
KTH – SE 100 44 Stockholm (Sweden)
46
―Related and supporting industries‖ - these industries and related
upstream industries shaped the competitiveness international.
―Corporate strategy, structure, and rivalry‖. (Porter, 1990)
In addition to these four elements,there were two other variables: ―Government‖
and ―Chance‖. (Porter, 1990) ―Chance‖ was beyond the control. Government‘s
policy could cause significant impact and which could not be ignored.
Michael Porter believed that the roles of the four elements were in effect
mutually and to form a diamond. (as shown by the below Figure 8 National
Diamond Theory Framework).
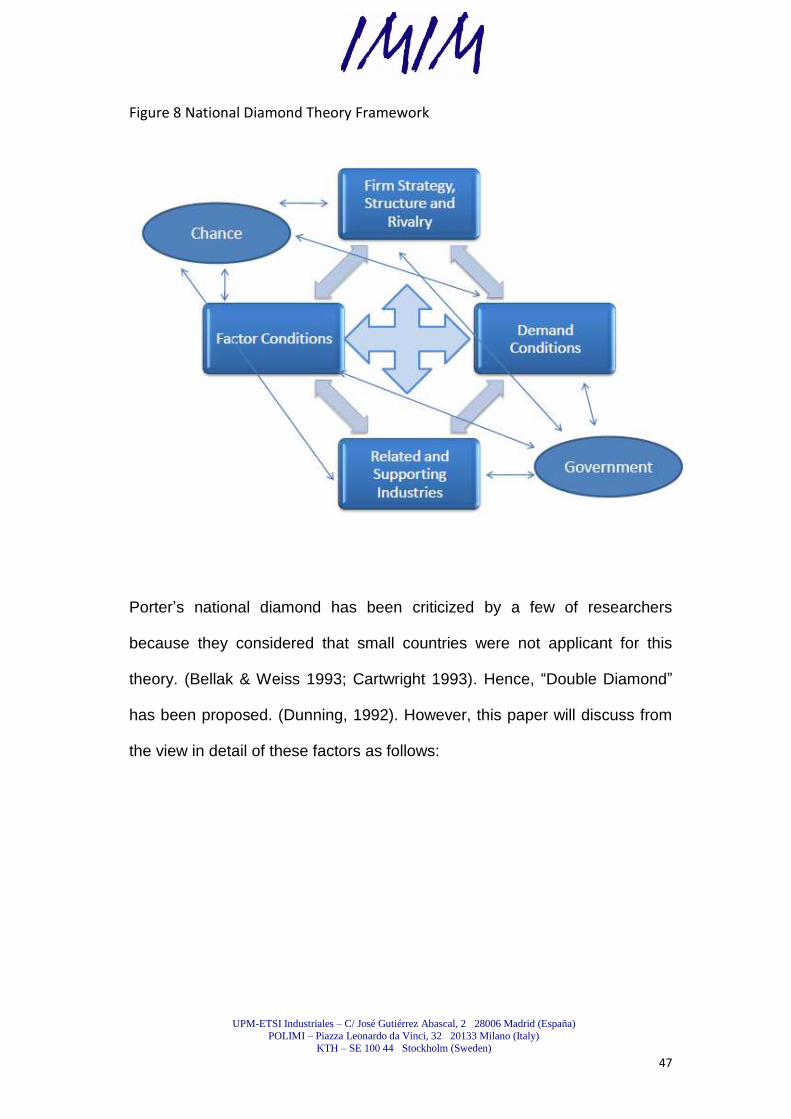
UPM-ETSI Industriales – C/ José Gutiérrez Abascal, 2 28006 Madrid (España)
POLIMI – Piazza Leonardo da Vinci, 32 20133 Milano (Italy)
KTH – SE 100 44 Stockholm (Sweden)
47
Figure 8 National Diamond Theory Framework
Porter‘s national diamond has been criticized by a few of researchers
because they considered that small countries were not applicant for this
theory. (Bellak & Weiss 1993; Cartwright 1993). Hence, ―Double Diamond‖
has been proposed. (Dunning, 1992). However, this paper will discuss from
the view in detail of these factors as follows:
UPM-ETSI Industriales – C/ José Gutiérrez Abascal, 2 28006 Madrid (España)
POLIMI – Piazza Leonardo da Vinci, 32 20133 Milano (Italy)
KTH – SE 100 44 Stockholm (Sweden)
48
3.2.1. Factor Conditions
From the point of view of economics, the types of production factors have
developed from dual-elements, three- elements… to the six elements in the
last. Early in the seventeenth centuries, ―Williams Petty‘s tax thought‖ has
been proposed ―Labor Theory of Value‖. That theory is that the value of
products was created from the abstract labors. (Zou, 1994) David Ricardo
and Adam Smith also contributed this point a lot. (Ricardo, 1817). Williams
Petty also stated that "Land is the mother of wealth; labor is the father
of wealth, and dynamic factor". That was both land and labor could create
wealth and value so production factor was dual. In ―The Wealth of Nations‖,
(Smith, 1776) he also proposed that "A nation‘s labor of each year is the
source of the supply of the nation‘s annual consumption of all the necessities
and conveniences ". (Smith, 1776) Finally the price was broken down
into labor, capital and land. In 1890, the famous British economist, Marshall,
one of founders of the Cambridge school, presented in his book "Principles of
Economics‖ that "organization" played an important role for the production
so "organization" became the fourth element. (Alfred, 1920)
In fifty of twenty century, an American economist Simon Smith Kuznets used
―Statistical Analysis‖ methods (Kuznets, 1995) to analyze the growth of
national economic. After comparing capability of each country's economic
growth, he found that the main factor of economic growth was to technology
improvement, and the adjustments of its system. ―Advanced technology‖ was
one of features of economic growth. Robert Merton Solow also revealed that
UPM-ETSI Industriales – C/ José Gutiérrez Abascal, 2 28006 Madrid (España)
POLIMI – Piazza Leonardo da Vinci, 32 20133 Milano (Italy)
KTH – SE 100 44 Stockholm (Sweden)
49
from his research:"Technology development is a long-term vital cause behind
the economic growth". (Solow, 1956)
As science and technology was playing an important role in carrying out
economic development, many economists agreed that technological
development was the third element of economic growth in addition to capital
and labors. At the same time, the rise of the ―Knowledge Economy‖ and the
―Information Super Highway‖, (Collinge & Staines, 2009) information had
more important position in the six elements. Then the six elements of
production have been shaped. Production factors usually included
capital, labor, technology, land, economical information and economical
management.
Michael Porter classified the ―factors conditions‖ into two categories as the
primary production factors and secondary production factors. Primary factors
of production referred to a country‘s natural resources, climate, geographical
location, non-skilled workers, capital and the other. Secondary production
factors referred to the modern communications, information, transportation
and other infrastructure and highly educated manpower, research institutes
and so on.
Based on Porter‘s national diamond (Porter, 1990), he regarded as that the
level of the importance of the primary production factors was low but the
UPM-ETSI Industriales – C/ José Gutiérrez Abascal, 2 28006 Madrid (España)
POLIMI – Piazza Leonardo da Vinci, 32 20133 Milano (Italy)
KTH – SE 100 44 Stockholm (Sweden)
50
secondary production factors of competitive advantage were invincible
crucial. To acquire secondary production factors was subjective to that if a
country was able to obtain the substantial amount of the human and capital
resources, if it could be sustainable on investments, and if it could have
senior research and education. High level of production factors were difficult
to obtain from the outside environment. A country should create its own
competitive advantages.
From the other perspective, production factors are divided into general and
specialized factors. Senior professionals, professional research institutions,
specialized software and hardware facilities are classified as specialized
factors of production. An industry which is more sophisticated needs more
specialized production factors. These companies or industries also have
more sophisticated competitive advantages.
If a country wants to establish the strong and sustained industrial production
factors, it must develop secondary production factors and specialized
production factors. These two production factors were fundamental
determines of the level of the quality of competitive advantages.
Porter also pointed out that the rich resources or low cost factors often
resulted in inefficient allocation of resources in the practical competition. On
the other hand, labor shortages, inadequate resources, poor geographical
UPM-ETSI Industriales – C/ José Gutiérrez Abascal, 2 28006 Madrid (España)
POLIMI – Piazza Leonardo da Vinci, 32 20133 Milano (Italy)
KTH – SE 100 44 Stockholm (Sweden)
51
and climatic conditions, and other unfavorable factors would stimulate
industries to innovate, promote or upgrade its competitive advantages.
In sum, industries with rich resources, low cost labor and labor-intensive
should be developed. However, these industries would not be much helpful
to increase the national income of the country. To rest merely on the primary
production factors that would not have the critical breakthrough for acquiring
the global competitiveness.
3.2.2. Demand Conditions
Demand from a domestic market was the motivation of the development of
industries. The difference between the domestic market and international
market was that domestic enterprises could discover the domestic demand in
time superior than the foreign competitors. Therefore, Michael Porter argued
that global competition did not lessen the importance of the domestic market.
Porter pointed out that the nature of domestic customers was substantial
crucial, particularly who are proficient, experienced and choosy. If the domestic
customers demanded with high criteria of products and services, it stimulated
industries to be capable and that increased a country's competitive advantage.
If an industry or an enterprise could satisfy with the most persnickety customer,
the rest of customers for the industry or enterprise were almost trouble free.
UPM-ETSI Industriales – C/ José Gutiérrez Abascal, 2 28006 Madrid (España)
POLIMI – Piazza Leonardo da Vinci, 32 20133 Milano (Italy)
KTH – SE 100 44 Stockholm (Sweden)
52
For example, Japanese consumers famously were known as over picky in
automotive industry. European automotive industry could offer world class
energy saving cars because it had the strict standard of regulation of
environmental protection. American consumption spoiled the automotive
industry, resulting in distress of the automotive industry after the oil crisis in the
United States.
―Expected demand‖ was important. If domestic customers needed high
quality of products which was ahead of other countries, this could also be an
advantage for domestic companies because sophisticate products need to be
supported by the sophisticate needs. Sometimes the national policies could
affect the projected demand such as the policies of environmental protection
and vehicle safety, regulation of energy and policy of tax. (Porter, 1990)
3.2.3. Related and Supporting Industries
Industry Chain contained the value chain, business chain, supply chain
and the concept of space chain. ―Equal Mechanism‖ was formed when to
balance the connection of the four dimensions. It was the objective
mechanism liked an invisible hand to control the‖ industry chain‖. (Han, 2009)
Industry chain was a concept of industrial economy. It was a relationship
based on a certain technical and economic relevance. The chain was mainly
objective existed in regional differences in regions which focused on regional
UPM-ETSI Industriales – C/ José Gutiérrez Abascal, 2 28006 Madrid (España)
POLIMI – Piazza Leonardo da Vinci, 32 20133 Milano (Italy)
KTH – SE 100 44 Stockholm (Sweden)
53
comparative advantage to cooperate in region by specialization and
multi-dimension.
On the point of formation of national competitive advantage (Porter, 1990),
the factor ―the relevant and supporting industries‖ had dependent relationship
with the main industries. From Porter's research, he proposed the
phenomenon "industry clusters". The dominant industry could not exist alone
but it upsurges with other relevant industries. Some economists pointed out
that some countries centralized the allocation of resources at only one
preferable industry which had been given the priority for developing. This
would scarify other industries and also make the industry alone without
supporting. The result would be that the preferable industry fails to survive.
Local suppliers and industrial innovation were as well indispensable parts of
competitive advantage. If there was a lack of world-class suppliers, the
industries could not cooperate between the upstream and downstream
industries .Relatively, competitive domestic industries usually would increase
the competitiveness of the relevant industries.
Porter claimed that even if the downstream industries did not have the
internationally competitiveness but as long as upstream suppliers had
international competitive advantage, the impact on the industry remained
positive. (Porter, 1990)

UPM-ETSI Industriales – C/ José Gutiérrez Abascal, 2 28006 Madrid (España)
POLIMI – Piazza Leonardo da Vinci, 32 20133 Milano (Italy)
KTH – SE 100 44 Stockholm (Sweden)
54
3.2.4. Corporate strategy, Structure and Rivalry
Porter considered that the motivation to drive enterprises to be international
was a significant key. This force might come from international demand, or
the pressure of local competitors. The strong domestic market competition
was the most important factor of increasing the competitive
advantage. Porter took account into this point was contradicted to some other
traditional concepts. For example, over intensive domestic competition
caused to consume excessive resources; it impeded the development of
economies of scale. Porter mentioned that in his study at ten countries,
generally, domestic competitors which were strong usually exist in the
international market as well. Enterprises forced themselves to be more
competitive in overseas markets by improvements themselves and
innovations. A successful business frequently needed to be past the
process of intensive conflicts in the business world. However, ―the star
industry‖ mostly was not competitive which did not have opponents in the
international world under its government‘s protection. (Porter, 1990)
3.2.5. Chance
Porter claimed that there were several possibilities for increasing
opportunities: science and technology inventions, a breakthrough of
traditional technologies; external factors causes increasing the production
costs (such as the oil crisis), exchange rates floating, finance market
substantial fluctuations, market demand surging, the government's policy, a
UPM-ETSI Industriales – C/ José Gutiérrez Abascal, 2 28006 Madrid (España)
POLIMI – Piazza Leonardo da Vinci, 32 20133 Milano (Italy)
KTH – SE 100 44 Stockholm (Sweden)
55
war occurring and so on. The opportunity was normal in both-ways. It was
often an advantage for the new competitors. At the same time, the original
competitors might lose their advantages. Only those enterprises which could
meet the needs had the new "opportunity." (Porter, 1990)
3.2.6. Government
Only if the government played its role appropriately, the force of the diamond
system could be expanded. The government could create new opportunities
for enterprises. A government should invest fields which enterprises were not
able to develop for their business. That was the external costs, such as
infrastructure development, opening up capital channels or integration of
information.
From the view of four elements, government procurement was the major
factor which could impact on the demand of domestic market. There must be
some strict procurement standards for playing the roles of the government to
be a critical customer. Procurement should be favorable to the competition
and innovation. Government should ensure that the competition is active in
the domestic market and avoid the ―Trust unfair‖ situation. (Porter, 1990)
Porter believed that the protections would be an obstacle of the formation of
industrial competitiveness.
UPM-ETSI Industriales – C/ José Gutiérrez Abascal, 2 28006 Madrid (España)
POLIMI – Piazza Leonardo da Vinci, 32 20133 Milano (Italy)
KTH – SE 100 44 Stockholm (Sweden)
56
However, the government could only support and offer resources, or created
the nice environment to enterprises but could not decide which industries
should be developed or how to achieve the best of the competitive
advantages for enterprises even the government had the best performance in
the world.
3.3. SWOT Analysis
3.3.1. SWOT
The origin was unknown but the strategic master Igor Ansoff has promoted it
for the past forty years and it became a popular strategically analysis tool. It
was the theory of business management strategic planning contained the
Strengths, Weaknesses, Opportunities, and Threats. (Kipley , 2009)
Generally, SWOT was used in analyzing the industry, mainly in consideration
of the internal conditions of the strengths and weaknesses whether it was
conducive to competition within the industry. Opportunities and threats were
to explore the external environment for enterprises to explore the industry of
the future evolution. This mode of thinking could help analysts to consider
four-orientations to analysis the pros and cons. Then, SWOT helped to find
exactly the problem and to design countermeasures to cope. Strategy was
proposed based on the result of analysis. (Kipley , 2009). Please see the
below figure 9 SWOT analysis which had four aspects.
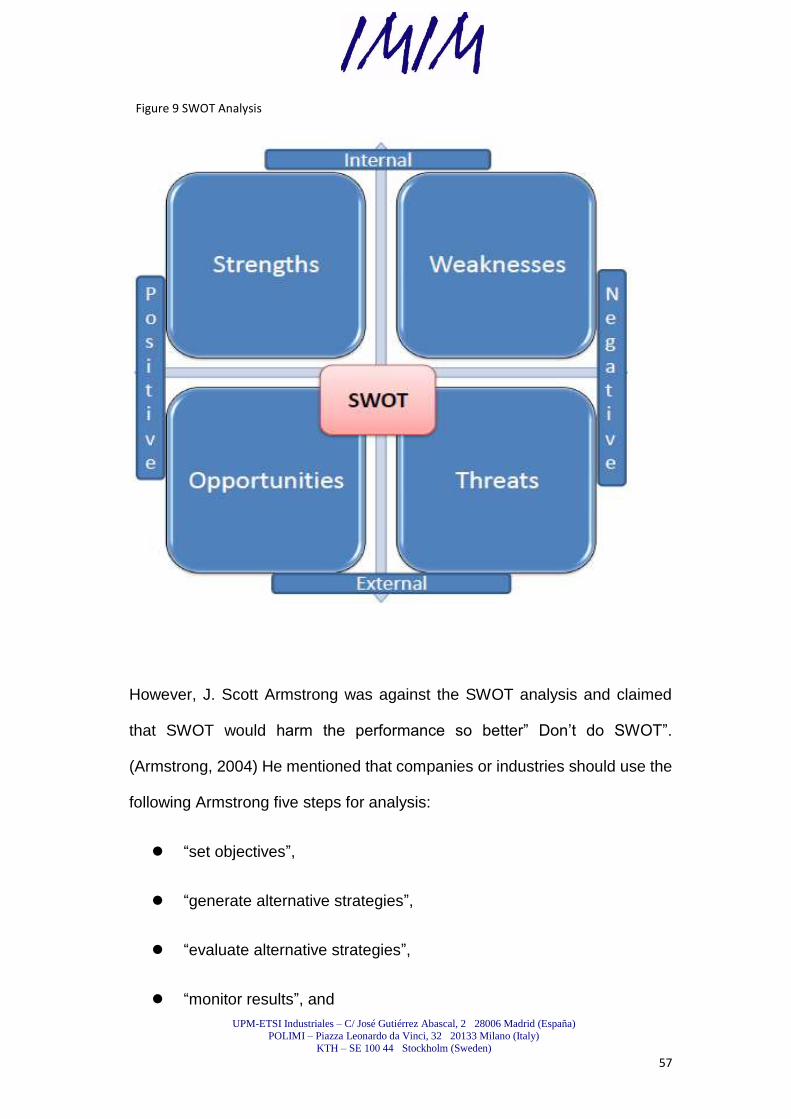
UPM-ETSI Industriales – C/ José Gutiérrez Abascal, 2 28006 Madrid (España)
POLIMI – Piazza Leonardo da Vinci, 32 20133 Milano (Italy)
KTH – SE 100 44 Stockholm (Sweden)
57
Figure 9 SWOT Analysis
However, J. Scott Armstrong was against the SWOT analysis and claimed
that SWOT would harm the performance so better‖ Don‘t do SWOT‖.
(Armstrong, 2004) He mentioned that companies or industries should use the
following Armstrong five steps for analysis:
―set objectives‖,
―generate alternative strategies‖,
―evaluate alternative strategies‖,
―monitor results‖, and
UPM-ETSI Industriales – C/ José Gutiérrez Abascal, 2 28006 Madrid (España)
POLIMI – Piazza Leonardo da Vinci, 32 20133 Milano (Italy)
KTH – SE 100 44 Stockholm (Sweden)
58
―gain commitment among the stakeholders during each step of this
process‖. (Armstrong, 1982)
Armstrong expressed that SWOT restraint the generation of alternatives but
his linear steps might not be applicable to the larger companies which had
international trade business with complex and sophisticated environment.
―Don‘t do SWOT analysis‖ might lose the opportunity to understand a
company or an industry‘s advantages, disadvantages and external
environment and opportunities. Therefore, SWOT analysis was still a useful
tool for academic research. To do SWOT right was more important than only
used it.
After the large amount of using SWOT tool, some people started to propose
advanced or improved SWOT for reducing the constraints. Most of problems
people encountered when used the SWOT analysis were the adaptability.
This tool was not applicable to any occasions. Therefore, this could lead
to the abnormal result. Hence, ―Power SWOT‖ has been cited which included
personal experience, order, weighting, emphasize detail, rank and prioritize.
3.3.2. SWOT--CLPV
―SWOT--CLPV Theory‖ was based on the SWOT model slightly
modified. This analysis was more objective and accurate on analysis of
UPM-ETSI Industriales – C/ José Gutiérrez Abascal, 2 28006 Madrid (España)
POLIMI – Piazza Leonardo da Vinci, 32 20133 Milano (Italy)
KTH – SE 100 44 Stockholm (Sweden)
59
the reality of a business method. Using this method could find out advantage
worth promoting, avoid disadvantages avoided, further to find problems and
have solutions, and make clearly direction for the future. In the adaptive
analysis process, an analyst should determine various internal and
external variables, based on ―leverage effect‖, ―inhibition‖, ―vulnerability‖
and ―problematic‖ of this model.
3.3.2.1. Leverage effect (strengths + opportunities):
Leverage effect occurred when the internal strengths and external
opportunities in the consistency. In this case, the industry could take
advantage of the internal strength by itself for creating the external
opportunities. The integration was for seeking the greater development for an
industry.
3.3.2.2. Inhibition (opportunities + weaknesses):
Inhibition meant prevention, determent, influence and control. When
the environment provided opportunities but the internal could not offer relative
resources to fit, the industry would not obtain any advantages. In this case, an
industry needed to provide some additional resources and to transfer its
disadvantages to advantages for adapting to external opportunities.
UPM-ETSI Industriales – C/ José Gutiérrez Abascal, 2 28006 Madrid (España)
POLIMI – Piazza Leonardo da Vinci, 32 20133 Milano (Italy)
KTH – SE 100 44 Stockholm (Sweden)
60
3.3.2.3. Vulnerability (strengths + threats):
This meant that the degree of strengths decreased. When the external posed
threats to an industry, the strengths could not be presented. In this case, an
industry must overcome the threats.
3.3.2.4. Problematic (weaknesses + threats):
When the internal weaknesses and external threats met at the same time,
the industry faced a challenge seriously. If this was not handled properly, it
could be direct threaten survive of the industry.
3.3.3. SWOT Analysis Steps
There were few steps when did the SWOT analysis. First , it was to confirm
the current strategy for an industry. To ensure the changes of the external
environment was second step. To analyze the industry‘s resources was the
third step. To fill in the facts in the four categories in the SWOP form was the
last.
UPM-ETSI Industriales – C/ José Gutiérrez Abascal, 2 28006 Madrid (España)
POLIMI – Piazza Leonardo da Vinci, 32 20133 Milano (Italy)
KTH – SE 100 44 Stockholm (Sweden)
61
4. Business Model of Spanish International
Wholesale Telecommunication Company
4.1. Introduction
Spanish International Wholesale Services (abbreviated as IWS in follows)
which is a subsidiary of the Spanish Telecommunication Group provides
global telecommunication services for fixed and mobile carriers, ISPs and
content providers. Most of telecommunication operators are primary IWS‘s
business partners.
IWS offers end-to-end connectivity with open and unrestricted access IWS‘s
self-healing fiber optic network. The network connects Latin America, United
States, Africa and Europe with the ultimate standard of quality and reliability.
IWS‘s network is the state of the art technology which meets the broadband
communication needs. The fiber optic cable is 45,000 Km long and up to 7.68
Tbps (TeraBytes Per Second) capacity (upgradeable to 10.8Tbps - protected)
which is end to end open and unrestricted access.
Moreover, IWS takes the ―stragetic alliance‖ with China Unicom by a way to
own 9.7% stake of the China Unicom by January 2011. IWS by market value
has expanded aggressively abroad, from fast-growing Latin American states
to promising economies such as China.
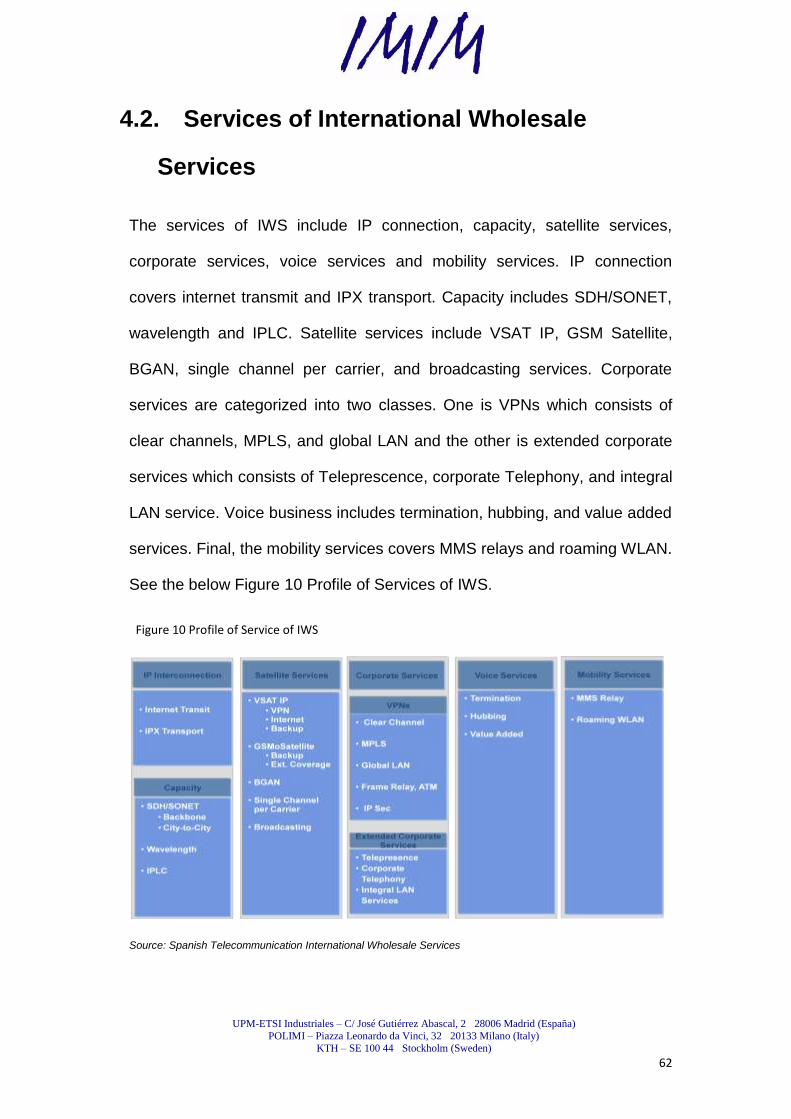
UPM-ETSI Industriales – C/ José Gutiérrez Abascal, 2 28006 Madrid (España)
POLIMI – Piazza Leonardo da Vinci, 32 20133 Milano (Italy)
KTH – SE 100 44 Stockholm (Sweden)
62
4.2. Services of International Wholesale
Services
The services of IWS include IP connection, capacity, satellite services,
corporate services, voice services and mobility services. IP connection
covers internet transmit and IPX transport. Capacity includes SDH/SONET,
wavelength and IPLC. Satellite services include VSAT IP, GSM Satellite,
BGAN, single channel per carrier, and broadcasting services. Corporate
services are categorized into two classes. One is VPNs which consists of
clear channels, MPLS, and global LAN and the other is extended corporate
services which consists of Teleprescence, corporate Telephony, and integral
LAN service. Voice business includes termination, hubbing, and value added
services. Final, the mobility services covers MMS relays and roaming WLAN.
See the below Figure 10 Profile of Services of IWS.
Figure 10 Profile of Service of IWS
Source: Spanish Telecommunication International Wholesale Services
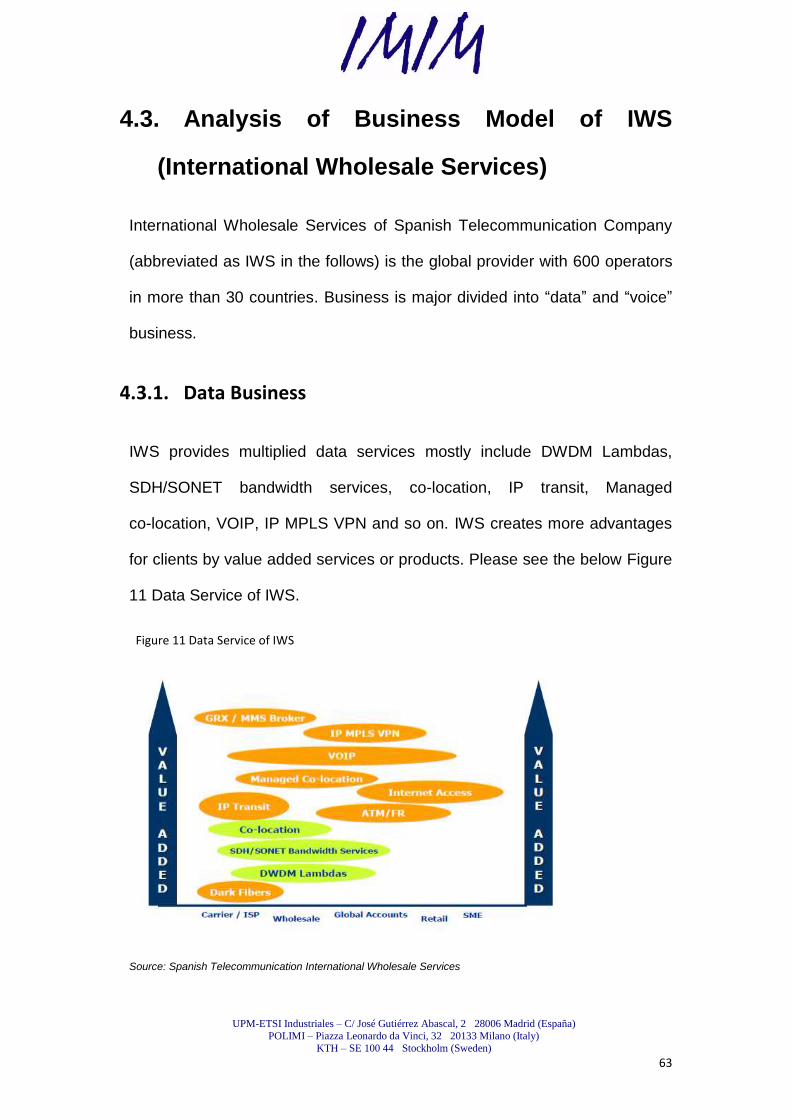
UPM-ETSI Industriales – C/ José Gutiérrez Abascal, 2 28006 Madrid (España)
POLIMI – Piazza Leonardo da Vinci, 32 20133 Milano (Italy)
KTH – SE 100 44 Stockholm (Sweden)
63
4.3. Analysis of Business Model of IWS
(International Wholesale Services)
International Wholesale Services of Spanish Telecommunication Company
(abbreviated as IWS in the follows) is the global provider with 600 operators
in more than 30 countries. Business is major divided into ―data‖ and ―voice‖
business.
4.3.1. Data Business
IWS provides multiplied data services mostly include DWDM Lambdas,
SDH/SONET bandwidth services, co-location, IP transit, Managed
co-location, VOIP, IP MPLS VPN and so on. IWS creates more advantages
for clients by value added services or products. Please see the below Figure
11 Data Service of IWS.
Figure 11 Data Service of IWS
Source: Spanish Telecommunication International Wholesale Services

UPM-ETSI Industriales – C/ José Gutiérrez Abascal, 2 28006 Madrid (España)
POLIMI – Piazza Leonardo da Vinci, 32 20133 Milano (Italy)
KTH – SE 100 44 Stockholm (Sweden)
64
4.3.1.1. SDH/ SONET Services
Synchronous Digital Hierarchy (SDH) is the European standard and
Synchronous Optical Network (SONET) is the American standard. Standards
synchronous transmission of optical signals to carry digital information at
speeds from 45 Mbps (SONET) or 155 Mbps (SDH). It is meant to point to
point solutions where the client has established its capacity needs and wishes
to concentrate on developing other aspects of their communications resources,
in contrast to solutions based on wavelength services that require greater
commitment and network control by the customer.
Contributions can be distinguished ―POP to POP‖ and ―End to End‖ depending
on client's interest in receiving it in the POP connectivity supplier delivery or in
specific site or POP, in which case you must include the "local tail" as a cost
Project Direct. Backbone is that connectivity SDH / SONET between IWS
POPs in different cities. Local Accesses offers customers access to IWS ́
network through physically diverse routes between ―Point of Presence‖ (POP)
of the client and the ―Points of Presence‖ (POP) in every city where IWS is
presence. Co-location is that equipment and connections can be adapted to
customer needs.
The major categories of IWS‘ capacity products are E1, E3, DS3, SDH,
STM-1, STM-4, STM-16, STM-64 and STM-256. Interfaces include Ethernet,
Fast Ethernet, and Gigabit Ethernet. Please see the below Table 1 Current
Product Capacity of IWS. It represents the relative different specification of
each product.

UPM-ETSI Industriales – C/ José Gutiérrez Abascal, 2 28006 Madrid (España)
POLIMI – Piazza Leonardo da Vinci, 32 20133 Milano (Italy)
KTH – SE 100 44 Stockholm (Sweden)
65
Table 1 Current Product Capacity of IWS
Source: Spanish Telecommunication International Wholesale Services
4.3.1.2. DWDM Service
It is a service that provides links without optical level protection with speeds of
2.5 or 10 Gbps DWDM technology-based (by Dense Wavelength Division
Multiplexing). DWDM is a technology which multiplexes several optical
communications wavelengths (lambdas) on a single optical fibre. It is meant to
facilitate point to point optical connections as singular solution or as a
constituent of more complex structures in which the client after setting their
capacity needs are responsible for the development of that structure. That is,
the client hires the wavelength of the optical transmission elements associated
with assuming the design, planning and control of additional elements of its
network.
It should be noted that in any case is a solution that does not include self
healing property for what has to be the customer who need to provide it.
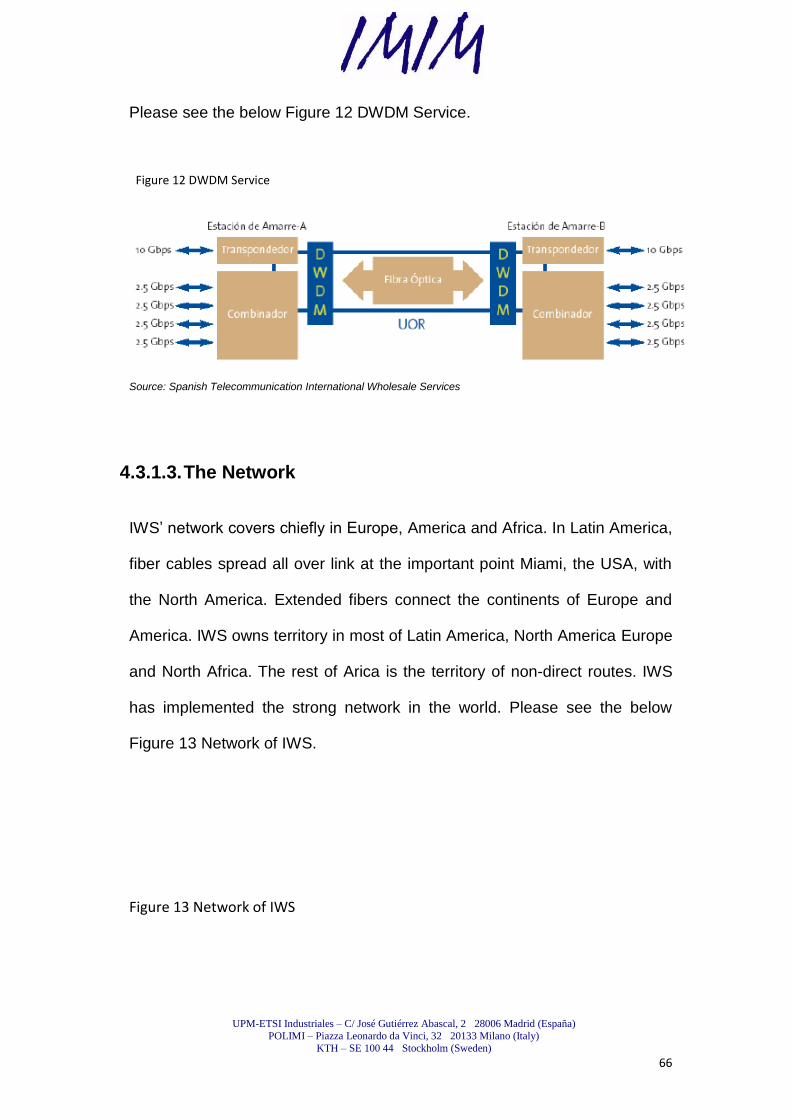
UPM-ETSI Industriales – C/ José Gutiérrez Abascal, 2 28006 Madrid (España)
POLIMI – Piazza Leonardo da Vinci, 32 20133 Milano (Italy)
KTH – SE 100 44 Stockholm (Sweden)
66
Please see the below Figure 12 DWDM Service.
Figure 12 DWDM Service
Source: Spanish Telecommunication International Wholesale Services
4.3.1.3. The Network
IWS‘ network covers chiefly in Europe, America and Africa. In Latin America,
fiber cables spread all over link at the important point Miami, the USA, with
the North America. Extended fibers connect the continents of Europe and
America. IWS owns territory in most of Latin America, North America Europe
and North Africa. The rest of Arica is the territory of non-direct routes. IWS
has implemented the strong network in the world. Please see the below
Figure 13 Network of IWS.
Figure 13 Network of IWS
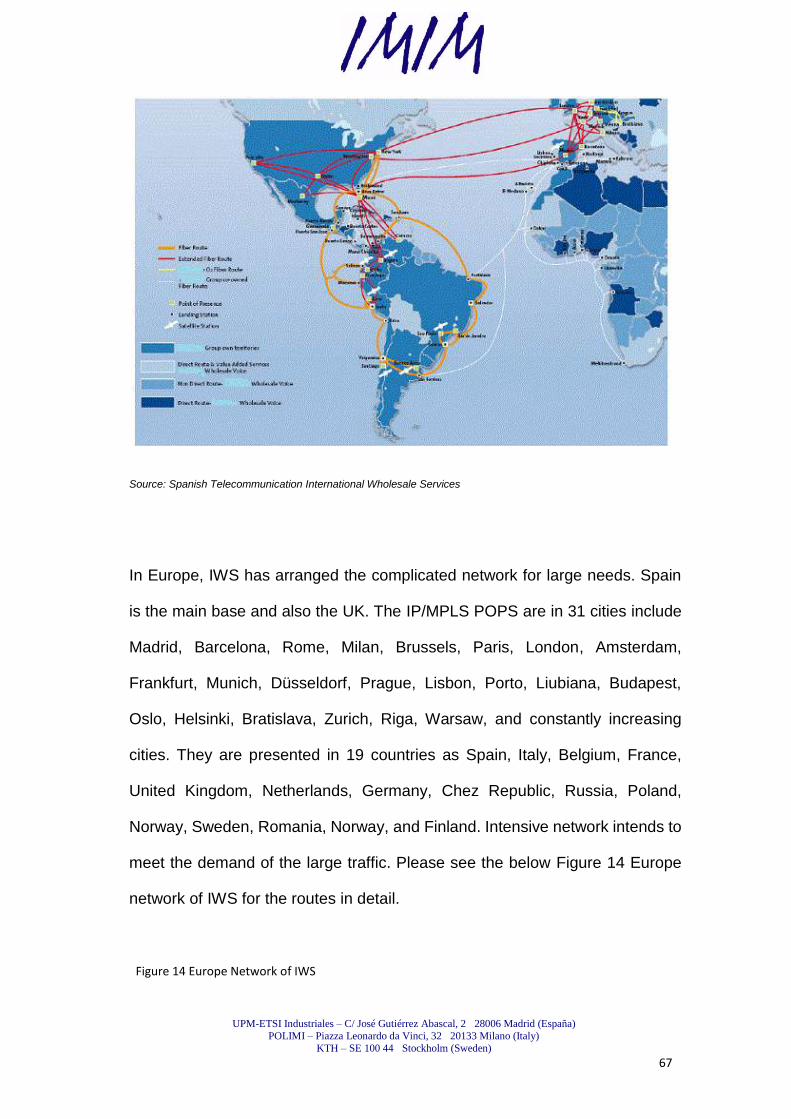
UPM-ETSI Industriales – C/ José Gutiérrez Abascal, 2 28006 Madrid (España)
POLIMI – Piazza Leonardo da Vinci, 32 20133 Milano (Italy)
KTH – SE 100 44 Stockholm (Sweden)
67
Source: Spanish Telecommunication International Wholesale Services
In Europe, IWS has arranged the complicated network for large needs. Spain
is the main base and also the UK. The IP/MPLS POPS are in 31 cities include
Madrid, Barcelona, Rome, Milan, Brussels, Paris, London, Amsterdam,
Frankfurt, Munich, Düsseldorf, Prague, Lisbon, Porto, Liubiana, Budapest,
Oslo, Helsinki, Bratislava, Zurich, Riga, Warsaw, and constantly increasing
cities. They are presented in 19 countries as Spain, Italy, Belgium, France,
United Kingdom, Netherlands, Germany, Chez Republic, Russia, Poland,
Norway, Sweden, Romania, Norway, and Finland. Intensive network intends to
meet the demand of the large traffic. Please see the below Figure 14 Europe
network of IWS for the routes in detail.
Figure 14 Europe Network of IWS
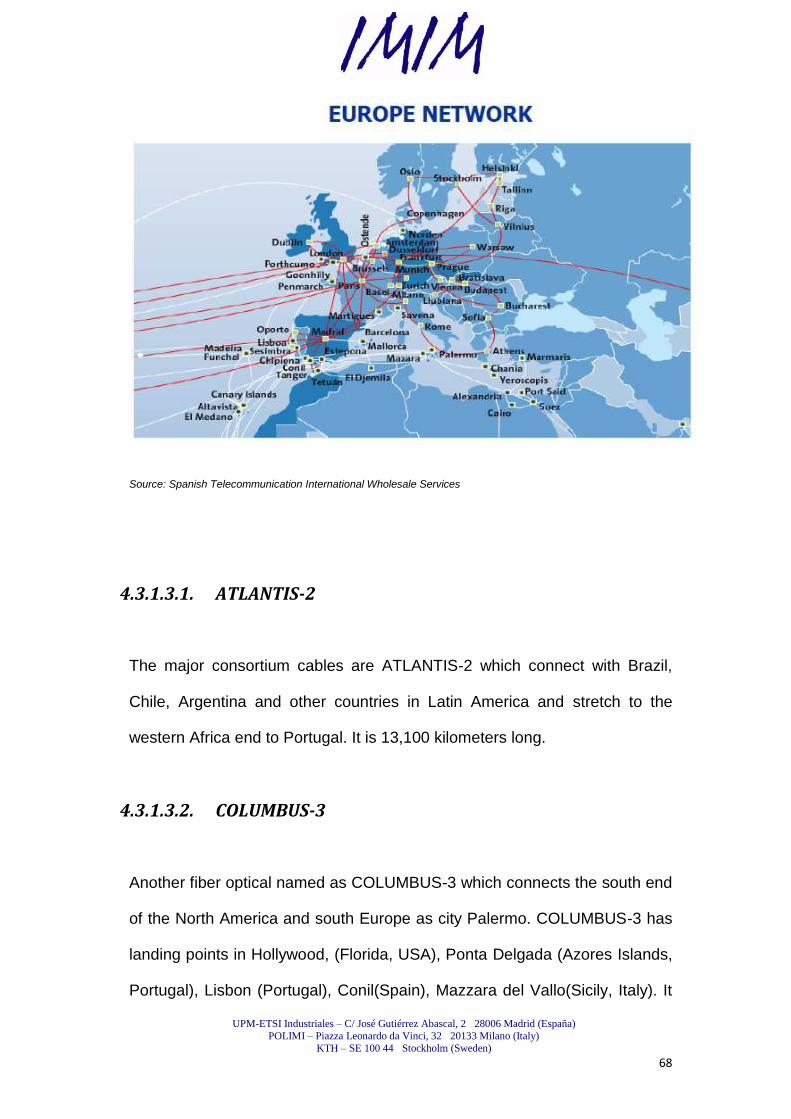
UPM-ETSI Industriales – C/ José Gutiérrez Abascal, 2 28006 Madrid (España)
POLIMI – Piazza Leonardo da Vinci, 32 20133 Milano (Italy)
KTH – SE 100 44 Stockholm (Sweden)
68
Source: Spanish Telecommunication International Wholesale Services
4.3.1.3.1. ATLANTIS-2
The major consortium cables are ATLANTIS-2 which connect with Brazil,
Chile, Argentina and other countries in Latin America and stretch to the
western Africa end to Portugal. It is 13,100 kilometers long.
4.3.1.3.2. COLUMBUS-3
Another fiber optical named as COLUMBUS-3 which connects the south end
of the North America and south Europe as city Palermo. COLUMBUS-3 has
landing points in Hollywood, (Florida, USA), Ponta Delgada (Azores Islands,
Portugal), Lisbon (Portugal), Conil(Spain), Mazzara del Vallo(Sicily, Italy). It
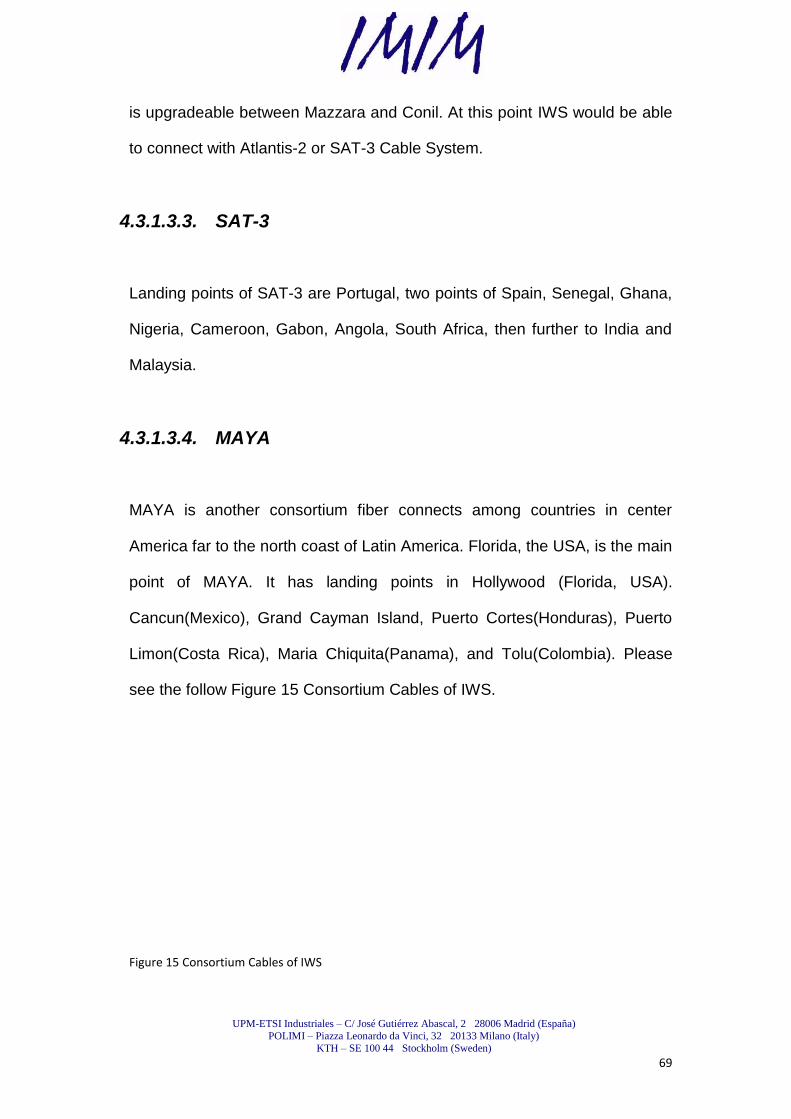
UPM-ETSI Industriales – C/ José Gutiérrez Abascal, 2 28006 Madrid (España)
POLIMI – Piazza Leonardo da Vinci, 32 20133 Milano (Italy)
KTH – SE 100 44 Stockholm (Sweden)
69
is upgradeable between Mazzara and Conil. At this point IWS would be able
to connect with Atlantis-2 or SAT-3 Cable System.
4.3.1.3.3. SAT-3
Landing points of SAT-3 are Portugal, two points of Spain, Senegal, Ghana,
Nigeria, Cameroon, Gabon, Angola, South Africa, then further to India and
Malaysia.
4.3.1.3.4. MAYA
MAYA is another consortium fiber connects among countries in center
America far to the north coast of Latin America. Florida, the USA, is the main
point of MAYA. It has landing points in Hollywood (Florida, USA).
Cancun(Mexico), Grand Cayman Island, Puerto Cortes(Honduras), Puerto
Limon(Costa Rica), Maria Chiquita(Panama), and Tolu(Colombia). Please
see the follow Figure 15 Consortium Cables of IWS.
Figure 15 Consortium Cables of IWS
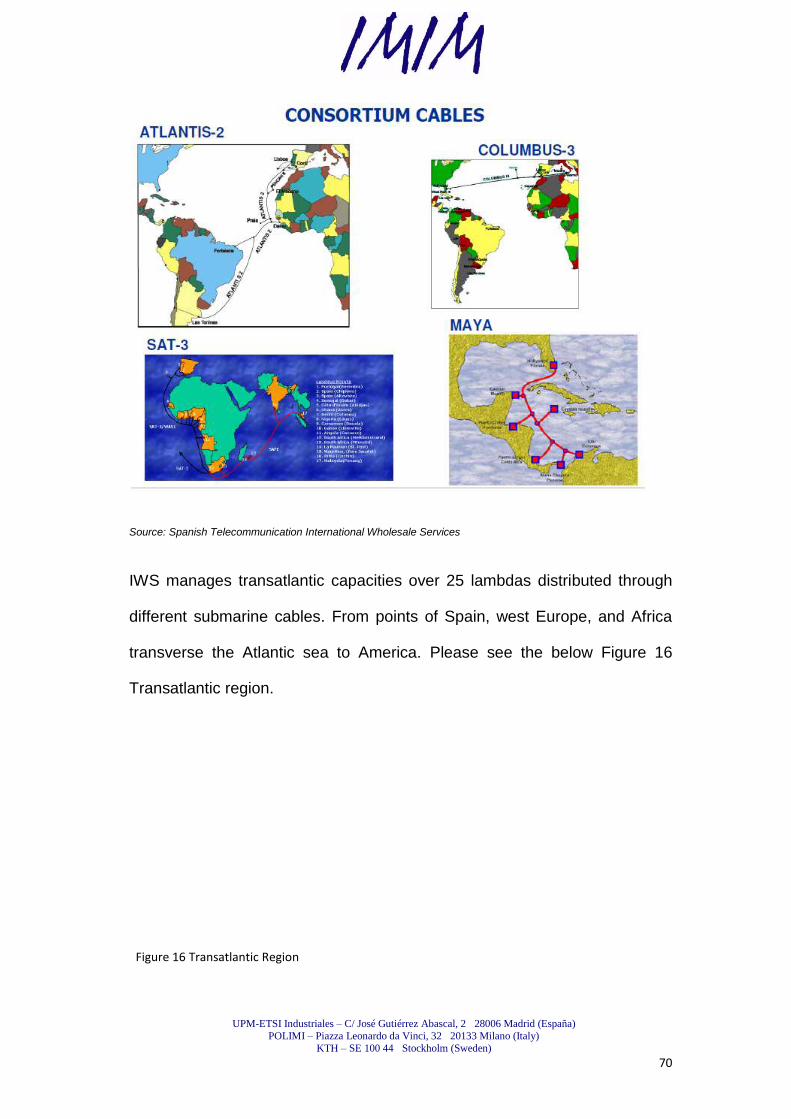
UPM-ETSI Industriales – C/ José Gutiérrez Abascal, 2 28006 Madrid (España)
POLIMI – Piazza Leonardo da Vinci, 32 20133 Milano (Italy)
KTH – SE 100 44 Stockholm (Sweden)
70
Source: Spanish Telecommunication International Wholesale Services
IWS manages transatlantic capacities over 25 lambdas distributed through
different submarine cables. From points of Spain, west Europe, and Africa
transverse the Atlantic sea to America. Please see the below Figure 16
Transatlantic region.
Figure 16 Transatlantic Region

UPM-ETSI Industriales – C/ José Gutiérrez Abascal, 2 28006 Madrid (España)
POLIMI – Piazza Leonardo da Vinci, 32 20133 Milano (Italy)
KTH – SE 100 44 Stockholm (Sweden)
71
Source: Spanish International Wholesale Services
4.3.2. Voice Business
4.3.2.1. Traditional business model of international voice
International telecommunications were generally controlled by
monopoly companies in the past that developed international interconnection
capacity. The companies were paid for calls made through bilaterally
negotiated billing rates. The billing rates represented the total costs which
transport calls through the international facilities to the destination network.
Please see the below Figure 17 Voice business model of IWS.
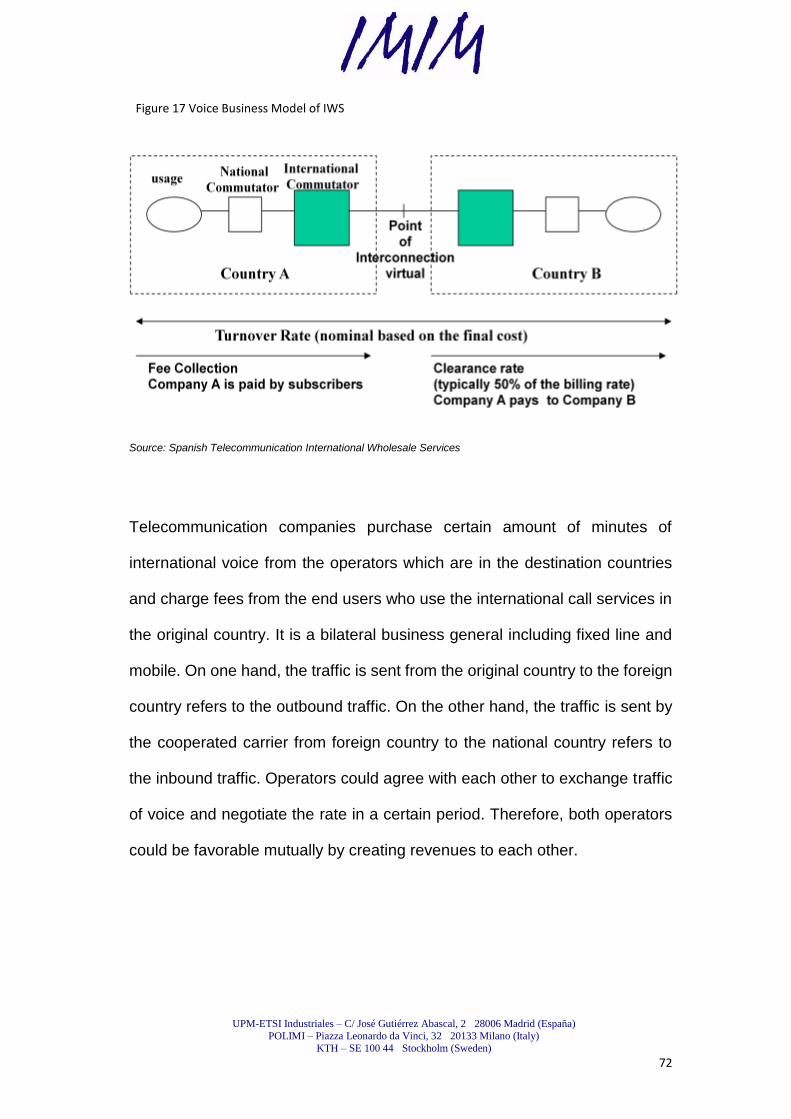
UPM-ETSI Industriales – C/ José Gutiérrez Abascal, 2 28006 Madrid (España)
POLIMI – Piazza Leonardo da Vinci, 32 20133 Milano (Italy)
KTH – SE 100 44 Stockholm (Sweden)
72
Figure 17 Voice Business Model of IWS
Source: Spanish Telecommunication International Wholesale Services
Telecommunication companies purchase certain amount of minutes of
international voice from the operators which are in the destination countries
and charge fees from the end users who use the international call services in
the original country. It is a bilateral business general including fixed line and
mobile. On one hand, the traffic is sent from the original country to the foreign
country refers to the outbound traffic. On the other hand, the traffic is sent by
the cooperated carrier from foreign country to the national country refers to
the inbound traffic. Operators could agree with each other to exchange traffic
of voice and negotiate the rate in a certain period. Therefore, both operators
could be favorable mutually by creating revenues to each other.
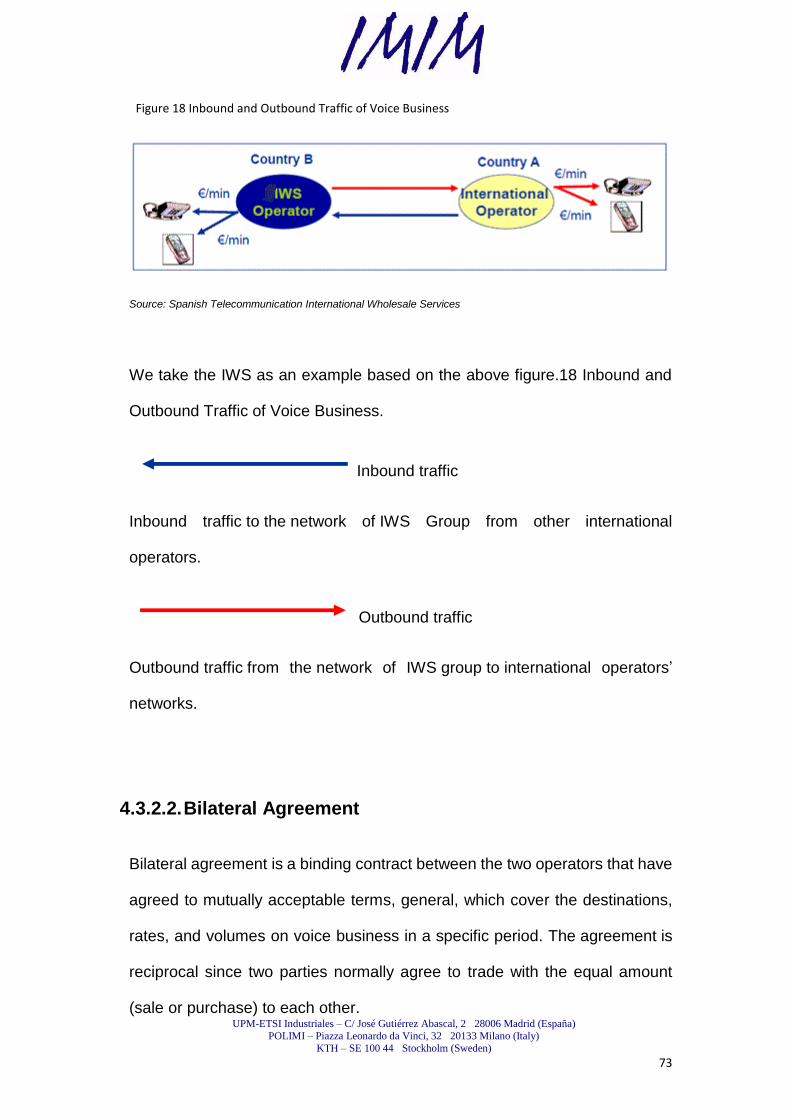
UPM-ETSI Industriales – C/ José Gutiérrez Abascal, 2 28006 Madrid (España)
POLIMI – Piazza Leonardo da Vinci, 32 20133 Milano (Italy)
KTH – SE 100 44 Stockholm (Sweden)
73
Figure 18 Inbound and Outbound Traffic of Voice Business
Source: Spanish Telecommunication International Wholesale Services
We take the IWS as an example based on the above figure.18 Inbound and
Outbound Traffic of Voice Business.
Inbound traffic
Inbound traffic to the network of IWS Group from other international
operators.
Outbound traffic
Outbound traffic from the network of IWS group to international operators‘
networks.
4.3.2.2. Bilateral Agreement
Bilateral agreement is a binding contract between the two operators that have
agreed to mutually acceptable terms, general, which cover the destinations,
rates, and volumes on voice business in a specific period. The agreement is
reciprocal since two parties normally agree to trade with the equal amount
(sale or purchase) to each other.
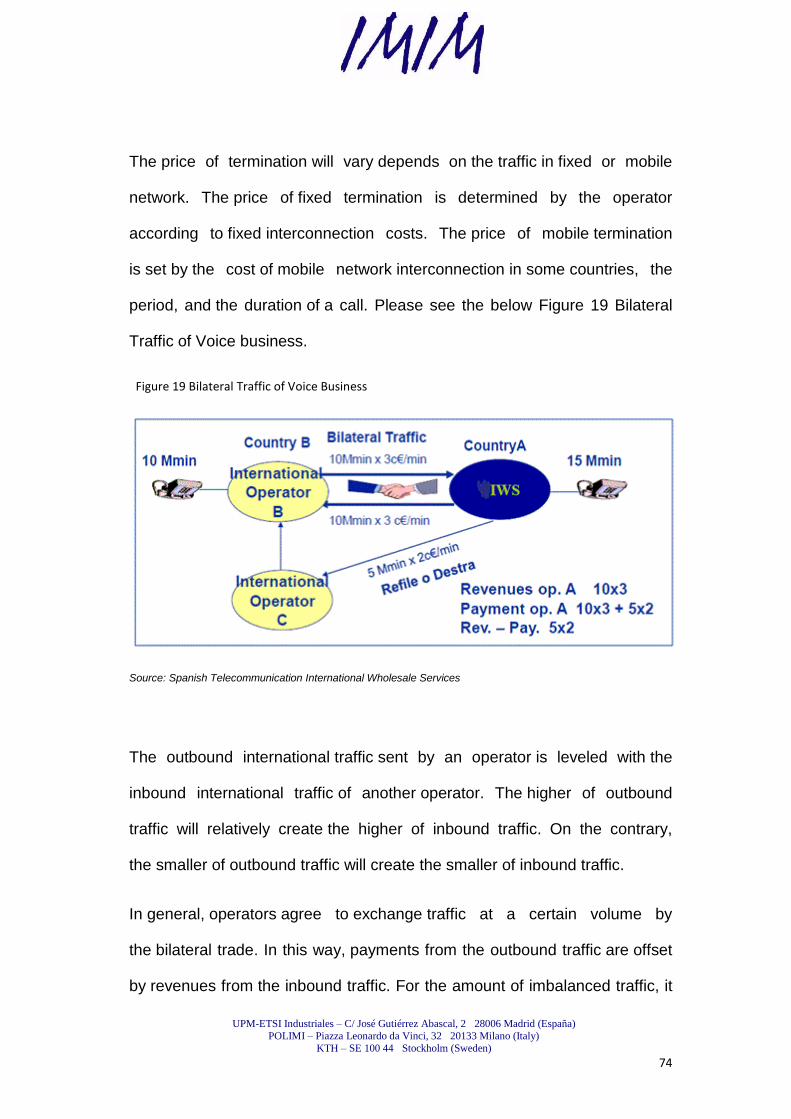
UPM-ETSI Industriales – C/ José Gutiérrez Abascal, 2 28006 Madrid (España)
POLIMI – Piazza Leonardo da Vinci, 32 20133 Milano (Italy)
KTH – SE 100 44 Stockholm (Sweden)
74
The price of termination will vary depends on the traffic in fixed or mobile
network. The price of fixed termination is determined by the operator
according to fixed interconnection costs. The price of mobile termination
is set by the cost of mobile network interconnection in some countries, the
period, and the duration of a call. Please see the below Figure 19 Bilateral
Traffic of Voice business.
Figure 19 Bilateral Traffic of Voice Business
Source: Spanish Telecommunication International Wholesale Services
The outbound international traffic sent by an operator is leveled with the
inbound international traffic of another operator. The higher of outbound
traffic will relatively create the higher of inbound traffic. On the contrary,
the smaller of outbound traffic will create the smaller of inbound traffic.
In general, operators agree to exchange traffic at a certain volume by
the bilateral trade. In this way, payments from the outbound traffic are offset
by revenues from the inbound traffic. For the amount of imbalanced traffic, it
UPM-ETSI Industriales – C/ José Gutiérrez Abascal, 2 28006 Madrid (España)
POLIMI – Piazza Leonardo da Vinci, 32 20133 Milano (Italy)
KTH – SE 100 44 Stockholm (Sweden)
75
will be negotiated with the "incremental price" or that to be sent by other
routes with the lower costs. Thereby, to maximize the trade
balance (revenue of traffic influx – payments of output traffic) or to minimize
the cost of completion of the outbound traffic (payments of outbound traffic -
revenue of traffic influx) is essential. Exchanged as operators seek the
largest possible volume of traffic for the net cost of completion is zero.
4.3.2.3. Hubbing Business
Hubbing traffic offers to operators to terminate international traffic in remote
networks of the destinations. The traffic to the many different destinations is
via a country or a operator which is like a transport transfer point. This is call
non-direct route. Particularly, the hubbing occurs when an operator needs to
send traffic to some small or remote countries which there are no direct
routes between the operator and these countries or under the circumstance
that the fares to these destinations are expensive. For example, China carrier
wants to send traffic to Andorra, a small country in Europe. The traffic can be
sent from China through IWS‘ (International Wholesale Services) Network in
Spain to Andorra since the agreement with IWS offers the competitive rate. It
could save cost by contracting with another operator with extensive network.
Please see the below Figure 20 Hubbing Business.
Figure 20 Hubbing Business

UPM-ETSI Industriales – C/ José Gutiérrez Abascal, 2 28006 Madrid (España)
POLIMI – Piazza Leonardo da Vinci, 32 20133 Milano (Italy)
KTH – SE 100 44 Stockholm (Sweden)
76
Source: Spanish Telecommunication International Wholesale Services
4.3.2.4. Tromboning
It is the practice that a country generates traffic terminated to the domestic
mobile network which the route is changed to via international operator in the
other end. IWS has the agreement with the price on these international
destinations. See Figure 21 Tromboning.
Figure 21 Tromboning
Source: Spanish Telecommunication International Wholesale Services
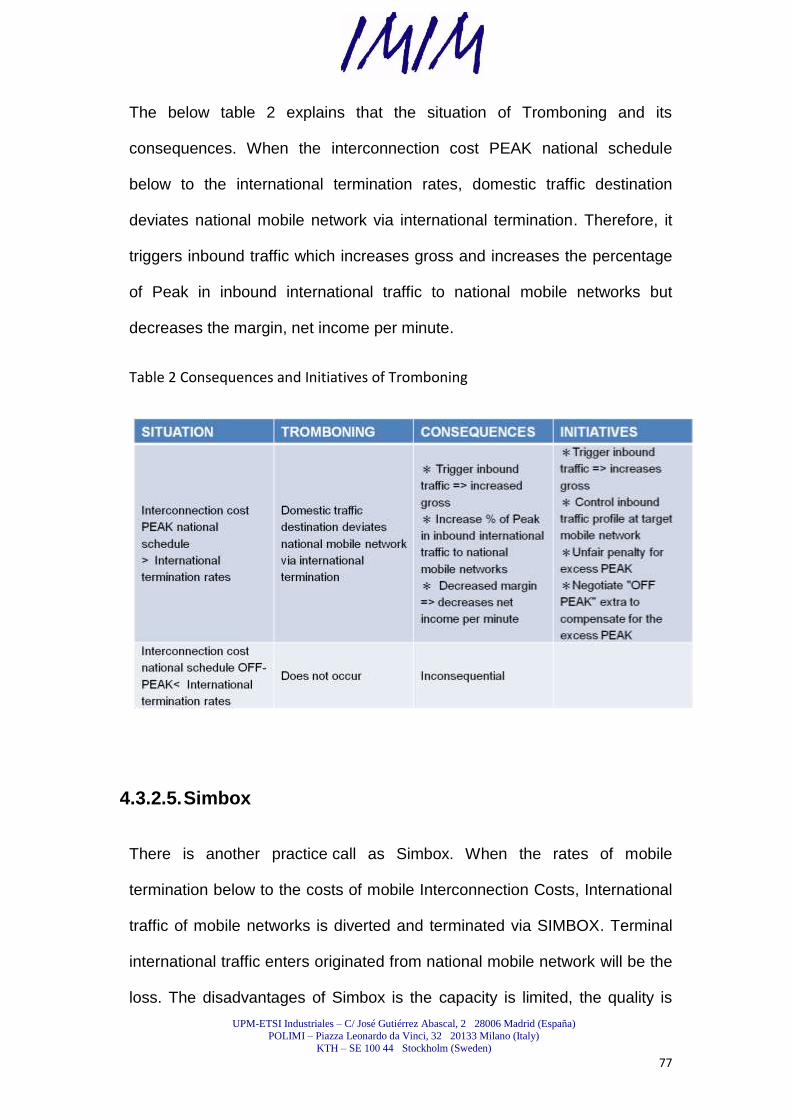
UPM-ETSI Industriales – C/ José Gutiérrez Abascal, 2 28006 Madrid (España)
POLIMI – Piazza Leonardo da Vinci, 32 20133 Milano (Italy)
KTH – SE 100 44 Stockholm (Sweden)
77
The below table 2 explains that the situation of Tromboning and its
consequences. When the interconnection cost PEAK national schedule
below to the international termination rates, domestic traffic destination
deviates national mobile network via international termination. Therefore, it
triggers inbound traffic which increases gross and increases the percentage
of Peak in inbound international traffic to national mobile networks but
decreases the margin, net income per minute.
Table 2 Consequences and Initiatives of Tromboning
4.3.2.5. Simbox
There is another practice call as Simbox. When the rates of mobile
termination below to the costs of mobile Interconnection Costs, International
traffic of mobile networks is diverted and terminated via SIMBOX. Terminal
international traffic enters originated from national mobile network will be the
loss. The disadvantages of Simbox is the capacity is limited, the quality is
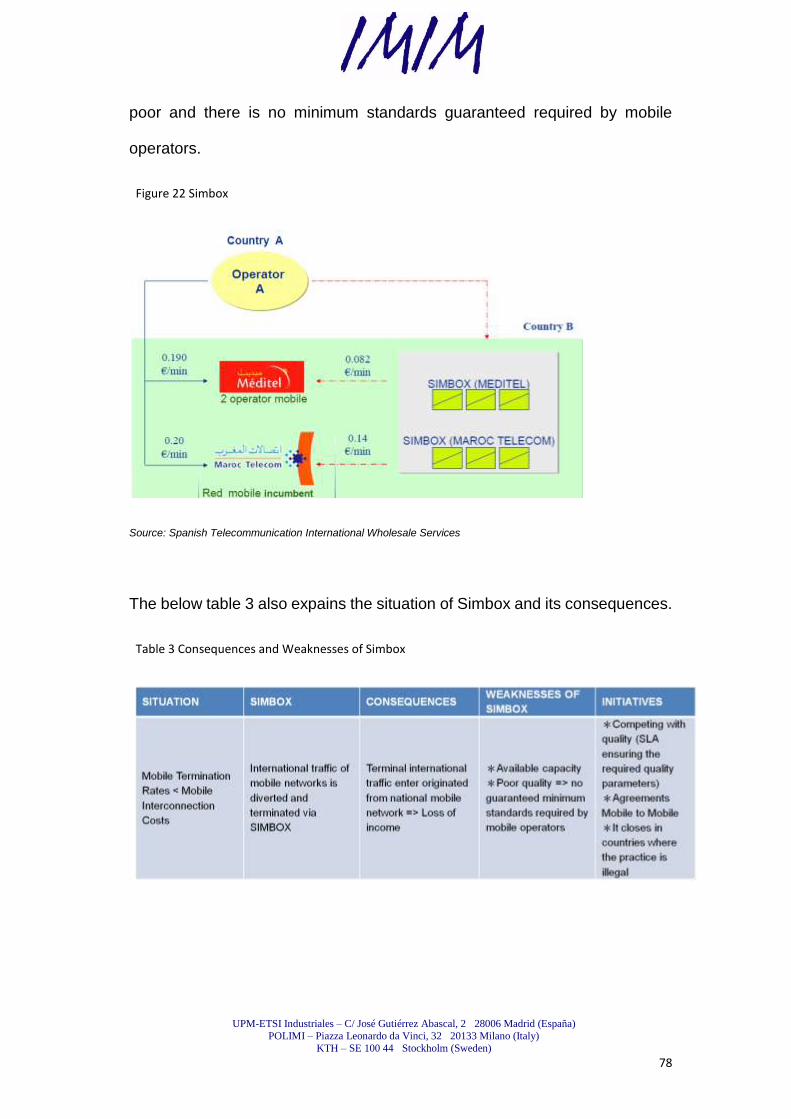
UPM-ETSI Industriales – C/ José Gutiérrez Abascal, 2 28006 Madrid (España)
POLIMI – Piazza Leonardo da Vinci, 32 20133 Milano (Italy)
KTH – SE 100 44 Stockholm (Sweden)
78
poor and there is no minimum standards guaranteed required by mobile
operators.
Figure 22 Simbox
Source: Spanish Telecommunication International Wholesale Services
The below table 3 also expains the situation of Simbox and its consequences.
Table 3 Consequences and Weaknesses of Simbox
UPM-ETSI Industriales – C/ José Gutiérrez Abascal, 2 28006 Madrid (España)
POLIMI – Piazza Leonardo da Vinci, 32 20133 Milano (Italy)
KTH – SE 100 44 Stockholm (Sweden)
79
4.4. IWS (Spanish International Wholesale
Services) Dimension
4.4.1. VOIP Evolution
In 2007, TDM traffic grew 10% while the VoIP traffic grew 28% which
reached 78,000 billion minutes of IWS. Latin America is the region where has
the most impact of the VoIP.
There are some new market players. A new type of international network
client generates which requires the service for international traffic (Skype,
Yahoo Communications, Microsoft ...)
4.4.2. Sales Model
A unique international network that handles all of the traffic group to minimize
the investment and meet all demands for the varied companies.
IWS synergies in investments and becomes OPEX operators and
local flexibility. Also, it devotes to implement new services over IP fast and
capture new business from other operators who are weak due to lacking
of management tools.
The model was presented in different areas of the Company. (Tlatam,
TE, etc.). Currently model is operating in LATAM and Spain.
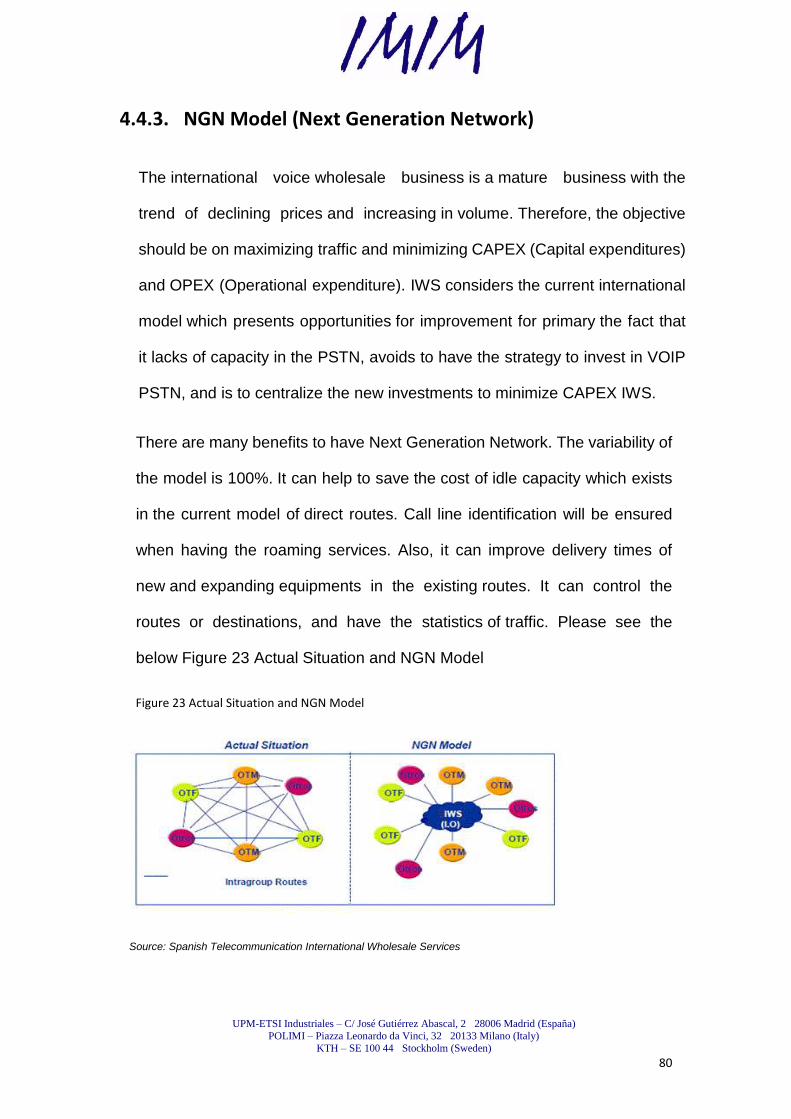
UPM-ETSI Industriales – C/ José Gutiérrez Abascal, 2 28006 Madrid (España)
POLIMI – Piazza Leonardo da Vinci, 32 20133 Milano (Italy)
KTH – SE 100 44 Stockholm (Sweden)
80
4.4.3. NGN Model (Next Generation Network)
The international voice wholesale business is a mature business with the
trend of declining prices and increasing in volume. Therefore, the objective
should be on maximizing traffic and minimizing CAPEX (Capital expenditures)
and OPEX (Operational expenditure). IWS considers the current international
model which presents opportunities for improvement for primary the fact that
it lacks of capacity in the PSTN, avoids to have the strategy to invest in VOIP
PSTN, and is to centralize the new investments to minimize CAPEX IWS.
There are many benefits to have Next Generation Network. The variability of
the model is 100%. It can help to save the cost of idle capacity which exists
in the current model of direct routes. Call line identification will be ensured
when having the roaming services. Also, it can improve delivery times of
new and expanding equipments in the existing routes. It can control the
routes or destinations, and have the statistics of traffic. Please see the
below Figure 23 Actual Situation and NGN Model
Figure 23 Actual Situation and NGN Model
Source: Spanish Telecommunication International Wholesale Services
UPM-ETSI Industriales – C/ José Gutiérrez Abascal, 2 28006 Madrid (España)
POLIMI – Piazza Leonardo da Vinci, 32 20133 Milano (Italy)
KTH – SE 100 44 Stockholm (Sweden)
81
5. Research Findings: India
5.1. The Country Overview
India is the second most populous country in the world with 1,166 million
inhabitants and the seventh in area with 3,287,590 km2. The republic
comprises 28 states and 7 territories. It is a pluralistic, multilingual, and
multiethnic society. (CIA, 2011)
5.1.1. Economic factors
India is the 12th largest economy in the world with the GDP (1,237
million) and fourth in terms of the purchasing power. (CIA, 2011)The serious
problems are poverty, illiteracy, pandemics, and malnutrition.
5.2. Telecom market in India
The telecom market in India is the second largest telecom market in the world
after China. (ITU, 2010) It is one of the most competitive and fastest growing
markets. The number of telecommunications customers in the country is
688.38 million (652.42 million, 35.96 million for mobile and fixed,
respectively). The penetration of telephone services is 59.31%. (ITU, 2010)In
Banda Ancha, it has 9.77 million users. Despite of the fast growth of
the number of customers, it is a very competitive market and revenue
increased very slowly. Among the top 30 of world income of MNOs (Mobile
Network Operator), Indian has none. The voice business increases, and the
broadband business expands. With the development of 3G network, and
UPM-ETSI Industriales – C/ José Gutiérrez Abascal, 2 28006 Madrid (España)
POLIMI – Piazza Leonardo da Vinci, 32 20133 Milano (Italy)
KTH – SE 100 44 Stockholm (Sweden)
82
expansion and extension of broadband, the investment in this sector will
grow from US$ 20 billion in 2009. (ITU, 2010)
Major operations in India in 2010:
Merger of Reliance Communication Infrastructure Ltd and GTL Ltd.
Bharti‘s acquisition of 15 African operators of Zain Group.
Acquisition by Reliance Industries of Infotel Broadband.
Telenor has acquired additional 7% of Unitech Wireless.
BSNL and MTNL, operators with public participation, they have 90% market
share of the fixed lines. (TRAI, 2009)The number of fixed line continues to
fall. The demand for voice increases by the number of customers at 8 million
per month. For meeting this demand, thirteen mobile operators in India
expect to invest more in their networks in 2010, and expand to new regions.
New players (Datacom, Loop Telecom, S Tel, Swa Communications, Unitec)
have input in much capital into the market. Over 50% of India's international
traffic has destinations in other countries in Asia. The main destination is the
United States, Asia, and Saudi Arabia. (TRAI, 2009)
5.2.1. Fixed operators
Seven operators share the Indian market fixed: (TRAI, 2009)
BSNL (81%)
MTNL (9%)
Bharti Airtel (6%)
Reliance Communications (2%)
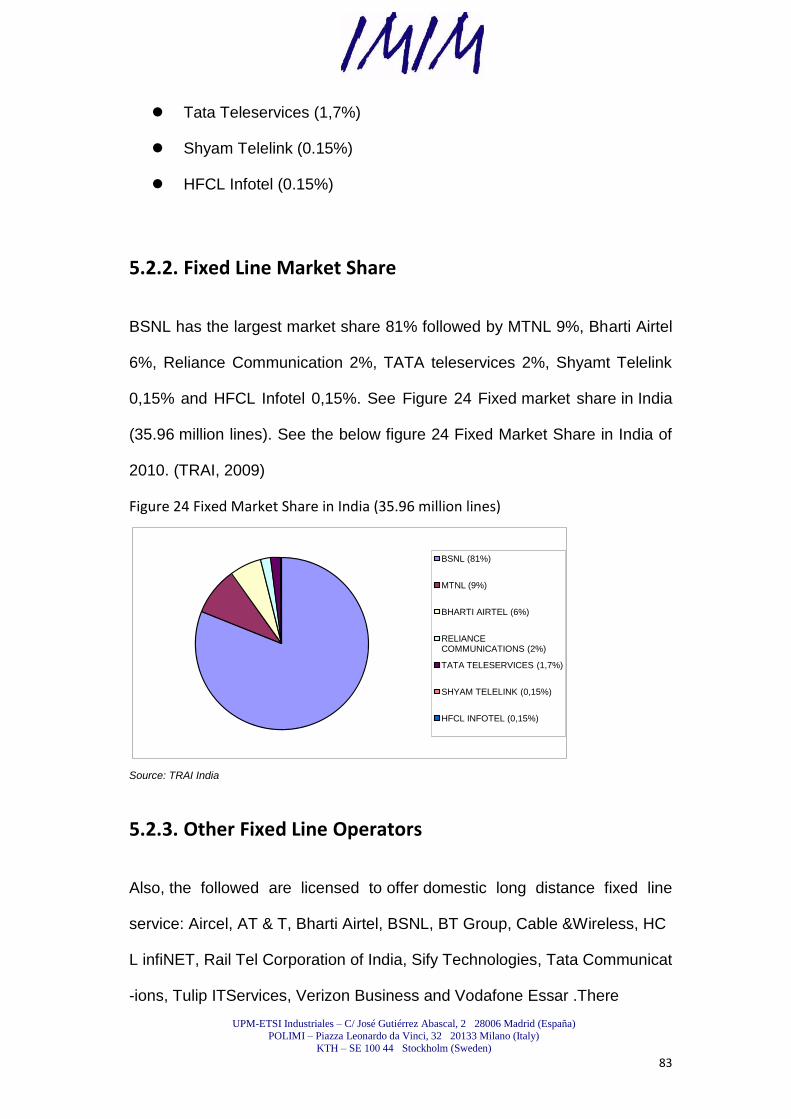
UPM-ETSI Industriales – C/ José Gutiérrez Abascal, 2 28006 Madrid (España)
POLIMI – Piazza Leonardo da Vinci, 32 20133 Milano (Italy)
KTH – SE 100 44 Stockholm (Sweden)
83
Tata Teleservices (1,7%)
Shyam Telelink (0.15%)
HFCL Infotel (0.15%)
5.2.2. Fixed Line Market Share
BSNL has the largest market share 81% followed by MTNL 9%, Bharti Airtel
6%, Reliance Communication 2%, TATA teleservices 2%, Shyamt Telelink
0,15% and HFCL Infotel 0,15%. See Figure 24 Fixed market share in India
(35.96 million lines). See the below figure 24 Fixed Market Share in India of
2010. (TRAI, 2009)
Figure 24 Fixed Market Share in India (35.96 million lines)
Source: TRAI India
5.2.3. Other Fixed Line Operators
Also, the followed are licensed to offer domestic long distance fixed line
service: Aircel, AT & T, Bharti Airtel, BSNL, BT Group, Cable &Wireless, HC
L infiNET, Rail Tel Corporation of India, Sify Technologies, Tata Communicat
-ions, Tulip ITServices, Verizon Business and Vodafone Essar .There
BSNL (81%)
MTNL (9%)
BHARTI AIRTEL (6%)
RELIANCE COMMUNICATIONS (2%)
TATA TELESERVICES (1,7%)
SHYAM TELELINK (0,15%)
HFCL INFOTEL (0,15%)
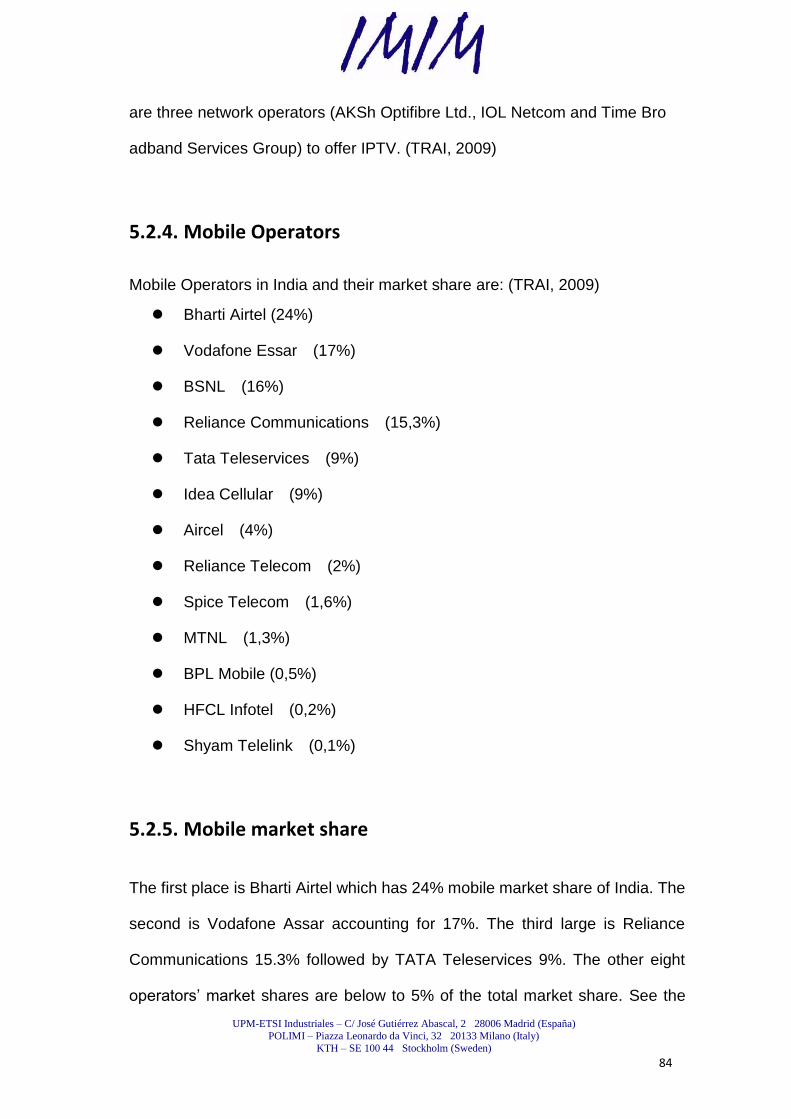
UPM-ETSI Industriales – C/ José Gutiérrez Abascal, 2 28006 Madrid (España)
POLIMI – Piazza Leonardo da Vinci, 32 20133 Milano (Italy)
KTH – SE 100 44 Stockholm (Sweden)
84
are three network operators (AKSh Optifibre Ltd., IOL Netcom and Time Bro
adband Services Group) to offer IPTV. (TRAI, 2009)
5.2.4. Mobile Operators
Mobile Operators in India and their market share are: (TRAI, 2009)
Bharti Airtel (24%)
Vodafone Essar (17%)
BSNL (16%)
Reliance Communications (15,3%)
Tata Teleservices (9%)
Idea Cellular (9%)
Aircel (4%)
Reliance Telecom (2%)
Spice Telecom (1,6%)
MTNL (1,3%)
BPL Mobile (0,5%)
HFCL Infotel (0,2%)
Shyam Telelink (0,1%)
5.2.5. Mobile market share
The first place is Bharti Airtel which has 24% mobile market share of India. The
second is Vodafone Assar accounting for 17%. The third large is Reliance
Communications 15.3% followed by TATA Teleservices 9%. The other eight
operators‘ market shares are below to 5% of the total market share. See the
UPM-ETSI Industriales – C/ José Gutiérrez Abascal, 2 28006 Madrid (España)
POLIMI – Piazza Leonardo da Vinci, 32 20133 Milano (Italy)
KTH – SE 100 44 Stockholm (Sweden)
85
detail from Figure 25 Market share of mobile market in India
(652.42 million lines)
Figure 25 Market Share of Mobile Market in India (652.42 million lines)
Source: TRAI India
5.2.6. Mobile sector
Major thirteen mobile operators capture about 8 million users per month. It
is one of the world's telecommunication markets with the high potential
due to its rapid growth. However, profit margins are quite small. The high
cost of covering the spacious country of 3.3 million km2 led these companies
to cooperate in infrastructure between operators by agreements. (DoT, 2011)
BHARTI AIRTEL (24%)
VODAFONE ESSAR (17%)
BSNL (16%)
RELIANCE COMMUNICATIONS
(15,3%)
TATA TELESERVICES (9%)
IDEA CELLULAR (9%)
AIRCEL (4%)
RELIANCE TELECOM (2%)
SPICE TELECOM (1,6%)
MTNL (1,3%)
BPL MOBILE (0,5%)
HFCL INFOTEL (0,2%)
SHYAM TELELINK (0,1%)
UPM-ETSI Industriales – C/ José Gutiérrez Abascal, 2 28006 Madrid (España)
POLIMI – Piazza Leonardo da Vinci, 32 20133 Milano (Italy)
KTH – SE 100 44 Stockholm (Sweden)
86
5.2.7. The circles/ service areas
The Indian domestic market is divided into 23 circles or service areas
(circles) which are grouped into four categories:
Metro: major cities (New Delhi, Mumbai, Chennai and Kolkata). (DoT,
2011)
A: The region is with other major cities (Gujarat, Maharashtra,
Andhra Pradesh, Karnataka and Tamil Nadu) (DoT, 2011)
B circles: The region is with small cities ( Haryana, Kerala, Punjab,
Uttar Pradesh W., Uttar Pradesh E., Rajashtan, Madhya Pradesh, W.
Bengal). (DoT, 2011)
C circles: It is the rural area( Jammu & Kashmir, Himachal Pradesh,
Bihar, Bihar, Orissa, Assam and NE) (DoT, 2011)
Metro: This area has 5% of the population, but account for 18 % of
total mobile customers. (DoT, 2011)
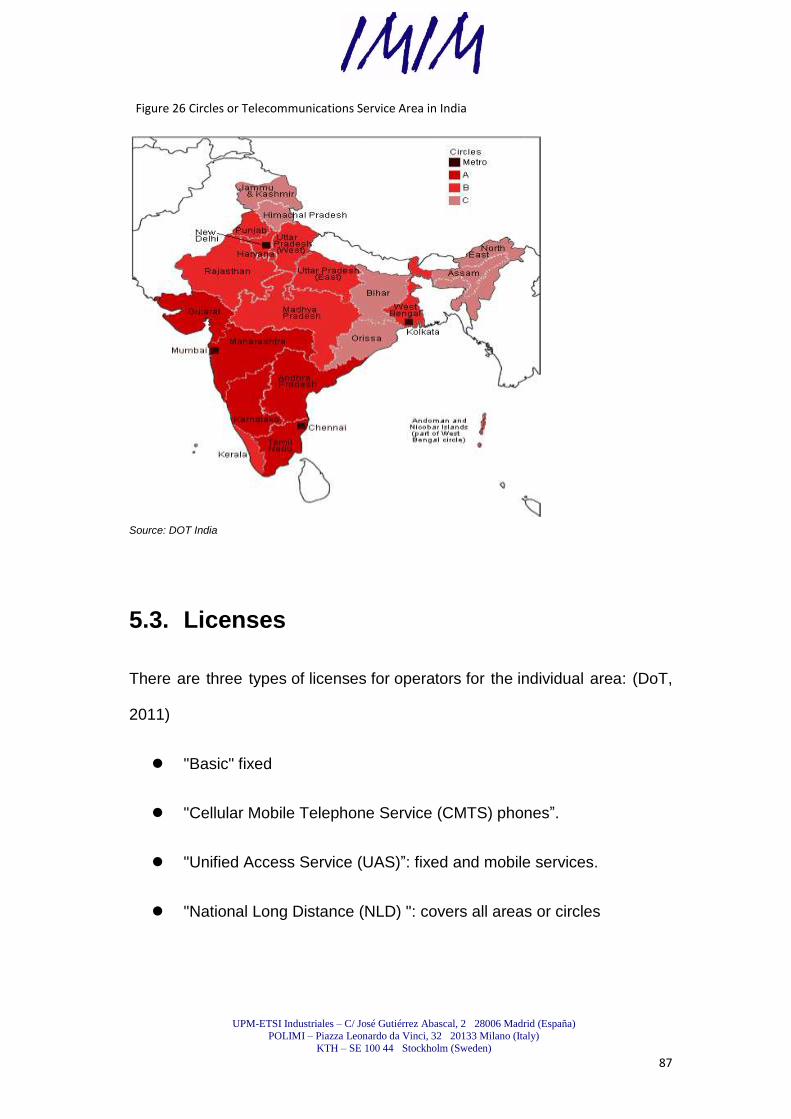
UPM-ETSI Industriales – C/ José Gutiérrez Abascal, 2 28006 Madrid (España)
POLIMI – Piazza Leonardo da Vinci, 32 20133 Milano (Italy)
KTH – SE 100 44 Stockholm (Sweden)
87
Figure 26 Circles or Telecommunications Service Area in India
Source: DOT India
5.3. Licenses
There are three types of licenses for operators for the individual area: (DoT,
2011)
"Basic" fixed
"Cellular Mobile Telephone Service (CMTS) phones‖.
"Unified Access Service (UAS)‖: fixed and mobile services.
"National Long Distance (NLD) ": covers all areas or circles
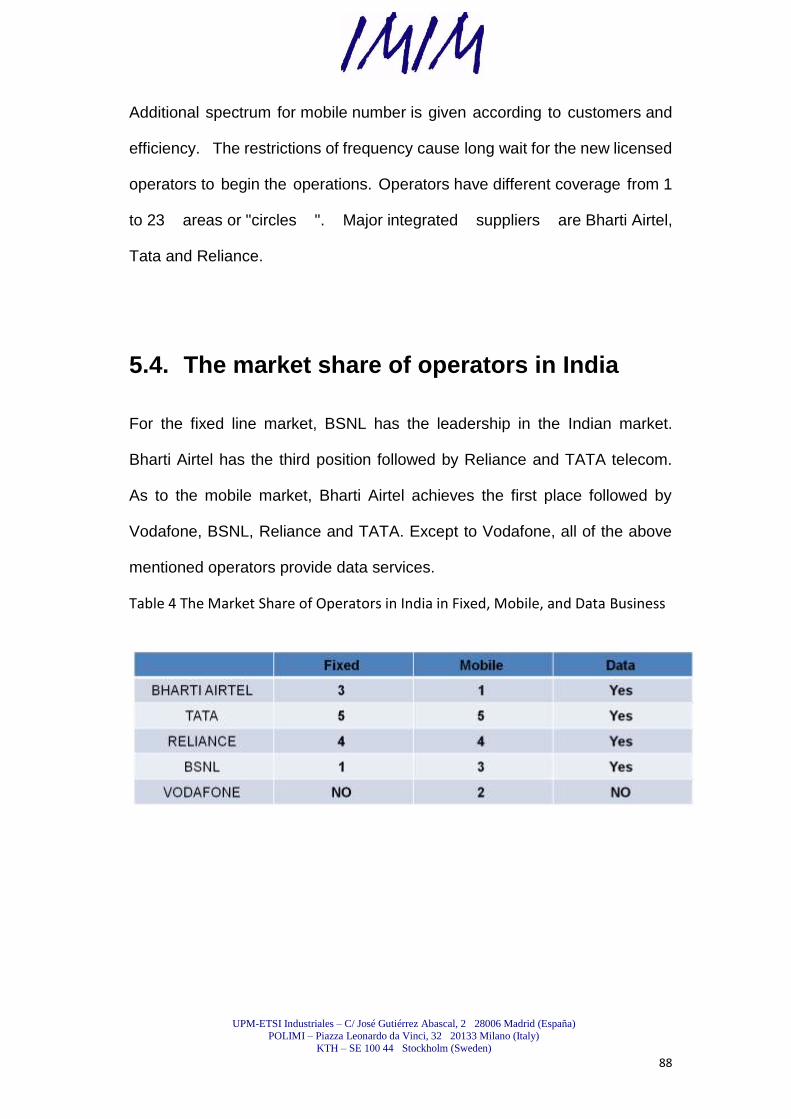
UPM-ETSI Industriales – C/ José Gutiérrez Abascal, 2 28006 Madrid (España)
POLIMI – Piazza Leonardo da Vinci, 32 20133 Milano (Italy)
KTH – SE 100 44 Stockholm (Sweden)
88
Additional spectrum for mobile number is given according to customers and
efficiency. The restrictions of frequency cause long wait for the new licensed
operators to begin the operations. Operators have different coverage from 1
to 23 areas or "circles ". Major integrated suppliers are Bharti Airtel,
Tata and Reliance.
5.4. The market share of operators in India
For the fixed line market, BSNL has the leadership in the Indian market.
Bharti Airtel has the third position followed by Reliance and TATA telecom.
As to the mobile market, Bharti Airtel achieves the first place followed by
Vodafone, BSNL, Reliance and TATA. Except to Vodafone, all of the above
mentioned operators provide data services.
Table 4 The Market Share of Operators in India in Fixed, Mobile, and Data Business
UPM-ETSI Industriales – C/ José Gutiérrez Abascal, 2 28006 Madrid (España)
POLIMI – Piazza Leonardo da Vinci, 32 20133 Milano (Italy)
KTH – SE 100 44 Stockholm (Sweden)
89
5.5. Major Telecom Operators in India
5.5.1. Bharti Airtel
Bharit Airtel is the fifth mobile operators worldwide. It has 139.2 million
customers (8 million new per three months), and 180 million total including Zain.
It is also the worldwide leader of India covers mobile, broadband, fixed
telephone, NLD, ILD and business solutions. Bharti has US $ 12,400
million revenues and USD $ 4,700 million of EBITDA. It has more than 600
Carrier Partners. Four strategic business units are Mobile Services, Telemedia
Services, Enterprise and Digital TV Services. Bharti offers services under the
brand Airtel, except to countries Bangladesh and Africa. (Airtel, 2011)
International Air PoPs: India, New York, London, HK, Singapore and LA.
PoPs are in planning in areas such as Paris, Dallas, Chicago, Dubai, Sri Lanka,
Thailand, Malaysia, Japan and Sydney.
At least there are three lanes in each route:
India-Middle East and Europe: SMW4, IMEWE, EIG
Atlantic, TAT 14, Hibernia, Appollo
India-Singapore: SMW4, i2i, i2i backup
Singapore-Japan: AAG, APCN2, EAC, SJC
Japan-US.: Unity, JUS, TGN
UPM-ETSI Industriales – C/ José Gutiérrez Abascal, 2 28006 Madrid (España)
POLIMI – Piazza Leonardo da Vinci, 32 20133 Milano (Italy)
KTH – SE 100 44 Stockholm (Sweden)
90
5.5.1.1. Local infrastructure in India
105.000 kilometers of fiber, SDH + MPLS PoPs 1.500
94 local access of cities, Global Exit 8 routes
Full Portfolio: NLD, ILD, VSAT, IP (Airtel, 2011)
5.5.1.2. Global transmission services of Bharti
Bharti has the new network covers the global coverage E-to-E in over 50
countries. Its capacity includes from E1 to 10G, SDH and Ethernet, short-term
IRU contracts. It has the diversity backhaul network in Singapore, Europe, HK,
U.S., Japan. Moreover, it has the multi Service Platform includes Transmission,
MPLS, IP, and Ethernet. The next generation equipment will be fully redundant.
(Airtel, 2011)
5.5.1.3. Services of Bharti
Bharti provides services E-to-E to corporate clients and DLD and ILD carriers.
It also offers global MPLS, managed services, MPLS Carrier. For the global
IP service includes global transit, regional transit, transit AS, Internet.
International Leased Lines:
Point to point connection worldwide.
Flexibility and availability of alternative routes to East and West
Catering facilities in multiple cables.
SLA E-to-E and 24x7 support. (Airtel, 2011)
UPM-ETSI Industriales – C/ José Gutiérrez Abascal, 2 28006 Madrid (España)
POLIMI – Piazza Leonardo da Vinci, 32 20133 Milano (Italy)
KTH – SE 100 44 Stockholm (Sweden)
91
5.5.1.4. MPLS Bharti Airtel
125 POPs. Global coverage through NNI agreements.
Cisco MPLS network, 64K to STM-1, F-Ethernet, Gig Ethernet.
Diversity in last mile providers.
CoS, SLA's, Carrier-grade platforms, Core redundant.
Managed service, online reports in "near real time, 24x7x365 support.
(Airtel, 2011)
5.5.1.5. Global IP Transit Services
Direct connection with service providers, content and CDNs Tier 1.
SLA E-to-E and 24x7 support.
Route diversity and flexibility in route selection and billing.
IP ports in London, Singapore, India and the U.S. (Airtel, 2011)
5.5.1.6. Other Services of Bharti
National Leased Lines: Connectivity of E-to-E is in 400 cities with
4000 SDH nodes, and the diversity of capillary network: 24x7 support,
Ethernet over SDH, and dedicated bandwidth and so on.
VSAT: VSAT provided only in India, Satellite IPLC circuits .
Data Center: "co location", "shared web hosting, management and
monitoring and so on.
UPM-ETSI Industriales – C/ José Gutiérrez Abascal, 2 28006 Madrid (España)
POLIMI – Piazza Leonardo da Vinci, 32 20133 Milano (Italy)
KTH – SE 100 44 Stockholm (Sweden)
92
Telemedia Services: Broadband, IPTV and telephone services in 89
Indian cities.
Digital TV Services: DTH services across India. (Airtel, 2011)
5.5.2. Group Tata
5.5.2.1. Introduction of Group Tata
Group Tata was founded in 1868 comprises a cluster of companies in
different sectors (telecommunications, science, technology, engineering,
energy, marketing, consulting and so on). There are 50,000 employees
worldwide. It creates more than USD $ 70,000 million revenues per year and
61% of it comes from outside India. The main business of Tata group is Tata
Steel, Tata Motors, Tata Consultancy Services, Tata Power, Tata Chemicals,
Tata Tea, Indian Hotels and Tata Communications. (Tata, 2010)
In 2002, Tata group acquired 45% shares of VSNL, the incumbent operator in
India for international services. In 2005, VSNL acquired Tyco Global Network
and in 2006, VSNL acquired Teleglobe, the incumbent operators in Canada.
In2008, VSNL, VSNL international, Teleglobe is integrated in Tata
Communications.
5.5.2.2. Tata Communications
Tata Communications is a global provider, the industry- leading telecom
company, which provides data services to companies in India and voice services
for over the world. It has strategic investments in South Africa (Neotel, the
UPM-ETSI Industriales – C/ José Gutiérrez Abascal, 2 28006 Madrid (España)
POLIMI – Piazza Leonardo da Vinci, 32 20133 Milano (Italy)
KTH – SE 100 44 Stockholm (Sweden)
93
second largest operator in South Arica), Sri Lanka
(Tata Communications Lanka Limited) and Nepal (United Telecom Limited).
The services provided include transmission, IP, Voice, Mobile Services,
Network Management, Data Center and Enterprise communication solutions.
5.5.2.3. Global Transmission Services of Tata
Tata operates a global network of widespread transmission.
Properties are in TGN Atlantic, Western Europe, Northern Europe,
Pacific, Intra-Asia and ICT.
Consortium SMW3, SMW4, SAFE / SAT 3 and APCN 2.
Cable redundancy in India: SMW4 and SMW3 & SAFE.
There is 40,000 km of network in 300 cities in India, with 170 PoPs.
5.5.2.4. Global Service MPLS of Tata
MPLS network is in 65 countries extended IPSec over 150 countries
which is up to 155Mbps
CoS.
Hits: SDH, Ethernet, Broadband Local Loop, Wireless.
Flexible options for the last mile access.
Services:VPN, VoIP, IP and CDN, Telepresence, Hostage and
Storage.
SLA E-to-E. (Tata, 2010)
UPM-ETSI Industriales – C/ José Gutiérrez Abascal, 2 28006 Madrid (España)
POLIMI – Piazza Leonardo da Vinci, 32 20133 Milano (Italy)
KTH – SE 100 44 Stockholm (Sweden)
94
Managed service option
Reports of real-time service.
Multiple VPN in a single access line.
5.5.2.5. Tata MPLS Network Coverage in Asia
China, India, Indonesia, Japan, Korea, Malaysia, Nepal, Philippines,
Singapore,Sri Lanka,Taiwan, Thialnd, EAU, Vietnam, Bahrein, Jordan,
Kuwait.
Pops on net MPLS: Belegium, France, Germany, Holland, Poland,
Romania, Spain, Sweden, Swizeland, Unite Kindom, China, India,
Japan, Malaysia, Philippines, Sigapore, EAU, South Africa, and
Australia.
Partners of MPLS PoPs: Austria, Bulgaria, Czech Republic, Demark,
Hungury, Finland, Italy, Luxemburg, Norway, Romania, Thailand,
Indonesia, Bahrein, Jordan, Kuwait, Egype, Argentina, Brazil, Chile,
Colombia, Ecuador, Guatemala, Mexico, Panama, Peru, Uruguay and
Venezuela.
PoPs MPLS in 130 cities in India. (Tata, 2010)
5.5.2.6. Features of MPLS Network Tata
Global Tier 1 Carrier.
100% Cisco. Tata and Cisco jointly offer managed services market by
Cisco Managed Services Channel Program.
UPM-ETSI Industriales – C/ José Gutiérrez Abascal, 2 28006 Madrid (España)
POLIMI – Piazza Leonardo da Vinci, 32 20133 Milano (Italy)
KTH – SE 100 44 Stockholm (Sweden)
95
Submarine cables owned by multiple routes and redundancy.
Metro-Ethernet network in major cities of India.
Routing flexibility and speed.
24x7 E-to-E. (Tata, 2010)
5.5.2.7. Value Added Services of Tata
Global VPN Extended Access Service: IPSec access option for sites without
dedicated links or of areas of difficult access.
MPLS IPSec Backup service if the main circuit is inoperative. Managed Security
Services: Firewall, intrusion detection and prevention (IDS / IPS), and antivirus.
5.5.2.8. Other Services of Tata
IP Services: Tier-1 IP network, with 400 PoPs (80 global PoPs).
Access from Ethernet to 10Gig-E and E1 to OC-192.
IPLC: flexible SLA management and E-to-E.
CDN.
Global Media and Entertainment solutions.
Data Center: ―Co-location "," Hosting" and "Storage."
Telepresence (Tata, 2010)
UPM-ETSI Industriales – C/ José Gutiérrez Abascal, 2 28006 Madrid (España)
POLIMI – Piazza Leonardo da Vinci, 32 20133 Milano (Italy)
KTH – SE 100 44 Stockholm (Sweden)
96
5.5.3. Group Reliance
5.5.3.1. Introduction of Group Reliance
The Reliance Group began with a small textile company. Now covers more than
100 companies in various sectors in India: energy, material, sand, textiles,
petrochemicals, telecommunications and so on. Total revenues of Group
Reliance is more than USD 44,000 million. Major Companies of Group Reliance
are Reliance Industries Limited and Reliance Industrial Infrastructure Limited. In
2003, it acquired FLAG Telecom submarine cable company.
Reliance Communication is the telecommunication subsidiary of Reliance
Energy, formerly known as Reliance Infocomm. Reliance Communication is
an integrated provider of telecommunication services. There are 2,100
corporations and multinational customers. (Reliance Group, 2011)
5.5.3.2. Reliance Globalcom
Reliance Globalcom Data is a subsidiary of Reliance Communications. The
system has the largest private undersea cable in the world. It has the
coverage in 230 countries and territories in total. There is 65,000 km of
submarine cable and 22,000 km of fiber. It provides the flexibility and tailored
solutions. (RelianceGlobalcom, 2011)
5.5.3.3. Services of Reliance Globalcom
WAN managed services, remote access services and security, voice and
hosting or placement. WAN management solutions: MPLS Matrix (MPLS multi
carrier solution), Secure IP (Internet VPN solution) and Committed Ethernet
UPM-ETSI Industriales – C/ José Gutiérrez Abascal, 2 28006 Madrid (España)
POLIMI – Piazza Leonardo da Vinci, 32 20133 Milano (Italy)
KTH – SE 100 44 Stockholm (Sweden)
97
(Ethernet solution multi carriers). SLA tailored to customer needs. Data
Centre and the CRC. Web Portal and proactively. (RelianceGlobalcom, 2011)
5.5.4. BSNL
It it the leading operator in fixed telephone in India, publicly owned, which has
created by the Department of Telecommunications Services and the
Department of Telecommunications Operations in 2000. It also offers mobile,
broadband, Internet, MPLS VPN, VSAT and so on. It has the great coverage
in India. (BSNL)
5.5.5. IDEA CELLULAR LTD.
It is the 6 th mobile operator in India and the member of Axiata Group
based in Malaysia, which owns 14.99% of Idea Cellular Ltd. It is the mobile
operator but does not have data business. (Ideacellular, 2011)
5.5.6. VODAFONE ESSAR
Vodafone Essar is the subsidiary of Vodafone Group . It entered in the Indian
market in 2007. Currently, it is at the position between 2nd and 3rd position.
It has the strong growth in service revenues (14.7%) and has 32 million
customers. Vodafone Essar is the mobile operator and does not have data
business. (Vodafone India, 2011)
5.5.7. AIRCEL
Aircel is the joint venture with Maxis (74%) and Sindy. It began the mobile
UPM-ETSI Industriales – C/ José Gutiérrez Abascal, 2 28006 Madrid (España)
POLIMI – Piazza Leonardo da Vinci, 32 20133 Milano (Italy)
KTH – SE 100 44 Stockholm (Sweden)
98
operation in 1999 and is a leader in Tamil Nadu. Aircel has the licensed in 21
areas or "circles". Aircel is the mobile operator but does not have data
business. (Aircel, 2011)
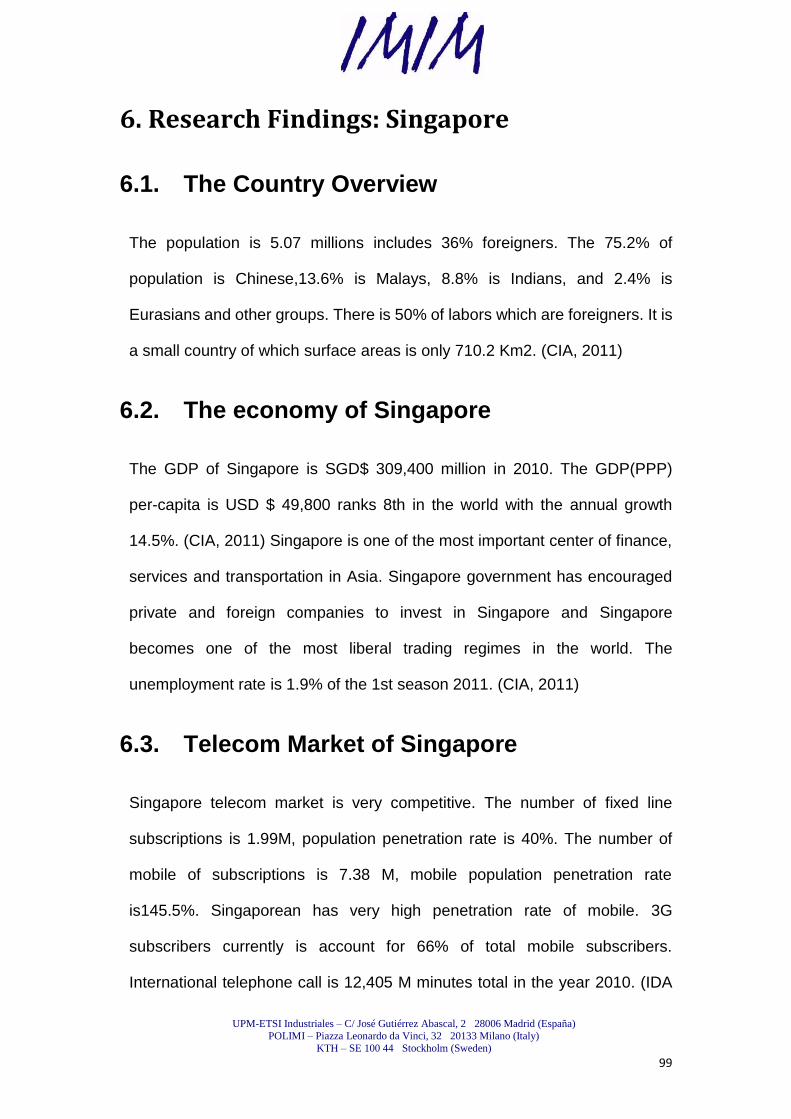
UPM-ETSI Industriales – C/ José Gutiérrez Abascal, 2 28006 Madrid (España)
POLIMI – Piazza Leonardo da Vinci, 32 20133 Milano (Italy)
KTH – SE 100 44 Stockholm (Sweden)
99
6. Research Findings: Singapore
6.1. The Country Overview
The population is 5.07 millions includes 36% foreigners. The 75.2% of
population is Chinese,13.6% is Malays, 8.8% is Indians, and 2.4% is
Eurasians and other groups. There is 50% of labors which are foreigners. It is
a small country of which surface areas is only 710.2 Km2. (CIA, 2011)
6.2. The economy of Singapore
The GDP of Singapore is SGD$ 309,400 million in 2010. The GDP(PPP)
per-capita is USD $ 49,800 ranks 8th in the world with the annual growth
14.5%. (CIA, 2011) Singapore is one of the most important center of finance,
services and transportation in Asia. Singapore government has encouraged
private and foreign companies to invest in Singapore and Singapore
becomes one of the most liberal trading regimes in the world. The
unemployment rate is 1.9% of the 1st season 2011. (CIA, 2011)
6.3. Telecom Market of Singapore
Singapore telecom market is very competitive. The number of fixed line
subscriptions is 1.99M, population penetration rate is 40%. The number of
mobile of subscriptions is 7.38 M, mobile population penetration rate
is145.5%. Singaporean has very high penetration rate of mobile. 3G
subscribers currently is account for 66% of total mobile subscribers.
International telephone call is 12,405 M minutes total in the year 2010. (IDA

UPM-ETSI Industriales – C/ José Gutiérrez Abascal, 2 28006 Madrid (España)
POLIMI – Piazza Leonardo da Vinci, 32 20133 Milano (Italy)
KTH – SE 100 44 Stockholm (Sweden)
100
Singapore, 2011) Singapore's international telephone services market has
grown considerably both in the diversity of such services available as well as
in the number of operators offering these services. Singapore continues to
develop as a hub for international voice traffic. In 2006, Singaporean
government starts to offer free Wi-Fi service over the whole country.
Household broadband penetration rate is 136.4%, wireless broadband
population penetration rate is 195.3%. (IDA Singapore, 2011)
In 2006, the government acted the ―Intelligent Nation 2015 (iN2015)‖ plan last
for 10 years to develop national information and communication. Objectives
are to achieve 90 % broadband usage in all homes to achieve 100 %
computer ownership in homes with school-going children, to increase in
infocomm export revenue to SGD$60 billion and so on. (IDA Singapore, 2011)
This plan makes the revenue boosts substantial of ICT industry. The
subsidiary plan, ―Next Generation National Infocomm Infrastructure (Next
Gen NII)‖, contributes Singapore to have good environment of optic network
with the capacity of 100Mbps ~ 1Gbps for its nation. (IDA Singapore, 2011)
6.4. The Number of Telecom Providers in
Singapore (till May 2011)
The below table 5 show the number of telecom operators in Singaporean
market. There are two fixed line operators and five mobile telephone
providers. There are 95 internet services providers, 436 voice services
providers and 40 IP telephone providers in Singapore. The telecom market in
Singapore is very competitive. (IDA Singapore, 2011)
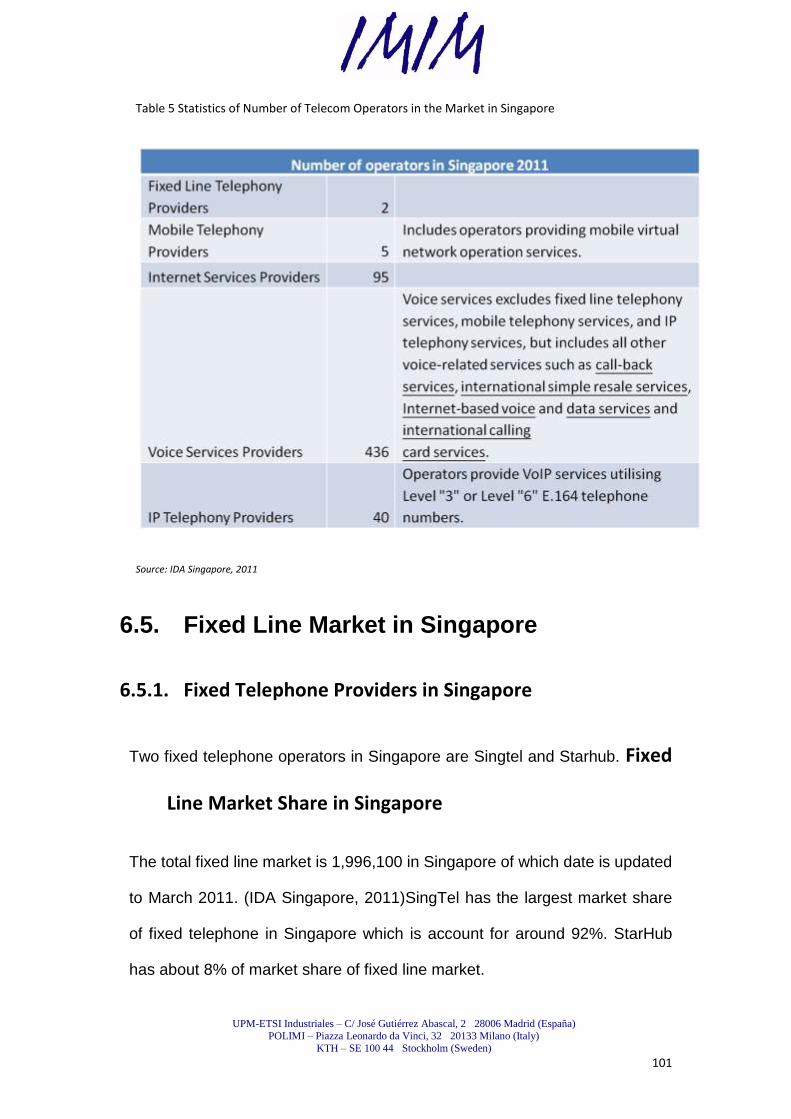
UPM-ETSI Industriales – C/ José Gutiérrez Abascal, 2 28006 Madrid (España)
POLIMI – Piazza Leonardo da Vinci, 32 20133 Milano (Italy)
KTH – SE 100 44 Stockholm (Sweden)
101
Table 5 Statistics of Number of Telecom Operators in the Market in Singapore
Source: IDA Singapore, 2011
6.5. Fixed Line Market in Singapore
6.5.1. Fixed Telephone Providers in Singapore
Two fixed telephone operators in Singapore are Singtel and Starhub. Fixed
Line Market Share in Singapore
The total fixed line market is 1,996,100 in Singapore of which date is updated
to March 2011. (IDA Singapore, 2011)SingTel has the largest market share
of fixed telephone in Singapore which is account for around 92%. StarHub
has about 8% of market share of fixed line market.
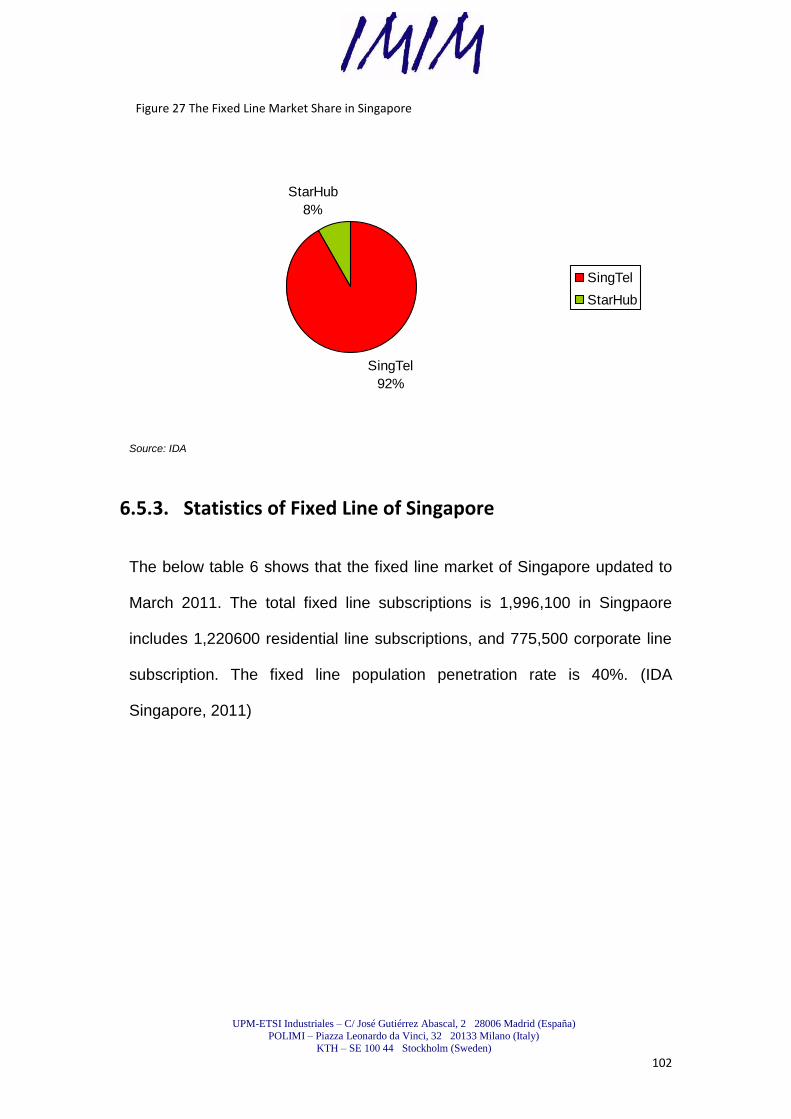
UPM-ETSI Industriales – C/ José Gutiérrez Abascal, 2 28006 Madrid (España)
POLIMI – Piazza Leonardo da Vinci, 32 20133 Milano (Italy)
KTH – SE 100 44 Stockholm (Sweden)
102
Figure 27 The Fixed Line Market Share in Singapore
Source: IDA
6.5.3. Statistics of Fixed Line of Singapore
The below table 6 shows that the fixed line market of Singapore updated to
March 2011. The total fixed line subscriptions is 1,996,100 in Singpaore
includes 1,220600 residential line subscriptions, and 775,500 corporate line
subscription. The fixed line population penetration rate is 40%. (IDA
Singapore, 2011)
SingTel
92%
StarHub
8%
SingTel
StarHub
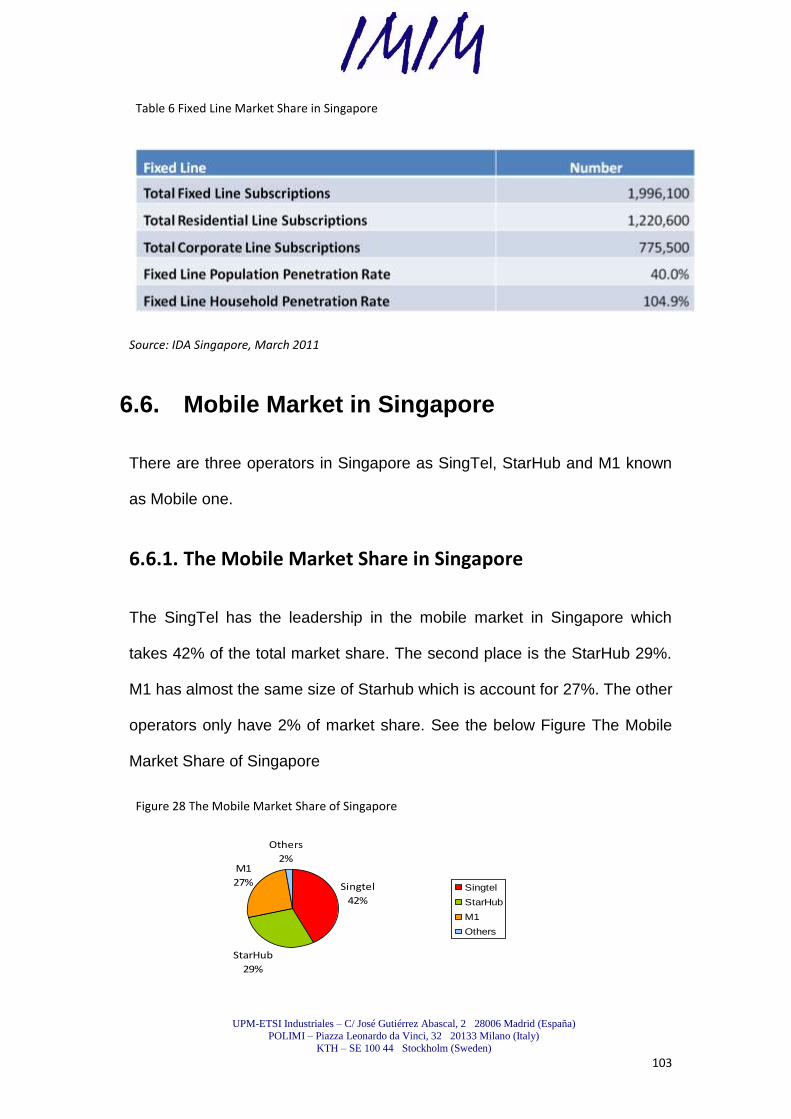
UPM-ETSI Industriales – C/ José Gutiérrez Abascal, 2 28006 Madrid (España)
POLIMI – Piazza Leonardo da Vinci, 32 20133 Milano (Italy)
KTH – SE 100 44 Stockholm (Sweden)
103
Table 6 Fixed Line Market Share in Singapore
Source: IDA Singapore, March 2011
6.6. Mobile Market in Singapore
There are three operators in Singapore as SingTel, StarHub and M1 known
as Mobile one.
6.6.1. The Mobile Market Share in Singapore
The SingTel has the leadership in the mobile market in Singapore which
takes 42% of the total market share. The second place is the StarHub 29%.
M1 has almost the same size of Starhub which is account for 27%. The other
operators only have 2% of market share. See the below Figure The Mobile
Market Share of Singapore
Figure 28 The Mobile Market Share of Singapore
Singtel
42%
StarHub
29%
M1
27%
Others
2%
Singtel
StarHub
M1
Others
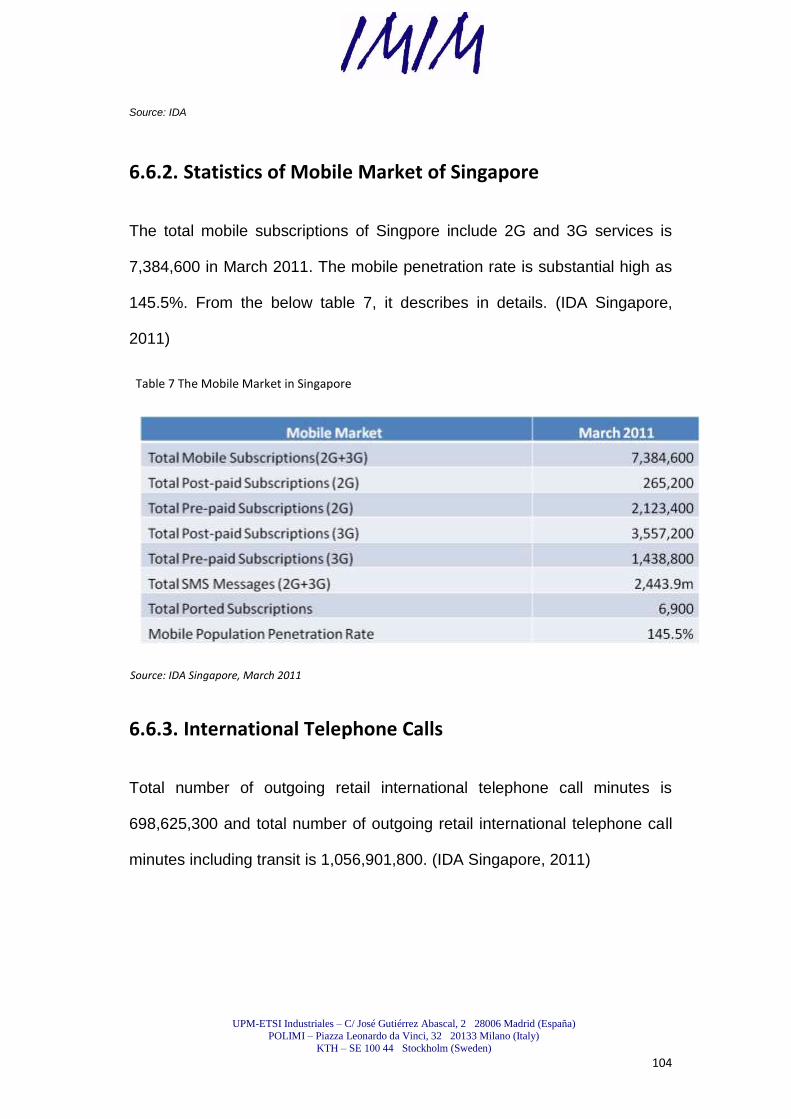
UPM-ETSI Industriales – C/ José Gutiérrez Abascal, 2 28006 Madrid (España)
POLIMI – Piazza Leonardo da Vinci, 32 20133 Milano (Italy)
KTH – SE 100 44 Stockholm (Sweden)
104
Source: IDA
6.6.2. Statistics of Mobile Market of Singapore
The total mobile subscriptions of Singpore include 2G and 3G services is
7,384,600 in March 2011. The mobile penetration rate is substantial high as
145.5%. From the below table 7, it describes in details. (IDA Singapore,
2011)
Table 7 The Mobile Market in Singapore
Source: IDA Singapore, March 2011
6.6.3. International Telephone Calls
Total number of outgoing retail international telephone call minutes is
698,625,300 and total number of outgoing retail international telephone call
minutes including transit is 1,056,901,800. (IDA Singapore, 2011)

UPM-ETSI Industriales – C/ José Gutiérrez Abascal, 2 28006 Madrid (España)
POLIMI – Piazza Leonardo da Vinci, 32 20133 Milano (Italy)
KTH – SE 100 44 Stockholm (Sweden)
105
6.7. Data Market in Singapore
The total broadband market is 8,192,300 in Singapore till March 2011. The
household broadband penetration rate is high to 195.3%. Total Wireless
Broadband is 6,923,100. Wireless broadband population penetration rate is
also high at 136.4%. (IDA Singapore, 2011) See Table 8 The Telecom Data
Market in Singapore.
Table 8 The Telecom Data Market in Singapore
Source: IDA Singapore, March 2011
UPM-ETSI Industriales – C/ José Gutiérrez Abascal, 2 28006 Madrid (España)
POLIMI – Piazza Leonardo da Vinci, 32 20133 Milano (Italy)
KTH – SE 100 44 Stockholm (Sweden)
106
6.8. Operators in Singapore
6.8.1. Singapore Telecommunications Limited (SingTel)
It is founded in 1879. The chairman is Lee Hsien Yang who is the brother of
Prime Minister Lee Hsien Loong, and the second son of Lee Kuan Jew. The
group revenue is SGD 18,071 million (around USD$ 14,507 million) in year
2010. Total employees is 4,000 in year 2010. (SingTel, 2011) The Products
are mobile, internet, fixed network, IPTV and IT services. SingTel is the
largest mobile network operator in the world with users at 400 millions in May
2011. Due to its government policy and its expanding strategy, Singtel
expand business fast oversea and is competitive. The customer base of
SingTel spreads all over the world, praticular in Asia. SingTel has a large
mobile market in Austraila at 8,877 thousand. In India, the customer base is
187,708 thousand under the brand of Bharti. Telkomsel operator in Indonesia
is also the part of SingTel with 91,136 thousand customers. SingTel has
mobile customers of 30,502 thousand from AIS of Thailand, 25,403 thousand
from Globel of Philippines, 17,165 thousand Warid of Pakistan, and 1,908
thousand from PBTL of Bangladesh. (SingTel, 2011)
6.8.1.1. Network of SingTel
SingTel has an extensive communications network and infrastructure in
Singapore and Australia. It is a major investor in many of the world's most
sophisticated submarine cable systems, such as SEA-ME-WE 3,
SEA-ME-WE 4, APCN, APCN 2, China-US, Japan-US, C2C, i2i and
Southern Cross. SingTel has the largest market share of IP VPN in Asian
UPM-ETSI Industriales – C/ José Gutiérrez Abascal, 2 28006 Madrid (España)
POLIMI – Piazza Leonardo da Vinci, 32 20133 Milano (Italy)
KTH – SE 100 44 Stockholm (Sweden)
107
market. (SingTel, 2011) SingTel(62%) cooperates with CHT-I(38%) to launch
a new satellite ST-2 into the orbit on 21 May 2011 in French Guiana to
replace the old satellite ST-1, and two additional launches by 2013. (SingTel,
2011)
6.8.2. StarHub Limited
It is founded in 7 May 1998. The revenue is SGD$2,338 million (around
USD$ 1,877 million) in year 2010. The profit is SGD$ 263M (around USD$
211 million) in 2010. The mmployees is 2,702. (StarHub, 2011)The products
are mobile, digital cable, internet and fixed network. It is the second largest
mobile operator in Singapore with customers base 2,145,000. StarHub has
the market share as Fixed line 8%, mobile 29%, Broadband 45%, paid-TV
90%, respectively. Takes strategy of bundling service which offers free shows
of EPL(The Premier League ). (StarHub, 2011) For the member of Conexus
Mobile Alliance, can use roaming service for free in the alliance countries.
6.8.3. M1 Limited
It is founded in1994. The products are mobile, Data,and Internet. The
revenue is SGD$ 782 million( around USD$ 628 million) in 2009. M1 is the
third largest operator in Singapore. The network covers 2G/3G/3.5G,
including international-call services. Vodafone is M1‘s Singaporean partner
at mobile In 2010, M1 has now joined in as one of the major RSP to provide
Singapore‘s Next Gen Fibre Optics (M1, 2011)
UPM-ETSI Industriales – C/ José Gutiérrez Abascal, 2 28006 Madrid (España)
POLIMI – Piazza Leonardo da Vinci, 32 20133 Milano (Italy)
KTH – SE 100 44 Stockholm (Sweden)
108
7. Research Findings: Thailand
7.1. The Country Overview
A surface area of Thailand is total 513,000 km2 and Thailand is the 21
most-populous country, with 64 million people. The country is a kingdom
influenced by many different countries. Thailand has a most big population of
Buddhists in the world. (CIA, 2011)
7.2. Economics of Thailand
The 2010 GDP of Thailand is total US $584 billion makes it the 24th largest
economy in the world. The per capita is US $ 4,620(89th). (CIA,
2011)Thailand is a considerable export-dependent country. The economy
starts to recover from 2010 and it appears the excellent performance after the
Asian economic crisis. (CIA, 2011)
7.3. Telecom Market Overview of Thailand
For the Thailand market, the fixed telephone line gradually slows down but
the mobile sector has the potential growth in the future. The indexes of
internet users, availability of the latest technologies, and FDI and
technologies transfers are decreasing in these years and stay low. General,
the global competitiveness index is unfortunately dropping.

UPM-ETSI Industriales – C/ José Gutiérrez Abascal, 2 28006 Madrid (España)
POLIMI – Piazza Leonardo da Vinci, 32 20133 Milano (Italy)
KTH – SE 100 44 Stockholm (Sweden)
109
7.4. Fixed Operators
There are mainly three telecommunication operators in Thailand on fixed line
business as followed:
TOT (TOT Public Company Limited ( ))
True (True Corporation Public Company Limited)
TT&T
7.4.1. Thailand Fixed Line
Thailand fixed line subscribers static from ICT shows that there were
3,643,296 subscribers of metropolitan and 3,365,607 subscribers of povincial
area. Total 7,008,903 subscribed the fixed line in 2010. (NTC, 2011) It is
lower than the 7,394,349 and 7,204,936 sbuscribers in 2008 and 2009 in
fixed line. (NTC, 2011)The sign shows that the fixed market in Thailand
decreases year by year.
7.4.2. Fixed Line Market Share
The major telecommunicaiton operators for the fixed line are TOT, True and
TT&T. In metropolitan area, TOT and True have the larger market shares at
44.83% and 55.17%, respectively. In other provinces, TOT and TT&T have
the larger market shares at 70.91% and 29.09%, respectively . Total market
share of Thailand fixed line are TOT 57.35%, True 28.68% and TT&T 13.97%,
respectively. (NTC, 2011)
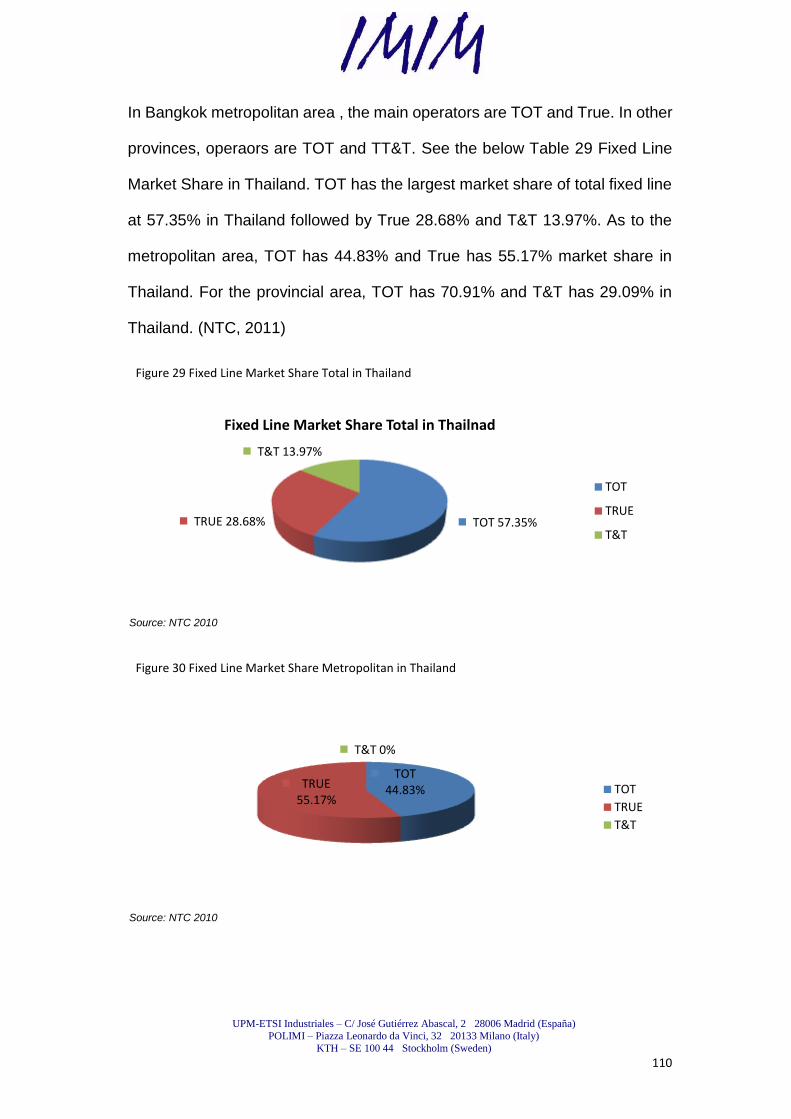
UPM-ETSI Industriales – C/ José Gutiérrez Abascal, 2 28006 Madrid (España)
POLIMI – Piazza Leonardo da Vinci, 32 20133 Milano (Italy)
KTH – SE 100 44 Stockholm (Sweden)
110
In Bangkok metropolitan area , the main operators are TOT and True. In other
provinces, operaors are TOT and TT&T. See the below Table 29 Fixed Line
Market Share in Thailand. TOT has the largest market share of total fixed line
at 57.35% in Thailand followed by True 28.68% and T&T 13.97%. As to the
metropolitan area, TOT has 44.83% and True has 55.17% market share in
Thailand. For the provincial area, TOT has 70.91% and T&T has 29.09% in
Thailand. (NTC, 2011)
Figure 29 Fixed Line Market Share Total in Thailand
Source: NTC 2010
Figure 30 Fixed Line Market Share Metropolitan in Thailand
Source: NTC 2010
TOT 57.35%TRUE 28.68%
T&T 13.97%
Fixed Line Market Share Total in Thailnad
TOT
TRUE
T&T
TOT 44.83%TRUE
55.17%
T&T 0%
TOT
TRUE
T&T
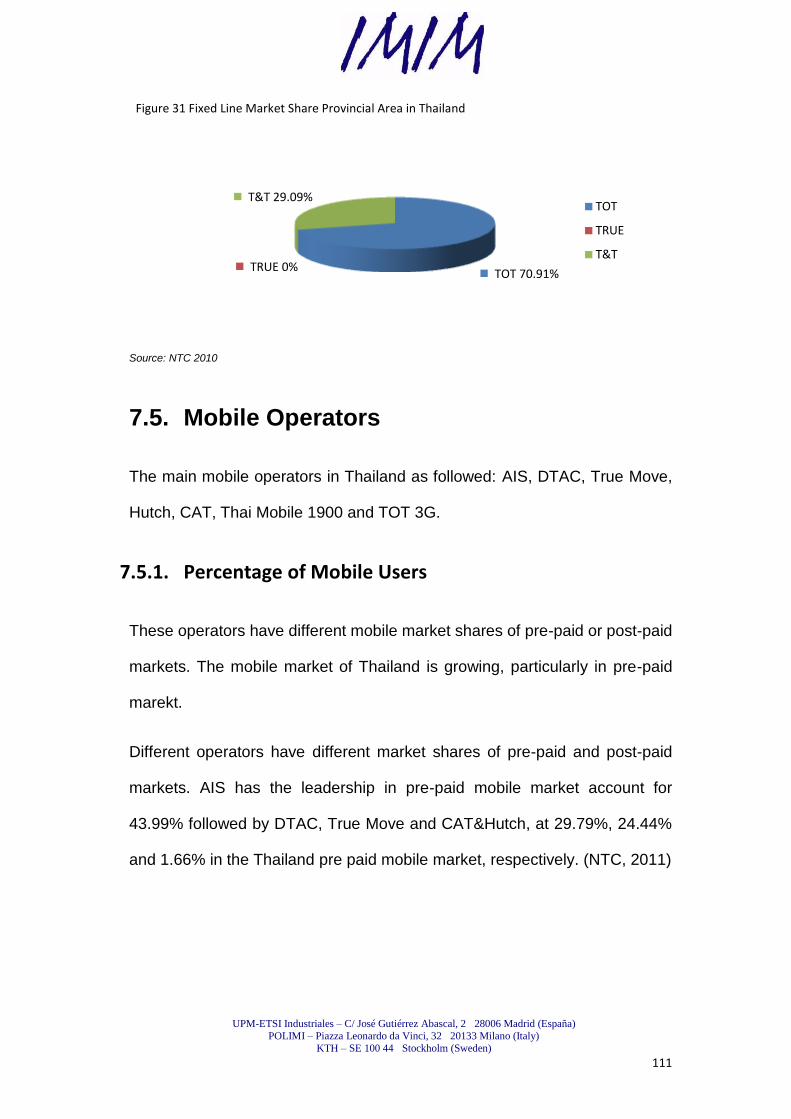
UPM-ETSI Industriales – C/ José Gutiérrez Abascal, 2 28006 Madrid (España)
POLIMI – Piazza Leonardo da Vinci, 32 20133 Milano (Italy)
KTH – SE 100 44 Stockholm (Sweden)
111
Figure 31 Fixed Line Market Share Provincial Area in Thailand
Source: NTC 2010
7.5. Mobile Operators
The main mobile operators in Thailand as followed: AIS, DTAC, True Move,
Hutch, CAT, Thai Mobile 1900 and TOT 3G.
7.5.1. Percentage of Mobile Users
These operators have different mobile market shares of pre-paid or post-paid
markets. The mobile market of Thailand is growing, particularly in pre-paid
marekt.
Different operators have different market shares of pre-paid and post-paid
markets. AIS has the leadership in pre-paid mobile market account for
43.99% followed by DTAC, True Move and CAT&Hutch, at 29.79%, 24.44%
and 1.66% in the Thailand pre paid mobile market, respectively. (NTC, 2011)
TOT 70.91%TRUE 0%
T&T 29.09%TOT
TRUE
T&T
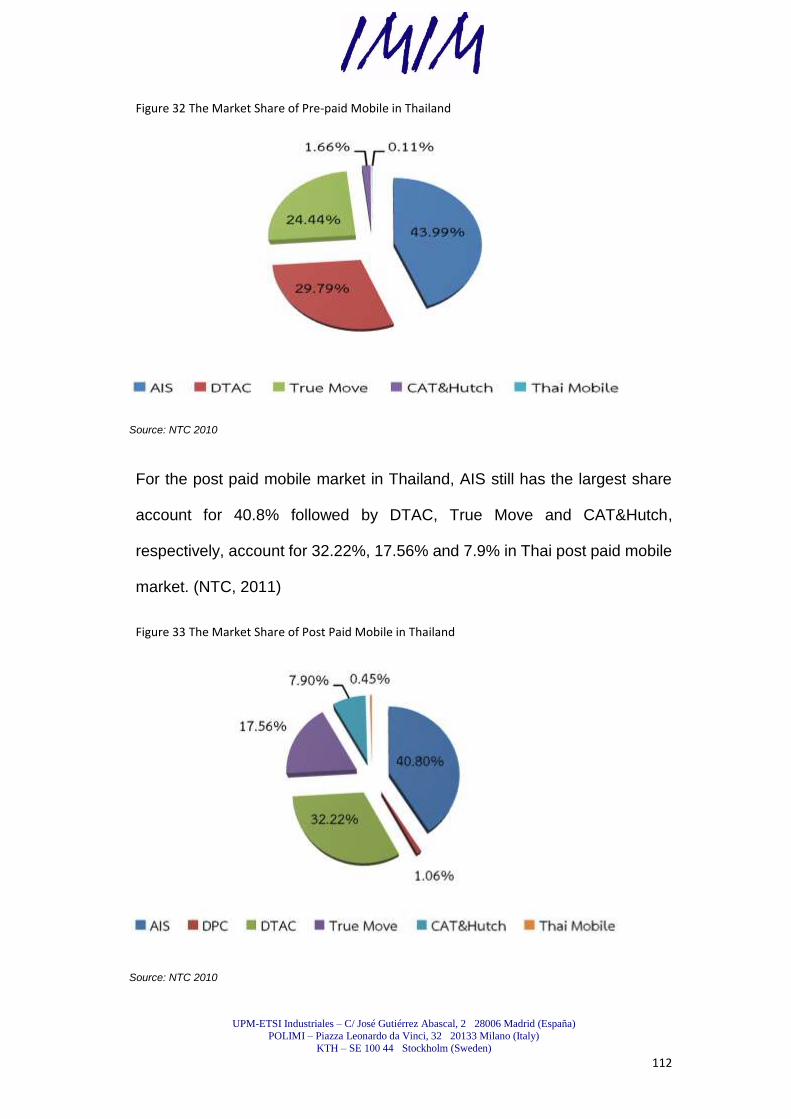
UPM-ETSI Industriales – C/ José Gutiérrez Abascal, 2 28006 Madrid (España)
POLIMI – Piazza Leonardo da Vinci, 32 20133 Milano (Italy)
KTH – SE 100 44 Stockholm (Sweden)
112
Figure 32 The Market Share of Pre-paid Mobile in Thailand
Source: NTC 2010
For the post paid mobile market in Thailand, AIS still has the largest share
account for 40.8% followed by DTAC, True Move and CAT&Hutch,
respectively, account for 32.22%, 17.56% and 7.9% in Thai post paid mobile
market. (NTC, 2011)
Figure 33 The Market Share of Post Paid Mobile in Thailand
Source: NTC 2010
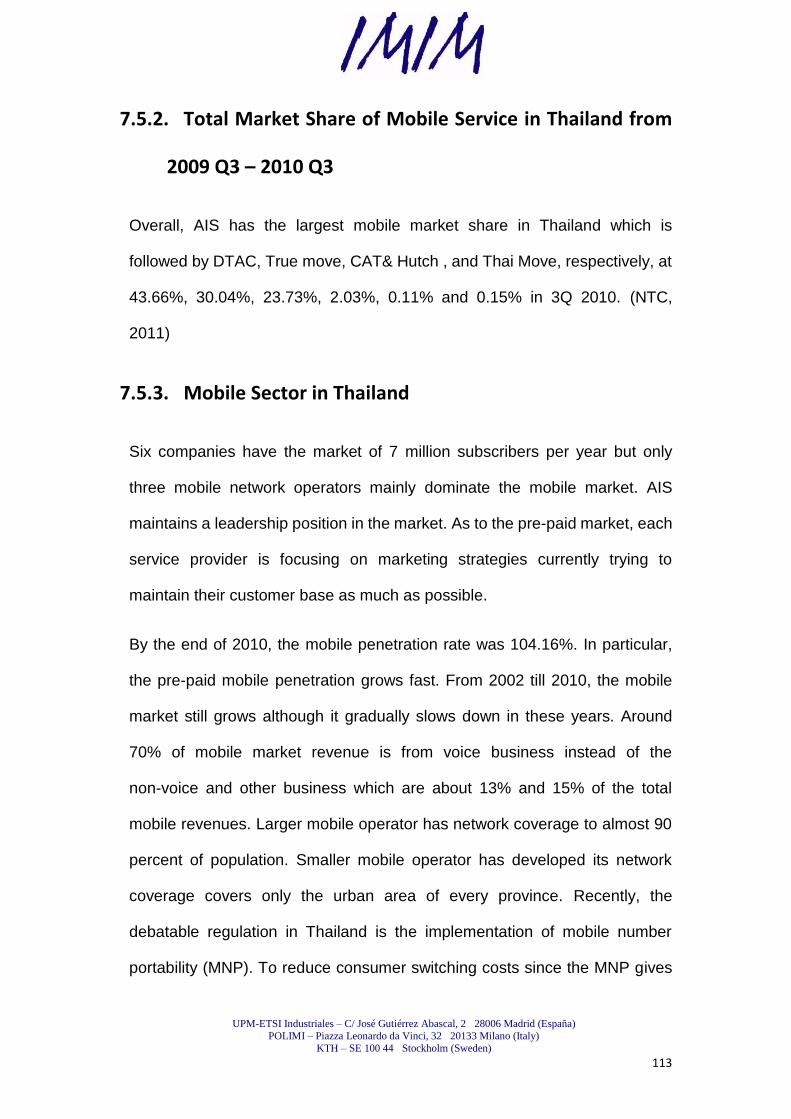
UPM-ETSI Industriales – C/ José Gutiérrez Abascal, 2 28006 Madrid (España)
POLIMI – Piazza Leonardo da Vinci, 32 20133 Milano (Italy)
KTH – SE 100 44 Stockholm (Sweden)
113
7.5.2. Total Market Share of Mobile Service in Thailand from
2009 Q3 – 2010 Q3
Overall, AIS has the largest mobile market share in Thailand which is
followed by DTAC, True move, CAT& Hutch , and Thai Move, respectively, at
43.66%, 30.04%, 23.73%, 2.03%, 0.11% and 0.15% in 3Q 2010. (NTC,
2011)
7.5.3. Mobile Sector in Thailand
Six companies have the market of 7 million subscribers per year but only
three mobile network operators mainly dominate the mobile market. AIS
maintains a leadership position in the market. As to the pre-paid market, each
service provider is focusing on marketing strategies currently trying to
maintain their customer base as much as possible.
By the end of 2010, the mobile penetration rate was 104.16%. In particular,
the pre-paid mobile penetration grows fast. From 2002 till 2010, the mobile
market still grows although it gradually slows down in these years. Around
70% of mobile market revenue is from voice business instead of the
non-voice and other business which are about 13% and 15% of the total
mobile revenues. Larger mobile operator has network coverage to almost 90
percent of population. Smaller mobile operator has developed its network
coverage covers only the urban area of every province. Recently, the
debatable regulation in Thailand is the implementation of mobile number
portability (MNP). To reduce consumer switching costs since the MNP gives
UPM-ETSI Industriales – C/ José Gutiérrez Abascal, 2 28006 Madrid (España)
POLIMI – Piazza Leonardo da Vinci, 32 20133 Milano (Italy)
KTH – SE 100 44 Stockholm (Sweden)
114
mobile subscribers to remain use the same mobile telephone number while
changing mobile operator.
Thai mobile operators work hard to retain their own mobile subscribers as
well as steal rival‘s mobile customers. All of mobile operators use the price
strategy to compete with each others, but the quality of service of each
remains unequal. In the future, to raise competition in both price and quality
of services will be a trend.
7.5.4. Coverage and areas
The largest mobile operator of Thailand has better network coverage in most
of regions in Thailand.
7.6. Data Market in Thailand
The trend for the data market in Thailand presents that the number of
subscribers of the board band increases instead of internet leased line in
these years. In 2010, the subscribers of XDSL in Thailand reaches 72.70 %
of total data market. (NTC, 2011)
7.7. International telephone services market in
Thailand
The price is competitive in IDD (International Direct Dialing). Customers are
attracted to promotion offers of customer service telephone services.
International calling card: The price is lower than IDD. The advantage of
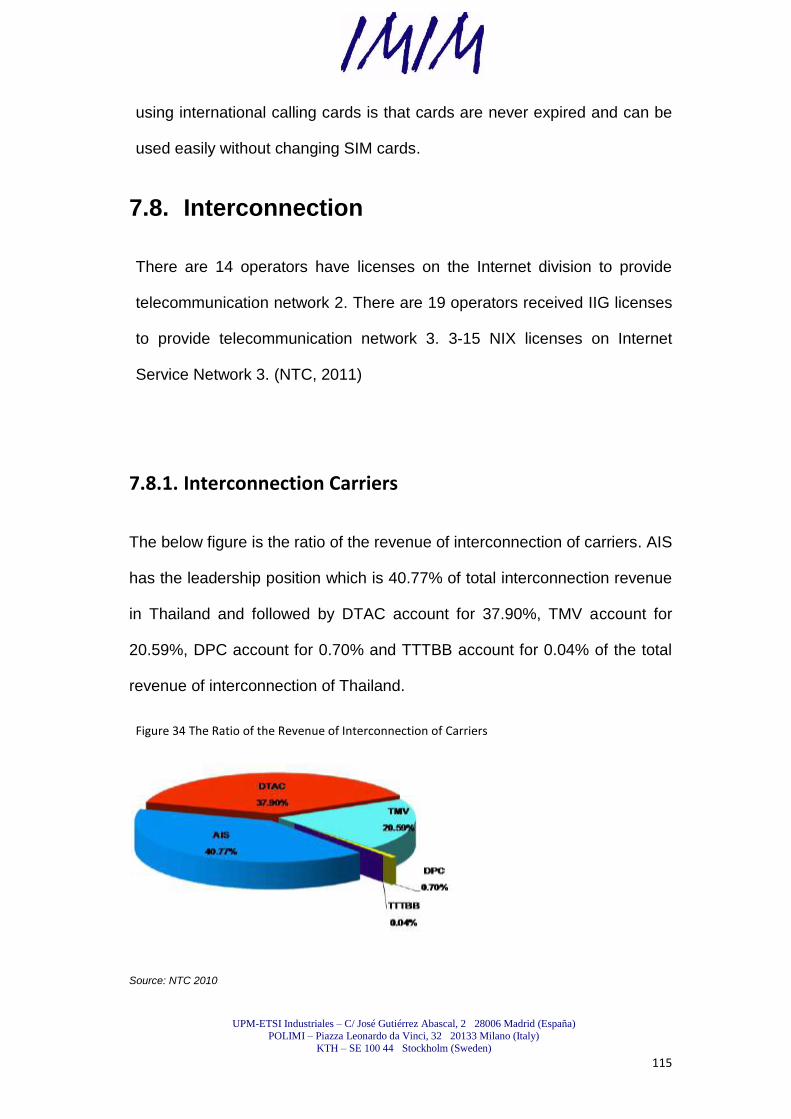
UPM-ETSI Industriales – C/ José Gutiérrez Abascal, 2 28006 Madrid (España)
POLIMI – Piazza Leonardo da Vinci, 32 20133 Milano (Italy)
KTH – SE 100 44 Stockholm (Sweden)
115
using international calling cards is that cards are never expired and can be
used easily without changing SIM cards.
7.8. Interconnection
There are 14 operators have licenses on the Internet division to provide
telecommunication network 2. There are 19 operators received IIG licenses
to provide telecommunication network 3. 3-15 NIX licenses on Internet
Service Network 3. (NTC, 2011)
7.8.1. Interconnection Carriers
The below figure is the ratio of the revenue of interconnection of carriers. AIS
has the leadership position which is 40.77% of total interconnection revenue
in Thailand and followed by DTAC account for 37.90%, TMV account for
20.59%, DPC account for 0.70% and TTTBB account for 0.04% of the total
revenue of interconnection of Thailand.
Figure 34 The Ratio of the Revenue of Interconnection of Carriers
Source: NTC 2010
UPM-ETSI Industriales – C/ José Gutiérrez Abascal, 2 28006 Madrid (España)
POLIMI – Piazza Leonardo da Vinci, 32 20133 Milano (Italy)
KTH – SE 100 44 Stockholm (Sweden)
116
7.9. International Internet Gateways
There are seven International Internet Gateway operators in Thailand.
True Corporation and Shin Corporation were granted Type II International
Internet Gateway and Internet Exchange Service License from the NTC
(National Telecommunication Committee) in 2005. CAT Telecom holds the
largest share of the market. CAT has a lot of gates for international Internet
than other operators.
7.10. Submarine Cables in Thailand
There are five submarine cables used for communications landing in
Thailand. Thailand has cable landing points in Satun, Petchaburi and
Chonburi.
SEA-ME-WE-3, SEA-ME-WE-4 linking South East Asia to the Middle
East and Western Europe. SEA-ME-WE 4 was operational since
2006.
Thailand-Indonesia-Singapore (TIS) operational since December
2003.
APCN linking Thailand, Malaysia, Singapore, Indonesia, Hong Kong,
Philippines, Taiwan, Korea and Japan. The cable is operational since
1996.
Thailand-Vietnam-Hong Kong (T-V-H) operational since February
1996.
UPM-ETSI Industriales – C/ José Gutiérrez Abascal, 2 28006 Madrid (España)
POLIMI – Piazza Leonardo da Vinci, 32 20133 Milano (Italy)
KTH – SE 100 44 Stockholm (Sweden)
117
Flag Europe-Asia (FEA) operational since mid-1990s.
Currently there are some new gateways which are building.
The Asia-America Gateway (AAG) is under construction and is expected to
be operational in Q2 2009. The Asia Pacific Gateway (APG), a new
submarine cable, is under planning stage and is expected to be operational in
Q3 2011. (NTC, 2011)
7.11. BTO Network in Thailand (Build Transfer
Operate)
BTO( Build Transfer Operate) is a very common way of Thai telecom
operators to cooperate with other carriers to expand their networks. They
have agreements based on the revenue sharing.
7.12. Telecom Operators in Thailand
7.12.1. AIS Introduction (Advanced Info Service)
Advanced Info Service PCL is Thailand‘s largest GSM mobile phone operator
which was founded on April 24, 1986 in Thailand. It has reached 28.8 million
customers by the end of February 2010. (AIS, 2011) AIS owns technology as
GSM, EDGE, UMTS, HSDPA and WCDMA900. The revenue was 81.59
billion baths of 2010 and the profit was 14.74 billion baths of 2010. (AIS, 2011)
Singapore Telecommunications holds 19.15% of the stake of the company.

UPM-ETSI Industriales – C/ José Gutiérrez Abascal, 2 28006 Madrid (España)
POLIMI – Piazza Leonardo da Vinci, 32 20133 Milano (Italy)
KTH – SE 100 44 Stockholm (Sweden)
118
7.12.2. DTAC (Total Access Communication Public
Company Limited)
Total Access Communication Public Company Limited (DTAC) which is
founded in 1989. It is the second largest GSM mobile phone in Thailand.
Telecom company Telenor owns part of it. DTAC operating 800 MHz and
1800 MHz frequency bands has the BTO contract with CAT for twenty seven
years long which is based on the revenues sharing basis. (DTAC, 2011)
7.12.3. True (formerly Orange)
True Corporation Public Company Limited (TRUE) which is founded on
November 13, 1990 controls Thailand‘s largest cable TV provider True
Visions in Thailand. Its another subsidiary ―True Move‖ owns third largest
market and operates ISP True Internet extensively. It has the technology as
GSM, EDGE, UMTS and HSDPA. (True, 2011)
7.12.3.1. TIG (True International Gateway)
It is 100% owned by True Corporation. Countries present in Cambodia, Hong
Kong, Laos, Singapore, and Thailand. It provides long-haul and metro
services include bandwidth, IP transit, MPLS, Ethernet, co-location, virtual
node services, local loops. Mainly technology: is Ethernet, DWDM, IP and
Sonet / SDH. TIG has obtained the first international gateway license to
provide both terrestrial and submarine connectivity services from the
NTC( National Telecommunication Commission of Thailand). (TIG, 2011)
UPM-ETSI Industriales – C/ José Gutiérrez Abascal, 2 28006 Madrid (España)
POLIMI – Piazza Leonardo da Vinci, 32 20133 Milano (Italy)
KTH – SE 100 44 Stockholm (Sweden)
119
7.12.4. Hutch
Hutch – CAT and TOT alliance, Thai Mobile and Hutch, for offering a GSM
mobile service , and both a CDMA2000 1X mobile service in twenty five
central provinces and a CDMA2000 1xEV-DO service in fifty one other
regional provinces. Mainly technology is Cdma One and CDMA2000 EV-DO.
(Hutch, 2011)
7.12.5. TOT (TOT Public Company Limited)
TOT Public Company Limited (ทีโอที) is a Thai state-owned
telecommunications company which is founded in 1954 and corporatized in
2002. The finance is controlled by the Ministry of Finance of Thailand. It has
technology as UMTS, HSDPA (Available on April 2011). (TOT, 2011)
7.12.6. CAT
CAT Telecom Public Company Limited is also a state owned company. Its
infrastructure includes the international gateways, satellite and submarine
cable networks connections. Countries present in Hong Kong, Laos,
Singapore, and Thailand. It provides long-haul and metro service including
Bandwidth, IP transit, voice, MPLS, Ethernet, and mobile. The technology is
Ethernet, DWDM, IP, cable, fibre, wireless, satellite, and Sonet/SDH. CAT is
the first international telecom service provider. Services provided include
internet service, network services, international calls, e business, CDMA and
IT security. (CAT, 2011)
UPM-ETSI Industriales – C/ José Gutiérrez Abascal, 2 28006 Madrid (España)
POLIMI – Piazza Leonardo da Vinci, 32 20133 Milano (Italy)
KTH – SE 100 44 Stockholm (Sweden)
120
8. Analysis
This chapter will discussed and analyzed the telecom industries of India,
Singapore, and Thailand by Michael Porter‘s Diamond theory and SWOT
analysis.
8.1. Diamond Theory Analysis of Telecom
Industry of India
The below table showed the abstract of the result of the diamond theory
analysis of Indian telecom market. Further, it would be discussed in the
follows in detail.

UPM-ETSI Industriales – C/ José Gutiérrez Abascal, 2 28006 Madrid (España)
POLIMI – Piazza Leonardo da Vinci, 32 20133 Milano (Italy)
KTH – SE 100 44 Stockholm (Sweden)
121
Table 9 Diamond Theory Analysis of Telecom Industry of India
8.1.1. Factor conditions:
India's labor force is up to 478.3 million in 2nd place of the world (CIA, 2011)
behinds China but the rural employment accounts for 60% of the total labor
force of India. Technical or semi-skilled labors are not sufficient in India. Due
to ineffective implementation of national education, the illiterate population is
high and most of them are in provinces UP and Bihar which have the worst
infrastructure. Accounting to the statistics, the illiteracy rate of people is 25%
in India. (CIA, 2011) However, India‘s education started to nurture more
engineers after fifty.
UPM-ETSI Industriales – C/ José Gutiérrez Abascal, 2 28006 Madrid (España)
POLIMI – Piazza Leonardo da Vinci, 32 20133 Milano (Italy)
KTH – SE 100 44 Stockholm (Sweden)
122
There are around 2.1 million of Indians employed in ICT industry every year.
(ITU, 2010) It becomes the biggest ICT jobs creator over the world. India now
is one of the countries which power the information and technology industry
in the world. Nearly 90 million graduated students (ITU, 2010) are into the
field of research and development of ICT every year. The human resource is
more abundant in ICT industry than other countries. Generally, Indians have
well training at mathematics and English which are favorable to foster IT
manpower. There are also many Indians have studied abroad and come back
to India for working in the ICT industry. Most of manpower is young people.
The average age is around 28 years old in IT industry. (ITU, 2010) Then, the
salary level of employees is one fifth of western employees. Obviously they
have competitive advantages than people from the developed countries. The
large operators set up their own training institutions for developing their own
human resources.
In 1987, India government has legislated National Policy on Education which
promoted the technology and information educations. Furthermore, India and
European Union have agreed that to cooperate on Information and
Telecommunication Technologies. They built a research & development
center in Bangalore to foster the area of software or information. Overall, the
general education of India still has the big problem, such as the high ratio of
pupil and teacher, high rate of dropping out study, or high illiterate rate.
Nevertheless, the government performs better in the area of developing
UPM-ETSI Industriales – C/ José Gutiérrez Abascal, 2 28006 Madrid (España)
POLIMI – Piazza Leonardo da Vinci, 32 20133 Milano (Italy)
KTH – SE 100 44 Stockholm (Sweden)
123
technology manpower. The knowledge resource in ICT part is developing
fast.
The infrastructure in India is still poor. Among 66,822 rural areas, there are
still 14,480 villages have not laid telephone lines. (TRAI, 2009)
India‘s 11th – 5 years economic plan during the year 2007-2012 (Planning
Commission, 2011) is enhancing the rural telephone connection to 200
million by 2012. By continuous reducing in tariffs of mobile phone and
introducing preferential rates program, the demand of the coverage of tower
and other infrastructure increase and operators have set up 30 million base
stations. (Planning Commission , 2011) India has expanded its
communication network fast based on its economic plan.
8.1.2. Demand conditions:
India is the fast-growing telecommunication market all over the world.
According to Telecom Regulatory Authority of India (TRAI) statistics, by the
end of March 2010, the number of telephone users reached 601,220 million
includes 507,550 mobile phone users and 6,660 million fixed line users.
Indian mobile market still has high potentiality for growth. In March 2009, the
average time of Indian mobile usage of GSM is 484 minutes. The average
UPM-ETSI Industriales – C/ José Gutiérrez Abascal, 2 28006 Madrid (España)
POLIMI – Piazza Leonardo da Vinci, 32 20133 Milano (Italy)
KTH – SE 100 44 Stockholm (Sweden)
124
consumption is US $ 4.1. The average time of usage of CDMA mobile is 357
minutes. The average consumption is US $ 1.98. (TRAI, 2009) Frost &
Sullivan is expected that wireless mobile users will reach USD 39.8 billion in
2012. Amount for fixed line telephone users will reach USD12.2 billion.
(Frost & Sullivan, 2010)
Indian state-owned telecom company BSNL provides 3G services at 318
cities throughout India which has 85,6 million subscribers. (BSNL, 2010)
BSNL also provides 3G services more than 760 cities in India. Tata Tele
services (Tata, 2010) already completed the radio telephone communication
network all over the India.
Overall, communication industry is the most successful industry in India since
the economy becomes liberated and open. Not only the growing number of
wired or wireless telephone, but also the number of usage of broadband
grows dramatically.
8.1.3. Related and supporting industries
IC, hardware, software...industries flourish in India. Related and supporting
industries develop well in genera in India. There are also many research
centers set up in India such as IIIT-b (International Institute of Information
Technology in Bangalore).
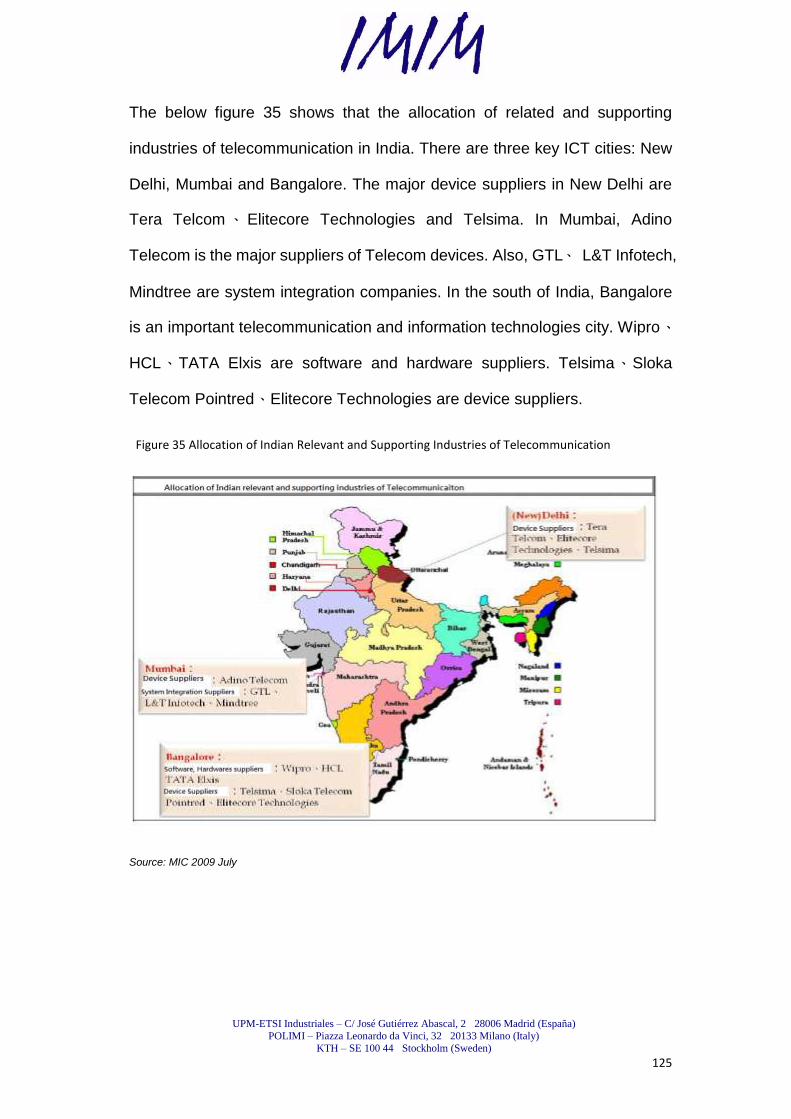
UPM-ETSI Industriales – C/ José Gutiérrez Abascal, 2 28006 Madrid (España)
POLIMI – Piazza Leonardo da Vinci, 32 20133 Milano (Italy)
KTH – SE 100 44 Stockholm (Sweden)
125
The below figure 35 shows that the allocation of related and supporting
industries of telecommunication in India. There are three key ICT cities: New
Delhi, Mumbai and Bangalore. The major device suppliers in New Delhi are
Tera Telcom 、 Elitecore Technologies and Telsima. In Mumbai, Adino
Telecom is the major suppliers of Telecom devices. Also, GTL、 L&T Infotech,
Mindtree are system integration companies. In the south of India, Bangalore
is an important telecommunication and information technologies city. Wipro、
HCL、TATA Elxis are software and hardware suppliers. Telsima、Sloka
Telecom Pointred、Elitecore Technologies are device suppliers.
Figure 35 Allocation of Indian Relevant and Supporting Industries of Telecommunication
Source: MIC 2009 July
UPM-ETSI Industriales – C/ José Gutiérrez Abascal, 2 28006 Madrid (España)
POLIMI – Piazza Leonardo da Vinci, 32 20133 Milano (Italy)
KTH – SE 100 44 Stockholm (Sweden)
126
8.1.4. Firm strategy, structure and rivalry:
Since 1991, the India Government conducted a series of reforms of
telecommunication. DoT allowed private operators to enter the
telecommunications market at the first time in 1991. It released two mobile
licenses of metropolitan areas in 1995. In 1994, DoT acted NTP-94 (DoT,
2011) which promote the popularization of fixed lines business and
encourage foreign companies to invest in Indian telecom industries. In 1999,
DoT further acted NTP-99 (DoT, 2011) continuing reforming the
telecommunication market includes expansion of private telecommunication
services of providing international long distance calls, authorizing
DoT functions of issuing licenses and making policy, having interconnections
between the different fixed-line operators , permitting BSNL and MTNL,
state-owned telecommunication, to access to mobile communications
services. In 2008, Indian government opened to the use of
wireless communication. "Crossover spectrum" policy is allowed operators
to access CDMA or GSM.
The Indian government has drawn up a blueprint to provide 3G services.
According to the schedule of the blueprint, 3G services will cover all urban
and rural areas in the country with more than 10 million users in 2012 by the
State Department of Telecommunications of India. In order to meet the
needs of the spectrum, the Indian government is trying to find unused
frequency bands from the areas of defense and aerospace.
UPM-ETSI Industriales – C/ José Gutiérrez Abascal, 2 28006 Madrid (España)
POLIMI – Piazza Leonardo da Vinci, 32 20133 Milano (Italy)
KTH – SE 100 44 Stockholm (Sweden)
127
Broadband network business of India is considered to an important factor to
enhance long-term economic development. Indian government announced
Broadband Policy "Broadband Policy 2004" in 2004. Since 2004, India had
a lower penetration rate regardless of Internet, broadband, and personal
computers, respectively, only 0.02%, 0,2% and 0.8% compared to other
Asian centuries. By "Broadband Policy 2004", BSNL and MTNL launched a
series of projects of fibers (HFC, FTTC, FTTH), DSL network. (DoT,
2011)This policy also encouraged ISP operators to deploy Cable,
Satellite and Wi-Fi network to increase the penetration of broadband. Fibers
and ADSL networks were deployed in the metropolitan areas and
its surrounding areas, and satellite communication networks were deployed
in remote rural areas to make up the insufficiency. Although "Broadband
Policy 2004" (DoT, 2011) has not clearly specified WiMAX technology, but it
has asked DoT to plan of radio spectrum of wireless broadband
technology for the future.
The WPC already published service policy "Guidelines for Broadband Wireless
Access Service" in 2007. (WPC, 2011) WiMAX services has been regarded as
the key technology of India. India's current WiMAX 2.3GHz and 2.5GHz
spectrum are going to auction and also include 3.3-3.4GHz spectrum and
the 5.8GHz which have been used by Fixed WiMAX . DoT and TRAI have
initiated the spectrum planning of 700MHz ,2.6-2 .7 GHz ,and 3.4-3 .7 GHz .
(WPC, 2011)
UPM-ETSI Industriales – C/ José Gutiérrez Abascal, 2 28006 Madrid (España)
POLIMI – Piazza Leonardo da Vinci, 32 20133 Milano (Italy)
KTH – SE 100 44 Stockholm (Sweden)
128
8.1.5. Government
8.1.5.1. DoT,Department of Telecom
Department of Telecom (referred to as DoT in the follows) is responsible for
overall planning and development of information and communication policies
to improve telecommunications services, improve industrial growth, permit
telecommunication business licenses, manage radio communication
frequency, regulate related specifications of radio usage and supervise
the telecommunications market. There are two state-owned national
telecommunication operators under the jurisdiction of DoT: Telecom BSNL
(Bharat Sanchar Nigam Limited), MTNL (Mahanagar Telephone Nigam
Limited)) and telecommunications consulting firm TCIL (Telecommunications
Consultants India Limited); spectrum management agencies WPC (Wireless
Planning & Coordination Wing), Telecom Engineering Center TEC (Telecom
Engineering Center), and telecommunications technology research and
development unit of C-DoT (Center for development of Telematics) and other
institutions. ―WPC,Wireless Planning and Coordination Wing ―and ―TEC,
Telecom Engineering Center‖, respectively, will be described their
responsibilities as follows. (DoT, 2011)
8.1.5.2. WPC,Wireless Planning and Coordination Wing
WPC was established in 1952, under the DoT. It is responsible for issuing
licenses, allocating of spectrum and telecommunication licenses approval.
UPM-ETSI Industriales – C/ José Gutiérrez Abascal, 2 28006 Madrid (España)
POLIMI – Piazza Leonardo da Vinci, 32 20133 Milano (Italy)
KTH – SE 100 44 Stockholm (Sweden)
129
WPC is divided into several major departments, including the radio spectrum
licensing and specification of units of LR (Licensing and Regulation), wireless
technology research group NTG (New Technology Group) and the Radio
Spectrum Allocation Advisory Committee SACFA (Standing Advisory
Committee on Radio Frequency Allocation). (WPC, 2011)
SACFA provides management advice of spectrum allocation and also
proposes spectrum planning proposals to the International Telecommunication
Union ITU (International Telecom Union).
8.1.5.3. TEC,Telecom Engineering Center
TEC is under DoT which is responsible for telecommunication technology
planning and network development. Business scope includes parts that to
build common level of quality to secure function between equipment
and services, to plan standards of the interface of services and networks, to
provide the standardization of telecommunication, to have technical
cooperation with international telecommunication organizations such as APT,
ETSI and ITU, to provide consult services of telecom research and
development to private telecommunication sector, and to plan the future
development policy of telecom with DoT.
UPM-ETSI Industriales – C/ José Gutiérrez Abascal, 2 28006 Madrid (España)
POLIMI – Piazza Leonardo da Vinci, 32 20133 Milano (Italy)
KTH – SE 100 44 Stockholm (Sweden)
130
8.1.5.4. TRAI,Telecom Regulatory Authority of India
TRAI was established in 1997, reorganized in 2000. TRAI is responsible for
managing the industry of telecommunication for operators which want to enter
the telecommunications industry to ensure license issuing, and operators
which conduct regular surveys of quality in order to protect users‘ interests.
Government of India has authorized jobs to TRAI includes: development the
fair and reasonable fees of telecommunication, to ensure the interoperability
of network, to analyze of the Indian WiMAX policy development, and to be the
coordinated unit between DoT and operators.
Overall the politician of India, it with features religion, multi race, caste based,
and local political developments is implicit a lot of conflicts in the whole nation
while India‘s economy rise. .
8.1.6. Chance:
India had planned in late 2008 in Delhi, Mumbai, Kolkata and Chennai city
for a mobile phone number for portable business that allows mobile phone
users to retain the replacement of the original number of carriers. This new
service brings an opportunity for mobile service. It will force telecom
operators to improve their service of quality.
In the early of 2011, 3G finally starts in India after many years delay. The
authority needs to plan to the divide this country into several service areas. If
UPM-ETSI Industriales – C/ José Gutiérrez Abascal, 2 28006 Madrid (España)
POLIMI – Piazza Leonardo da Vinci, 32 20133 Milano (Italy)
KTH – SE 100 44 Stockholm (Sweden)
131
there is only a small percentage of person using 3G services, it still is a large
market. However, the 3G service has different average price of spectrum per
subscriber in different regions. In metro circles, it could be USD 5-6 but the
rest circles is charged at USD0.5-1. The 3G technology may not be utilized
fully in India.
Nevertheless, the fast growing telecom market and the government‘s support
make the ICT industry has good prospect for the long run.
8.2. Diamond Theory Analysis of Telecom
Industry of Singapore
The below Table 12 indicated the abstract of the result of diamond theory
analysis of the telecom market in Singapore.
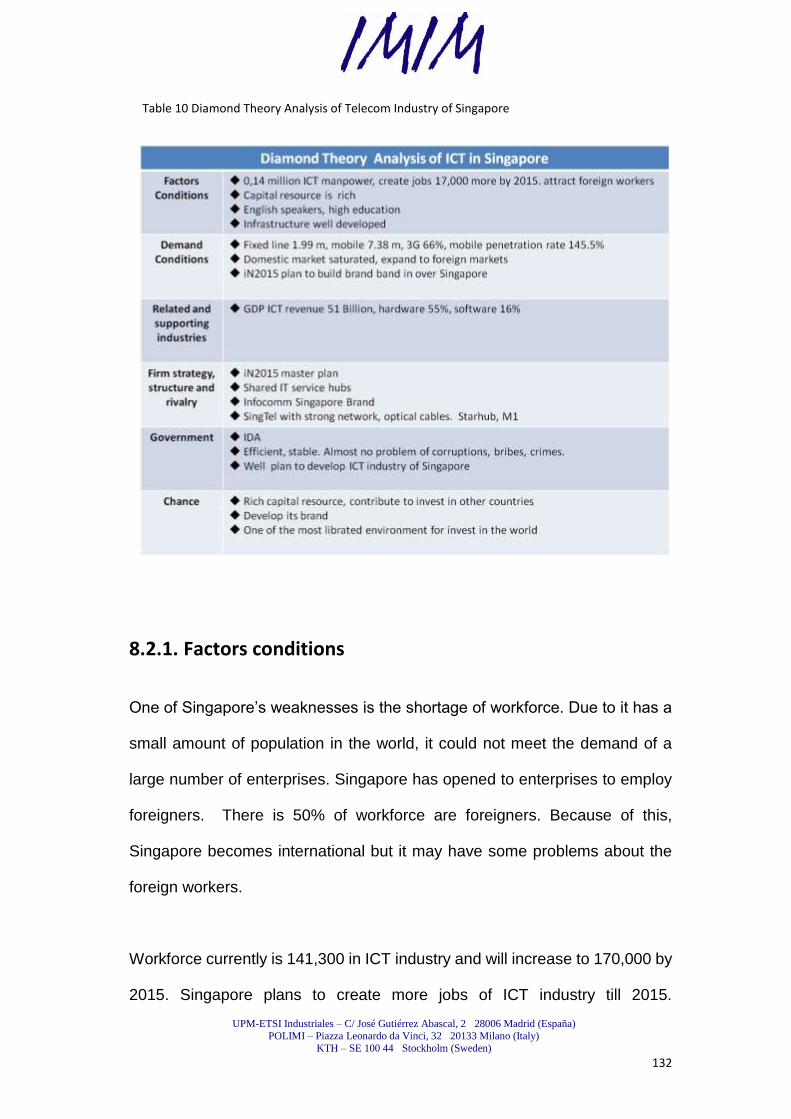
UPM-ETSI Industriales – C/ José Gutiérrez Abascal, 2 28006 Madrid (España)
POLIMI – Piazza Leonardo da Vinci, 32 20133 Milano (Italy)
KTH – SE 100 44 Stockholm (Sweden)
132
Table 10 Diamond Theory Analysis of Telecom Industry of Singapore
8.2.1. Factors conditions
One of Singapore‘s weaknesses is the shortage of workforce. Due to it has a
small amount of population in the world, it could not meet the demand of a
large number of enterprises. Singapore has opened to enterprises to employ
foreigners. There is 50% of workforce are foreigners. Because of this,
Singapore becomes international but it may have some problems about the
foreign workers.
Workforce currently is 141,300 in ICT industry and will increase to 170,000 by
2015. Singapore plans to create more jobs of ICT industry till 2015.
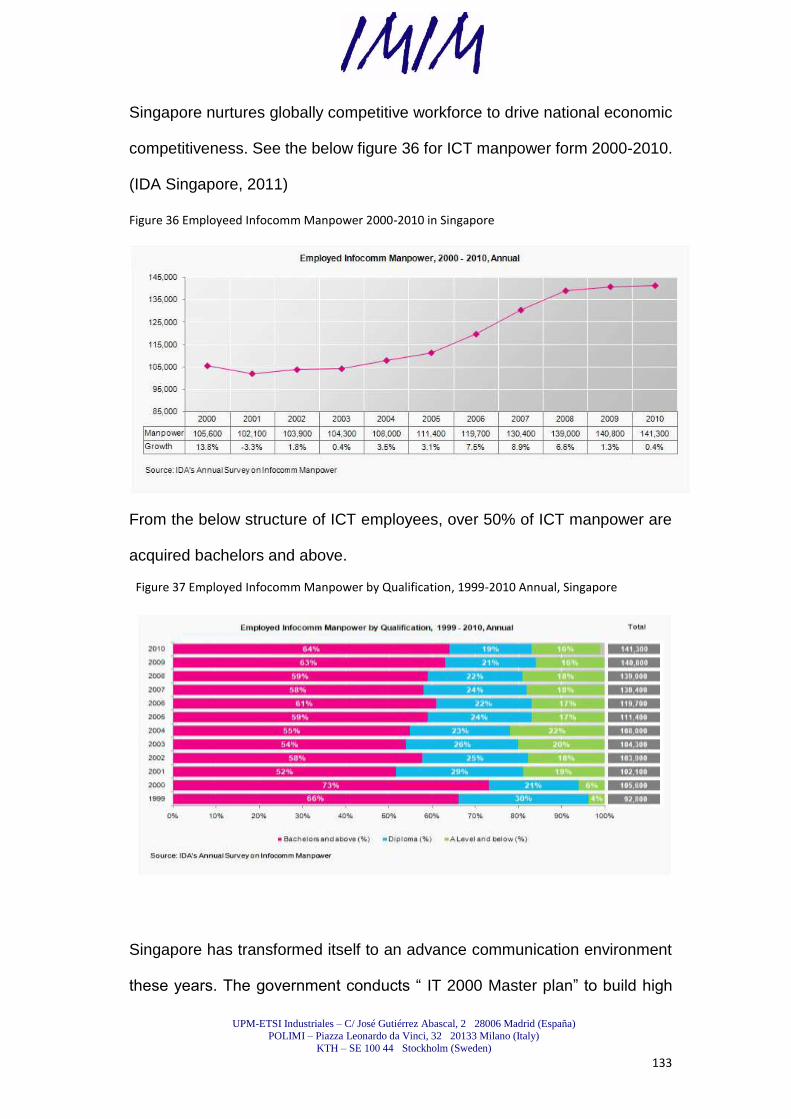
UPM-ETSI Industriales – C/ José Gutiérrez Abascal, 2 28006 Madrid (España)
POLIMI – Piazza Leonardo da Vinci, 32 20133 Milano (Italy)
KTH – SE 100 44 Stockholm (Sweden)
133
Singapore nurtures globally competitive workforce to drive national economic
competitiveness. See the below figure 36 for ICT manpower form 2000-2010.
(IDA Singapore, 2011)
Figure 36 Employeed Infocomm Manpower 2000-2010 in Singapore
From the below structure of ICT employees, over 50% of ICT manpower are
acquired bachelors and above.
Figure 37 Employed Infocomm Manpower by Qualification, 1999-2010 Annual, Singapore
Singapore has transformed itself to an advance communication environment
these years. The government conducts ― IT 2000 Master plan‖ to build high
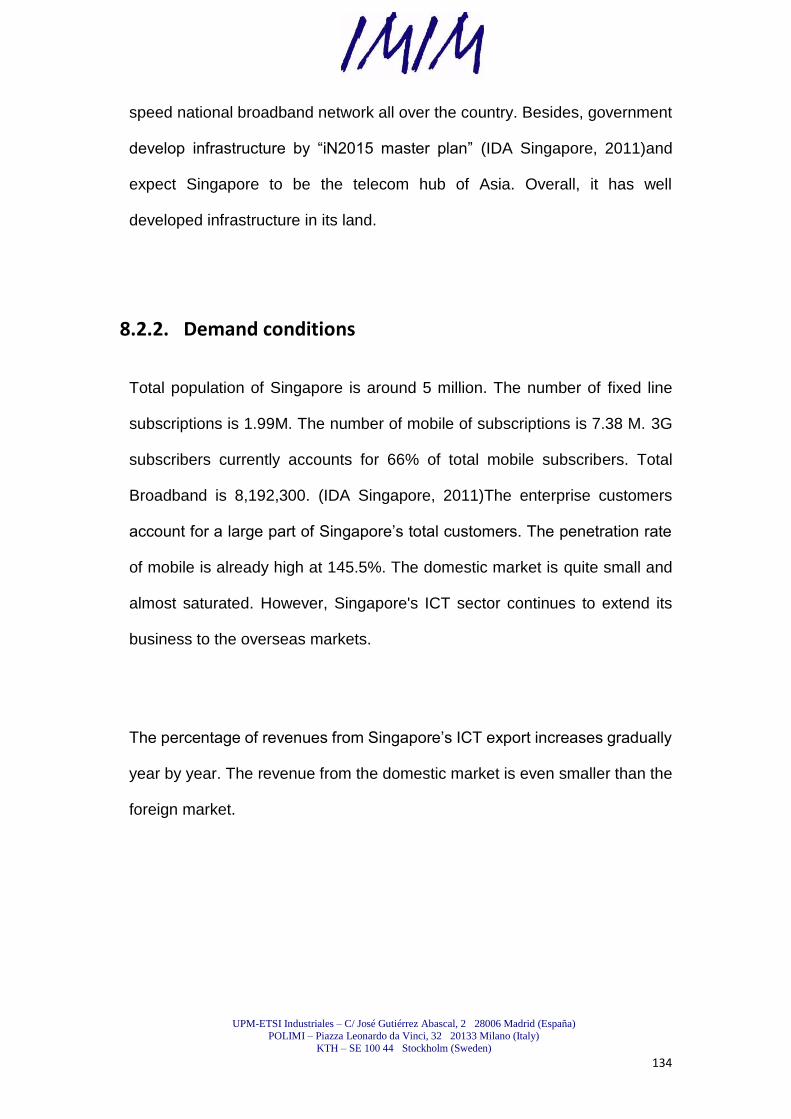
UPM-ETSI Industriales – C/ José Gutiérrez Abascal, 2 28006 Madrid (España)
POLIMI – Piazza Leonardo da Vinci, 32 20133 Milano (Italy)
KTH – SE 100 44 Stockholm (Sweden)
134
speed national broadband network all over the country. Besides, government
develop infrastructure by ―iN2015 master plan‖ (IDA Singapore, 2011)and
expect Singapore to be the telecom hub of Asia. Overall, it has well
developed infrastructure in its land.
8.2.2. Demand conditions
Total population of Singapore is around 5 million. The number of fixed line
subscriptions is 1.99M. The number of mobile of subscriptions is 7.38 M. 3G
subscribers currently accounts for 66% of total mobile subscribers. Total
Broadband is 8,192,300. (IDA Singapore, 2011)The enterprise customers
account for a large part of Singapore‘s total customers. The penetration rate
of mobile is already high at 145.5%. The domestic market is quite small and
almost saturated. However, Singapore's ICT sector continues to extend its
business to the overseas markets.
The percentage of revenues from Singapore‘s ICT export increases gradually
year by year. The revenue from the domestic market is even smaller than the
foreign market.

UPM-ETSI Industriales – C/ José Gutiérrez Abascal, 2 28006 Madrid (España)
POLIMI – Piazza Leonardo da Vinci, 32 20133 Milano (Italy)
KTH – SE 100 44 Stockholm (Sweden)
135
Figure 38 Revenue by Domestic and Export Market 1998-2009 Annual Singapore
8.2.3. Related and supporting industries
Due to the policy of the Singaporean government, it develops the ICT
industries well and also these contribute to the telecommunication industries.
From the below figure, hardware accounts for 55%, software accounts for
16% , IT services accounts for 13% and content services account for 2% in
the total ICT revenues SGD62.7 billion in 2009. Telecommunication service
accounts for 14% of the total. (IDA Singapore, 2011)
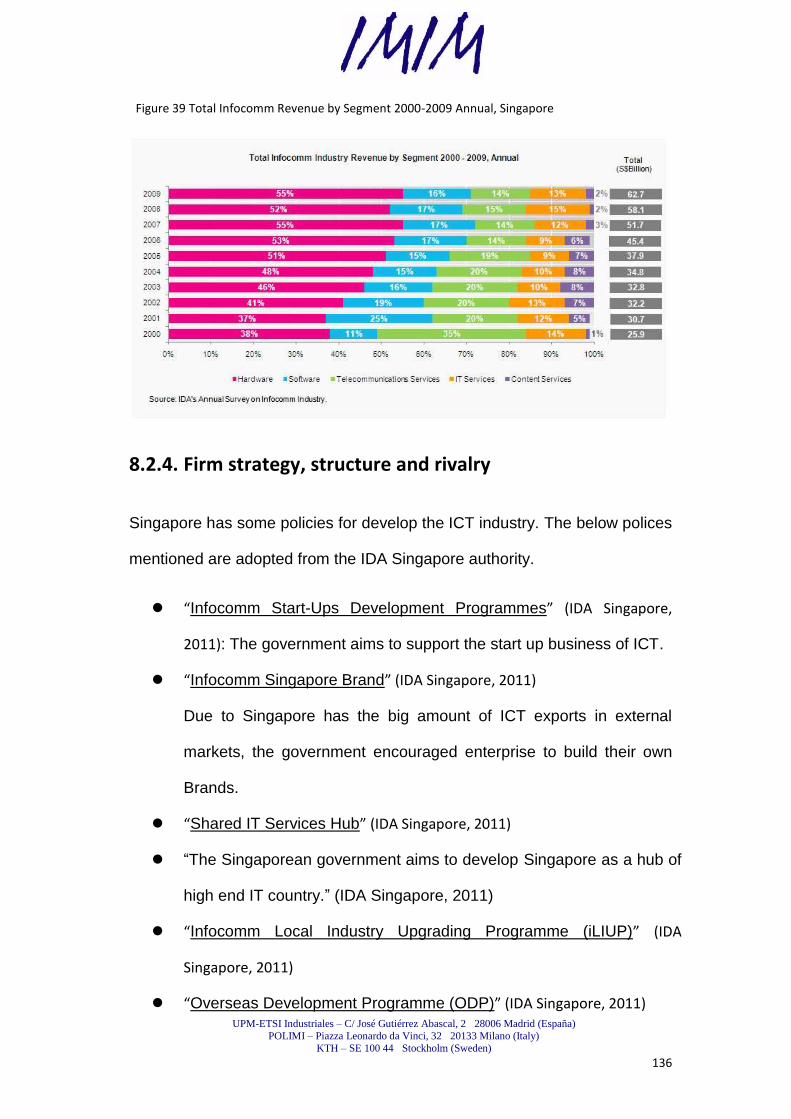
UPM-ETSI Industriales – C/ José Gutiérrez Abascal, 2 28006 Madrid (España)
POLIMI – Piazza Leonardo da Vinci, 32 20133 Milano (Italy)
KTH – SE 100 44 Stockholm (Sweden)
136
Figure 39 Total Infocomm Revenue by Segment 2000-2009 Annual, Singapore
8.2.4. Firm strategy, structure and rivalry
Singapore has some policies for develop the ICT industry. The below polices
mentioned are adopted from the IDA Singapore authority.
“Infocomm Start-Ups Development Programmes” (IDA Singapore,
2011): The government aims to support the start up business of ICT.
“Infocomm Singapore Brand” (IDA Singapore, 2011)
Due to Singapore has the big amount of ICT exports in external
markets, the government encouraged enterprise to build their own
Brands.
“Shared IT Services Hub” (IDA Singapore, 2011)
―The Singaporean government aims to develop Singapore as a hub of
high end IT country.‖ (IDA Singapore, 2011)
“Infocomm Local Industry Upgrading Programme (iLIUP)” (IDA
Singapore, 2011)
“Overseas Development Programme (ODP)” (IDA Singapore, 2011)
UPM-ETSI Industriales – C/ José Gutiérrez Abascal, 2 28006 Madrid (España)
POLIMI – Piazza Leonardo da Vinci, 32 20133 Milano (Italy)
KTH – SE 100 44 Stockholm (Sweden)
137
The Infocomm Local Industry Upgrading Programme (iLIUP) and
Overseas Development Programme (ODP) promote strategic and
mutually beneficial partnerships between iLEs and infocomm MNCs.
8.2.5. Government
The government is strong, efficient and stable. The problems of corruption,
bribes, crime, and foreign currencies control seldom happen in Singapore.
Singaporean government has the excellent performance and governance. It
set up many departments for development Information and Communication
Industry. There are many programs running.
8.2.6. Chance
There is sufficient capital for Singapore to invest in more business. It has
foreign exchange reserves USD 2,233 billion till January 2011 in 8th place in
the world. The government encourages investments and it has the liberalized
environment.
Since it is a very small country, Singaporeans have the vision for expanding
business to outside of its country instead of concentrating to its small
domestic market. Singaporeans are willing to learn more, speak English, and
ambitious to take more market share of external market.
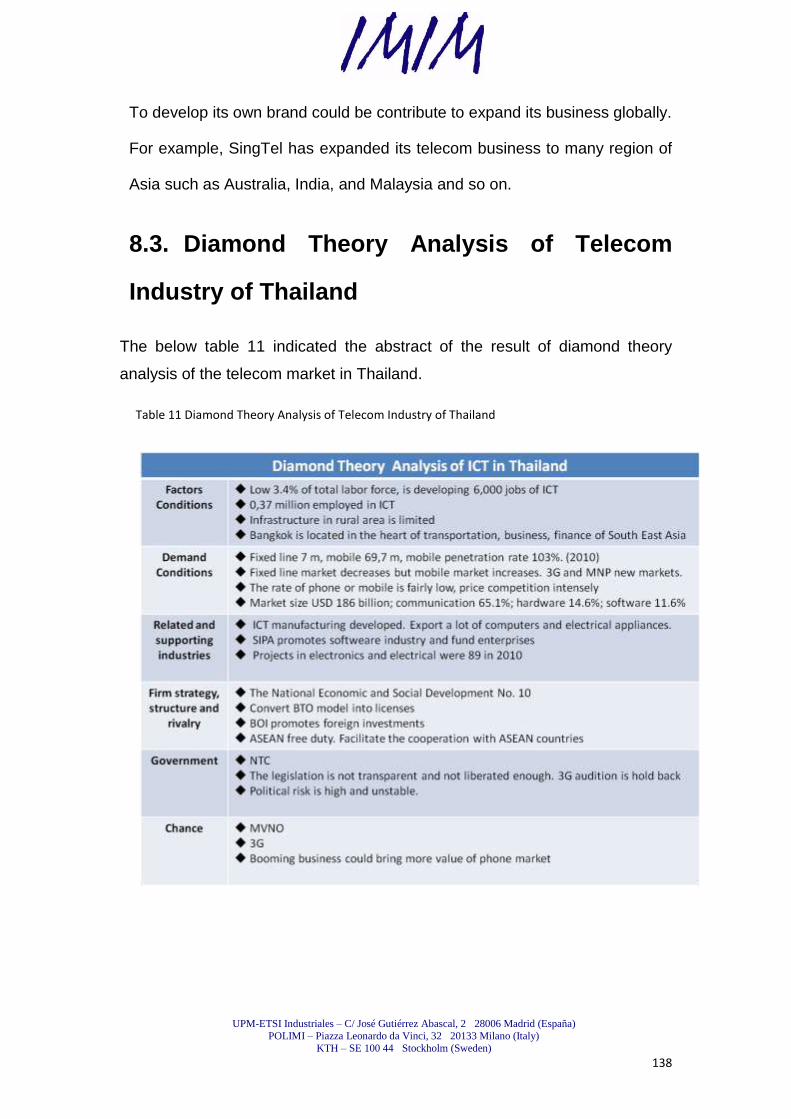
UPM-ETSI Industriales – C/ José Gutiérrez Abascal, 2 28006 Madrid (España)
POLIMI – Piazza Leonardo da Vinci, 32 20133 Milano (Italy)
KTH – SE 100 44 Stockholm (Sweden)
138
To develop its own brand could be contribute to expand its business globally.
For example, SingTel has expanded its telecom business to many region of
Asia such as Australia, India, and Malaysia and so on.
8.3. Diamond Theory Analysis of Telecom
Industry of Thailand
The below table 11 indicated the abstract of the result of diamond theory
analysis of the telecom market in Thailand.
Table 11 Diamond Theory Analysis of Telecom Industry of Thailand
UPM-ETSI Industriales – C/ José Gutiérrez Abascal, 2 28006 Madrid (España)
POLIMI – Piazza Leonardo da Vinci, 32 20133 Milano (Italy)
KTH – SE 100 44 Stockholm (Sweden)
139
8.3.1. Factor conditions
There are only 0, 37 million employed in ICT industry in Thailand (ITU, 2010)
although it only has 0.9 percentage of unemployment. (CIA, 2011) The
personnel number of information and telecommunication industry is relative
low accounts for 3.4% of labor force although the number of knowledgeable
personnel is growing in Thailand. Noticeably, Thailand is trying to develop
more high skilled personnel in ICT industry. According to NTC Thailand
authority, Thai information and telecommunication industry is expected to
employ about 6,000 people to the positions as programmers, software
engineers and so on. (NTC, 2011)
Infrastructure of information and communication of Thailand is not well
constructed and developed in the rural areas compared to other countries.
The metropolitan areas such as city Bangkok and rural areas are extremely
unbalanced. In countryside, the number of internet access is small and the
quality should be enhanced.
For the geographical condition, Thailand locates in the center of the south
east peninsula. It is the transportation hub and one of the biggest financial
centers in Asia. There are many multinational companies and world or
regional organizations set up headquarters of Asia Pacific in Bangkok
metropolitan. Due to its open strategy at trade, it becomes the very
international business city and investment point in Asia.
UPM-ETSI Industriales – C/ José Gutiérrez Abascal, 2 28006 Madrid (España)
POLIMI – Piazza Leonardo da Vinci, 32 20133 Milano (Italy)
KTH – SE 100 44 Stockholm (Sweden)
140
8.3.2. Demand conditions
Thailand‘s fixed-line market had 7.0 million subscribers and it appears that -3%
annual growth rate. The estimated subscribers of fixed line remains the same
number around 7.0 million in Thailand and the annual growth rate is close to
zero. Pessimistically, it is no sign for revival. The fixed-line market tends to
slow down gradually and it even will be dropped in the future. There is no room
for growing up of the fixed-line market.
Thailand‘s mobile market had reached 69.7 million subscribers by the end of
2010, for an overall penetration of 103%. Estimated subscribers in 2011 are
about 98.0 million and the estimated penetration is 117% totally. The growth
rate of Thailand‘s mobile market is 6% and 15% (estimated), respectively in
2010 and 2011. (NTC, 2011)The static number of the mobile market in
Thailand has the positive result and it grows continuously. Although the mobile
market seems to climb, the annual increase in the mobile subscriber numbers
had eased considerably in 2009 and 2010 as the national economy slowed.
The penetration rate of Thailand mobile has reached almost the world‘s
average. To be more competitive in the subsequent periods, mobile carriers
focus on improving the quality of services, and maintaining the stability and
increasing the comprehensive of the telecom network.
The progress of 3G mobile is slow. It may be the slowest country of the South
East Asia. Since the 3G auction plan could not be fairly to Thai major operators,
UPM-ETSI Industriales – C/ José Gutiérrez Abascal, 2 28006 Madrid (España)
POLIMI – Piazza Leonardo da Vinci, 32 20133 Milano (Italy)
KTH – SE 100 44 Stockholm (Sweden)
141
the 3G auction unfortunately could not be moved forward successful which is
still on hold although the National Telecommunications Commission is trying to
revise and improve the auction plan. It would take months, a year or more time
to conclude the process of 3G licences issuing. Since the unstable politician
and the coming election, the variables make this more complicated.
The broadband Internet market in Thailand was strong subscriber growth in
2009 and 2010. The expansion at an annual rate was about 30%. (NTC,
2011)The broadband market optimistically projected to have a substantial
growth in the next few years. However, the demand of broadband services has
the certain increase in Thailand; the broadband penetration still remains low
relatively at 4% in 2010. (NTC, 2011) The penetration rate of broadband has a
large gap to the average of world‘s standard.
The competition of telecom market is intense and final most of telecom
operators take the cut-throat price strategy to attract
customers. IDD(International Direct Calls) in Thailand has the lowest price
which is about 8 baht / minute, the lowest price of VoIP calls which is
about 4 baht / min, and the lowest price of internet phone calls without
accessing which is about 0.25 baht / minute in the world. In addition to the
pricing strategy, the telecom operators have taken the advertising strategies to
attract customers and stimulate the consumption of internet telephone
services. Its sales increases, particularly in VoIP, which of the market share is
up to about 40%, closes to the percentage of International Direct
UPM-ETSI Industriales – C/ José Gutiérrez Abascal, 2 28006 Madrid (España)
POLIMI – Piazza Leonardo da Vinci, 32 20133 Milano (Italy)
KTH – SE 100 44 Stockholm (Sweden)
142
Dialing 55%. The international phone cards, only 5% market share,
because most consumers still use international direct dial telephone and
Internet telephone. The companies which sell international phone cards are far
too many and cause the intense competition. Nowadays, the internet gateway
market has been opened up and more telecom hardware has been
constructed.
In addition, the increasingly popular social network expansion will also
increase Thailand's mobile phone sales in 2011. Thai Research Center
expects mobile phone sales in Thailand in 2011 will reach 9.5 million to
1,000 million units. (ITU, 2010)
Moreover, according to the data from Thailand's software industry promotion
offices in 2009, Thailand ICT market size is up to USD 175 billion, expanding
by 6% compared to 2008. (SIPA, 2009)The forecast of the growth rate of ICT
market size is 7.2% at the total market expansion of186 million. (ITU,
2010)Thailand's ICT market can be classified into the followed
groups: total USD11.3 billion at communications industry, the proportion
65.1% of total; followed by computer hardware, amounted to USD 2.53 billion,
the proportion reaches to 14.6%; computer software amounted to USD 20
billion , the proportion is 11.6%; computer services amounted to USD 1.5
billion, accounting for 8.7%. (ITU, 2010) Among them, the software
industry grows slightly, mainly due to software developers of the
domestic industry in Thailand transforming to the services providers.

UPM-ETSI Industriales – C/ José Gutiérrez Abascal, 2 28006 Madrid (España)
POLIMI – Piazza Leonardo da Vinci, 32 20133 Milano (Italy)
KTH – SE 100 44 Stockholm (Sweden)
143
8.3.3. Related and supporting industries
ICT manufacturing industry covers electronic components, computer and
peripheral equipments, consuming electronics, and so on. GDP of Hardware in
2009 accounted for 6.39%. (BOI Thailand, 2011) The current investment
environment is proficient and it attracts foreign investments including in
high-tech investment. The output value of Thailand's electronics industry has
rapid growth annual rate 30% in average. (SIPA, 2009)The electronics
product has become the largest export of Thai products.
The latest mobile technologies, modern design and improved features, such
as higher resolution cameras and memory card capacity, will also make the
mobile phone market more active.
The software also increases substantially since the SIPA (Software Industry
Promote Agency) promote it hard which fund to enterprises and also
develop the manpower of ICT. It particular put the effort on the practical
applications such as the assistance of tourism, food industry, jewelry
industry and so on.

UPM-ETSI Industriales – C/ José Gutiérrez Abascal, 2 28006 Madrid (España)
POLIMI – Piazza Leonardo da Vinci, 32 20133 Milano (Italy)
KTH – SE 100 44 Stockholm (Sweden)
144
8.3.4. Firm strategy, structure and rivalry
The policy ―The Tenth National Economic and Social Development Plan‖ from
National Economic and Social Development Board of Thailand (NESDB, 2006)
covers strategies to instruct the direction of being competitiveness in the global
environment.
It has mentioned that the importance to construct the ICT infrastructure to assist
manufacturing industries. Also, the government encourages people to use
internet services for proceeding administration jobs. At meantime, the
e-government has been promoted to the public. In the plan 10th, ―Strategies for
development of human quality towards a knowledge based and learning society‖.
(NESDB, 2006) indicates that to advance the quality of knowledge is one of
points for development. The authority expects to achieve that ―Improving
research and development in science and technology‖. (NESDB, 2011)
Technology transfer from the research organizations or academic units to
enterprises is an important step to execute the plan.
In Thailand, it is a common way to have the BTO, build transfer operation, model
between operators. Operators have the BTO concessions and contract with each
other to provide services and share the reverences. This made the monopoly
telecom economy in Thailand. For reforming the telecom industry to be
liberalized, the regulators should put more effort on converting the system into
licenses. In addition, the privatization of TOT and CAT is the big step for Thai
telecom industry to be liberated.
UPM-ETSI Industriales – C/ José Gutiérrez Abascal, 2 28006 Madrid (España)
POLIMI – Piazza Leonardo da Vinci, 32 20133 Milano (Italy)
KTH – SE 100 44 Stockholm (Sweden)
145
Thailand has encouraged foreign enterprises to invest in projects in its nation.
From the statistics from BOI Thailand, total number of projects reached 1,338
cases; total investment was at 448 billion baths, total registered capital was
44.1 billion baths in 2010. (BOI Thailand, 2011) Electronic and electrical
sector has been invested in 138 projects in 2007; 234 projects in 2008; 80
projects in 2009; and 85 projects in 2010. (BOI Thailand, 2011) Since the
open strategy of business, there are a lot of multinational or international
large enterprises located in Thailand and these helps the economy of
Thailand. Hence, Thailand exports a lot of amount of electronic products.
Thailand is one original member of AFTA , ASEAN free trade area, set up
from 2010 includes six countries Thailand, Singapore, Malaysia, Indonesia,
Philippines, and Brunei. In 2015, there are another four Asian centuries
Vietnam, Lao, Cambodia, and Myanmar will join the organization. The duty
is free in this AFTA and this could stimulate the trade and the growth of
economy. The export value to ASEAN is high at 22.3% of total export in the
first quarter of 2011. (NESDB, 2011) The policy emphasis on accelerating a
regional cooperation and building transportation facilitate.
8.3.5. Government:
Thai telecom authority is trying to reform the rules and regulations of
Telecom industry. Unfortunately, the authority still constructs constraints to
the operators and this becomes an obstacle for development of Telecom
UPM-ETSI Industriales – C/ José Gutiérrez Abascal, 2 28006 Madrid (España)
POLIMI – Piazza Leonardo da Vinci, 32 20133 Milano (Italy)
KTH – SE 100 44 Stockholm (Sweden)
146
industry. In addition, the regulators are not independent to the government.
To change Thai telecom environment into efficient and fair system is an
important issue.
Master Plan for Telecommunications Development was set in 1995. The topics
of the master plan of Telecommunications Development are: ―Liberalization‖,
―Increasing Private Participation‖, ―Establishment of Independent Regulatory
Body‖, ―Privatization of TOT and CAT‖, ―Separation of Postal Service from
Telecommunications Service‖, ―Consumer Protection‖, ―R & D and Industrial
Development‖, ―Personnel Development‖, ―Support to IT Development‖, ―Laws
Revision‖, ―Pricing Structure‖, and ―Regional Center‖. (NTC, 2011) The
―Privatization of TOT and CAT‖ is an important step for Thai telecom industry.
TOT and CAT have monopolized the telecom market of Thailand for a long
time. Although TOT and CAT still have shade of state owned culture, this
change indeed push the Thai telecom industry forward to be more competitive.
Some other operators could enter the markets for compete liberally.
The long delayed of 3G auction still is hold up since the process of auction is
not transparent. Some operators have suited the bided operators for the unfair
procedure.
Moreover, the politician of Thailand is extremely unstable. In 2006, the military
get power while the Prime Minister Thaksin was outside of Thailand. In 2008,
the political crisis almost crashed down the Thailand. During 2008 to 2010,
UPM-ETSI Industriales – C/ José Gutiérrez Abascal, 2 28006 Madrid (España)
POLIMI – Piazza Leonardo da Vinci, 32 20133 Milano (Italy)
KTH – SE 100 44 Stockholm (Sweden)
147
―Red Shirt‖ army protested and demonstrated in a large scale in Thailand.
These turmoils may bring negative impact to Thailand‘s economy.
8.3.6. Chance
The forecast of the telecom industry in Thailand shows that the overall
economy in Thailand starts to recover from 2010 will drive the telecom service
market of Thailand once grow again. The mobile communications market
accounts for 65% of the total telecom service market, particularly in
mobile value-added services which has a substantial growth. However,
competition will be more intense because state-owned telecom companies
will strengthen their market positions and increase revenue for making up
for the incoming losses of market shares in the future while the
private enterprises are going to obtain 3G licenses, and five companies can
have mobile virtual network of furniture (MVNO) business licenses of 3G
operators which will grab some of the state-owned telecom companies‘ current
customers. In addition, expected to open in August 2010 the "mobile number
portability service " may have an impact on the market share to the operators
because the service of 3G telecommunications service providers still have
significant difference among them.
UPM-ETSI Industriales – C/ José Gutiérrez Abascal, 2 28006 Madrid (España)
POLIMI – Piazza Leonardo da Vinci, 32 20133 Milano (Italy)
KTH – SE 100 44 Stockholm (Sweden)
148
8.4. SWOT Analysis of India Telecom Industry
8.4.1. Strengths
One of its strengths is that India owns a large of population so the market is
huge. It is predicted that the Indian telecom industry will be the fastest
growing industry in the world in the following years. Currently the government
regulates policies to support ICT industry. The environment is liberated. Then,
the software industry is strong and it could strength the development of
Telecom industry.
8.4.2. Weaknesses
As to the weaknesses, one of them is that the competition is intense among
operators in India. There are many operators enter the market and attempt to
take a part of market share. Also, there is a flaw exists in the supervision of
the government. Then, the basic infrastructure is weak in the rural area.
There is a big difference of development between the metropolitan and rural
areas. Last, the profit is low caused by the low tariff and it is difficult for
operators to gain the invest return in a short term.
8.4.3. Opportunities
For opportunities, the favorable one is that the broadband market is large and
has not saturated. The rural network will expand in large scale. Next, it is
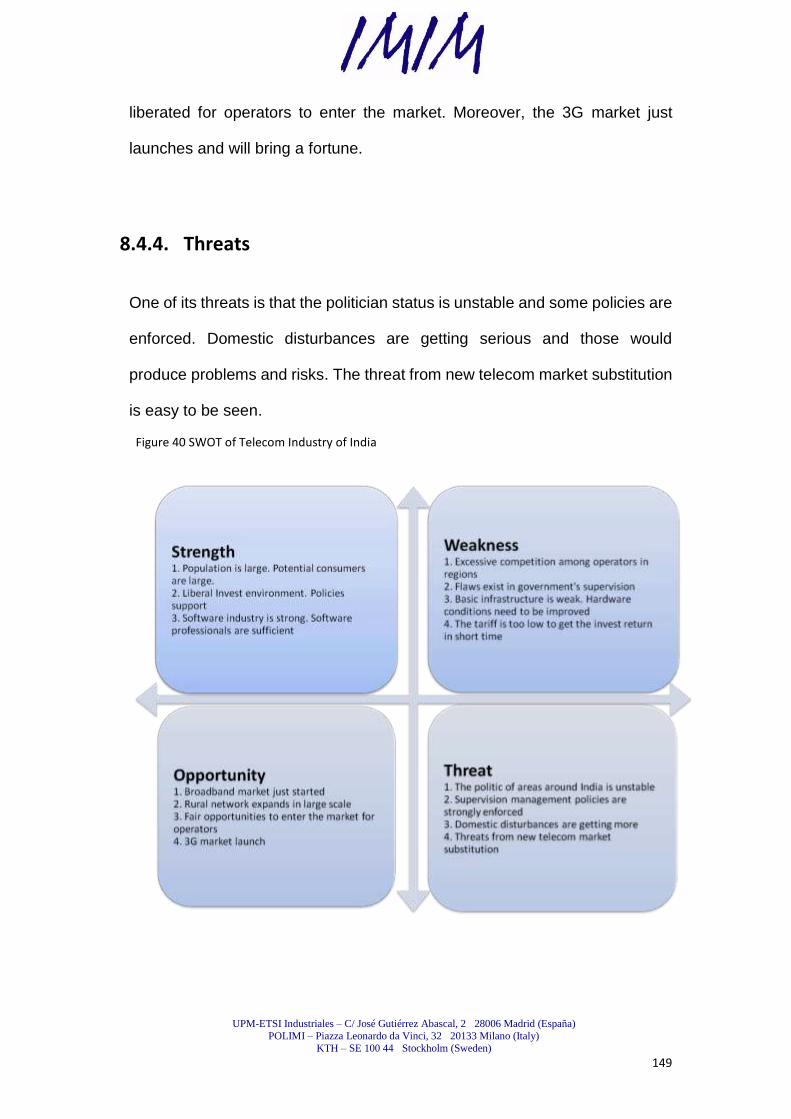
UPM-ETSI Industriales – C/ José Gutiérrez Abascal, 2 28006 Madrid (España)
POLIMI – Piazza Leonardo da Vinci, 32 20133 Milano (Italy)
KTH – SE 100 44 Stockholm (Sweden)
149
liberated for operators to enter the market. Moreover, the 3G market just
launches and will bring a fortune.
8.4.4. Threats
One of its threats is that the politician status is unstable and some policies are
enforced. Domestic disturbances are getting serious and those would
produce problems and risks. The threat from new telecom market substitution
is easy to be seen.
Figure 40 SWOT of Telecom Industry of India
UPM-ETSI Industriales – C/ José Gutiérrez Abascal, 2 28006 Madrid (España)
POLIMI – Piazza Leonardo da Vinci, 32 20133 Milano (Italy)
KTH – SE 100 44 Stockholm (Sweden)
150
8.5. SWOT Analysis of Singapore Telecom
Industry
8.5.1. Strengths
One of its strengths of telecom industry of Singapore is that it has strong
market position in Asia and has expanded the business in many regions in
Asia. It is very successful in Australia. Then, Singapore owns a lot of capitals
and keeps seeking opportunities to invest in telecom industry. It has
interested in many projects of implementation of optical cables or satellites
over all world. Next, it has the efficient government which acts many policies
for supporting the ICT industry. Singapore also has put efforts on developing
their work force for ICT. Generally, they can offer high class of services and
advanced technologies. Moreover, Singapore is in the important position in
Asia and now it is the substantial financial and trade center in Pacific Asia.
8.5.2. Weaknesses
One of the its weaknesses is that high dependence on other countries. The
GDP could be serious influenced by the business of other regions outside of
Singapore. The variables are risky and not easy to be controlled. The
penetration rate of mobile market has reached to 145%. (IDA Singapore,
2011) It is too mature to grow in the future. Nevertheless, the competition is
quite intense. Another weakness is that Singapore has insufficient work
force of ICT industry. It needs to attract foreigners to work in Singapore or
UPM-ETSI Industriales – C/ José Gutiérrez Abascal, 2 28006 Madrid (España)
POLIMI – Piazza Leonardo da Vinci, 32 20133 Milano (Italy)
KTH – SE 100 44 Stockholm (Sweden)
151
outsource. The policies in Singapore seem strong and there may be risky to
invest there.
8.5.3. Opportunities
One of its opportunities is that alliance with global wireless. The government
acts the plan‖ iN2015‖ for developing the high speed network in Singapore.
Its infrastructure could be developed well. Since the telecom industry is
strong in Singapore, it could cooperate with the international organization for
invest some projects to develop the ICT or with international carriers.
8.5.4. Threats
One of its threats is that it highly depended on the markets in other regions
in Asia and even these are larger than its domestic market. It has the
potential risks. The other Asian countries grow very fast and those countries
may have the chance to lead the Asia such as China, India, Korea and so on.
They are also developing their ICT industries hard. These countries could be
threats to Singapore. Singapore has the problem of the inflation. It offers the
liberalized environment and it leads many international large telecom
companies enter the market for sharing the market. Singapore still does not
have enough experiences on developing the mature markets such as the
region Europe.
Figure 41 SWOT of Telecom Industry of Singapore
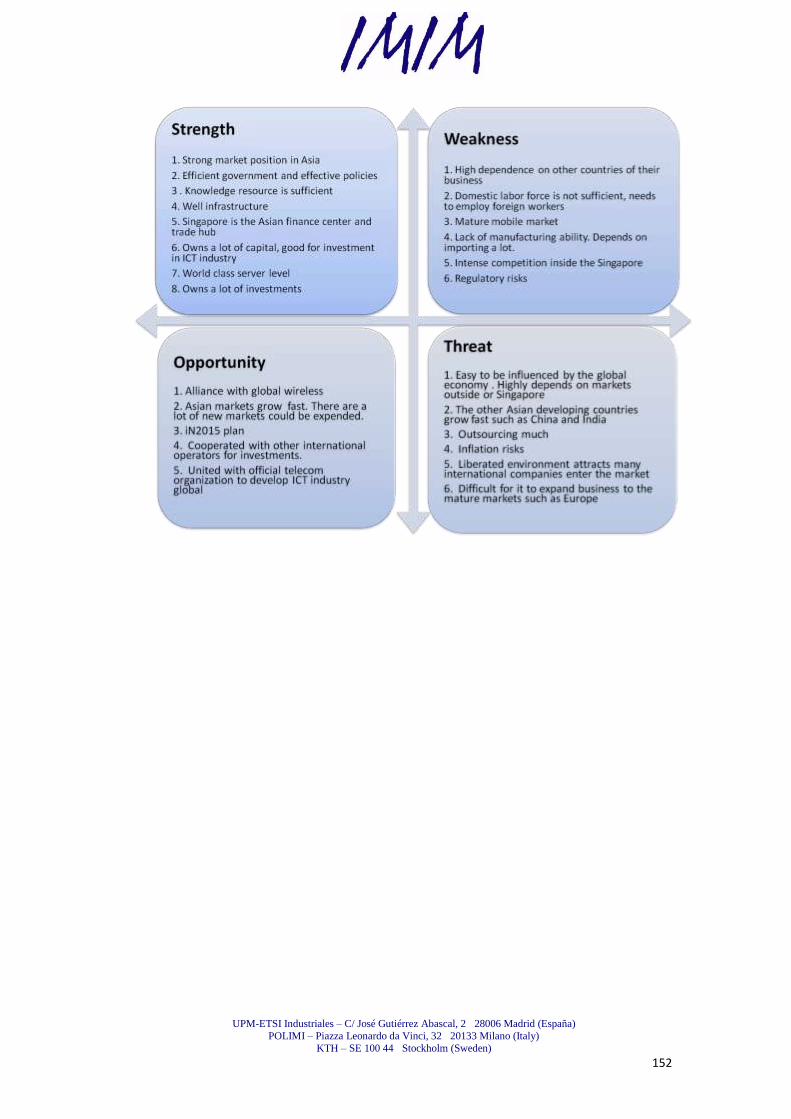
UPM-ETSI Industriales – C/ José Gutiérrez Abascal, 2 28006 Madrid (España)
POLIMI – Piazza Leonardo da Vinci, 32 20133 Milano (Italy)
KTH – SE 100 44 Stockholm (Sweden)
152
UPM-ETSI Industriales – C/ José Gutiérrez Abascal, 2 28006 Madrid (España)
POLIMI – Piazza Leonardo da Vinci, 32 20133 Milano (Italy)
KTH – SE 100 44 Stockholm (Sweden)
153
8.6. SWOT Analysis of Thailand Telecom
Industry
8.6.1. Strengths
One of its strengths is that the government policies to promote ICT. In these
years, the government plan to develop the ICT industry and to be more
competitive in the global environment. It nurtures more technology
professionals and graduates. In the urban area, the infrastructure developed
very well such as the city Bangkok which is very international and capable to
connect to other networks. The official telecommunication authority releases
licenses to some small scale operators. Hence, those carriers could have
the chance to develop.
8.6.2. Weaknesses
One of the Thai telecom industry‘s weaknesses is that the budget allocation
of education is unbalance in different regions. Particularly, scarcity of the
knowledge resource exists in the remote areas include hardware or teachers.
The manpower of ICT industry is not sufficient. Moreover, the language skill
is a weakness for Thailand to be competitive in the international environment.
One serious weakness may high damage its development of
telecommunication industry is that the process of audition of new licenses is
not very transparent. There are still a lot of power behind manipulate the
operation unfairly to the public.
UPM-ETSI Industriales – C/ José Gutiérrez Abascal, 2 28006 Madrid (España)
POLIMI – Piazza Leonardo da Vinci, 32 20133 Milano (Italy)
KTH – SE 100 44 Stockholm (Sweden)
154
8.6.3. Opportunities
One of Thai telecom industry‘s opportunities is that MNP just launched and
also 3G is going to be realized in the near future. The market share will be
relocated and this may bring some big change of the Thai telecom market.
In these years, many foreign companies invest in Thailand and Thailand
has produced and exported high percentage of its GDP. The electronic
industry has importance position in its national industrial structure. Then,
Thailand highly depends on international trade business. For the need of
being competitive, the ICT demand such as video conference, VoIP phone,
and broadband network increased for assisting the other industries‘
development. The tourism is also helpful for developing the ICT industry
because it needs the well equipped network for communicating with the
external. Moreover, the free trade agreements expedite the trade in Asian
area.
8.6.4. Threats
One of its threats is that other neighbor Asian countries have developed
faster than Thailand. Thailand is one of latest Asian countries to develop its
telecom technologies. Due to its unstable politician status and also the
coming election, there is almost no progress of telecommunication because
these operators or regulators know the coming election is a variable. The
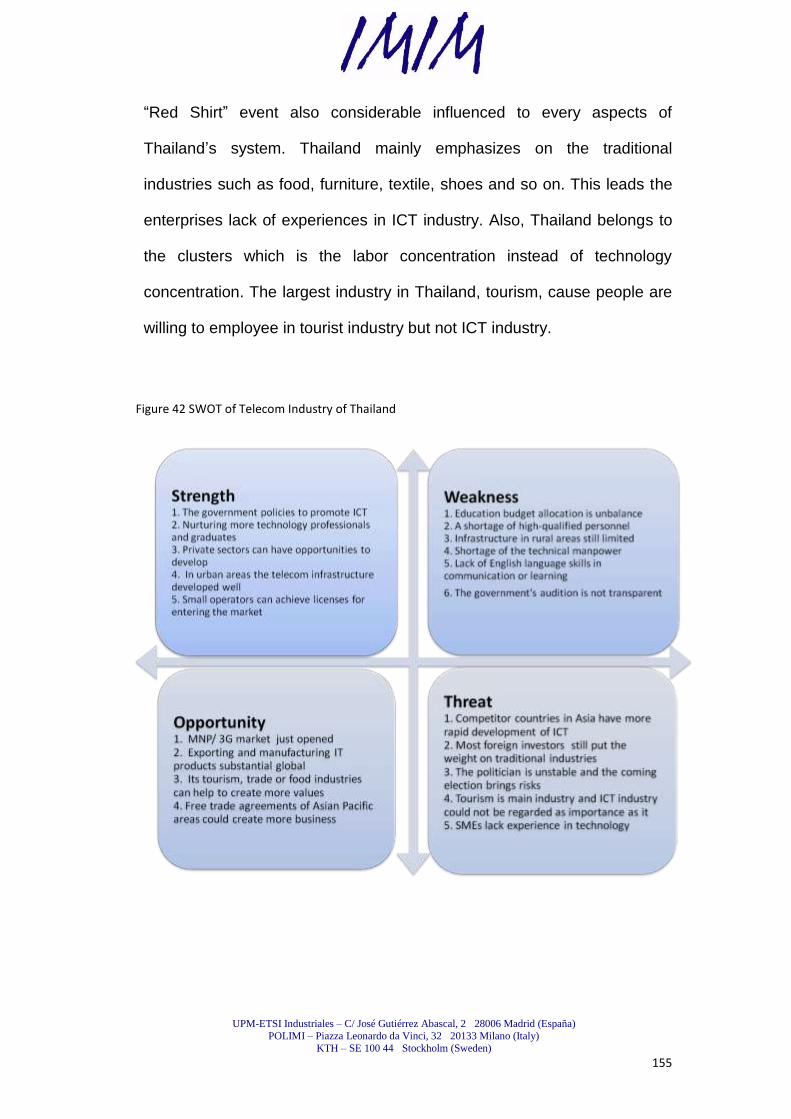
UPM-ETSI Industriales – C/ José Gutiérrez Abascal, 2 28006 Madrid (España)
POLIMI – Piazza Leonardo da Vinci, 32 20133 Milano (Italy)
KTH – SE 100 44 Stockholm (Sweden)
155
―Red Shirt‖ event also considerable influenced to every aspects of
Thailand‘s system. Thailand mainly emphasizes on the traditional
industries such as food, furniture, textile, shoes and so on. This leads the
enterprises lack of experiences in ICT industry. Also, Thailand belongs to
the clusters which is the labor concentration instead of technology
concentration. The largest industry in Thailand, tourism, cause people are
willing to employee in tourist industry but not ICT industry.
Figure 42 SWOT of Telecom Industry of Thailand

UPM-ETSI Industriales – C/ José Gutiérrez Abascal, 2 28006 Madrid (España)
POLIMI – Piazza Leonardo da Vinci, 32 20133 Milano (Italy)
KTH – SE 100 44 Stockholm (Sweden)
156
8.7. The Comparison of India, Singapore and
Thailand
In this section, the comparison of the above three countries present by the
basic, knowledge recourse, human resource, and so on.
The comparison of the basic of the three countries is as the below table 12.
India has the largest areas and population among them. India has more
resource innate than the other two countries. Moreover, English as one of the
official languages of India and Singapore. It is one of competitive advantages
to be international.
Table 12 The Comparison of the basic of India, Singapore and Thailand
As to the knowledge resource, Thailand has the lowest ratio of pupil and
teacher as 16. That means every 16 students can be instructed by one
teacher in average. At literature rate, Singapore has the highest rate 100%.
That presents that Singaporeans over 15 years old can read. India has some

UPM-ETSI Industriales – C/ José Gutiérrez Abascal, 2 28006 Madrid (España)
POLIMI – Piazza Leonardo da Vinci, 32 20133 Milano (Italy)
KTH – SE 100 44 Stockholm (Sweden)
157
problem of the literature rate and it is only at 81%. Thailand is at 3.8% and
20.5% of public expenditure on education as percentage of GDP and
percentage of total government expenditure. Education on Technology and
Science of the statistics of 2007 shows that Singapore has 6,088 per 1 million
inhabitants as researchers and 2.52% of expenditure on R&D of its GDP,
follow by Thailand as 311, 0.25% and India 137, 0.8%. Singapore invest the
more in research and development among these three countries. See Table
13 The comparison of knowledge resource of India, Singapore and Thailand
Table 13 The Comparison of Knowledge Resource of India, Singapore and Thailand
From the next table, we can see that human resources of ICT in these three
countries, India has the largest population at 2.1 million in ICT industry follow
by Thailand 0.37 million and Singapore 0.14 million. Thailand and Singapore
have low unemployment rate at 1.2% and 1.9%, respectively. Table 14 The
comparison of human resource of India, Singapore and Thailand.
Table 14 The Comparison of Human Resource of India, Singapore and Thailand
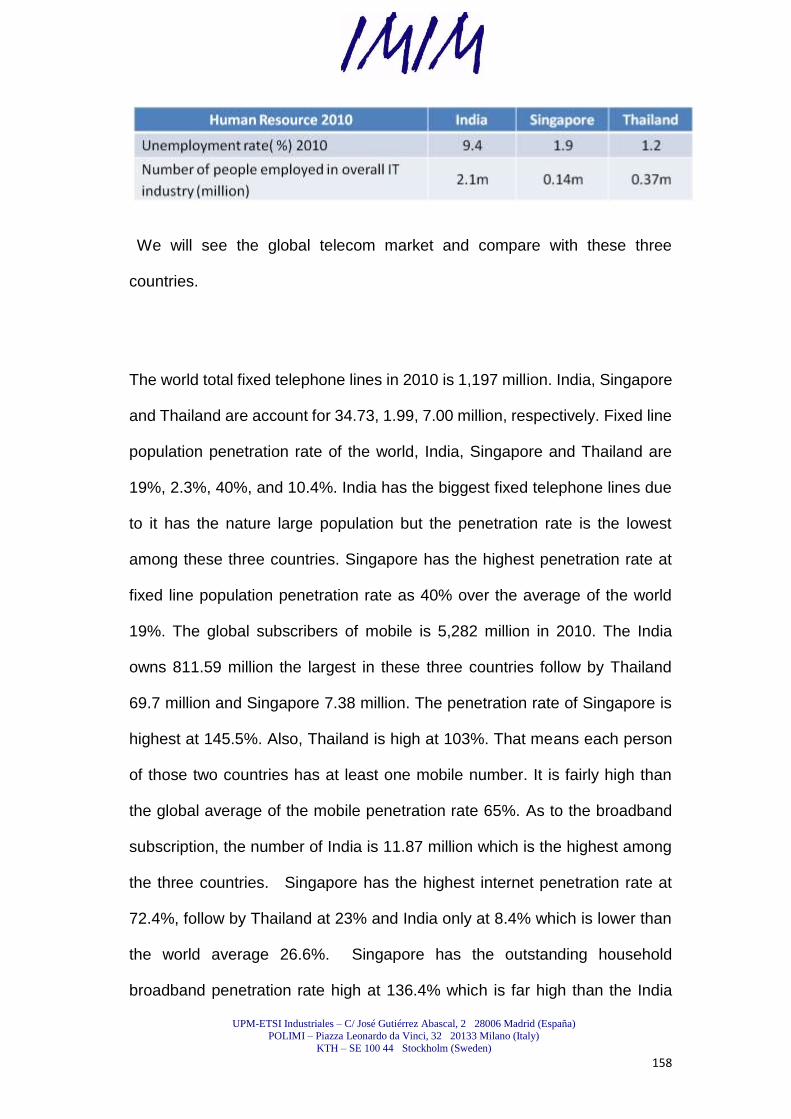
UPM-ETSI Industriales – C/ José Gutiérrez Abascal, 2 28006 Madrid (España)
POLIMI – Piazza Leonardo da Vinci, 32 20133 Milano (Italy)
KTH – SE 100 44 Stockholm (Sweden)
158
We will see the global telecom market and compare with these three
countries.
The world total fixed telephone lines in 2010 is 1,197 million. India, Singapore
and Thailand are account for 34.73, 1.99, 7.00 million, respectively. Fixed line
population penetration rate of the world, India, Singapore and Thailand are
19%, 2.3%, 40%, and 10.4%. India has the biggest fixed telephone lines due
to it has the nature large population but the penetration rate is the lowest
among these three countries. Singapore has the highest penetration rate at
fixed line population penetration rate as 40% over the average of the world
19%. The global subscribers of mobile is 5,282 million in 2010. The India
owns 811.59 million the largest in these three countries follow by Thailand
69.7 million and Singapore 7.38 million. The penetration rate of Singapore is
highest at 145.5%. Also, Thailand is high at 103%. That means each person
of those two countries has at least one mobile number. It is fairly high than
the global average of the mobile penetration rate 65%. As to the broadband
subscription, the number of India is 11.87 million which is the highest among
the three countries. Singapore has the highest internet penetration rate at
72.4%, follow by Thailand at 23% and India only at 8.4% which is lower than
the world average 26.6%. Singapore has the outstanding household
broadband penetration rate high at 136.4% which is far high than the India
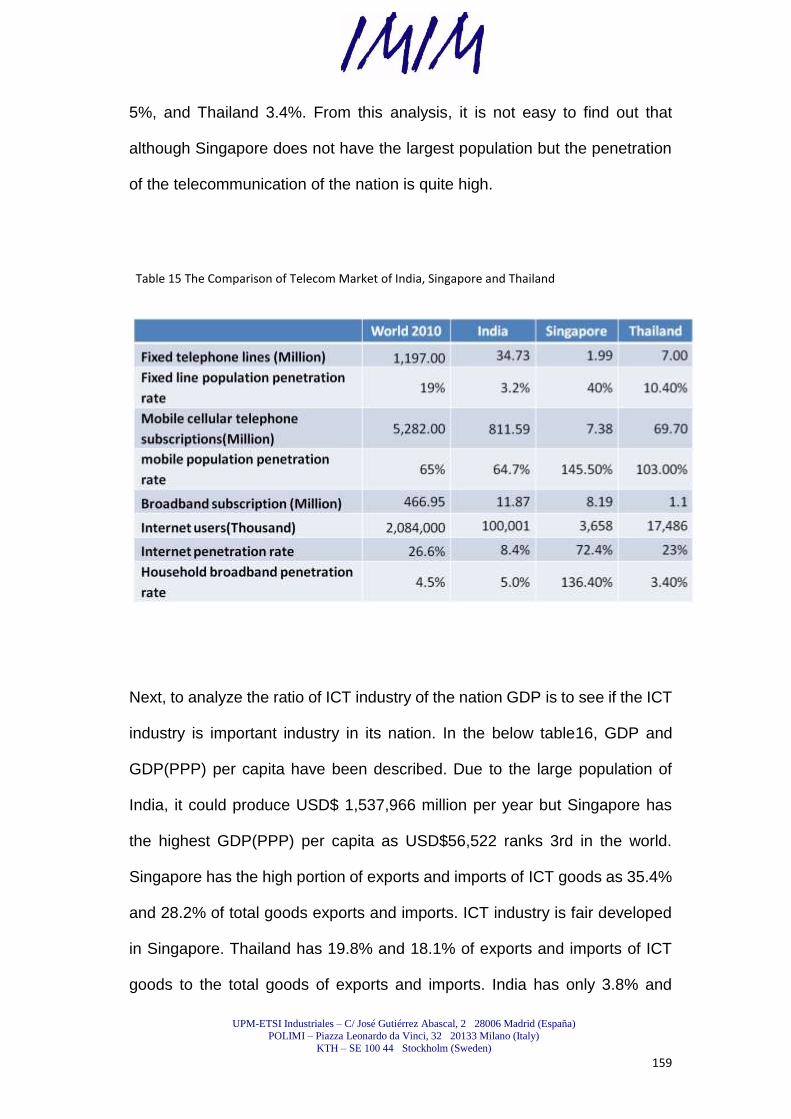
UPM-ETSI Industriales – C/ José Gutiérrez Abascal, 2 28006 Madrid (España)
POLIMI – Piazza Leonardo da Vinci, 32 20133 Milano (Italy)
KTH – SE 100 44 Stockholm (Sweden)
159
5%, and Thailand 3.4%. From this analysis, it is not easy to find out that
although Singapore does not have the largest population but the penetration
of the telecommunication of the nation is quite high.
Table 15 The Comparison of Telecom Market of India, Singapore and Thailand
Next, to analyze the ratio of ICT industry of the nation GDP is to see if the ICT
industry is important industry in its nation. In the below table16, GDP and
GDP(PPP) per capita have been described. Due to the large population of
India, it could produce USD$ 1,537,966 million per year but Singapore has
the highest GDP(PPP) per capita as USD$56,522 ranks 3rd in the world.
Singapore has the high portion of exports and imports of ICT goods as 35.4%
and 28.2% of total goods exports and imports. ICT industry is fair developed
in Singapore. Thailand has 19.8% and 18.1% of exports and imports of ICT
goods to the total goods of exports and imports. India has only 3.8% and
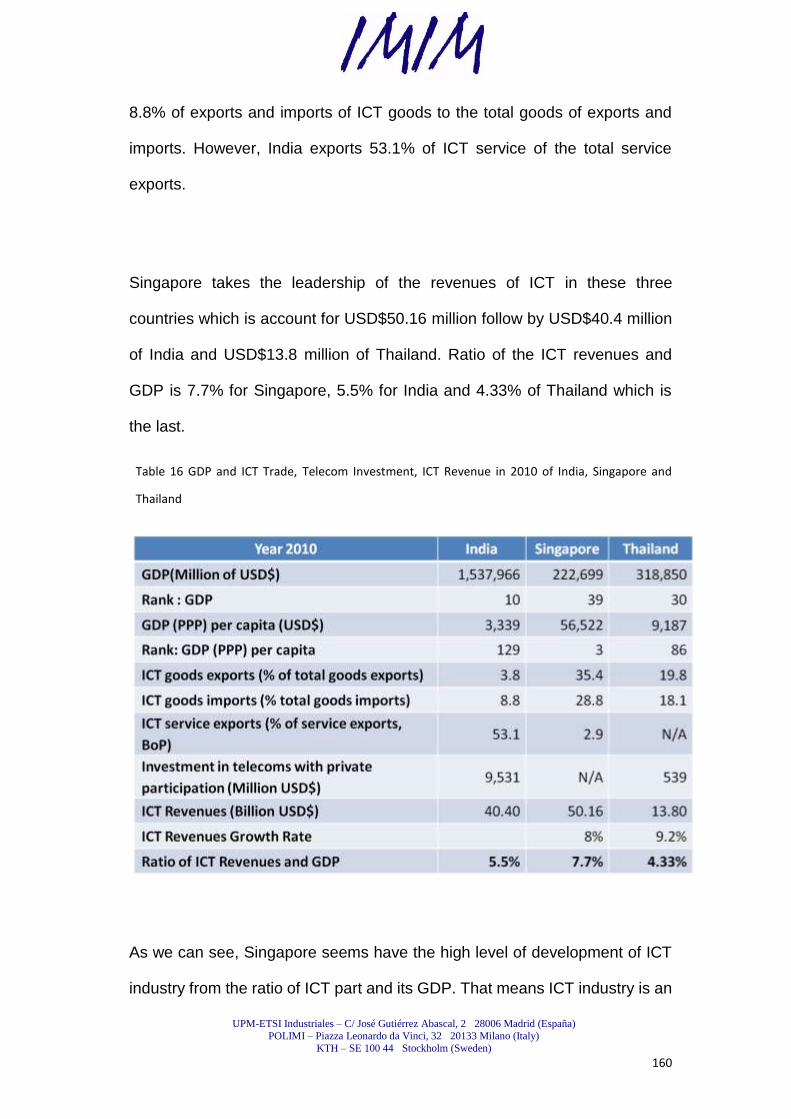
UPM-ETSI Industriales – C/ José Gutiérrez Abascal, 2 28006 Madrid (España)
POLIMI – Piazza Leonardo da Vinci, 32 20133 Milano (Italy)
KTH – SE 100 44 Stockholm (Sweden)
160
8.8% of exports and imports of ICT goods to the total goods of exports and
imports. However, India exports 53.1% of ICT service of the total service
exports.
Singapore takes the leadership of the revenues of ICT in these three
countries which is account for USD$50.16 million follow by USD$40.4 million
of India and USD$13.8 million of Thailand. Ratio of the ICT revenues and
GDP is 7.7% for Singapore, 5.5% for India and 4.33% of Thailand which is
the last.
Table 16 GDP and ICT Trade, Telecom Investment, ICT Revenue in 2010 of India, Singapore and
Thailand
As we can see, Singapore seems have the high level of development of ICT
industry from the ratio of ICT part and its GDP. That means ICT industry is an
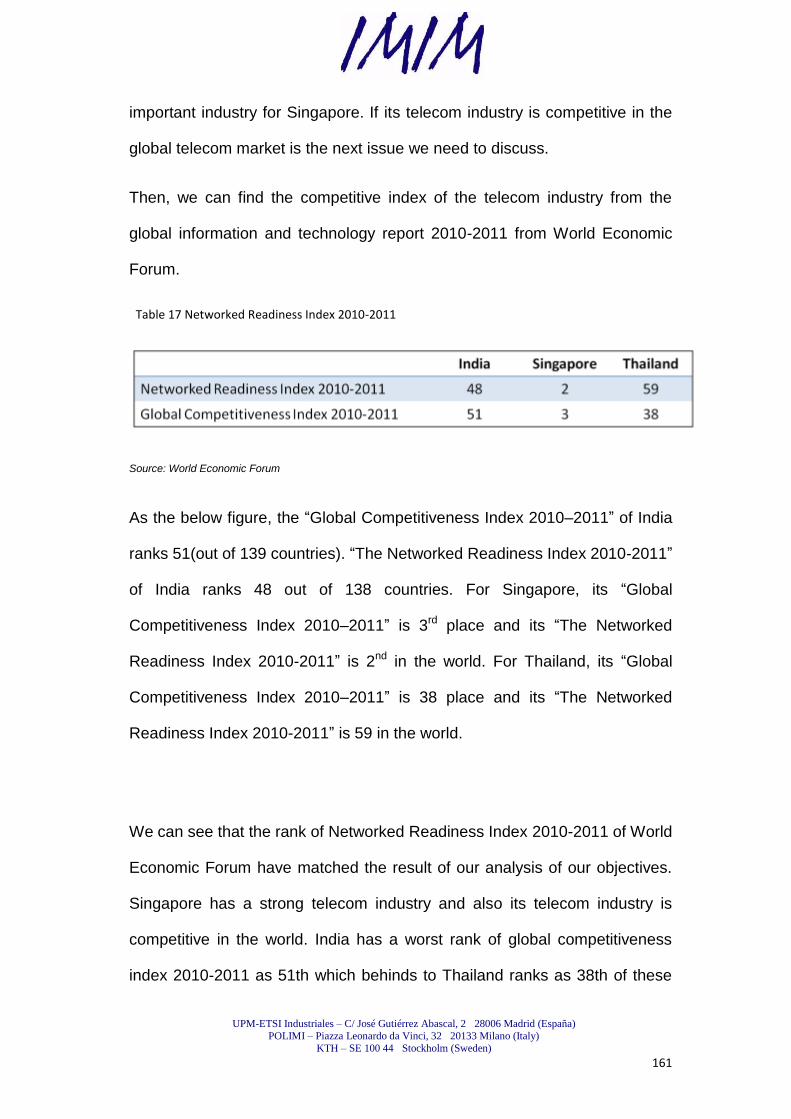
UPM-ETSI Industriales – C/ José Gutiérrez Abascal, 2 28006 Madrid (España)
POLIMI – Piazza Leonardo da Vinci, 32 20133 Milano (Italy)
KTH – SE 100 44 Stockholm (Sweden)
161
important industry for Singapore. If its telecom industry is competitive in the
global telecom market is the next issue we need to discuss.
Then, we can find the competitive index of the telecom industry from the
global information and technology report 2010-2011 from World Economic
Forum.
Table 17 Networked Readiness Index 2010-2011
Source: World Economic Forum
As the below figure, the ―Global Competitiveness Index 2010–2011‖ of India
ranks 51(out of 139 countries). ―The Networked Readiness Index 2010-2011‖
of India ranks 48 out of 138 countries. For Singapore, its ―Global
Competitiveness Index 2010–2011‖ is 3rd place and its ―The Networked
Readiness Index 2010-2011‖ is 2nd in the world. For Thailand, its ―Global
Competitiveness Index 2010–2011‖ is 38 place and its ―The Networked
Readiness Index 2010-2011‖ is 59 in the world.
We can see that the rank of Networked Readiness Index 2010-2011 of World
Economic Forum have matched the result of our analysis of our objectives.
Singapore has a strong telecom industry and also its telecom industry is
competitive in the world. India has a worst rank of global competitiveness
index 2010-2011 as 51th which behinds to Thailand ranks as 38th of these
UPM-ETSI Industriales – C/ José Gutiérrez Abascal, 2 28006 Madrid (España)
POLIMI – Piazza Leonardo da Vinci, 32 20133 Milano (Italy)
KTH – SE 100 44 Stockholm (Sweden)
162
objective countries we research. However, the ―Networked Readiness Index
2010-2011‖ of India ranks 48th exceeds Thailand ranks 59th. That means
although Thailand has high percentage of trade but it has not focus on
telecom industry as its main industry. From the structure of industries of
Thailand, the main industry is the tourism instead of telecom. On the contrary,
India has bad performance of its trade but it has put more weights on
development of ICT industry. We can see that from the above analysis. From
this, we can conduct that the competitiveness of an industry of a nation is
related to the competitiveness of the industry‘s global competitiveness. If it is
strong in its own country, it can devolve the competitiveness ability in the
global environment.
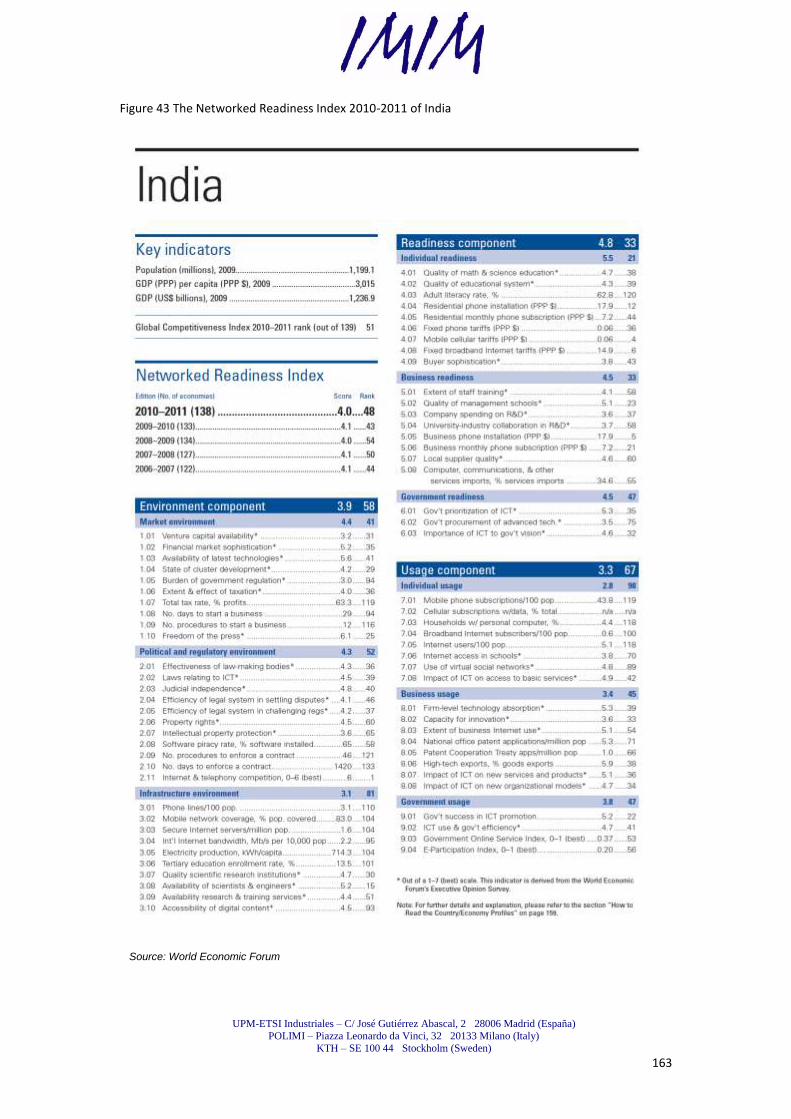
UPM-ETSI Industriales – C/ José Gutiérrez Abascal, 2 28006 Madrid (España)
POLIMI – Piazza Leonardo da Vinci, 32 20133 Milano (Italy)
KTH – SE 100 44 Stockholm (Sweden)
163
Figure 43 The Networked Readiness Index 2010-2011 of India
Source: World Economic Forum
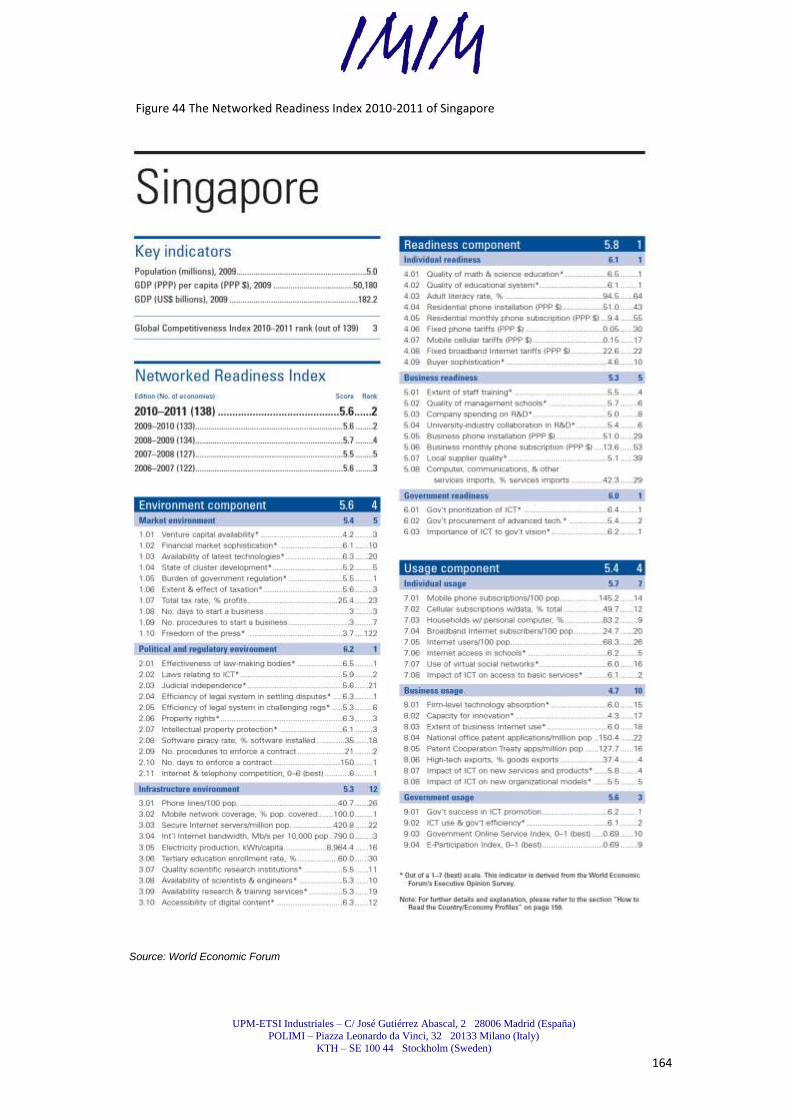
UPM-ETSI Industriales – C/ José Gutiérrez Abascal, 2 28006 Madrid (España)
POLIMI – Piazza Leonardo da Vinci, 32 20133 Milano (Italy)
KTH – SE 100 44 Stockholm (Sweden)
164
Figure 44 The Networked Readiness Index 2010-2011 of Singapore
Source: World Economic Forum
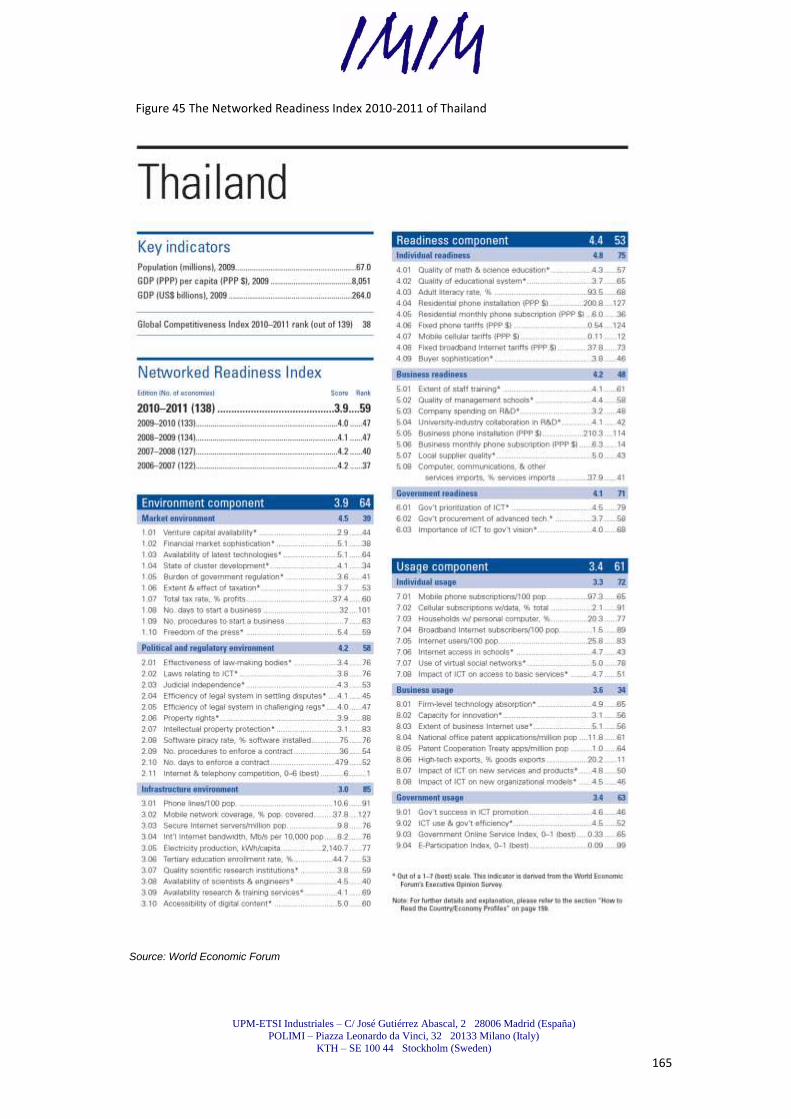
UPM-ETSI Industriales – C/ José Gutiérrez Abascal, 2 28006 Madrid (España)
POLIMI – Piazza Leonardo da Vinci, 32 20133 Milano (Italy)
KTH – SE 100 44 Stockholm (Sweden)
165
Figure 45 The Networked Readiness Index 2010-2011 of Thailand
Source: World Economic Forum
UPM-ETSI Industriales – C/ José Gutiérrez Abascal, 2 28006 Madrid (España)
POLIMI – Piazza Leonardo da Vinci, 32 20133 Milano (Italy)
KTH – SE 100 44 Stockholm (Sweden)
166
9. Conclusion and Recommendations
In this paper it has presented extensive the fact of the telecom markets of
India, Singapore and Thailand. It also has analyzed the markets by the
SWOT and diamond theory to understand conditions of countries at six
determinants include factors, demands, related supporting industries,
strategies and rivalry, government and chance, and their strengthens,
weaknesses, opportunities and threats. In this chapter it will conclude the
results found and to make a few suggested strategies to the main audience.
This part will describe the forecast of these three telecom markets and give
recommendations.
9.1. India Telecom Market
9.1.1. Data Market Increases Substantial, but Voice Services
Still the Main Foundation of Revenue:
In the future, the data business leads the telecom industry to grow fast.
Besides this, the video service occupies a part of market. When the wireless
or broadband expands to the enough degree, operators could offer users in a
way of economical and large scaled.
Although the voice business will decrease to the second third of total
revenues of telecom industry in 2020, voice business still take the biggest
share of telecom revenues. The decrease is due to the increase of the
UPM-ETSI Industriales – C/ José Gutiérrez Abascal, 2 28006 Madrid (España)
POLIMI – Piazza Leonardo da Vinci, 32 20133 Milano (Italy)
KTH – SE 100 44 Stockholm (Sweden)
167
revenues of data and content service, and also the decrease of the telephone
or mobile rate per minute. Video telecom continues developing but it still
remains small portion of the total.
Even if the fixed or mobile data provide the business of internet voice
telephone which is going to take more market share in the future, the mobile
voice service still lead the telecom market.
9.1.2. Wireless Will Take the Leadership In the Network
Business
The network market will depend on the wireless a lot in the future. It is
dominated by 3G or 4G technology in the cities, and combined with FTTx and
DSL or cable TV. In the rural region, it will depend on wireless including 2G
and 3G but not 4G more than fixed line. The capacity of the core network
could be advance by the upgrade of IP and optical cable.
9.1.3. Integrated Operators Show Up
The data operators still exist in the market in the future. However, the roles of
participants in the telecom market would be re-positioned follows by the
situation of dramatically increasing of data, content, and applications.
Integrated operators are necessary for the whole telecom industry. Integrated
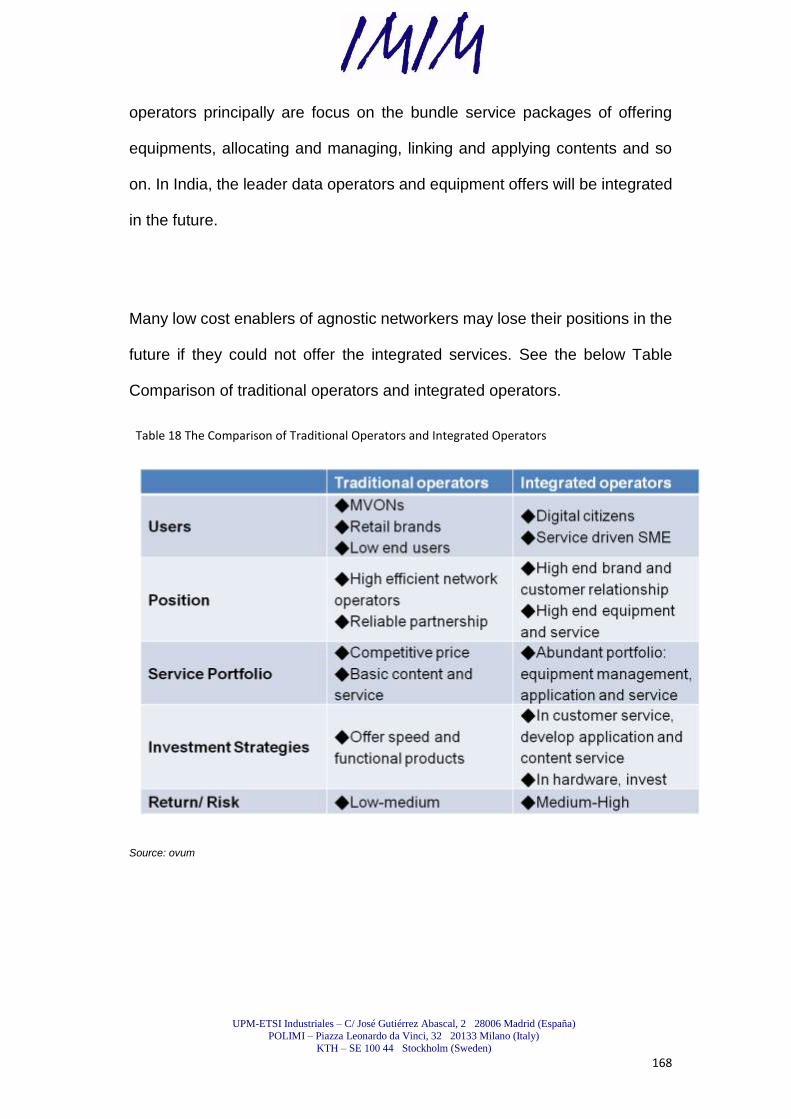
UPM-ETSI Industriales – C/ José Gutiérrez Abascal, 2 28006 Madrid (España)
POLIMI – Piazza Leonardo da Vinci, 32 20133 Milano (Italy)
KTH – SE 100 44 Stockholm (Sweden)
168
operators principally are focus on the bundle service packages of offering
equipments, allocating and managing, linking and applying contents and so
on. In India, the leader data operators and equipment offers will be integrated
in the future.
Many low cost enablers of agnostic networkers may lose their positions in the
future if they could not offer the integrated services. See the below Table
Comparison of traditional operators and integrated operators.
Table 18 The Comparison of Traditional Operators and Integrated Operators
Source: ovum
UPM-ETSI Industriales – C/ José Gutiérrez Abascal, 2 28006 Madrid (España)
POLIMI – Piazza Leonardo da Vinci, 32 20133 Milano (Italy)
KTH – SE 100 44 Stockholm (Sweden)
169
9.1.4. Digital Citizens and Service Driven Enterprises are the
Keys Although They Are in a Small Amount
Digital citizens will build a relationship in ways of safe, easy, and cost
predictable with integration telecom operators. Operators are going to offer
the bundle packages to these digital citizens.
Part of service driven enterprises are going to cooperate with telecom
operators by offering service driven business. Those dedicate on expanding
the scale of ICT industry. Ovum predicts that digital citizens merely are in
account of 20% of total users in 2002. (Ovum, 2011)
9.1.5. The Driver of Dramatically Change – Economy Growth
In the next few years, the real GDP of India will be close to 8%. (CIA, 2011) In
around 2020 or following ten years, India could almost catch up with the
mature markets such as markets of Europe or North America at economy
growth.
The main presentation of economical growth is on middle class of India.
However, the most of the bottom levels of pyramid are satisfied with the basic
services.
UPM-ETSI Industriales – C/ José Gutiérrez Abascal, 2 28006 Madrid (España)
POLIMI – Piazza Leonardo da Vinci, 32 20133 Milano (Italy)
KTH – SE 100 44 Stockholm (Sweden)
170
9.1.6. The Market of Small and Medium Enterprises
The market for the small and medium enterprises will form 3 types:
―consolidated‖, ―mobile only‖, and ―price focus‖.
It is around 20% of the small and medium enterprises whish will integrate the
IT and telecom services in 2020. (Ovum, 2011) For telecom operators, the
market of ―consolidated‖ type is the most attractive market. Because these
enterprises will take more advanced technology and give more and more
business to the telecom operators.
The biggest portion about 50% of Indian SME (Small and Medium
Enterprises) (Ovum, 2011)are get used to work by facilities of mobile service.
Those do not like to purchase the fixed telecom services.
It is about 30% of SME (Ovum, 2011) which is in the category of price focus.
Those are keeping search the lowest cost of telecom system. Part of them
would choose the ―over the top‖ solution such as ―Skype‖.
9.1.7. Three Orientations of the Enterprise Clients
There are three groups of companies formed in the future by the demand and
purchase model: ―service driven‖, ―commodity buyers‖ and ―mavericks‖.
UPM-ETSI Industriales – C/ José Gutiérrez Abascal, 2 28006 Madrid (España)
POLIMI – Piazza Leonardo da Vinci, 32 20133 Milano (Italy)
KTH – SE 100 44 Stockholm (Sweden)
171
In India, around 25% of bigger companies will be in the category of service
driven. For operators, those are the most attractive business clients since
they generally contract with service driven model. Those companies put on
the importance on the reliability and scale of providers. This type of business
will stimulate the growth of the market of sub contract business.
The 40% of companies are ―commodity buyers‖. Those companies choose
the low cost technologies although they may have the relationship with the
sub contract providers. Cost is the priority for them to choose the telecom
solution.
The 35% of companies belong to ―mavericks‖. Those companies choose the
non assigned service. Although the quality of these services is limited, they
still use that.
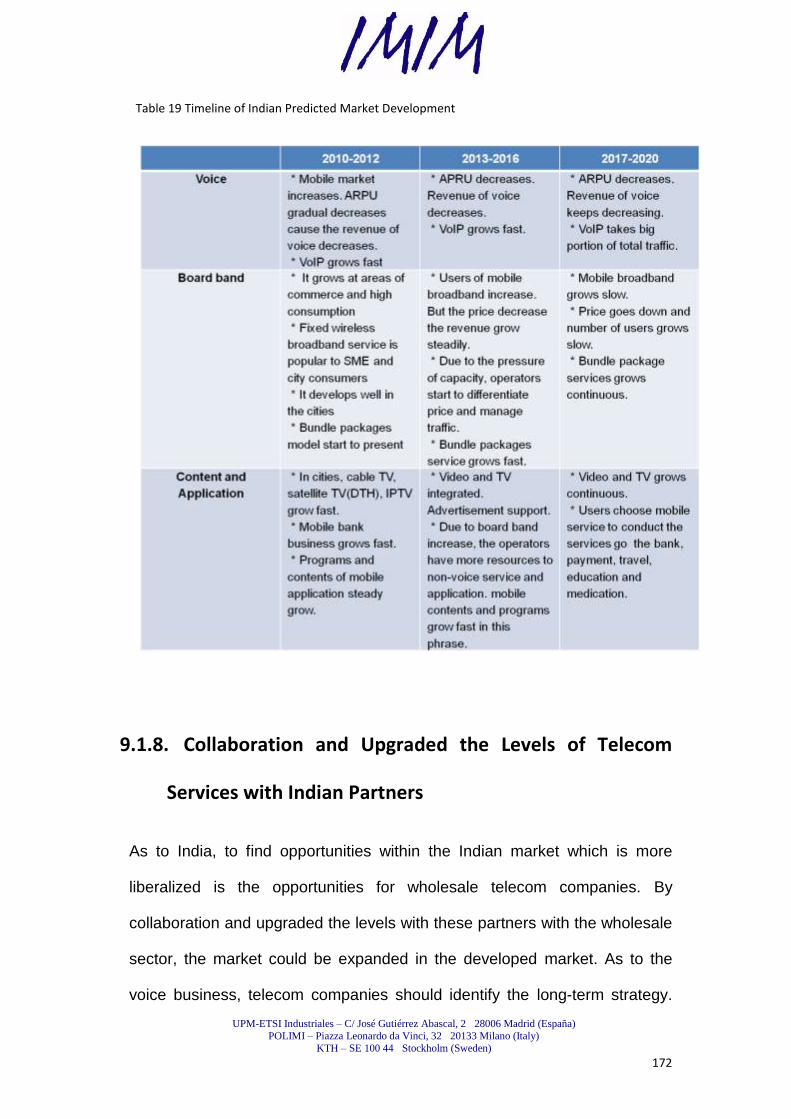
UPM-ETSI Industriales – C/ José Gutiérrez Abascal, 2 28006 Madrid (España)
POLIMI – Piazza Leonardo da Vinci, 32 20133 Milano (Italy)
KTH – SE 100 44 Stockholm (Sweden)
172
Table 19 Timeline of Indian Predicted Market Development
9.1.8. Collaboration and Upgraded the Levels of Telecom
Services with Indian Partners
As to India, to find opportunities within the Indian market which is more
liberalized is the opportunities for wholesale telecom companies. By
collaboration and upgraded the levels with these partners with the wholesale
sector, the market could be expanded in the developed market. As to the
voice business, telecom companies should identify the long-term strategy.

UPM-ETSI Industriales – C/ José Gutiérrez Abascal, 2 28006 Madrid (España)
POLIMI – Piazza Leonardo da Vinci, 32 20133 Milano (Italy)
KTH – SE 100 44 Stockholm (Sweden)
173
The low fare of rate could be the point to take more market share. Enhancing
global network-service quality and customer satisfaction will be more
important than the low price.
9.1.9. Competitive in the Telecom Market of India. New
Merges Will Be an Important Strategy
The intense competition in India has forced these operators to reduce
tariffs to be sustainable in the industry. Therefore, operators need to seek
new opportunities for creating income now. New merging is an important
strategy.
9.1.10. The Rate Should Be In a Stability In Indian Market
The rate should be stabile, with the current ARPU below US $ 2 dollar, (TRAI,
2011) which is not expected to be further cuts in mobile tariffs by
the operators in the future.
9.1.11. Market Consolidation Situation
The current saturation will lead to further mergers in 2011. A candidate of
merging is Idea Cellular.

UPM-ETSI Industriales – C/ José Gutiérrez Abascal, 2 28006 Madrid (España)
POLIMI – Piazza Leonardo da Vinci, 32 20133 Milano (Italy)
KTH – SE 100 44 Stockholm (Sweden)
174
9.1.12. 3G Launch:
Operators have not been launched until the end of 2010. The government
has warned spectrum blocks released in stages causing dissatisfaction in
any new players.
9.1.13. Mobile Number of Portability Will Occur in Stages.
Voice & Data Packages: In 2010, it could be ended by the first voice
and data packets by 5 major operators.
Bringing global coverage and international services to market, and also
expanding infrastructure, connectivity and access will be important strategy
for the telecom market expansion in the future.
9.2. Singapore Telecom Market
9.2.1. Sufficient Capital in Singapore:
Singapore has a large of capital for investment. A country could seek for
Singapore‘s investment and aim to develop its industry by cooperation.
UPM-ETSI Industriales – C/ José Gutiérrez Abascal, 2 28006 Madrid (España)
POLIMI – Piazza Leonardo da Vinci, 32 20133 Milano (Italy)
KTH – SE 100 44 Stockholm (Sweden)
175
9.2.2. Mobile Integrated Services in the Emerging
The 3G subscription accounts for 66% of the total. Singapore develops fast
and it could step in to the mobile banking sector faster than most of countries
in the world.
9.2.3. Singapore is the 2nd at the Rank of Global Information
Technology Report (GITR) 2010-2011
The Networked Readiness Index 2010–2011 of Singapore ranks 2nd in the
world (World Economic Forum, 2011) which is only behind Sweden. The
Network Readiness Index has been measuring the degree leverage
information and communication technologies (ICT) for enhanced
competitiveness. The overall environment for ICT, including innovation, market
conditions, regulatory framework, and infrastructure are developed quite well.
9.2.4. Next Generation Nationwide Broadband Network is
the Main Point of Development of ICT of Singapore.
―N2015 ― plan (IDA Singapore, 2011): Singapore expects to have the
coverage of Fiber-to-the-Premises — FTTP of 100% in 2013. Singapore has
the strong political and regulatory environment. It is quite efficient to develop
the ICT industry than other countries. Also, the good education system and
training programs contribute to this industry.
UPM-ETSI Industriales – C/ José Gutiérrez Abascal, 2 28006 Madrid (España)
POLIMI – Piazza Leonardo da Vinci, 32 20133 Milano (Italy)
KTH – SE 100 44 Stockholm (Sweden)
176
9.2.5. Expansion to Pacific Asia Fast
Singaporean domestic market is small but SingTel expands its business to
pacific Asia very fast. 19% of revenues is from Australia. Bharti Airtel had
the bad performance in 2010 drag SingTel's total revenues 2.3% down.
(SingTel, 2011) SingTel's performance is substantial dependent on its
external markets. It is riskyif markets with instability. However, SingTel
could lead the telecom industry and control other regions in this field in Asia
in the near future.
9.3. Thailand Telecom Market
9.3.1. To Invest in Broadband for Offsetting the Loss of Fixed
Line Market of Thailand
From the previous overview of telecom market of Thailand, the market of
fixed line presents gradually slow down in these years and this situation could
be worse in the future. At this point, telecom companies should overcome the
fact of that the decrease of revenue or margin. The voice market has grown
to a certain level and there is no much room for continuous growing. However,
we can see that from the above research the data market shows the strong
potential growth. For making up the loss of revenues of voice business,
telecom companies could put weight on the investment of data business
instead of voice business for acquiring more revenue in the future.
UPM-ETSI Industriales – C/ José Gutiérrez Abascal, 2 28006 Madrid (España)
POLIMI – Piazza Leonardo da Vinci, 32 20133 Milano (Italy)
KTH – SE 100 44 Stockholm (Sweden)
177
9.3.2. To Increase the Capacity for Meeting the Needs of
Internet Backbone and International Bandwidth
Internet demand increases noticeably in the telecom market of Thailand.
Besides, there is also a large demand of international bandwidth. For this, the
telecom companies should devote in expanding the capacity for these
requirements.
9.3.3. To Increase the Stability and Quality of Telecom
Services Through Submarine Cables in Thailand
To increase the stability and quality of telecom services is very essential for
the wholesale business for the current competitive environment. Submarine
cables are made of optical transmit signals of telephone and internet and
their price of transmission are higher than the satellites transmission but the
level of security and privacy is relative strong. International telecom
transmission business through submarine networks has been increased and
the volume is more than which is through satellites.
9.3.4. True Group Acquired Hutchison of Thailand Going to
Change the Market Structure
The True group‘s acquisition of Hutch in Thailand in 2011 will change the

UPM-ETSI Industriales – C/ José Gutiérrez Abascal, 2 28006 Madrid (España)
POLIMI – Piazza Leonardo da Vinci, 32 20133 Milano (Italy)
KTH – SE 100 44 Stockholm (Sweden)
178
telecom market structure and expand its mobile user base. Buying 73.92% of
Hutchison CAT Wireless Multimedia (True, 2011) will make True an indirect
stakeholder of Hutchison with 800,000 customer base. Total True‘s mobile
users will increase to five percentages. The concession of True and CAT
which the license of CAT is expire in 2 years with the True's two bigger rivals,
Advanced Info Service PCL and Total Access Communication PCL, are due to
expire in 2015 and 2018, respectively, is unsecure. This acquisition came
under the condition that True has proposed to CAT that if True buys Hutchison,
CAT will terminate the Hutchison existing contract and enter a new contract
with True. If the cash flow of Hutchison could turn in positive, it would influence
the status of True and how could True solve it effectively.
Since of this deal, True turns into a nationwide 3G service provider. Also if the
True MOVE remains the same brand in the market as its marketing strategy is
another point after acquisition. The telecom market of Thailand would be
changed because of this new deal and operators should have appropriate
strategies to face this change.
9.3.5. TOT Awarded the Contract of 3G Infrastructure
Meanwhile, fellow state entity TOT also took a step forward after the firm
opened the sale of bidding documents for the e-auction of a 3G infrastructure
contract in December 2010. (TOT, 2011) TOT successfully awarded the
contract to a Samart-led consortium in January 2011 amid complaints of
discrimination from Ericsson and ZTE after they were excluded.
UPM-ETSI Industriales – C/ José Gutiérrez Abascal, 2 28006 Madrid (España)
POLIMI – Piazza Leonardo da Vinci, 32 20133 Milano (Italy)
KTH – SE 100 44 Stockholm (Sweden)
179
9.3.6. Positive Thai Telecom Reform – Mobile Number
Portability (MNP)
The Thai telecoms regulatory framework also saw some positive developments
in its reform progress. The first phase of the long-awaited mobile number
portability was successfully implemented in Bangkok on December 5
2010. Five mobile operators in Thailand including AIS, DTAC, True Move,
CAT, and TOT provide mobile number –portability services after the National
Telecommunications Commission (NTC) issue this newly approved. Thailand
has 69 million mobile phone subscribers, 91% of whom are prepaid users.
Mobile Number Portability (MNP) allows customers to retain their numbers
when changing from one operator to another. Expected market will be 1.2
million per year to use this service. (NTC, 2011) After the launch of MNP, the
number of users who request to change the network is far under the estimated
number. It only around 40,000 users in Thailand are willing to use this service
and most of the other customers are not interested in having the same
numbers in different network. The promotion of MNP will be another issue of
operators. Probably this service is contradicted to 3G service in this time and it
may be confused for customers to tell the difference. However, this
development is an big opportunity to increase their share in the highly
competitive market. MNP is the positive reform of Thailand telecom industry.
UPM-ETSI Industriales – C/ José Gutiérrez Abascal, 2 28006 Madrid (España)
POLIMI – Piazza Leonardo da Vinci, 32 20133 Milano (Italy)
KTH – SE 100 44 Stockholm (Sweden)
180
9.3.7. 3G Could Re Shape the Thai Telecom Market
The competition of mobile market in Thailand which presents the complex
commercial environment is increasingly intensive.
CAT Telecom and telecoms group True Corp get an opportunity to continue
the 3G service plan although the petition from Total Access Communication
Pcl (TAC) controlled by Norway's Telenor was filed to the Thai authority. Due
to the acquisition of CAT, True indirect achieves the 3G license. TAC doubt if
it is legal to launch 3G services by this contract.
Due to the instability cause by the new general election of Thailand in 2011,
most of operators or the related organizations are not willing to move forward.
The situation of development of 3G is still messy.
9.3.8. NBTC Starts to Running
The long-awaited 'super' regulator, the National Broadcasting and
Telecommunications Commission (NBTC) made progress after a chairman
was chosen to head the selection panel. The panel will shortlist 22 qualified
candidates before trimming the number down to 11, which will head the new
telecoms regulator. NBTC could reduce the level of un-fairly and un-freely
competition in the market. In the past or even now, the legalization of
UPM-ETSI Industriales – C/ José Gutiérrez Abascal, 2 28006 Madrid (España)
POLIMI – Piazza Leonardo da Vinci, 32 20133 Milano (Italy)
KTH – SE 100 44 Stockholm (Sweden)
181
Thailand is not transparent and it makes some carriers denominate the
market for a long time. The master plan could be effective if it increases the
number of networks to access, improves the levels of internationalization,
and standardizes products.
Thailand remained in 16th position in BMI‘s latest Business Environment
Ratings for the Asia Pacific region. Although the country still remains third
from the bottom of the table, a successful election could provide
much-needed political and social stability in Thailand, which would evoke
investor confidence, while a commercial 3G launch would boost the country‘s
Industry Rewards score.
9.3.9. Improve the Quality of Service
As we can see that each mobile subscriber has more than one mobile
number, the mobile market is growing but the competition is tend to be
intensive. Carriers should focus on improving the quality of service,
increasing the stability of the networks to be more competitive.
9.3.10. Concluding Summary:
From the above analysis of the telecommunication markets of India,
Singapore, and Thailand, we found that India has innate massive national
resources included land and population but Singapore is the smallest country
among these three countries researched. Generally, India has the enormous
UPM-ETSI Industriales – C/ José Gutiérrez Abascal, 2 28006 Madrid (España)
POLIMI – Piazza Leonardo da Vinci, 32 20133 Milano (Italy)
KTH – SE 100 44 Stockholm (Sweden)
182
workforce, but Singapore lacks of manpower for developing its industries.
Nevertheless, Singapore has the higher percentage of ICT worker per million
of people from the above observation. In ordered to offset its weakness of
manpower shortage, Singapore drew up policies and principles on
introducing foreign work force. This demonstrated that acquired effort could
make up the congenital national disadvantages. The GPD(PPP) of India is at
a low level but India has effective built its nation as a technology driven
country in these years although it still needs to overcome serious problems
such as unbalanced development, poverty, and disease. Thailand has
produced high national GDP but Thailand is more concentrated on agriculture,
textile, furniture, electronic industries rather than ICT industry. It is slight
weaker in ICT industry than the telecom industries of Singapore and India but
overall national competitiveness is higher than India. That indicated India and
Thailand respectively emphasized on the different industries for its national
development. Next, Singapore has the higher percentage of ICT import,
export and revenues among these three countries. Due to having a small
domestic market, it has been expanded business to numerous Asia Pacific
countries and invested various considerable ICT projects. The government of
Singapore has been successful to build its ICT industry nowadays. For the
national strategy and policy, Singapore and India put weights on their ICT
industry; on the contrary, Thailand has set up a small portion about ICT in its
national master plan. The different levels of control cause different levels of
consequences. Moreover, the government of Singapore is considerable
stable, effective, and efficient, and its commercial environment is liberal. The
legislated procedure of Thailand‘s ICT industry is not transparent and not
UPM-ETSI Industriales – C/ José Gutiérrez Abascal, 2 28006 Madrid (España)
POLIMI – Piazza Leonardo da Vinci, 32 20133 Milano (Italy)
KTH – SE 100 44 Stockholm (Sweden)
183
impartial. In addition, Thailand and India noticeable have the development
unbalanced between the metropolitan and rural areas. We found that the less
developed telecom industry can have more opportunities for growth in the
future like Thailand and India. On the contrary, Singapore‘s telecom market is
too mature to expand further business in its nation. We concluded that the
policy maker is an important factor for development the telecom market. The
performance of some industries would be influenced substantial by its
national development plan. Although Singapore has innate unfavorable
factors, it still has the excellent functioning on development its ICT. Then,
India and Thailand own strong culture in fact these limit themselves. From the
above analysis based on Porter‘s diamond theory and SWOT, and main
points summarized, we can assume that the telecom industry of Singapore
should be the most competitive country among these three objective
countries, followed by India then Thailand.
From the World Economic Forum, the ―networked readiness index 2010-2011‖
showed that Singapore has the second place out of 138 countries. India is at
48 and Thailand is at 59. (World Economic Forum, 2011)The result we
analyzed presented the same phenomena as the official organization. It can
be proved that the degree of the six determinants of National Diamond can
point out if a specific industry is competitive in the global market. The
―Government‖ factor is an unquestionable vital condition for developing the
national competitiveness. This is even more important than other conditions.
In sum, we evidently observed that why some nations are more competitive
than others are, and why some industries within nations are more competitive
than others are by these factors Porter declared.
UPM-ETSI Industriales – C/ José Gutiérrez Abascal, 2 28006 Madrid (España)
POLIMI – Piazza Leonardo da Vinci, 32 20133 Milano (Italy)
KTH – SE 100 44 Stockholm (Sweden)
184
Bibliography
Porter, Michael E. (1998) Competitive Advantage of Nations. New York:
Palgrave Macmillan.
Ricardo, D. (1817) On the principles of political economy and taxation.
Canada: Kitchener
Porter, Michael E. (1990) The competitiveness advantages of nations.
Harvard Business Review, Vol.68(2), 73-93
Wolff, Ricardo D., Resnick, Stephen A. (1987) Marxian versus neoclassical,
Baltimore: Johns Hopkins University Press
Smith, A. (1776) The Wealth of Nations. Lodon: W. Strahan and T. Cadell
Chamberlin, E. H. (1933), The Theory of Monopolistic Competition.
Cambridge: Harvard University Press.
Robinson, J. (1933) Economics of imperfect competition. London: St Martins
Pr
Keynes, John M. (1992) An economist's biography. London : Routledge
Porter, Michael E. (1980) Competitive Strategy: Technique to analyzing
industries and competitors. New York: FreePress
Porter, Michael E. (1985) Competitive Advantage: Creating and Sustaining
Superior Performance. New York: FreePress
UPM-ETSI Industriales – C/ José Gutiérrez Abascal, 2 28006 Madrid (España)
POLIMI – Piazza Leonardo da Vinci, 32 20133 Milano (Italy)
KTH – SE 100 44 Stockholm (Sweden)
185
Ketels, C.H.M. (2006) Michael Porter‘s competitiveness framework: recent
learnings and new research priorities, Journal of Industrial Trade and
Competition, Vol. 6, 63–66.
Salvatore, D. (2002). International Economics. New York: Macmillan.
Balassa, B. (1981) The Newly Industrialising Countries in the World
Economy, The IDS Bulletin, Vol.13(1), 1-74
Jones, Ronald W., & Scheinkman, Jose A., (1977), The Relevance of the
Two-Sector Production Model in Trade Theory, Journal of Political Economy,
Vol.85(5), 909-935
Jones, R. (1956). Factor proportions and the Heckscher–Ohlin theorem.
Review of Economic Studies, Vol. 24, 1–10.
Zou B., (1994) William Petty's Thoughts on Value Resource: A New
Exploration, Journal of South China Normal University.
Bellak, C.J., & Weiss, A. (1993). A note on the Austrian ―diamond‖,
Management International Review, Vol.33(2),109-109.
Fazzari., Steven M. (1985) Keynes, Harrod, and the rational expectations
revolution. Journal of Post Keynesian Economics, Vol. 8(1), 66-80.
Dunning, J.H. (1992) The Competitive Advantage of Nations and TNC
activities: a review article, Transnational Corporations, 1(1), 135–168.
Helpman, E., & Krugman, Paul R. (1989) Trade policy and market structure.
London: MIT Press.
UPM-ETSI Industriales – C/ José Gutiérrez Abascal, 2 28006 Madrid (España)
POLIMI – Piazza Leonardo da Vinci, 32 20133 Milano (Italy)
KTH – SE 100 44 Stockholm (Sweden)
186
Yang, X. (2001). New Classical versus Neoclassical Frameworks. Mass :
Blackwell.
Eckel, C. (2008) Globalization and specialization. Journal of International
Economics. Vol.75(1), 219-228.
Smith, A. (1776) The Wealth of Nations. London: W. Strahan and T. Cadell
Alfred, M. (1920) Principles of Economics 8th edition. London: Macmillan and
Co., Ltd.
Kuznets, S. (1995). Economic Growth and Income Inequality. The American
Economic Review, Vol. 45(1),1-28
Solow, Robert M. (1956) A Contribution to the Theory of Economic Growth.
The Quarterly Journal of Economics, Vol. 70(1), 65-94
Collinge, C., & Staines, A. (2009) Rethinking the knowledge-based economy.
The Knowledge Based Economy Journal, Vol.35 (2), 165-172
Han, X. (2009) Research on Relevance of Supply Chain and Industry Cluster.
International Journal of Marketing Studies, Vol.2 (1).
Business Strategy Review. (2003) Bringing SWOT into focus. Business
Strategy Review, Vol. 14(2), 8-10
Armstrong, J. S. (1982) The Value of Formal Planning for Strategic Decisions.
Strategic Management Journal, Vol. 3, 197-211.
Brooksbank, R. (1996) The BASIC marketing planning process: a practical
framework for the smaller business. Journal of Marketing Intelligence &
Planning, Vol.14(4), 16-23.
UPM-ETSI Industriales – C/ José Gutiérrez Abascal, 2 28006 Madrid (España)
POLIMI – Piazza Leonardo da Vinci, 32 20133 Milano (Italy)
KTH – SE 100 44 Stockholm (Sweden)
187
Kipley, D. (2009) The Scalability of H. Igor Ansoff's Strategic Management
Principles for Small and Medium Sized Firms. Read more: Journal of
Management Research, Vol. 1(1), 1-26.
The Board Investment of Thailand. (2011) Net Application Submitted. [Online]
Available from: http:// www.boi.go.th [Accessed 12 April 2011].
BSNL. (2011) Director’s Report [Online] Available from: http:// www.bsnl.co.in
[Accessed 12 March 2011].
Frost sullivan. (2011) Information and Communication Technologies Report.
[Online] Available from: http:// www.frost.com [Accessed 20 May 2011].
Ideacelluar. (2011) Annual Report. [Online] Available from: http://
www.ideacelluar.com [Accessed 13 April 2011].
National Economic Social Development Board of Thailand. (2011) NI2009.
[Online] Available from: http:// www.nesdb.go.th [Accessed 10 April 2011].
Planning Commission of India. (2011).Five years plans 11th. [Online]
Available from: http://planningcommission.nic.in/ [Accessed 15 April 2011].
Wireless Planning and Coordination Wing India. (2011).Profile. [Online]
Available from: http://www.wpc.dot.gov.in/ [Accessed 15 April 2011].
Telecom Regulatory Authority of India. (2011).Study Papers. [Online]
Available from:http://www.trai.gov.in/ [Accessed 15 April 2011].
Vargas, Fundacao G., (2006) On the output effects of barriers to trade.
International Economic Review, Vol.47 (4), 1319-1340.
UPM-ETSI Industriales – C/ José Gutiérrez Abascal, 2 28006 Madrid (España)
POLIMI – Piazza Leonardo da Vinci, 32 20133 Milano (Italy)
KTH – SE 100 44 Stockholm (Sweden)
188
Ederington, J., (2002) Trade and domestic policy linkage in international
agreement. International Economic Review, Vol.43 (4), 1347-1368.
Squalli, J., & Wilson, K., & Hugo, S., (2008) An analysis of growth
competitiveness. International Review of Applied Economics, Vol.22 (1),
105-126.
Dutta, S., & Mia, R. (2010) Global Information and Technology Report
2010-2011. Report number: 435
Burgelman, R., & Siegel, R. (2008) Cutting the Strategy Diamond in
High-Technology Ventures. California Management Review, Vol. 50(3),
140-167.
Rugman, A., & Verbeke, A. (1993) How to Operationalize
Porter‘s Diamond of International Competitiveness. International Executive,
Vol. 35(4), 283-299.
Coman, A., & Ronen, B. (2009) Focused SWOT: diagnosing critical strengths
and weaknesses. International Journal of Production Research, Vol. 47(20),
5677-5689.
R. C. (2010) The SWOT Analysis. CA Magazine, Vol. 143(8), 31-31.
Narayana, M. (2011) Telecommunications services and economic
growth: Evidence from India. Telecommunications Policy, Vol. 35(2),
115-127.
UPM-ETSI Industriales – C/ José Gutiérrez Abascal, 2 28006 Madrid (España)
POLIMI – Piazza Leonardo da Vinci, 32 20133 Milano (Italy)
KTH – SE 100 44 Stockholm (Sweden)
189
Patel, U., & Bhattacharya, S. (2010) Infrastructure in India: The economics of
transition from public to private provision. Journal of Comparative Economic,
Vol. 38(1), 52-70.
Ray, P., & Ray, S. (2010) Resource-Constrained Innovation for Emerging
Economies: The Case of the Indian Telecommunications Industry. IEEE
Transactions on Engineering Management, Vol. 57(1), 144-156.
Durchslag, A. (2010) India's telecoms market ripe for M&A. Acquisitions
Monthly, Issue 310, 6-9.
Chandra, A., & Fealey, T., Rau, P. (2006) National barriers to global
competitiveness: The case of the IT industry in India.
Competitiveness Review, Vol. 16(1), 12-19.
Panagariya, A., (2011). India: A global economic power? Revisiting the past
and contemplating the future. Journal of International Affairs, 64(2),197-212.
Kuo, Eddie C. Y., & Low, L.,Toh M.(2011) The Singapore
Telecommunications Sector and Issues Affecting Its Competitive Position in
the Pacific Region. Columbia Journal of World Business, Vol. 24(1), 59-71.
Clark, R. (2010) IDA pushes on with S$60m spectrum sale. Telecom Asia,
Vol. 21(6), 12-12.
Cave, M., & Martin, I. (2010) Motives and means for public investment in
nationwide next generation networks. Telecommunications Policy, Vol. 34(9),
505-512.

UPM-ETSI Industriales – C/ José Gutiérrez Abascal, 2 28006 Madrid (España)
POLIMI – Piazza Leonardo da Vinci, 32 20133 Milano (Italy)
KTH – SE 100 44 Stockholm (Sweden)
190
Tom, M., & Low, L. (1993) The Intelligent City: Singapore Achieving the Next
Lap. Technology Analysis & Strategic Management, Vol. 5(2), 187-187.
Douglas, J. (2010) Singapore builds IT hub. BRW, Vol. 32(36),13-13.
Senia, A. (2006) Singapore‘s high-tech gamble. Telecom Asia, Vol.
17( 7),11-11.
Tubtimhin, J.(2009) Thailand Moves to Connected Government. I-Ways, Vol.
32(4), 229-239.
Bushell-Embling, D. (2010) Court decision kills off Thai 3G. Telecom Asia,
Vol. 21(8), 13-13.
Bushell-Embling, D.(2010) Thai mobile a 'mess' after 3G ruling. Telecom
Asia, Vol. 21(9), 12-12.
Department of Telecom India. (2011) National Telecom Policy 1994. [Online]
Available from: http://www.dot.gov.in/ [Accessed 25 May 2011].
Telecomindiaonline (2011) India Telecom market growth and subscribers
2010 | GSM and CDMA operators April 2010 data. [Online] Available
from: http://www.telecomindiaonline.com/ [Accessed 25 May 2011].
Cellular Operator Association of India. (2011) GSM Mobile Statistics. [Online]
Available from: http://www.coai.com/ [Accessed 25 May 2011].
Central Intelligent Agency. (2011) The World FactBook. [Online] Available
from:https://www.cia.gov/library/publications/the-world-factbook/index.html [A
ccessed 20 May 2011].
UPM-ETSI Industriales – C/ José Gutiérrez Abascal, 2 28006 Madrid (España)
POLIMI – Piazza Leonardo da Vinci, 32 20133 Milano (Italy)
KTH – SE 100 44 Stockholm (Sweden)
191
Infocomm Development Authority of Singapore. (2011) Publications. [Online]
Available from: http://www.ida.gov.sg/ [Accessed 20 May 2011].
SingTel. (2011) Annual Report 2009/2010. [Online] Available from: http://
http://info.singtel.com/ [Accessed 15 May 2011].
StarHub. (2011) Annual Report 2010. [Online] Available from: http://
www.starhub.com [Accessed 15 May 2011].
M1. (2011) About M1. [Online] Available from: http://www.m1.com.sg/
[Accessed 15 May 2011].
IWS International Wholesale Services. (2011) Company Information. [Online]
Available from: http://www.IWS -wholesale.com/en/infoCorp.html [Accessed
22 April 2011].
DTAC. (2010) dtac Second quarter 2010. [Online] Available
from: http://www.dtac.com/ [Accessed 15 March 2011].
TOT Public Company Limited. (2010) Anuual report 2009. [Online] Available
from: http://www.tot.com/ [Accessed 15 March 2011].
True. (2011) TIG. [Online] Available
from: http://www2.truecorp.co.th [Accessed 15 March 2011].
Hutch. (2011) Corporate. [Online] Available
from: http://www.hutch.co.th/index_en.htm [Accessed 15 March 2011].
CAT Telecom. (2011) Company Information. [Online] Available
from: http://www.cattelecom.com/site/en/main.php [Accessed 15 March
2011].
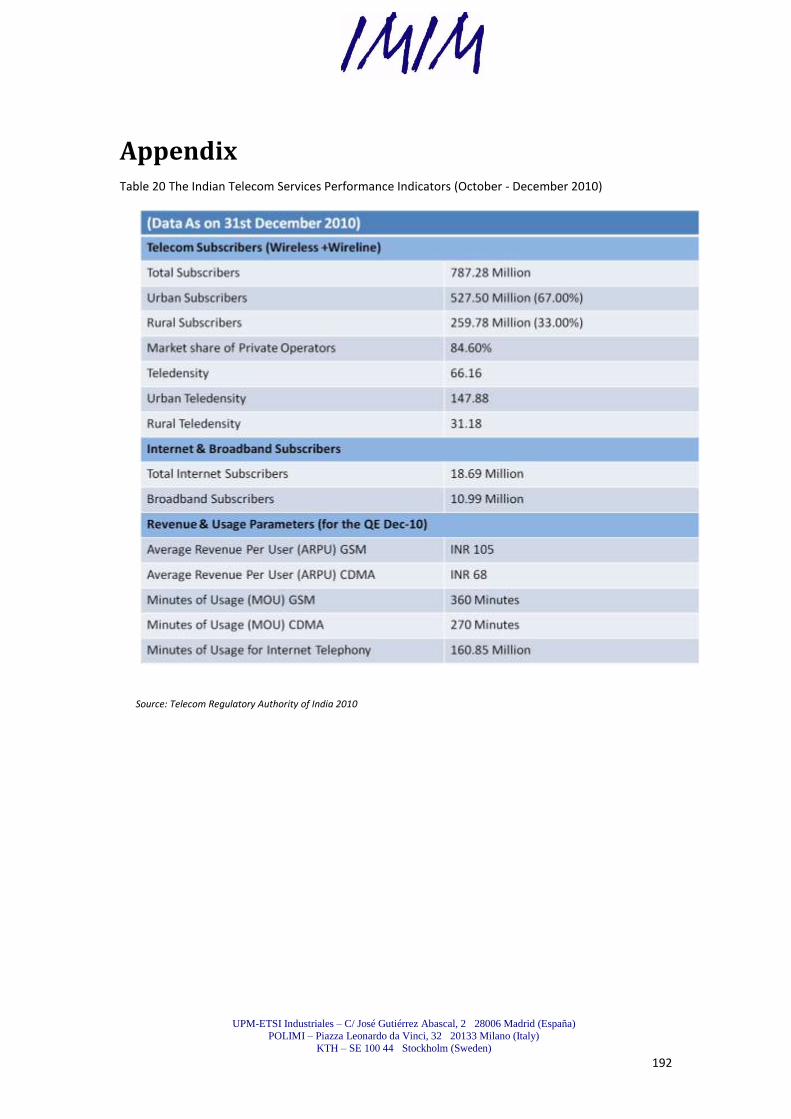
UPM-ETSI Industriales – C/ José Gutiérrez Abascal, 2 28006 Madrid (España)
POLIMI – Piazza Leonardo da Vinci, 32 20133 Milano (Italy)
KTH – SE 100 44 Stockholm (Sweden)
192
Appendix Table 20 The Indian Telecom Services Performance Indicators (October - December 2010)
Source: Telecom Regulatory Authority of India 2010
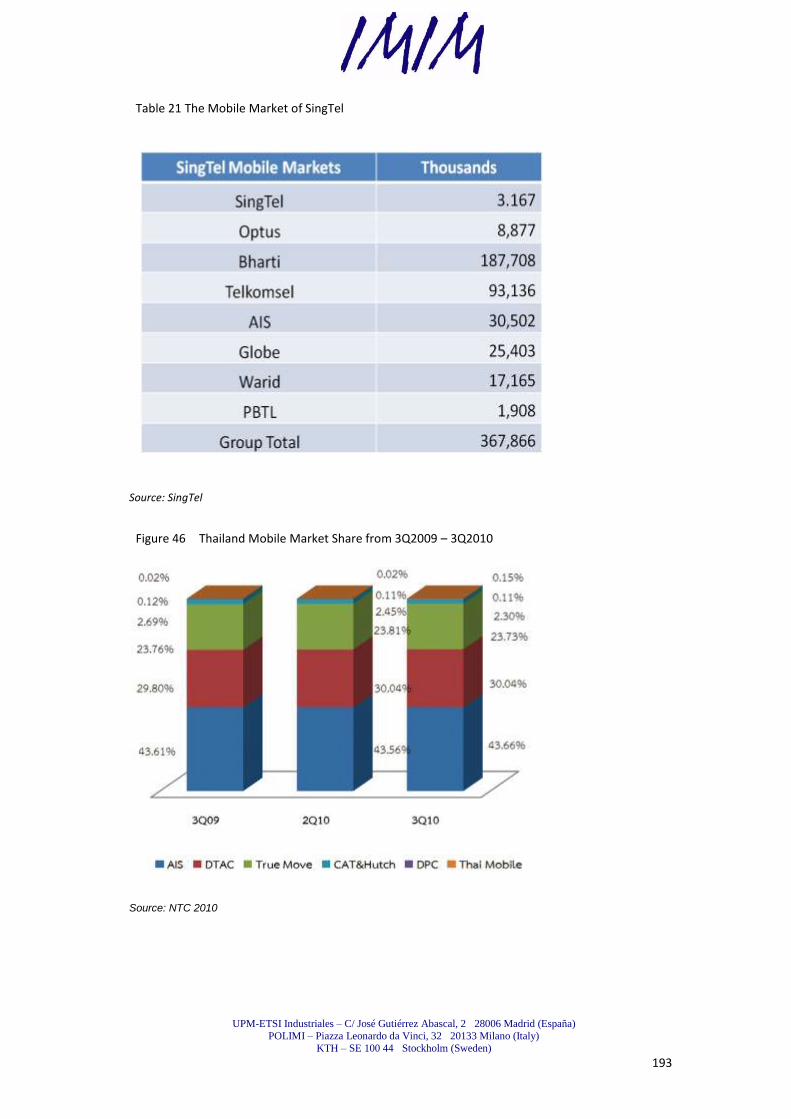
UPM-ETSI Industriales – C/ José Gutiérrez Abascal, 2 28006 Madrid (España)
POLIMI – Piazza Leonardo da Vinci, 32 20133 Milano (Italy)
KTH – SE 100 44 Stockholm (Sweden)
193
Table 21 The Mobile Market of SingTel
Source: SingTel
Figure 46 Thailand Mobile Market Share from 3Q2009 – 3Q2010
Source: NTC 2010
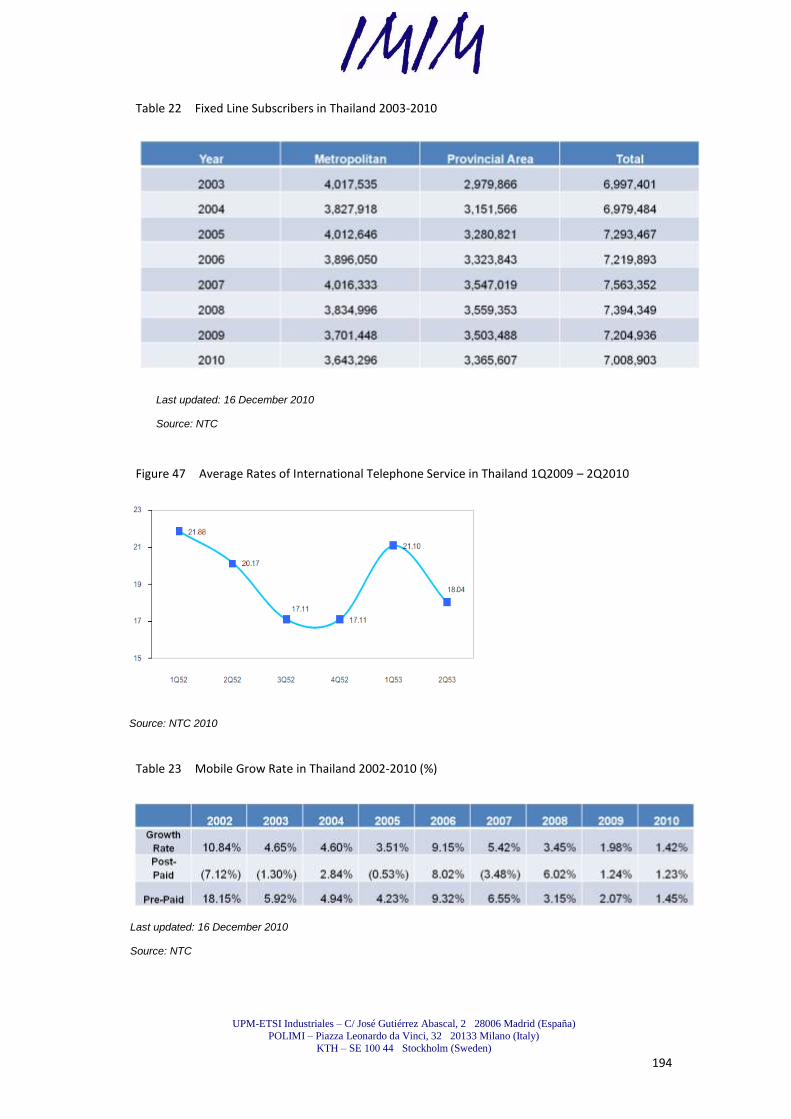
UPM-ETSI Industriales – C/ José Gutiérrez Abascal, 2 28006 Madrid (España)
POLIMI – Piazza Leonardo da Vinci, 32 20133 Milano (Italy)
KTH – SE 100 44 Stockholm (Sweden)
194
Table 22 Fixed Line Subscribers in Thailand 2003-2010
Last updated: 16 December 2010
Source: NTC
Figure 47 Average Rates of International Telephone Service in Thailand 1Q2009 – 2Q2010
Source: NTC 2010
Table 23 Mobile Grow Rate in Thailand 2002-2010 (%)
Last updated: 16 December 2010
Source: NTC
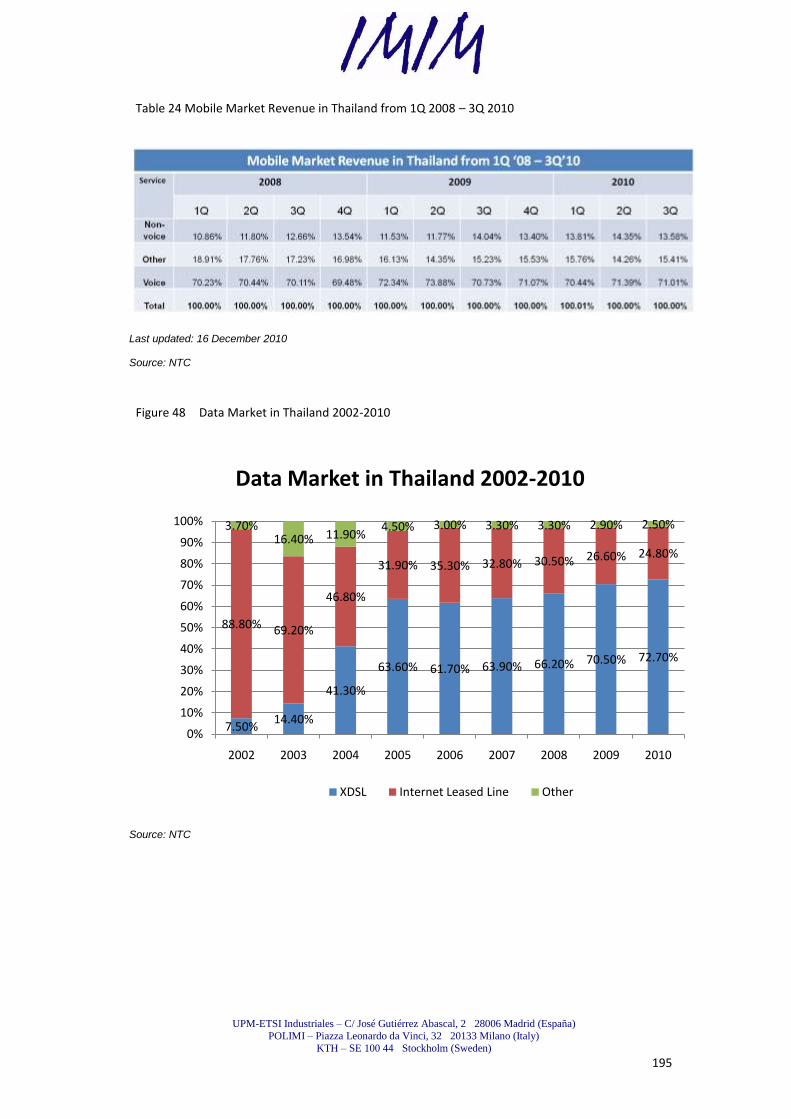
UPM-ETSI Industriales – C/ José Gutiérrez Abascal, 2 28006 Madrid (España)
POLIMI – Piazza Leonardo da Vinci, 32 20133 Milano (Italy)
KTH – SE 100 44 Stockholm (Sweden)
195
Table 24 Mobile Market Revenue in Thailand from 1Q 2008 – 3Q 2010
Last updated: 16 December 2010
Source: NTC
Figure 48 Data Market in Thailand 2002-2010
Source: NTC
7.50%14.40%
41.30%
63.60% 61.70% 63.90% 66.20% 70.50% 72.70%
88.80% 69.20%
46.80%
31.90% 35.30% 32.80% 30.50% 26.60% 24.80%
3.70%16.40% 11.90%
4.50% 3.00% 3.30% 3.30% 2.90% 2.50%
0%
10%
20%
30%
40%
50%
60%
70%
80%
90%
100%
2002 2003 2004 2005 2006 2007 2008 2009 2010
Data Market in Thailand 2002-2010
XDSL Internet Leased Line Other