gnss, earth observation and satellite telecommunication ... · pdf filegnss, earth observation...
TRANSCRIPT

GNSS, Earth Observation and Satellite Telecommunication
Applications and Markets
October 2009

Table of Contents
1. Global Navigation Satellite Systems (GNSS) .................................................................................... 4
1.1. Global navigation systems ....................................................................................................... 5
1.1.1. GPS ................................................................................................................................... 5
1.1.2. GLONASS .......................................................................................................................... 6
1.1.3. Galileo .............................................................................................................................. 6
2. GNSS Market ................................................................................................................................... 8
3. GPS Technology Market and Trends ............................................................................................. 10
3.1. GPS chipset miniaturization and falling prices ...................................................................... 10
3.2. GPS enabled handsets in navigation markets ....................................................................... 10
3.3. Auto, mobile and handheld segments important in navigation market ............................... 11
3.4. Handset market – location based services adoption, applications driving sales .................. 13
3.5. Growing demand for precision GNSS .................................................................................... 14
4. GNSS Services Markets and Market Trends .................................................................................. 15
4.1. Land Applications, location based services (LBS) .................................................................. 15
4.1.1. Navigation...................................................................................................................... 17
4.1.2. Tracking & fleet management services ......................................................................... 21
4.1.3. Traffic management & public transport ........................................................................ 26
4.1.4. Location-based social networks (LBSN) ......................................................................... 31
4.1.5. Location-based gaming.................................................................................................. 34
4.1.6. Law Enforcement ........................................................................................................... 35
4.2. Precision GNSS applications .................................................................................................. 36
4.2.1. Agriculture & Forestry ................................................................................................... 40
5. Remote Sensing and Earth Observation ........................................................................................ 46
5.1. Satellite imaging .................................................................................................................... 47
5.2. Earth Observation value chain .............................................................................................. 51
5.2.1. Data providers ............................................................................................................... 53
5.2.2. Value adding sector ....................................................................................................... 56
5.3. Earth observation applications .............................................................................................. 59
5.3.1. Agriculture ..................................................................................................................... 59
5.3.2. Earth observation applications in forestry and forest management ............................ 62
5.3.3. Energy Industry applications ......................................................................................... 63
5.3.4. Marine applications ....................................................................................................... 72

3
5.4. Providers of satellite imagery ................................................................................................ 75
6. Fixed Satellite Service (FSS) market............................................................................................... 84
6.1. Market size and segmentation .............................................................................................. 84
6.1.1. Applications ................................................................................................................... 85
6.1.2. Geographical segmentation .......................................................................................... 87
6.2. Perspectives and market trends ............................................................................................ 89
6.2.1. Technological segmentation for application segmentation .......................................... 89
6.2.2. Growing demand for video capacity ............................................................................. 89
7. Mobile Satellite Service (MSS) market .......................................................................................... 91
7.1. Market size and segmentation .............................................................................................. 91
7.1.1. Maritime market ........................................................................................................... 92
7.1.2. Land services market ..................................................................................................... 93
7.1.3. Aeronautical market ...................................................................................................... 95
7.2. Perspectives and market trends ............................................................................................ 95
7.2.1. Broadband adoption ...................................................................................................... 95
7.2.2. Handheld market ........................................................................................................... 97
7.2.3. In-flight communications............................................................................................... 98
7.2.4. Changes in the supply chain .......................................................................................... 98
7.2.5. Military demand .......................................................................................................... 100
7.3. MSS competitor overview ................................................................................................... 101
7.3.1. Barriers to entry in MSS sector .................................................................................... 101
7.3.2. Companies offering MSS ............................................................................................ 102

4
1. Global Navigation Satellite Systems (GNSS)
Satellite-based navigation is, together with telecommunications and Earth observation, one of the
three main legs of the so called space applications. Satellite-based navigation systems or Global
Navigation Satellite Systems (GNSS) are services which provide signals that can be used to accurately
locate the position of people and places, and to provide safe navigation information for moving
platforms such as ships, aircraft, and automobiles, anywhere on the surface of the Earth and out to
near space.
The infrastructure of a GNSS system can be basically divided into three so-called segments: the space
segment, the ground segment, and the user segment.
The space segment in composed of the satellites which transmit the navigation signal, also
called signal in space, used by the user receiver to calculate its position, time, and velocity.
The ground segment or ground control segment includes all the means used by the
owner or operator to keep the system working appropriately, tracking the satellite
constellation and transmitting the corrected orbital parameters. This includes a control
center or master station, and ground stations to control and monitor the satellite
constellation and provide the satellites and user with the information needed to generate an
adequate signal in space.
The user segment is composed of the user receivers which get the signals from the
satellite, perform the calculations using different algorithms, and provide the user with
the required service.
In addition to these three segments, another two components, which are not strictly part of the
GNSS, have to be taken into account, the launch segment and the external entities. The launch
segment includes all the means (basically launch services and early operations) in order to place the
satellites into their defined orbits from where they will provide the signals. The term external entities
refers in a broad sense to any entity that interacts with the GNSS system. Some examples include
entities providing time reference information (Coordinated Universal Time, UTC), and precise Earth-
based position reference (GTRF system), other GNSS systems, other systems providing regional
integrity information, the scientific community and so forth.

5
Augmentation systems can also be considered as part of the GNSS. Those are systems that use space
or ground-based infrastructure to enhance the navigation signals with greater performances or value
added services in a determined local or regional area. Depending on the infrastructure used for the
augmentation, the augmentation systems can be classified as ground-based (GBAS) or satellite-based
(SBAS). An example of SBAS is European Geostationary Navigation Overlay Service (EGNOS).
Consisting of three geostationary satellites and a network of ground-stations, EGNOS augments the
existing GNSS (GPS and GLONASS) systems.
Basically, navigation satellite systems implement a time-difference-of-arrival concept. This is done
using precise satellite position and on-board atomic clocks to generate navigation messages that are
continuously broadcast from each of the satellites in the GNSS constellation. These messages,
containing information about the position and clock of the satellite sending the message, can be
received and processed by users anywhere in the world (within the coverage of the system). The
receiver, upon reception of those messages, determines the distance between both, by measuring
the travel time of the signal. The user needs the information of at least three satellites in order to
determine its position with enough accuracy (ranging between centimeters and a few meters,
depending on different factors). The signal from a fourth satellite would provide the accurate (in the
order of nanoseconds) reference of time.
1.1. Global navigation systems
The GNSS of today consists of two satellite constellations, the US Global Positioning System (GPS)
and the Russian GLONASS. These are the only two satellite systems in orbit from which military and
civilian users can determine their positions free of any charges almost anywhere on Earth. Of these
two systems the GPS is fully operational today, offering worldwide service.
1.1.1. GPS
The concept of GPS started in the early 1970s as a way for the United States military to accurately
identify locations throughout the globe. Between 1978 and 1985, the US Department of Defense
launched the first generation of GPS satellites (Block I) exclusively for military use. However, in 1983
following the downing of Korean Airlines Flight 007 after it strayed over territory belonging to the
Soviet Union, President Ronald Reagan decided to permit civilian use of GPS technology once it
became operational. Launches of second generation GPS Block II satellites, which included a signal
for civilian use, began in 1989, and additional Block IIA GPS satellites were launched in the early
1990s to complete the GPS constellation. Air Force Space Command (AFSPC) declared full operational
capability on April 27, 1995.
The current GPS constellation consists of 32 satellites in nearly circular orbits, at an altitude of
approximately 20,200 kilometers above the earth (most recent launches took place in March 2009).
The satellites are arranged on 6 planes, each of them containing at least 4 slots where satellites can
be arranged equidistantly. The circulation time of the satellites is about 12 hours.
According to sources, GPS cost between $10 and $11 billion to build between 1987 and 2002. Since
2000 additional $1.6 billion has already been spent on GPS modernization program IIIA without any

6
new generation satellites launched to date.1 It is claimed that GPS currently contributes $30 billion to
the U.S. economy annually.2
1.1.2. GLONASS
GLONASS (Global Navigation Satellite System) is the Russian equivalent of the U.S. Global Positioning
System, and is designed for both military and civilian use. Development on GLONASS began in 1976,
with a goal of global coverage by 1991. Beginning on 12 October 1982, numerous launches added
satellites to the system until the constellation was completed in 1995. Economic problems
suspended the project, and Russia committed to restore the system in 2001. Since 2007, Russian
military has provided open access to the civilian navigation signals of the GLONASS system, to
Russian and foreign consumers free of charge and without limitations.
As of June 2009, the GLONASS system comprises 20 satellites. A total of 17 satellites are operational
while three remain under maintenance. The system requires 18 satellites for continuous navigation
services covering the entire territory of the Russian Federation, and 24 satellites to provide services
worldwide. Two Proton-M launch vehicles are expected to lift off this year to put six more Glonass-M
satellites into orbit. GLONASS is expected to become fully operational with 24 satellites early in
2010.3
Several North American and European manufacturers offer combined GPS/GLONASS OEM products,
including NovAtel, Javad GNSS4, Trimble, Septentrio5, and Leica6.
The stable progress in rebuilding and modernizing GLONASS and the launch of single GLONASS/GPS
chips by Javad and other manufacturers have even sparked interest from large players in the mobile
phone industry. Nokia has been investigating the use of GLONASS for its handsets.7
1.1.3. Galileo
The Galileo Positioning System is a satellite navigation system, being built by the European Union
(EU) as an alternative to the US Global Positioning System (GPS) and the Russian GLONASS. Unlike
GPS and GLONASS, Galileo is a navigation infrastructure fully under civilian control.
The idea of a European geopositioning system similar to the GPS and Russia’s Global Navigation
GLONASS originated a decade ago, when teams of engineers from France, Germany, Italy, and the
United Kingdom developed a joint concept for an independent set of satellites that would provide
superior accuracy and not be vulnerable to military cutoff. In March 2002, the European Union (EU)
and the European Space Agency (ESA) agreed to proceed with the project, named Galileo, which they
visualized as a public-private partnership (PPP) that ultimately would pay for itself by providing
premium paid services with encoded signals.
1 http://www.telecommagazine.com/article.asp?HH_ID=AR_5309
2 http://www.washingtonpost.com/wp-dyn/content/article/2008/05/15/AR2008051504007.html
3 http://www.insidegnss.com/node/1389
4 http://www.javad.com/jns/index.html?/jns/technology/jns_digital_chip_specifications.html
5 http://www.septentrio.com/products_gps.htm
6 http://www.leica-geosystems.com/corporate/en/products/gps_systems/lgs_67536.htm
7 http://www.insidegnss.com/node/534
7
However, in early 2007 the consortium of eight leading aerospace and telecom companies, known as
the European Satellite Navigation Industries, formally abandoned the project. The consortium could
not reach agreement on issues such as the allocation of lucrative contracts, and the European Union
took control.
Lack of public funds then led to a period of great uncertainty for Galileo. Although the original aim
had been to have the system operational by 2008, by 2007 only one test satellite (GIOVE-A) was in
orbit and just four of the thirty in the projected constellation had been ordered. The EC proposed to
fully fund the project using public money, leaving private companies to run the system. The EC
funding was to come from its surplus agriculture and administration budgets for 2007 and 2008. The
project was finally approved by the 27 EU transport ministers in November 2007 in an amount of
€3.4 billion. Total estimated investment costs of the Galileo project are €5.4 billion.
In June 2009 ESA and commercial launch services provider Arianespace signed a contract for the
launch of the first four operational Galileo satellites. The deal calls for the Galileo satellites to be sent
into orbit in pairs using two Soyuz launch vehicles. The launches will be made from the Soyuz launch
facility currently under construction at the Guiana Space Center, in French Guiana. All four of the
satellites are supposed to be in orbit by the end of 2010.
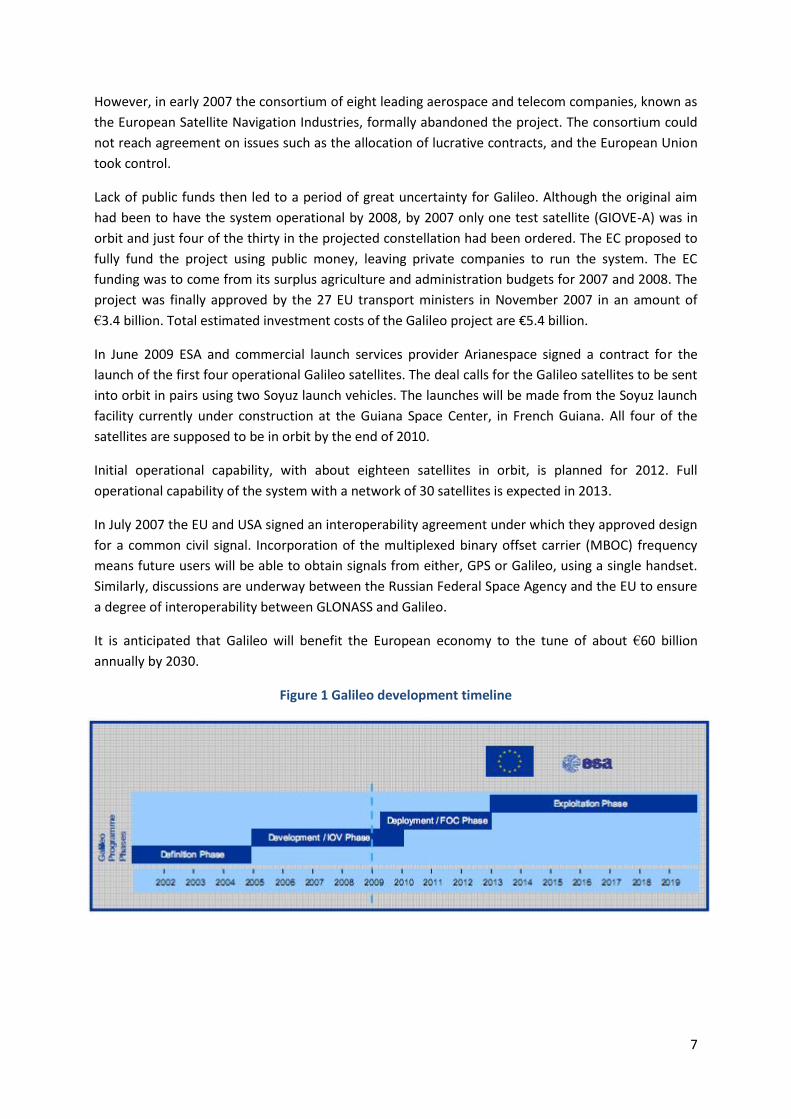
Initial operational capability, with about eighteen satellites in orbit, is planned for 2012. Full
operational capability of the system with a network of 30 satellites is expected in 2013.
In July 2007 the EU and USA signed an interoperability agreement under which they approved design
for a common civil signal. Incorporation of the multiplexed binary offset carrier (MBOC) frequency
means future users will be able to obtain signals from either, GPS or Galileo, using a single handset.
Similarly, discussions are underway between the Russian Federal Space Agency and the EU to ensure
a degree of interoperability between GLONASS and Galileo.
It is anticipated that Galileo will benefit the European economy to the tune of about €60 billion
annually by 2030.
Figure 1 Galileo development timeline
8
2. GNSS Market
The GNSS industry of today is primarily GPS oriented. Galileo, GLONASS and other navigation systems
are not expected to have an impact on commercial GNSS market before 2012.
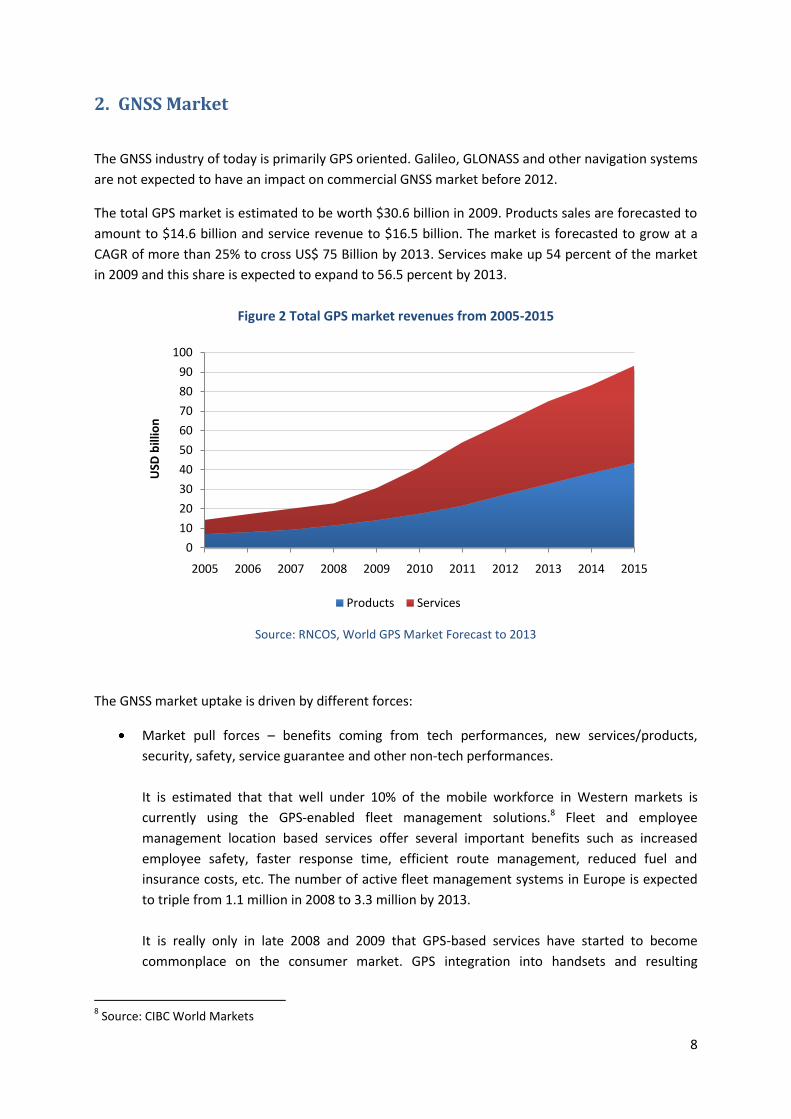
The total GPS market is estimated to be worth $30.6 billion in 2009. Products sales are forecasted to
amount to $14.6 billion and service revenue to $16.5 billion. The market is forecasted to grow at a
CAGR of more than 25% to cross US$ 75 Billion by 2013. Services make up 54 percent of the market
in 2009 and this share is expected to expand to 56.5 percent by 2013.
Figure 2 Total GPS market revenues from 2005-2015
Source: RNCOS, World GPS Market Forecast to 2013
The GNSS market uptake is driven by different forces:
Market pull forces – benefits coming from tech performances, new services/products,
security, safety, service guarantee and other non-tech performances.
It is estimated that that well under 10% of the mobile workforce in Western markets is
currently using the GPS-enabled fleet management solutions.8 Fleet and employee
management location based services offer several important benefits such as increased
employee safety, faster response time, efficient route management, reduced fuel and
insurance costs, etc. The number of active fleet management systems in Europe is expected
to triple from 1.1 million in 2008 to 3.3 million by 2013.
It is really only in late 2008 and 2009 that GPS-based services have started to become
commonplace on the consumer market. GPS integration into handsets and resulting
8 Source: CIBC World Markets
0
10
20
30
40
50
60
70
80
90
100
2005 2006 2007 2008 2009 2010 2011 2012 2013 2014 2015
USD
bill
ion
Products Services

9
combination of location information with a data connection has great potential to
revolutionize the way people live and work. According to analysts location based advertising
would be predominantly used for monetizing location services and could generate $18 billion
in revenue by 2015 globally.9
Regulatory forces – directives, standards, certification, security;
Following the SOLAS regulation XI-2/6 adopted in December 2002 by the IMO (International
Maritime Organization) and effective over two stages (July 1, 2004 and July 1, 2006), all
vessels of more than 500 tons must be equipped with a SSAS (Ship Security Alert System).
SSAS is a GPS-based system that sends an alert from ship to shore in case of a piracy or
terrorist attack on-board a vessel.
44 US states out of 50 have regulations in place that require those criminals with a profile
that indicates a likelihood of them repeating their crimes to wear GPS tracking devices so
that authorities can monitor their movements. Florida’s experience shows offenders on GPS
tracking are less likely to get in trouble than those under traditional supervision. Nearly 6
percent of GPS-monitored offenders had committed new felonies or misdemeanors,
compared with 11 percent of those who were not electronically monitored.10 Similar tracking
systems are also being developed in Spain, Britain, France and Germany.
Social and scientific benefits forces – driven by non-commercial benefits related to
environment protection, civil protection, emergencies, scientific and research activities.
The European Union is promoting eCall technology to reduce the number of roadway
fatalities by minimizing the response time when an accident has occurred. eCall is a
combination of an In Vehicle System (NS), a device with a GSM cell phone and GPS location
capability, and a corresponding infrastructure of Public Safety Answering Points (PSAPs).
When the device detects an accident it automatically calls a PSAP, transmits the vehicle
location and other data. The European Commission has presented a policy document with a
strategy for introducing eCall in all new vehicles across Europe by 2014. This could create a
market for 200 million receivers assuming that this application will become mandatory across
the EU and so by 2022 most vehicles will have it installed (assuming an average vehicle life of
8 years in Europe).
The United States Enhanced 911 (E-911) emergency service takes advantage of GPS
positioning on GPS-enabled cell phones to zero in on a caller's location. By autumn 2012 all
wireless carriers in the US must comply with Federal Communications Commission’s (FCC)
strict location accuracy standards. As a result of this, In the US, nearly all new handsets are
GPS capable.
9 J.P. Morgan Europe Equity Research, Location, location, location: Analyzing Location Based Services
opportunities, June 2009 10
http://gpsmonitoring.com/blog/?p=349

10
3. GPS Technology Market and Trends
3.1. GPS chipset miniaturization and falling prices
The progress made in silicon technology allows for size reduction, power consumption reduction, and
integration of additional functionalities in the receivers.
Adoption rate for GPS technology has been hindered by cost, but falling chipset prices have increased
volume and market scope. Miniaturization and receiver advances are improving prices vs.
performance and favor its use in portable devices. This means that more phones and cars are
including GPS, and the technology is growing in consumer popularity. Average price of a GPS chipset
has fallen from $11 in 2003 to $3-$3.50 in the end of 2008. Application shipments for electronics
capable of GPS reached 291.3 million units in 2008. Growing at a compound annual growth rate of 27
percent, shipments could reach nearly 770 million units by 2012.
Figure 3 Average price of a GPS chipset and unit sales of GPS capable electronics
Source: SIRF estimates
3.2. GPS enabled handsets in navigation markets
Currently, the available navigation solutions on the consumer market can be divided into two broad
groups, integrated in-vehicle systems and handheld or portable systems.
In-vehicle systems can in turn be divided into OEM systems and aftermarket standard systems that
are integrated with car’s audio system. The handheld or portable systems can be divided into three
segments: dedicated navigation devices usually called personal navigation devices (PNDs), systems
based on smartphones and systems based on personal digital assistants (PDAs). Up until recent years
the consumer GPS device market has been driven mainly by the sales of dedicated personal
navigation devices (PNDs). These can either be in the format of a normal handheld computer with an
0
50
100
150
200
250
300
350
400
450
500
0
2
4
6
8
10
12
2003 2004 2005 2006 2007 2008 2009 2010
Sale
s o
f G
PS
en
able
d d
evi
ces
(mln
un
its)
Pri
ce o
f a
GP
S C
hip
set
($)
Price of a GPS chipset Sales of GPS capable electronics (million units)
Mass market adoption

11
integrated GPS receiver, or formats more suited for attaching on the dashboard of a car. Although
there is a trend of moving away from simple dedicated PND systems, these devices are still mainly
specialized for navigation purposes only. This has meant that contribution of GPS navigation systems
and products in the consumer space has been limited to mapping driving routes, tracking hikers and
marking coordinates.
Largest producers in the dedicated PND segment include US based Garmin, TomTom NV of
Amsterdam, Netherlands and Magellan. TomTom claimed it grew its PND market share in both North
America and Europe to 19 percent and 44 percent, respectively, up from 18 percent and 42 percent
during last year’s first quarter. Garmin’s market share stood at over 50% in North America. Garmin’s
global market share was 37% in 2008, TomTom held 24% of the total PND market worth about $9.44
billion according to financial reports of the largest producers.
PND market has seen incredible growth rates over the past couple of years (average global unit sales
growth of 60% over the period of 2005-2008). However the growth will probably start to slow
substantially as the market share of PNDs is expected to get disturbed by the availability of GPS-
enabled handsets or smartphones that will account for an estimated 87.8% share of the total GPS
market by the end of 2012. This trend towards GPS enabled handheld devices and navigation
software solutions accessed on smartphones is accompanied by a shift to a more service-oriented
business model in the GNSS marketplace.
This transition will not come overnight, but industry momentum is clearly shifting in this direction.
According to forecasts stand-alone PND unit sales will peak in 2009 and gradually decline with time.
Ultimately consumers will see less need to buy PNDs when their smartphones offer the same service,
even if the smartphone navigation experience is not quite as robust as that of the PND (e.g. smaller
screens on smartphones). PNDs will probably not go away entirely, but will increasingly be relegated
to a much smaller niche.
Changes in the portable GPS and personal navigation device (PND) markets are clearly illustrated by
Garmin’s and TomTom’s financial reports. In the second quarter of 2009 Garmin sales tumbled 27
percent to $669 million from $912 million during the same period a year ago. TomTom reported
revenue of $515.2 million, a decrease of 24 percent from $679 million during the same quarter last
year.
Largest PND market players are clearly looking to capitalize on this new trend. Garmin is set to enter
the smartphone market in Q3 2009 with a set of nüvifone branded handhelds. Garmin nüvifone G60
will be available beginning October 4 for AT&T customers in U.S. The Garmin hopes its phone will
create a growth area beyond its mainstay personal navigation devices segment, and possibly create a
niche of devices positioned as GPS-centric handsets.
3.3. Auto, mobile and handheld segments important in navigation market
While Garmin’s four product segments have remained the same over the years, the contribution
each makes to top and bottom line results have not. As customer demands have evolved, and as
Garmin has launched new products, its revenue and income mix has changed.

12
The auto/mobile segment has grown in importance for Garmin, contributing nearly 73% of
Garmin’s revenues in 2008 and about 58% of its income. However, gross margins in this
segment fell 5.5 percentage points from 2005 to 2008. That negative trend was offset by
increasing margins in the other three segments. Looking forward, the margins will certainly continue
to compress in the auto/mobile segment due to competition from the handset market, eventually
settling in the 32-35% range.
Segment Performance
FY2005 FY2008
Auto/ mobile
% of Revenue 39.2% 72.6%
Gross Margin 44.0% 38.5%
% of Income 33.7% 57.7%
Aviation % of Revenue 22.3% 9.3%
Gross Margin 66.2% 67.3%
% of Income 26.7% 15.2%
Marine % of Revenue 15.4% 5.9%
Gross Margin 51.2% 54.5%
% of Income 15.2% 8.4%
Fitness/ Outdoor
% of Revenue 23.1% 12.2%
Gross Margin 52.7% 57.7%
% of Income 24.4% 18.7%

13
3.4. Handset market – location based services adoption, applications
driving sales
Canaccord Adams handset survey (conducted February 2009). 40 respondents including carriers,
retailers, and partners like T-Mobile, Best Buy, Sprint and AT&T from the US, UK, Germany and
France.
What new services are customers asking for? GPS remains the most requested feature among buyers
at 18% (20% previously).11
2008 was the breakout year for GPS in mobile phones. In 2009 GPS will begin to penetrate into a
range of vertical markets, such as cameras, laptops, sporting equipment and first responder radios.
This will help to drive GPS chip shipment growth of over 25% year-on-year.
While global mobile handset shipments fell 13 percent year-over-year in the first quarter of 2009 –
the fastest fall rate in the industry’s history, GPS-enabled phones will climb to 300 million units for
the year, an increase of 25% over 2008. Strong performance will be driven by the ongoing demand
for feature-rich smartphones. Although slowing slightly in 2009, demand for smartphones, a group
that includes the Apple iPhone 3G, RIM’s BlackBerry devices, and Nokia N series phones among a
growing list, will increase at an average annual unit shipment rate of 19 percent through 2014.
During the period, GPS chipsets will continue to penetrate this segment; nine of every ten
smartphones will contain GPS chips in 2014, compared with one in three in 2008.
Handset vendors will increasingly leverage mobile applications to drive handset sales especially for
higher-end, higher-ASP (average selling price) and richer margin handsets. As handsets increasingly
serve more purpose than just voice and text communication, the ability to customize what the
handset can do for the user by the user will become important. Retention of customers is the other
big driver – a user is less likely to switch from an iPhone to a Nokia device after having customized
11
http://www.canaccordadams.com/NR/rdonlyres/C8F3D7AD-426B-42B5-BE8D-5FC3FB59233A/0/Feb2009HandsetSurvey.pdf

14
the handset with all his/her favorite applications and is very unlikely to forego any paid applications.
This is even more important today when replacement handsets account for 59% of total handset
sales (2008) up from 55% in 2007, and are expected to increase to 67% by 2010.
Differentiated service and software rather than only the hardware is already impacting market share
changes in the high-end space. Nokia has lost 10 percentage points (pp) of share in the converged
device space in 2008 vs. 2007 while Apple and RIM together have gained 11 pp. One of the attractive
features of using the iPhone, besides the capacitive touch screen, is a very large selection of
useful/entertaining applications that utilize handsets technological capabilities, including location
awareness.
Figure 4 Annual shipments of GPS-enabled handsets, million units, 2008-2014
3.5. Growing demand for precision GNSS
Precision GNSS equipment capable of accuracies of less than 10cm are used in a steadily growing
number of applications including land, marine and aerial surveying, structural monitoring of dams,
bridges and buildings, earthquake/tsunami warning systems, atmospheric and meteorological
research, space craft navigation and machine control systems for cargo handling, agricultural and
earth moving equipment.
Precision GNSS is rapidly developing from a niche technology for scientists and surveyors to an
essential productivity tool in globally important industrial sectors such as mining, agriculture and
construction. These milestones include the value of precision GNSS systems used for industrial
applications such as machine control in agriculture and civil engineering exceeding that of precision
GNSS for traditional uses such as surveying and science for the first time.
The precision agriculture segment has been performing well, showing double digit growth rate over
the past 5 years, and remains a leading driver for precision GNSS equipment market. Despite good
value proposition and healthy growth, the market remains well under penetrated. In North America,
less than 30% of farms greater than 200 hectares use guidance systems and less than 5% utilize auto-
steering devices.

15
Market for auto steering solutions harnessing precision GPS technology is large, with 3.5 million
tractors and combines in North America alone. OEMs are producing around another 100,000 new
tractors (40+HP) in the United States per year. About 20% of these are GPS equipped.12
In Europe over 150,000 new tractors are sold every year and only 8% of them are currently equipped
with GNSS-enabled receivers, a share that is forecast to rise to 13% in 2012. In addition about 4% of
the tractors being used have been retro-fitted with GNSS receivers.13
4. GNSS Services Markets and Market Trends
4.1. Land Applications, location based services (LBS)
By the beginning of 1990’s GPS receivers for land uses became affordable and commonplace. It
started with vehicle tracking and navigation and with handheld receivers used for hiking, data
collection, and general recreational pursuits. By 2003, the receiver box evolved into a chipset and
now even into a single chip; the prices dropped so dramatically that GPS capability could be
embedded into almost any other kind of electronic device.
The ease and low cost of adding GPS functionality opened up new possibilities and spurred many
companies to offer products and services that were heretofore either too expensive or too complex
for the average consumer.
Growth in new services was especially boosted by symbiotic relationship between GPS navigation
and different communication technologies. With the availability of the Internet, Wi-Fi, and satellite
and cellular links to communicate with GPS-equipped users, mobile location based applications
harnessing many different business models began to appear in the beginning of 2000s. In an
explosion of growth, the number of GNSS users on land has far outstripped all other users combined.
Essentially, every vehicle owner and every cell phone user has become a potential customer. This has
put the ultimate number of GNSS receivers that could be sold into the billions.
The concept of location-based services using mobile phones has been around since the late 1990s.
Its genesis was the Wireless Communications and Public Safety Act of 1999 (911 Act) by the United
States Federal Communication Commission (FCC), usually referred to as the E911 Mandate. The Act
mandated that beginning in 2001, American wireless operators offer some way of locating mobile
customers when they dial 911 (the national emergency number that connects callers to emergency
dispatch personnel) from their mobile phones. Even before the act was formalized, many in the
industry recognized that the same technology to be used for locating people in emergency situations
would also have commercial applications. In fact in the North American market, wireless carriers
have acted as the main channel for nascent consumer LBS sales, leveraging the location
infrastructure they had to create earlier this decade to address Federal E-911 mandates.
Location based services can be divided into consumer and corporate segments. Most commercial
location based applications have revolved around tracking and navigation services, to enable workers
12
Source: Fraser Mackenzie Equity Research 13
http://www.gsa.europa.eu/go/news/egnos-for-agriculture-providing-high-precision-at-a-low-cost

16
to more efficiently plan their routes and to support dispatch services. Asset tracking, too, is an
important LBS application. Although most of commercial services make use of specialized GPS
modules, there is a clear trend towards utilizing GPS equipped handsets for commercial applications
as well.
While consumer-based services have been slower to come to market, many operators throughout
the world now offer some LBS services. Community and entertainment services that are marketed
towards consumer market comprise location enabled chat and messaging applications, games,
friend-finder services and other services primarily designed for leisure or social contacts and
networking. Information services include local search services like “find the nearest” and other
applications that provide localized information based on the user’s position. Navigation services
incorporate all applications aimed at giving directions for drivers or pedestrians by displaying maps
and instructions on the handset display.
Although the LBS services for the consumer market have been around for several years, applications
are now poised for strong growth due to several key drivers. One of the major drivers for location
based services all over the world includes the need on the part of mobile carriers to drive non-voice
revenue in the face of falling voice ARPU (average revenue per user). GPS-based LBS services are
seen as perfect opportunity for generating more mobile internet traffic and creating value-added
non-voice services which would increase subscriber ARPU.
Another important impetus for LBS services has been the growing popularity of GPS-equipped
smartphones and even more importantly the rise of several viable device “ecosystems” which have
become essential outlets for third-party companies and software developers. Significant software
markets have recently developed or are developing for Apple iPhone, Google Android, RIM
Blackberry, Nokia S60 and Palm Pre devices. Especially the Apple’s highly successful launch of its
iPhone in 2007 and associated App Store in 2008 has led other handset vendors and mobile
operators to introduce similar services, which is expected to bring about significant uptake of mobile
applications, including location-enhanced applications, among mainstream mobile users.
There are now (as of autumn 2009) over 2,500 location-based applications available in the iPhone
App Store and close to 400 location-aware applications available in the Android Marketplace. The
most popular type of location software in both stores is Travel, followed by Social Networking. The
Blackberry App World that serves RIM Blackberry devices has 57 location-aware applications.
ThemostpopularcategoriesarecurrentlyTravelandProductivity & Utilities.
The number of European users of mobile location-based services is expected to grow from 20 million
users in 2008 at a compound annual growth rate (CAGR) of nearly 37 percent to reach 130 million
users in 2014. Local search, navigation services and social networking are believed to become the top
applications in terms of number of users. Worldwide, the user base of LBS services will be growing to
486 million by 2012, up from 18.9 million in 2007 and 63 million in 2008.

17
Figure 5 European users of mobile location-based services, 2007-2014
Source: Berg Insight, Mobile Location Based Services 2009
The key enablers for LBS are rapidly falling into place. On-device application stores allow easier
access to mobile services for a broader audience at the same time as flat-rate data plans make
pricing more transparent. In conjunction with more operators opening their location platforms to
third parties, location aggregators have started to provide common application programming
interfaces (APIs) for accessing location data from multiple operators. This together with ever growing
GPS handset sales will allow more application developers to create location-enabled mobile
applications. It is estimated that 20 percent of mobile handsets shipped in 2009 will feature GPS and
that the installed base in Europe will surpass 50 percent of total handsets already in 2013.
With the exception of search and information as well as social networking services that are likely to
become predominantly ad-funded, many other service categories, notably tracking and most
navigation services can be expected to remain premium services. However, besides monthly
subscriptions and per-use fees, service providers increasingly offer one-time fees, service bundles or
device bundles to match consumer expectations.
4.1.1. Navigation
The first personal navigation systems were introduced in the 1980s for use in cars. These were based
on compass and gyroscopes since GPS was not available for civilian use at the time. At the beginning
of the 1990s, the first GPS based vehicle navigation systems became available. The rapid
advancements in micro electronics have since enabled new applications for personal navigation
systems, such as handheld devices with integrated maps.
Modern specialized consumer GPS receivers come in form of Portable Navigation Devices (PND)
which combine positioning capability and navigation functions. Personal Navigation Devices (PNDs),
i.e. transferable devices with integrated GPS receivers and digital maps, have in recent years gained
large scale mass-market acceptance. In Europe, PND shipments grew to 18.1 million units in 2008,
up from 16.5 million units in 2007. In North America, very strong sales resulted in remarkable growth
0
20
40
60
80
100
120
140
2007 2008 2009 2010 2011 2012 2013 2014
Mill
ion
use
rs

18
in 2008 – in total about 18 million units shipped, compared to 11 million in 2007. Booming personal
navigation device market is expected to grind to a halt in 2009 with little or no growth expected in
most regions – global unit sales are estimated to come in at 39 million units. This means that year-
on-year growth will be slowest in five years.
The personal navigation value chain comprises three principal categories of players. These are map
data providers, navigation solution providers and device manufacturers. In many cases, dynamic
content providers and mobile operators are also involved. Digital map data for the personal
navigation market are today available from two dominant players. Navigation software is available
from numerous providers developing products for several hardware platforms.
PND manufacturers
While there are over 100 PND brands on the market in Europe and North America, personal
navigation device market is ruled by two manufacturers – Garmin and TomTom, who together share
61% of the PND market worth about $9.44 billion in 2008 according to financial reports of the largest
producers. The business models of major navigation device producers are based on designing,
manufacturing and marketing GPS enabled navigation, communication and information devices.
This transition from PNDs to smartphone navigation will not be easy for Garmin and TomTom as their
core revenue base will likely shrink, but this process will take some time. TomTom likely has more
financial strength to weather this transition. At heart, TomTom has a core competency in marketing
and design, and their software offerings stand to do well as a featured application in smartphones.
TomTom also outsources its PND manufacturing, a model which should allow for them to scale down
in a declining PND market.
By contrast, Garmin’s core competency rests in hardware manufacturing an area which will be hit
hardest with the shift to smartphone and software offerings. Garmin’s answer to the smartphone
threat has been to jointly develop their own smartphone with original design manufacturer (ODM)
Asus. Garmin Asus nüvifone is unlikely to meaningfully alter the company’s trajectory. The device is
late to market and shows no signing of generating significant volume any time soon. Moreover, in
this field Garmin is competing against several far larger vendors. Success in the smartphone industry
is dependent on operating system platforms and developer interest. Garmin’s OS strategy appears to
be fragmenting, with pledged support to their own proprietary OS, Microsoft’s Windows Mobile and
potentially Google’s Android. This trend will leave Garmin exposed to many forces beyond their
control.
Map providers
Two companies – Netherlands-based Tele Atlas NV owned by TomTom NV and the Chicago-based
Navteq Corporation owned by Nokia, are responsible for supplying data to all major digital mapping
and navigation services in the world.
Nokia Corp. struck a deal to buy Navteq in October 2007 for $8.1 billion, with plans ultimately to use
maps as a cornerstone for selling ads tied to a cellphone user's location. A month later portable GPS
device-maker TomTom beat out rival Garmin in a bidding war for Tele Atlas, with a $4.2 billion offer.
Neither bid could be justified by the financial performance of the companies – Navteq was modestly

19
profitable while Tele Atlas was losing money – but according to analysts buyers were willing to pay a
"strategic premium" because of the value of mapping data to all players in the GPS industry.
Nokia’s acquisition of Navteq shows how serious handset manufacturers are about entering the PND
market and how the development of mobile location-based services can turn many handsets into
cost effective alternatives to in-vehicle navigation systems and personal navigation devices. As of
June 2009 most Nokia smartphones already are location-enabled, and free access to Navteq’s map
database has allowed Nokia to effectively contend with the likes of Garmin and TomTom.
All Nokia location-enabled are currently supplied with pre-installed version of Nokia Maps service,
that offers most if not all the functions that are included in majority of the modern specialized PND
devices and additional functions that are enabled by mobile internet connections. Maps service
includes travel guides, real-time updated maps, points of interests, and traffic information, plus the
expected turn by turn navigation, and more. Nokia Maps is currently the only service of its kind, but
nevertheless could seriously hurt the position of PND manufacturers as Nokia shipped 60.9 million
smartphones in 2008 for a total market share of 43.7 percent. Full Nokia Maps service license,
covering all regions of the world, currently costs €129.99 for one year. Walking licenses for one
country maps data start from €4.99 for one month of service.
Smartphone platforms
Navigation software is today available on most large smartphone platforms. Apple has preinstalled a
Google Maps application on their popular iPhone handset. Google Maps is also available on all
Google Android smartphones. Google Maps on mobile platforms offers most of the functionalities
that are available with Nokia Maps and is free to use. The main difference lies in the fact that unlike
Nokia Maps, Google Maps does not allow users to download maps into their handsets, so it requires
a data connection of some kind to function.
Operator-branded white label navigation solutions are also supplied by major cellular carriers.
Largest mobile carrier in US, Verizon Wireless offers VZ Navigator GPS navigation software that is
compatible with most of its GPS handsets. The service costs $2.99 per day or $9.99 per month. VZ
Navigator will not incur data transfer charges, to download updates to the software, maps updates,
routes or re-routes. The software is based on Networks In Motion, Inc. mobile platform.
UK’s leading mobile network operator Vodafone is offering Vodafone Find & Go Sat Nav service in
Britain. The service, launched in February 2008, provides users with both in-car and pedestrian
navigation. It features 3D maps, live map updating, live traffic alerts and points-of-interest data. The
subscription to the service costs GBP 5 per month. When using the service data charges apply.
Service is based on Telmap Ltd. Navigator application.

20
Figure 6 Evolution of portable navigation devices
Perspectives for PND market
Map data is currently 75 percent of the cost of a specialized PND device. As portable navigation
system revenues and prices have been in freefall for the past 12 months, whereas map data prices
have stayed constant, the profit margins on PND manufacturers have fallen considerably. Shrinking
profits, low-cost competitors, and especially the rise of the smartphones have forced PND producers
to re-think their entire business models.
PND vendors are increasingly looking at service revenues as device revenue growth slows. In Europe,
total device revenues peaked in 2007 and revenues in North America peaked in 2008. In order to
make navigation services useful in everyday situations for more people, introducing wireless
connectivity to PNDs can enable integration of online services such as local search, enhanced traffic
information and automatic map updates. Many in the PND industry at the same time remain
skeptical about the potential of connected PNDs to become strong enough to salvage the market.
According to these arguments consumers want more than the standard PND, but they are not willing
to pay a whole lot of money for it. This opens up further opportunities for the handheld market as
GPS related components represent a marginal part of the overall cost of the smartphone.
Vendors are also adding new features and refining the user interface to facilitate command and
control, as well as improve the information presentation. New models will, for instance, gradually
introduce automatic speech recognition technology, 3D map features and photo-realistic textures.

21
New features and services will likely be crucial for convincing existing customers to upgrade their
existing devices to more advanced models.
4.1.2. Tracking & fleet management services
There are several types of tracking services for both consumer and corporate customers. A basic
distinction can be made between asset and people tracking services. People tracking services can be
used to locate elderly and children, or be used as portable alarms. Asset tracking services are used to
locate objects such as cars, courier shipments and similar. In contrast to people tracking services
privacy issues are less of a concern for asset tracking services. For corporate clients there are also
fleet management services and workforce management services available. These services are mainly
marketed as productivity enhancement services. Most tracking services need indoor coverage to be
useful, but the position accuracy needed varies depending on the specific application.
Tracking services are most widely used by corporate customers. Corporate market also generates the
majority of revenues for tracking services segment of the GNSS market. An increasing number of
businesses are deploying location-enhanced applications for asset tracking, fleet management and
workforce automation. There is also a market for tracking services among consumers, even though
this segment will be of relatively smaller value.
According to research firm Gartner, European corporate tracking services market, including fleet
management, was worth around €170 million and is estimated to reach €323 million in 2010. The
automotive telematics market (corresponding today mainly to a security devices for tracking stolen
vehicles) is a market in full expansion. It represented around €75 million in 2006 and is estimated by
Gartner to reach €105 million in 2010.
The European consumer tracking market, including asset tracking and services for tracking elderly
and children, is expected to be worth €18 million in 2009 and reach €40 million by 2010.
Asset and personnel tracking
Due to their activities, many companies have a large number of valuable assets in faraway places.
Keeping track of assets such as trailers or construction equipment is intricate, but using an asset
management system can optimize operations and minimize theft and misuse. There are numerous
systems available to monitor asset location based on GPS or mobile network location. Vehicle-
tracking solution companies are introducing new products that provide multiple functions including
location, security etc. Another popular function is geo-fencing where the system has defined a virtual
area where an asset should be located and triggers an alarm if the asset leaves that area. Companies
are implementing some or all of the above solutions, which all have one thing in common – they all
need wide area mobile connectivity to link the information generated by these devices to head
office. Indoor coverage is also useful. Tracking services are also marketed towards consumers, for
instance for tracking of stolen vehicles.
Many companies, such as security companies and other companies with many field workers, can
benefit from a work force management system. Systems integrated into handhelds typically enable
workers to send messages, status updates and positions to the company enterprise system. The
workforce manager can send back messages, view workers on a map, as well as give routes to new
sites. Security functions such as alarms are also part of the service.
22
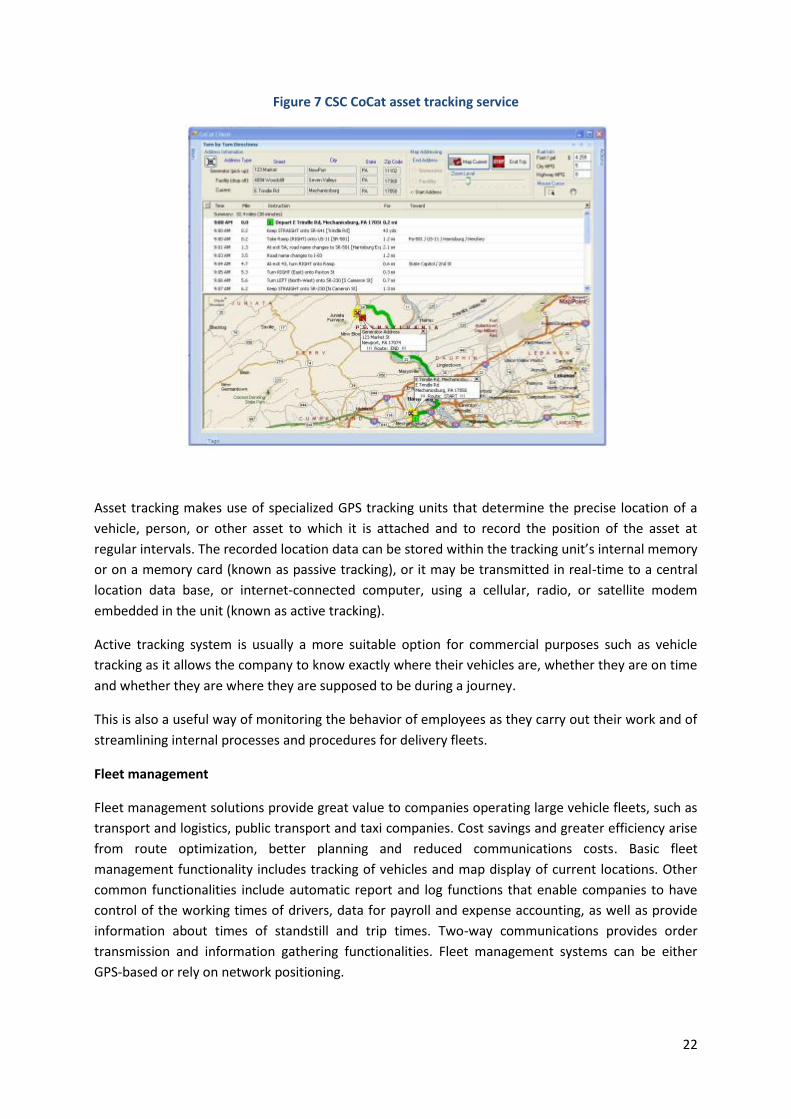
Figure 7 CSC CoCat asset tracking service
Asset tracking makes use of specialized GPS tracking units that determine the precise location of a
vehicle, person, or other asset to which it is attached and to record the position of the asset at
regular intervals. The recorded location data can be stored within the tracking unit’s internal memory
or on a memory card (known as passive tracking), or it may be transmitted in real-time to a central
location data base, or internet-connected computer, using a cellular, radio, or satellite modem
embedded in the unit (known as active tracking).
Active tracking system is usually a more suitable option for commercial purposes such as vehicle
tracking as it allows the company to know exactly where their vehicles are, whether they are on time
and whether they are where they are supposed to be during a journey.
This is also a useful way of monitoring the behavior of employees as they carry out their work and of
streamlining internal processes and procedures for delivery fleets.
Fleet management
Fleet management solutions provide great value to companies operating large vehicle fleets, such as
transport and logistics, public transport and taxi companies. Cost savings and greater efficiency arise
from route optimization, better planning and reduced communications costs. Basic fleet
management functionality includes tracking of vehicles and map display of current locations. Other
common functionalities include automatic report and log functions that enable companies to have
control of the working times of drivers, data for payroll and expense accounting, as well as provide
information about times of standstill and trip times. Two-way communications provides order
transmission and information gathering functionalities. Fleet management systems can be either
GPS-based or rely on network positioning.

23
Stronger focus on cost efficiency is the main driver of fleet management market. It is expected that
penetration rate for fleet management in Europe will continue to increase in 2009 and 2010. The
number of fleet management systems in active use is forecasted to grow at a compound annual
growth rate of 20.5 percent from 1.1 million units at the end of 2008 to 3.3 million by 2013. The
penetration rate in the total population of non-privately owned commercial vehicles is estimated to
increase from 3.1 percent in 2008 to 9.3 percent in 2013. In the US currently nearly 1.9 million GPS
devices are used to monitor fleet vehicles, trailers, construction equipment and mobile workers.
Figure 8 Installed base of fleet management units (EU27+2, 2007–2013)
Source: Berg Insight
A diversity of international aftermarket solution providers compete for the top positions on the
European market. These include specialists such as Cybit, Minorplanet, Navman Wireless and
Trafficmaster from the UK, Masternaut from France, Digicore and MiX Telematics from South Africa
and Punch Telematics and Transics from Belgium, as well as the large corporations GE and
Qualcomm. The navigation vendors TomTom and Garmin are also active on the market, employing
strikingly different strategies. Trimble is a new entrant on the European fleet management market
but has a leading position in North America following the acquisition of @Road in 2007. Masternaut
is ranked as the largest player overall in terms of installed base with 100,000 units deployed, mainly
in France and the UK, while Transics is ranked as number one in the heavy trucks segment with about
55,000 units installed. All major truck manufacturers on the European market offer OEM telematics
solutions as a part of their product portfolio. Mercedes-Benz, Volvo and Scania launched their first
products in the 1990s and followed by MAN in 2000, Renault Trucks in 2004, DAF Trucks in 2006 and
IVECO in 2008.

24
Companies offering tracking and fleet management services
Masternaut
http://www.masternaut.co.uk/
Masternaut, founded in 1997, is the European leader in fleet management and asset tracking with
more than 100,000 equipped vehicles for 5,000 clients all over Europe. The company, which is based
in France and has a most significant presence in France and UK, has experienced rapid growth in
business and recorded a turnover of more than 31 million euros in 2007, rising to over 40 million in
2008. In March 2009 Masternaut was acquired by Hub télécom, the specialized telecom division of
Europe’s second largest airport group Aéroports de Paris. In the UK, Masternaut solutions are sold
through an independent business partner: Masternaut Three X.
Masternaut offers large range of vehicle and asset tracking services, mobile workforce applications,
and a range of back office, business intelligence and business management applications.
Vehicle and asset tracking services provides extensive visibility of vehicles including engine on/off
times, vehicle location, journey start times, speed, journey duration and journey end times as well as
idling. Alerts can be established to draw attention to specific circumstances associated with tracked
assets. These customizable alerts include out-of-hours vehicle usage, excessive speeding, vehicles
travelling outside pre-defined areas or late departures from appointments.
Mobile workforce services include a set of solutions that give real-time visibility of workforce. Mobile
workforce services also include satellite navigation application that comes integrated into central
tracking solution. A separate lone worker communication wearable device and service “Lokate” is
offered. It gives insight into location and historical movements of lone workers, allows sending alerts,
SMS messages and making telephone calls.
All Masternaut’s tracking solutions are fully-managed and operate through dedicated web-portals so
there is no investment in hardware needed or software installation required for clients and regular
automatic updates are included in the service. Geographic and location-based information for all
services is visualized using Microsoft’s Bing Maps for Enterprise platform.
Masternaut vehicle and asset tracking and mobile workforce services are priced by user. Prices range
from €25-€135 per vehicle or user per month. Lokate GPS watch costs £295.00 (€355) plus £14.95
(€18) per month subscription fee.
Cybit
http://www.cybit.co.uk/
Cybit is one of Europe’s leading providers of real time GPS vehicle tracking, fleet management tools
and mobile workforce tracking systems. Company currently provides tracking for 46,000 vehicles in
2,000 fleets. In 2008 company revenues were up 48% from £13.3 million (€16 million) in 2007 to
£19.7 million (€23.6 million).
Cybit Fleetstar range of services is divided into three groups – Field Service Management, Transport
& Logistics, and Public Sector & Utilities. Field Service Management services provide tools for

25
managing a mobile service workforce by providing access to real-time information about employee
locations and activities. Transport & Logistics services provide advanced fleet tracking and reporting
solution, with additional modules enabling advanced and user driven reporting, automatic links to
power take off, integrated satellite navigation and duty of care and data analyzer modules. Public
Sector & Utilities services are specifically designed to provide organizations delivering service into the
public arena with visibility of their mobile operations and vehicle fleet.
Fleetstar is a modular system that enables functionality to be added as and when usage develops or
your circumstances change. These enhanced options are available as a system upgrade on the
existing Fleetstar platform. No additional hardware or installation is required and modules are fully
configurable to individual business requirements. All Cybit services are fully-managed and accessed
through an internet-based platform.
Cybit Fleetstar tracking services are priced from £1.20 (€1.44) per vehicle per day.
Computer Sciences Corporation, CSC
http://www.csc.com/government/offerings/11054/20217-omnilocation
Computer Sciences Corporation (CSC) is one of the leading providers of management consulting and
IT services. The company is one of the leading outsourcing solutions providers in the world. It has a
strong position in providing IT services to government customers and is a top 10 federal contractor in
the United States. The company primarily operates in the US and Europe. Other international
operations of the company are in Australia, Asia and Canada. The company is headquartered in Falls
Church, Virginia and employs 89,000 people. The company recorded revenues of $16,739.9 million
during the financial year ended March 2009 (FY2008), an increase of 1.5% over 2008.
CSC’s wide range of services includes OmniLocation suite which is a set of safety location systems for
tracking people, vehicles, materials and assets. OmniLocation integrates location-based systems
data, such as GPS and RFID, with static and dynamic information about people, equipment, vehicles,
assets and infrastructure. Organizations can monitor the real-time location and status of assets in
motion or at rest through a single, interactive, real-world Web interface using Google Earth products
and Web 2.0 methods. In addition, the interface can integrate multiple location and mobile asset
tracking systems, including inventory management, vehicle tracking, access control, and status and
maintenance schedules of infrastructure.
The OmniLocation suite, launched in June 2008, includes three offerings that address a range of
location requirements: LOFT (Location Object Field Tracking), LISA (Location Intelligent Safety
Application) and CoCAT (Chain of Custody Asset Tracking).
OmniLocation’s LOFT solution is designed to help organizations visualize, protect and account for
mobile assets including lone workers (e.g., pipeline inspectors) and vehicles in the field. LOFT has
been used in 2007 and 2008 Tour of California and Tour de France professional cycling races, giving
cycling fans a “bird’s-eye view” of the race by tracking riders online during the race.
LISA enables organizations to visualize people, vehicles and assets that are moving or dispersed
throughout a facility. The solution integrates indoor (RFID) and outdoor (GPS) location information
data, object attributes, communications, and context and association information to track, map and

26
model enterprise operations in real-time. LISA combines situation awareness with location
information to help improve safety and security, prevent accidents and can be used to account for
personnel in an emergency.
Figure 9 CSC Omnilocation iPhone client for tracking Tour de France riders
CoCAT provides companies with reliable accountability and a visible chain of custody during the
transportation of high value, hazardous or dangerous materials to help eliminate fraud and comply
with materials handling legislation. The solution combines fleet, asset and identity management, and
biometrics with location tracking information (GPS and RFID) to verify and monitor truck, trailer,
driver-custodian, shipper and receiver authentication.
4.1.3. Traffic management & public transport
Nowadays, sensors installed at selected traffic intersections are the main means of determining the
current traffic situation in real time in a large conurbation. The quality of the data depends mainly on
the number and spread of the systems installed.
In US the largest commercial traffic analysis network is operated by Navteq with over 4,000 lane
kilometers of sensors. In total the United States highway network consists of 6.4 million kilometers of
roads and streets. All commercial and federally managed sensor systems combined currently cover
less than 0.2% of the total US highway network. As a rule, the available investment budget limits the
quantity of sensors. Expensive cost of the sensing networks means that traffic information is usually
only available for busy highways in large metropolitan areas, but it's missing on arterial roads feeding
into these highways or on rural secondary roads. Thus the quality of the traffic information is
adversely affected by the small number of deployed monitoring sensors.
On the other hand, due to the recent advance in embedded techniques and wireless networks,
mobile devices with powerful computation, comparatively large storage, localization and wireless

27
communication capabilities are becoming increasingly popular. Alone in 78.0 million GPS-enabled
handsets were sold globally and shipments are forecasted to reach 770 million units in 2014.
In by utilizing GPS techniques, these powerful mobile devices can easily obtain the GPS information
in which the location of users and the speed are now available for navigation services or location-
based services. Data collected from mobile GPS devices provides access to real-time information on
traffic flows, crashes and travel time to help drivers anticipate delays. This traffic information
represents substantial value to the US economy as each year congestion costs $78 billion in delays
and wasted fuel, according to a report from the Texas Transportation Institute, a research arm of
Texas A&M University.
The use of GPS technology in public transportation such as buses and taxis is also increasing rapidly.
By equipping public transport vehicles with GPS transmitters, their location and speed can be
constantly tracked and this information turn is used to display estimated time of arrivals at street-
side bus stops. Tracking taxi cabs with GPS can yield significant cost savings and customer
satisfaction. When a call for a cab comes in the dispatcher can use a GPS tracking system to locate
the cab nearest to the pick-up. This saves not only vehicle miles but the customer also gets picked up
faster and to his destination happier.
Electronic satellite-based toll collection technology has advanced to the forefront of the discussion
on highway finance as policy makers seek a stable revenue source for funding maintenance and
construction of the highways. Construction costs have escalated and the demand for safe and
efficient highways has steadily increased all over the world. Highway capacity has increased
insignificantly over past decades while at the same time vehicle miles traveled have increased
dramatically. Increasing cost coupled with decreased revenue per mile driven has caused policy
makers to move towards mileage based user fees, which are seen as an effective way for generating
additional funds for transport infrastructure.
A GPS based tolling system relies on digital maps rather that overhead gantries or embedded loops
to determine a vehicles’ location and miles traveled for the purpose of assessing a charge. There is no
infrastructure on the ground other than what is used for enforcement; the basemaps and GIS
systems serve as virtual cordons where fees are assessed. Therefore, systems must be thoughtfully
developed and extensively tested to ensure their reliability and accuracy.
Siemens and China Mobile
In August 2008, Siemens and telecom provider China Mobile launched a pilot project in the Chinese
city of Guangzhou that utilizes positional data of taxis transmitted via GPS to obtain information on
the current traffic situation.
In many Chinese cities taxi fleets are equipped with satellite-based on-board units. The original aim
of this measure was to increase the safety of taxi drivers. The system signals the position of each taxi
to a central coordinating and monitoring office. The taxi can be located at any time thanks to the
positional data obtained via GPS.
During the project positional data of the more than 17,000 taxis are recorded every 20 seconds and
processed. The time, current position of the taxi, its direction of travel and its current speed are
recorded. Given that the taxis in the city are included in the normal flow of traffic on the main roads

28
– there are no separate lanes such as bus lanes – this pool of data constitutes a comprehensive
platform of information on the current traffic situation.
The data are then made available to telecom provider China Mobile who offers them to other road
users via general-access information sources such as cell phones, the web or via a hotline. The
information is also available on PDAs or PNDs (Personal Navigation Devices). This business model is
not only of interest to China, but could be implemented in all cities currently planning similar
projects.
Dash Navigation, Inc.
http://www.dash.net/
California, US based Dash Navigation was the first company to introduce internet-connected
personal navigation device to the marketplace in 2008. Dash approached traffic information
reporting in a new way - by collecting information from other people driving real commute routes,
during real commute times.
The Dash Express unit is a PND unit that can communicate back to the Internet using cellular data
networks or Wi-Fi (it contains three chips: GPS,Wi-Fi, and GPRS). Through its cellular and Wi-Fi
modems, the Dash Express delivers real-time traffic reports and monitors each of its user's road-
speed data as they travel. It reports the road-speed information to other Dash users within minutes,
creating local traffic reports, and thus providing the most up-to-date traffic information available.
Dash also added the more commonly available alerts from road sensors and other reporting sources
to supplement their network.
The quality of the traffic predictions made by Dash is directly correlated with the amount of users
providing input to the system – the more people who have the devices in a given area, the more
accurate the information.
Unfortunately, Dash couldn’t build a large user base and in June 2009 company was acquired by
Research In Motion (RIM), the Canadian maker of BlackBerry smartphones. Financial terms of the
deal were not disclosed. Dash had raised a total of $71 million in venture capital funding.
It is expected that RIM, who controls 17.4% of the global smartphone market, will use Dash’s
technology to upgrade the GPS capabilities in their upcoming devices in some capacity. Potentially,
with Dash’ technology RIM could turn its Blackberry users (28.5 million as of June 2009) into the
largest GPS network of traffic sensors not only in the US, but worldwide. This could open up totally
new possibilities for commercial traffic management applications.
Nokia and Navteq
Nokia and Navteq in conjunction with the University of California at Berkeley are currently running a
project called Mobile Millennium in the San Francisco Bay Area that uses GPS-enabled cell phones as
traffic monitors or "probes" to collect real-time traffic data14.
14
http://traffic.berkeley.edu/
29
To participate in the project volunteers with phones running on T-Mobile or AT&T's services can
register their phones and download the appropriate software through the project web site. Nokia
does not need to be the manufacturer of the hardware, but the phone needs GPS and has to be able
to run Java applications, like RIM Blackberry smartphones and Apple iPhones.
In brief, project uses anonymous speed and position information gathered by GPS-equipped cell
phones, fuses it with data from static traffic sensors, and broadcast traffic information back to the
phones.
As users drive with their phones in the car, they cross the virtual trip lines placed every quarter mile
on the Navteq maps on the program. As this happens, phone knows to send its coordinates and
traveling speed back to the engineers at UC Berkeley, who have created the algorithms to process
the data. Data is gathered only from locations that are statistically significant for traffic information.
This careful targeting minimizes bandwidth usage by collecting only traffic-relevant data, and equally
important, is privacy aware. The ultimate aim of the project is to provide drivers with current traffic
information where and when they can use it to make informed travel decisions that keep traffic
flowing.
Similarly to Dash Navigation traffic information system, the program will only work where there's a
large enough sample size to analyze. According to researchers in Nokia Research Center in Palo Alto,
Calif., the application works efficiently with only 2 percent of the drivers on the road using it.
Currently about 10,000 volunteers have joined the program.
Nokia expects a commercial offering to be available within the next two years. It's not clear yet if
Nokia will make the application available to phones other than ones made by Nokia. It's likely that
the application could be made available as part of a service offered through a wireless operator. This
would likely mean that it would be available on a wide range of handsets from other manufacturers.
Nextbus
http://www.nextbus.com/
NextBus, Inc., founded in 1997, provides vehicle arrival and departure information solutions. NextBus
uses GPS tracking systems fitted into vehicles to provide arrival information and real-time maps to
take into account the actual position of the buses, their intended stops, and the typical traffic
patterns to estimate vehicle arrivals with a high degree of accuracy. The predictions are then made
available on the internet and to wireless devices including signs at bus stops and business, internet
capable handsets, and PDAs.
NextBus service is currently used by approximately 45 transit agencies in the United States and
Canada. NextBus service costs $2,500 per vehicle tracker device and $40 per vehicle per month.

30
Toll Collect
http://www.toll-collect.de/
Berlin based Toll Collect GmbH is an operator of the toll collection system in Germany. Toll Collect
GmbH is a joint venture of Daimler Financial Services AG, Deutsche Telekom AG and the French
motorway operator, Cofiroute S.A.
Distance-based truck toll for Germany for proposed in February 2000. The aim was to equitably share
the costs of maintaining and expanding transport routes. At the same time, the introduction of a
truck toll was intended to guarantee German and foreign transport companies equal competitive
conditions, offer railroads and inland shipping companies an opportunity to shift more goods traffic
from the roads to railways and waterways, and to generate additional income for maintaining and
expanding the transport infrastructure. In 2002 Toll Collect won the bid for the development of a toll
billing system from the German government.
Since January 2005, when Toll Collect system became operational, a distance-based toll has been
collected on German motorways for all trucks with a gross vehicle weight of 12 tons or more. From 1
January 2007, the truck toll has also applied on some sections of German non-motorway trunk roads
(Bundesstrasse).
Toll Collect system which is based on satellite positioning (GPS) and mobile communications (GSM) is
the biggest public private partnership project in Germany. The joint venture collects around three
billion euros in tolls each year on behalf of the German state. With a road network covering around
12,000 kilometers, Toll Collect operates the biggest European toll network.
The mainstay of the system is automatic log-on. An On-Board Unit (OBU) installed in the vehicle uses
GPS signals and other positioning sensors to automatically determine which toll route segments a
truck is driving on. The OBU pinpoints the location of the truck and is able to identify its position on
any of the 5,400 route segments on more than 25,000 kilometers of the German toll road network
(both directions). The On-Board Unit then calculates the toll charge payable, on the basis of the
details provided by the user relating to emissions class and number of axles, before transmitting this
information to the Toll Collect computer centre using mobile communications.
To be able to log-on with an OBU or via Internet, vehicles and users must be registered with Toll
Collect. Road usage charges for registered users are paid by LogPay plan (debit method), AirPlus
Road Account, credit account or fuel card.
The level of the toll is based on the emissions class and number of axles on the truck and on the
distance travelled on the toll route. As of June 2009 toll rates per kilometer range from €0.141 to
€0.288.
As of spring 2008 almost 620,000 OBUs have been installed to vehicles all over Europe, including
more than 1,200 in Estonia. To handle the installation and maintenance of OBUs, Toll Collect has
established a Europe-wide network of more than 1,900 authorized Service Partners.

31
4.1.4. Location-based social networks (LBSN)
According to Nielsen Online two thirds of the global online population or about 1 billion people are
currently using online social networking services. Worldwide user base of social networking
increased by 25% in 2008 compared to 2007. Overall increase of users is high in Middle East Africa
with 66% of growth and the users in Europe increased by 35% when compared to 2007. The amount
of time spent online globally increased 18% between December 2007 and December 2008. In the
same period, however, the amount of time spent on social networking sites rose 63%. Largest social
networking sites Facebook and MySpace both have more 200 million users. As of June 2009
Facebook global user base is still growing at year-on-year pace of more than 100%.
Large and growing user bases that can be easily segmented based on communication streams have
led online social networks to monetize their services through an advertising-driven business model.
Research firm EMarketer estimates that Facebook's 2009 US ad revenue will come in at $230 million.
Facebook’s overseas ad revenue is expected to grow to $70 million in 2009, a 75% increase over
2008. Worldwide, online social network advertising spending is expected to grow to $4.1 billion in
2011 from $2.1 billion in 2008.
Mobile or location based social networks are seen as the next important step in the development of
social network services. In essence LBSN services will take social networking to the next level by
integrating location technologies like GPS navigation functionality into these services. LBSN services
enable people to track and share location related information with each other, via either mobile or
desktop computers. As location is one of the most important aspects for people’s everyday lives, a
lot of novel application scenarios can be supported by LBSN. For example, trustworthy location
recommendations can be collected and shared within location based social networks and used to
rank interesting locations, discover new places, people and activities.
There are three primary methods of revenue generation for mobile social networking applications—
advertising, subscription services, and premium upgrades. Although the subscription services and
premium upgrades may work for some of these networks if what they offer is truly high-quality or
unique, the advertising revenue is still the most promising income source for mobile social networks.
With half the world's population soon owning a cell phone, the opportunity to reach more people on
the Web via a mobile device is very substantial. Research firm Gartner predicts that total worldwide
mobile advertising revenue will grow from less than $2.7 billion last year to $12.8 billion in 2011.
The central assumption of the industry business models is that thanks to highly targeted location-
based advertising that has significantly higher CPM (cost-per-impression) rate than even traditional
web and mobile advertising (e.g. SMS campaigns), there is a good chance that a mobile social
network that manages to attract enough users (or any of the already establish social networks that
releases a location aware application) will be able to be financially successful.
According to some speculative estimates, location-based social networks like Brightkite, GyPSii,
Pelago and Loopt could reach revenues as high as $3.3 billion by 2013.15 This analysis points out that
successful business models may differ from what many industry participants and observers currently
expect. Location-based advertising integrated with sophisticated algorithms may hold a lot of
15
http://www.abiresearch.com/press/1204-Location-based+Mobile+Social+Networking+Will+Generate+Global+Revenues+of+%243.3+Billion+by+2013

32
promise, but the current reality rather points to licensing and revenue-sharing models as the way
forward for mobile social networking start-ups to grow their customer base and reach profitability.
Recent evidence include the agreements between GyPSii and both Garmin and Samsung. Similarly,
Loopt has established partnerships with all major US cellular carriers.
Indeed, largest networks, e.g. Loopt currently receive lion-share of their revenues from wireless
service providers. But, as some evidence suggests, this might be changing as networks have started
to sign significant deals to provide advertising based on GPS location information.
Companies offering location-based social networks
Loopt
http://loopt.com/
Loopt is a Mountain View, California, United States based company providing a mobile social
mapping application. Using cell phones and mobile devices, Loopt application displays the locations
of a user’s friends along with their presence status (available, away, etc) visually on maps or on lists.
Based on GPS and related data, users can request alerts when friends are within a certain distance,
send messages to groups of friends in particular area, and be able to tag and blog physical locations
in a way that’s accessible to friends through Loopt. Users can also take pictures from their cell
phones and tag them; these pictures will be available to friends and others on the Loopt network.
Loopt is also integrated with other social networks – it allows sharing location with friends in
Facebook and sending status updates via Facebook or Twitter micro-blogging service.
Loopt was founded in the spring of 2005 and received initial funding from Y Combinator, an early
stage investment company. Company has since raised $13.3 million in Series A and B financing led by
Sequoia Capital and New Enterprise Associates. Loopt is available on all major US mobile carriers –
Verizon, AT&T, Sprint, MetroPCS, Nextel, Boost Mobile, T-Mobile. All together more than 100
phones are supported including iPhone, Blackberry, Windows Mobile, and Google Android platforms.
Loopt has currently more than 1 million users and is one of the most popular services to allow people
to track their friends via their smart phones.
Loopt is free on most carriers and devices, but a fee of $3.99 applies on some networks and
platforms. The company currently makes most of its money selling its technology to wireless carriers
and acting as a platform for other software developers. Loopt has a 50/50 revenue sharing
agreement with carriers. Overall revenue was estimated to be $2.7 million in 2007 and $21.5 million
in 200816. Loopt expects to more than triple its revenue and become profitable in 2009. According to
company, local mobile advertising revenue could make up as much as 70 percent of total sales by the
end of 2009 financial year.
Whrrl
http://whrrl.com/
Whrrl is a location-based social network and discovery service developed by the Seattle-based
company Pelago, Inc. Whrrl is currently offered in two versions. Initial release is a social network and
16
http://www.stanford.edu/group/codeforcommunity/Projects/SummitVentures.pdf

33
mobile location awareness service that enables personalized discovery for the real world. It gives
users access to 6.5 million points of interest throughout the United States. This includes bars and
clubs, restaurants, movie theaters and concert halls, fitness centers and ohter personal services, for
example. For each of the places Whrrl lists, individuals have access to 70 different data ponts (such as
price, hours, distance, neighborhood, type of establishment and cuisine, payment options, features,
and user ratings/feedback) that can be used to filter the information, allowing users to make a more
informed decision.
Second version of Whrrl, released in april 2009, is a mobile and Web application that allows users to
combine photos, stories, and their location with the photos and stories of their friends for a
collective storytelling experience. Whrrl treats posts made on the network like stories and utilizes the
smartphone’s built-in GPS – when two or more people are in the same physical location they can join
together and collaborate on the same story. Essentially stories turn into a collective mobile journal
with multiple points of view on the same experience. Stories also have their own unique URL so they
can be shared beyond Whrrl, and can be edited by all participants on the Whrrl website. Whrrl
includes integration with Facebook Connect and Twitter, meaning users can sign up to the service
with thei Facebook credentials, and have location updates and status updates from Whrrl cross-
posted to both Facebook social-networking profile and Twitter page.
Whrrl is available as a Java application and therefore runs on most modern handsets. Whrrl v2.0 is
available only as an Apple iPhone application.
Whrrl, released in 2007, was the first application to get funding from venture capital firm Kleiner
Perkins’ iFund, the $100 million fund which the firm set up to spur iPhone application development.
Pelago has raised all together $22.4 million in Series A and Series B funding rounds led by Kleiner
Perkins Caufield & Byers and Deutsche Telekom.
Whrrl’s business model is advertising supported, using highly targeted, localized offers specific to the
interests of individual Whrrl users. Company will also attempt to monetize the platform by selling
virtual goods.
Brightkite
http://brightkite.com/
Brightkite (formerly Limbo) is a location based social network based in Denver, Colorado, United
States. Brightkite allows users to syndicate their current location to their friends, meet nearby
Brightkite users, and send geo-encoded messages. Application also uses databases to automatically
associate points of interests with GPS locations, so user positions aren’t simply displayed as
coordinates.
Standalone Brightkite application is available only for Apple iPhone smartphones, but the service can
also be used via website optimized mobile browsers, desktop website, and SMS messages. The idea
behind the service, like any other location based social network, is to help people broadcast their
location and meet up more easily. This can include meeting new people that share both a similar
interest and physical location. Unlike other leading mobile social networks, Brightkite application is
available to users worldwide.

34
Brightkite also offers "Brightkite Wall" feature that aggregates all the notes and photos posted from
a specific physical location into a single stream of information. By showing off a Brightkite Wall on
their own websites, a club or a bar for example can advertise itself to anyone who finds its web site
by showing what is currently happening inside the venue.
Current company was formed in April 2009, when mobile social network Limbo acquired competing
network Brightkite and changed its name to Brightkite in a re-branding move. The combined
company employs 35 people and has about two million active users. Limbo, founded in 2005, has
previously raised $24 million in three rounds of funding led by Azure Capital Partners, Draper Fisher
Jurvetson and New Enterprise Capital Partners. Brightkite had raised $1.02 from business angles.
Brightkite business model is based on delivering interactive, highly targeted, location-based mobile
advertisements to the users of the service. Also, Brightkite is planning to monetize its platform by
offering premium features, like Brightkite Wall, for businesses.
4.1.5. Location-based gaming
A location-based game is a form of entertainment using location-aware technologies. Players
equipped with GPS-enabled handheld devices or wearable interfaces are moving through real
settings such as urban environments. Interests in the game derive from the users’ interaction with
the game by changing their position and visiting certain places.
The most popular form of a location-based game is Geocaching17. Geocaching is a treasure hunting
game played throughout the world by adventure seekers equipped with GPS devices. The basic idea
is to locate hidden containers, called “caches”, outdoors and then share your experiences online. The
objective of a location- based game may also be the collection of not physical but virtual items
scattered on the whole city or any other location. As in Geocaching, the challenge is to reach
geographically defined places that have been beforehand created in the game. The use of virtual
items or “caches” instead of physical ones opens up whole new possibilities for creating customized
scenarios and game descriptions.
Orbster
http://orbster.com/
Karlsruhe, Germany based Orbster GmbH designs and publishes online entertainment products for
GPS-enabled handsets. Orbster’s main product is GPS Mission, a platform for user-generated GPS
games such as scavenger hunts, travels through local history, guided tours as well as crime and
mystery stories. Game missions are easy to create, requiring no programming skills. Users can also
use smartphone’s GPS to locate and find other games in the immediate area.
Since launch in May 2008 GPS Mission games have been created in more than 50 countries. GPS
Mission is available for Windows Mobile, Apple iPhone, and Nokia S60 smartphones and also as a
Java application.
Company has received funding from two seed capital investors: High-Tech Gründerfonds, a public-
private venture capital fund based in Bonn and Mesago Holding GmbH, a supplier of outdoor media
17
http://www.geocaching.com/

35
in China. High-Tech Gründerfonds invested €500,000 while Mesago has not disclosed the amount of
its funding. Orbster plans to monetize the GPS Mission platform by offering in-game virtual goods
and localized advertising services from 2Q/2009.
4.1.6. Law Enforcement
GNSS receivers are destined to be a vital tool for law enforcement. The major application is for
keeping track of criminals, whether they are in fleeing automobiles, under house arrest, or out on
parole.
Currently 44 US states out of 50 have some type of GPS monitoring systems in place for criminals.
Monitoring in most of states involves sex offenders, thirteen states monitor also for domestic
violence. About 20,000 sex offenders and 5,000 domestic abusers are being tracked in United States.
Tracking of criminals is usually carried out using ankle bracelets that include an embedded GPS chip
and a cellular chip for transferring the data to monitoring center. Law enforcement officials can track
the movements of criminals in real time using Web-based software.
State of California is one of the pioneers when it comes to tracking sex offenders via the high tech
devices. California now has a total of 4,800 sex offenders equipped with GPS. That total includes all
2,300 of its High Risk Sex Offender (HRSO) parolee population. That is nearly triple the 1,800 GPS
units currently used by Florida, the second leading state using the devices. The California tracking
program running costs are expected to be $106 million in 2009.
In November 2008 the Spanish government agreed to spend five million Euros (6.3 million dollars) on
GPS tracking devices to ensure that men accused of domestic violence comply with restraining
orders. The tracking systems are supplied by UK-based Elmo-Tech Ltd.
Countries including the Britain, France, Germany, Canada and Singapore are also using GPS-based
monitoring systems to track some former prisoners. Japan is seeking to implement similar system in
near future.
A run-away vehicle is a real problem for law enforcement. In the United States there are more than
100,000 high-speed police pursuits each year and in 2007, 424 people were killed in police chases,
according to US federal statistics. A company called StarChase LLC has developed a novel approach to
this recurring problem of stopping criminals fleeing by auto on busy streets and freeways18. The
system is being tested by Los Angeles Police Department.
The unit works as follows. The pursuing police car fires two darts at the fleeing vehicle. The darts
have an adhesive property and unbeknownst to the felon, stick to the rear of the car. They fire two in
case one of them does not adhere properly. The dart contains a GPS receiver and a radio transmitter,
which allow the police to let the car go out of sight and still keep track of its position. The vehicle’s
positions are transmitted via radio and the over the Internet if required, to a central location where
the vehicle’s path is imposed upon a digital map of the area. This enables the police to avoid the
high-speed pursuit and all the potential perils to bystanders and themselves and still to be able to
apprehend the driver by placing a strip of nails far ahead on the projected path or by arresting the
suspect when he finally comes to a stop.
18
http://www.starchase.org/

36
Elmo-Tech Ltd.
http://www.elmotech.com/
Elmo-Tech, established in 1994, a fully owned subsidiary of Israeli-based Dmatek Ltd., is the leading
provider of electronic monitoring technologies for the corrections industry. Company produces
presence and location verification technologies, designed for tracking and monitoring individuals in
the law enforcement and corrections and security markets. Elmo-Tech systems are employed by
private operators and government agencies throughout the U.S., Europe, Pacific Rim and Latin
America.
In the first half of 2008 Elmo-Tech revenues were $23.8 million, increasing by 38% over the
corresponding period in 2007. United Sates accounted for 55% of the total sales, Europe 34%, and
rest of the world 11%. Revenue in Europe amounted to $8.1m, a 26% increase over the
corresponding period in 2007 (H1 2007: $6.4). This expansion came from continued growth in the
company’s various accounts across the continent, notably in France and Spain.
In December 2008 Elmo-Tech’s parent company Dmatek agreed to a £52.9 million (€60.8 million)
takeover by a group headed by Francisco Partners, one of the world's largest technology-focused
private equity funds.
Elmo-Tech is also the provider of monitoring technology for the ongoing Estonian offender
monitoring program managed by the Estonian Ministry of Justice.
4.2. Precision GNSS applications
At its current level of performance, GPS is providing, on average, better than 5-meter horizontal
accuracy, better than 10-meter vertical accuracy, and absolute time within 0.1 microsecond of UTC.
In many instances ordinary stand-alone GPS signal accuracy is not sufficient for completing a
desirable task at an acceptable level of quality.
In order for satellite navigation technology to meet all the requirements of civilian users, the U.S.
federal agencies, European Space Agency and several commercial providers have implemented
augmentation systems to improve the performance of standalone GPS signals. Augmentation
systems use the GPS signal as an input to provide an improved service, usually for a specific region of
interest.
Most widely used technique for augmenting GPS signal is Differential GPS (DGPS). The basic idea of
DGPS is to gauge GPS inaccuracy at a stationary receiver station with a known precise location. Since
the DGPS hardware at the station already knows its own position, it can easily calculate its receiver's
inaccuracy. The station then broadcasts a signal to all DGPS-equipped receivers, providing signal
correction information for that area. These augmentation systems broadcasting signal corrections
can be ground- (GBAS) or space-based (SBAS), depending on the infrastructure used. GBAS uses long
wave radio frequencies to transmit corrections from each base station. SBAS gathers information
from an array of ground reference stations and generates correction signals that are transmitted as
pseudo-GPS signals from satellites.

37
Several satellite augmentation systems are nowadays available or under development. These have
the advantage of a greater coverage than ground bases systems, and usually make use of satellites in
the geostationary orbit (in a fixed position in the equator). These systems can increase the accuracy,
integrity, availability, and continuity of GPS signals, and allow the control of a national positioning
system. In other words, they represent an augmentation to the core service provided by the GPS
satellites, and none will operate on its own without the presence of the basic GPS signals. In most
cases, the augmentations serve as checks on the quality of the basic signals, but together, they
already represent a critical component of several industries of the economy and public safety.
Public satellite based augmentation systems (SBAS):
WAAS (Wide Area Augmentation System) is a GPS augmentation system developed by US
Federal Aviation Administration (FAA) that became operational in 2003. WAAS consists of
approximately 25 ground reference stations positioned across the United States that monitor
GPS satellite data. Two master stations, located on either coast, collect data from the
reference stations and create a GPS correction message. This correction accounts for GPS
satellite orbit and clock drift plus signal delays caused by the atmosphere and ionosphere.
The corrected differential message is then broadcast through one of two geostationary
satellites, or satellites with a fixed position over the equator. The information is compatible
with the basic GPS signal structure, which means any WAAS-enabled GPS receiver can read
the signal. Currently, WAAS satellite coverage is only available in North America and the
signal is free to use. Specifications for WAAS require accuracy of 7 meters or better both
vertically and laterally, 95% of the time. In practice, WAAS has achieved a lateral accuracy of
1 meter and of 1.5 meters vertically when over the contiguous United States.
EGNOS (The European Geostationary Navigation Overlay Service) is satellite based
augmentation system developed by the European Space Agency (ESA) under a tripartite
agreement between the European Commission (EC), the European Organisation for the
Safety of Air Navigation (Eurocontrol) and ESA. EGNOS complements the GPS system. It
disseminates, on the GPS L1 frequency, integrity signals in real-time, providing information
on the health of the GPS constellation. In addition, correction data improves the accuracy of
the current GPS services from about 10 m to about 2 m. The EGNOS Service Area includes all
European states and has the system-inherent capability to be extended to other regions,
such as EU neighboring countries, North Africa and more generally regions within the
coverage of three geostationary satellites being used to transmit the EGNOS signal. EGNOS is
expected to enter its initial operational phase in 2009.
Commercial satellite based augmentation systems:
OmniSTAR is a commercial wide-area differential GPS service marketed by OmniSTAR, Inc.
that is part of the Fugro Group of Companies. OmniSTAR continuously monitors the signals of
all GPS satellites at over 100 known locations around the world, 21 of which are in North
America. The "monitors" (Base Stations) measure the errors from all GPS satellites in view at
their locations and compute corrections. If these corrections can be delivered to "users"
quickly, they can be used to remove most of the errors. OmniSTAR utilizes several
commercial Geostationary Satellites around the world to "deliver" these corrections to
customers. In order for a user to receive the OmniSTAR corrections, an OmniSTAR-enabled

38
satellite receiver must be utilized for receiving and decoding the OmniSTAR data. This system
of measurement and delivery of corrections to customers is in the form of a subscription
service. Customers subscribe to the service for a fixed period, usually one year, for a fee. The
subscription fee and options for subscription duration are dependent on the area of
operations. OmniSTAR fees range from $800 to $2,500 per year per receiver.
StarFire is a global subscription based SBAS service that provides real-time accuracy typically
better than 10cm. Its globally corrected signal is available virtually anywhere on the Earth's
surface on land or sea, from 76 degrees north to 76 degrees south latitude. StarFire was
developed and is operated by NavCom, a component of John Deere and Company, the
leading manufacturer of agricultural machinery in the world. StarFire utilizes a network of
more than 60 GPS reference stations around the world to compute GPS satellite orbit and
clock corrections. Two redundant processing centers and multiple communication links
ensure the continuous availability of StarFire GPS corrections. The resulting signals are
broadcast to users from Inmarsat commercial geosynchronous satellites.
There are two types of subscription licenses to current StarFire2 service, introduced in 2004:
land only (excludes all oceans/offshore), all areas (global coverage). Licenses can be
purchased in monthly, quarterly, semi-annual, and yearly increments. Annual land only
StarFire service subscription costs $1,500, annual all areas subscription costs $5,000.
For some high-precision navigation/surveying applications and precision agriculture applications such
as row crop bed preparation and planting or topographic map generation, sub meter DGPS accuracy
is not enough and can require RTK (Real-Time Kinematic) technology, which is based on the use of
carrier phase of GPS signals. With RTK, a base station is needed placed on a known, surveyed point,
and one or more mobile receivers within a ten kilometer range of base station. The base station
transmits corrections via radio to the mobile receivers in the field. A typical radio link required for
RTK is in the UHF, VHF, or spread spectrum radio band. Radios operate best within line of sight or
with a repeater.
Precision GNSS equipment capable of accuracies of less than 10cm are used in a steadily growing
number of applications including land, marine and aerial surveying, structural monitoring of dams,
bridges and buildings, earthquake/tsunami warning systems, atmospheric and meteorological
research, space craft navigation and machine control systems for cargo handling, agricultural, mining
and earth moving equipment.
Precision GNSS allows for example the positioning of a tractor and other farm machinery in order to
follow a very precise path for seeding or fertilizing, it can be used to position heavy earth movers for
mining and construction operations. Another precise use of GNSS is for structure monitoring and
earth monitoring. In these types of applications, the object tracked is something that is moving
extremely slowly – for example snow or ice thickness on mountain peaks, the movement of glaciers
or movement and deformation of the Earth’s tectonic plates.
Suppliers of precision GNSS goods and services include large established GPS device providers such
as Trimble Navigation (USA, revenues of $1.33 billion in 2008), Hexagon Group – Leica
Geosystems/Novatel brands (Sweden, GNSS revenues of $910 million in 2008), Topcon/Sokkia
(Japan, GNSS revenues of $580 million in 2008) and smaller specialized participants such as
Hemisphere GPS (producer of agriculture specific GPS devices and software), large multi-nationals

39
such as John Deere, and companies providing augmentation services, such as Fugro/Omnistar,
Subsea 7/ Veripos and NavCom.
The global value of precision GNSS products and services is approximately US$3 billion in 2008 and
predicted to grow to a value of between US$6-8 billion by 2012, a CAGR of 19-23%, although
prolonged economic downturn in North America and Europe could see growth slow to a CAGR of 15-
19%. According Trimble and Hexagon growth could even slow to a CAGR of 10% as engineering and
construction segment of the market remains in a historical unprecedented downturn.
The period 2008-2012 will embrace a number of important milestones in the evolution of precision
GNSS from a niche technology for scientists and surveyors to an essential productivity tool in globally
important industrial sectors such as mining, agriculture and construction.
These milestones include the value of precision GNSS systems used for industrial applications such as
machine control in agriculture and civil engineering exceeding that of precision GNSS for traditional
uses such as surveying and science for the first time. During 2008-12, Machine Control applications
for precision GNSS are forecast to grow at a CAGR of 23-28% whereas the growth in Non-machine
Control applications is forecast at 16-21% CAGR.
The large potential of precision agriculture segment is illustrated by several important acquisitions
recently made in this space by some of the largest players in the market. In December 2006 Topcon
acquired KEE Technologies Pty Ltd., an Australian company with over 25 years experience in
agricultural electronics and applications, which focuses on the precision agriculture market. In
October 2008 Hexagon/Leica acquired RINEX Technology, a private Australian-owned company which
designs and produces steering and control system for precision agriculture. In the beginning of 2009
Trimble acquired the assets of privately-held Rawson Control Systems based in Oelwein, Iowa.
Rawson manufactures hydraulic and electronic controls for the agriculture equipment industry. In
June 2009 Trimble acquired privately-held NTech Industries based in Ukiah, Calif. NTech is a leading
provider of crop-sensing technology.
The expected rapid growth in the number of precision GNSS users is essentially spurred by low
penetration rates of precision technologies in several industries. It estimated that in North-America
less than 35% of the large farms make use of advanced agricultural guidance systems, and less than
10% have equipped their vehicles with auto-steering devices. While about 100,000 new tractors were
built in U.S. alone in 2008, only 20% of them were equipped with GPS receivers.
Growth in the number of precision GNSS users (estimated at more than 300,000 globally in 2008) is
encouraging government and the private sector to invest in precision GNSS infrastructure. This
infrastructure uses GNSS reference stations and wireless communications to deliver a data service to
multiple users removing the need for individual users to operate their own GNSS reference stations.
The growth of infrastructure and its associated data services will be a significant feature of the
precision GNSS landscape in 2008-2012. Precision GNSS data services are forecast to be the fastest
growing component of the value chain with a CAGR of 33-38%.

40
4.2.1. Agriculture & Forestry
Precision agriculture
Precision Agriculture is a now a term used throughout agricultural systems worldwide. The 1997 U.S.
Farm Bill describes “precision agriculture” (PA) as “an integrated information- and production-based
farming system designed to increase long-term, site-specific and whole farm production efficiencies,
productivity, and profitability while minimizing unintended impacts on wildlife and the
environment.”
In simple terms, precision agriculture can be defined as a holistic and environmentally friendly
strategy in which farmers can vary input use and cultivation methods – including application of
seeds, fertilizers, pesticides, and water, variety selection, planting, tillage, harvesting – to match
varying soil and crop conditions across a field. By another definition PA is the application of
technologies and principles to manage spatial and temporal variability associated with all aspects of
agricultural production.
Regardless of the actual definition, PA is a management philosophy, which embraces the use of
information technologies, such as GPS and IT-based controllers to improve productivity, reduce input
costs, minimize risk and lessen environmental impact of farming operations.
It has long been recognized that crops and soils within a field and/or region are both spatially and
temporally variable. Growers tried to manage such variability to a limited extent mainly by intuition.
Developments in geo-spatial information and communication technologies especially in the late
twentieth century have made it possible, however, to manage such variability much more precisely
than before. Precision agriculture, therefore, differs from conventional farming as it involves
determining variation more precisely and linking spatial relationships to management actions,
thereby allowing farmers to look at their arms, crops, and practices from an entirely new perspective.
Essential to the application of precision agriculture is the availability of a location positioning system
of sufficient accuracy and reliability that can be used take account of the inherent spatial variability
of the fields i.e. to map of soil, crop and environment factors. This was increasingly available from the
early 1990s in the form of the Global Positioning System. Without GPS as a reliable, reasonable
accuracy, reasonable cost, always available location system, it is unlikely that precision agriculture
would have gained its current high profile exposure.
In-field positioning is required in order to map the sensed soil and crop factors and for the control of
application equipment. The position resolution required covers a wide range, depending on the field
operation, with estimate figures as follows:
Variable fertilizer application – 30 meters
Yield mapping – 10 meters
Variable application of herbicide – 1 meter
Spray overlap avoidance – 10 centimeters
Row crop planting – 10 centimeters
Seedbed structure – 5 centimeters
Plant scale/leaf treatment – 1 centimeter

41
Some aspects of precision agriculture, such as avoidance of spray overlap and application control
near sensitive areas such as field margins, will be practiced at a smaller and smaller scale requiring
higher resolution positioning. Targeting of field inputs to some crops will be at the plant scale, and
even down to leaf scale, requiring much enhanced reliability and accuracy of dynamic positioning. As
standalone GPS cannot provide sufficient accuracy and reliability of signal, precision agriculture
equipment makes use of GPS signal corrections provided by several augmentation techniques and
services such as Differential GPS (DGPS) or Real Time Kinematic (RTK).
GNSS applications in precision agriculture include:
Soil mapping – One of the most common uses of GNSS in agriculture is grid based soil
sampling. By sampling the field in a systematic manner and spatially identifying the sampling
sites, a map can be created identifying soil characteristics and/or fertility levels across the
field.
Topographic mapping – One relatively new use of GPS data is for detailed topographic
mapping, using RTK. In many production settings, topography may have a profound effect
on within-field variability. Topography controls surface water redistribution over the
landscape, can influence crop growth through differences in aspect, and may provide
information about soil type differences. This may be the case even in relatively flat fields.
Our experience indicates that topography can have a significant influence on spatial
variability in yields even when average field slopes are less than 1%. Especially in areas of
flat topography, it is difficult to efficiently obtain topographic maps with the required vertical
resolution. Standard surveying techniques can be used, but require a significant investment
of time and labor.
Yield mapping – Yield mapping is a tool that is one of the first steps towards implementing a
precision agriculture strategy. Yield mapping produces a contoured field map showing high
and low yielding areas of the field. The use of a GPS together with a grain flow sensor on the
main elevator into the grain tank of a combine harvester and a computer-based recording
system forms the basis of a yield mapping system. Recorded data is fed into an analysis
program for smoothing/interpolation and plotting as a contour map of crop yield. Yield maps
as well as soil and topographic maps act as inputs for variable rate application systems.
Variable rate application – Once areas with similar yield-limiting variables have been
identified across the field, these areas can be treated differently using variable rate
application technology. GNSS is needed in this case because variable rate equipment needs
to know where to change the input, be it planting, or applying fertilizers or pesticides. The
varying levels of inputs for areas within the field are defined in a “prescription” for the field.
This prescription defines the kinds and amounts of inputs applied to each of the identified
areas or management zones within the field. In theory, production inputs are applied in each
area in such a manner as to maximize profits for that area. In doing so, profit for the whole
field is also maximized. Also, reduction in inputs, which give the crop only what it requires,
reduces movement of fertilizers and chemicals into the environment.
Automated guidance and automated steering – GPS guidance and auto-steering assist
farmers to precisely map and navigate their fields - enabling straighter rows, no skipped
areas and minimal overlap in input application. With automated steering systems, farmers
can record routes while plowing fields with a recording GNSS system. The vehicle can then be

42
programmed to follow the same route – for cultivating, fertilizing pest control or harvesting.
These products significantly reduce driver fatigue and stress, while saving valuable time, fuel,
and operating costs.
Geo-traceability – GNSS can be used to add geo-reference data to food for fully-traceable
products – including information on how they are grown, what chemicals were used, how
much, and how often.
According to largest industry players, precision agriculture market is competitive, but not heavily
fragmented. Industry includes a few strong participants, who control large majority of the market,
and a few fringe players. Precision agriculture market is estimated to worth $450 million in 2009 and
growing to an estimated $1.5 billion by 2017 with a CAGR of 16.25 percent over the period. Trimble
Navigation is estimated to hold 25% share of the total market; Hemisphere GPS has 13.7 percent of
the market.
A notable trend in precision agriculture GNSS applications is the increased interest in the most
accurate level of GPS positioning – the +/- 1 inch performance made possible with Real Time
Kinematic (RTK) signal correction. The first commercial RTK GPS system was launched by Trimble
Navigation in 1993/94 and currently more than 50% of the farming land using RTK operates on
correction signals provided by Trimble RTK networks. In 2006 it was estimated that up to 16.7
percent US cropland was farmed with RTK-controlled equipment.19 Trimble RTK networks are now
available also in Europe (currently company manages a network in Denmark).
The subscription to RTK GPS service costs about $2,000 or approx. €1,500 annually. The prices for
RTK capable GPS receivers range from €5,000-€15,000 depending features.
The main driver behind the adoption of precision agriculture over coming years will be the rising cost
of crop production inputs, mainly fuel and fertilizers. PA solutions have great potential adding
economical value to the farm in the form of higher input savings and a greater net return. At the
same time the adoption of precision farming has been modest, especially in Europe. A recent survey
by British Agriculture and Horticulture Development Board (AHDB) division HGCA shows only 35% of
UK farmers have even looked into what precision farming could do for them. Surveys conducted in
Germany show that the share of farmers using precision farming techniques has slowly increased
from 6.65% in 2001 to 11.04% in 2006. At the same time 72% of the farmers were familiar with the
term “precision farming” in 2006 compared to 46% in 2001. The most common PA practice in
Germany is GPS-based area measurement followed by GPS-based soil sampling and yield mapping.20
19
http://www.trimble.com/pdf/AG_RTK%20BSNetworks_WP_0806.pdf 20
M. Reichardt, C. Jürgens, „Adoption and future perspective of precision farming in Germany: results of several surveys among different agricultural target groups“, Precision Agriculture 1/2009, http://dx.doi.org/10.1007/s11119-008-9101-1

43
Companies offering precision GPS products and services
Fugro N.V.
http://www.fugro.com/
Since acquiring a leading competitor, Thales GeoSolutions (formerly Racal Survey), in 2003, The
Netherlands-based Fugro N.V. survey and geotechnical services company has dominated the global
GNSS differential corrections market, representing more than 90 percent of the total market. Fugro
was founded in 1962 and has more than 13,600 employees stationed in over fifty countries.
In 2008, Fugro’s total revenue grew by 19.5 percent to €2,154.5 million (2007: €1,802.7 million), with
earnings growing 31.1 percent to €283.4 million (2007: €216.2 million). Its survey division, which
includes OmniSTAR and Fugro SeaSTAR wide-area differential GPS services, saw revenue increase by
12.7 percent to €960 million (2007: €852 million). Fugro’s GNSS network includes more than 100
reference stations.
Fugro SeaSTAR addresses offshore dynamic positioning and marine applications. OmniSTAR focuses
on on-shore application markets including agriculture, mining and survey, geographic information
services, and construction. OmniSTAR is a high performance, wide-area differential GPS service that
uses satellite broadcast techniques to improve the accuracy of GPS receivers by as much as 100
times. According to OmniSTAR sale, the company’s agriculture-related business has grown rapidly in
recent years as U.S. farmers rapidly bring more acreage under cultivation to take advantage of
markedly stronger commodity prices.
OmniSTAR has satellite coverage over most of the Land areas of the Globe, with the exception of
some areas beyond 60 degrees North and 60 degrees South Latitude.
Currently, three levels of OmniSTAR service are offered: "VBS" offers sub-meter positioning, "XP"
achieves better than 20 centimeters, and "HP" is better than 10 centimeters. These services are
available in various combinations in most land areas of the world.
OmniSTAR services pricing:
Pricing for North American Agricultural Applications:
VBS - $800/year, XP - $800/year, HP - $1,500 year.
Pricing for North American Subscription GIS/Mapping applications:
VBS - $800/year per receiver, XP - $1,500/year per receiver, HP - $2,500/year per receiver.
Several GPS manufacturers have incorporated the special OmniSTAR receiver into their own GPS
receiver packages. Trimble, Hemisphere, NovAtel, Starlink, Topcon, AGCO, Case IH, Raven Industries,
and Ag Leader all have GPS systems with fully integrated OmniSTAR.

44
Trimble Navigation Ltd.
http://www.trimble.com/
Trimble Navigation, a California corporation founded in 1978, is a market leading provider of
precision position equipment largely based on advanced use of Global Positioning System
technology. Trimble was one of the first companies to develop civilian applications using military GPS
satellites. Over the years they have improved their technology and today have one of the largest
pools of GPS-related patents. The company sells centimeter- and millimeter-accurate positioning
equipment to a range of end-markets including: construction, agriculture and asset tracking. They
have also developed a portfolio of software tailored to these customers.
Trimble’s agriculture products consist of manual and automated steering systems for farm vehicles,
flow and overlap control for chemical, fertilizer, seed application, grade control systems for irrigation
and drainage, and reporting and planning software.
In fiscal 2008, company revenues increased by $107.0 million, or 9%, to $1.33 billion from $1.22
billion in fiscal 2007. The increase in fiscal 2008 was due to stronger performances in the Field
Solutions market, which includes precision agriculture products, and Mobile Solutions segments.
Field Solutions revenue increased by approximately $100.1 million, or 50% to $300.7 million. The
increase in revenue was driven primarily by strong sales of agriculture products, both in the U.S. and
internationally. Field Solutions segment accounted for 22 percent of the total revenues.
As an industry leader Trimble enjoys two primary barriers to market entry. First, their technology and
patent portfolio are difficult to replicate. Their expertise in GPS signal interpretation, built up over
the years, is advanced. Moreover, the software suite that accompanies their products makes for a
unique offering. Second, their distribution market is extensive, covering many end-markets in the US
and overseas. While they have competitors in each field, no single competitor covers as many
markets. New entrants would have a difficult time matching this network.
Hemisphere GPS
http://www.hemispheregps.com/
Calgary, Alberta, Canada, based Hemisphere GPS designs and manufactures GPS products for
positioning, guidance, and machine control applications in precision agriculture (ground-based and
aerial), commercial marine, industrial, and geographic mapping & survey markets.
Hemisphere GPS is leading after-market precision agriculture GPS technology supplier serving large,
mid - and entry segments. Company reported a 35 percent increase in revenues in 2008 — to a
company record of US$72.7 million, versus $53.7 million the previous year.
According to the company, 2008 growth was driven by strong market fundamentals in agriculture,
including higher farm incomes. Revenues in Hemisphere’s ground agriculture business, which
represents about three-quarters of the company’s sales, grew 34 percent for the year, while the air
agriculture business grew 31 percent. Aerial and ground-based agriculture markets together
accounted for 85 percent of company revenue ($61.8 million).

45
The company is the world’s largest after-market supplier of GPS guidance devices for the agriculture
industry with approximately 50% market share. Hemisphere GPS has deployed over 50,000 guidance
and 10,000 auto steering units.
International sales growth for the year was 44 percent, contributing 30 percent of total revenues for
the year, as compared to a contribution of 28 percent in 2007. Company has recently also been
building OEM agreements with tractor manufacturers, including Claas, Valtra, Fendt and Massey-
Ferguson.
Company has cited U.S. Department of Agriculture report, according to which strong grain
commodity prices have led to record net farm income in the United States and other countries in
recent years. Increased cash inflows from farming operations provide additional capital for
reinvestment in field equipment and precision GPS technology.

46
5. Remote Sensing and Earth Observation
Broadly defined, the remote sensing market includes revenues from applications as varied as
weather forecasting, intelligence-gathering, highway inspections, climate change studies, and
commercial uses in agriculture, fishing, mining, construction, and public health.
The total global market size for services and products utilizing remote sensing technology to a
greater or lesser degree was more than $7 billion in 2006, almost $7.3 billion in 2007 and $7.5 billion
in 2008, a 3 percent increase from previous year. At a compounded annual growth rate (CAGR) of
6.3%, the market is expected grow to more than $9.9 billion by 2012.
Weather forecasting holds the highest share of the market throughout the forecast period, hovering
at approximately 38% of the total global market through 2012. Public health applications hold the
highest growth potential through the forecast period. These products will be worth $402 million in
2007 and grow at a CAGR of 10.9% to reach $675 million in 2012. Other applications include right-of-
way inspection, intelligence gathering, climate change studies, and other applications.
Figure 10 Global Expenditures for Remote Sensing Products, By Application, Through 2012 (millions US$)
Application 2006 2007 2012 2007-2012 CAGR%
Weather Forecasting 2,700 2,830 3,750 5.8
Right-Of-Way Inspections 1,000 1,010 1,200 3.5
Intelligence Gathering 510 545 798 7.9
Climate Change Studies 550 560 697 4.5
Public Health 397 402 675 10.9
Other Applications 1,866 1,940 2,788 7.5
Total 7,023 7,287 9,908 6.3
0
500
1000
1500
2000
2500
3000
3500
4000
2006 2007 2012
$ M
illio
n
Weather Forecasting Right-Of-Way Inspections Intelligence Gathering
Climate Change Studies Public Health Other Applications

47
5.1. Satellite imaging
Total market for all space based imagery was estimated to be $2.85 billion in 2007 and $3.13 billion
in 2008. The total revenues from commercial earth observation (EO) data sales were $735 million in
2007 and $845 million in 2008. This means that the government oriented satellite imagery market is
today on the order of three times larger than the still nascent commercial market. According to BCC
Research, the segment of earth observation market that includes the sale of resolution of three
meters or better and related products and services, was estimated to be worth $1.9 billion in 2007
and is expected to grow to $3.2 billion by 2012. The commercial market for high resolution satellite
imagery is currently highly fragmented and modest in size, possibly in the range of $125 – $250
million.21
The overall market for space-based earth imagery will grow at about 10% CAGR, however, US
providers could experience 15% growth in the next three years owing to exposure to some faster-
growth subsets of the overall market (e.g. consumer & commercial applications), but also because of
potential upside from the US government, who has acknowledged a gap in broad area intelligence
gathering capabilities.
Largest competitors in the commercial market are US-based DigitalGlobe, Inc., Spot Image (France),
US-based GeoEye, Inc. and ImageSat International NV (Netherlands Antilles). Also several
government-owned programs are starting to gain market share (e.g. South Korea, China, India and
Israel). Generally these satellites are lower resolution, lower quality and lower accuracy
(long/latitude specificity), and are only partial competitors to largest commercial providers.
Figure 11 Earth Observation Commercial Data Sales Market Shares in 2008
Source: Annual reports of companies; other sources
21
Source: Jeffries & Company, Inc.
DigitalGlobe33%
SPOT Image18%
GeoEye17%
ImageSat11%
Others21%

48
Requirements of U.S. and international defense and intelligence communities are expected to fuel
EO industry growth in medium-term:
The U.S. and foreign governments are increasingly relying on commercial remote sensing
space capabilities to provide unclassified earth imagery for defense, intelligence, foreign
policy, homeland security and civil needs. It is estimated that the relevant market for imagery
and related value-added services could well be in excess of $2.5 billion per year and growing
at a rate of 10%.22
The US government has been purchasing satellite imagery from commercial providers since
2002 and generally signs one-year contracts. All purchasing is through the National
Geospatial Intelligence Agency (NGA) which controls purchases for 16 US government
entities, and generally splits its spend evenly between domestic competitors DigitalGlobe
and GeoEye. The government’s use is both Defense & Intelligence related (e.g., Department
of Defense, Central Intelligence Agency) and civil (e.g., US Geological Survey, Drug
Enforcement Administration, FDA). Canadian government revenues are also included in this
line item. Most of that government demand is for high resolution imagery with about 0.4
meter resolution, multi-spectral (0.4 meters is currently the highest resolution available from
commercial providers)
Demand from other governments is also high, and unlikely to be satisfied completely within
the next few years. Countries (agencies or commercial companies as proxies) that are
customers of the commercial satellite imagery companies include Japan, China, Singapore,
Korea, Saudi Arabia, Israel, Turkey, various European countries, and Russia. Typical uses
include area surveillance and reconnaissance, damage assessment and disaster response. In
the case of China, most of the imagery captures relates to domestic targets; China is
essentially using the imagery to create an inventory of its own strategic assets, and to
monitor industrial activity and urban sprawl.
Longer-term growth, skewed toward commercial and industrial customers, will be catalyzed by the
creation of comprehensive data sets of imagery for specific cities, regions and geographies, and the
first-time creation of a time series database that supports new applications:
Expanding Use of Location-Based Information by Commercial Enterprises and Civil Agencies –
Commercial enterprises are using imagery and other location-based information to help plan
and manage business infrastructures and supply chains to capture efficiencies across
functions. Oil and gas exploration companies have been using satellite imagery for many
years, and are described as sophisticated consumers of both tasking capacity and the image
library. Business software providers, such as Autodesk, Oracle, SAP and SAS, are enhancing
their products and services by incorporating imagery products and services. U.S. and foreign
civil agencies are using satellite imagery for many purposes, including establishing effective
police and fire emergency routes, and classifying land use for growth planning and tax
assessments;
22
Source: Jeffries & Company, Inc

49
Growing Use of Imagery to Monitor Economic Development – Developing countries in Asia,
Eastern Europe, and Latin and South America are experiencing significant changes as a result
of their economic growth and development. These countries are increasingly relying on earth
imagery for many purposes, such as building and maintaining current maps that catalogue
this development and change;
Increasing Use of Imagery in Consumer Applications – The introduction of earth imagery
overlays to digital maps by major internet portals, such as Google and Microsoft, has
increased consumer awareness of, and demand for, location-based applications that utilize
earth imagery. Large-scale mapping capabilities are being combined with up-to-date images
and information to create new and more powerful consumer applications and products for
use in real-estate applications, GPS-based mobile devices and next generation video games.
Figure 12 Demand for Space-Based Imagery

50
Figure 13 2007-2012 CAGR by Application
Source: BCC Research, J.P. Morgan

51
5.2. Earth Observation value chain
It is possible to define two vertically separated groups within the operator and downstream
segments of the earth observation industry – data providers and value adding companies. In the
upper parts of the downstream sector, where earth observation data is produced, there is a
concentration of a few, large players, while the number of companies increases significantly further
downstream in the value chain.
Data providers are dealing with reception, archiving, and distribution of earth observation data. Data
providers are usually owners and/or operators of earth observation satellites or they have close
connections with satellite operators. Leading earth observation data providers are large
organizations, with revenues reaching over hundred million Euros. All of these companies have close
ties to the public sector, being either partially government owned or dominated by government
interests. Value-adding companies are working with raw or semi-processed data from remote
sensing instruments, and convert the data into information that brings value to end-users. Services
offered by these companies may include procedures such as geometric correction, image
classification, mapping and weather prediction as well as consultancy, system design,
implementation and training. The value-adding organizations are usually small or medium sized,
ranging from few persons up 60 employees. Only 9% of the value-adding companies in Europe are
classified as large i.e. with more than 60 employees.
The earth observation value chain is currently going through a radically transformation. This process
is characterized by disruption and blurring of traditional value chain as an increasing number of data
suppliers are entering the market, established industry participants are increasing vertical market
penetration, and new technologies and distribution methods have given rise to the emergence of
novel business models.
Estimated 151 new earth observation satellites are to be launched from 2007 to 2016. This is more
than twice the number of launches during the past decade. The number of commercial and dual use
EO satellite launches is expected to grow 7.5 times – from 6 during 1997-2006 to 45 from 2007 to
2016. About 29 national space agencies are to launch EO satellites by 2017. It is highly likely that
EO System
Provider
EO System
Operator
Data
Distribution
& Archiving
Data
Processing
Marketing
& Product
Distribution
End User
Raw Data System Data Info Product
Downstream services Upstream
Figure 14 Earth Observation Value Chain

52
there will be increasing efforts to find opportunities to commercialize data from these government
program satellites, thus even further increasing available earth observation data supply.23
Figure 15 Total Earth Observation Satellites to be Launched by Operator Typology, 1997-2006, planned/forecast 2006-2017
*launch failures are not taken into account
Satellite operators and even satellite manufacturers from upstream sector (notably EADS Astrium
and Canadian company MacDonald Dettwiller Associates), are gradually moving down the value
chain in an effort to access the value added business. All of the largest satellite operators (ImageSat
International N.V. being the exception) are currently already offering a range of value added services.
Several recent acquisitions in the value-adding sector made by leading satellite operators indicate
that these industry players are interested in moving even closer to the end-users. Growing focus on
end-users is also demonstrated by the fact that it becomes increasingly simple to obtain earth
observation data online directly from the satellite operators.
In recent years Google Earth, Microsoft Bing Maps and similar technologies have democratized the
access to global satellite imagery. They have lowered the start-up threshold for access to global
satellite data and opened up new possibilities for collaborative research and product generation.
These so called “virtual globes” have had a massive impact on increasing the awareness of mass-
market to the potential of Earth observation technologies. Google has announced that Google Earth
application has been downloaded more than 500 million times since its inception in 2005 and more
than 2 billion placemarks have been entered on the maps by users24. This means that the traditional
scientific and industrial user segment of the earth observation industry is already supplemented by a
23
“Satellite-Based Earth Observation, Market Prospects to 2017”, Euroconsult 2008 24
http://www.gearthblog.com/blog/archives/2009/08/google_earth_surpasses_500_million.html

53
very significant community of mainstream users taking advantage of capabilities of EO solutions for
the real-estate, tourism and insurance industries among others.
As the basic virtual globe software and access to earth observation satellite imagery is free, variety of
applications previously handled by specialized service companies (such as applications in cartography
and infrastructure planning) could be made available through these platforms, which may encourage
value-adding organizations to rethink their service portfolios and distribution methods.
5.2.1. Data providers
The barriers of scale for building an earth observation system can be considered very high, especially
for the space segment. The development and launch of a modern high resolution satellite typically
takes half a decade, requires considerable technical expertise and substantial up-front capital outlays
of approximately half a billion dollars.
As a result, the availability of high-resolution imagery on a commercial basis is a fairly recent event in
space remote sensing history. The worldwide government restrictions began to erode in the mid
1980s, with the commercialization of the United States’ Landsat program and in response to the
development and operation of the SPOT satellite series from 1986 by the French government space
agency (CNES). Escalating Landsat costs led to its commercialization in 1983, and in July 1984 the
“Land Remote Sensing Policy Act” turned over Landsat operation to the Eosat Corporation, which
was responsible for operating and marketing the satellite data.
The first space imaging license was granted by the U.S. Department of Commerce in 1993 to
DigitalGlobe’s predecessor, namely WorldView Inc. of Longmont, Colorado, allowing a private
enterprise to build and operate a satellite system and to gather high spatial resolution digital imagery
of the Earth for commercial sale. Under the new policy, a number of private companies obtained
licenses for the operation of private satellite remote sensing systems. In September 1999 the U.S.
firm SpaceImaging (now merged into GeoEye, Inc.) opened high resolution commercial space remote
sensing with the launch of Ikonos II, providing 1 meter resolution imagery for public sale.
U.S. Government currently controls commercial remote satellites primarily by limiting the resolution
at which imagery can be collected. For electro-optical imagery, the policy involves one resolution
(currently 0.5 meter) for imagery that can be marketed generally and a second resolution (currently
0.25 meter) for imagery than can only be disseminated with specific authorization and to recipients
individually authorized by the U.S. Government. Before a firm can be authorized to disseminate the
highest resolution (0.25 meter) imagery the State Department must first obtain assurances from the
foreign government (highest resolution data is only authorized for foreign governments) that the
imagery will not be disseminated further without authorization.
The U.S. commercial earth observation industry was provided with a significant impetus in May 2003,
when U.S. Commercial Remote Sensing Space Policy directive issued by the Bush administration,
directed United States federal agencies to rely more heavily on private satellite companies to provide
images from space. The shift in policy and ensuring NextView program has considerably helped to
bolster the position of American satellite companies in the global marketplace. Sponsored by NGA
(National Geospatial Intelligence Agency) which provides mapping and related services for the US
military and intelligence community, the NextView program is designed to assure the availability of

54
high resolution imagery from the next series of US commercial satellites. NGA is sponsoring the
construction and launch of these satellites to fill imagery and geospatial needs for military,
intelligence, foreign policy, homeland security and civil users.
Currently, three independent specialized companies operate high-resolution optical satellites: two
US-based vertically integrated operators, DigitalGlobe and GeoEye, and Imagesat, a Netherlands
Antilles listed company. The shares of largest U.S. based earth observation companies, DigitalGlobe
and GeoEye, are publicly traded on US stock exchanges.
In Europe, Public Private Partnership (PPP) has become an attractive model for developing
commercial ventures with two main projects: TerraSAR-X satellite launched in 2007, principally
funded by EADS Space and the German Space Agency (DLR). EADS Astrium Services subsidiary,
Infoterra GmbH, is responsible for data commercialization. RapidEye, a 5 satellite constellation
(launched in August 2008, 5 meter resolution), financed by a consortium again includes the DLR, local
government agencies, and private investors. The company is responsible for data sales and end
services targeting the land-use sector (such as agriculture). The German Government authorizes and
regulates the distribution of imagery and imagery products by TerraSAR and RapidEye on the basis of
a 2007 law and Federal regulations. Controls are based on an evaluation of the sensitivity of a
specific transaction considering the nature of the data to be provided, the location observed, and the
recipient. Special cases are subject to review by the German Foreign Office and German Defense
Ministry.
Europe’s largest space imagery provider, Toulouse, France based SPOT Image, the operator of French
space agency’s’ SPOT and upcoming Pleiades satellites, is majority owned by EADS Astrium. Other
shareholders include the Italy-based Telespazio and Swedish Space Corporation.
The launch of SPOT-1 in 1986 established France’s role as a leader in the commercial remote sensing
satellite industry. The SPOT (Satellite Pour l’Observation de la Terre) series of electro-optical
satellites are owned and operated by SPOT Image, a French corporation created in 1982 as a
partnership among the French space agency Centre National dÉtudes Spatiales (CNES), the French
National Geographic Institute IGN, and several French space firms. The SPOT satellites (currently
three satellites in operation – SPOT 2, SPOT 4 and SPOT 5) are dual-use satellites, providing national
reconnaissance capabilities to the French Government as well as providing imagery for SPOT Image
to distribute on a commercial basis. SPOT Image’s commercial distribution of imagery is monitored
by the French Government and individual transactions deemed sensitive may be subject to
governmental review.
Canadian firm MacDonald Dettwiller Associates (MDA) is the largest operator of commercial SAR
satellites. Company owns and operates two SAR satellites, RadarSat-1 (1999) and RadarSat-2 (2007).
The Canadian Space Agency (CSA) provided 80% of the funding for RadarSat-1 and the associated
ground system (launch was provided by U.S. NASA in exchange for imagery). CSA also provided funds
toward the construction and launch of RadarSat-2 in exchange for imagery from the satellite. The
Canadian Government uses RadarSat imagery for maritime surveillance (homeland security) and
national reconnaissance. MDA is authorized to sell imagery and imagery products on a commercial
basis under the regulatory control of the Canadian Government. Canada’s controls on distribution of
RadarSat imagery are based on a bilateral agreement with the United States, concluded in 2000, and
on national legislation and regulations brought into force in 2007. Canada plans a next generation

55
constellation of three satellites to become operational before end-of-service of RadarSat-2; it
appears that this constellation will be built and operated with the same joint public/private
arrangement as utilized for RadarSat-1 and -2. Canada does not have the capability to provide
satellite launch services.
The satellite-base earth imagery industry is difficult to characterize. The barriers to entry, as
previously mentioned, are very high, there is significant demand that is not being satisfied, and yet
there is no pricing power and there appears to be intense competitive rivalry. Unfortunately, the
anomalies in the industry are made indecipherable by the opacity of the end-market, particularly as it
relates to defense and intelligence applications.
Nevertheless, some easy observations can be made about the competitive forces in the industry:
Substitutes
Aerial Imagery
UAVs
Competitive rivarly
DigitalGlobe
GeoEye
SPOT Image
New Entrants
Intl’ Govts
Suppliers
ITT, Ball & General
Dynamics
Boeing, Arianespace
Customers
US NGA
Intl’ Govts
Commercial
Limited # of
suppliers
implies high
cost of
construction
and launch
US NGA and
Intl’ Govts
have
significant
purchasing
power.
Aerial Imagery competes in terms of quality and accuracy, but refresh/revist capability Is limited
Satellite imagery capacity will increase, leading to pricing pressure. Google will compete as an aggregator

56
5.2.2. Value adding sector
Earth observation value-adding service can be defined as any service that corresponds to one or
more of the following criteria:25
does not rely on the sole provision of the satellite signal, but enhance/upgrade it, or
is designed for a customer, a final user, or,
is provided for operational purpose (recurring service),
mixes several applications.
In addition the service is provided under a contract or for a definable budget. Companies offering
earth observation value-adding services are traditionally located at the end of the industry value
chain, where raw or semi-processed EO data is used as input, and combined with other inputs to
bring value to end-users. It is estimated that that the value adding products and services provided by
the EO value adding industry are made up for 80% from a combination of space-borne plus aerial or
ground-borne data.
While the earth observation data sales market is dominated by a small number of large players, the
value added sector is much more fragmented. In recent years the clearly defined industry value chain
and the structure of sector is being reshaped as larger market participants hosting full in-house chain
from data reception to end user products are starting to gain foothold in the market. Despite these
trends the value-adding group of organizations is still primarily made up of small and medium sized
companies.
Today, the majority of the demand for EO services is driven by the public sector. Typically,
governments and other public bodies at all levels (regional, national, and international) are the
dominant customers of EO products, thereby generating the majority of revenues. When reflecting
combined EO services revenue, defense and law enforcement has the greatest market share, and this
is due to the influence of large companies with government contracts. It is estimated that 70% of
services revenues in Europe and about 55% in the U.S. rely on public sector contracts.26
Only the energy (oil, gas and minerals) market has a strong private presence, mainly due to weather
forecast applications for oil and gas off-shore exploitation.
Barriers to entry the sector are relatively limited in number. Most important seems to be the
influence of governmental policy and additionally the cost of data access, where incumbent
producers that are part of a larger group of companies also providing data have a comparative
advantage. Nevertheless, the initial set-up costs for a new company in the value adding industry are
low, and many new entrants are started by individuals originating from the R&D environment.
Despite low barriers of entry, the takeoff of commercial EO value-added business is slow. In terms of
growth rates, the value-added sector is currently seriously lagging the raw satellite imagery
acquisition and selling business. This is mainly caused by the lack of knowledge about the EO
potential to tentative customers and resulting low commercial interest. Consumer related services
25
Euroconsult, Assessment of the downstream value adding sectors of space-based applications, 2007 26
10-Year Industry Forecast, The American Society for Photogrammetry and Remote Sensing 2004

57
are just emerging but with strong effort from large IT and web companies such as Microsoft, Yahoo!
and Google, providing strong confidence for future market growth.
A survey of the status of the European and Canadian earth observation service industry conducted by
VEGA Group analyzed the situation for private sector service providers over the time period 2003 to
2006. A population of 151 companies was identified in 2006. Companies remain predominantly small
(<10 employees) or medium (11 – 60 employees) with only 9% of the companies classed as “large”.
France, Germany and Italy are the most common locations of EO service companies. According to
VEGA survey, almost all EO downstream organizations are located in the EU15, plus Norway and
Switzerland. VEGA notes that regarding the new member states only the Czech Republic
accommodates a few EO downstream organizations.
The study team estimated 2006 total industry revenues of €412m, and €306m for value-adding
activity once the major data suppliers’ revenues were factored out. This value includes revenues
from grants; corrected for this, revenues from paying customers amount to € 175 -210 million in
2006. This excludes public sector EO revenues. The European market showed a growth of
approximately between 2% (2002-2006, VEGA) and 4% (2000-2005, Euroconsult) in the past years,
taking up approximately one third of the global market. Profitability is typically below 10% and
concentrated in a few larger companies – 89% of all profit value across the sample was delivered by
just five companies. On average, the sector employs 20 persons per company and generates a
turnover of around €2 million per company. Altogether there were approximately 3000 people
working in the sector in 2006.
Information product/service sales are the most common service type provided by the value-adding
EO service industry, followed by software development services and consulting services. Land use
monitoring and cartographic & topographic mapping, marine and coastal surveillance and agriculture
are the primary thematic areas in which EO companies are involved. Cartographic & topographic
mapping and land use monitoring generate approximately 35% of industry revenues. Revenues are
primarily generated from operational services, but income from grants still comprises about 25% of
average company revenues. This figure rises to 50% for small/medium sized companies. The most
common market sector, in terms of the number of supplier companies, is environmental protection
& pollution management.27
The dominating players in the EO downstream services sector in Europe that generate most of the
industry revenues are Spot Infoterra Group, Telespazio, GAF and Eurosense. The majority of these
five organizations is companies with multidisciplinary activities and related to the upstream part of
the value chain through their shareholders and business focus. Spot Infoterra is also one the largest
imaging satellite operators in the world.
Spot Infoterra Group is the earth observation division of Astrium, itself a wholly owned subsidiary of
EADS. The group was formed in July 2008 after EADS became the majority shareholder in Spot Image
group. The company sells data from its own SPOT satellites, distributes imagery from other satellites
and provides value added services. The group, with a turnover of €160 million in 2008 and more than
800 staff, is established in twelve countries. Spot Infoterra Group is the largest EO value-adding
company in Europe.
27
The State and Health of the European and Canadian EO Service Industry, VEGA 2008

58
Telespazio, a member of the Space Alliance between Finmeccanica and Thales is a satellite services
company. It is based in Rome, and employs 1,400 staff, operating from a network of four space
centers and 22 global sites. Company revenue was €440 million in 2008. Telespazio offers satellite
services in different domains such as navigation, communication and observation, and is a re-seller of
Quickbird, Landsat en Envisat images. EO value added services are only a small part of their portfolio,
which means that out of the 1,400 employees a smaller number is involved in EO value adding
activity.
GAF is based in Munich, Germany and currently employs 60 members of staff. GAF belongs to the
Telespazio group of companies. Its core services are described as data processing, information
services and management consultancy.
EUROSENSE is a commercial remote sensing organization and has several offices in Europe. It has a
presence in Belgium (HQ), The Netherlands, France, Germany, Hungary, Slovakia, Czech Republic,
Poland Romania, Bulgaria and Ukraine. The EUROSENSE-group employs a staff of about 250
specialists: engineers, geographers, topographers, programmers, etc. EUROSENSE is involved in aerial
photogrammetry, digital orthophotography, cartography, hydrography, GIS and other products and
services build on the processing of satellite remote sensing data, based on aerial, space and ground
based data.
The U.S. earth observation value-added services industry is comparable to size of the EU sector. The
Management Association for Private Photogrammetric Surveyors (MAPPS) is the only national
association of firms in the surveying, spatial data and geographic information systems field in the
United States28. It currently has about 150 members, most of which are classified as small
organizations and are focused on providing specific, narrowly defined services or data. In terms of
revenue, U.S. Industry is between two and three times the size of Europe, depending on the exact
definition of the sector. Euroconsult has estimated the US industry for satellite EO related value
added services to be $867 million or €619 million in 2005, including applications in meteorology and
oceanography.
Revenue per head is approximately 20% higher in US. This statistic is related to the slightly larger
average size of companies in the US. The size distribution of companies is similar in character, but in
absolute terms there are larger companies in the US. There are similar market profiles in terms of
applications. The most obvious difference in the market and customer characteristics between the
US and Europe is the large defense/homeland security market in the US, which accounts for 40% of
all revenues, compared with 12% – 18% in Europe.
There is no direct evidence of any clear differences in export performance/market access between
the US and Europe. Surveys on both continents reveal almost identical perception that other
countries’ industry enjoys better protection in their domestic markets. Only about 10% of all
European products are sold to global users as export to non-European customers is poor, and almost
entirely carried out by few large companies. The majority of the users or customers of European
value adding companies are located in the country of the company itself. This implies that even intra-
European export is relatively limited.
28
http://www.mapps.org/

59
5.3. Earth observation applications
5.3.1. Agriculture
FarmStar (Spot Image & Infoterra, EADS/Astrium)
FarmStar is a crop monitoring and management service developed by Infoterra, a fully owned
subsidiary of EADS/Astrium, in partnership with French agronomy institutes. The commercial
application of FarmStar started in 2002 after 6 years of development and validation.
The objective of FarmStar is to create information products for agricultural cooperatives and farmers
to help them improve crop management. Satellite imagery from Spot Image is combined by Infoterra
with state-of-the-art image processing techniques, agronomic information and meteorological data
to create user-friendly guidance and recommendation maps for farmers and agronomists.
Their main customers of FarmStar are French agricultural cooperatives, as well as their counterparts
in Germany and in England. In France, currently more than 350,000 hectares worth of fields for 10,00
farmers is subscribed to the service.
For FarmStar service, farmers initially provide the necessary information for monitoring the field
plots (crop variety, date of sowing, depth of soil, irrigation, among others) from which Infoterra
makes a “plot database”. Before the beginning of the crop period, clients will receive a start-up kit
consisting of a detailed plan for each plot (surface area, type of soil) and annual crop information (a
farming summary). The plot database will enable Spot Image to optimize the satellite programming
and the validation and orthorectification of Spot imagery. The satellites in the Spot constellation can
be programmed to target plots for given crop stages for large areas on given dates.

60
Spot Image validates the images acquired according to the cloud conditions found over the target
plots. An image combination system is used to determine the precise number of plots without clouds
at a given time during the programming period. The number of images to be acquired to ensure total
coverage of each site varies according to the cloud conditions encountered: for the 2004 campaign,
an average of 1.4 images had to be combined per period and per site to cover 99% of the target
plots. The validated multispectral images are then orthorectified and delivered to Infoterra on
average 2 work days following the validation. Infoterra then draws up crop status, recommendation
maps and advice.
The maps are sent by post, fax or e-mail to the archiving organization and to the farmer no less than
5 days after the image has been acquired. Depending on the type of crop monitored, farmers will
receive 3 to 6 advice maps per campaign. Maps delivered include: Leaf Area Index Map, Chlorophyll
Concentration Map, Shoot Density Map, Fertile Tiller Density Map, Lodging Risk Map, etc. All
recommendation maps are delivered in geographic file formats to integrate with farm mapping
software or GPS-guided spreader/sprayer systems.
Figure 16 FarmStar Field-scale Chlorophyll Concentration Map (Wheat, Spain)
FarmStar maps provide both the grower and agronomist with the ideal reference information for
decision-making. Without any need for field sampling farmers can see quantitative crop information
for every corner of every field and the average figure for each field. Management benefits come
through being able to target field inspections to specific locations, detect stress early, refine input
decisions and to provide justification of inputs. The information can either be used to optimize inputs
at whole-field level, or to vary inputs within fields, as appropriate for each field.
For instance for winter wheat, the recommendation map for the 3rd nitrogen application delivered in
April/May will enable them to determine the optimal dose for the 3rd nitrogen application according
61
to the needs of the crop and to plan the interventions (for fertilizing and spraying) thanks to the
forecast of the ‘last leaf’ stage
The price of the FarmStar service is approximately €10 per hectare for wheat. For wheat, an estimate
of the average increase in gross margin compared to an equivalent unmanaged situation can be
made, giving an estimated increase of about €25 to €35 per hectare.
SPOTCana (Spot Image & Infoterra, EADS/Astrium)
SPOTCana is precision farming service launched in 2009 and tailored specifically to monitoring sugar
cane plantations. The service is currently available only in Brazil, in the State of Sao Paulo through
Spot Image’s recently opened subsidiary, Spot Image Brasil.
SPOTCana is a an online subscription service to give the sugar industry – cane growers, distilleries,
environmental departments and insurance companies – precise, ready-to-use maps throughout the
growth cycle. Subscribers can thus acquire information to closely monitor their crops, precisely
ascertain growth, maturity and stress for timely decision-making, and manage their priorities.
SPOTCana provides information on crop maturity derived from high-resolution satellite imagery. This
information is delivered at key stages of the growth cycle to support estimation of available biomass
and detection of yield disparities between fields.
To subscribe to the service users have to register at SPOTCana website and choose the area of
interest (18 km x 18 km or 324 sq.km. minimum). Users receive four batches of products (1 per
period) characterizing crop growth throughout the growing season. Subscribers are alerted each time
new data are available online for their region of interest. Each delivery comprises a 10-meter
resolution orthorectified SPOT satellite image and two vegetation maps:
a green vegetation map showing crop density, an indicator of healthy growth;
a dry vegetation map pinpointing crop problems and indicating the degree of maturity at the
end of the growth cycle. A link on the portal is provided to retrieve data and view them in
Google Earth.
The cost of the service is €1,000 per period, per tile (18 km x 18 km). This includes:
permanent access to the SPOTCana website for the period
browsing and downloading of SPOT products (imagery and maps)
technical and sales support
Fishing applications
The use of remote sensing and satellites with dedicated oceanographic sensors has brought a new
perspective in information management for commercial fishing. Commercial fishermen require
timely, reliable and accurate information on meteorological and oceanographic parameters, such as
ocean colour, sea surface temperatures, winds, waves, circulation, and observations on indirect signs
related to fish distribution (food, birds, dolphins, current patterns, etc). Satellite ocean remote
sensing provides such information, thereby enhancing fishing strategies.

62
One of the largest provider of EO services, GeoEye, offers SeaStar fish-finding information service
tailored to the unique needs of pelagic commercial fishing operations worldwide. This service
combines plankton data from SeaWiFS optical sensor on OrbView-2 satellite with other
meteorological and ocean data (surface temperature, currents, salinity estimates, etc.) to provide
digital maps that significantly improve the efficiency of finding fish for commercial fishing vessels.
SeaStar oceanographic imagery products are processed daily by GeoEye’s team of oceanographers
and delivered directly to a customer’s vessel at sea for viewing on the ship’s personal computer.
Combined with the captain’s local fishing knowledge, the SeaStar maps allow one to navigate directly
to the closest and potentially most plentiful fishing areas.
To maximize the use of the information, GeoEye provides the OrbMap software. The OrbMap
software enables captains and fleet managers to view and manipulate the map layers, translating
satellite imagery and oceanographic data into fishing strategies.
5.3.2. Earth observation applications in forestry and forest management
ImageTree
http://www.imagetreecorp.com/
ImageTree develops and markets forest management software platform ForestSense that pulls
together different technologies and uses them to fuel data creation. The output from that platform
for most customers is a detailed forest inventory analysis for their holdings. ForestSense combines
high resolution Color Infrared (CIR) imagery from satellites and Light Detection and Ranging (LiDAR)
data from aircraft to capture and measure every visible tree crown. Field crews then identify all the
vegetation in the randomly selected plots along with accurate GPS locations for each tree. Finally
remote-sensing data and the field data are combined to create predictive algorithms (a proprietary
process on which the company holds several patents) to predict the landcover situation for the entire
area of interest.
ImageTree serves mainly two types of owners/buyers who manage forest lands. First, there are
timber investment management organizations (TIMOs), which serve private investors by managing
forest resources. Second, there are timber real estate investment trusts (REITs) that own and
manage income-producing timberlands. REITs may lease the land to paper companies or
conservation groups.
Aside from the U.S. forest management marketplace worth several hundred million dollars, the
company is positioned to take a piece of the nascent carbon offset market which is set to boom as
the new U.S. administration plans out a strategy to combat global warming.
A forest carbon offset is a financial instrument that represents a reduction in greenhouse gas
emissions. By purchasing carbon offsets, companies invest in projects that reduce carbon dioxide
emissions in one location to compensate for their own emissions in another. North America’s largest
greenhouse gas reduction and trading system The Chicago Climate Exchange (CCX) has already
launched a market where owners of forestland could sell carbon credits to polluters.

63
CCX issues tradable Carbon Financial Instrument contracts to owners or aggregators of sequestration,
destruction or reduction of greenhouse gas emissions. In order for offsets to be issued, net growth in
forest carbon stocks must be quantified using a CCX approved quantification technique. One of the
largest carbon offset aggregator firms FORECON EcoMarket Solutions has received approval from
CCX for forestry carbon offset project that deploys the ImageTree ForestSense technology platform
in establishing carbon baselines for forest properties anywhere in the United States.
In 2006 and 2007 ImageTree raised $6.7 million of venture capital funding in two equity rounds. In
april 2009 company received an undisclosed strategic investment from In-Q-Tel, the investment firm
founded by the US Central Intelligency Agency (CIA).
5.3.3. Energy Industry applications
One of the most established commercial markets in earth observation (EO) is within the areas of
natural resources exploration including oil, gas and minerals and the energy sector in general.
Accurate geo-information data is critical for optimizing the exploration, production and distribution
of energy. The traditional way to collect such data has been with field surveys; an expensive and
localized method. By contrast earth observation satellites reprsent a cost-effective source for wide
area measurements. Measurements made from spaceare uniform and are non-intrusive; companies
can conveniently survey the most inaccessible sites on Earth.
Earth observation imagery is used extensively by exploration companies in support of their search for
new oil and gas reserves. They routinely use satellite-based radar to monitor naturally occurring oil
slicks on the sea surface that can indicate the location of an offshore basin. Earth observation also
plays a growing role in supporting efficient extraction and safe transportation of the world’s oil and
gas reserves.
Real opportunities exist for information from Earth observations to contribute to the optimization of
renewable energy systems for power production, and to contribute to the provision of information
for optimal integration of traditional and renewable energy supply systems into electric power grids.
Energy sources such as solar, wind, and wave power flat facilities, offer environmentally-friendly
alternatives to fossil fuels but are particularly sensitive to environmental conditions. The energy
output from renewable energy systems can fluctuate significantly over different time scales creating
daily, seasonal and multi-year variations. Therefore, the ability to predict these fluctuations and to
characterize the long-term behavior of these processes is critical to ensure overall system security
and reliability.
Local climate data on cloud cover, solar irradiance, and on wind/wave speed and direction –
combined with other environmental parameters such as land elevation and land cover models – are
vital elements in developing a strategy for the location and operation of solar, wind, and wave power
facilities.
Earth observation is also commercializing science solutions to provide a competitive advantage in the
market place of mining during the design and construction of underground structures and during the
operating period of these structures.
64
Applications in hydrocarbon industries
Altamira Information
http://www.altamira-information.com/
Altamira Information, founded in 1999 in Barcelona, offers space information and imagery data
processing services. Altamira is specialized in providing high-precision ground movement
measurements and mapping solutions using satellite images. It caters to civil defense bodies,
territorial planning authorities, construction companies, research and technology groups, oil and gas
industry, mining and insurance companies.
Altamira mapping products are created from Synthetic Aperture Radar (SAR) images currently
provided mainly by Envisat (owned by ESA), ERS 1&2 (ESA), Radarsat-2 (CSA), TerraSAR-X (EADS &
DLR) or Alos (JAXA) satellites. SAR images may be merged with satellite optical imagery or aerial
photography. To measure ground motion over time or assess the topography, phase values of radar
images are compared using to the Synthetic Aperture Radar Interferometry (InSAR) technique.
Depending on the quantity of available radar images and the required precision, different InSAR
techniques are applied by Altamira: Classical Differential InSAR, Advanced Differential InSAR, InSAR
Stable Point Network (SPN) and InSAR Stable Point Network with Artificial Corner Reflectors.
Precision of displacement measurements ranges from 1 cm in case of Classical Differential InSAR to 1
mm with InSAR SPN and Artificial Corner Reflectors (ACR; ACR’s are aluminium trihedrals that are
installed if there are not sufficient "natural radar measurements points", for example in areas with
trees, snow and low infrastructure presence).
Oil and gas industries constitute the largest part of Altamiras commercial client base as the detection
of ground movements with satellite radars is especially relevant to many areas of hydrocarbon sector
including the extraction stage, gas storage and monitoring and maintenance of refineries:
Oil & Gas extraction
o Increase of extraction efficiency: Radar monitoring allows optimizing oil extraction
efficiency using steam-assisted gravity drainage (SAGD) oil recovery technique. The
detection of ground movements contributes to minimize risks for nearby
infrastructure due to steam injection. Ground uplift is an indicator of potential steam
excess and can pose a potential risk for nearby pipelines, refineries etc. Ground
subsidence is an indicator of limited steam injection and/or potential reservoir
compaction as consequence of extraction activities. High precision in achieved using
a network of Artificial Corner Reflectors.
o Infrastructure: The analysis of movements of ground by satellite images contributes
to the optimization and risk reduction in choosing the location for refineries and
other infrastructure.
Underground Gas Storage – Quality control of storage facilities with ground uplift &
subsidence monitoring to identify areas of potential risk instabilities.
o CH4 and CO2 emissions storage: Monitoring of ground motion due to seasonal
changes in storage pressure or leaks in the subterranean storage that can result in
damage to infrastructure.

65
Offshore Platform monitoring
o Monitoring of offshore platform settlement (sea-bottom-anchored platforms) to
support decisions on platform replacement timing. Measurement reference point is
the nearest continental location that appears on the same satellite track as the
platform.
Pipeline monitoring
o Landslides and other potentially hazardous ground movements are monitored to
quantify the lateral impact on the pipeline.
Monitoring of oil slicks
o Oil slicks are detected in offshore and can be from different origin, e.g. oil seepages
as an indicator of hydrocarbon existence. Results are integrated with additional data
such as wind force and direction to locate the oil seepage emission point.
Mapping
o 3D mapping and structural mapping, especially in remote areas.
Mapping products can be a key support to logistics and route planning,
interpretation of surface structures, slope measurement etc.
Figure 17 Extraction site of heavy oil by steam injection: surface movement in time (after 2, 5, and 7 months). In red, the raising of surface, and blue, sinking (subsistence)
These SAR satellites used by Altamira have different imaging features and pricing structures, thus the
the needs and budget available to each project can be met with using a specific satellite. The possible
monitoring frequency also varies with the satellite, e.g. with Envisat satellite the highest frequency is
typically 6 months, and with the Radarsat-2 three months. TerraSAR-X satellite can provide monthly,
bimonthly or even weekly updates for measurements.
The company’s clientele includes The European Commission, European Space Agency (ESA), French
Space Agency (CNES), French Research and New Technology Ministry, Catalan Institute of Geomatics
(IdeG), Gaz de France, and Magnitude and Charbonnages.

66
Altamira is headquartered in Barcelona (Spain), with offices in Toulouse (France) and Calgary
(Alberta, Canada). Company has currently 25 employees. Company has received investments from
FonsInnocat, a multi-sector venture capital fund managed by Highgrowth Partners and oriented
towards small-to-medium sized enterprises located in Catalonia.
Renewable energy industries
Satellite based information services for hydropower plant management: EO-Hydro project
http://www.eohydro.com/
EO-Hydro (Environmental Information Services for Hydropower Plant Management) was an ESA
funded project under Earth Observation Market Development (EOMD) programme, active from 2003
to 2007, that was conceived to improve the hydro power plant management using space
technologies in three different areas of interest: Canada, Norway and Alpine Region.
Main interest for hydropower plant management focuses on the snow/glacier elements and the
estimate of their potential water content. Especially on the border between the temperate and polar
regions, substantial annual precipitation combined with low temperatures leaves most of the
available water on the ground as snow and ice that cannot be exploited to power production
immediately. Moreover the melt water is in great part stored for electricity production, so that a
change in the amount of availability water will oblige the hydropower companies to change the
operative production schemes or even to increase the electricity price.
The importance of snow resource and the climatic changes observed during the past decades justify
the increasing demand for monitoring strategies of this strategic resource.
EO-Hydro project catered to this demand by creating an integrated information service for improved
water management that combines space imaging technologies with conventional methods (like
sensors and hydrological models). The most important parameters provided by EO-Hydro are snow
cover, snow water equivalent (SWE), land displacement and river runoff forecast. All services are
based on the processing of satellite data:
The snow cover maps are derived from the combined use of synthetic-aperture radar (SAR)
and optical data.
The land displacement products detect the surface deformations with millimetric accuracy.
They are generated using SAR interferometric (InSAR) techniques.
The snow water equivalent is estimated through application of the SAR technology in
combination with ancillary data.
The water runoff forecast is based on a model which needs in input also meteorological data
(precipitations and temperatures).
The project identified that large hydropower companies hold proprietary runoff models for their
power plants, hence are interested in snow cover maps (e.g. Norwegian state owned electricity
company Statkraft and Italy’s largest energy provider ENEL who both were engaged in the project).
Small hydropower companies do not hold proprietary runoff models for their plants, hence are more
interested in water runoff services.

67
As a direct outcome of the EO-Hydro project, a number of earth observation based services for
hydropower companies have been brought to the commercial market. Since 2007 Kongsberg Satellite
Services29 has been offering snow cover area detection service in the Nordic area. Carlo Gavazzi
Space30 is currently offering snow cover monitoring in Italy for ENEL and AEM, one of the leading
energy companies in northern Italy. ENVEO IT GmbH31 combines satellite derived snow cover
information and hydro-meteorological data to provide Austrian energy companies with run-off
forecasts.
Satellite based information services for windfarm management: WEMSAR and EO-Windfarm
projects
At the end of 2008, there were 65 GW of wind power capacity installed in the EU-27 producing 142
TWh hours of electricity, and meeting 4.2 % of EU electricity demand. European Wind Energy
Association (EWEA) projections suggest that the wind power sector will continue to expand fast,
providing 12% of EU electricity demand by 2020, compared to only 3.7% in 2008.
While large majority of wind energy capacity is currently drawn from onshore farms, the share of
offshore installations in overall production is expected to grow substantially over the coming
decades. It is estimated that in 2010 EU-27 will have 80 GW installed wind energy capacity, including
3.5 GW offshore. This means that about 4.4% of overall wind energy is supplied from offshore
installations. For 2020 the EU has a set target of 180 GW installed capacity, including 35 GW offshore,
which is equivalent to approximately 19.4% of total wind power supply.
The motivation for increasing exploitation of offshore wind resources stems from the fact that
offshore winds are less turbulent (because the ocean is flat relative to onshore topography), and they
tend to flow at higher speeds than onshore winds, thus allowing turbines to produce more electricity.
Because the potential energy produced from the wind is directly proportional to the cube of the wind
speed, increased wind speeds of only a few miles per hour can produce a significantly larger amount
of electricity. For instance, a turbine at a site with an average wind speed of 7 meters per second
would produce 50% more electricity than at a site with the same turbine and average wind speeds of
6 meters per second.
Therefore quantifying the amount of energy that can be expected from a prospective offshore wind
farm site is of vital importance to optimize its sitting, design and financial yield. The traditional
approach to obtain this information is to measure coastal wind with an offshore meteorological mast
for at least one year. This approach is however very expensive (it costs about EUR 1 million for a mast
of 100 meters height) and lacks objectivity for a spatially varying wind field. In contrast, satellite
measurements of ocean wind provide an alternative and cost effective approach to build a synoptic
picture of wind climatology, which helps renewable energy managers to have a quick and easy check
of the potential energy yield.
29
http://www.ksat.no/ 30
http://www.cgspace.it/ 31
http://www.enveo.at

68
WEMSAR
The WEMSAR (Wind Energy Mapping using Synthetic Aperture Radar) project ran from year 2000 to
2002. The project was funded from the European Union 5th Framework Program on Research
Technology Development and Demonstration within the Energy, Environment and Sustainable
Development Programme.
The objective of the project, led by the National Laboratory for Sustainable Energy at the Technical
University of Denmark, was to develop, validate and demonstrate the potential use of satellite-based
Synthetic Aperture Radar (SAR), scatterometer and altimeter data combined with meteorological
observations for the mapping of wind resources in off-shore and near-coastal regions. The project
focused on three test sites: Hellisøy on the western coast of Norway, Horns Rev in Denmark and
Maddalena in Italy.
Project showed that SAR retrieved wind information shows good agreement with in situ
measurements and traditional wind models.
The final WEMSAR tool consists of two modules: a SAR wind retrieval module and a statistical
module RWM (Risø WEMSAR Module). The wind climate information from the tool can be imported
into the software WAsP32, a commercial solution for predicting wind climates, wind resources and
power productions from wind turbines and wind farms used worldwide in more than 100 countries.
EO-Windfarm
EO-Windfarm, active from 2003-2006, was an ESA EOMD (Earth Observation Market Development)
and Norwegian Research Council joint market development project that aimed at providing earth
observation (EO) based information service for wind farm management to fill the need for data in
offshore and remote areas. The project was based on a consortium composed of EO service
providers (3E, BMT ARGOSS, Altamira) wind energy market players (Vestas) and end-users such as
electricity companies (DONG Energy, Airtricity)
The overall objective was to design and integrate an EO-based mapping service based on end-user
demands for geo-information when planning, constructing and operating wind farms. The focus of
the project was on providing an EO-based information service, aiding potential customers with the
first six phases of the wind farm life cycle: 1) site selection, 2) feasibility study, 3) permit stage, 4)
design and engineering, 5) construction, 6) operation, maintenance, and monitoring.
The set of data provided by EO-Windfarm comprises offshore wind, waves and tides information and
onshore orography and terrain roughness maps. Wind, waves and tides information and terrain
roughness maps were gathered from high spatial resolution synthetic aperture radar (SAR) images.
Offshore SAR measurements were combined with altimeter data on tidal heights and tidal currents
and scatterometer data for precise wind resource information. Orography is available from a digital
elevation model based on data collected during NASA's Shuttle Radar Topography Mission (SRTM).
The wind data provided by EO-Windfarm allow the establishment of the long term wind rose
(combined wind speed wind direction distribution) for projected sites offshore. These wind roses are
32
http://www.wasp.dk/

69
essential to estimate the long-term annual energy output of projected offshore wind farms. Another
application is the use of EO-Windfarm data to establish the combined wind and wave climate. The
design of the offshore wind turbine construction needs site specific input data about wind and waves
to calculate the effects of their combined dynamic loading on the construction. EO-Windfarm can
provide wind and wave statistics for user specified sites and in a range of desired formats. The
information includes both the long-term statistics on averages and on extreme wind and wave design
situations. In addition, EO-Windfarm can provide site-specific information on tidal heights and
currents. Such information has several applications, both in the design phase and the operational
phase of offshore wind farms. For example, in some areas, the tidal height variations can be quite
significant (> 10 m). In such cases the position of the wind turbine in the atmospheric boundary layer
is shifted. This causes a variation in the mean wind speed and also a variation of the wind shear
across the wind turbine rotor.
Figure 18 An off-shore wind speed map derived from Radarsat-1 data (depicting the Gaspe Peninsula in Quebec)
The environmental data services of EO-Windfarm for onshore wind energy applications are mainly
oriented to the provision of suitable terrain data as input for wind farm design tools (such as WAsP,
WindPro, Windfarmer etc.). Basically all these models need maps of terrain elevation and terrain
roughness in an area of a few tens of kilometers around the projected wind farm.
The RWT software developed at Risoe National Laboratory during the WEMSAR project was used to
assess the wind climate from satellite SAR images. The SAR images were calibrated in the BEST
software from ESA, then calculated into wind speed and wind direction maps from the WEMSAR tool
developed by Nansen Environmental and Remote Sensing Center (NERSC). Finally maps of the wind
resource statistics were generated.

70
EO-Windfarm project made contributions to several commercial information services for the wind
energy sector that are currently used by clients all over the world. DataForWind provides
professionals of the wind industry an easy access to relevant geo-information for on-shore wind
farms. In the website http://www.dataforwind.com/, world-wide relief information is available for
subscribers. WaveClimate (http://waveclimate.com/) provides site-specific and detailed information
on the offshore wind and wave climate anywhere on the world's oceans and seas. Tidal-Info provides
site-specific information on tidal heights and currents world-wide. WaveClimate and Tidal-Info
service are operated by BMT ARGOSS, a leading specialist provider of marine environmental
information services.
Earth observation applications in solar energy sector
Enough solar energy falls on the earth's surface in twenty minutes to meet our needs for a year.
Exploiting this resource is essential in light of our growing energy use and continued battle against
man-made global warming.
There are two kinds of commercial solar energy establishments: solar thermal plants which
concentrate heat from the Sun, and photovoltaic plants that convert sunlight into electricity.
Solar energy currently accounts for only 0.5% of the EU's energy use, but is fast-growing, owing to
feed-in tariffs in several Members States, notably Germany and Spain. Europe's installed capacity of
photovoltaic solar cells increased threefold in 2008, to 4.8 GW. The solar thermal market in the EU
also showed a strong performance in 2008: It grew by 60% to 19 GWth (gigawatts of thermal
equivalent) of installed capacity.
Understanding the variability of solar energy over time is an important step in increasing the share of
solar energy in the overall energy mix. In both, solar thermal and photovoltaic cases precise, long-
term irradiance data is needed for choosing plant locations and estimates of likely energy yield for
prospective investors. Then once a plant is built, managers need data updated in near real-time to
check the facility is working optimally, and energy output tallies with available sunshine.
ENVISOLAR and related commercial services
ENVISOLAR (Environmental Information Services for Solar Energy Industries), was a development
project, active from 2003 to 2007, funded by ESA within the framework of the Earth Observation
Market Development Program (EOMD). The main focus of ENVISOLAR was to support the industrial
use of earth observation based information in the solar energy sector.
While in-situ measurements have been available for a long time satellite-derived information has
some obvious advantages over other methods for solar energy forecasts. Ground measurements
provide poor spatial coverage as there are only around 200 solar-energy measuring stations to cover
all of Europe and Africa in the official networks affiliated to the World Meteorological Organisation
(WMO). Satellites offer data with a high spatial resolution of a very few kilometres, which is
therefore more representative for a specific location. Also, archived satellite data from Meteosat
(meteorological satellites operated by EUMETSAT) are available for a very large area going back as far
as 1985. This enables advanced statistical analyses which can provide the backbone of forecasting
models. When used with cloudiness forecasts and other parameters which have an impact on solar

71
irradiance (such as aerosols), these models are already proving to be very helpful in managing large
scale solar energy generation systems.
ENVISOLAR project, led by The German Aerospace Center (DLR), identified a list of blockages
preventing the increased use of earth observation techniques up to now and targeted them by
bringing together strong scientific, engineering and marketing skills on environmental information for
solar plant management.
Eart observation data for ENVISOLAR came mainly from Meteosat series of satellites. Geo-physical
parameters exploited are cloud cover and cloud height, aerosols, water vapor and snow cover. All
these parameters were used to assess the surface solar irradiance as the solar resource.
Services developed within ENVISOLAR provide the required support in different areas of solar power
plant management:
Services for Investment Decision – At the strategic decision-making level, a critical
parameter for site selection of solar parks is solar irradiance, the “fuel” of such generation
systems. For this purpose, meteorological satellite data for solar irradiance is used in
combination with other earth observation capabilities such as digital elevation models (DEM)
and cloud cover measurements. For site selection analysis, having access to long-term time
series is highly desirable, since it can dramatically increase the accuracy of solar irradiance
estimates for a given site. Therefore archived satellite data sets are particularly useful for
pre-feasibility studies. Recently, the interest in satellite-derived solar energy information has
spread to many different sectors, including financial institutions. Today, such information is
being used for strategic decisions such as site selection (e.g., map products), as well as site
qualification (e.g., time-series products). Time-series of at least 10 years are required by the
banks in Spain as part of the due diligence for extending loans to solar energy investments.
Given that the scale of such investments has reached the level of 200 million Euros for a
single project, the economic importance of these analyses becomes clear33. For most places
in the world this due diligence process can only be achieved through the use of
meteorological satellite data.
Commercial solar power plant site analysis and optimisation services for large projects that
incorporate satellite-based time series are currently offered by a German company
meteocontrol GmbH, of the leader of the ENVISOLAR project. For smaller plants the yield
estimation has to be has to be substantially cheaper, easy and fast. Italian company Flyby
provides web-based SolarSAT yield estimation service34, which offers a cost-effective and
automatic way to estimate the expected yield for smaller plants.
Services for Plant Management – Satellite monitoring capability can also be used to support
operational decision-making. The key to reliable performance checks is knowing the available
solar radiation at the plant site. Satellite data offer a unique chance to receive the local solar
radiation in near real time. Through comparison between the effective energy production
and the corresponding solar energy at the array plane, the proper functioning of the solar
33
http://www.eomd.esa.int/events/event262.asp 34
http://www.solarsat.eu/

72
power plant can be monitored in defined time intervals. This information is also used for
error analysis. In this case, the plant operator will not only receive the message that the plant
does not work properly; he also will receive an information about the possible reason for the
malfunction.
Commerical operation monitoring and analysis applications for solar power systems are
currently provided in Europe by meteocontrol (safer'Sun product package35), Flyby (SolarSAT
PV-Controller36) and Swiss company Meteotest (SPYCE products37).
Services for Utilities – Another emerging market for the use of earth observation is
forecasting the electricity load for electric utilities. Both, scheduling of power plants and
overall grid management needs precise knowledge of the load. Because of liberalised
markets a highly accurate load forecast is necessary to achieve good prices in energy spot
markets. Besides temperature, irradiance has a major environmental influence of up to 10%
on electricity demand. Just as load is to be forecasted, solar irradiance needs to be
forecasted. Currently, this is done using model output statistics based on numerical weather
prediction. Satellite-based irradiance values from the previous day are used as input for
these model output statistics besides other parameters.
Time-Series Services for Science and Consulting – Time series are used to calculate the
expected yield from solar thermal and photovoltaic power plants. Furthermore they can be
used to estimate light and heat within buildings for architectural purposes. Time series are a
semifinished product on which other products build but there is also a market for raw time
series. In general, planners, architects and scientists are the key customers for this sector.
The Solar Energy Mining (SOLEMI) service offered by German Aerospace Center (DLR)
provides Meteosat time series in hourly resolution and at a spatial resolution of up to 2.5 km
with a time series extending up to 20 years over Europe, Africa and the Middle East. Asia is
also covered with a time series of up to 8 years.38
5.3.4. Marine applications
Satellite-based earth observation techniques are especially beneficial for marine monitoring due to
large areas that need to be monitored and limited coverage of both airborne and land based
surveillance systems.
Sea ice monitoring
Useful albeit sparse information about sea-ice conditions is provided in the form of reports from
vessels in the ice, and from icebreakers and weather stations. Other sources include airborne survey
by radar, but these aircraft are expensive and provide only limited coverage. Although the radar
sensor itself may be insensitive to weather conditions, the aircraft upon which it is flown can be
grounded for a week or more at a time by adverse weather conditions.
35
http://www.meteocontrol.com/cms/db/index.php?pageID=187 36
http://www.solarsat.eu/images/brochure/ss-cnt_v1.0_A4_eng_26.pdf 37
http://www.spyce.ch 38
http://www.solemi.de/home.html

73
The role of satellite-based earth observation (EO) data in operational ice monitoring has grown in
importance over the years. Earth observation data from visible/infrared sensors are potentially
available to all ice services but are useful only under cloud-free conditions. Passive microwave
sensors can penetrate cloud cover but their effectiveness in ice monitoring is limited by coarse
resolution. Active microwave sensors, such as the Synthetic Aperture Radar (SAR), are ideal for ice
mapping because of their high resolution, all weather, wide swath ice detection capability. Ideally,
various spectral ranges (e.g. visible, infrared and microwave) should be accessed to allow for the
most accurate analysis of ice conditions.
Sea ice guidance products derived in real-time from these data are used operationally to ensure
safety of navigation by all vessels, the determination of the most efficient and safest route, and to
protect life and property associated with human activities on the ice.
Satellites carrying SAR instruments and used for providing ice monitoring services include ESA's ERS-2
and ENVISAT missions (data distributed by SARCOM consortium, led by Spot Image), the Italian
COSMO-SkyMed (COnstellation of small Satellites for Mediterranean basin Observation) mission, the
Canadian RADARSAT-2 mission (operated and commercialized by MacDonald, Dettwiler and
Associates Ltd.) and the German TerraSAR-X and TanDEM-X missions (commercialized by Infoterra
GmbH). These SAR instruments are also used for several other marine EO applications discussed
below.
Integrated ice monitoring services Baltic Sea, Europe and Russia, North America and the Antarctic are
available from several value-adding companies, including Canadian C-Core39 and Kongsberg Satellite
Services40, from public private partnership program Polar View41 and from local meteorological
service providers (Canadian Ice Service42).
Oil spill detection
Oil spill accidents are seen relatively frequently and have become a severe threat to coastal and
marine ecosystems and water quality. Thus, active surveillance and rapid response to marine oil spills
is important and essential to environment protection.
Aerial remote sensing or using airplanes to monitor the oil spill has the advantages of rapid reaction
time and flexibility, but costs associated with this method are relatively high. The use of satellite
remote sensing to monitor sea surface for oil spills has the advantages of large coverage area,
multitemporal monitoring capability and low-cost.
Remote sensing method operates by detecting properties of the surface such as color, reflectance,
temperature or roughness of the area. Spilled oil can be detected on the surface when it modifies
one or more of these properties.
Optical observation of spilled oil by the satellite requires clear skies, thereby limits the usefulness of
such system. SAR, as an active sensor operating in the microwave region of the electromagnetic
spectrum, is not restricted by the presence of cloud, thus it is a more useful tool for spill monitoring.
39
http://www.c-core.ca/ 40
http://www.ksat.no 41
http://www.polarview.org 42
http://ice-glaces.ec.gc.ca/
74
However with radar imagery, it is quite difficult to be certain if an anomalous feature on a satellite
image is caused by the presence of oil. Consequently, radar imagery from SAR requires expert
interpretation by suitably trained and qualified personnel to avoid other features being mistaken for
oil spills.
Oil on the sea surface dampens some of the small capillary waves that normally are present on clean
seas. These capillary waves reflect radar energy producing a brighter area in radar imagery known as
sea clutter. The presence of an oil slick can be detected as a darker area or one with the absence of
sea clutter.
Unfortunately, oil slicks are not the only phenomena that can be detected in similar manner. There
are many other interferences including fresh water slick, calm areas (wind slicks), wave shadows
behind land or structures, vegetation or weed beds that calm the water just above them, glacial
flour, and biogenic oils. SAR satellite imagery analysis has showed that several false signals are
present in a large number of scenes. Despite these limitations, radar is an important tool for oil spill
remote sensing since it is the only sensor capable of searching large areas in practically all weather
conditions.
In 2005 the European Parliament and Council adopted a Directive (2005/35/EC) aimed at
incorporating international standards for ship-sourced pollution into Community law and at
discouraging illegal discharges of oil from ships by ensuring that persons responsible are subject to
adequate penalties.
Directive led The European Maritime Safety Agency (EMSA) to establish a European wide operational
system for oil slick detection based on SAR images from satellites. This service, called CleanSeaNet,
supplements existing surveillance systems at national and regional level and supports Member States
response to illegal discharges and accidental spills as well as helping to locate and identify polluters
in areas under their jurisdiction.43
CleanSeaNet uses SAR satellite images primarily from ENVISAT, RADARSAT-1 and RADARSAT-2.
Looking to the future the planned GMES Sentinel-1 mission series will be important for routine
monitoring (constellation of two C-band Sentinel-1 satellites is due to launch at the end of 2011). X-
band radar data from TerraSAR-X and CosmoSkyMed could potentially be used in case of an oil spill
emergency.
CleanSeaNet began operating in April 2007 and oil pollution response authorities of 24 European
Coastal States have access to the service. Since the beginning of the service over 400 million square
kilometers of European seas have been monitored. More than 4000 possible oil slicks have been
detected, but not all of these detections were oil. A study conducted after 18 months of operations
showed that the percentage of detections checked on-site by aircraft or patrol vessels and confirmed
as oil varies from one region to another but can reach values as high as 80%.
From the second half of 2009 CleanSeaNet will provide vessel track information as an added layer on
top of the SAR image. Therefore it shall be possible to link a recent spill to a vessel if the vessel is
shown to be attached to the spill, or if the track matches pattern and shape of the spill and if there is
no confusion between the different vessels observed in the vicinity of the slick.
43
http://cleanseanet.emsa.europa.eu/

75
Oil spill detection services are also offered by commercial value-adding companies, such as
Kongsberg Satellite Services, GAF AG44 and DEIMOS Imaging45.
5.4. Providers of satellite imagery
GeoEye, Inc.
http://www.geoeye.com/
Virginia, U.S. based GeoEye, founded in 1992 as a division of Orbital Sciences Corporation, is a
provider of satellite imagery, imagery information products and image processing services. Company
was spun off in 1997 and changed its name to GeoEye in 2006 after acquiring Colorado-based Space
Imaging. GeoEye has established an integrated business operations structure that includes imagery
collection systems, production and processing facilities and a global distribution system.
GeoEye currently operates three imaging satellites – OrbView-2 satellite, launched in August 1997;
IKONOS satellite, launched in September 1999; and GeoEye-1 satellite, launched in September 2008:
OrbView-2 collects 1.13 kilometer, low resolution color imagery and was the first commercial
satellite to image the Earth’s entire surface daily in color. The satellite carries NASA’s Sea
Viewing Wide Field of View Sensor (SeaWiFS) that is specifically designed to monitor
different ocean characteristics.
IKONOS satellite was acquired from Space Imaging in 2006. IKONOS provides 0.82-meter
resolution black and white and 3.2-meter resolution color imagery with a geolocation
accuracy of approximately 7.1 meters. IKONOS can collect about 200,000 square kilometers
of imagery per day.
GeoEye-1 is currently (as of June 2009) the world’s highest-resolution color commercial
remote-sensing satellite. GeoEye-1 has been designed to collect 0.41 meter resolution
panchromatic (black and white) imagery and 1.65 meter resolution color imagery (known in
the industry as multispectral) of the Earth’s surface, both individually and simultaneously. It
can collect up to up to 127 million square kilometers per year in the color mode, the more
popular mode, or 255 million square kilometers per year in the black and white mode. Due to
current U.S. licensing restrictions, satellite images from GeoEye-1 are re-sampled to 0.5
meter ground resolution before being made available for sale to non-U.S. Government
customers. GeoEye-1 is expected to remain operational up until 2020. Final cost of the
GeoEye-1 program is estimated to be $495.4 million. US National Geospatial-Intelligence
Agency (NGA) supported the project with a cost share of $226.8 million.
44
http://www.gaf.de/ 45
http://www.deimos-imaging.com
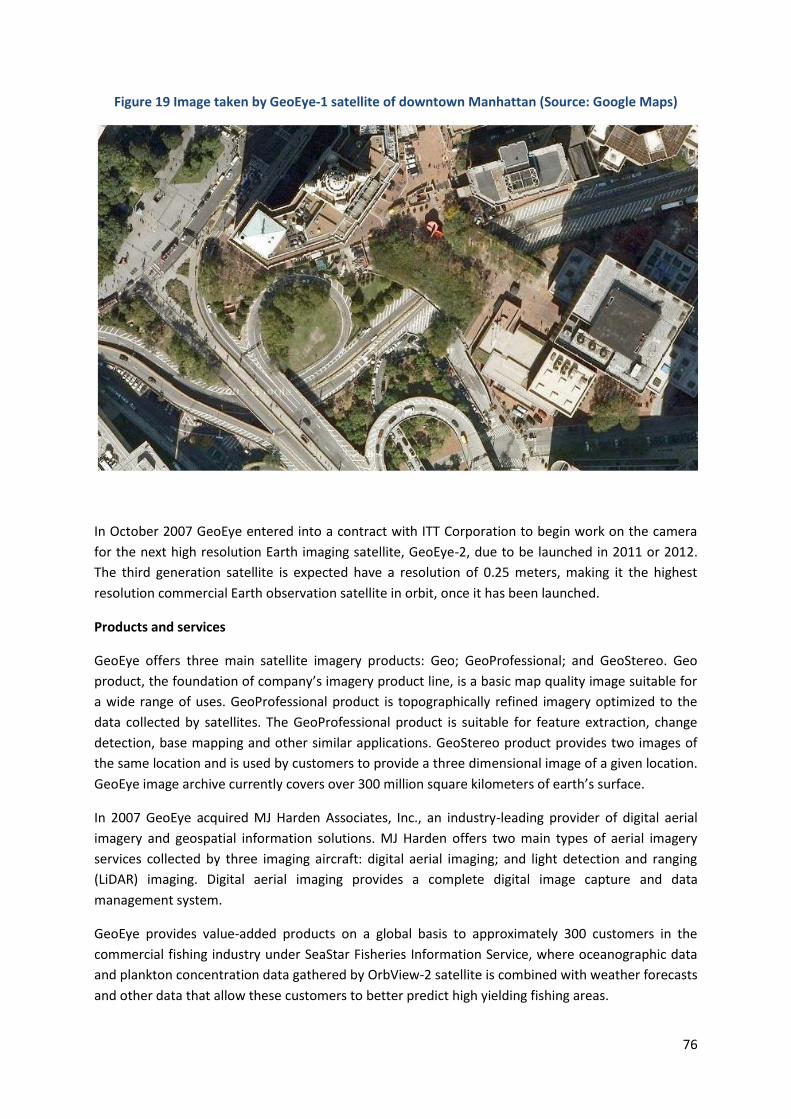
76
Figure 19 Image taken by GeoEye-1 satellite of downtown Manhattan (Source: Google Maps)
In October 2007 GeoEye entered into a contract with ITT Corporation to begin work on the camera
for the next high resolution Earth imaging satellite, GeoEye-2, due to be launched in 2011 or 2012.
The third generation satellite is expected have a resolution of 0.25 meters, making it the highest
resolution commercial Earth observation satellite in orbit, once it has been launched.
Products and services
GeoEye offers three main satellite imagery products: Geo; GeoProfessional; and GeoStereo. Geo
product, the foundation of company’s imagery product line, is a basic map quality image suitable for
a wide range of uses. GeoProfessional product is topographically refined imagery optimized to the
data collected by satellites. The GeoProfessional product is suitable for feature extraction, change
detection, base mapping and other similar applications. GeoStereo product provides two images of
the same location and is used by customers to provide a three dimensional image of a given location.
GeoEye image archive currently covers over 300 million square kilometers of earth’s surface.
In 2007 GeoEye acquired MJ Harden Associates, Inc., an industry-leading provider of digital aerial
imagery and geospatial information solutions. MJ Harden offers two main types of aerial imagery
services collected by three imaging aircraft: digital aerial imaging; and light detection and ranging
(LiDAR) imaging. Digital aerial imaging provides a complete digital image capture and data
management system.
GeoEye provides value-added products on a global basis to approximately 300 customers in the
commercial fishing industry under SeaStar Fisheries Information Service, where oceanographic data
and plankton concentration data gathered by OrbView-2 satellite is combined with weather forecasts
and other data that allow these customers to better predict high yielding fishing areas.
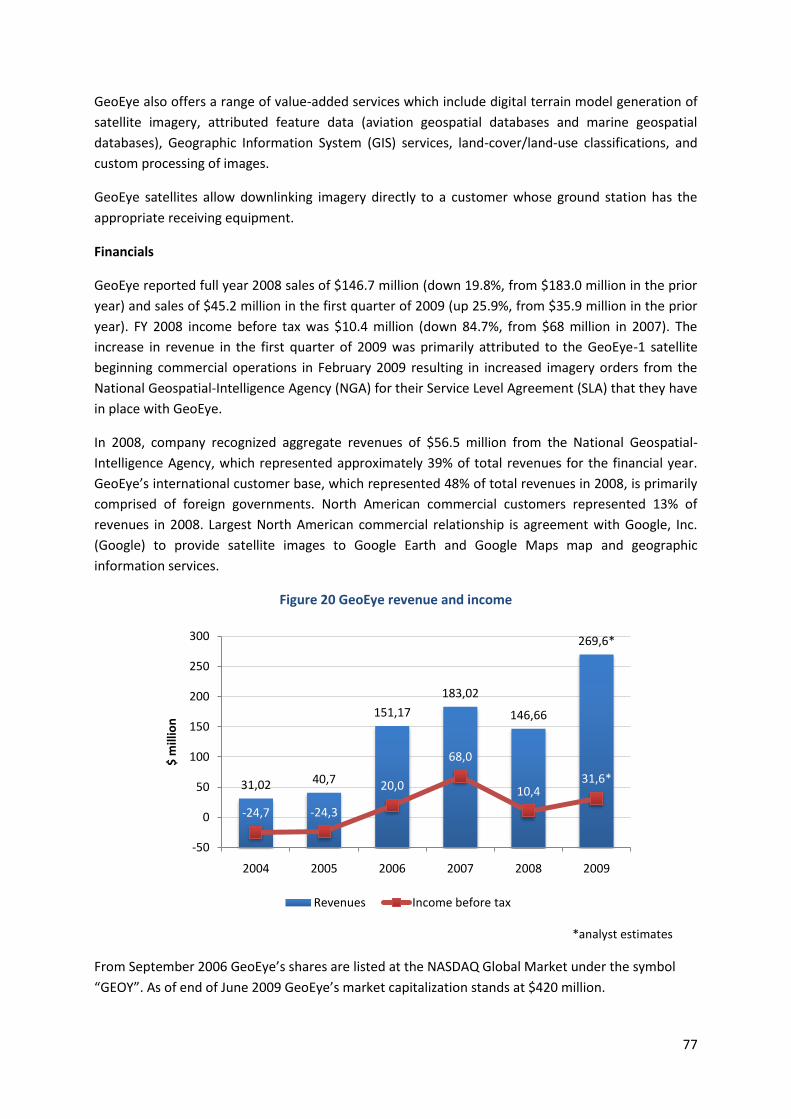
77
GeoEye also offers a range of value-added services which include digital terrain model generation of
satellite imagery, attributed feature data (aviation geospatial databases and marine geospatial
databases), Geographic Information System (GIS) services, land-cover/land-use classifications, and
custom processing of images.
GeoEye satellites allow downlinking imagery directly to a customer whose ground station has the
appropriate receiving equipment.
Financials
GeoEye reported full year 2008 sales of $146.7 million (down 19.8%, from $183.0 million in the prior
year) and sales of $45.2 million in the first quarter of 2009 (up 25.9%, from $35.9 million in the prior
year). FY 2008 income before tax was $10.4 million (down 84.7%, from $68 million in 2007). The
increase in revenue in the first quarter of 2009 was primarily attributed to the GeoEye-1 satellite
beginning commercial operations in February 2009 resulting in increased imagery orders from the
National Geospatial-Intelligence Agency (NGA) for their Service Level Agreement (SLA) that they have
in place with GeoEye.
In 2008, company recognized aggregate revenues of $56.5 million from the National Geospatial-
Intelligence Agency, which represented approximately 39% of total revenues for the financial year.
GeoEye’s international customer base, which represented 48% of total revenues in 2008, is primarily
comprised of foreign governments. North American commercial customers represented 13% of
revenues in 2008. Largest North American commercial relationship is agreement with Google, Inc.
(Google) to provide satellite images to Google Earth and Google Maps map and geographic
information services.
Figure 20 GeoEye revenue and income
*analyst estimates
From September 2006 GeoEye’s shares are listed at the NASDAQ Global Market under the symbol
“GEOY”. As of end of June 2009 GeoEye’s market capitalization stands at $420 million.
31,02 40,7
151,17
183,02
146,66
269,6*
-24,7 -24,3
20,0
68,0
10,431,6*
-50
0
50
100
150
200
250
300
2004 2005 2006 2007 2008 2009
$ m
illio
n
Revenues Income before tax

78
DigitalGlobe, Inc.
http://www.digitalglobe.com/
DigitalGlobe, founded as Worldview Imaging Corporation in January 1992, is a leading global provider
of commercial high resolution earth imagery products and services. Company products and services
are used in a variety of applications, such as defense and intelligence initiatives, mapping and
analysis, environmental monitoring, oil and gas exploration, and infrastructure management.
Since founding, DigitalGlobe has launched 4 imaging satellites, of which 2 are currently in orbit –
QuickBird-2, launched in 2001, and WorldView-1, launched in 2007:
QuickBird features 61 cm panchromatic (black and white imagery) resolution and 2.4 m
multispectral resolution. QuickBird is expected to approach the end of its operational life in
2010.
WorldView-1, built by Ball Aerospace, features 50 cm panchromatic resolution. WorldView-1
does not have multispectral imaging capability. DigitalGlobe expects the satellite to remain
operational up until 2018. At the time of launch WorldView-1 was the highest resolution
commercial earth-observation satellite in operation (surpassed by GeoEye-1 in 2008). The
total on-orbit system cost of the satellite is estimated to approach $500 million. US National
Geospatial-Intelligence Agency (NGA) paid DigitalGlobe $266.0 million to partially offset the
cost of the construction and launch of WorldView-1.
Company expects to launch new WorldView-2 satellite in September or early October 2009.
WorldView-2 is expected to nearly double company’s’ collection capabilities to nearly two million
square kilometers per day and enable intra-day revisits to specific geographical areas. WorldView-2
offers 46-centimeters black and white and 1.84-meter multi-spectral resolutions. WorldView-2 will
also be the only commercial satellite with 8-band multi-spectral capability.46
Products and services
Imagery received from satellites is added daily to DigitalGlobe’s ImageLibrary archive, which
currently houses more than 660 million square kilometers of high resolution earth imagery.
ImageLibrary enables customers to use up-to-date and historical images for real-time planning
purposes and to perform comparison analyses with historical images. ImageLibrary covers all of the
world’s 300 largest cities at a resolution of 61 centimeters or better and covers a substantial portion
of the population in the United States, Canada, Western Europe, China, Russia, India and Brazil,
including a total population coverage of over two billion, 127 cities with populations of over one
million, 1,625 ports and harbors and 6,321 airports. DigitalGlobe’s offering includes CitySphere, a
collection of 300 of the world’s largest cities that is refreshed every two years.
In addition to obtaining imagery from ImageLibrary, certain customers, with prior approval from the
U.S. government, will be able to task WorldView-1 and WorldView-2 satellites from their own secure
access facilities and receive data directly into their facilities for processing and use.
46
http://www.digitalglobe.com/digitalglobe2/file.php/686/WorldView-2_Datasheet_web.pdf

79
Value-added products offered by DigitalGlobe include ImageScape 3D modeling solution and
WorldView Elevation Suite elevation modeling service.
ImageScape, developed in cooperation with AEgis Technologies Group, allows clients to create three
dimensional (3D) terrain models of any images in DigitalGlobe’s ImageLibrary archive. The visual
representations are delivered at a full 1:1 resolution with no loss of image quality. 3D models can be
derived from a single frame of satellite imagery up to a full country or region. According to
DigitalGlobe 3D model can be delivered within few days and at a fraction of the cost of competing
offerings.
WorldView Elevation Suite, developed in partnership with PhotoSat Information Ltd., allows users to
produce highly accurate digital elevation models of satellite image that are comparable to aerial
technologies in detail and accuracy.
Financials
For the years ended December 31, 2006, 2007 and 2008 DigitalGlobe generated revenue of $106.8
million, $151.7 million, $275.2 million, respectively, and income before tax of $9.9 million, $37.9
million, $91.9 million, respectively. For three months ended March 31, 2009 company generated
revenue of $67.2 million, compared to revenue of $68.8 million during the same period a year
earlier.
Figure 21 DigitalGlobe revenue & income
*analyst estimates
Approximately 73.9% and 77.4% of company revenue in 2008 and for the three months ended March
31, 2009, respectively, was derived from National Geospatial-Intelligence Agency (NGA), most of
which was from a service level agreement, or SLA, that can be terminated at any time. The loss or
significant reduction of the SLA would materially reduce DigitalGlobe’s revenue.
Commercial customers represented 20% of total sales in 2008. Commercial customers include: gas
and oil companies, utilities, telecommunications, utilities, insurance, agricultural customers, civil
58,8 65,4
106,8
151,7
275,2 267,77*
-31,2 -28,7
9,9
37,9
91,968,2*
-50
0
50
100
150
200
250
300
2004 2005 2006 2007 2008 2009
$ m
illio
n
Revenues Income before tax

80
government customers, consumer electronics companies and content aggregators. Most customers
buy imagery, downloading it from ImageLibrary or by placing tasking orders (a minority), on an as-
needed basis. Some customers subscribe to ImageLibrary. 59% of commercial sales are via resellers
such as Hitachi and EurImage, 41% come from direct sales (e.g. Navteq, TeleAtlas). In spring of 2009,
DigitalGlobe lost TeleSpazio (to GeoEye) as a distributor in Europe.
In 2008 and for the first three months of 2009, approximately 17.1% and 15.4%, respectively, of
company revenue was derived from international sales.
In May 13, 2009 DigitalGlobe successfully completed its initial public offering (IPO) of shares. 14.7
million-share offering generated $279.3 million for the company and its investors at the price of $19
a share. Shares ended their first day trading at New York Stock Exchange 13 percent higher than they
started, reflecting solid demand for the stock (NYSE symbol: DGI).
The IPO valued company at $852.5 million. Investment bank Morgan Stanley is the largest
shareholder in the company, owning 32 percent of DigitalGlobe after the IPO.
In January 2007, DigitalGlobe acquired GlobeXplorer, LLC and AirPhotoUSA, LLC (together referred to
herein as GlobeXplorer) for a total purchase price of $21.3 million. GlobeXplorer is a producer,
integrator and provider of geographic data and of earth imagery. Acquisition was part of
DigitalGlobe’s forward vertical integration efforts aimed at offering a wider selection of image
content, more value-added services and augmenting its distribution capabilities by giving customers
access to a designated portion of imagery through a web-based delivery platform.
Spot Image
http://www.spotimage.com/
Toulouse, France based Spot Image, founded in 1982, is one of the largest providers of satellite
imagery and related geo-information value-added services. The majority stakeholder in Spot Image is
EADS Astrium, the aerospace subsidiary of the European Aeronautic Defence and Space Company
(EADS).
In July 2008 EADS Astrium, already shareholder in the company, purchased of further shares in Spot
Image from the French Space Agency (CNES). This deal resulted in Astrium holding 81% of Spot
Image. Spot Image is part of the Spot Infoterra Group, the Earth observation division of Astrium
Services, world leader in earth observation products and services.
Spot Image is the exclusive operator of the SPOT (Satellite Pour l'Observation de la Terre) optical
satellite constellation and strategic partner for other satellites, (the Korean 1 meter resolution
KOMPSAT-2, the Taiwanese 2 meter resolution FORMOSAT-2 and others). The SPOT constellation
consists of three satellites on sun-synchronous orbits – SPOT 2, SPOT 4 and SPOT 5:
SPOT 2 was launched in January 1990. It features panchromatic resolution of 10 meters, and
the multispectral resolution of 20 meters. In June 2009 Spot Image and CNES announced
they have decided to de-orbit SPOT 2 after 19 years of operation. Beginning on July 1, 2009,
Spot Image has stopped sending programming to the satellite related to passage files, card

81
files and related services. During the month of July, CNES will prepare the satellite for
deactivation and de-orbiting.
SPOT 4 was launched in March 1998. SPOT 4 has the same imaging capabilities as previous
SPOT series satellites. However its HRVIR (High Resolution Visible Infrared) instrument
performance has been increased by adding a new shortwave infrared spectral band (SWIR).
SPOT 4 also includes specialized VEGETATION instrument for monitoring of terrestrial
vegetation.
SPOT 5 satellite was launched in May 2002. Compared to its predecessors, SPOT-5 offers
greatly enhanced capabilities, which provide additional cost-effective imaging solutions.
SPOT-5 offers spatial resolution of 2.5 meters to 5 meters in panchromatic mode and 10
meters in multispectral mode. SPOT 5 features a new high resolution stereoscopy (HRS)
imaging instrument operating in panchromatic mode. HRS points forward and after of the
satellite, giving it the ability to acquire stereopair images almost simultaneously to map
relief. SPOT 5 is also carrying the recurrent VEGETATION 2 instrument and the DORIS
instrument for precise location of satellites on their orbits and of terrestrial beacons. Spot 5
accounts for more than half of Spot Image's 110 million euros in annual revenue47.
Spot Image is commercialization partner for following satellites:
FORMOSAT-2 – a high resolution earth observation satellite operated by National Space
Organization (NSPO) of the Republic of China (Taiwan). FORMOSAT-2 is the first and only
high-resolution satellite with a daily revisit capability, offering spatial resolution of 2 meters
in panchromatic (black and white) and 8 meters in multispectral (color) mode. FORMOSAT-2
has four bands: blue, green, red and near-infrared.
KOMPSAT-2 – a high resolution satellite developed and operated by Korea Aerospace
Research Institute (KARI). KOMPSAT-2 acquires imagery in panchromatic mode at a
resolution of 1 m and in multispectral mode across 4 bands in the visible (red, green, blue)
and near-infrared at a resolution of 4 m. KOMPSAT-2 images cover a footprint of 15 km x 15
km.
TerraSAR-X – TerraSAR-X, launched June 2007, is a radar satellite funded by a public/private
partnership between the German aerospace agency DLR, Infoterra Gmbh shareholder EADS
Astrium and Spot Image. TerraSAR-X is an active-array, X-band Synthetic Aperture Radar
(SAR) capable of acquiring data at a resolution of 1 metre, day and night, and in all weather
conditions.
Spot Image is preparing for the planned launch of the French space agency’s (CNES) Pleiades
constellation (2 agile, 50 cm spatial resolution optical satellites) in 2010 and 2011. As with SPOT,
other European space agencies will have minority participation in Pleiades (Austria, Belgium, Spain,
and Sweden). Spot Image will be the official and exclusive worldwide distributor of data from the
Pleiades satellites. New generation SPOT 6 and SPOT 7 satellites are also now being planned
(expected launches in 2012 and 2013, respectively) and will further extend and compliment the
currently available Spot 5 satellite products.
47
http://www.paradigmsecure.com/media_centre/news/2009_april/astrium_services_reaches_billion_dollar_mileston_2008

82
Products
Spot Image has the world’s largest archive of already existing satellite imagery (20 million images and
more than 70 billion square kilometers coverage). These images are offered as part of various
geoimagery, advanced processing, and geoinformation products and services, most of which are
available to clients through online interfaces.
Basic SPOT imagery archives have more than 10 million images covering almost the whole surface of
the Earth several times over. Depending on the degree of resolution required, standard images cost
from €0.3 per sq. km (archives at 20 m color resolution) to €2.25 per sq. km (color imagery at 2.5 m
resolution). Spot Image also offers independent access to SPOT satellite acquisitions to receive
imagery in real time directly to client’s own station.
SPOTMaps are seamless, uniform, orthorectified countrywide coverages produced with 2.5-meter
color imagery acquired by the SPOT 5 satellite. SPOTMaps images are priced at €2 per sq. km.
Subscriptions are also available as country, region or world packages. “All-You-Can-Eat” Continent
subscriptions are priced from $750,000 per year. “All-You-Can-Eat” World subscriptions are priced
from $1.5 million per year.
SPOT 3D products include Reference3D, SPOT DEM Precision and SPOT DEM. These products are
derived by automatically correlating stereopair images acquired by the HRS (High Resolution
Stereoscopic) instrument on SPOT 5. A SPOT DEM is a digital elevation model of imagery; DEM
Precision adds quality and traceability metadata to elevation models. Reference3D is a geocoded
database containing three layers of information: HRS DEM, GPS-compatible HRS Orthoimage, and
quality and traceability metadata. Reference3D offers customers world-wide coverage totaling 37
million km² available off the shelf. Due to high quality (vertical accuracy 7 meters and horizontal
accuracy 10 meters) Reference 3D is used by the French defense customers as a tool for creating
onboard datasets for unmanned aerial vehicles (UAVs), missiles and aircraft. Applications include
multiscale mapping and defense & security. SPOT DEM is priced at €2.3 sq. km, DEM Precision at €4.5
sq. km and Reference3D at €7 sq. km.
Spot Image also offers tailor-made webservices that can be designed to manage, display, sell and
deliver geospatial datasets, imagery products or imagery derived geoinformation for specific needs
and uses. Some of the services developed by Spot Image include Farmstar – a satellite-based crop
management service (currently offered in Europe); SPOTCana – a satellite-based subscription service
tailored to sugar cane producers for following the crop cycle, analyze the biomass, and optimize
crops (offered in Brazil through subsidiary, Spot Image Brasil); EXPRESSMaps – provides maps of any
part of the world at scale 1:50,000 within one single day with a very high level of accuracy and
interoperability; SPOTMonitoring – for surveillance and monitoring purposes, this online service
provides customers with change detection alerts; purchase the useful data at the right time.
Financials
Spot Image sales for 2008 were €110 million, growing 17% from previous year’s revenue of €94
million. About 70% of the company revenues are generated outside of Europe and 90% outside of
France itself. Spot Image’s two biggest export markets are United States and China, with both
markets dominated by government demand.

83
Figure 22 Spot Image revenues
0
20
40
60
80
100
120
2001 2002 2003 2004 2005 2006 2007 2008
€m
illio
n
Revenue

84
6. Fixed Satellite Service (FSS) market
6.1. Market size and segmentation
Fixed Satellite Service (FSS) traditionally refers to a service that links terrestrial communications with
fixed satellites in orbit. FSS operators operate geostationary (GEO) satellites, positioned in orbit in
space approximately 36,000 kilometers from the earth in the equatorial plane. Once a satellite is in
service at a given orbital position, FSS operators lease the transmission capacity (i.e. the
transponders) to customers: this includes operators of broadcasting platforms, television channels,
telecommunications services operators and Internet service providers.
Given the very high barriers to entry, the fixed satellite services industry has an oligopolistic market
structure, with a majority of the market divided between small group of world-scale players, built up
through M&A activity, and less than 30% remains in the hands of local or regional players.
According to largest industry participants, the worldwide FSS market generated revenues of $9.6
billion in 2008, an increase of roughly 8% over the previous year48. Euroconsult expects the FSS
market to deliver $13.4 billion in 2018, or $16.8 billion, including wholesale revenues from emerging
BBS systems dedicated to satellite consumer broadband access.
FSS industry is currently dominated by four global players – SES, Eutelsat, Telesat, and Intelsat, which own more than 70% of global market share. Luxembourg based SES and Intelsat, headquartered in US are the two largest FSS operators, together accounting for 50% of total industry revenues. France’s Eutelsat operates in enlarged Europe, offering services to nearby emerging regions and transatlantic links. Canada’s Telesat chiefly targets North America, but is looking to expand into emerging markets.
Figure 23 FSS market share distribution of 2008 revenues
Source: SES
48
Source: SES
SES; 25,1%
Eutelsat; 14,1%
Intelsat; 24,7%
Telesat; 7,0%
Others; 29,1%

85
Intelsat is a leading provider of FSS capacity with 2,125 transponders on 54 satellites at the end of
2008, representing 41.4% of total global transponder count. SES fleet comprises of 1,105
transponders on 40 satellites. SES is looking to increase its transponders by 25% over the next three
years, challenging for additional market share.
Figure 24 FSS market shares
Source: Euroconsult, JP Morgan & ING estimates
6.1.1. Applications
Fixed satellite capacity is mainly consumed by media operators (mainly TV broadcasters) and
telecommunication companies to reach private consumers (either via direct-to-home or through
hybrid networks) or by governments and multinational corporations requiring satellite support for
global communication.
Video distribution, fixed satellite operators’ core source of revenues, accounts for 43.5% of capacity
use worldwide or 2,232 transponders out of total 5,130 in 200849. This capacity is used both to
broadcast programs directly to households equipped with small individual reception antennas, and
to provide links between content producer centers and remote terrestrial broadcast systems, such as
cable networks or isolated terrestrial antennas (digital terrestrial television, for example). In terms of
revenue, video distribution accounts for 55% or $5.28 billion of overall FSS market, since broadcast
capacity sells at above-average prices.
49
Source: NSR, Euroconsult
0
2
4
6
8
10
12
14
2008 2009 2010 2011 2012 2013
Mill
ion
s $
Telesat
Eutelsat
Intelsat
Others
SES

86
Figure 25 Global FSS transponder demand by application in 2008
Source: NSR, Euroconsult, company data
Demand for satellite capacity is estimated to reach around 7,150 transponders in 2013 and 8,150 in
2018 for a CAGR of 4.7% over the ten year period. This growth rate is expected to support a
positive/stable pricing environment for FSS operators as takeoff of satellite TV in emerging digital
markets contributes to new growth in video distribution segment. Video distribution demand is
expected to represent 48% of total transponder capacity by 2018, growing at a compounded rate of
5.8%.
Broadband data services via satellite are the second most important source of growth for the
industry. Consumer satellite broadband subscribers reach was 1.18 million in 2008, growing 30%
from previous year, and is expected to expand to 10.5 million subscribers by 2018.
This trend has been predominately made possible by the advent of higher-performance technologies
with the use of the Ka-band (frequencies of 26.5-40GHz). The first internet via satellite offers on C-
band (in North America only) and then Ku-band were not very competitive in terms of cost, as both
installation and subscriptions were more expensive than for wire offers, or effectiveness (very low
uplink speed). According to estimates Ka-band needs could represent 14% of total capacity demand
by 2018 (1,141 transponders) compared to low single digits in 2008.
US based HughesNet and WildBlue currently dominate the broadband market with almost 1 million
subscribers. In Europe SES has more than 50,000 subscribers for its Astra2Connect consumer service
(uses Ku-band) and Eutelsat has 11,000 users for Tooway broadband service. Eutelsat hopes to grow
the subscriber base aggressively in coming years and is building a large dedicated broadband all-Ka-
band satellite, called Ka-Sat, for launch in late 2010. Ka-Sat alone has capacity for 2 million users.
Corporate broadband demand is driven by proliferation of VSAT (Very Small Aperture Terminal)
technology. As of 2008 more than 1.2 million VSAT terminals have been deployed globally. According
to Euroconsult up to 5 million terminals could be deployed by 2018 for corporate and civilian
Video contribution;
14%
Video distribution;
43,50%
Traffic trunking; 28%
Corporate networks & broadband
access; 9,60%
Milsatcom; 4,90%

87
government networks. While broadband uses primarily in Ku and C-band capacity, new VSAT systems
are coming online using Ka-band technology that provide higher bandwidth rates for lower costs.
Transponder usage for military satellite communication reached 249 units in 2008. The US
government alone currently generates 90% of sales in this segment; part of this is tied up with
exchanges between government agencies in North America, but much of it also relates to external
military operations (primarily Iraq and Afghanistan). Military segment is estimated to see a 9% CAGR
in transponder demand between 2008 and 2018
6.1.2. Geographical segmentation
By geographical area, Western Europe is the world’s largest market in terms of revenue, followed by
North America and Asia Pacific region.
European FSS market (including Russia, Central Asia, the Middle East and North Africa) generated
revenues of $4.42 billion in 2008, accounting for 46% of global sales. North American and Asia Pacific
markets equally generated revenues of $1.82 billion.
Figure 26 FSS wholesale revenues by region in 2008
Source: Euroconsult
Asia is the most fragmented FSS region, with >10 regional players competing with SES, Eutelsat and
Intelsat. Japanese SKY Perfect JSAT and The Indian National Satellite (INSAT) are two potentially
aggressive operators in the region with ambitious fleet plans. Rapidly increasing supply in the Asia is
largely offset by the very sharp demand growth as the region is expected to see the highest global
DTH subscriber growth (53% 2008-17 CAGR)50.
In US market players Dish Network, EchoStar and Telesat are increasingly constrained. The former
two are turning to external suppliers and can be viewed as FSS industry clients, while Telesat is
actively replacing its fleet. Largest operator DirectTV is self sufficient, albeit with modest expansion
50
Source: SES presentation, http://www.ses.com/ses/siteSections/investorRelations/Investor_Days/index.php
Western Europe; 29%
Central Europe; 4%
Russia & Central Asia; 4%
Middle East & North Africa;
9%Sub-Saharan
Africa; 4%
North America; 19%
Latin America; 9%
South Asia; 3%
Asia Pacific; 19%

88
prospects. Latin America is a historically oversupplied market, however, this trend is unwinding in the
medium term, with both DirectTV and Dish Network and also local telecommunication companies
(mainly Mexican Telmex and Spanish Telefonica) increasingly demanding more capacity.
In terms of competition, European market is even more concentrated that the global arena. The two
leaders, SES and Eutelsat, together control two thirds of the market with, on the one hand, SES and
New Skies Services, and on the other Eutelsat, which, together with its main shareholder, Abertis,
owns 53.4% of Hispasat. While SES and Eutelsat have set out rather aggressive medium-term
investment plans, smaller, regional West European players (Telenor, Hispasat, Hellas Sat) are not
expected to aggressively pursue supply growth in near-term future. ArabSat, serving Middle East,
Africa and Europe, on the other hand, is launching one new satellite every year over four years from
2008.
As the orbital positions over Europe have all been assigned and are tacitly renewed, it appears that
competitive positions have already been carved out, making it difficult to envisage the advent of a
new entrant.
Figure 27 European FSS market revenue shares
Source: Company data
SES; 33,30%
Eutelsat; 29,40%
Telenor; 9,20%
Intelsat; 18,20%
ArabSat; 2,40%
Hispasat; 4,60%Others; 2,90%

89
6.2. Perspectives and market trends
6.2.1. Technological segmentation for application segmentation
Satellite communications use frequencies ranging from 1.2GHz to 36GHz. This spectrum is divided
into several bands (L, S, C, X, Ku and Ka), whose technical characteristics make them better suited for
one type of application than another. While most transponders currently under lease for video use
Ku-bands (10.7-14.5GHz; reception requires only small antennas) and C-bands (1.97-2.69GHz; large
antennas, but with good resistance to weather conditions), the next set of launches will make more
room for transponders using Ka frequencies that are usually used for broadband internet
applications. Ka-band requires even smaller antenna than Ku-band reciever.
The emergence of Ka technology paves the way for a competitive broadband service offer, in terms
of both price – satellite is less expensive and offers more bandwidth – and two-way speed, with
downlink speeds of up to 8Mbits/s and uplinks of up to 1Mbits, according to Eutelsat.
Figure 28 Ku and Ka band cost differential
Source: Eutelsat
6.2.2. Growing demand for video capacity
Video broadcasting capacity demand will remain key market driver for FSS industry growth during
the next decade. Over the next ten years 83% of newly-leased transponders will be for video
distribution and DTH (direct-to-home) satellite TV services, as well as video contribution. Expected
annual 5.8% rise in broadcasting capacity between 2008 and 2018 will be driven by the combined
effect of:
Growth of digital television subscriber base combined with the burgeoning number of TV
channels offered by existing digital packages, and the advent of new packages in emerging
countries – Industry analysts expect 13,875 channels carried on board DTH platforms today
to grow to more than 21,000 in 2018 at a compounded annual growth rate of 4.6%. The
number of DTH service subscribers was 114 million in 2008, gaining 17% from previous year
0
5
10
15
20
25
30
0
100
200
300
400
500
600
700
800
900
Ku band Ka band
Co
st p
er
giga
byt
e €
Co
st o
f te
rmia
l €
Cost of terminal Cost per gigabyte

90
DTH, and is expected to grow to 209 million by 2018. Emerging markets projected to drive
this growth, adding 64 million new DTH subscribers by 2017.51
The pick-up of HDTV – The move to high definition (HD) and then ultra-high definition (Ultra
HD) TV will trigger a boom in volumes transmitted from 1x to 64x, even though improved
compression performances following the switch from MPEG-2 to MPEG-4 format will reduce
real capacity needs. Generally, a high definition channel requires 3-4 times as much capacity
as a standard definition (SD) channel so the growth in HD has a major impact on total
satellite capacity demand (SD digital – 2Mbps of bandwidth with MPEG-4 compression; 18
channels per transponder. HD digital – 8Mbps of bandwidth with MPEG-4 compression; 3
channels per transponder).
In the beginning of 2009, more than 1,100 HD channels were operational worldwide.
Approximately 900 of these channels were broadcast in the North American market. In
Europe’s main markets, the commercial HD offer doubled in 2008, as in the previous year. In
Asia-Pacific, the number of HD channels increased from 44 to 77. HDTV channels still
represent a minor share of total broadcasts in most regions, but by 2018, 22% of satellite TV
channels are expected to be broadcast in HD, compared to only 4% in 2008.
According to Nielsen, in the US, HDTV penetration is growing rapidly and now stands close to
25%. Growing number of HDTV channels in Europe (from 130 in 2008 to approx 250 in 2011)
is expected to increase high definition penetration at an exponential pace, from only 2% in
2008 to 19% in 2011.
Figure 29 Projected global HD channels per spectrum band
Source: Northern Skies Research
51
Source: NSR & Euroconsult
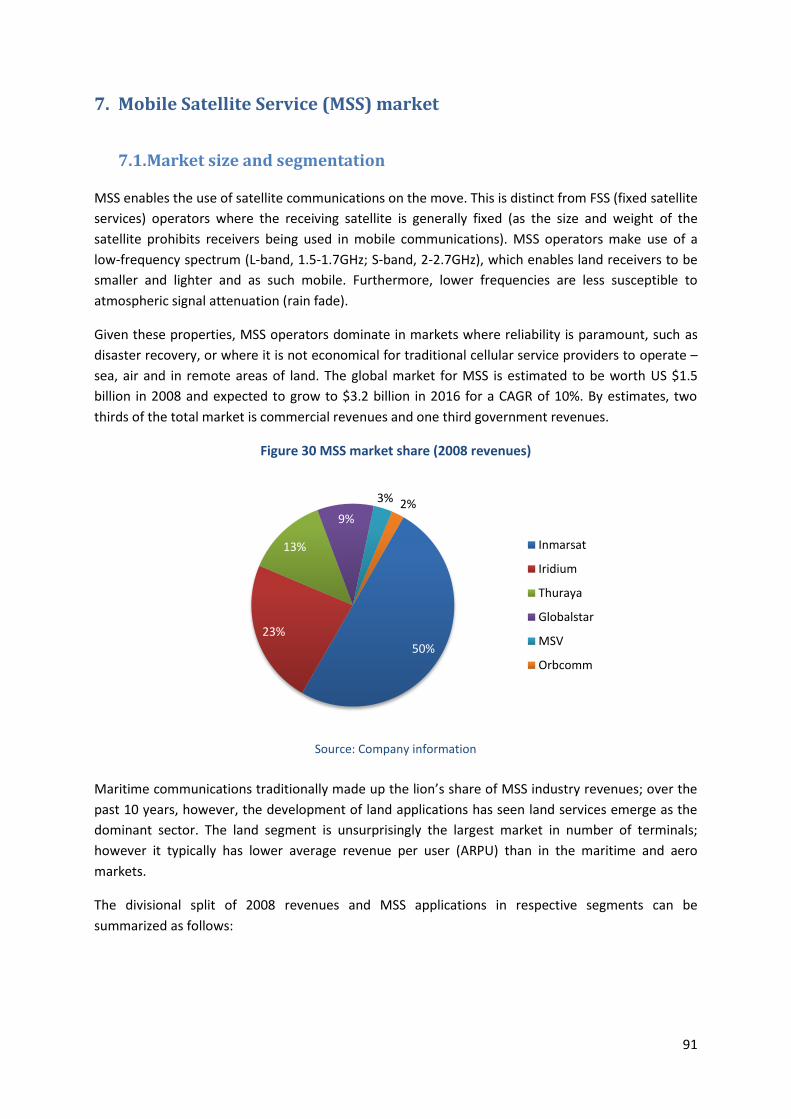
91
7. Mobile Satellite Service (MSS) market
7.1. Market size and segmentation
MSS enables the use of satellite communications on the move. This is distinct from FSS (fixed satellite
services) operators where the receiving satellite is generally fixed (as the size and weight of the
satellite prohibits receivers being used in mobile communications). MSS operators make use of a
low-frequency spectrum (L-band, 1.5-1.7GHz; S-band, 2-2.7GHz), which enables land receivers to be
smaller and lighter and as such mobile. Furthermore, lower frequencies are less susceptible to
atmospheric signal attenuation (rain fade).
Given these properties, MSS operators dominate in markets where reliability is paramount, such as
disaster recovery, or where it is not economical for traditional cellular service providers to operate –
sea, air and in remote areas of land. The global market for MSS is estimated to be worth US $1.5
billion in 2008 and expected to grow to $3.2 billion in 2016 for a CAGR of 10%. By estimates, two
thirds of the total market is commercial revenues and one third government revenues.
Figure 30 MSS market share (2008 revenues)
Source: Company information
Maritime communications traditionally made up the lion’s share of MSS industry revenues; over the
past 10 years, however, the development of land applications has seen land services emerge as the
dominant sector. The land segment is unsurprisingly the largest market in number of terminals;
however it typically has lower average revenue per user (ARPU) than in the maritime and aero
markets.
The divisional split of 2008 revenues and MSS applications in respective segments can be
summarized as follows:
50%
23%
13%
9%
3% 2%
Inmarsat
Iridium
Thuraya
Globalstar
MSV
Orbcomm

92
7.1.1. Maritime market
Maritime market contributes 63% of industry revenues. Inmarsat is the dominant player in the
segment with over 70% share, followed by Iridium with almost 28%. Also, FSS operators are starting
to become active in this segment.
Maritime end-users make use of the following services:
Data and information applications. Ships’ crews and passengers use services to send and
receive email and data files, and to receive other information services such as electronic
newspapers, weather reports, emergency bulletins and electronic charts and their updates.
High bandwidth services such as Iridium’s BGAN based FleetBroadband also allow for video
conference applications.
Vessel management, procurement and asset tracking. Shipping operators use MSS services to
manage inventory on board ships and to transmit data, such as course, speed and fuel stock.
These services are integrated with GPS to allow asset tracking.
Voice services for passengers and crew. Voice services are used for both vessel operations
and social communications for crew welfare.
Security services. The IMO (International Maritime Organisation) requires that all vessels
over 300 tons and all passenger vessels, irrespective of size, must carry GMDSS (Global
Maritime Distress and Safety Systems) terminals. Currently Inmarsat is the only provider of
terminals recognized by the IMO for the provision of satellite-based GMDSS terminals.
Merchant shipping accounts for the bulk of segment revenues as these ships spend the majority of
time away from land. Major clients for the industry include ship operators Maersk and
Mediterranean Shipping Co. Altogether approximately 230 thousand maritime MSS terminals are
installed worldwide (as of June 2009).52
More than 51.4 percent of maritime segment revenues are from data services, 31.5% from voice
services and 17.1% from M2M services.53
While maritime market has boomed during the past decade, recent economic turmoil has resulted in
collapse in new ship builds and unprecedented levels of new ships orders (e.g., Clarkson, the London
shipbroker, reported in September 2008 that orders in 2008 were down 49% according to the
monthly Port tracker report). Despite difficult conditions and softened market growth in large
merchant sector, the demand in segment has remained relatively strong, as Inmarsat’s maritime
revenues showed healthy growth of 9.8% for the first half of 2009.
Inmarsat has attributed this resilience to increased usage, which is more than offsetting the impact
of ships being laid up. Usage costs typically account for less than 0.5% of a ship’s operating costs, and
once the terminals are installed at an initial cost of $25,000 per terminal, customers are fairly price
insensitive. Furthermore, the service is largely viewed as a necessity, often improving the efficiency a
ship.
52
Source: Company reports and estimates 53
Source: Inmarsat

93
Figure 31 Maritime MSS terminals in service globally
7.1.2. Land services market
Land services segment contributes 34% of industry revenues. The land market is hotly contested with
United Arab Emirates based Thuraya being the leader of the segment with ca 30% share, followed by
Iridium, Globalstar, and Inmarsat.
On land, MSS operators provide communication services mainly to areas not serviced by existing
terrestrial cellular networks. Military and government are the largest customers in the land services
market, but customers also include aid organisations, media agencies, and construction, energy and
transport companies.
Altogether there are over 1 million active land MSS terminals globally.
Figure 32 Active land MSS terminals
Source: Company reports, estimates
0
50
100
150
200
250
2004 2005 2006 2007 2008 2009
Tho
usa
nd
s
0
0,2
0,4
0,6
0,8
1
1,2
2004 2005 2006 2007 2008 2009
Mill
ion
s
Inmarsat Iridium Globalstar Thuraya

94
About 60% of all land segment revenues are from voice services and 40% from data services.
Notably, Inmarsat’s land segment revenue structure differs considerably from other operators as
company currently (H1 2009) generates less than 7% of revenues from voice services (approx. 1% of
total voice market).
After years of double-digit declines in the land voice market, Inmarsat’s management hopes to
reverse this trend following the recent launch of the new handheld satellite phone – the Isatphone
(expected to launch globally in 2Q2010). This phone is positioned more competitively than the
previous product against other MSS operators. Management is targeting a 10% or $30 million market
share in the remote land voice market by 2010.
Table 1 MSS Operators: Comparative handset offers
Inmarsat Iridium Globalstar Thuraya
Handset model Isatphone 9505a GSP-1700 SO 2510
Handset cost $500 $1,295 $700 £430
Price per minute $1.00 $0.85-2.00 $0.95-1.99 £1.00-1.50
Sim card $0 $30 $0* £38.00
Data function Yes Yes Yes Yes
GSM hybrid Yes No Yes Yes * On an annual prepay of $750
The average price per minute of a MSS handheld voice minute is currently ca $1.40. An MSS voice
pricing level of $1 per minute has typically been seen as a key pricing point below which subscriber
interest in the service was significantly increased. Following sharp price declines up to 2005, pricing
posted a moderate recovery as operators tried to offset slowing subscriber growth. The slowdown in
growth was largely attributable the new GSM networks in Afghanistan and Iraq, but also a shortage
of Thuraya handset supply.
Figure 33 MSS voice pricing per minute
Source: TMF Associates
Rivalry in the land segment between is mainly concentrated in the handheld and voice markets, and
the low-speed data markets (M2M, machine to machine telemetry). These constellations are
optimized for voice and low-speed data and are unable to offer a reliable high-speed data product.
Given this, MSS operators have competed aggressively for the remote voice market.

95
The emerging high-speed data service market has been dominated by Inmarsat, who until recently
was the only operator to offer global broadband coverage. Inmarsat launched its land Broadband
Global Area Network (BGAN) service in 2005, leveraging from the advanced data capabilities
achievable with the latest generation of satellites, Inmarsat-4. These three satellites are 60 times
more powerful and have 16 times more capacity than the previous fleet, with data speeds of up to
492 Kbps. Older constellations only support speeds of 128kbps. As at 30 June 2009, Inmarsat had
31,896 active BGAN subscribers, an increase of 46% from year earlier. BGAN costs around $50/month
in line rental, and then $7/megabyte of traffic.
As BGAN has continued to be a major source of revenue growth for Inmarsat, other MSS operators
have started to launch similar high-speed data services. In 2008 Thuraya introduced ThurayaIP
service with bandwidth of up to 444 Kbps. ThurayaIP terminal is A5 size and weighs only 1.3kg.
Airtime is being priced at $550 per month for 138MB ($4/MB). There is an all-you-can-eat plan at the
price of $5,000 per month.
7.1.3. Aeronautical market
Aeronautical market contributes 3% of the industry revenues. Inmarsat accounts for close to 80% of
the segment revenues and Iridium for the remaining share. Together Inmarsat and Iridium currently
have 30,000 active aeronautical terminals.
MSS terminals are installed in 80% of all long haul commercial aircraft. Terminals for commercial
aircraft cost up to $350,000 each and are used for: 1) air traffic control communications (safety); 2)
operational communications; and 3) passenger communications. Inmarsat has a unique advantage in
this segment as it is the only satellite communications provider that complies with the ICAO’s
(International Civil Aviation Organization) standards for the provision of aeronautical safety services.
Whilst there has recently been a clear slowdown in the market for corporate jets, this market is fairly
nascent and Inmarsat and Iridium are increasing penetration with existing aircraft. Similarly to
maritime market, once a terminal is installed, customers tend to be not as price sensitive to ongoing
usage costs.
7.2. Perspectives and market trends
7.2.1. Broadband adoption
The MSS sector has seen a significant revenue shift from legacy voice towards data traffic. The latter
has been driven by the growth in higher data rate MSS broadband, principally Inmarsat’s Broadband
Global Area Network (BGAN) service, but also low data rate applications such as asset tracking and
messaging.

96
Figure 34 MSS sector: Revenue by application
Source: Euroconsult
Industry expects handheld (voice) and broadband (data) to drive sector revenues in coming years.
Iridium’s financial results have shown that the better functionality of high-speed BGAN product (data
speeds up to 492 kbps) has led to significant increases in ARPU compared to earlier slower speed
data services. As competing services are launched, all MSS operators are gradually expected to
migrate more customers onto their higher-speed, higher ARPU products. Broadband services are also
expected to be big winners from increasing product penetration as a growing number of new
customers are opting in for broadband connectivity. These developments are estimated to take
broadband services share in operator revenues from low single digits in 2008 to 10.5% or $200
million in 2011.
Migration to higher bandwidth data products has the potential to ramp up data revenues and turn
around the growth profile of the land segment, while driving growth in maritime and aero. When
comparing estimates for numbers of active terminals and revenues for sectors, it is evident that
broadband is the most profitable segment for operators, providing average annual revenue per
terminal of $2,000 in 2011, compared to $790 for slow-speed data and $940 for voice services.
Figure 35 MSS sector: Terminals by sector
Source: Euroconsult

97
In high-speed data services, MSS operators increasingly compete with FSS and VSAT (Very Small
Aperture Terminal) operators, but (according to Inmarsat management) mainly at the margin of the
maritime operations. VSAT operators are able to offer service only at the high end of the maritime
market, where vessels are large enough to carry the heavier fixed satellites required for VSAT or
where usage is such to justify the higher cost.
Inmarsat argues that its products prove cheaper as customers pay on a per bit basis whilst VSAT
operators charge for always-on communications better suited for high-end users. Typical VSAT
monthly cost could be three times higher than Inmarsat’s products. Furthermore, VSAT products are
not compliant with IMO standards.
Competition to Inmarsat domination in maritime services is also strengthening within MSS sector
with the recent launch of Iridium’s marine specific OpenPort data service (always-on data with
speeds up to 128 kbps).
7.2.2. Handheld market
In January 2007 Globalstar, the largest operator by the number of handset terminals, formally
disclosed the degradation in the performance of the solid-state power amplifiers of the S-band
communications antenna on many of its satellites. While Globalstar has secured funding to complete
the construction and launch of its first 24 second generation satellites by the end of 2010, the gap in
service has significantly impacted company’s position in the market.
With Globalstar’s first generation satellite constellation coming to a premature demise (global
coverage has been lacking for voice since the beginning of 2009), other operators have effectively
capitalized on the churn of Globalstar’s customers.
Inmarsat plans to capitalize on the demise of Globalstar’s constellation with the introduction of its
hand-held phone – Isatphone in 2Q10. This product was originally planned to be launched in 2008,
but difficulties with its manufacturer have pushed the launch into 2010. Whilst this product may be a
little late to the market to capture large portions of the segment before Globalstar restarts services,
Inmarsat hopes for a 10% share in handheld revenue within two years of the beginning of sales.
Iridium has successfully targeted Globalstar customers (post the latter’s fleet anomaly) launching its
campaign “Trade up to Iridium”. At the FY2008 9 month results Iridium said that 10% of its net
additional customer base was churned from Globalstar.
Iridium’s own fleet of 66 LEO satellites is due to expire by 2014/15, and at the moment the funding
required for a new constellation is not guaranteed (The Iridium constellation replacement cost,
according to its management is in the order of US$2.7 billion versus Iridium’s current EBITDA of
about £100 million).

98
Table 2 Current MSS fleets
Inmarsat Globalstar Iridium Thuraya
Number of satellites 11 44 66 2
Orbit GEO LEO LEO GEO
Replacement timeframe
>2020 16 by 2010, 28 by 2014
2014 >2016
Replacement cost $1.5bn >$1.25bn $2.7bn $1.2bn
7.2.3. In-flight communications
In April 2008 the European Commission cleared the use of mobile phones on aircraft. This move
effectively opened up in-flight telephony market. In United States, the Federal Communications
Commission currently maintains a ban on in-flight cell phone usage above continental US and US
waters.
Two companies currently offering in-flight voice telephone, text messaging and data services to
passangers are OnAir (owned Airbus and Sita) and Aeromobile (owned Telenor and ARINC). Both use
miniature cellular stations or a picocell system to provide in-flight mobile telephony service. The
system interfaces with the Inmarsat's high-speed SwiftBroadband aeronautical communications
system that provides the backhaul to these providers. The cost of Inmarsat terminals for this service
ranges from $150,000 to $350,000.
The postulated size of the in-flight communications market ranges up to $1 billion by 2012 (estimate
of MultiMedia Intelligence54). Inmarsat believes consensus expectations are around $500 million, of
which it hopes to attract 20% (i.e. its wholesale share).
Although OnAir and Aeromobile have been operating since 2005 and have aggressive targets (OnAir
targets 1,200 planes by 2012), the market remains nascent with only a handful of planes offering
commercial services or trials (OnAir expects to have close to 80 aircraft equipped with its in-flight
mobile connectivity). The current economic climate will probably cause airlines to delay equipment
spend, hence further delaying the pace at which in-flight connectivity is rolled out.
7.2.4. Changes in the supply chain
The satellite service distribution model has changed significantly over the past decade. In the past,
telecommunication companies (including France Telecom, Telenor, KPN) competed against
independent retailers in this space. Following consolidation in the industry, two dominant players
emerged – Stratos (45.6% market share, owned by Inmarsat) and Vizada (38.5% market share,
owned by APAX Funds). Distribution partners also operate land-based transmission facilities that
connect MSS satellites to terrestrial communication networks. It is estimated that 80% or $1.2 billion
worth of MSS sales are generated through satellite service distributors.
54
Broadband in Flight: Next Generation In-Flight-Entertainment, http://www.multimediaintelligence.com/index.php?page=shop.product_details&flypage=flypage.tpl&product_id=9&option=com_virtuemart

99
Figure 36 MSS distribution: revenue share 2008
Source: Company data
This wholesale model enables MSS operators to limit their operational risk and enables them to
operate with a predominantly fixed cost base as they provide no subsidies, contract out
manufacturing and installation, use wholesale distribution and have no subscriber acquisition costs
or service costs.
On 11 December 2007, Inmarsat acquired Stratos, the largest satellite service distributor in the
world. The deal, seen partly as a defensive play, marked a significant change to the distribution
model, with Inmarsat now having a direct interest in the retail market. The deal was a key to securing
long term wholesale profitability, and maintaining an effective supply chain for Inmarsat.
38,5%
45,6%
5,8%
10,1%
Vizada
Stratos
Singtel
Others
Inmarsat Inmarsat
Distributors
End-users
Service
providers
Before
Distributors
Service
providers
End-users
Current
Figure 37 Inmarsat's supply chain before and after Stratos acquisition

100
7.2.5. Military demand
As land MSS market is driven in large part by military demand, the US policies have the potential to
disrupt revenues in this segment.
The activities in Iraq and Afghanistan led to increased demand for commercial satellite capacity from
the Pentagon; Inmarsat alone reported an exceptional $47 million of revenues in 2003 as a result of
increased military demand in these regions.
War, conflict, natural disaster and governmental paranoia are good for MSS business. In the past
satellite operators have benefited from increased military operations in the Middle East. Following
the September 11 attacks, Inmarsat’s revenues in its land division jumped from $125 million in 2002
to $164 million in 2003 with the military operation in Afghanistan. However, US President Obama has
committed to pulling troops out of Iraq and is looking for a pathway to do the same in Afghanistan
over time. Inmarsat’s CEO believes that in the near term, this strategy could be a net positive. The
more established military bases in Iraq make it mainly an FSS environment; in Afghanistan, where
troop mobility remains substantial, it expects increased demand for its mobile satellite services.
Total military demand for bandwidth is expected to continue to rise in the medium term with
increased “netted warfare” techniques and spiraling situations in Gaza, Iran and North Korea.
However, whether this rise in demand is serviced by commercial companies or proprietary military
satellites is less clear. Uncomfortable with its dependence on commercial capacity, the US
government has been developing its own additional capacity (e.g., WGS – the Wideband Global
Satellite program to increase the US military’s Ka- band and X- band capacity). Over the next five
years, the US government plans to increase its internal capacity by 30Gbps to support its anticipated
demand for frequency as a result of netted warfare and communications-on-the-move (COTM)
equipment. As the military’s proprietary assets are deployed, the total demand for commercial
satellite capacity across the industry is expected to diminish.

101
7.3. MSS competitor overview
7.3.1. Barriers to entry in MSS sector
Frequencies
Unlike FSS operators, MSS companies offer their services in the L-Band or S-Band spectrum. L-Band
has a longer wavelengths than Ka/Ku Band hence is less prone to degradation from noise (e.g.,
precipitation), and can be received by smaller ground equipment (antenna). However L-Band
spectrum has less bandwidth than C/Ku/Ka band. In the MMS space Inmarsat, Thuraya and Iridium
operate in L-Band. Iridium and Globalstar, two other key players in the industry, use S-Band.
It is estimated that the timeframe for initiation of a filing for spectrum to launching and operating a
satellite is nine years. Spectrum is however typically secured for 15 years, with an additional 15 years
renewal option. Operators usually account for frequency (and orbital slots) as an indefinite life
intangible asset.
Orbital space
Satellite companies place satellites at varying distances from the earth, depending upon the purpose
of the satellite. Unlike FSS satellites, MSS satellites do not have to point at a fixed location, hence
positioning is less important. Nevertheless, orbital slots can limit the ability of an MSS operator to
deliver global coverage. In this respect Inmarsat is at a clear advantage to Thuraya, with sufficient
slots to cover all of earth from geostationary positions.
Orbital slots are allocated by the International Telecommunication Union (ITU) and Federal
Communications Commission (FCC, based in United States). Given that most of the world’s "hot"
(desired) slots have already been allocated, Thuraya and other (would-be) competitors are limited in
achieving global presence. The scarcity of fixed orbital positions is generally considered to be the
chief entry barrier protecting established operators.
Capital expenditure
The cost of building and launching a geostationary L-Band satellite is estimated at $300 million, and a
global constellation is typically $1.2 billion or more. Normally a satellite takes three to five years to
build. Without economies of scale and other recurring income/cash flow, funding a multi-year
project of this magnitude would be a challenge. While low earth orbit satellites are cheaper
(<$100m) to build, an operator needs at least 20 to provide coverage vs. 3 required by a GEO-based
satellite fleet.

102
7.3.2. Companies offering MSS
Inmarsat Iridium Globalstar Thuraya ICO MSV Orbcomm Terrestar
Frequency L-band L-band S-band L-band S-band L-band VHF S-band
Projected lifespan
2020 2014 2009 2020 2020 2020 2025 2025
Coverage Global (ex remote
polar), ocean
Global Global, no ocean
coverage
Asia, Europe, no
ocean coverage
USA North and Central America
Global US and Canada
Orbit GEO LEO LEO GEO GEO/MEO GEO LEO GEO
Satellites 12 66 48 3 1 2 44 0
Speeds offered
Voice and data up to 492kbps
Data 2.3kbps
Voice/data up to 9.4kbps
Data 9.6kbps Voice and data up to 400kbps
Voice and data up to 400kbps
Data only for M2M
markets
Voice and data up to 400kbps
Terminal base
244 300 320 000 344 000 250 000 NA 20 000 460 000 0 (2010 launch)