analysis of economic developments in 1998 and prospects … · analysis of economic developments in...
TRANSCRIPT
ANALYSIS OF ECONOMIC
DEVELOPMENTS IN 1998 AND
PROSPECTS FOR 1999
(1998 AUTUMN REPORT )
TABLE OF CONTENTS
FOREWORD
1. INTRODUCTION
2. SUMMARY – Economic growth in 1998 estimated at 4 per cent; forecast for 1999
is 3.5 to 4 per cent
2.1. 1998 – Favourable economic developments, forecast economic growth will be
achieved
2.2. 1999 – Economic growth from 3.5 to 4 per cent
3. INTERNATIONAL ECONOMIC ENVIRONMENT – Slowdown in economic
growth expected in Europe and the USA in 1999
4. GROSS DOMESTIC PRODUCT – 4 per cent economic growth in 1998, 1999
forecast: 3.5 to 4 per cent growth
4.1. PRODUCTION STRUCTURE OF GROSS DOMESTIC PRODUCT – 3.7 per
cent real-term increase in value added in 1998; 3.3 per cent in 1999
4.2. THE EXPENDITURE SIDE OF GROSS DOMESTIC PRODUCT – Exports
were the most important growth factor in 1998; in 1999, the contributions of domestic
and foreign demand will be more balanced
4.3. COST STRUCTURE OF GROSS DOMESTIC PRODUCT – Positive
developments continue
5. EXPORT COMPETITIVENESS AND INTERNATIONAL TRADE
5.1. EXPORT COMPETITIVENESS – Competitiveness of Slovenian manufacturing
will deteriorate
5.2. EXPORT-IMPORT FLOWS AND THE BALANCE OF PAYMENTS – A
slowdown in world trade flows and subdued economic growth are likely to cause the
slower growth of Slovenian exports
5.3. FOREIGN DIRECT INVESTMENT – After accelerated growth in foreign
direct investment inflows into Slovenia in 1997, modest developments are expected in
1998
6. INVESTMENT – Gradual growth continues
7. EMPLOYMENT AND UNEMPLOYMENT – The downward trend in
employment has been halted
8. WAGES - Moderate growth
9. PUBLIC FINANCE
9.1. GENERAL GOVERNMENT REVENUE IN 1998 – The share of general
government revenue in gross domestic product at approximately the same level as last
year
9.2. GENERAL GOVERNMENT EXPENDITURE IN 1998 – Consistent
implementation of the Government’s resolution on general government expenditure
reduction is of utmost importance
9.3. GENERAL GOVERNMENT REVENUE IN 1999 – Characterised by tax
reform
9.4. GENERAL GOVERNMENT EXPENDITURE IN 1999 – The total general
government expenditure will amount to 44 per cent of gross domestic product
10. PRICES – 1998 inflation rate lower than anticipated, average annual inflation to
continue falling next year
11. MONEY AND LIQUIDITY – Interest rates have dropped substantially
12. THE SECURITIES MARKET – Ljubljana Stock Exchange’ s market
capitalisation is growing fast
STATISTICAL APPENDIX
BIBLIOGRAPHY
7Page
FOREWORD
The Autumn Report reviews economic developments and the factors of growthin 1998, and examines the prospects for 1999. For several years, the Reporthas been prepared by the Institute of Macroeconomic Analysis and Develop-ment (hereafter IMAD) in Slovene and English. The Government of the Re-public of Slovenia assesses it and draws on it in preparing the Budget andshaping measures of economic policy.
The Report is based on official statistics, in particular those of the StatisticalOffice of the Republic of Slovenia (SORS), the Bank of Slovenia (BS), theAgency for Payments (AP), and the expert findings of domestic and foreigninstitutes. Based on these figures, the new estimate of National Accounts for1998 and 1999 was prepared by IMAD in October this year. They werefounded on the national accounts statistics of SORS, who, in its last edition,replaced the 1992 prices with the 1995 ones in the categories using constantprices. This does not allow direct comparison of national accounts preparedin spring with the autumn ones.
The 1998 Autumn Report was prepared by Alenka Kajzer (editor, head ofproject, summary), Branka Tavèar (national accounts), Lili Figar (investment),Pavle Gmeiner (industry, country risk), Andrej Hrovat (money and liquidity),Slavica Juranèiè (export competitiveness), Mateja Kovaè (agriculture), RotijaKmet (international economic environment), Sa�a Kovaèiè (wages), Toma�Kraigher (employment and unemployment), Jasna Kond�a and Du�an Kidriè(public finance), Jo�e Markiè (export-import flows and the balance of pay-ments), Nata�a Marzidov�ek (prices), Jure Pov�nar (energy sector, mining,transport and communications), Mateja Peèar (hotels and restaurants, do-mestic trade), Janja Peèar (unemployment by regions), Matija Rojec (foreigndirect investment), Ana Seènik (manufacturing), Janez �u�ter�iè (introduc-tion), Ivanka Zakotnik (national accounts).
FOREWORD
The 1998 Autumn Report is based on data availableup to 5 November 1998.
IMAD AUTUMN REPORT 1998
8 Page
1 INTRODUCTION
Global economic developments have this year been marked by the Asianand Russian financial crises which have developed into an economic reces-sion that will continue to have a strong impact on a large part of the worldincluding some of the most developed countries. Slovenia will be unable toavoid the effects of the crisis, however they are expected to be relativelylimited. It is anticipated that the 4 per cent real economic growth forecast inspring will be reached by the end of the year and that next year the realgrowth in gross domestic product will be between 3.5 per cent and 4 percent.
Economic indicators in the first half of 1998 were even slightly better thanexpected. Gross domestic product increased more than expected, which isalso true of industrial production, and the exports of goods and services.The rise in the gross wage per employee has lagged behind growth in pro-ductivity and the rate of employment has improved a little. Monetary trendshave been equally favourable: the inflation rate will be by about 1 percent-age point lower than forecast, interest rates are much lower than at thebeginning of the year, while in the banking sector long-term corporate lend-ing is increasing significantly along with the level of personal savings. Sinceit is expected that positive trends, especially those in exports and industrialproduction, will slow down by the end of the year, and also the Sloveneeconomy�s international competitiveness will deteriorate, consequently theeconomic growth this year is unlikely to differ much from the 4 per cent-rate anticipated in spring.
Next year, favourable trends in the Slovene economy are expected to con-tinue. Real unit labour costs calculated in tolars are likely to drop a bit more,however their level measured in the basket of currencies would probablyrise. Next year investments should increase at the same rate as this year,triggered also by favourable credit terms, moderately growing productioncosts, and the ownership restructuring of companies. Inflation will continueto decrease, whilst the appreciation of the tolar is predicted to be somewhatless pronounced than this year. General government deficit as a share ofgross domestic product is expected to slightly decrease. On the other hand,the expected lower rates of economic growth and imports in the most im-portant trading partners of Slovenia, most of which are among the countriesleast effected by the recession, is estimated to result in lower growth inSlovene exports of goods and services and a slightly bigger deficit on thecurrent account of the balance of payments. It is estimated that the deterio-
9Page
ration in international environment and the generally favourable domesticsituation will result in 3.5 per cent to 4 per cent economic growth.
It is interesting to draw a comparison between the projected trends in theSlovene economy and the forecasts for the European Union (hereinafter: theEU) member-states. According to the autumn projections, economic growthin the EU next year will drop by around one-half of a percentage point andreturn to the current level in the year 2000. The European Commissionbelieves that the EU economy next year will remain an island of stability inthe recession already affecting almost one-third of the world�s productionand resulting in halved world economic growth in 1998. The Commission�soptimism is primarily based on internal economic stability shown in improv-ing investment profitability, record low interest and inflation rates, and highlygrowing productivity accompanied by moderately increasing labour costs,all of which positively affect production costs. It has also established that,owing to balanced public finance in the EU countries together with thecredible announcement of the introduction of the euro, European capitalmarkets have successfully avoided the impact of the global financial crisis.
This reveals an important difference between the position of Slovenia andthe EMU states. Even though Slovenia can boast a relatively stable domesticeconomic situation, its financial stability, especially the stability of the tolar,is not based on participation in the European monetary system nor on thetolar�s pegging to any particular currency, but exclusively on the stability ofits own economy and the credibility of economic policy. In 1999, which willbe probably see further depreciation of certain currencies, it is particularlyimportant that the economic policy�s primary goal remains sustainable long-term economic growth combined with the strengthening of economic sta-bility (lower inflation rate, stable exchange rate, small general governmentdeficit) and positive macroeconomic relationships (wage increase laggingbehind productivity growth, relatively low interest rates, growing nationalsavings). Economic policy could seek growth-boosting measures within theframework of these macroeconomic constraints mainly in more wide-use ofexport insurance instruments of, promotion and attraction of (foreign) in-vestment and technological development.
In view of the global recession, it is possible that the governments of ad-vanced European economies next year decide for a more expansionist eco-nomic policy based on the Keynesian approach to boosting domestic de-mand. Since the financial world�s response will be inevitably negative, theeffects of such a policy are uncertain - if favourable, the increased economic
INTRODUCTION
IMAD AUTUMN REPORT 1998
10 Page
growth in these countries could be beneficial for Slovenia too. Slovenia hasworse initial position for implementing expansionist economic policy thanEU member-states, mainly due to its higher and inconstant inflation rate andweaker financial stability. In the given macroeconomic framework there isno room for a policy of raising public expenditure or boosting householdconsumption, since experience has shown that, after a possible short-termrise in public outlays or wages, it would take too long before the existingfavourable relationships could be re-established. Moreover, enforcing ex-penditure can trigger inflation and jeopardise international financial stabilityof the country and/or its currency. Negative consequences resulting fromshort-term promotion of growth are evidenced by data on the situation inthose countries in transition whose economic growth is the same or higherthan the Slovene, but which is financed through high budget or currentaccount deficits and inflation.
In order to maintain favourable conditions in the Slovene economy andsustainable economic growth based on domestic investment and technologi-cal development, the government can do the most by furthering and accel-erating structural reforms as well as by adapting the institutional framework,which also involves the process of Slovenia�s integration into the EU. Asdescribed in the World Bank�s study (cited in Keefer and Shirley, 1998, p.10), adequate institutions (in the sense of the rule of law and protection ofproperty rights) are even more important for economic growth than appro-priate macroeconomic policy. An important element in this process is thecontinuing restructuring of the corporate sector along the lines of an open,export-oriented development which the state can help through gradual pri-vatisation of state-owned enterprises and banks, through introducing com-petition to monopolistic or near-monopolistic sectors, through efforts for amore efficient judiciary and better financial discipline. Company restructur-ing will be promoted and facilitated also by amendments in labour legisla-tion. The new Labour Relations Act, presently in the parliament discussion,will improve labour market flexibility by increasing on the one hand theflexibility in dismissals and on the other better protection of employeesagainst any breaches of regulations. During implementation of the foreseenreform of indirect taxation (the introduction of value-added tax and exciseduties), which will decrease effective taxation of exports and the size of theblack economy, appropriate information will have to be disseminated inorder to reduce as much as possible the uncertainty in the corporate sector,and possible liquidity problems in the period of introducing the new systemwill have to be taken care of. Long-term stability of public finance will ofcourse inevitably require the planned pension reform. In the area of health

11Page
care, measures within the present system will have to be used to keep theshare of health care outlays in gross domestic product at the same level overthe next few years. All these orientations are clearly defined in state strategicdocuments connected with the EU integration process.
INTRODUCTION
IMAD AUTUMN REPORT 1998
12 Page
2 SUMMARY � Economic growth in 1998 estimated at 4per cent; forecast for 1999 is 3.5 to 4 per cent
2.1 1998 � Favourable economic developments, forecast economicgrowth will be achieved
With the 3.3 per cent real growth in gross domestic product in 1996, and 3.8per cent growth in 1997, Slovenia has reduced the lag behind the EU coun-tries� average in terms of economic development. In 1995, it reached 65 percent of the level of average gross domestic product per person (measured incurrent-price purchasing power standards) in EU, while in 1997, it was 68per cent (EUROSTAT, 1998). A real gross domestic product per person ofECU 13,000 has allowed Slovenia to maintain the first position among thecandidate-countries applying for EU membership. Compared to less devel-oped EU-members, Slovenia�s development lags behind Greece by less than1 per cent (ECU 13,100) and Portugal by 3 per cent (ECU 13,400).
Due to the Slovene economy�s smallness and openness, economic develop-ments in Slovenia depend strongly on economic developments in the in-ternational environment, i.e. particularly those of its most important Euro-pean trading partners. In recent years, exports of goods and services amountedto around 55 per cent of annual gross domestic product, while around 65per cent of Slovenia�s total exports are sold in the EU market. Owing to theAsian and Russian crises, spreading also to Latin America, global economicgrowth has already halved this year - following 4.1 per cent economic growthin 1997, the global economy is expected to grow by only 2 per cent in 1998(IMF, 1998b). Nevertheless, in 1998, economic growth in EU countries hasnot been affected by the recession due to rise in domestic demand. Onaverage, the gross domestic product is expected to rise in real terms by 2.9per cent in the EU countries this year, representing 0.1 of a percentage pointmore than forecast by the European Commission in spring. To a limitedextent, the consequences of deteriorated conditions in the international en-vironment will be seen in Europe next year. In 1999, economic growth isexpected to be 2.4 per cent, which is 0.6 of a percentage point less thanestimated in spring (EC, 1998). The outburst of the Asian and Russian finan-cial crises does not have a strong direct impact on the Slovene economy,owing to the relatively limited scope of trading with these countries (exceptsectors that appear substantially on the Russian market). By decreasing im-ports, a drop in EU growth will also impact on economic growth in countriesin transition. According to IMF study, Slovenia, among other countries in
13Page
transition, is considered to be most sensitive to changes in growth of grossdomestic product in the member-states of European Monetary Union (IMF;1998b). Judging from these estimates, growth in EMU countries rising ordropping by 1 per cent causes exports of goods to fluctuate by 1.1 per cent,and economic growth in Slovenia by 0.5 per cent.
In the first half of 1998, economic trends in Slovenia were relatively favour-able: in the first half of the year, gross domestic product rose in real terms by4.8 per cent over the same period in 1997, the physical volume of manufac-turing in the first nine months grew by 4.9 per cent over the same period in1997, and exports of goods in the first eight months increased in real termsby 9.4 per cent over the same period in 1997. Growing stocks, deterioratinginternational competitiveness in manufacturing, findings of SORS� survey onbusiness tendency in manufacturing (a drop in export orders) and businessexpectations, recorded by the Chamber of Commerce and Industry in Slovenia(SKEP-GZS, 1998) already reveal less favourable tendencies resulting fromdeteriorated international environment. Nevertheless, it is estimated that the4 per cent-economic growth forecast in spring will be achieved this year.
Exports of goods (estimated to rise in real terms by 6.5 per cent) are also themain factor of economic growth in 1998 (similar to 1997), which in theproduction area primarily promotes growth in manufacturing (3.5 per centrise in real terms in value added), transport, storage and communications(4.6 per cent rise in real terms in value added). It is estimated that relativelyfast growth in value added will be recorded in hotels and restaurants, finan-cial intermediaries (5.5 per cent), and community and personal services (5.5per cent). In the framework of domestic demand (4 per cent rise), invest-ment is estimated to record the highest growth (+ 6.7 per cent), whilst gov-ernment consumption is also above average (+4.6 per cent). In 1998, exter-nal trade is characterised by an about 6.5 per cent-rise in exports of goodsand slow growth in the exports of services, estimated to increase in realterms by only 1.5 per cent in 1998 compared to 1997. Slow growth in theexports of services mainly results from a modest inflow from tourism, esti-mated to decline in real terms by 5 per cent in 1998 over 1997. The moderateforeign currency inflow from tourism primarily results from lower levels ofso called shuttle trade from Austrians (restricted imports of tobacco prod-ucts) and Italians (reduced petrol prices in near-border areas). The tradedeficit of USD 516.6 million in the first eight months of 1998 is expected toincrease to about USD 780 million by the end of the year (USD 772 million,in 1997). The surplus in services trade will be lower than in the past fewyears (about USD 525 million). The deficit on the current account in the
SUMMARY
IMAD AUTUMN REPORT 1998
14 Page
balance of payments is estimated to amount to USD 5 million.
Despite the fact that in previous years the level and inflows of foreign indi-rect investments to Slovenia also lagged behind competitive countries intransition, this year�s moderate inflow is particularly alarming. In the firstseven months, the inflow amounted to USD 141 million, two-thirds of whichrepresents the inflow under an agreement made back in 1997. This modestinflow indicates that Slovene companies are too slow in searching for strate-gic foreign partners (due to ownership structure), which may be fatal intimes of globalisation and integration, especially in more globalised indus-tries that are characterised by increasing returns to scale and the great impor-tance of economies of scale.
Unit labour costs in manufacturing (deflated by consumer prices) will de-crease by 1.8 per cent in 1998, resulting from the lag in labour cost growthper employee behind the rise in productivity. When estimating internationalcompetitiveness, these costs must be measured in a basket of currencies ofthe most important trading partners. In 1998, unit labour cost measured inthe basket of currencies, are expected to rise by about 3.3 per cent over1997. Even though price and cost competitiveness has deteriorated, com-petitiveness is still better than in 1995, when it hit a low.
After a dynamic rise in prices in the first half of 1998, inflation levelled off insummer. In October, consumer prices grew by 5.4 per cent over last Decem-ber, while at the annual level inflation was 6.9 per cent, the lowest levelrecorded since independence. Wage impacts on prices are weaker thanexpected, since the period of moderate growth in wages has been quitelong. Until the end of the year, additional impacts on prices are not expectedeven from exchange rate movements. In 1998, in spite of expected adjust-ments of controlled prices in November and December, inflation will notreach 8 per cent as forecast in spring. It is estimated that, in the period fromDecember 1997 to December 1998, prices will increase by less than 7 percent (spring forecast 8 per cent). Average annual inflation will also be lowerthan the spring forecast. It is now estimated at around 8 per cent (springforecast 8.5 per cent).
Last year�s agreement of the social partners on wages, which was codified bythe Minimum Wage and Wage Adjustment Mechanism Act passed in July,1997, led to a slowdown in growth in prices even in 1997 (2.4 per cent risein the average gross wage per employee, in real terms) and also influencedthe slowing down of wages in 1998. Growth in wages is moderate in both
15Page
the private and public sectors. In the first eight months of 1998, the averagegross wage per employee rose in real terms by only 1.4 per cent over thesame period in 1997. Given the usual seasonal rise in wages in the lastquarter, it is estimated that in 1998, the average gross wage will increase inreal terms by something less than 2 per cent compared to 1997.
The slightly positive trends in the area of employment recorded in the sec-ond half of 1997 are also present in 1998. The number of persons in employ-ment fluctuates seasonally, nevertheless in 1998 the number of employeeswill increase by about 0.5 per cent over last year (according to the definitionof SNA). A big gap between registered and survey-estimated unemployment(labour force survey data), which makes the international comparability ofunemployment data possible, exists in 1998 as well. In the second quarter of1998, the survey-estimated unemployment rate was 7.7 per cent, slightlymore than last year�s average of 7.4 per cent.
The state budget for 1998 was adopted in April 1998. Anticipated state budgetexpenditure amounted to SIT 879.5 billion (6.8 per cent more than in 1997).The realisation of state budget expenditure in the proposed amount wouldcause the budget deficit to exceed the planned 1 per cent of gross domesticproduct, that is why the Government, in compliance with Article 23 of thePublic Consumption Financing Act, has temporarily restrained funds allo-cated in the state budget for 1998, amounting to around SIT 20 billion.Through this measure, the budget deficit will be preserved at the level of 1per cent of gross domestic product (according to existing methodology ofpublic finance flows consolidation), i.e. it will arrive at 1.2 per cent of grossdomestic product according to new methodology of representing publicfinance, in compliance with the government finance statistics of the Interna-tional Monetary Fund1. Total general government expenditure, presentedaccording to the existing methodology by means of estimates, will reach45.7 per cent of gross domestic product, as in 1997, but when presentedaccording to the new methodology, they will reach 44.1 per cent of grossdomestic product. According to the existing presentation by estimates, totalgeneral government revenue will reach 44.7 per cent of the gross domesticproduct (44.6 per cent in 1997), whereas according to the new methodol-ogy, they will reach 42.9 per cent of the estimated gross domestic product(42.6 per cent in 1997).
The measures proposed in the so-called austerity programme that the
SUMMARY
1 The difference between the existing and new methodology of representing government fi-nance is explained at the beginning of Chapter 9.
IMAD AUTUMN REPORT 1998
16 Page
Government presented together with the proposed state budget for 1998have brought positive results in 1998 in the area of wage trends andpublic administration employment. In 1998, the average number of employ-ees in public administration will not increase for the first time after inde-pendence. In August, the average gross wage per employee in public ad-ministration decreased in real terms by 1.4 per cent over the average in 1997.New taxes made up for the loss in customs revenues.
Since Euromoney did not publish estimates of regional risk in spring, be-cause of the Asian financial crisis, the autumn estimate brought great changesamong first ten as well (see Euromoney, September 1998). This time, Sloveniaoccupied 38th position and preserved its first place among countries in tran-sition.
2.2 1999 � Economic growth from 3.5 to 4 per cent
In 1999, economic growth in Slovenia will be marked by the slowingdown of economic growth in EU-countries, especially in the most importanttrading partners. In 1999, according to estimates of the European Commis-sion, economic growth in individual EU countries will decrease by 0.2 (Spain)to 3.2 (Ireland) percentage points over 1998. Economic growth is expectedto improve only in Italy and Greece. According to European Commissionestimates, economic growth in Germany, Slovenia�s most important tradingpartner, is expected to rise by 2.2 per cent in 1999 (2.8 per cent in 1998).Owing to the slowdown in economic growth and lower import growth fore-cast of Slovene most important trading partners, deteriorated competitive-ness of Slovene manufacturing and moderate growth in domestic demand, itis estimated that economic growth could reach from 3.5 to 4 per cent.
In the last two years, the main growth factor was foreign demand, but in1999 the contribution to growth coming from domestic and foreign de-mand will be more balanced. With slower growth in exports (estimated 3.8per cent growth in real terms), it is important that the increase in domesticprivate consumption (3.2 per cent) and investments (6.8 per cent) will beabout the same as in 1998. It is estimated that value-added growth will leveloff in all industries, while the highest growth rates will be recorded in cater-ing (4 per cent), construction (4 per cent), transport, storage and communi-cations (4.5 per cent), financial intermediaries (4 per cent) and common andpersonal services (5.3 per cent). In the framework of domestic demand,investment is expected to increase the most also in 1999 (about 6.8 percent).
17Page
In 1999, the slowdown in economic growth and export market growth inSlovenia�s most important trading partners will slightly limit the increasein Slovene exports. Autumn estimates of real import growth rates (LINK1998; IMF 1998b; EC 1998) of Slovenia�s seven most important trading part-ners in the OECD indicate 4.5 per cent-growth in the aforementioned exportmarkets (spring estimates indicated a 6.9 per cent growth). Due to loweredforecast of economic growth and import growth, the spring estimate of growthin Slovene exports of goods and services has been lowered. It is estimatedthat the growth in export of goods and services of about 5.6 per cent in 1998will level off, thus arriving at about 3.8 per cent. Since a substantial part ofgoods imports is destined for further manufacturing for export, growth inimports of goods is also anticipated to slow down. With goods imports growingslightly faster (at about 4.3 per cent in real terms) than goods exports (about4.1 per cent in real terms), the trade deficit will expand slightly, amountingto about USD 900 million. The surplus in the services trade, amounting toUSD 540 million, is anticipated to cover a significant part of the goods tradedeficit (as in previous years). The current account of the balance of pay-ments would thus remain rather close to the balanced one, as in the lastfour years. Namely, the deficit is estimated to amount to about USD 80million, which is 0.4 per cent of the estimated gross domestic product.
Moderate economic growth and a moderate rise in wages will enable thepositive trends in the labour market to continue. In 1999, employment isexpected to rise by about 0.5 per cent. The active employment policy andamendments to the Law on Employment and Insurance in the Case of Un-employment, which newly defines criteria for acquiring and preserving un-employment status, will lead to a lower registered unemployment rate in1999 (about 14.1 per cent). The survey unemployment rate is estimated torange between 7 and 8 per cent.
In the first half of 1999, wage policy will be determined by the MinimumWage and Wage Adjustment Mechanism Act, adopted in 1997. The socialpartners are still negotiating the wage policy in the second half of the year,taking into account the introduction of value-added tax. Given the presump-tion that public sector wages will stabilise in real terms and similar trendswill continue in other sectors, as in 1998, it is estimated that the gross wageper employee will increase in real terms by about 1.8 per cent in 1999.
This year, the government tabled the state budget draft for 1999 to theparliament in time, so that it will be adopted by the end of 1998. The
SUMMARY

IMAD AUTUMN REPORT 1998
18 Page
proposal anticipates revenues amounting to SIT 928.8 billion, and expendi-ture amounting to SIT 958.6 billion. The budget deficit would thereforeamount to SIT 29.8 billion, representing 0.8 per cent of the projected grossdomestic product in 1999.
Payments from both social security funds will amount to 19.7 per cent ofgross domestic product. Social security contributions will make up 15.1 percent of gross domestic product. By means of transfers, the state budget willfinance the outlays of the Pension and Invalidity Insurance Agency to theamount of 4.1 per cent of gross domestic product. State budget transfers forfinancing social security payments have already reached the level not to beexceeded in future years. The pension reform that will put a stop to increas-ing public expenditures is ready and, from the public finance point of view,it should be carried out as soon as possible. In the framework of healthinsurance, it is necessary to ensure, by using measures available in the cur-rent system, that public expenditures will not increase.
According to estimates anticipating the introduction of the value-added taxin the middle of the year, as well as the extension of the budget year toJanuary 2000, public finance revenues would, under the new methodologyof presenting general government finance, arrive at 43.3 per cent of grossdomestic product. If the state budget is passed within proposed amount,general government finance expenditures will arrive at 44 per cent of grossdomestic product. In 1999, the general government deficit would thus amountto 0.7 per cent of the gross domestic product.
19Page
3 INTERNATIONAL ECONOMIC ENVIRONMENT –Slowdown in economic growth expected in Europe and
the USA in 1999
Autumn’s forecasts of international institutions on world economic growththis and next year are by about one percentage point below those in spring.Hence, economic growth is expected to reach about 2 per cent this year andabout 2.5 per cent in 1999 (LINK, 1998; IMF, 1998b). Compared to 1997, thisyear’s world economic growth has been halved. The main reason for thecorrections to economic growth estimates is the world financial crisis accom-panied by economic recession. Some estimates suggest that the world isfacing its most severe financial crisis after the Second World War (for moredetails see Šlibar, 1988). Even though no cure has been found for the areashit by the crisis, international institutions (IMF, 1998b; EC, 1998) forecastnormalisation of the situation in the year 2000.
In mid-1998, the United States saw a halt in its economic downturn. Lastyear, the American economy recorded a 3.8 per cent-rate of real economicgrowth compared to 2.8 per cent in 1996. The driving force behind thatgrowth was private consumption (consumer confidence was fuelled by alow unemployment rate, recorded at 4.5 per cent in June) and investment ofthe business sector. On the other hand, the Asian crisis almost completelyhandicapped the American export sector (only just over 3 per cent in realgrowth of exports of goods and services is expected this year), which will tosome extent contribute to low economic growth, forecast at 3.2 per cent (EC;1998) or 3.5 per cent (IMF, 1998b) in 1998, and 2.0 per cent (IMF, 1998b) or2.5 per cent (LINK, 1998) in 1999.
In the European Union, the dynamic trend in economic growth continuesthis year. The European Commission even corrected its spring estimate up-wards by 0.1 of a percentage point (see EC, 1998). In the two most importantEuropean economies, the German and French, domestic demand is a moreimportant factor of economic growth this year than last year, when the eco-nomic upturn was mainly supported by export growth. Next year, domesticdemand is expected to play an important role in Austria and Italy. Fairlyfavourable economic trends are also forecast to continue in other EU Mem-ber States despite subdued economic growth. The economic growth in theEU is on average expected to range between 2.7 per cent (LINK, 1988) and2.9 per cent (EC, 1998, IMF, 1998b). In the majority of EU Member States, thisyear has seen an improvement in the labour market – the average unem-
INTERNATIONAL ECONOMIC ENVIRONMENT
IMAD AUTUMN REPORT 1998
20 Page
ployment rate in EU countries fell from 11 per cent in 1997 to 10 per cent inAugust 1998. However, the problem of structural unemployment is still threat-ening. In its forecast for next year, the European Commission admitted thatthe worsening of conditions in the international environment will not leaveEU economies unaffected. The Commission has revised its spring estimate of3 per cent average economic growth in EU countries downwards to 2.4 percent, similar to the International Monetary Fund (IMF, 1988b). Next year’srates of economic growth are expected to be lower in all 15 Member Statesexcept Italy and Greece (EC, 1988).
In Germany, dynamic economic growth continued in the first half of theyear due to stronger domestic demand, particularly for capital investment.Parallel to dynamic economic growth, employment began to rise; the labourmarket situation is currently improving only in the western part of the coun-try. This year’s economic growth estimates range between 2.6 per cent (LINK,1998; IMF, 1998b; WIFO, 1998) and 2.8& (EC, 1998), and forecasts for 1999between 2.2 per cent (EC, 1998) and 2.5 per cent (IMF, 1998b; IFO, 1998).Next year’s economic growth should be supported by increased private ex-penditure resulting from a somewhat more favourable labour market situa-tion.
According to the forecasts by the Austrian WIFO institute, economic growthin Austria should reach 3 per cent this year, the European Commission’s
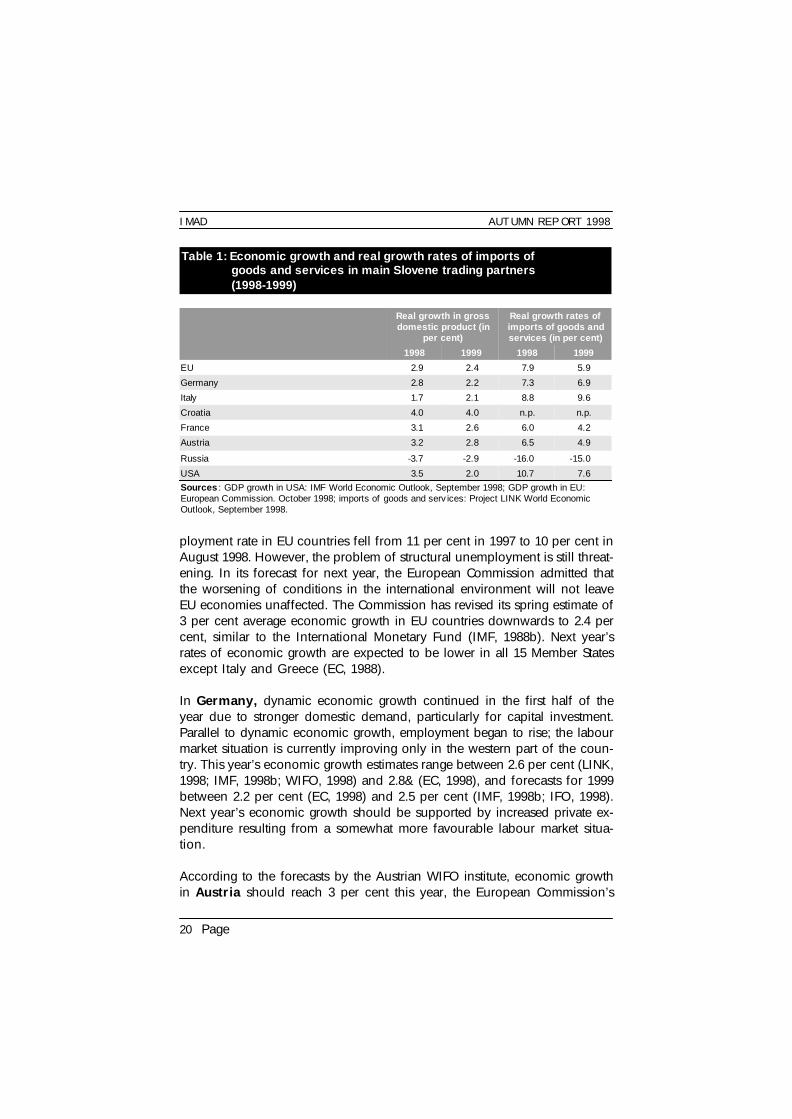
Table 1: Economic growth and real growth rates of imports of goods and services in main Slovene trading partners (1998-1999)
Real growth in grossdomestic product (in
per cent)
Real growth rates ofimports of goods andservices (in per cent)
1998 1999 1998 1999
EU 2.9 2.4 7.9 5.9
Germany 2.8 2.2 7.3 6.9
Italy 1.7 2.1 8.8 9.6
Croatia 4.0 4.0 n.p. n.p.
France 3.1 2.6 6.0 4.2
Austria 3.2 2.8 6.5 4.9
Russia -3.7 -2.9 -16.0 -15.0
USA 3.5 2.0 10.7 7.6Sources : GDP growth in USA: IMF World Economic Outlook, September 1998; GDP growth in EU:European Commission. October 1998; imports of goods and services: Project LINK World EconomicOutlook, September 1998.
21Page
October estimate is even slightly higher (3.2 per cent). Favourable economicresults (2.5 per cent real growth in gross domestic product last year) areexpected to be achieved mostly through the exports of goods (real growthestimate at 10 per cent) and capital investment (according to WIFO esti-mates, 7.5 per cent-real growth this year). Favourable results were contrib-uted to by cyclical recovery in other Member States and further increases ofexports into Eastern and Central European countries. WIFO forecasts that,with the rise in private expenditure (by 1.9 per cent in real terms this yearand 2.2 per cent next year), gross domestic product should go up by 3.2 percent in real terms in 1999. The European Commission’s October forecast ismore modest: it predicts 2.8 per cent-economic growth.
In France, the ongoing dynamic economic growth continues (Meary, 1998).The forecast 3.3 per cent real growth in gross domestic product in 1998should be achieved mostly by domestic expenditure, both private consump-tion (expected 5.7 per cent-real growth) and investment (5.7 per cent-fore-casted real growth). However, net exports should contribute negatively toeconomic growth in 1998 and 1999. This year’s private consumption growthwill not be repeated next year due to the more restrictive monetary policyexpected in 1999. Hence, the economic growth rate in 1999 should be by 0.3to 0.5 of a percentage point lower than this year.
According to the latest estimates of the Italian Government and internationalinstitutions, this year’s economic growth in Italy will be lower than expected(1.7 per cent growth instead of the forecast 2.4 per cent). On the one hand,the impact of the Asian and Russian crises is hindering any faster increase inexports and, on the other, the rise in private consumption is still modest.Capital investment does not meet expected growth rates despite lower inter-est rates. The International Monetary Fund (IMF, 1998b) estimates that thecountry will see more substantial improvements in economic growth onlyafter short-term interest rates have been lowered to EU levels, which shouldin turn trigger growth in private consumption and investment.
After the average economic growth rates in CEFTA countries in 1997 fell byless than one percentage point compared to the previous year, this year’sgrowth should remain at last year’s level (3.8 per cent), according to theLINK model forecasts on economic growth in individual countries. Analystsexpect higher average levels of economic growth in CEFTA countries nextyear, when gross domestic product in these countries should on averageincrease by 4.8 per cent. This should be largely contributed to by the ex-pected recovery of the Czech and Romanian economies.
INTERNATIONAL ECONOMIC ENVIRONMENT
IMAD AUTUMN REPORT 1998
22 Page
In 1998, the stagnation of the Czech economy is continuing. In the firstquarter, gross domestic product fell by 0.9 per cent in annual terms. Themain factor underlying the one-percent economic growth in 1997 was ex-ports. A similar trend continues this year. High real growth rates of industrialproduction (8.4 per cent in the first quarter in annual terms) are related toaccelerated growth of exports (20 per cent-real growth in the first half of theyear) due to depreciation of the Czech koruna. Domestic demand, on theother hand, has a negative effect on economic growth in the Czech republic(2.5 per cent real drop in gross fixed capital formation in the first threemonths of this year, in annual terms). The Czech Statistical Office forecaststhis year’s real gross domestic product to remain at last year’s level. Inflationshould reach a one-digit level in 1999 in an environment of falling realwages and the gradually lifting of controlled prices. Further restructuring ofthe economy is expected to increase unemployment to about 7 per cent inthe following few years.
Figures for the first half of 1998 indicate that the period of dynamic eco-nomic growth that started in 1997 continues in Hungary. Industrial produc-tion in the first half of the year rose by 14 per cent in real terms, and grossdomestic product by approximately 5 per cent (WIIW estimate, 1998 and theBudapest University of Economics). Economic growth is still largely fuelledby exports, which are rising faster than imports. This year’s deficit on thecurrent account of the balance of payments is expected to be lower thanoriginally forecast. Hungarian and foreign analysts’ estimates of economicgrowth in 1998 and 1999 stand at about 5 per cent. According to someestimates, inflation is expected to fall to a one-digit level in 1999 (Simon,1998). Even though it is still relatively high (this year’s estimate is 4.5 percent of gross domestic product), the proportion of general government defi-cit in the gross domestic product is gradually going down.
As in previous years, Poland has recorded the highest economic growthrates this year among CEFTA countries. According to the latest estimates(Welfe, 1998), gross domestic product rose by 7 per cent in the first half ofthe year (by 6.5 per cent in the first quarter). Favourable economic trendsrecorded for the second consecutive year are the result of strong domesticdemand, particularly in investment (in the first half of the year investmentrose by as much as 24 per cent in real terms; Welfe, 1998). The situation inthe foreign trading sector, on the other hand, is not satisfactory, as a rise inthis year’s imports is expected to exceed exports. Despite the Polish zloty’sappreciation, this year’s foreign trade imbalance is not increasing. The fore-cast deficit on the current account of the balance of payments will probably
23Page
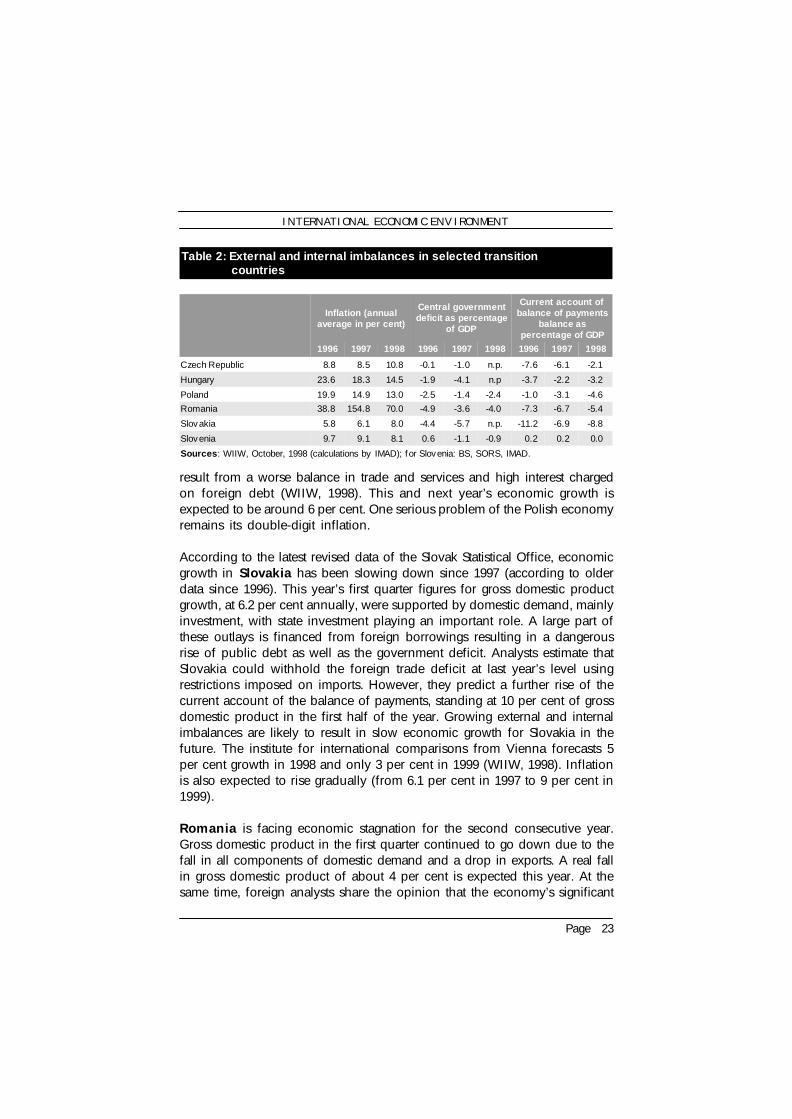
result from a worse balance in trade and services and high interest chargedon foreign debt (WIIW, 1998). This and next year’s economic growth isexpected to be around 6 per cent. One serious problem of the Polish economyremains its double-digit inflation.
According to the latest revised data of the Slovak Statistical Office, economicgrowth in Slovakia has been slowing down since 1997 (according to olderdata since 1996). This year’s first quarter figures for gross domestic productgrowth, at 6.2 per cent annually, were supported by domestic demand, mainlyinvestment, with state investment playing an important role. A large part ofthese outlays is financed from foreign borrowings resulting in a dangerousrise of public debt as well as the government deficit. Analysts estimate thatSlovakia could withhold the foreign trade deficit at last year’s level usingrestrictions imposed on imports. However, they predict a further rise of thecurrent account of the balance of payments, standing at 10 per cent of grossdomestic product in the first half of the year. Growing external and internalimbalances are likely to result in slow economic growth for Slovakia in thefuture. The institute for international comparisons from Vienna forecasts 5per cent growth in 1998 and only 3 per cent in 1999 (WIIW, 1998). Inflationis also expected to rise gradually (from 6.1 per cent in 1997 to 9 per cent in1999).
Romania is facing economic stagnation for the second consecutive year.Gross domestic product in the first quarter continued to go down due to thefall in all components of domestic demand and a drop in exports. A real fallin gross domestic product of about 4 per cent is expected this year. At thesame time, foreign analysts share the opinion that the economy’s significant
INTERNATIONAL ECONOMIC ENVIRONMENT
Table 2: External and internal imbalances in selected transition countries
Inflation (annualaverage in per cent)
Central governmentdeficit as percentage
of GDP
Current account ofbalance of payments
balance aspercentage of GDP
1996 1997 1998 1996 1997 1998 1996 1997 1998
Czech Republic 8.8 8.5 10.8 -0.1 -1.0 n.p. -7.6 -6.1 -2.1
Hungary 23.6 18.3 14.5 -1.9 -4.1 n.p -3.7 -2.2 -3.2
Poland 19.9 14.9 13.0 -2.5 -1.4 -2.4 -1.0 -3.1 -4.6Romania 38.8 154.8 70.0 -4.9 -3.6 -4.0 -7.3 -6.7 -5.4
Slovakia 5.8 6.1 8.0 -4.4 -5.7 n.p. -11.2 -6.9 -8.8
Slovenia 9.7 9.1 8.1 0.6 -1.1 -0.9 0.2 0.2 0.0
Sources: WIIW, October, 1998 (calculations by IMAD); for Slovenia: BS, SORS, IMAD.
IMAD AUTUMN REPORT 1998
24 Page
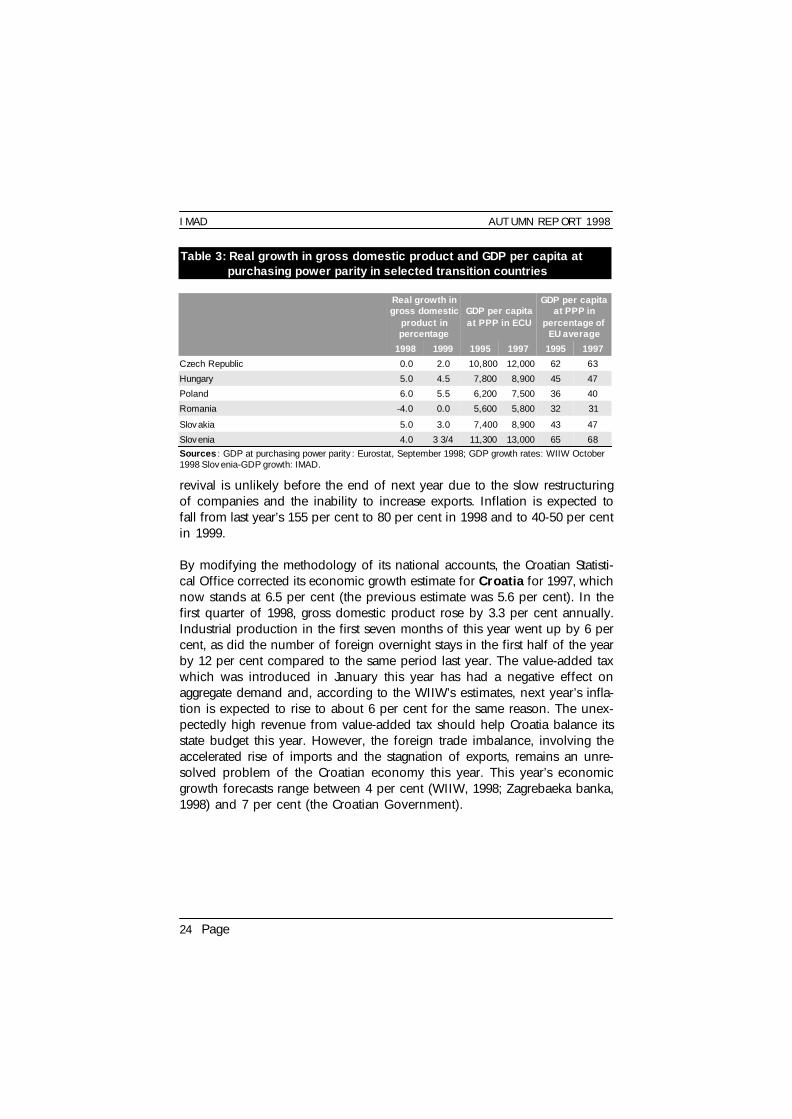
revival is unlikely before the end of next year due to the slow restructuringof companies and the inability to increase exports. Inflation is expected tofall from last year’s 155 per cent to 80 per cent in 1998 and to 40-50 per centin 1999.
By modifying the methodology of its national accounts, the Croatian Statisti-cal Office corrected its economic growth estimate for Croatia for 1997, whichnow stands at 6.5 per cent (the previous estimate was 5.6 per cent). In thefirst quarter of 1998, gross domestic product rose by 3.3 per cent annually.Industrial production in the first seven months of this year went up by 6 percent, as did the number of foreign overnight stays in the first half of the yearby 12 per cent compared to the same period last year. The value-added taxwhich was introduced in January this year has had a negative effect onaggregate demand and, according to the WIIW’s estimates, next year’s infla-tion is expected to rise to about 6 per cent for the same reason. The unex-pectedly high revenue from value-added tax should help Croatia balance itsstate budget this year. However, the foreign trade imbalance, involving theaccelerated rise of imports and the stagnation of exports, remains an unre-solved problem of the Croatian economy this year. This year’s economicgrowth forecasts range between 4 per cent (WIIW, 1998; Zagrebaeka banka,1998) and 7 per cent (the Croatian Government).
Table 3: Real growth in gross domestic product and GDP per capita at purchasing power parity in selected transition countries
Real growth ingross domestic
product inpercentage
GDP per capitaat PPP in ECU
GDP per capitaat PPP in
percentage ofEU average
1998 1999 1995 1997 1995 1997
Czech Republic 0.0 2.0 10,800 12,000 62 63
Hungary 5.0 4.5 7,800 8,900 45 47
Poland 6.0 5.5 6,200 7,500 36 40
Romania -4.0 0.0 5,600 5,800 32 31
Slovakia 5.0 3.0 7,400 8,900 43 47
Slovenia 4.0 3 3/4 11,300 13,000 65 68Sources : GDP at purchasing power parity: Eurostat, September 1998; GDP growth rates: WIIW October1998 Slovenia-GDP growth: IMAD.
25Page
4 GROSS DOMESTIC PRODUCT – 4 per cent economicgrowth in 1998, 1999 forecast: 3.5 to 4 per cent growth
4.1 PRODUCTION STRUCTURE OF GROSS DOMESTIC PRODUCT– 3.7 per cent real-term increase in value added in 1998; 3.3per cent in 1999
In the first quarter of 1998 accelerated economic growth continued. Accord-ing to the estimates of SORS, gross domestic product was 2.2 per cent higherin real terms than in the last quarter of 1997, while compared to the sameperiod of 1997 it was as much as 6.5 per cent above. Rapid economic growthslowed down in the second quarter – gross domestic product was 0.5 percent lower than in the first quarter. In the first half of 1998, gross domesticproduct was in real terms 4.8 per cent higher than in the same period of1997. Above-average real growth in value added in the first half of the yearwas seen in the mining (12.6 per cent), transport (8.8 per cent) and manufac-turing (6.5 per cent). In the second half of the year, continued moderategrowth is expected - growth rates of about 3.2 per cent in the third and lastquarter would enable reaching the 4 per cent -economic growth predicted inspring this year. Since economic growth across the world is levelling off, it isexpected that growth in Slovenia will also slow down and be slightly lowerin 1999 than in 1998. The estimates forecast economic growth of between3.5 per cent and 4 per cent.
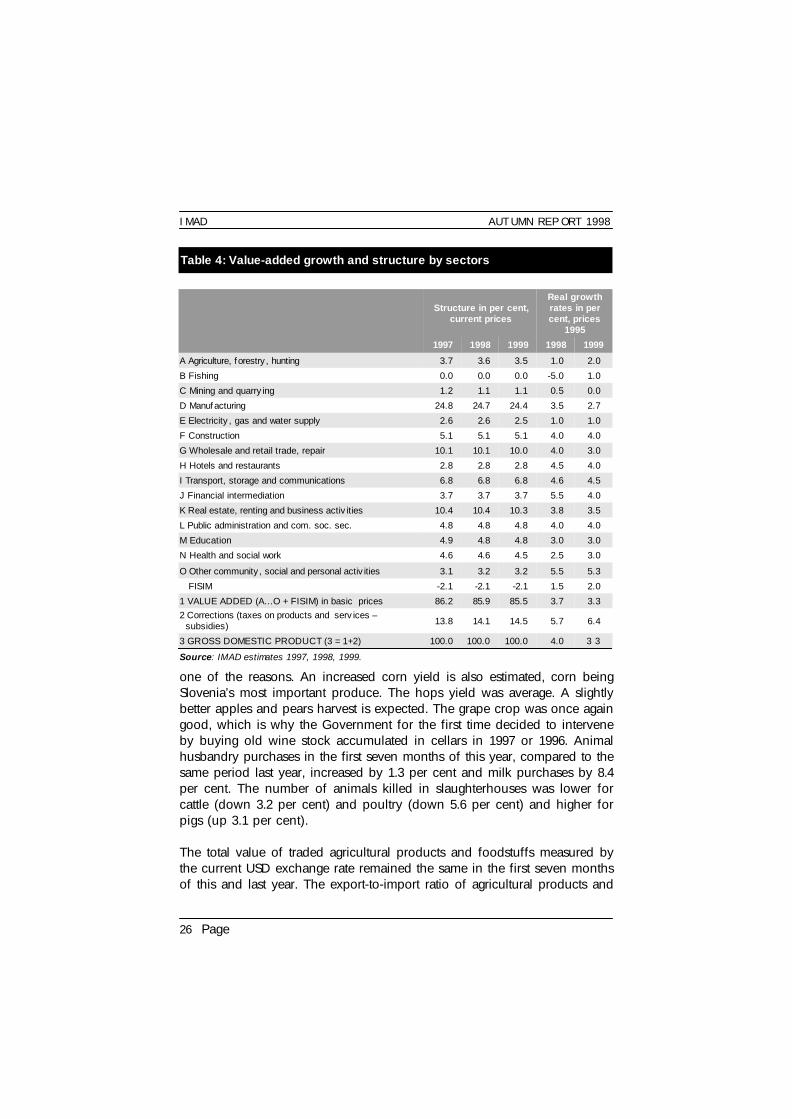
It is projected that real value-added growth will be seen this year in allindustries except fishing. The highest value-added rise is supposed to berecorded in financial intermediation and other community and personal serv-ices. The trend of relatively high growth in services continues this year –service sectors will on average increase value added by 4 per cent in realterms. In 1999, rises in value added are expected in all industries although ata slightly slower pace (see Table 4). It is estimated that the total value addednext year will improve by 3.3 per cent in real terms (this year it went up by3.7 per cent).
After three years of relatively rapid growth, agricultural production declinedlast year, while this year a more favourable crop output is expected. It isanticipated that growth in value added in agriculture will be approximately1 per cent this year and around 2 per cent next year. The wheat yield wasa bit higher than last year and its quality was better. The wheat purchasesincreased by as much as 54 per cent, the favourable purchase price being
INTERNATIONAL ECONOMIC ENVIRONMENT
IMAD AUTUMN REPORT 1998
26 Page
one of the reasons. An increased corn yield is also estimated, corn beingSlovenia’s most important produce. The hops yield was average. A slightlybetter apples and pears harvest is expected. The grape crop was once againgood, which is why the Government for the first time decided to interveneby buying old wine stock accumulated in cellars in 1997 or 1996. Animalhusbandry purchases in the first seven months of this year, compared to thesame period last year, increased by 1.3 per cent and milk purchases by 8.4per cent. The number of animals killed in slaughterhouses was lower forcattle (down 3.2 per cent) and poultry (down 5.6 per cent) and higher forpigs (up 3.1 per cent).
The total value of traded agricultural products and foodstuffs measured bythe current USD exchange rate remained the same in the first seven monthsof this and last year. The export-to-import ratio of agricultural products and
Table 4: Value-added growth and structure by sectors
Structure in per cent,current prices
Real growthrates in percent, prices
1995
1997 1998 1999 1998 1999
A Agriculture, forestry, hunting 3.7 3.6 3.5 1.0 2.0
B Fishing 0.0 0.0 0.0 -5.0 1.0
C Mining and quarrying 1.2 1.1 1.1 0.5 0.0
D Manufacturing 24.8 24.7 24.4 3.5 2.7
E Electricity, gas and water supply 2.6 2.6 2.5 1.0 1.0
F Construction 5.1 5.1 5.1 4.0 4.0
G Wholesale and retail trade, repair 10.1 10.1 10.0 4.0 3.0
H Hotels and restaurants 2.8 2.8 2.8 4.5 4.0
I Transport, storage and communications 6.8 6.8 6.8 4.6 4.5
J Financial intermediation 3.7 3.7 3.7 5.5 4.0
K Real estate, renting and business activities 10.4 10.4 10.3 3.8 3.5
L Public administration and com. soc. sec. 4.8 4.8 4.8 4.0 4.0
M Education 4.9 4.8 4.8 3.0 3.0
N Health and social work 4.6 4.6 4.5 2.5 3.0
O Other community, social and personal activities 3.1 3.2 3.2 5.5 5.3
FISIM -2.1 -2.1 -2.1 1.5 2.0
1 VALUE ADDED (A...O + FISIM) in basic prices 86.2 85.9 85.5 3.7 3.32 Corrections (taxes on products and services – subsidies) 13.8 14.1 14.5 5.7 6.4
3 GROSS DOMESTIC PRODUCT (3 = 1+2) 100.0 100.0 100.0 4.0 3 3
Source: IMAD estimates 1997, 1998, 1999.

27Page
foodstuffs was 45.1 per cent, which is 1.7 percentage point above last year’slevel. Total exports of agricultural products and foodstuffs in this periodincreased by 2.4 per cent, while imports dropped by 1.4 per cent. Goodstrade with EU-countries rose (exports by 19.1 per cent, imports by 3.7 percent) and that with CEFTA- countries, contrary to expectations, declined(exports were 45.1 per cent higher and imports 19.8 per cent lower).
The main activity in the mining industry concerns energy products, i.e. lig-nite and brown coal, accounting for approximately 85 per cent of valueadded in this industry. The energy balance in 1998 forecasts a drop in ligniteextraction by 3.4 per cent and a rise in brown coal extraction by 2.3 per centin comparison with 1997, which means coal mining output falling by ap-proximately 1.5 per cent. Although energy products data in the first ninemonths of the year point to a 0.2 per cent-fall compared to the same periodlast year, it is estimated that the forecast drop will not take in fact place.According to our estimates, coal-mining output will be about 2 per centhigher in 1998 than in 1997. The output of non-energy products in mining inthe first eight months of this year is less than 1/10 below that recorded in thesame period last year. Based on these trends, it is estimated that this year’svalue added in mining will grow by approximately 0.5 per cent in realterms. In 1999, no real increase in value added in this industry is expected.
The upward trend in manufacturing production volume, which started lastyear continues this year and has grown even stronger in recent months. Theproduction volume in the first nine months of this year went up 4.9 per centover the same period last year or 3.2 per cent above last year’s average. Themost substantial increase was seen in the production of vehicles and vessels(up 20.7 per cent), while the most considerable fall was recorded in theproduction of coke, oil derivatives and nuclear fuel (down 52.2 per cent).The slow reduction in the number of employees, which was on average 1.9per cent lower in the first nine months of this year compared to the sameperiod last year, led to the increase of labour productivity by 6.9 per cent.Real growth in the average gross wage per employee in manufacturing (inthe first eight months of 1998 2.9 per cent more than in the same period lastyear) did not reach growth in labour productivity (up 6.9 per cent).
Production figures by end-use product groups in the first nine months showhigh annual growth in the production of capital goods (up 7.5 per cent) andintermediate goods (up 4.8 per cent). Growth in these two groups was espe-cially stimulated by the export of capital goods which improved by 12.6 percent in real terms in the first six months of the year, and the export of
GROSS DOMESTIC PRODUCT
IMAD AUTUMN REPORT 1998
28 Page
intermediate goods which was 14.1 per cent above the same period of 1997.In the first nine months there was a slightly slower rise in the production ofconsumer goods (by 2.7 per cent) and non-durable goods (by 1.0 per cent).The production of durable goods climbed by 9.3 per cent.
The October survey on business trends in manufacturing indicates, in com-parison with September, a worsening of confidence indicator, consisting ofproduction expectations and trends in orders and stock. A drop in the con-fidence indicator in September was mainly due to lower total volumes oforders, while in October this indicator was primarily influenced by a fall inproduction expectations and an increase in final-product stocks. Small-sizedcompanies experienced the most noticeable decline in production expecta-tions which were, on the other hand, most favourable in medium-sizedcompanies which, in the next 3 to 4 months, expect more orders from abroadthan the whole of manufacturing industry.
In the first six months, compared to the same period last year the valueadded in manufacturing increased by 6.9 per cent in real terms (9.1 per centin the first quarter and 4.7 per cent in the second). After relatively highgrowth in value added in the first half of 1998 and production levels in thefirst nine months, this upward trend is expected to slow down by the end ofthe year. It is estimated that in 1998 value added will improve by some 3.5per cent in real terms. In 1999, a slower rise in exports and value added inmanufacturing is expected due to the more critical situation in foreign mar-kets. The anticipated rate is 2.7 per cent.
The share of value added (approximately 80 per cent) in the electricity, gasand water supply sector is created in electricity production. The energybalance in 1998 forecasts a 1.5 per cent fall in total electricity production(measured in produced MWh). In the first three quarters, compared to thesame period last year the total electricity production increased by 1.8 percent, mostly in traditional thermal electrical power plants (up 4.7 per cent).The energy balance forecasts that the production and distribution of thermalenergy in 1998 will rise by 4.5 per cent and gas supply by 1.3 per cent. Onthe basis of available data on electricity production and forecasts of theenergy balance, it is estimated that electricity, gas and water supply will thisyear reach 1 per cent real growth in value added. The same growth (about1 per cent) is anticipated in 1999.
According to SORS’ records, the value of completed construction works inthe first eight months of the year dropped by more than 14 per cent in realterms compared to the same period last year. The value of completed con-
29Page
struction works improved only in housing construction (by 22.6 per cent),while the value of road and building construction fell far behind the resultsachieved in the same period last year. The slowing down in highway con-struction can be seen in the dramatic fall in the share of road and railwayconstruction in the total value of completed construction works, only 12 percent this year compared to last year’s 47 per cent. Unfortunately, monthlystatistical records do not cover the entire construction sector, which is whythey are a poor indicator of construction activities. More than one-third ofconstruction investment is represented by the individual construction ofhouses, which is not included in monthly statistical records. The rapidlygrowing small businesses are also not included in these reports. Quarterlyestimates of value added by individual sectors published by SORS depict amore favourable picture than the above mentioned monthly statistical data.Value added in construction was, according to these estimates, higher by 3.4per cent in the first six months of 1998, compared to the same period lastyear. The data on the number of employees and their wages in the construc-tion industry also reveal a more favourable picture. The number of employ-ees in construction in the first six months of 1998 was 1.7 per cent above thatin the same period last year, whilst gross wage per employee in constructionwas 3 per cent higher in real terms this August than last year’s average.
In foreign markets, Slovene construction companies account for only a bitmore than one-tenth of the value of total completed works - the situation isstill unfavourable. In the first quarter of 1998, the value of completed con-struction works abroad was more than one-third lower than in the sameperiod of 1997. The value of work contracted for this year is slightly higherthan last year. In the structure of contracted work the share of constructionagreements for building in Germany and Russia has dropped greatly.
It is estimated that the actual situation in construction is better than indicatedin the monthly statistical data, which do not include rapidly growing small-businesses. According to the estimates, value added in construction will thisyear go up by 4 per cent and the same growth rate is expected next year.
Previous data on total income in the retail sector and the sale of motorvehicles for the first eight months of 1998 point to a slight fall in total income(down by 0.5 per cent in real terms) compared to the same period last year.The greatest reason for this decrease is the retail sector’s reduced sales aris-ing from the sub-sector of motor fuels accounting for approximately one-tenth of total income which was generated by 30.3 per cent less income inreal terms than in the same period last year (a drop in sales on the Italianborder). Income earned in the maintenance and repair of motor vehicles fell
GROSS DOMESTIC PRODUCT
IMAD AUTUMN REPORT 1998
30 Page
by 14.3 per cent. In the group of motor vehicles and fuel, a 9.3 per cent-increase in income was recorded in motor vehicle sales. In the group ofnon-food products income rose by 8.7 per cent, while the respective in-crease in the sales of food products, beverages and tobacco was 2 per cent.Real-terms income growth was only seen in large companies (up 3.5 percent), while in medium-sized and small companies it fell by 2.5 per cent and9.4 per cent, respectively. The share of large companies in total incomeearned is increasing this year. In the first eight months, it was 69.8 per centor 3.7 percentage points above the level recorded in the same period lastyear. Consequently, the share of medium-sized and small companies is de-creasing, from 17.8 per cent to 16.2 per cent and from 16.2 per cent to 14 percent, respectively. Slovene trading companies are even more inclined to-wards mergers, which reflects gradual preparation for the common Euro-pean market and thus even keener international competition. Large tradingcompanies are investing more and more of their capital in the constructionof large shopping centres. In the first half of the year, the trade sector gener-ated 3.3 per cent more value added in real terms than last year. On the basisof available data and seasonal invigoration in this sector expected in the lastquarter, it is believed that the sectors of trade, repair of motor vehicles andconsumer goods will reach about 4 per cent real growth of value added thisyear, while next year, given a more moderate increase in domestic demand,the respective growth is likely to be somewhat lower (by about 3 per cent).
After last year’s substantial growth in the number of overnight stays andtourists in the first nine months of this year, the former saw a 2.5 per centand the latter a 2.7 per cent fall on the levels recorded in 1997. Overnightstays of foreign tourists decreased by 0.7 per cent and those of domestictourists by 4.1 per cent. The fall in the number of foreign tourists was insig-nificant (0.2 per cent), while there were 5.6 per cent fewer domestic tourists.Overnight stays of foreign tourists represent 49 per cent of total overnightstays (48.1 per cent last year), whereas in the total number of tourists for-eigners accounted for more than a half (54.8 per cent)(53.4 per cent in thesame period of 1997 and 49.5 per cent in 1996). Although the number ofovernight stays is somewhat lower, income is expected to remain stable,according to some hoteliers’ estimates, due to increased prices as a conse-quence of investment made to improve the quality of services. In the firsthalf of the year, value added in the sector of hotels and restaurants went up2.7 per cent in real terms on the same period last year. For the entire 1998, itis estimated that value added growth in real terms in the sector of hotelsand restaurants will be about 4.5 per cent, while next year it is forecast tobe about 4 per cent.
31Page
In the period from January to August, foreign exchange inflows from tourismin the amount of USD 748 m were 6.7 per cent lower, in real terms, (nomi-nally down by 9.2 per cent) than in the same period last year. The biggestfall was recorded in the sales of goods in duty-free shops (down by 22.5 percent in real terms). In real terms, 14 per cent less cash was exchanged inexchange offices. A positive picture can only be seen in payments to compa-nies engaged in tourism which increased by 31.3 per cent in real terms(consequently their share in total foreign exchange inflows rose from 9.9 percent to 14 per cent) and net exchange of cash for chips in casinos which was4.7 per cent higher in real terms. The future of duty-free shops is still un-known (this year, they accounted for 9.1 per cent in the foreign exchangeinflows and 11 per cent last year), since the EU demands Slovenia closedown all such shops at road border crossings by July 1999. Talking about theconnection between foreign exchange inflows from tourism and the sectorof hotels and restaurants, it must be emphasised that only in the item ofpayments to companies engaged in tourism (hotels and other accommoda-tion capacities, except tourist agencies), directly belonging to the sector ofhotels and restaurants, which is a narrower concept than tourism In 1998,this item experienced a boom. The remaining foreign exchange inflows onlyhave an indirect impact on the sector of hotels and restaurants.
On the basis of extremely dynamically growing transport activities at thebeginning of the year, a 5.5 per cent-rise was predicted in spring for thesector of transport, storage and communications (in 1997 it was 4.3 percent). A slower improvement during the summer indicates that transportactivities’ growth in 1998 will be only slightly higher than last year. In thefirst eight months compared to the same period last year, the actual volumeof freight transport operations increased most considerably in harbour trans-port and in the entire loading and unloading activities (+16.7 per cent),railway transport (+8.0 per cent) and road transport (+5.7 per cent). A mod-erate fall was only seen in sea freight transport. Railway passenger transportwent up by 2.0 per cent, while road and urban transport went down by 1.8per cent and 5.2 per cent, respectively. An upsurge was seen in air passengertransport (7.1 per cent) and an even more significant one in airport passen-ger transport (8.6 per cent). The volume of postal services (measured bydelivered packages) fell by 15 per cent. According to our anticipations, thetelecommunications sector will record at least 8 per cent growth. On thebasis of the aforementioned trends, it is estimated that value added thetransport storage and communications sector will this year rise by approxi-mately 4.6 per cent in real terms (last year’s growth was 4.3 per cent) anda similar increase is also expected in 1999 (about 4.5 per cent).
GROSS DOMESTIC PRODUCT
IMAD AUTUMN REPORT 1998
32 Page
4.2 THE EXPENDITURE SIDE OF GROSS DOMESTIC PRODUCT –Exports were the most important growth factor in 1998;in 1999, the contributions of domestic and foreigndemand will be more balanced
Considering the economic growth achieved in the first half of the year (grossdomestic product was 4.8 per cent higher in real terms than in the sameperiod last year) and favourable export developments, it is estimated that the4 per cent-economic growth forecast in spring will be reached this year.Therefore, Slovenia will also this year increase the level of its economicdevelopment, measured by gross domestic product per capita, and reducethe lag behind the EU-countries’ average. The EUROSTAT figures from itsinternational statistical survey published in September show that gross do-mestic product per capita in Slovenia, measured by purchasing power stand-ards, amounted to ECU 13,000 in 1997, arriving at 68 per cent of the EUaverage.
Having a small, open economy Slovenia is very sensitive to external eco-nomic factors. Also in 1999, due to Slovenia’s smallness, openness and ex-port orientation, its economic growth will be primarily determined by inter-national economic trends and the export competitiveness of the Sloveneeconomy. Since Slovene exports are predominantly oriented towards EUmarkets, economic trends in the EU Member States play a key role in Sloveneeconomic trends. According to IMAD’s autumn estimates Slovenia couldachieve 3.5 to 4 per cent economic growth next year, taking into accountcurrent economic trends in the international and domestic environments,and forecasts by European institutes and international organisations that eco-nomic and import growth in Slovenia’s most important trading partners willbe somewhat lower (see IMF, 1998; EC, 1998; LINK, 1998),.
The main lever of economic growth in 1997 was foreign demand, whilstdomestic demand improved only modestly (except investment demand).The particularly fast growth in export demand in 1997 was followed in 1998by the first signs of moderation. It is estimated that the growth in exportdemand in 1998 will be half of that in 1997 (the growth rate will drop from11.3 per cent in 1997 to 5.6 per cent this year). Since the global financialcrisis has not yet reached its peak (Štiblar, 1998), it is expected that next yearSlovenia will also be influenced mainly by indirect negative effects of theglobal financial crisis and economic recession. The lower export growth (ofabout 3.8 per cent) next year will be influenced by direct effects of trading
33Page
with former Soviet Union countries, as well as indirect effects (lower de-mand in Slovenia’s most important trading partners, increased competitionof more competitive exporters from Asia as a result of depreciation). Sloveneindustrial production is strongly linked with EU reproduction cycles, there-fore movements in the EU’s industrial production will largely determine thepace of that in Slovenia. The European Commission adjusted its estimatesregarding economic growth next year: economic growth in the EU-15 shouldbe 2.4 per cent (the spring forecast was 3 per cent). Piling up of stocks ofunsold goods is a warning that the aggregate effects will neither be negligi-ble nor only short-term.
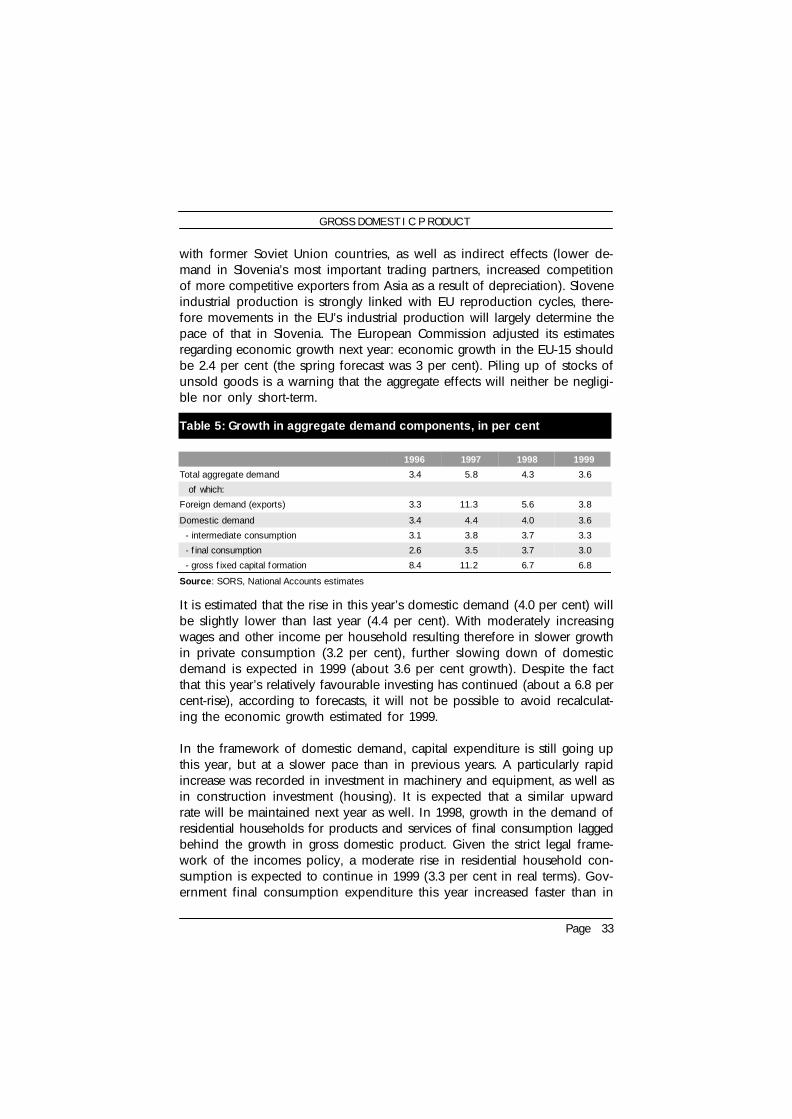
It is estimated that the rise in this year’s domestic demand (4.0 per cent) willbe slightly lower than last year (4.4 per cent). With moderately increasingwages and other income per household resulting therefore in slower growthin private consumption (3.2 per cent), further slowing down of domesticdemand is expected in 1999 (about 3.6 per cent growth). Despite the factthat this year’s relatively favourable investing has continued (about a 6.8 percent-rise), according to forecasts, it will not be possible to avoid recalculat-ing the economic growth estimated for 1999.
In the framework of domestic demand, capital expenditure is still going upthis year, but at a slower pace than in previous years. A particularly rapidincrease was recorded in investment in machinery and equipment, as well asin construction investment (housing). It is expected that a similar upwardrate will be maintained next year as well. In 1998, growth in the demand ofresidential households for products and services of final consumption laggedbehind the growth in gross domestic product. Given the strict legal frame-work of the incomes policy, a moderate rise in residential household con-sumption is expected to continue in 1999 (3.3 per cent in real terms). Gov-ernment final consumption expenditure this year increased faster than in
GROSS DOMESTIC PRODUCT
Table 5: Growth in aggregate demand components, in per cent
1996 1997 1998 1999
Total aggregate demand 3.4 5.8 4.3 3.6
of which:
Foreign demand (exports) 3.3 11.3 5.6 3.8
Domestic demand 3.4 4.4 4.0 3.6
- intermediate consumption 3.1 3.8 3.7 3.3
- final consumption 2.6 3.5 3.7 3.0
- gross fixed capital formation 8.4 11.2 6.7 6.8
Source: SORS, National Accounts estimates
IMAD AUTUMN REPORT 1998
34 Page
previous years (last year 3.2 per cent, this year 4.6 per cent). In view of theproposed national budget of the Republic of Slovenia for 1999, the rise ingovernment consumption next year is expected to be slightly lower (2.3 percent). Therefore, the forecast rise in Slovene government consumption willbe at the level of real annual increases recorded in the EU member-statesover the last few years (2 to 3 per cent).
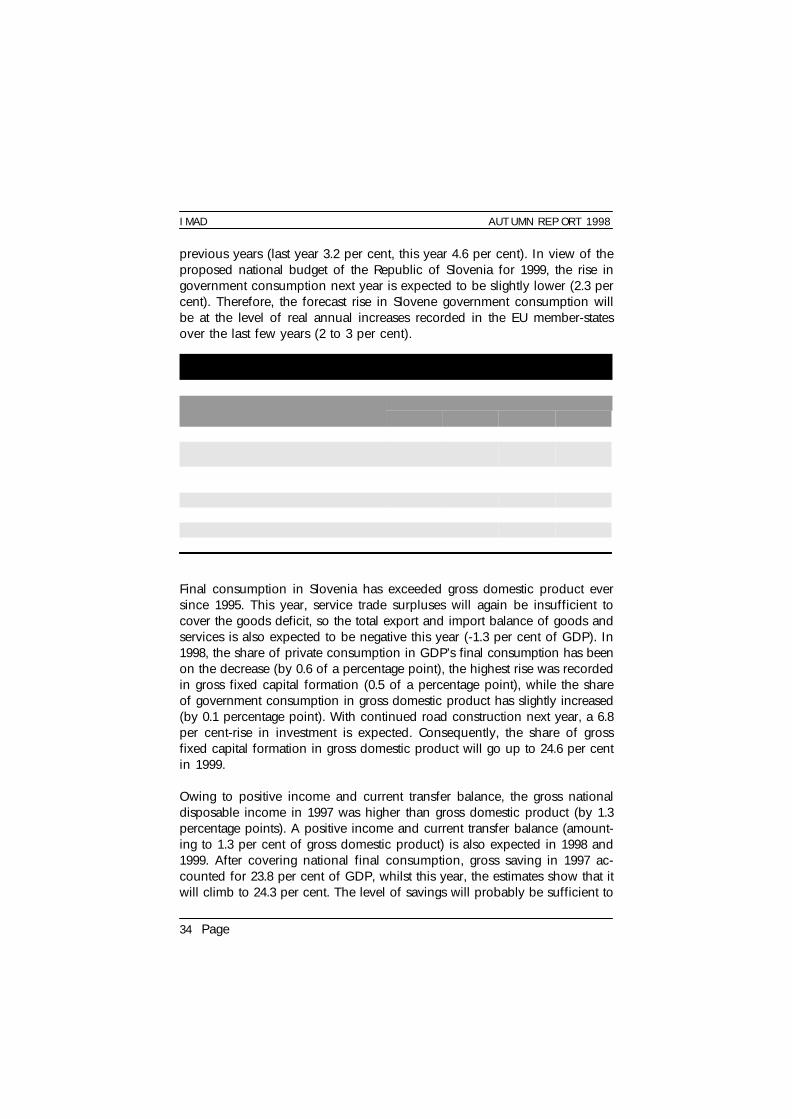
Final consumption in Slovenia has exceeded gross domestic product eversince 1995. This year, service trade surpluses will again be insufficient tocover the goods deficit, so the total export and import balance of goods andservices is also expected to be negative this year (-1.3 per cent of GDP). In1998, the share of private consumption in GDP’s final consumption has beenon the decrease (by 0.6 of a percentage point), the highest rise was recordedin gross fixed capital formation (0.5 of a percentage point), while the shareof government consumption in gross domestic product has slightly increased(by 0.1 percentage point). With continued road construction next year, a 6.8per cent-rise in investment is expected. Consequently, the share of grossfixed capital formation in gross domestic product will go up to 24.6 per centin 1999.
Owing to positive income and current transfer balance, the gross nationaldisposable income in 1997 was higher than gross domestic product (by 1.3percentage points). A positive income and current transfer balance (amount-ing to 1.3 per cent of gross domestic product) is also expected in 1998 and1999. After covering national final consumption, gross saving in 1997 ac-counted for 23.8 per cent of GDP, whilst this year, the estimates show that itwill climb to 24.3 per cent. The level of savings will probably be sufficient to
Table 6: Gross domestic product by expenditure, in per cent
Structure
1996 1997 1998 1999
GROSS DOMESTIC PRODUCT 100.0 100.0 100.0 100.0External balance of goods and services (export-import)
-1.0 -1.2 -1.3 -1.7
Final consumption and gross capitalformation/expenditure 101.0 101.2 101.3 101.7
- Private final consumption 57.3 57.1 56.5 56.5
- Government final consumption expendit. 20.3 20.4 20.5 20.2
- Gross fixed capital formation 22.5 23.5 24.0 24.6
- Changes in inventories 0.9 0.2 0.3 0.4
Source: SORS, National Accounts estimates IMAD.
35Page
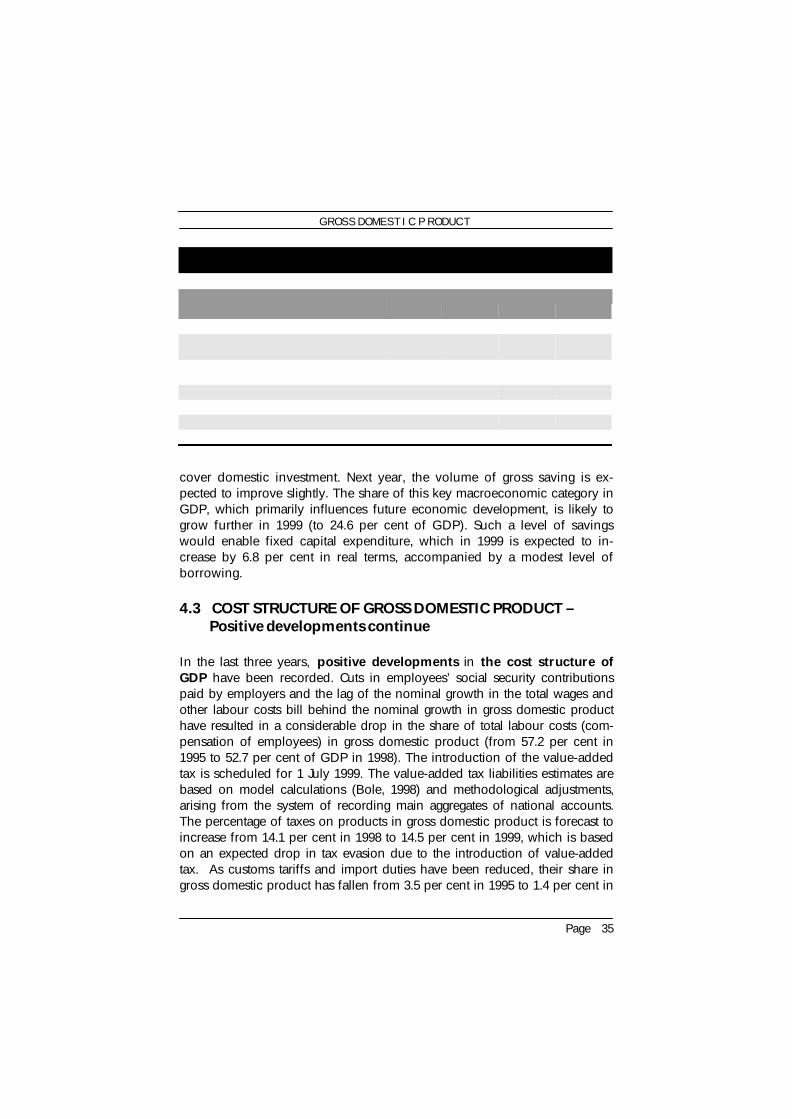
cover domestic investment. Next year, the volume of gross saving is ex-pected to improve slightly. The share of this key macroeconomic category inGDP, which primarily influences future economic development, is likely togrow further in 1999 (to 24.6 per cent of GDP). Such a level of savingswould enable fixed capital expenditure, which in 1999 is expected to in-crease by 6.8 per cent in real terms, accompanied by a modest level ofborrowing.
4.3 COST STRUCTURE OF GROSS DOMESTIC PRODUCT –Positive developments continue
In the last three years, positive developments in the cost structure ofGDP have been recorded. Cuts in employees’ social security contributionspaid by employers and the lag of the nominal growth in the total wages andother labour costs bill behind the nominal growth in gross domestic producthave resulted in a considerable drop in the share of total labour costs (com-pensation of employees) in gross domestic product (from 57.2 per cent in1995 to 52.7 per cent of GDP in 1998). The introduction of the value-addedtax is scheduled for 1 July 1999. The value-added tax liabilities estimates arebased on model calculations (Bole, 1998) and methodological adjustments,arising from the system of recording main aggregates of national accounts.The percentage of taxes on products in gross domestic product is forecast toincrease from 14.1 per cent in 1998 to 14.5 per cent in 1999, which is basedon an expected drop in tax evasion due to the introduction of value-addedtax. As customs tariffs and import duties have been reduced, their share ingross domestic product has fallen from 3.5 per cent in 1995 to 1.4 per cent in
GROSS DOMESTIC PRODUCT
Table 7: Gross domestic product by expenditure, in per cent
Structure
1996 1997 1998 1999
GROSS DOMESTIC PRODUCT 100.0 100.0 100.0 100.0
External balance of goods and services (export-import) -1.0 -1.2 -1.3 -1.7
Final consumption and gross capitalformation/expenditure
101.0 101.2 101.3 101.7
- Private final consumption 57.3 57.1 56.5 56.5
- Government final consumption expendit. 20.3 20.4 20.5 20.2
- Gross fixed capital formation 22.5 23.5 24.0 24.6
- Changes in inventories 0.9 0.2 0.3 0.4
Source: SORS, National Accounts estimates IMAD.
IMAD AUTUMN REPORT 1998
36 Page
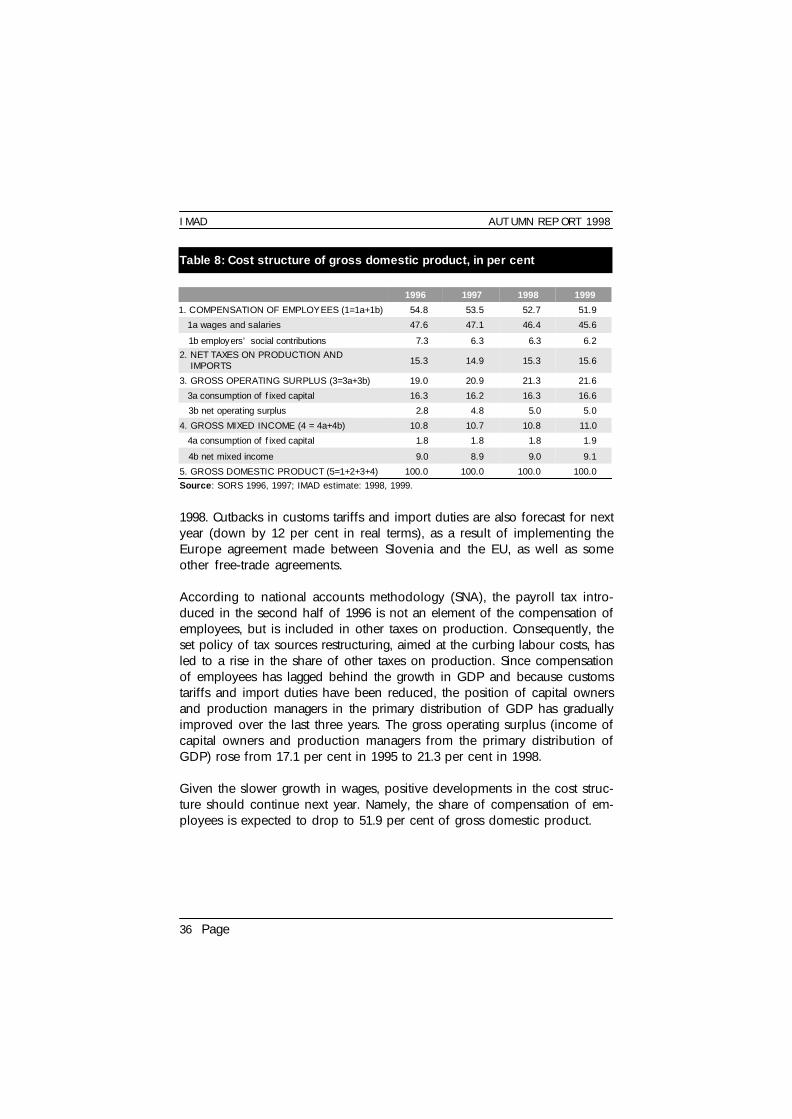
1998. Cutbacks in customs tariffs and import duties are also forecast for nextyear (down by 12 per cent in real terms), as a result of implementing theEurope agreement made between Slovenia and the EU, as well as someother free-trade agreements.
According to national accounts methodology (SNA), the payroll tax intro-duced in the second half of 1996 is not an element of the compensation ofemployees, but is included in other taxes on production. Consequently, theset policy of tax sources restructuring, aimed at the curbing labour costs, hasled to a rise in the share of other taxes on production. Since compensationof employees has lagged behind the growth in GDP and because customstariffs and import duties have been reduced, the position of capital ownersand production managers in the primary distribution of GDP has graduallyimproved over the last three years. The gross operating surplus (income ofcapital owners and production managers from the primary distribution ofGDP) rose from 17.1 per cent in 1995 to 21.3 per cent in 1998.
Given the slower growth in wages, positive developments in the cost struc-ture should continue next year. Namely, the share of compensation of em-ployees is expected to drop to 51.9 per cent of gross domestic product.
Table 8: Cost structure of gross domestic product, in per cent
1996 1997 1998 1999
1. COMPENSATION OF EMPLOYEES (1=1a+1b) 54.8 53.5 52.7 51.9
1a wages and salaries 47.6 47.1 46.4 45.6
1b employers’ social contributions 7.3 6.3 6.3 6.22. NET TAXES ON PRODUCTION AND IMPORTS 15.3 14.9 15.3 15.6
3. GROSS OPERATING SURPLUS (3=3a+3b) 19.0 20.9 21.3 21.6
3a consumption of fixed capital 16.3 16.2 16.3 16.6
3b net operating surplus 2.8 4.8 5.0 5.0
4. GROSS MIXED INCOME (4 = 4a+4b) 10.8 10.7 10.8 11.0
4a consumption of fixed capital 1.8 1.8 1.8 1.9
4b net mixed income 9.0 8.9 9.0 9.1
5. GROSS DOMESTIC PRODUCT (5=1+2+3+4) 100.0 100.0 100.0 100.0Source: SORS 1996, 1997; IMAD estimate: 1998, 1999.
37Page
5 EXPORT COMPETITIVENESS AND INTERNATIONALTRADE
5.1 EXPORT COMPETITIVENESS – Competitiveness ofSlovenian manufacturing will deteriorate
In both this and next year, the price and cost competitiveness of Slovenianmanufacturing will deteriorate in domestic and foreign markets. Afterappreciating steadily from last September until this May in real terms againstthe basket of currencies (measured by relative inflation by as much as 6.9per cent), the tolar depreciated in June and July after the intervention of theBank of Slovenia (by 1.5 per cent), but real appreciation continued again inAugust and September. In September, the tolar was thus 4.6 per cent strongerthan in December last year, and 3.6 pr cent stronger in the first nine monthscompared to the same period last year.
In August, the price competitiveness of Slovenian manufacturing in relationto Croatia was worse than in December last year (the tolar strengthened by3.5 per cent in real terms compared to the Croatian kuna), the eight months’average, however, is similar to last year’s. In the same period, the pricecompetitiveness of Slovenian manufacturing in relation to CEFTA countriesdid not deteriorate, and compared to last December it even improved slightlythis year (0.9 per cent real depreciation of the tolar against the currencies ofCEFTA countries). A relatively high rise (6.7 per cent) in labour productivityin the first eight months over the same period last year was largely due toaccelerated growth recorded in the second half of 1997, this year’s labourproductivity, however, stagnated more or less at February’s level (accordingto seasonally adjusted data, it was 1.9 per cent higher in August than inDecember). Real compensation of employees (deflated by producer priceindex) was only 1.2 per cent higher in August compared to December due toa falling trend recorded since April, whilst the first eight months’ averagewas 3.6 per cent higher than the last year’s eight-month figure due to a risingtrend recorded between September 1997 and March 1998. Hence, unit la-bour costs measured in the basket of currencies were 3.8 per cent higherwhen comparing August with last December, and in the first eight monthson average 1.2 per cent up on the same period in 1997, without taking intoaccount the parallel drop in unit labour costs in important trading partners(the available data show approximately 0.7 per cent).
Trends estimated until the end of the year indicate that the worsening of
EXPORT COMPETITIVENESS AND INTERNATIONAL TRADE
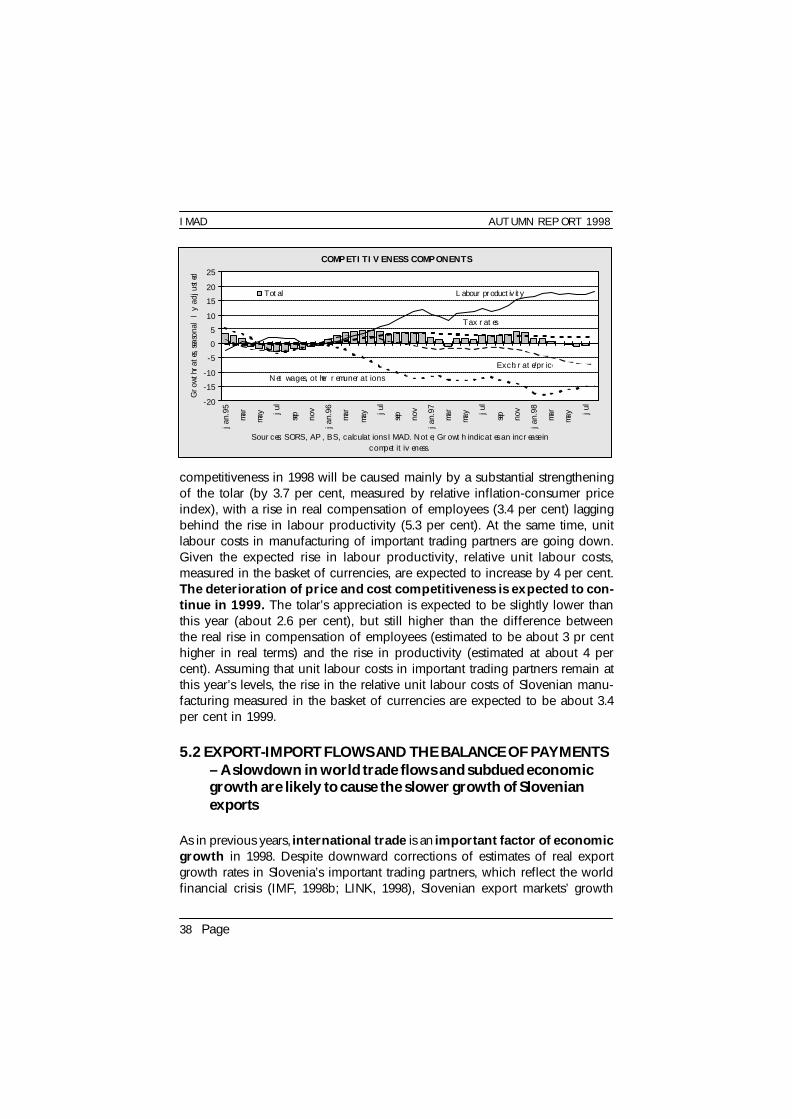
IMAD AUTUMN REPORT 1998
38 Page
competitiveness in 1998 will be caused mainly by a substantial strengtheningof the tolar (by 3.7 per cent, measured by relative inflation-consumer priceindex), with a rise in real compensation of employees (3.4 per cent) laggingbehind the rise in labour productivity (5.3 per cent). At the same time, unitlabour costs in manufacturing of important trading partners are going down.Given the expected rise in labour productivity, relative unit labour costs,measured in the basket of currencies, are expected to increase by 4 per cent.The deterioration of price and cost competitiveness is expected to con-tinue in 1999. The tolar’s appreciation is expected to be slightly lower thanthis year (about 2.6 per cent), but still higher than the difference betweenthe real rise in compensation of employees (estimated to be about 3 pr centhigher in real terms) and the rise in productivity (estimated at about 4 percent). Assuming that unit labour costs in important trading partners remain atthis year’s levels, the rise in the relative unit labour costs of Slovenian manu-facturing measured in the basket of currencies are expected to be about 3.4per cent in 1999.
5.2 EXPORT-IMPORT FLOWS AND THE BALANCE OF PAYMENTS– A slowdown in world trade flows and subdued economicgrowth are likely to cause the slower growth of Slovenianexports
As in previous years, international trade is an important factor of economicgrowth in 1998. Despite downward corrections of estimates of real exportgrowth rates in Slovenia’s important trading partners, which reflect the worldfinancial crisis (IMF, 1998b; LINK, 1998), Slovenian export markets’ growth
COMPETITIVENESS COMPONENTS
-20
-15
-10
-5
0
5
10
15
20
25
jan.
95
mar
may ju
l
sep nov
jan.
96
mar
may ju
l
sep nov
jan.
97
mar
may ju
l
sep nov
jan.
98
mar
may ju
l
Sources: SORS, AP, BS, calculations IMAD. Note; Growth indicates an increase in competitiveness.
Gro
wth r
ates,
seas
onal
ly
adju
sted
Total Labour productivity
Tax rates
Net wages, other remunerationsExch. rate/price
39Page
will not be seriously affected this year. The spring estimates of real growth ofimports in the seven most important trading partners from OECD in 1998standing at 6.3 per cent have been corrected to 5 per cent in the autumnestimates. A further slowdown in world trade flows resulting from the finan-cial crisis and world recession is expected in 1999. According to EuropeanCommission’s estimates (EC, 1998), real growth in imports in the EU-15 willdrop from the 7.9 per cent expected in 1998 to 5.9 per cent forecast in 1999.
In the first eight months of this year, total exports of goods increased by 9.4per cent in real terms compared to the same period last year, and imports ofgoods by 9.1 per cent. End-use structure of trade in goods reveals that theexports and imports of investment goods and intermediate goods are risingthe fastest. Exports of investment goods increased by 10.6 per cent in realterms compared to the same period a year earlier, exports of intermediategoods by 11.3 per cent, and exports of consumer goods by 7.1 per cent .Looking at trade in goods in the context of the standard international tradeclassification shows that exports of machinery and transport equipment re-corded the highest real-term rises (15.5 per cent) together with exports ofchemical products (10.5 per cent). In the first eight months of this year, theexports of industrial products represented 93.2 per cent of the total value ofSlovenian exports. Total exports of goods in current US dollars rose by 6.8per cent compared to the same period in 1997, and total imports of goods by4.2 per cent in nominal terms.
In the first eight months of this year, trade with EU countries rose by 10.4 percent in real terms compared to the same period last year. Exports of goodswent up by 9.3 per cent, and imports of goods by 11.5 per cent. Growingimport flows from the EU were caused by the real appreciation of the tolaras well as the gradual lowering of import duties on industrial products im-ported from EU countries. Customs duties fell to 30 per cent of the basecustoms duty on 1 January 1998, whilst the Europe Agreement establishingan association between Slovenia and the EU regulated the reducing of cus-toms duties to 55 per cent of the base customs duty on 1 January 1997. In thefirst eight months of the year, exports to the EU accounted for 64.5 per centof total exports of goods, the same as in last year’s same eight-month period.The share of goods imported from the EU rose by 1.6 percentage points to68.6 per cent of total imports of goods. The trade deficit with EU countriesincreased by USD 36 million and totalled USD 708.4 million compared to thesame period last year. Trade with Slovenia’s most important trading partner,Germany, which accounts for one-quarter of trade in goods, meant that thetraditional trade surplus fell by USD 20 million to USD 316 million. Of all EU
EXPORT COMPETITIVENESS AND INTERNATIONAL TRADE
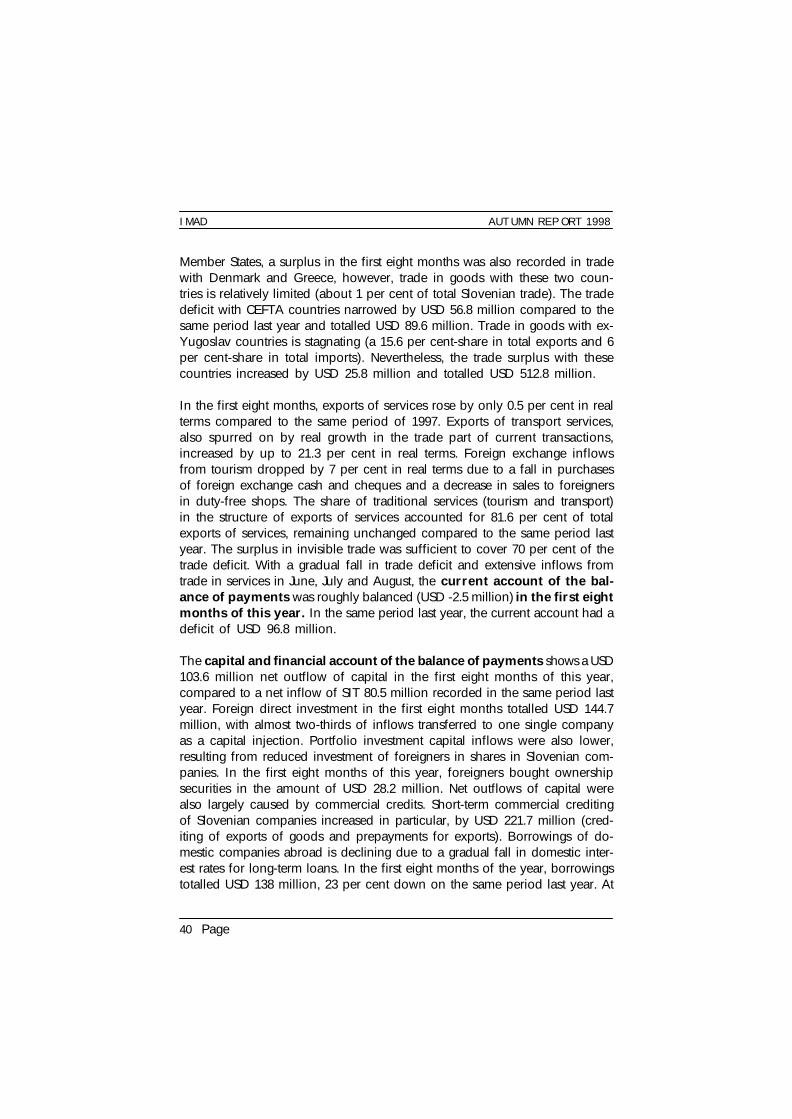
IMAD AUTUMN REPORT 1998
40 Page
Member States, a surplus in the first eight months was also recorded in tradewith Denmark and Greece, however, trade in goods with these two coun-tries is relatively limited (about 1 per cent of total Slovenian trade). The tradedeficit with CEFTA countries narrowed by USD 56.8 million compared to thesame period last year and totalled USD 89.6 million. Trade in goods with ex-Yugoslav countries is stagnating (a 15.6 per cent-share in total exports and 6per cent-share in total imports). Nevertheless, the trade surplus with thesecountries increased by USD 25.8 million and totalled USD 512.8 million.
In the first eight months, exports of services rose by only 0.5 per cent in realterms compared to the same period of 1997. Exports of transport services,also spurred on by real growth in the trade part of current transactions,increased by up to 21.3 per cent in real terms. Foreign exchange inflowsfrom tourism dropped by 7 per cent in real terms due to a fall in purchasesof foreign exchange cash and cheques and a decrease in sales to foreignersin duty-free shops. The share of traditional services (tourism and transport)in the structure of exports of services accounted for 81.6 per cent of totalexports of services, remaining unchanged compared to the same period lastyear. The surplus in invisible trade was sufficient to cover 70 per cent of thetrade deficit. With a gradual fall in trade deficit and extensive inflows fromtrade in services in June, July and August, the current account of the bal-ance of payments was roughly balanced (USD -2.5 million) in the first eightmonths of this year. In the same period last year, the current account had adeficit of USD 96.8 million.
The capital and financial account of the balance of payments shows a USD103.6 million net outflow of capital in the first eight months of this year,compared to a net inflow of SIT 80.5 million recorded in the same period lastyear. Foreign direct investment in the first eight months totalled USD 144.7million, with almost two-thirds of inflows transferred to one single companyas a capital injection. Portfolio investment capital inflows were also lower,resulting from reduced investment of foreigners in shares in Slovenian com-panies. In the first eight months of this year, foreigners bought ownershipsecurities in the amount of USD 28.2 million. Net outflows of capital werealso largely caused by commercial credits. Short-term commercial creditingof Slovenian companies increased in particular, by USD 221.7 million (cred-iting of exports of goods and prepayments for exports). Borrowings of do-mestic companies abroad is declining due to a gradual fall in domestic inter-est rates for long-term loans. In the first eight months of the year, borrowingstotalled USD 138 million, 23 per cent down on the same period last year. At
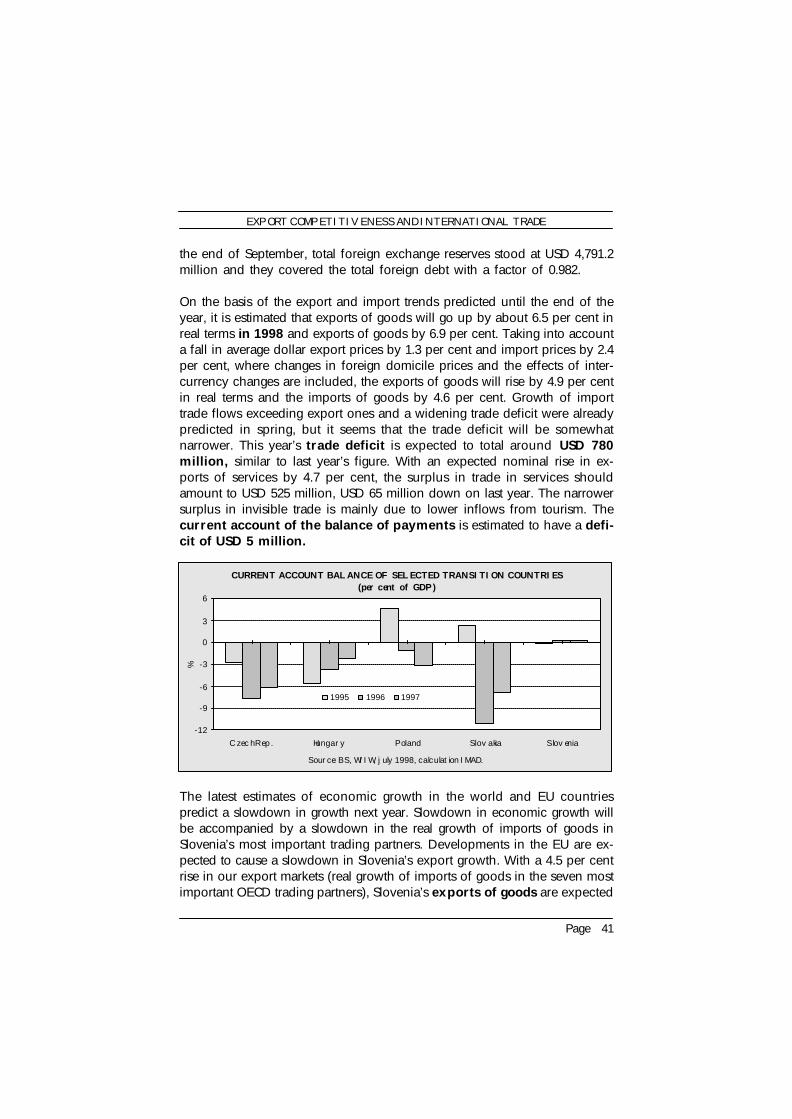
41Page
the end of September, total foreign exchange reserves stood at USD 4,791.2million and they covered the total foreign debt with a factor of 0.982.
On the basis of the export and import trends predicted until the end of theyear, it is estimated that exports of goods will go up by about 6.5 per cent inreal terms in 1998 and exports of goods by 6.9 per cent. Taking into accounta fall in average dollar export prices by 1.3 per cent and import prices by 2.4per cent, where changes in foreign domicile prices and the effects of inter-currency changes are included, the exports of goods will rise by 4.9 per centin real terms and the imports of goods by 4.6 per cent. Growth of importtrade flows exceeding export ones and a widening trade deficit were alreadypredicted in spring, but it seems that the trade deficit will be somewhatnarrower. This year’s trade deficit is expected to total around USD 780million, similar to last year’s figure. With an expected nominal rise in ex-ports of services by 4.7 per cent, the surplus in trade in services shouldamount to USD 525 million, USD 65 million down on last year. The narrowersurplus in invisible trade is mainly due to lower inflows from tourism. Thecurrent account of the balance of payments is estimated to have a defi-cit of USD 5 million.
The latest estimates of economic growth in the world and EU countriespredict a slowdown in growth next year. Slowdown in economic growth willbe accompanied by a slowdown in the real growth of imports of goods inSlovenia’s most important trading partners. Developments in the EU are ex-pected to cause a slowdown in Slovenia’s export growth. With a 4.5 per centrise in our export markets (real growth of imports of goods in the seven mostimportant OECD trading partners), Slovenia’s exports of goods are expected
EXPORT COMPETITIVENESS AND INTERNATIONAL TRADE
CURRENT ACCOUNT BALANCE OF SELECTED TRANSITION COUNTRIES (per cent of GDP)
-12
-9
-6
-3
0
3
6
C z e c h R e p . Hungary Poland Slovakia Slovenia
Source: BS, WIIW, july 1998, calculation IMAD.
%
1995 1996 1997
IMAD AUTUMN REPORT 1998
42 Page
to rise by about 4 per cent in real terms. Given the fact that the imports ofgoods are expected to rise slightly (4.3 per cent), the trade deficit in 1999will increase by USD 120 million to reach about USD 900 million comparedto 1998. The surplus in traditional services is expected to contribute to aslight increase in the overall surplus in invisible trade. With 2.6 per cent realgrowth of exports of services and 3.5 per cent real growth of imports ofservices, the surplus should total USD 540 million. The deficit on the cur-rent account of the balance of payments is expected to amount to USD80 million (0.4 per cent of gross domestic product).
5.3 FOREIGN DIRECT INVESTMENT – After accelerated growthin foreign direct investment inflows into Slovenia in1997, modest developments are expected in 1998
Globally we are witnessing the continuous and rapid growth in inflows offoreign direct investment (FDI). In the 1992-1997 period, FDI flows doubledto reach USD 400 million. The share of FDI flows in gross domestic productincreased from 1.0 per cent in 1980 to 2.3 per cent in 1996; the share of FDIstock in gross domestic product increased from 10 per cent to 21 per cent inthe same period. This gives evidence of growing internationalisation(globalisation) and importance attributed to FDI in the process of integrationwith the world economy. 1997 again saw record levels of FDI flows, whenthey for the first time exceeded USD 400 billion, according to UNCTAD data,with the prospect of further growth in 1998. Last year’s FDI outflows totalledUSD 424 billion and FDI inflows USD 400 billion, compared to USD 333billion and USD 338 billion, respectively, recorded in 1996.
Despite differences in the economic situations of individual countries, FDIflows reached record levels in all groups of countries in 1997. Developedcountries directly invested abroad USD 359 billion dollars (27 per cent up on1997) and attracted USD 233 billion of FDI (up by 19 per cent). Inflows intodeveloping countries increased by 15 per cent to reach USD 149 billion,outflows rose by 24 per cent to USD 61 billion. The most marked increases,44 per cent, in FDI flows were recorded in Central and Eastern Europeancountries and they totalled USD 19 billion, outflows, on the other hand,more than tripled and reached USD 3 billion. Positive trends are also con-tinuing in 1998.
Countries in transition as a whole are ever more successful in taking part ininternational flows of FDI. What about Slovenia? The FDI stock in Slovenia
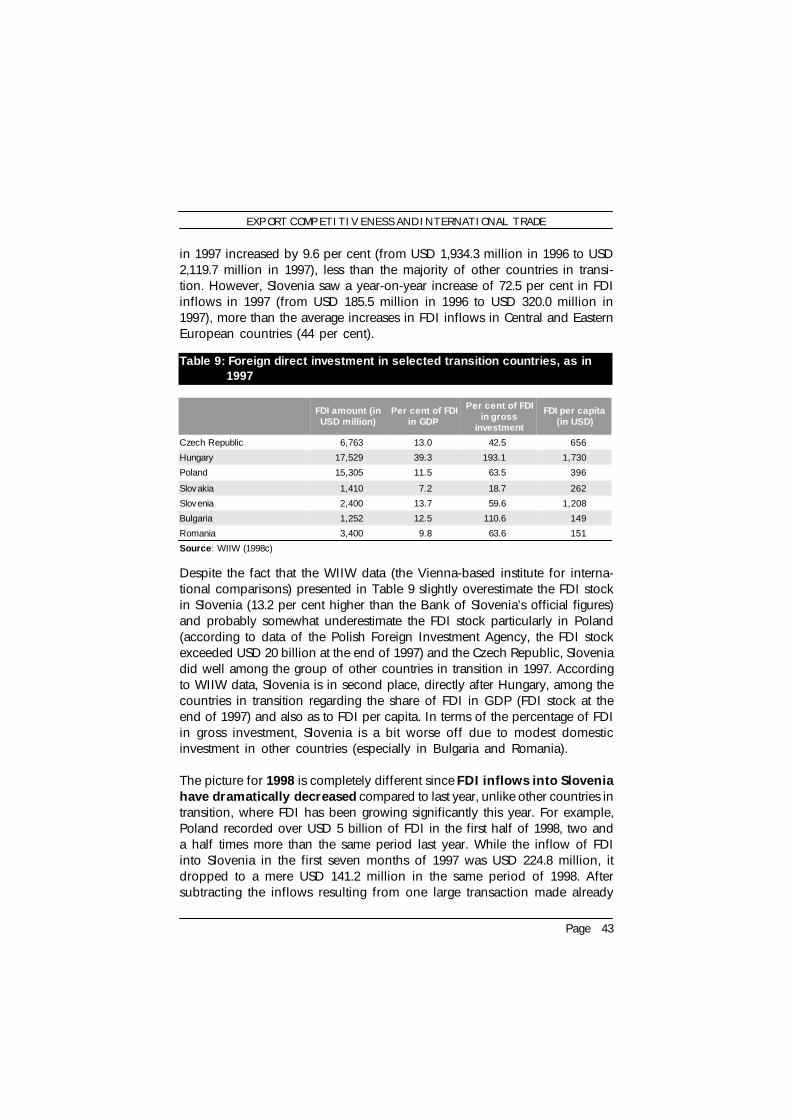
43Page
in 1997 increased by 9.6 per cent (from USD 1,934.3 million in 1996 to USD2,119.7 million in 1997), less than the majority of other countries in transi-tion. However, Slovenia saw a year-on-year increase of 72.5 per cent in FDIinflows in 1997 (from USD 185.5 million in 1996 to USD 320.0 million in1997), more than the average increases in FDI inflows in Central and EasternEuropean countries (44 per cent).
Despite the fact that the WIIW data (the Vienna-based institute for interna-tional comparisons) presented in Table 9 slightly overestimate the FDI stockin Slovenia (13.2 per cent higher than the Bank of Slovenia’s official figures)and probably somewhat underestimate the FDI stock particularly in Poland(according to data of the Polish Foreign Investment Agency, the FDI stockexceeded USD 20 billion at the end of 1997) and the Czech Republic, Sloveniadid well among the group of other countries in transition in 1997. Accordingto WIIW data, Slovenia is in second place, directly after Hungary, among thecountries in transition regarding the share of FDI in GDP (FDI stock at theend of 1997) and also as to FDI per capita. In terms of the percentage of FDIin gross investment, Slovenia is a bit worse off due to modest domesticinvestment in other countries (especially in Bulgaria and Romania).
The picture for 1998 is completely different since FDI inflows into Sloveniahave dramatically decreased compared to last year, unlike other countries intransition, where FDI has been growing significantly this year. For example,Poland recorded over USD 5 billion of FDI in the first half of 1998, two anda half times more than the same period last year. While the inflow of FDIinto Slovenia in the first seven months of 1997 was USD 224.8 million, itdropped to a mere USD 141.2 million in the same period of 1998. Aftersubtracting the inflows resulting from one large transaction made already
EXPORT COMPETITIVENESS AND INTERNATIONAL TRADE
Table 9: Foreign direct investment in selected transition countries, as in 1997
FDI amount (inUSD million)
Per cent of FDIin GDP
Per cent of FDIin gross
investment
FDI per capita(in USD)
Czech Republic 6,763 13.0 42.5 656
Hungary 17,529 39.3 193.1 1,730
Poland 15,305 11.5 63.5 396
Slovakia 1,410 7.2 18.7 262
Slovenia 2,400 13.7 59.6 1,208
Bulgaria 1,252 12.5 110.6 149
Romania 3,400 9.8 63.6 151
Source: WIIW (1998c)
IMAD AUTUMN REPORT 1998
44 Page
last year, FDI inflows into Slovenia were less than a negligible amount ofUSD 50 million.
By the end of 1997, indicators of FDI in Slovenia were not unfavourable,however, the actual situation of relatively modest FDI in Slovenia has untilnow been concealed by occasional, for Slovenia relatively large, foreignacquisitions. The moment no similar projects are concluded in a given year,annual FDI inflows fall dramatically. This year, this was accompanied by ageneral fall in foreign investors’ interest in Slovenia, since FDI inflows havebeen drastically lower in each individual month (apart from July, when thelarge inflow mentioned above was recorded) compared to the same periodlast year. Putting aside the small size of Slovenia’s market, which will alwaysbe an important obstacle to (‘greenfield’) FDI – although less pronouncedwith full membership in the EU – there are four main factors that reduce FDIin Slovenia: (i) incomplete transition in terms of incomplete legal frameworkregulating corporate activities, and discrimination to the benefit of certaincategories of companies, which increases the costs of establishing and oper-ating a company; (ii) problems in providing business premises and land tobusiness, especially for production; (iii) privatised companies, especially thosewith predominant internal ownership, have obviously not started a compre-hensive restructuring of their business, which would encourage them tosearch for strategic foreign partners (this is true especially of industries char-acterised by increasing returns to scale, i.e. economies of scale); and (iv)ambiguous signals about Slovenia’s attitude towards FDI, since in individualcases a negative attitude often prevails over declarations of support for FDI.
45Page
6 INVESTMENT – Gradual growth continues
After the real-term drop recorded in the 1988-1992 period, investment rosesubstantially in the 1993-1995 period (13.4 per cent average real growth)owing to the necessary restructuring of the economy and the beginning ofbuilding economic infrastructure. Over the last three years, the growth ininvestment has slowed down, but it is still steady and stable (over 7 per centper cent average real growth). This year’s investment is estimated to rise inreal terms by about 6.7 per cent, thus increasing its share in gross domesticproduct to 24 per cent. With a similar growth rate (6.8 per cent) expectednext year, the share of capital formation in gross domestic product shouldreach 24.6 per cent.
Over the last three years, accelerated growth in investment has also beenrecorded by other successful countries in transition: 20.5 per cent in Poland,4 per cent in Hungary. However, the Czech Republic, recorded a real de-cline of 5 per cent in 1997 after the 15 per cent average real growth recordedfrom 1994 to 1996 (EBRD, 1998). Gross fixed capital formation in the CzechRepublic represents over 30 per cent of gross domestic product.
The only monthly indicator available to assess investment, and that is noteven entirely reliable, indicates growth in investment outlays. In the firstnine months of this year, investment outlays were up 7 per cent in real termsover the same period last year. The highest rises were recorded in agricul-ture, transport and construction, the lowest, on the other hand, in electricity,gas and water supply. Manufacturing, which accounted for 14 per cent of allinvestment outlays in the first nine months, recorded 4 per cent real growth.The amounts of individual investment outlays suggest that companies (ex-cept for certain large profitable enterprises) allocate investment funds mainlyto renovations, repairs, whilst constructing new buildings is rare. The overone-third increase in investment outlays in transport, storage and communi-cations reflect investment in rail and telecommunications infrastructure. Thepace of growth in outlays for motorway construction has slowed down thisyear, similarly in postal services, where investment has decreased substan-tially. This year’s investment in economic infrastructure is estimated not torecord exceptional growth rates. Rates above the average are expected onlyin investment in transport infrastructure, mainly the railways.
Data on the imports of investment goods – going up by 17 per cent in realterms in the first eight months of this year compared to the same period last
INVESTMENT
IMAD AUTUMN REPORT 1998
46 Page
year also point to relatively dynamic investment activities. The production ofinvestment goods is also buoyant. Indirect indicators (the value of construc-tion works already completed) indicate that housing construction has begunto strengthen, driven by lower interest rates. The average commercial banks’real interest rates for long-term loans for housing construction have fallen byone-third this year (6.4 per cent in September) compared to last year (9.4 percent in September). The fact that interest rates for long-term loans to thecorporate sector have also fallen should trigger increased investment activi-ties.
Investment analysis of companies by ownership structure reveals that com-panies with predominantly internal ownership invest less than companieswhere foreigners hold a majority stake. A relatively high rate of investmenthas also been recorded in newly established private domestic companies(Simoneti, Rojec, Rems, 1998). Weak investment is a serious problem whichis, to some extent, an indicator of slow restructuring and a deterioration incompetitiveness. Reasons for modest investment are (i) absence of coreownership with long-term perspective in most companies; (ii) the lack ofinvestment opportunities as many companies have not yet formed any stra-tegic alliances with foreign strategic partners; and (iii) high costs and limitedavailability of investment financing from abroad and structural characteristicsof the domestic financial sector (Ibid, p. 18).
47Page
7 EMPLOYMENT AND UNEMPLOYMENT – Thedownward trend in employment has been halted
In 1998, the employment trend continues to fluctuate with the number ofemployed going up slightly in the spring and autumn months and goingdown in summer and winter. This spring’s increase in employment, takingplace from February to July, was stronger compared to last year’s. Septem-ber’s increase in the number of unemployed resulting from job losses couldbe an indicator of stagnation in employment in autumn months. Neverthe-less, the number of people in employment in Slovenia is estimated to haverisen by about 0.5 per cent this year compared to last year. With 4 per cent-growth in gross domestic product, this should result in about a 3.5 per cent-rise in global labour productivity, slightly down on last year.
Unlike in previous years, when the number of employed in enterprises andorganisations was falling on average and the number of self-employed andemployed in small-scale private sector rose substantially, this year’s employ-ment picture is somewhat different. Employment in enterprises and organi-sations is going up slightly, the number of individual private entrepreneursand own-account workers has been falling for nearly one year, and thisyear’s rise in the number of employed in these types of companies has beenmoderate compared previous years. Despite the fact that the number ofemployed in this sector has almost doubled in the period of transition (inJuly 1998 the figure was 61,377), the share of employment in this sector isstill lower than in developed European countries.
This year’s falling trend in the total number of employed in manufacturinghas been halted, but it is still pronounced in the sectors of oil products (fromDecember 1997 to August 1988 it dropped by 6.3 per cent), furniture andother manufacturing (-5.3 per cent), wood and wood products (-5.2 percent), paper, pulp and publishing (-2.7 per cent). The number of employed,on the other hand, has risen in the sectors of chemicals and chemical prod-ucts (+1.9 per cent), machines and equipment (+2.6 per cent), electrical andoptical equipment (+2.4 per cent), transport equipment (+4.0 per cent) andparticularly in rubber and plastic products manufacture (+11 per cent). It isalso going up in agriculture, construction, stone and sand production com-pared to electricity, gas and water supply, where the number is falling. In theservices sector, a drop in the number of employed has again been recordedin trade, hotels and restaurant, however, in other services, the figures aregoing up, particularly in financial intermediation. For the first time since
EMPLOYMENT AND UNEMPLOYMENT
IMAD AUTUMN REPORT 1998
48 Page
1992, the average number of employed in state administration will not behigher than in the previous year, as currently there is a downward trend.
This year’s weaker drop in employment in manufacturing will be reflected insmaller labour productivity rises. Labour productivity in manufacturing isestimated to increase by 5.4 per cent (1997 saw a 6.9 per cent increase).This year’s growth in global labour productivity has been somewhat modestcompared to last year’s. Assuming that productivity will increase by about 31 per cent next year, a rise in employment similar to this year’s can also beexpected next year (about 0.5 per cent).
This year’s average number of registered unemployed will remain at lastyear’s level, a little over 125,000 people representing 14.4 per cent of theactive population. Prospects of employing the jobless have improved slightlycompared to last year (in the first nine months of this year, 43,000 unem-ployed found jobs, 2.8 per cent up on the same period last year), and theinflow of unemployed due to job losses was roughly equal. Analysis of theactive population’s formation flows reveals that this year, as in 1997, a largenumber of people have found jobs without going to employment offices.This year’s inflow of young unemployed from schools is slightly higher com-pared to 1997. The amendments to the Law on Employment and Unemploy-ment Insurance passed in September this year will probably bring about afall in the number of people listed as being registered unemployed. Conse-quently, the usual seasonal rise in the number of unemployed will be fol-lowed by a drop to below 125,000 or 14.3 per cent of active populationbefore the end of the year. Next year’s unemployment rate is expected to beslightly lower (accompanied by usual seasonal fluctuations) compared to1998 (about 14 per cent), whereas the rate of labour force participation bythe economically active is expected to remain unchanged (63.1 per cent).
Despite the seasonal inflow of young job-seekers, the share of people facingdifficulties in finding a job in total unemployed has risen. The share of job-seekers above 40 has reached 47 per cent and the share of long-term unem-ployed 62 per cent. The proportion of unskilled unemployed remains atabout 47 per cent, 70 per cent of whom have been unemployed for morethan one year. A comparative study of the educational background of theunemployed and the educational levels required for vacancies reveals asituation similar to last year’s: there are on average 4 registered unemployedper vacancy requiring a university degree, about 10 unemployed per va-cancy requiring vocational or secondary education and about 15 to 20 un-employed per vacancy for unskilled or semi-skilled workers. Even though
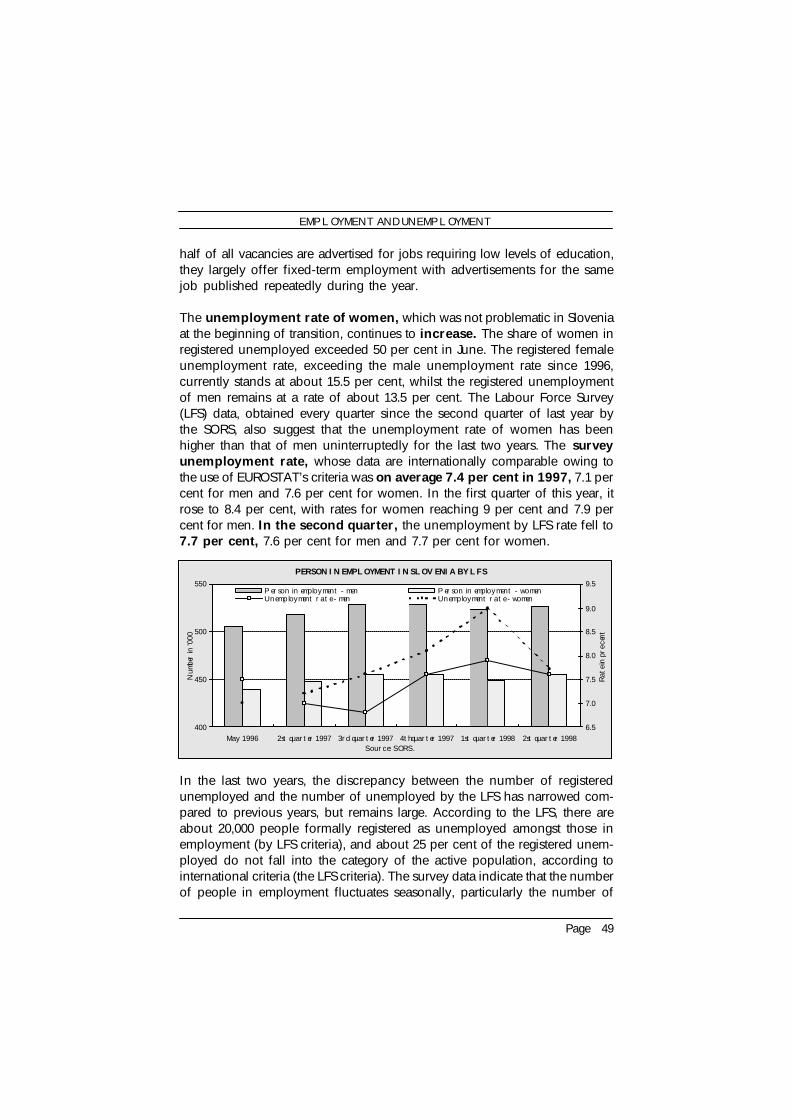
49Page
half of all vacancies are advertised for jobs requiring low levels of education,they largely offer fixed-term employment with advertisements for the samejob published repeatedly during the year.
The unemployment rate of women, which was not problematic in Sloveniaat the beginning of transition, continues to increase. The share of women inregistered unemployed exceeded 50 per cent in June. The registered femaleunemployment rate, exceeding the male unemployment rate since 1996,currently stands at about 15.5 per cent, whilst the registered unemploymentof men remains at a rate of about 13.5 per cent. The Labour Force Survey(LFS) data, obtained every quarter since the second quarter of last year bythe SORS, also suggest that the unemployment rate of women has beenhigher than that of men uninterruptedly for the last two years. The surveyunemployment rate, whose data are internationally comparable owing tothe use of EUROSTAT’s criteria was on average 7.4 per cent in 1997, 7.1 percent for men and 7.6 per cent for women. In the first quarter of this year, itrose to 8.4 per cent, with rates for women reaching 9 per cent and 7.9 percent for men. In the second quarter, the unemployment by LFS rate fell to7.7 per cent, 7.6 per cent for men and 7.7 per cent for women.
In the last two years, the discrepancy between the number of registeredunemployed and the number of unemployed by the LFS has narrowed com-pared to previous years, but remains large. According to the LFS, there areabout 20,000 people formally registered as unemployed amongst those inemployment (by LFS criteria), and about 25 per cent of the registered unem-ployed do not fall into the category of the active population, according tointernational criteria (the LFS criteria). The survey data indicate that the numberof people in employment fluctuates seasonally, particularly the number of
EMPLOYMENT AND UNEMPLOYMENT
PERSON IN EMPLOYMENT IN SLOVENIA BY LFS
400
450
500
550
May 1996 2st quarter 1997 3rd quarter 1997 4th quarter 1997 1st quarter 1998 2st quarter 1998Source: SORS.
Num
ber
in '0
00
6.5
7.0
7.5
8.0
8.5
9.0
9.5
Rate
in p
re c
ent
Person in employment - men Person in employment - womenUnemployment rate - men Unemployment rate - women
IMAD AUTUMN REPORT 1998
50 Page
family members working as additional help and occasionally employed peo-ple. What is worrying is the fact that a high unemployment rate has beenregistered among young people (about 18 per cent), particularly women(about 19 per cent).
In 1998, a number of new measures of active labour market policy havebeen introduced. The changes are in line with the guidelines for EU MemberStates’ labour market policies. The active labour market policy measures willtarget the following groups: young unemployed without basic or with un-suitable vocational training, the unemployed aged over 40, the disabled,recipients of unemployment benefits and unemployment assistance, unem-ployed recipients of means-tested welfare allowance, those employed inindustries undergoing the restructuring process, and permanently redundantworkers. The system of job exchange and co-operation between employ-ment agencies and employers is improving, public works programmes areincreasing. Changes and amendments to the Law on Employment and Un-employment Insurance tighten eligibility criteria for unemployment benefitsand unemployment assistance.
Year-on-year comparisons of unemployment between regions show nomarked changes, as the rates largely depend on the regional economic struc-tures. Regions where high unemployment has been recorded over the lastfew years (Podravje, Pomurje and Posavje) have seen no marked changes inunemployment rates. Hence, in the first half of the year, the share of unem-ployed in the working age population was the highest in the Podravje re-gion, whose 14.2 per cent exceeds the Slovenian average almost by one-third. Rates above the average have also been recorded in the Pomurje,Zasavje, and Savinja regions. Unemployment increased the most in the Zasavje,Pomurje, Koroška, Savinja and Notranjska-Kras regions. The lowest share ofunemployed in working-age population (5.9 per cent) was recorded in theGorica region.
The problems of unemployment of women, young, low-skilled and thoseaged over 40 are also evident at the regional level. The female unemploy-ment rate is rising gradually in all regions and exceeds the rates of men inthe majority of them. This year’s unemployment rate of women increasedthe most in the Posavje, Koroška and Savinja regions, with the highest per-centage of women in total unemployed recorded in the Coast-Karst region(56 per cent). The young below 26 hold the highest share among job-seek-ers in the Pomurje region (35 per cent of all unemployed), nearly 30 per centhave also been recorded in the Zasavje, Posavje, Gorica and Savinja regions.
51Page
The lowest qualification structure of the unemployed has been registered inDolenjska with almost 60 per cent of job-seekers having attained only first orsecond levels of education, and Pomurje with 57 per cent of job-seekersholding such education. The number of unemployed aged over 40 has in-creased substantially since 1995. Over one-half of the unemployed beingaged over 40 has been recorded in the Central Slovenian and Gorenjskaregions.
EMPLOYMENT AND UNEMPLOYMENT

IMAD AUTUMN REPORT 1998
52 Page
8 WAGES - Moderate growth
Incomes policy is one of the important issues negotiated on by the socialpartners. Even though a new social agreement was not achieved last year, anagreement on incomes policy parameters was reached and incorporated inthe Minimum Wage and Wage Adjustment Mechanism Act. The agreement,i.e. the Act, has contributed to incomes policy’s success in 1997 and 1998,and that is an important contribution of social partnership to the macroeco-nomic stability of the country. In the coming new social agreement the socialpartners will have to unanimously approve not only the incomes policy, butalso tax, pension and social systems reforms.
The Minimum Wage and Wage Adjustment Mechanism Act passed in July,1997 will remain valid throughout 1998. Movements in wages in the first halfof 1998 were very moderate. In the first eight months of the year, real grosswages per employee grew by a mere 0.5 per cent over last year’s average,whilst in 1997 the growth recorded in the same period was 2.2 per cent.Slight changes in wages were also seen in both private and public sectors. Ahigher increase in wages is expected at the end of the business year, whencompanies report on their performances. Since it is likely that the projected6.5 per cent-rise in consumer prices will come to fruition by December, it isas early as January that the wages will be adjusted by 85 per cent of theconsumer price index. At the beginning of this year, price projections for1998 anticipated a somewhat different pace, and it was estimated that earlywage adjustment (6.5 per cent-rise in consumer prices) would take placesometime in September. Therefore, the Law on Amendments and Supple-ments to the Minimum Wage and Wage Adjustment Mechanism Act waspassed, stipulating that the early wage adjustment for the public sector bepostponed until December. This is one of the austerity measures in the areaof public sector wages. Adjustments of wages to price rises will now bemade in both sectors at the same time, which clearly represents a substantialimprovement since it removes the source of dissatisfaction arising from thedifferent treatment of public and private sectors.
The government’s austerity package presented last autumn required interalia the public sector not to take on more employees, add annexes to collec-tive agreements, nor promote any staff. Nevertheless, this policy may bejeopardised by the annex to the collective agreement for doctors and den-tists, which introduced wage supplements for these professions (signed inJune) as well as by the new collective agreement on health care profession-
53Page
als which introduced health care allowance (signed in September). Collec-tive bargaining for those professions which traverse several branch collec-tive agreements is decreasing trasparency of what has already been agreedin the area of public sector wages policy.
However, the wage supplements and allowances in the public sector thathave already been agreed, will not significantly influence general wage move-ments in 1998. If additional wage supplements in the public sector are notintroduced by the end of the year and if wage movements in the privatesector at the end of the year are similar to those of last year, we may expectthe average gross wage per employee to rise in real terms by about 2 percent.
The Minimum Wage and Wage Adjustment Mechanism Act expires in June1999. It is expected that the value-added tax will be introduced in July.Incomes policy in 1999 will therefore have to be based on an agreementtaking into account the consequences of introduction of the value-addedtax. Among instruments interfering with personal income tax and social ben-efits, the most acceptable would be those geared towards social security.Nevertheless, a social consensus will have to be achieved and then incorpo-rated into the social agreement in order to direct the development of macr-oeconomic policies of wages, tax and social security towards the greatercompetitiveness of the business sector. In the public sector, more effectiveausterity measures actions will have to be taken. Wages are to be adjustedonly once a year. Over the last three years, the gross wage level per em-ployee in the public sector has been constantly rising, compared to theaverage level gross wage per employee in the rest of the economy. Conse-quently, the share of wages in budget expenditure has been increasing ac-cordingly.
If social partners together with representatives of public sector unions reacha reasonable agreement on wages policy in the second half of the next year,the gross wage per employee is estimated to rise by 1.8 per cent in realterms. This increase will then be 1.5 percentage points below growth inlabour productivity.
Work-related allowances and other remunerations, as well as payments aris-ing from employment contracts and author’s contracts, are growing veryslowly this year. Such movements result from the adopted Law on Amend-ments and Supplements to the Social Security Contributions, which is thebasis for calculating and paying social contributions including other types of
WAGES
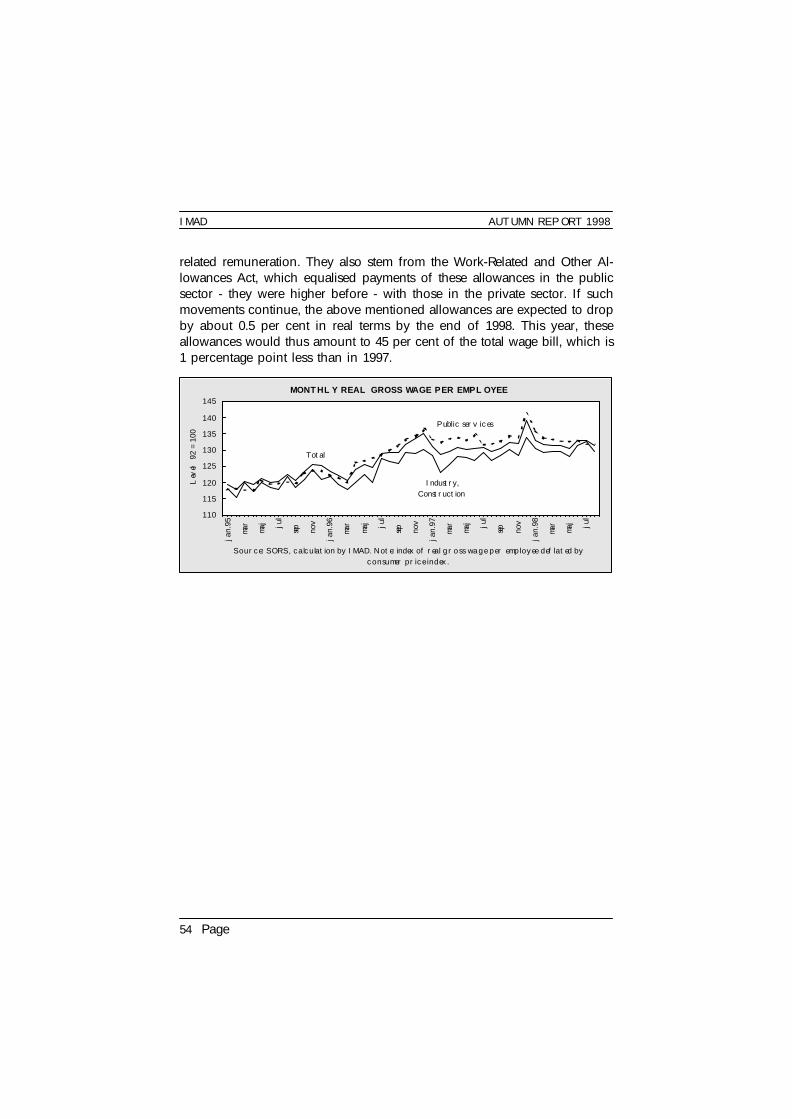
IMAD AUTUMN REPORT 1998
54 Page
related remuneration. They also stem from the Work-Related and Other Al-lowances Act, which equalised payments of these allowances in the publicsector - they were higher before - with those in the private sector. If suchmovements continue, the above mentioned allowances are expected to dropby about 0.5 per cent in real terms by the end of 1998. This year, theseallowances would thus amount to 45 per cent of the total wage bill, which is1 percentage point less than in 1997.
MONTH LY REAL GROSS WAGE PER EMPLOYEE
110
115
120
125
130
135
140
145
jan.
95
mar
maj ju
l
sep nov
jan.
96
mar
maj ju
l
sep nov
jan.
97
mar
maj ju
l
sep nov
jan.
98
mar
maj ju
l
Lev
el 9
2 =
100
Source: SORS, calculation by IMAD. Note: index of real gro s s wag e p er e mployee deflated by consumer price index.
Total
Industry,Construction
Public s ervice s

55Page
9 PUBLIC FINANCE
When drafting the state budget for 1999, the Ministry of Finance adopted anew economic classification of government flows, which complies with themethodology of Government Finance Statistics of the International MonetaryFund (GFS IMF 1986). According to the Decree on Economic Classificationof General Government Receipts and Outlays, Loans Granted and Repaid,Borrowing and Loan Servicing (Official Gazette of the Republic of Slovenia,No. 75, 4 November, 1998), the new classification applies from 1 January1999. In addition to a different classification of general government revenueand expenditure, the new methodology also implies different consolidationof general government finance flows, i.e. exclusion of transfers betweenindividual public finance funds from the general government account. Thechanges in methodology will bring about changes in public finance flowsrecords mainly in the following areas: i) according to the new methodology,the loans granted and the payments received are regarded neither as generalgovernment revenue nor as general government expenditure, and they arerecorded within financial assets and claims calculation; ii) the more detailedeconomic classification enables additional exclusion of transfers betweenpublic finance funds. In this way, social security contributions paid by thestate as employer are additionally excluded, as well as certain transfers be-tween the state budget and municipality budgets and the so-called ownrevenue (revenue from sale of products and services, charged by individualadministrative bodies to other government bodies or other public financefunds).
Since the Ministry of Finance has prepared the consolidated general govern-ment account in accordance with the new methodology only for the 1997-1999 period, public finance is also presented according to the old methodol-ogy throughout the Report in order to allow a comparison with previousyears. (see the tables in the Statistical Appendix).
9.1 GENERAL GOVERNMENT REVENUE IN 1998 – The share ofgeneral government revenue in gross domestic product atapproximately the same level as last year
General government revenue was shaped by fiscal instruments in force atthe end of 1997, whereby some changes were introduced, influencing boththe amount and the structure of fiscal revenue. The austerity programme,
PUBLIC FINANCE
IMAD AUTUMN REPORT 1998
56 Page
introduced by the Government upon drafting the 1998 state budget, in-cluded changes in fiscal instruments. Thus, the tax on balance sheet totals ofbanks was introduced this year, the basis for social security contributionscharging was expanded to include other income arising from labour rela-tions, the sales tax rate was raised for services, the rate of tax on petroleumproducts was increased several times and the special sales tax on beer andtobacco was increased.
It is estimated that this year the revenue from social security contributionswill exceed last year’s by 4 per cent in real terms. Wages were burdened bya social contribution rate at a level of 38 per cent of the contribution basis.The modification of the Law on National Insurance Contributions expandedthe tax basis to include other income arising from labour relations; from thebudgetary point of view, this resulted in slightly increased revenue fromsocial security contributions. Due to the contribution-basis expansion, thegrowth of revenue from social security contributions is quicker than wagegrowth.
A new fiscal source was introduced to the state budget by the tax on thebalance sheet totals of banks and savings banks. Apart from its impact ongeneral government revenue, this tax provides stimulation for banks’ tolarplacements to the non-financial sector because of the deduction item fortolar loans to the business sector. Revenue arising from this tax will amountto about SIT 4.3 billion.
The growth of sales tax rates also contributed to the increase in generalgovernment revenue. In January the rate of sales tax on the supply of serv-ices in the 1st tariff group was raised from 5 per cent to 6.5 per cent. Tax rateson petroleum products trading also went up several times and the specialsales taxes on beer and tobacco were increased as well. As in 1997, pro-longed state budget financing is planned this year. Sales taxes, paid up inJanuary 1999 and relating to 1998 sales, will be regarded as 1998 revenues.In this way, the 1998 sales tax revenue will be 5 per cent higher in realterms than last year.
Another cause for higher budgetary inflows in 1998 were increases in the taxon CO
2 emissions, court fees and registration fees. The payroll tax remained
a fiscal source in 1998. The legislative amendment planned last year aimedat raising the lower taxation limit for wages was withdrawn from the parlia-mentary procedure.
57Page
Due to the Association Agreements, the customs rates were further loweredin 1998, which led to an additional drop in customs and import duties rev-enue. After an almost 30-percent slash in real terms in 1997, revenues fromcustoms duties are expected to drop further by around 26 per cent in realterms this year. Thus they will amount to approximately 1.4 per cent of thegross domestic product, which is less than planned when passing the budget.
It is our estimate that in 1998 the total general government revenue, includ-ing the prolonged state budget financing in January 1999, will increase by4.3 per cent in real terms and they will amount to 44.7 per cent of the GDP(42.9 per cent of the GDP according to the Ministry of Finance predictionsand the new methodology).
9.2 GENERAL GOVERNMENT EXPENDITURE IN 1998 – Consistentimplementation of the Government’s resolution on generalgovernment expenditure reduction is of utmost importance
In order to enforce the laws and regulations regarding pension and disabilityinsurance, expenditures should grow by 3 per cent in real terms over 1997.Growth in the number of pensioners has still not levelled off - it remains atabout 1 per cent per year. Additional pressure is being put on retirement bythe anticipated pension reform. Together with the pensioners’ recreationgrant and other allowances guaranteed by the law, the pension payments(excluding health insurance payments for the pensioners) will amount to13.2 per cent of the gross domestic product, which is 0.1 of a percentagepoint less than last year.
The compulsory health insurance will ensure approximately the same levelof programmes and rights in 1998 as in 1997. It is estimated that the compul-sory health insurance expenditures will increase by 3 per cent in realterms, while their share in the GDP will be about 6.7 per cent, which is 0.1of a percentage point less than last year.
Budget expenditures of the municipalities are expected to grow by 4 percent in real terms. They will reach 4.8 per cent of the gross domestic prod-uct, which is equal to last year.
Accumulated problems, causing pressure on increasing state budget expendi-ture, made balancing of the 1998 state budget a very difficult task in spite ofthe proposed austerity measures. The state budget for 1998 passed in Aprilthis year anticipated expenditures in the amount of SIT 879.5 billion, which
PUBLIC FINANCE
IMAD AUTUMN REPORT 1998
58 Page
is in real terms 6.8 per cent more than the government expenditures in 1997and also more than originally proposed by the Government. In the structureof the passed state budget for 1998, the share of purchase of goods andservices, interest payments, guarantees, subsidies, transfers to the businesssector and investments is increasing. Austerity measures (agreement withtrade unions on public sector wages) contributed to reducing the share ofgovernment expenditure allocated to wages. This year the transfers from thestate budget to the pension fund will be higher by 5.6 per cent in real termsthan last year and they already account for 14.5 per cent of the total statebudget expenditure (3.9 per cent of gross domestic product).
Assuming the anticipated general government revenue, the realisation of thestate budget expenditure in the agreed amount would imply a general gov-ernment deficit in the amount of about 1.5 per cent of the GDP, thus exceed-ing the permitted dept incurring regulated by the Budget ImplementationAct. This is why the Government, in accordance with Art. 23 of the Law onPublic Expenditures, withheld the expenditure of appropriations of the statebudget for 1998 in the amount of about SIT 20 billion. This measure wasintroduced to ensure that the general government deficit would not exceed1 per cent of gross domestic product (according to the old methodology)or 1.2 per cent of gross domestic product (according to the new methodol-ogy).
If budget expenditures are realised in a reduced amount, the net budgetaryspending (excluding transfers to other public finance funds) will in increasein 1998 by 5 per cent in real terms and they will amount to 21 per cent ofgross domestic product, which is 0.2 of a percentage point more than lastyear. The total general government expenditure is estimated to rise by about4 per cent. It will amount to 45.7 per cent of gross domestic product (ac-cording to the former methodology) or 44.1 per cent of gross domesticproduct (according to the Ministry of Finance’s estimate and the new meth-odology).
9.3 GENERAL GOVERNMENT REVENUE IN 1999 – Characterisedby tax reform
The tax reform will continue in 1999. In the middle of 1999 the introductionof the value added tax and excise duties is anticipated. The Law on ValueAdded Tax and the Law on Excise Duties were passed in November thisyear. The Law on Value Added Tax introduces two new tax rates (the generalrate of 19 per cent and the reduced rate of 8 per cent), which are lower than
59Page
the originally planned 20-percent universal rate. As the VAT is not applicableto financial services, special taxation is planned for insurance services andgambling and an increase in the rate of the tax on balance sheet totals ofbanks and saving banks. Since introducing the VAT would lower the taxeson automobile purchase, additional taxation of automobile purchase is be-ing prepared. State budget financing is anticipated to be extended to January2000 (regarding inflows from the value-added tax), in order to compensatefor the deficit caused by the transition to the new system.
On the basis of the decelerated wage growth, it is expected that the growthof government revenue based on wages will level off as well. Our estimateis that the growth of revenue from social security contributions will be of 2.3per cent in real terms next year.
In 1999 it will still not be possible to abrogate the payroll tax, which hadbeen planned when introducing it. The rates and brackets of this tax are notanticipated to change.
Due to obligations arising from signed trade agreements, customs rates willcontinue to fall next year, and so will government revenue arising fromcustoms and import duties.
All the novelties introduced by the tax reform will have a substantial effecton the structure and the share of individual revenue sources. All the inter-relations among and between payments and taxpayers’ liabilities can not beforecast completely. Departures of actual revenue from the estimates aretherefore possible. It is estimated that government revenues will be higherby 4.5 per cent in real terms in 1999 compared to 1998. According to thenew methodology, they will amount to 43.3 per cent of the gross domesticproduct.
9.4 GENERAL GOVERNMENT EXPENDITURE IN 1999 – The totalgeneral government expenditure will amount to 44 percent of gross domestic product
In order to realise the benefits arising from the Law on Pension and Dis-ability Insurance (excluding health insurance contributions for the pen-sioners), it will be necessary to allocate 13.1 per cent of gross domesticproduct next year, which is 0.1 of a percentage point less than this year. Theestimate is based upon a forecast increase in the number of pensioners by1.1 per cent, as retirement pressure will continue to be created by the antici-
PUBLIC FINANCE
IMAD AUTUMN REPORT 1998
60 Page
pated changes of the pension system. On the other hand, the estimate doesnot take into account the demand for a rise in the pensioners’ recreationgrant.
The scope of benefits in the compulsory health insurance will be roughlythe same in 1999 as in 1998. The expenditures for compulsory health insur-ance are estimated to account for about 6.6 per cent of gross domesticproduct, down 0.1 per cent of a percentage point from 1998.
Local government expenditure is not expected to change in 1999 and shouldrepresent 4.8 per cent of GDP, as in 1997 and 1998.
The Government has already drafted the state budget for 1999. Governmentexpenditure for 1999, including loans granted and increased equity shares,amount to about SIT 968 billion, which is in real terms 4.1 per cent morethan passed budget expenditures for 1998, or 6.3 per cent more in real termsthan budget expenditures for 1998 reduced in accordance with the Govern-ment’s proposal.
Stated according to the new methodology, general government expendi-ture will amount to 44 per cent of gross domestic product. In 1999 it willstill not be possible to avoid general government deficit entirely, but it isestimated to remain within moderate boundaries. General government defi-cit is expected to represent 0.7 per cent of gross domestic product. Theestimated level of general government deficit can only be reached if all themeasures and assumptions taken into account when estimating value addedtax are realised, or else the deficit in 1999 can be higher.
61Page
10 PRICES – 1998 inflation rate lower thananticipated, average annual inflation to continue
falling next year
In the period from January to October 1998, consumer prices rose 5.4 percent. Inflation dropped to 6.9 per cent at an annual level in October, achiev-ing its lowest rate since Slovenia became independent. Retail prices went upby 6.4 per cent in the first ten months or by 7.3 per cent at the annualisedlevel. In October 1998, manufacturers’ prices were 2.8 per cent over those inDecember 1997, i. e. 3.9 per cent higher than in October 1997.
This year’s inflation rate, measured by the consumer price index, will notreach the 8 per cent annual growth projected in spring. We estimate that inthe December 1998 - December 1997 period prices shall rise by somewhatless than 7 per cent. Additionally, the average annual inflation rate will besomewhat lower than estimated in spring. It is forecast to be around 8 percent (spring estimate 8.5 per cent)
This year’s inflation path was characterised by seasonal fluctuations, mainlycaused by prices of foodstuffs. In the first three quarters of 1998, price growthwas lower than in the same period last year (6.8 per cent). Hence, theaverage monthly growth rates of prices, which were 0.56 per cent this yearand 0.75 per cent in the first nine months of 1997, were also lower. Unregu-lated prices rose at an average monthly rate of 0.5 per cent (in 1996 by 0.85per cent) in the first half of this year (last year’s rate is similar). The summermonths saw a distinctive slowdown in unregulated prices, which even sawnegative growth during this time. This contributed to the general levellingoff in prices (unchanged prices in June and July and their 0.1 per cent-growth in August) despite fiscal influences (increase in the special beer andtobacco sales tax). Prices in the unregulated market increased on average by0.33 per cent per month in the first nine months (by 0.4 per cent in the sameperiod last year and by 0.55 per cent the year before). The average monthlygrowth rates will probably be somewhat higher by the end of the year dueto seasonal influences and controlled prices. Nevertheless, the average monthlygrowth in unregulated prices is going to be far lower than seen in the previ-
PRICES

IMAD AUTUMN REPORT 1998
62 Page
ous years - estimates predict it will not exceed 0.35 per cent - 0.4 per cent,which is further proof that the unregulated prices are stabilising.
Once again it can be noticed that the prices of services are increasing morequickly this year. In September, they rose by 9.3 per cent annually whereasthe prices of goods went up by 6.3 per cent. This bigger gap in the growth inthe prices of goods and services is partly due to a higher tax on services.
Tax policy also had quite a significant influence on inflation. Together withadjustments of relative petrol prices, the so-called fiscal influences contrib-uted 1.3 percentage points to the 5.1 per cent-inflation rate in the first ninemonths. At the beginning of the year, the government raised turnover taxesin the first tariff tier by 1.5 percentage points. The prices of transport servicesgrew on average by 6.2 per cent. The special beer and tobacco sales exciseswere also increased during the summer.
The policy concerning products and services whose prices are still govern-ment controlled was less active than last year. Thus, in 1998 controlledprices contributed 1.4 percentage points to the 5.1 per cent-inflation rate. Inthe same period last year, this contribution was 2.7 percentage points to the6.8 per cent-nine month inflation rate.
In the first three quarters of this year, the government was reducing dispari-ties in petrol prices (now approximately 9.8 per cent more expensive), basiclocal utility services (up by 10.5 per cent), compulsory automobile liabilityinsurance (9.5 per cent) and TV subscription (8.9 per cent). Last year, thegovernment deregulated the formation of certain prices more actively. This
PRICE INDEXES
104
108
112
116
120
jan.
95
mar
may ju
l
sep nov
jan.
96
mar
may ju
l
sep nov
jan.
97
mar
may ju
l
sep nov
jan.
98
mar
may ju
l
sep
Source: Current month over the same month a year earlier
Inde
xes
Retail prices Consumer prices Industrial producer prices
63Page
year, according to the Europena Agreement, the wholesale prices of medi-cines and medicinal products were also deregulated in the spring, as werefresh pork and retail milk prices.
The price of household electricity rose by 8 per cent in January 1998 and,according to SORS’ estimates, it will go up by approximately 9 per cent inNovember 1998 due to the new tariff system. Nevertheless, price disparitieshave not yet been entirely removed, as they can still be found in basic postalservices, telecommunications and compulsory automobile liability insurance.
Price disparity adjustments are set to continue next year, although the dis-parities were significantly reduced over previous years. This year’s favour-able inflationary trends will, with the continuing support of all policies influ-encing prices, enable a continuous gradual fall in inflation next year. It isestimated that the average annual inflation rate in 1999 will be 6.8 per cent.
PRICES
IMAD AUTUMN REPORT 1998
64 Page
11 MONEY AND LIQUIDITY – Interest rates havedropped substantially
The monetary policy goal for 1998 anticipates a rise in the M3 moneyaggregate within the range of 18 per cent and 26 per cent. From the end of1997 to September 1998, the M3 money aggregate rose at an average monthlyrate of 1.6 per cent, meaning 21.2 per cent in annual terms. The M3 growthrates are closer to the lower edge of the target range due to weak inflowsfrom abroad; the target set by the Bank of Slovenia therefore is being met.From the last quarter of 1997 to the third quarter of 1998, growth in the M1money aggregate was 24.1 per cent in annual terms, and that of the M2 was29.1 per cent due to strong growth in tolar savings and time deposits.
In the first eight months of this year, the issue of the M3 money aggregatetotalled SIT 48.0 billion through a rise in the monetary system’s net foreignassets, or SIT 2.3 billion less due to the state’s higher foreign exchangedeposits with the Bank of Slovenia. Monetisation arising from foreign ex-change transactions totalled SIT 52.3 billion, with SIT 37.7 billion goingthrough exchange offices and the foreign exchange market. The release ofmoney through banks’ domestic investments amounted to SIT 141.5 billion,the majority being through loans granted to enterprises and households.From the point of view of the monetary policy (necessity of sterilisation),activities on the financial account of the balance of payments were morefavourable in the first eight months of this year compared to last year.
At the end of September, total foreign exchange reserves totalled USD 4,791.2million, 10 per cent up on December 1997. Foreign exchange reserves of theBank of Slovenia (BS) were USD 3,780.8 million, 14.7 per cent higher than inDecember last year. The BS had 78.9 per cent of total foreign exchangereserves at the end of September, compared to 75.5 per cent last December.
In the first nine months of this year, banks’ loan granting operations werestrong, indicated by the fact that loans to the non-banking sectors increasedby 9.2 per cent in real terms in September compared to December 1997. Inthe same period, long-term loans rose by 14.2 per cent in real terms andshort-term loans by 1.7 per cent. Loans granted to households increased by13.3 per cent in real terms, and their share in the structure of total loansstood at 39.4 per cent at the end of September, 1.4 percentage points aboveDecember last year.
65Page
After the inter-bank agreement on setting the ceiling for deposit interest ratescame into force in July 1998, interest rates for tolar deposits fell by 1.0 to1.5 percentage points. Banks have also introduced the nominal interest ratefor 30-day time deposits (6 per cent annually) in order to gradually introduceinterest nominalism. The average real interest rate for time deposits with amaturity of over one year fell from last December’s 6.2 per cent to the 4.2 percent recorded in September this year.
The average real interest rates – above the revaluation part of the interestrate allowing for inflation (TOM) – for short-term and long-term loans grantedto the business sector have been falling this year. In September, average realinterest rates for short-term loans were 5.9 per cent, 3.7 percentage pointslower than in December last year; 7.3 per cent for long-term loans, 3.4percentage points below last December’s level. The average real interest rateabove the revaluation rate for short-term consumer loans dropped substan-tially, with the September rate standing at 4.3 per cent compared to 8.0 percent last December. The interest rate for long-term housing loans granted tohouseholds fell from last December’s 9.4 per cent to 6.4 per cent in Septem-ber 1998.
Average nominal interest rates have also dropped. In September, the aver-age nominal interest rates for short-term loans granted to the business sectorwere 13.9 per cent, 6.4 percentage points down on December 1997. Forlong-term loans they stood at 15.4 per cent, 6.2 percentage points lower thanin December 1997. The average nominal interest rates for time deposits havealso fallen, going down from the monthly level of 0.8 per cent recorded inDecember last year to this September’s 0.6 per cent.
In September 1998, the annual nominal interest rate on the inter-bank moneymarket averaged 6.42 per cent, 1.1 percentage points below the base interestrate (TOM), suggesting that bank liquidity is sound. Last December, nominalinterest rates on the inter-bank money market were 9.8 per cent, the same asthe base interest rate (9.84 per cent).
Total tolar and foreign exchange household savings in banks have beenrising this year. At the end of September, total savings were up 10.9 per centin real terms compared to December 1997. In the first nine months of thisyear, household tolar savings with banks were increasing to record a 21.6per cent real rise at the end of September compared to last December. Thisstrong growth in tolar deposits was largely due to a slower rise in the foreignexchange rate of the German mark compared to the rise in domestic prices.In the same period, foreign exchange deposits recorded only modest in-
MONEY AND LIQUIDITY
IMAD AUTUMN REPORT 1998
66 Page
creases. At the end of September 1998, they edged up 1.8 per cent in realterms compared to last December. After increasing gradually over the year,the proportion of tolar savings in total households’ assets held in banksstood at 50.5 per cent at the end of September, 4.5 percentage points up onDecember 1997. The increasing proportion of tolar savings suggests thatconfidence in both the domestic currency and domestic banking system isgrowing.
The Slovenian banking system is still not competitive in comparisonwith those in developed countries. Labour costs and the relative share ofoperating expenses are too high in contrast to foreign banks, besides theyshow no signs of going down. The four foreign banks currently operating inSlovenia have not substantially contributed to improving the banking sys-tem’s competitiveness. Banks’ financial margins have not dropped markedlyand are still too high compared to foreign banks. Slovenian banks will faceforeign competition after the Association Agreement between Slovenia andthe EU comes into force, enabling foreign banks to open up branches inSlovenia. The process of co-operation within the banking system is alsoweak, as the existing bank groups have no common business policy thatwould lead to further bank mergers.
67Page
12 THE SECURITIES MARKET – Ljubljana StockExchange’s market capitalisation is growing fast
1997 saw the conclusion of the first phase of Slovenian capital market devel-opment characterised by limited supply, low market capitalisation, slow own-ership restructuring, a strong indirect influence of monetary policy, the lackof domestic institutional and total foreign demand, and the lack of a regula-tive framework. The second phase of capital market development, markingthe start of its maturing, is characterised by rapidly growing market capitali-sation and consequently an increase in supply, the entering of the first for-eign institutional investors and the Bank of Slovenia’s portfolio capital re-strictions, established regulations and their regulator, inappropriate fiscal policyin this field, the absence of the state as an important and positive actor, in allevery sense of the word, and demand weaker than supply (Veselinovie,1998).
The total market capitalisation increased from SIT 177 billion at the end of1996 to SIT 399 billion at the end of 1997. At the end of September 1998, itstood at SIT 584 billion, representing 17.8 per cent of gross domestic prod-uct. The number of issuing companies rose from 67 at the end of 1996 to 107at the end of 1997, or to 125 recorded at the end of September 1998. At theend of September, a total of 150 securities were traded on the stock ex-change (65 on the official market and 85 on the open market).
In 1998, the majority of shares issued on the market were the shares ofprivatised companies, however, the trend was weaker compared to 1997. Astronger share offering can again be expected after the adoption of the Lawon the Dematerialisation Process, when also ‘stubborn’ privatised companieswill formally issue their shares, stop trading on the ‘grey’ market and fulfilpromises given to their shareholders and partners (Veselinovie, 1998). In1998, the debt instruments market was characterised by the issue of govern-ment bonds – RS04 and RS11 – first on the Ljubljana stock exchange openmarket and then under exchange quotation A. The state has thereby ensuredthat its transferable bond issues are traded in organised and transparentconditions.
Foreign capital represents only about 7 per cent in the total market capi-talisation of Slovenian securities, and about 9 per cent in the market capitali-sation of shares. Foreigners invest exclusively in shares, as they are facedwith the Bank of Slovenia’s additional credit restrictions when investing in
TH E SECURITES MARKET
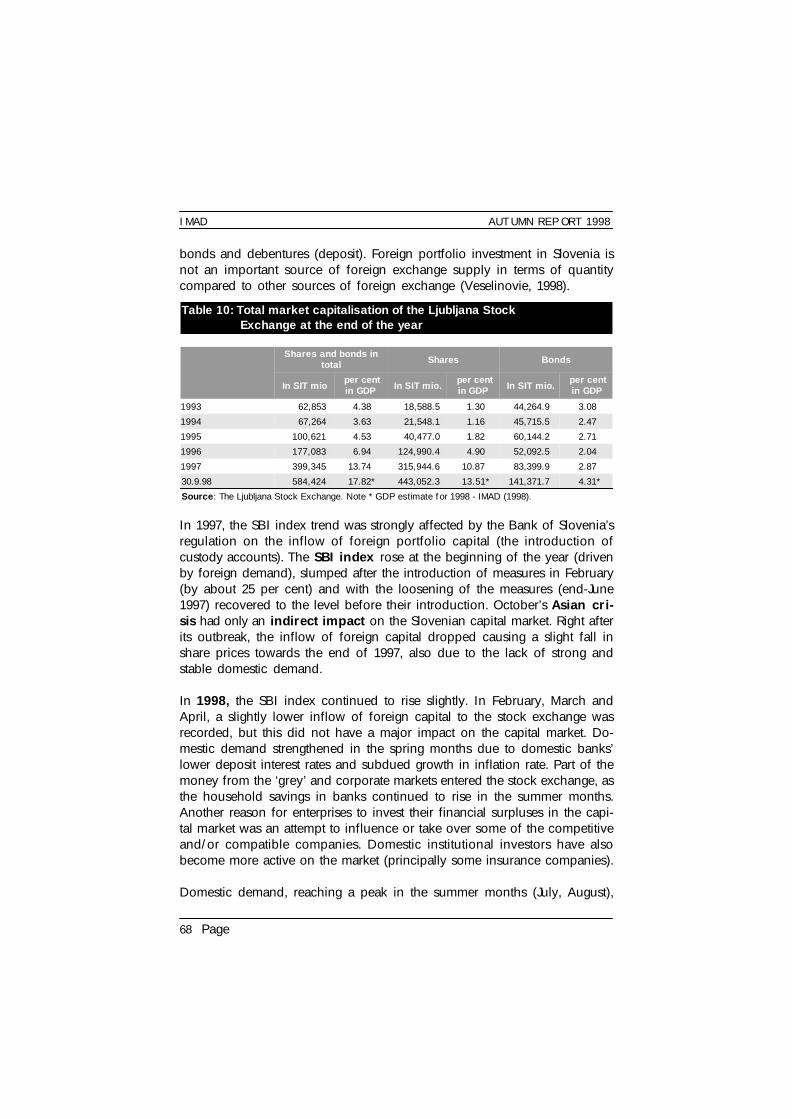
IMAD AUTUMN REPORT 1998
68 Page
bonds and debentures (deposit). Foreign portfolio investment in Slovenia isnot an important source of foreign exchange supply in terms of quantitycompared to other sources of foreign exchange (Veselinovie, 1998).
In 1997, the SBI index trend was strongly affected by the Bank of Slovenia’sregulation on the inflow of foreign portfolio capital (the introduction ofcustody accounts). The SBI index rose at the beginning of the year (drivenby foreign demand), slumped after the introduction of measures in February(by about 25 per cent) and with the loosening of the measures (end-June1997) recovered to the level before their introduction. October’s Asian cri-sis had only an indirect impact on the Slovenian capital market. Right afterits outbreak, the inflow of foreign capital dropped causing a slight fall inshare prices towards the end of 1997, also due to the lack of strong andstable domestic demand.
In 1998, the SBI index continued to rise slightly. In February, March andApril, a slightly lower inflow of foreign capital to the stock exchange wasrecorded, but this did not have a major impact on the capital market. Do-mestic demand strengthened in the spring months due to domestic banks’lower deposit interest rates and subdued growth in inflation rate. Part of themoney from the ‘grey’ and corporate markets entered the stock exchange, asthe household savings in banks continued to rise in the summer months.Another reason for enterprises to invest their financial surpluses in the capi-tal market was an attempt to influence or take over some of the competitiveand/or compatible companies. Domestic institutional investors have alsobecome more active on the market (principally some insurance companies).
Domestic demand, reaching a peak in the summer months (July, August),
Table 10: Total market capitalisation of the Ljubljana Stock Exchange at the end of the year
Shares and bonds intotal Shares Bonds
In SIT mio per centin GDP In SIT mio.
per centin GDP In SIT mio.
per centin GDP
1993 62,853 4.38 18,588.5 1.30 44,264.9 3.08
1994 67,264 3.63 21,548.1 1.16 45,715.5 2.47
1995 100,621 4.53 40,477.0 1.82 60,144.2 2.71
1996 177,083 6.94 124,990.4 4.90 52,092.5 2.04
1997 399,345 13.74 315,944.6 10.87 83,399.9 2.87
30.9.98 584,424 17.82* 443,052.3 13.51* 141,371.7 4.31*
Source: The Ljubljana Stock Exchange. Note * GDP estimate for 1998 - IMAD (1998).
69Page
TH E SECURITIES MARKET
caused a rise in prices on the capital market. The SBI index reached a recordhigh at the beginning of August (it exceeded 2000 points). The beginningof the Russian crisis halted the rise in securities’ prices driven mainlyby increasing domestic demand. At that time, foreigners cut their invest-ments completely. After the start of the crisis, only foreign capital that en-tered the market before February 1997 (before the introduction of custodyaccounts) started to withdraw from Slovenia. The existing regulation on for-eign portfolio investment thereby reduced the impact of the Russian crisis onthe stock exchange developments. The Russian events also halted growth indomestic demand.
In 1998, the Slovenian capital market recorded another increase in marketcapitalisation (of shares and bonds), number of issuing companies, securi-ties and privatised companies. More authorised privatisation investment fundsstarted to trade on the official markets (9). At the end of September, therewere 125 issuing companies registered on the official markets listing 150different securities. The end of 1998 and particularly 1999 will be character-ised by authorised privatisation investment funds entering the official mar-ket.

IMAD AUTUMN REPORT 1998
70 Page
71Page
STATISTICAL APPENDIX
STATISTICAL APPENDIX

IMAD AUTUMN REPORT 1998
72 Page

73Page
LIST OF TABLES
Table 1: Main macroeconomic indicators of Slovenia____________ 75Table 2a: Value added at factor cost by NACE Rev. 1 activities
and gross domestic product _________________________ 78Table 2b: Value added at factor cost by NACE Rev. 1 activities
and gross domestic product _________________________ 79Table 3a: Value added at factor cost by NACE Rev. 1 activities
and gross domestic product _________________________ 81Table 3b: Value added at factor cost by NACE Rev. 1 activities
and gross domestic product _________________________ 82Table 4: Cost structure of GDP______________________________ 83Table 5a: Expenditure on gross domestic product _______________ 84Table 5b: Expenditure on gross domestic product _______________ 86Table 6: Supply and use of resources (estimates) _______________ 88Table 7: Investment in economic infrastructure ________________ 90Table 8: Balance of payments ______________________________ 92Table 9: Exports and imports of goods and services by
end-use of products _______________________________ 94Table 10: Foreign trade by geographical area ___________________ 95Table 11: Foreign trade by geographical area ___________________ 97Table 12: General government revenue _______________________ 99Table 12a: Consolidated general government revenues,
expenditures and financing; GFS – IMF Methodology ___ 101Table 13: General government expenditure ___________________ 103Table 13a: Consolidated general government revenues,
expenditures and financing; GFS – IMF Methodology ___ 105Table 14: Indicators of overall competitiveness ________________ 107Table 15: Labour force, employment and unemployment ________ 108Table 16: Labour force flows during the year __________________ 110
STATISTICAL APPENDIX

IMAD AUTUMN REPORT 1998
74 Page
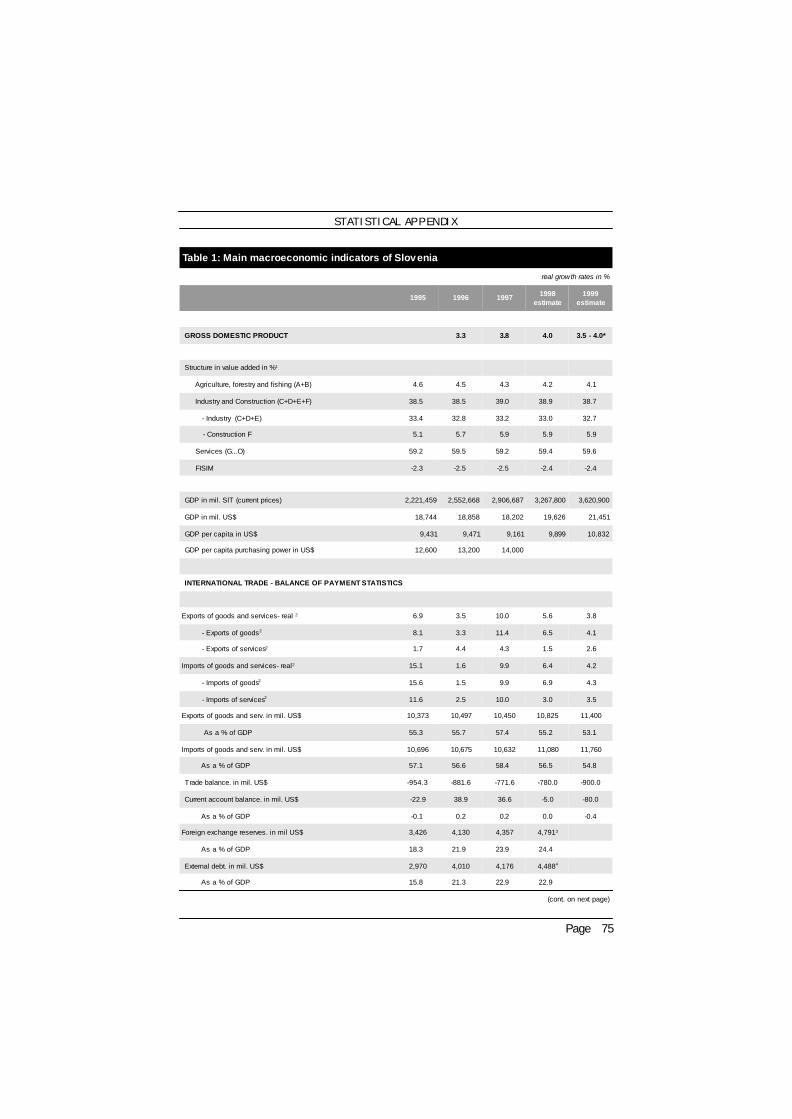
75Page
Table 1: Main macroeconomic indicators of Slovenia
real growth rates in %
1995 1996 1997 1998estimate
1999estimate
GROSS DOMESTIC PRODUCT 3.3 3.8 4.0 3.5 - 4.0*
Structure in value added in %1
Agriculture, forestry and fishing (A+B) 4.6 4.5 4.3 4.2 4.1
Industry and Construction (C+D+E+F) 38.5 38.5 39.0 38.9 38.7
- Industry (C+D+E) 33.4 32.8 33.2 33.0 32.7
- Construction F 5.1 5.7 5.9 5.9 5.9
Services (G...O) 59.2 59.5 59.2 59.4 59.6
FISIM -2.3 -2.5 -2.5 -2.4 -2.4
GDP in mil. SIT (current prices) 2,221,459 2,552,668 2,906,687 3,267,800 3,620,900
GDP in mil. US$ 18,744 18,858 18,202 19,626 21,451
GDP per capita in US$ 9,431 9,471 9,161 9,899 10,832
GDP per capita purchasing power in US$ 12,600 13,200 14,000
INTERNATIONAL TRADE - BALANCE OF PAYMENT STATISTICS
Exports of goods and services- real 2 6.9 3.5 10.0 5.6 3.8
- Exports of goods2 8.1 3.3 11.4 6.5 4.1
- Exports of services2 1.7 4.4 4.3 1.5 2.6
Imports of goods and services- real2 15.1 1.6 9.9 6.4 4.2
- Imports of goods2 15.6 1.5 9.9 6.9 4.3
- Imports of services2 11.6 2.5 10.0 3.0 3.5
Exports of goods and serv. in mil. US$ 10,373 10,497 10,450 10,825 11,400
As a % of GDP 55.3 55.7 57.4 55.2 53.1
Imports of goods and serv. in mil. US$ 10,696 10,675 10,632 11,080 11,760
As a % of GDP 57.1 56.6 58.4 56.5 54.8
Trade balance. in mil. US$ -954.3 -881.6 -771.6 -780.0 -900.0
Current account balance. in mil. US$ -22.9 38.9 36.6 -5.0 -80.0
As a % of GDP -0.1 0.2 0.2 0.0 -0.4
Foreign exchange reserves. in mil US$ 3,426 4,130 4,357 4,7913
As a % of GDP 18.3 21.9 23.9 24.4
External debt. in mil. US$ 2,970 4,010 4,176 4,4884
As a % of GDP 15.8 21.3 22.9 22.9
(cont. on next page)
STATISTICAL APPENDIX
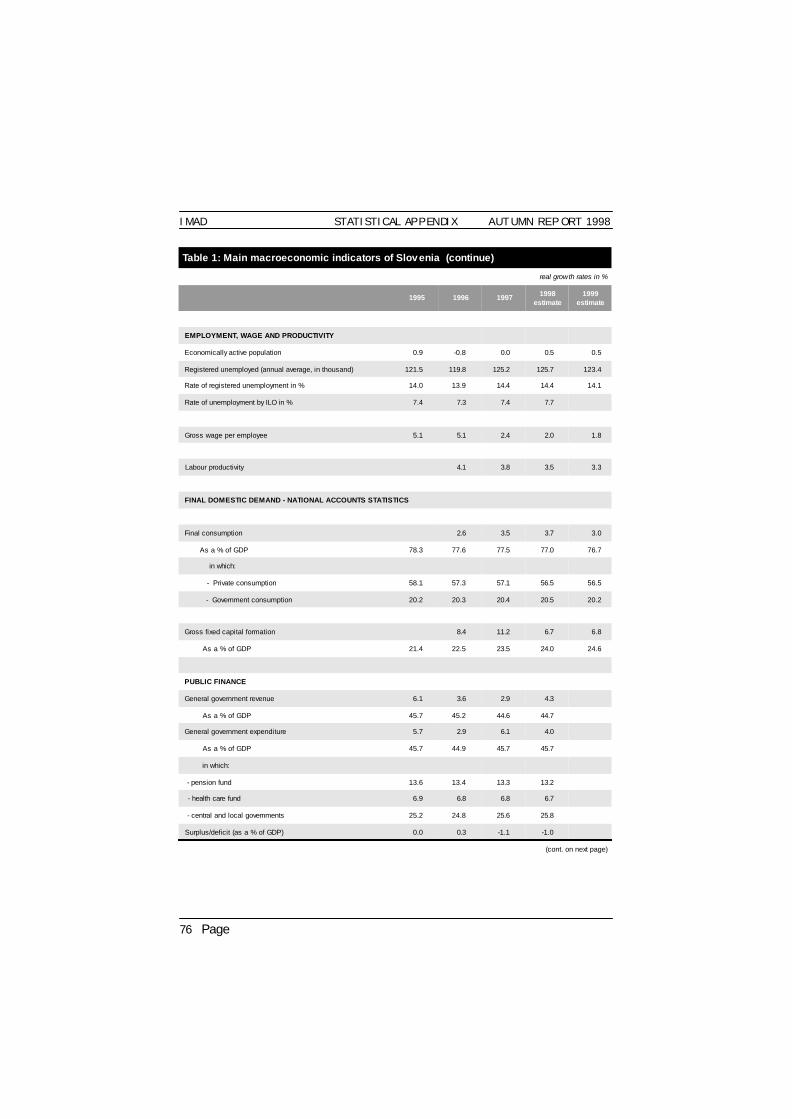
IMAD AUTUMN REPORT 1998
76 Page
Table 1: Main macroeconomic indicators of Slovenia (continue)
real growth rates in %
1995 1996 1997 1998estimate
1999estimate
EMPLOYMENT, WAGE AND PRODUCTIVITY
Economically active population 0.9 -0.8 0.0 0.5 0.5
Registered unemployed (annual average, in thousand) 121.5 119.8 125.2 125.7 123.4
Rate of registered unemployment in % 14.0 13.9 14.4 14.4 14.1
Rate of unemployment by ILO in % 7.4 7.3 7.4 7.7
Gross wage per employee 5.1 5.1 2.4 2.0 1.8
Labour productivity 4.1 3.8 3.5 3.3
FINAL DOMESTIC DEMAND - NATIONAL ACCOUNTS STATISTICS
Final consumption 2.6 3.5 3.7 3.0
As a % of GDP 78.3 77.6 77.5 77.0 76.7
in which:
- Private consumption 58.1 57.3 57.1 56.5 56.5
- Government consumption 20.2 20.3 20.4 20.5 20.2
Gross fixed capital formation 8.4 11.2 6.7 6.8
As a % of GDP 21.4 22.5 23.5 24.0 24.6
PUBLIC FINANCE
General government revenue 6.1 3.6 2.9 4.3
As a % of GDP 45.7 45.2 44.6 44.7
General government expenditure 5.7 2.9 6.1 4.0
As a % of GDP 45.7 44.9 45.7 45.7
in which:
- pension fund 13.6 13.4 13.3 13.2
- health care fund 6.9 6.8 6.8 6.7
- central and local governments 25.2 24.8 25.6 25.8
Surplus/deficit (as a % of GDP) 0.0 0.3 -1.1 -1.0
(cont. on next page)
STATISTICAL APPENDIX
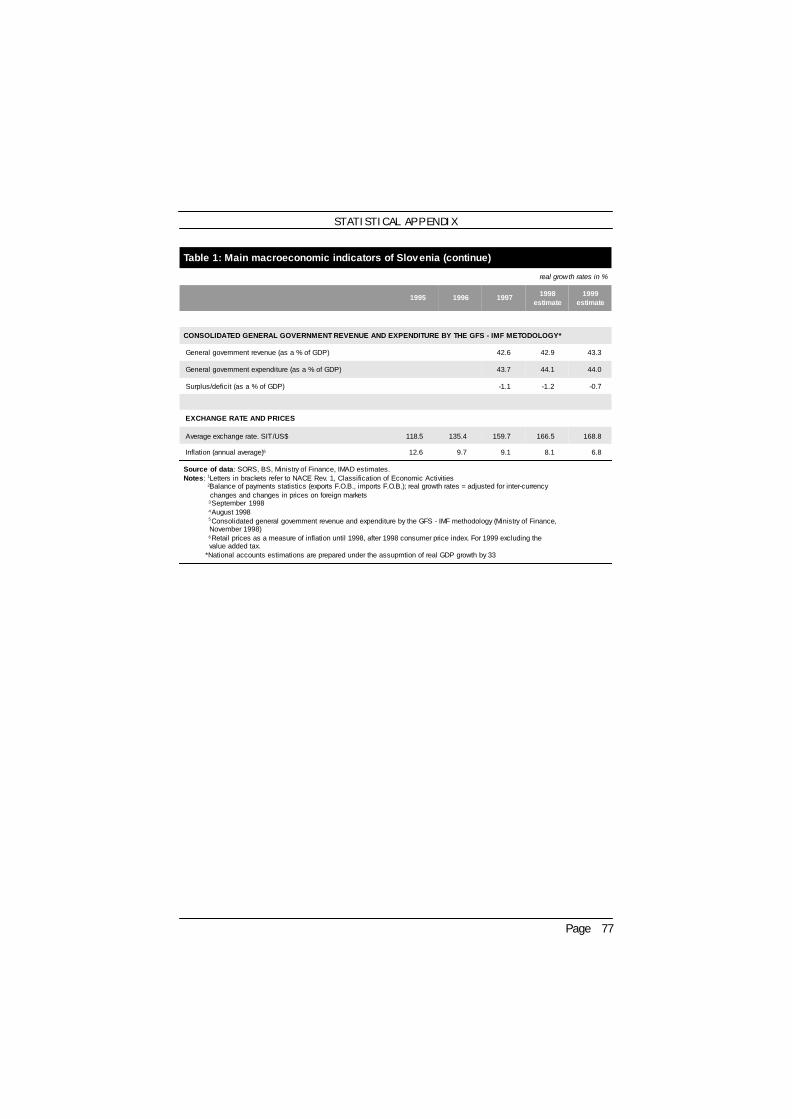
77Page
Table 1: Main macroeconomic indicators of Slovenia (continue)
real growth rates in %
1995 1996 1997 1998estimate
1999estimate
CONSOLIDATED GENERAL GOVERNMENT REVENUE AND EXPENDITURE BY THE GFS - IMF METODOLOGY*
General government revenue (as a % of GDP) 42.6 42.9 43.3
General government expenditure (as a % of GDP) 43.7 44.1 44.0
Surplus/deficit (as a % of GDP) -1.1 -1.2 -0.7
EXCHANGE RATE AND PRICES
Average exchange rate. SIT/US$ 118.5 135.4 159.7 166.5 168.8
Inflation (annual average)6 12.6 9.7 9.1 8.1 6.8
Source of data: SORS, BS, Ministry of Finance, IMAD estimates.Notes: 1Letters in brackets refer to NACE Rev. 1, Classification of Economic Activities 2Balance of payments statistics (exports F.O.B., imports F.O.B.); real growth rates = adjusted for inter-currency changes and changes in prices on foreign markets 3September 1998 4August 1998 5Consolidated general government revenue and expenditure by the GFS - IMF methodology (Ministry of Finance, November 1998) 6Retail prices as a measure of inflation until 1998, after 1998 consumer price index. For 1999 excluding the value added tax. *National accounts estimations are prepared under the assupmtion of real GDP growth by 33
STATISTICAL APPENDIX
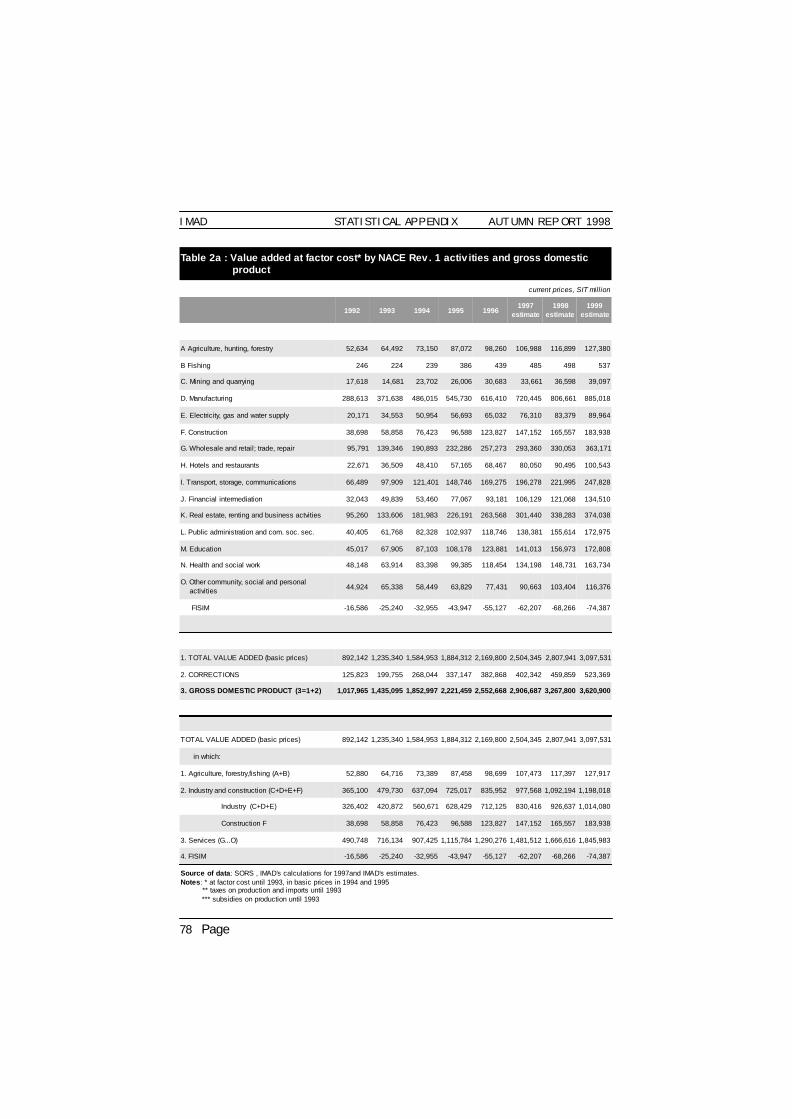
IMAD AUTUMN REPORT 1998
78 Page
Table 2a : Value added at factor cost* by NACE Rev. 1 activities and gross domestic product
current prices, SIT million
1992 1993 1994 1995 19961997
estimate1998
estimate1999
estimate
A Agriculture, hunting, forestry 52,634 64,492 73,150 87,072 98,260 106,988 116,899 127,380
B Fishing 246 224 239 386 439 485 498 537
C. Mining and quarrying 17,618 14,681 23,702 26,006 30,683 33,661 36,598 39,097
D. Manufacturing 288,613 371,638 486,015 545,730 616,410 720,445 806,661 885,018
E. Electricity, gas and water supply 20,171 34,553 50,954 56,693 65,032 76,310 83,379 89,964
F. Construction 38,698 58,858 76,423 96,588 123,827 147,152 165,557 183,938
G. Wholesale and retail; trade, repair 95,791 139,346 190,893 232,286 257,273 293,360 330,053 363,171
H. Hotels and restaurants 22,671 36,509 48,410 57,165 68,467 80,050 90,495 100,543
I. Transport, storage, communications 66,489 97,909 121,401 148,746 169,275 196,278 221,995 247,828
J. Financial intermediation 32,043 49,839 53,460 77,067 93,181 106,129 121,068 134,510
K. Real estate, renting and business actvities 95,260 133,606 181,983 226,191 263,568 301,440 338,283 374,038
L. Public administration and com. soc. sec. 40,405 61,768 82,328 102,937 118,746 138,381 155,614 172,975
M. Education 45,017 67,905 87,103 108,178 123,881 141,013 156,973 172,808
N. Health and social work 48,148 63,914 83,398 99,385 118,454 134,198 148,731 163,734
O. Other community, social and personal activities 44,924 65,338 58,449 63,829 77,431 90,663 103,404 116,376
FISIM -16,586 -25,240 -32,955 -43,947 -55,127 -62,207 -68,266 -74,387
1. TOTAL VALUE ADDED (basic prices) 892,142 1,235,340 1,584,953 1,884,312 2,169,800 2,504,345 2,807,941 3,097,531
2. CORRECTIONS 125,823 199,755 268,044 337,147 382,868 402,342 459,859 523,369
3. GROSS DOMESTIC PRODUCT (3=1+2) 1,017,965 1,435,095 1,852,997 2,221,459 2,552,668 2,906,687 3,267,800 3,620,900
TOTAL VALUE ADDED (basic prices) 892,142 1,235,340 1,584,953 1,884,312 2,169,800 2,504,345 2,807,941 3,097,531
in which:
1. Agriculture, forestry,fishing (A+B) 52,880 64,716 73,389 87,458 98,699 107,473 117,397 127,917
2. Industry and construction (C+D+E+F) 365,100 479,730 637,094 725,017 835,952 977,568 1,092,194 1,198,018
Industry (C+D+E) 326,402 420,872 560,671 628,429 712,125 830,416 926,637 1,014,080
Construction F 38,698 58,858 76,423 96,588 123,827 147,152 165,557 183,938
3. Services (G...O) 490,748 716,134 907,425 1,115,784 1,290,276 1,481,512 1,666,616 1,845,983
4. FISIM -16,586 -25,240 -32,955 -43,947 -55,127 -62,207 -68,266 -74,387
Source of data: SORS , IMAD's calculations for 1997and IMAD's estimates.Notes: * at factor cost until 1993, in basic prices in 1994 and 1995 ** taxes on production and imports until 1993 *** subsidies on production until 1993
STATISTICAL APPENDIX
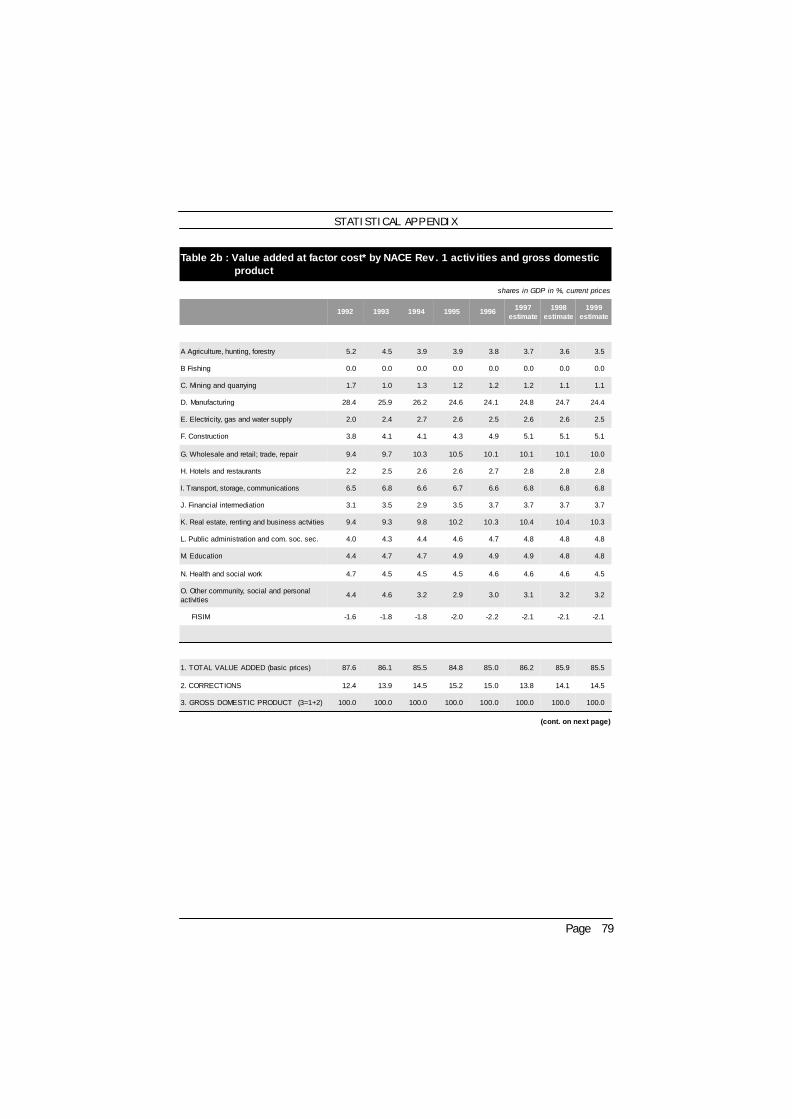
79Page
Table 2b : Value added at factor cost* by NACE Rev. 1 activities and gross domestic product
shares in GDP in %, current prices
1992 1993 1994 1995 1996 1997estimate
1998estimate
1999estimate
A Agriculture, hunting, forestry 5.2 4.5 3.9 3.9 3.8 3.7 3.6 3.5
B Fishing 0.0 0.0 0.0 0.0 0.0 0.0 0.0 0.0
C. Mining and quarrying 1.7 1.0 1.3 1.2 1.2 1.2 1.1 1.1
D. Manufacturing 28.4 25.9 26.2 24.6 24.1 24.8 24.7 24.4
E. Electricity, gas and water supply 2.0 2.4 2.7 2.6 2.5 2.6 2.6 2.5
F. Construction 3.8 4.1 4.1 4.3 4.9 5.1 5.1 5.1
G. Wholesale and retail; trade, repair 9.4 9.7 10.3 10.5 10.1 10.1 10.1 10.0
H. Hotels and restaurants 2.2 2.5 2.6 2.6 2.7 2.8 2.8 2.8
I. Transport, storage, communications 6.5 6.8 6.6 6.7 6.6 6.8 6.8 6.8
J. Financial intermediation 3.1 3.5 2.9 3.5 3.7 3.7 3.7 3.7
K. Real estate, renting and business actvities 9.4 9.3 9.8 10.2 10.3 10.4 10.4 10.3
L. Public administration and com. soc. sec. 4.0 4.3 4.4 4.6 4.7 4.8 4.8 4.8
M. Education 4.4 4.7 4.7 4.9 4.9 4.9 4.8 4.8
N. Health and social work 4.7 4.5 4.5 4.5 4.6 4.6 4.6 4.5
O. Other community, social and personalactivities
4.4 4.6 3.2 2.9 3.0 3.1 3.2 3.2
FISIM -1.6 -1.8 -1.8 -2.0 -2.2 -2.1 -2.1 -2.1
1. TOTAL VALUE ADDED (basic prices) 87.6 86.1 85.5 84.8 85.0 86.2 85.9 85.5
2. CORRECTIONS 12.4 13.9 14.5 15.2 15.0 13.8 14.1 14.5
3. GROSS DOMESTIC PRODUCT (3=1+2) 100.0 100.0 100.0 100.0 100.0 100.0 100.0 100.0
(cont. on next page)
STATISTICAL APPENDIX
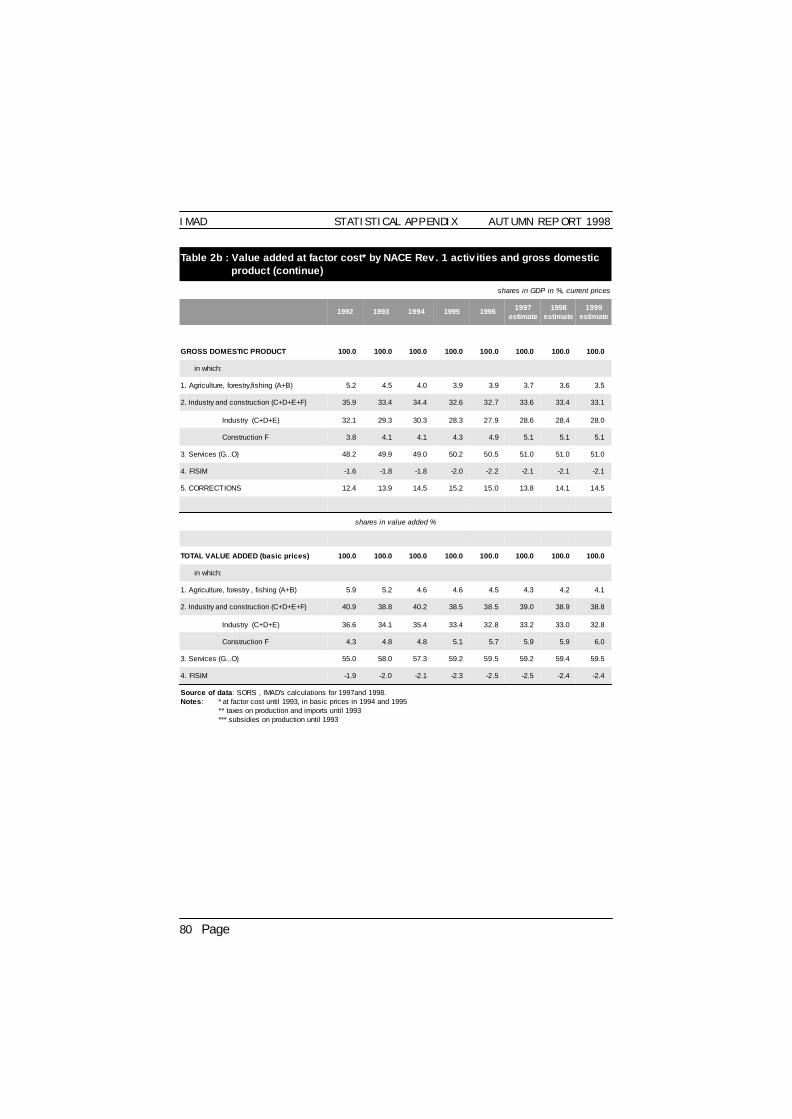
IMAD AUTUMN REPORT 1998
80 Page
Table 2b : Value added at factor cost* by NACE Rev. 1 activities and gross domestic product (continue)
shares in GDP in %, current prices
1992 1993 1994 1995 1996 1997estimate
1998estimate
1999estimate
GROSS DOMESTIC PRODUCT 100.0 100.0 100.0 100.0 100.0 100.0 100.0 100.0
in which:
1. Agriculture, forestry,fishing (A+B) 5.2 4.5 4.0 3.9 3.9 3.7 3.6 3.5
2. Industry and construction (C+D+E+F) 35.9 33.4 34.4 32.6 32.7 33.6 33.4 33.1
Industry (C+D+E) 32.1 29.3 30.3 28.3 27.9 28.6 28.4 28.0
Construction F 3.8 4.1 4.1 4.3 4.9 5.1 5.1 5.1
3. Services (G...O) 48.2 49.9 49.0 50.2 50.5 51.0 51.0 51.0
4. FISIM -1.6 -1.8 -1.8 -2.0 -2.2 -2.1 -2.1 -2.1
5. CORRECTIONS 12.4 13.9 14.5 15.2 15.0 13.8 14.1 14.5
shares in value added %
TOTAL VALUE ADDED (basic prices) 100.0 100.0 100.0 100.0 100.0 100.0 100.0 100.0
in which:
1. Agriculture, forestry , fishing (A+B) 5.9 5.2 4.6 4.6 4.5 4.3 4.2 4.1
2. Industry and construction (C+D+E+F) 40.9 38.8 40.2 38.5 38.5 39.0 38.9 38.8
Industry (C+D+E) 36.6 34.1 35.4 33.4 32.8 33.2 33.0 32.8
Construction F 4.3 4.8 4.8 5.1 5.7 5.9 5.9 6.0
3. Services (G...O) 55.0 58.0 57.3 59.2 59.5 59.2 59.4 59.5
4. FISIM -1.9 -2.0 -2.1 -2.3 -2.5 -2.5 -2.4 -2.4
Source of data: SORS , IMAD's calculations for 1997and 1998.Notes: * at factor cost until 1993, in basic prices in 1994 and 1995 ** taxes on production and imports until 1993 *** subsidies on production until 1993
STATISTICAL APPENDIX
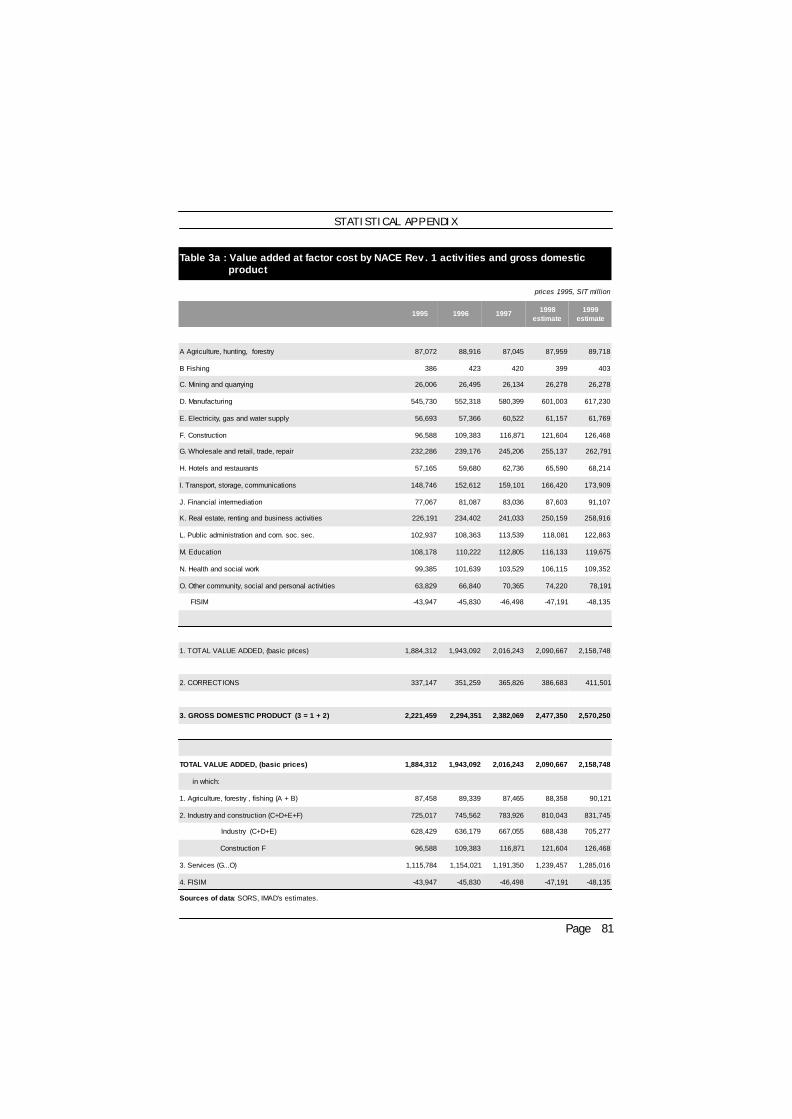
81Page
Table 3a : Value added at factor cost by NACE Rev. 1 activities and gross domestic product
prices 1995, SIT million
1995 1996 1997 1998estimate
1999estimate
A Agriculture, hunting, forestry 87,072 88,916 87,045 87,959 89,718
B Fishing 386 423 420 399 403
C. Mining and quarrying 26,006 26,495 26,134 26,278 26,278
D. Manufacturing 545,730 552,318 580,399 601,003 617,230
E. Electricity, gas and water supply 56,693 57,366 60,522 61,157 61,769
F. Construction 96,588 109,383 116,871 121,604 126,468
G. Wholesale and retail, trade, repair 232,286 239,176 245,206 255,137 262,791
H. Hotels and restaurants 57,165 59,680 62,736 65,590 68,214
I. Transport, storage, communications 148,746 152,612 159,101 166,420 173,909
J. Financial intermediation 77,067 81,087 83,036 87,603 91,107
K. Real estate, renting and business activities 226,191 234,402 241,033 250,159 258,916
L. Public administration and com. soc. sec. 102,937 108,363 113,539 118,081 122,863
M. Education 108,178 110,222 112,805 116,133 119,675
N. Health and social work 99,385 101,639 103,529 106,115 109,352
O. Other community, social and personal activities 63,829 66,840 70,365 74,220 78,191
FISIM -43,947 -45,830 -46,498 -47,191 -48,135
1. TOTAL VALUE ADDED, (basic prices) 1,884,312 1,943,092 2,016,243 2,090,667 2,158,748
2. CORRECTIONS 337,147 351,259 365,826 386,683 411,501
3. GROSS DOMESTIC PRODUCT (3 = 1 + 2) 2,221,459 2,294,351 2,382,069 2,477,350 2,570,250
TOTAL VALUE ADDED, (basic prices) 1,884,312 1,943,092 2,016,243 2,090,667 2,158,748
in which:
1. Agriculture, forestry , fishing (A + B) 87,458 89,339 87,465 88,358 90,121
2. Industry and construction (C+D+E+F) 725,017 745,562 783,926 810,043 831,745
Industry (C+D+E) 628,429 636,179 667,055 688,438 705,277
Construction F 96,588 109,383 116,871 121,604 126,468
3. Services (G...O) 1,115,784 1,154,021 1,191,350 1,239,457 1,285,016
4. FISIM -43,947 -45,830 -46,498 -47,191 -48,135
Sources of data: SORS, IMAD's estimates.
STATISTICAL APPENDIX
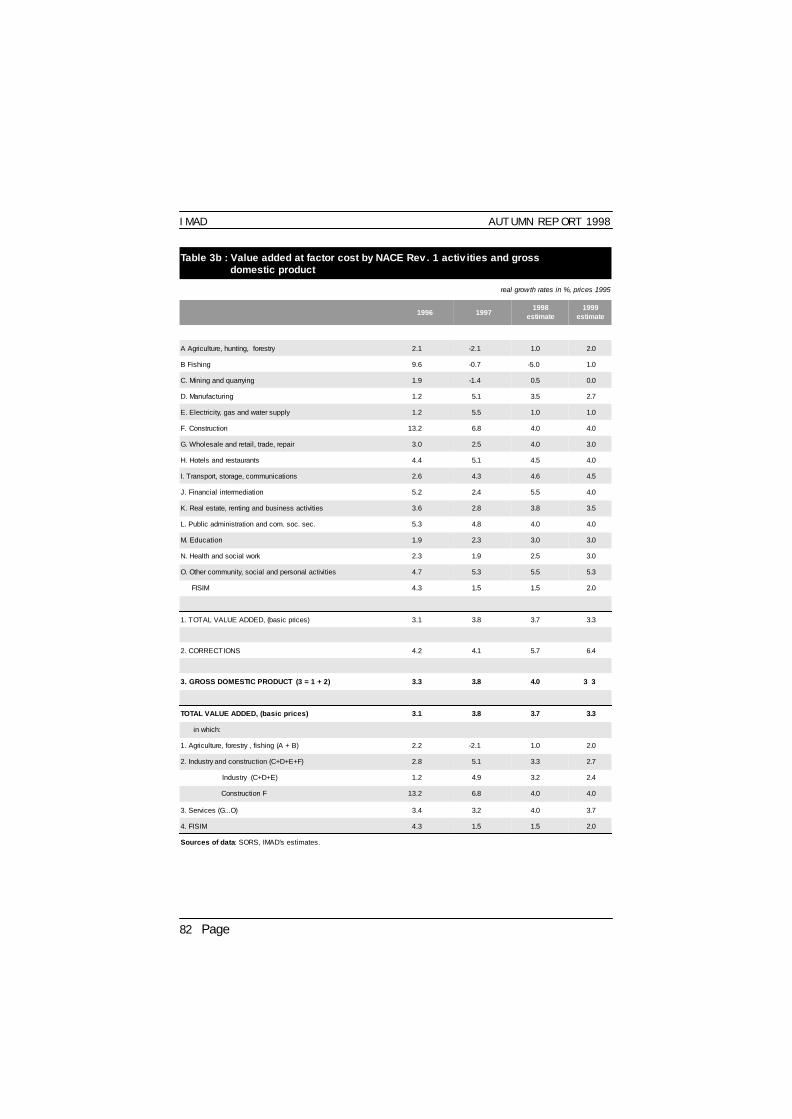
IMAD AUTUMN REPORT 1998
82 Page
Table 3b : Value added at factor cost by NACE Rev. 1 activities and gross domestic product
real growth rates in %, prices 1995
1996 19971998
estimate1999
estimate
A Agriculture, hunting, forestry 2.1 -2.1 1.0 2.0
B Fishing 9.6 -0.7 -5.0 1.0
C. Mining and quarrying 1.9 -1.4 0.5 0.0
D. Manufacturing 1.2 5.1 3.5 2.7
E. Electricity, gas and water supply 1.2 5.5 1.0 1.0
F. Construction 13.2 6.8 4.0 4.0
G. Wholesale and retail, trade, repair 3.0 2.5 4.0 3.0
H. Hotels and restaurants 4.4 5.1 4.5 4.0
I. Transport, storage, communications 2.6 4.3 4.6 4.5
J. Financial intermediation 5.2 2.4 5.5 4.0
K. Real estate, renting and business activities 3.6 2.8 3.8 3.5
L. Public administration and com. soc. sec. 5.3 4.8 4.0 4.0
M. Education 1.9 2.3 3.0 3.0
N. Health and social work 2.3 1.9 2.5 3.0
O. Other community, social and personal activities 4.7 5.3 5.5 5.3
FISIM 4.3 1.5 1.5 2.0
1. TOTAL VALUE ADDED, (basic prices) 3.1 3.8 3.7 3.3
2. CORRECTIONS 4.2 4.1 5.7 6.4
3. GROSS DOMESTIC PRODUCT (3 = 1 + 2) 3.3 3.8 4.0 3 3
TOTAL VALUE ADDED, (basic prices) 3.1 3.8 3.7 3.3
in which:
1. Agriculture, forestry , fishing (A + B) 2.2 -2.1 1.0 2.0
2. Industry and construction (C+D+E+F) 2.8 5.1 3.3 2.7
Industry (C+D+E) 1.2 4.9 3.2 2.4
Construction F 13.2 6.8 4.0 4.0
3. Services (G...O) 3.4 3.2 4.0 3.7
4. FISIM 4.3 1.5 1.5 2.0
Sources of data: SORS, IMAD's estimates.
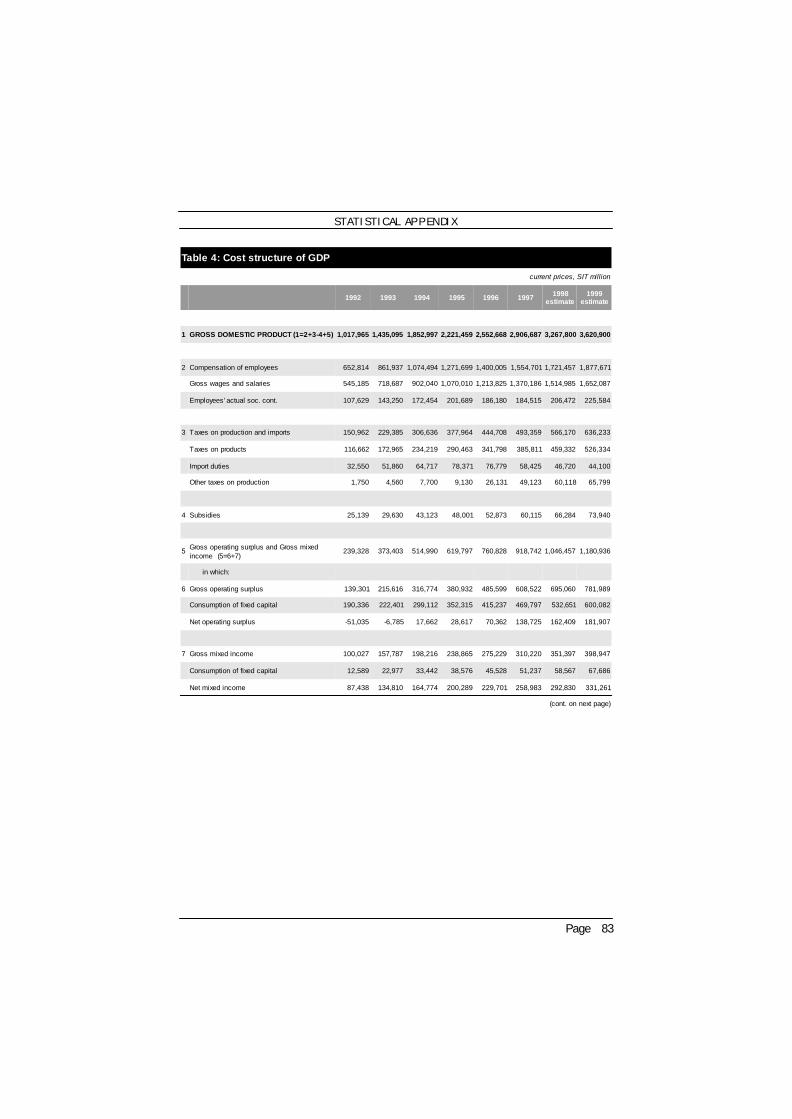
83Page
Table 4: Cost structure of GDP
current prices, SIT million
1992 1993 1994 1995 1996 1997 1998estimate
1999estimate
1 GROSS DOMESTIC PRODUCT (1=2+3-4+5) 1,017,965 1,435,095 1,852,997 2,221,459 2,552,668 2,906,687 3,267,800 3,620,900
2 Compensation of employees 652,814 861,937 1,074,494 1,271,699 1,400,005 1,554,701 1,721,457 1,877,671
Gross wages and salaries 545,185 718,687 902,040 1,070,010 1,213,825 1,370,186 1,514,985 1,652,087
Employees' actual soc. cont. 107,629 143,250 172,454 201,689 186,180 184,515 206,472 225,584
3 Taxes on production and imports 150,962 229,385 306,636 377,964 444,708 493,359 566,170 636,233
Taxes on products 116,662 172,965 234,219 290,463 341,798 385,811 459,332 526,334
Import duties 32,550 51,860 64,717 78,371 76,779 58,425 46,720 44,100
Other taxes on production 1,750 4,560 7,700 9,130 26,131 49,123 60,118 65,799
4 Subsidies 25,139 29,630 43,123 48,001 52,873 60,115 66,284 73,940
5 Gross operating surplus and Gross mixedincome (5=6+7)
239,328 373,403 514,990 619,797 760,828 918,742 1,046,457 1,180,936
in which:
6 Gross operating surplus 139,301 215,616 316,774 380,932 485,599 608,522 695,060 781,989
Consumption of fixed capital 190,336 222,401 299,112 352,315 415,237 469,797 532,651 600,082
Net operating surplus -51,035 -6,785 17,662 28,617 70,362 138,725 162,409 181,907
7 Gross mixed income 100,027 157,787 198,216 238,865 275,229 310,220 351,397 398,947
Consumption of fixed capital 12,589 22,977 33,442 38,576 45,528 51,237 58,567 67,686
Net mixed income 87,438 134,810 164,774 200,289 229,701 258,983 292,830 331,261
(cont. on next page)
STATISTICAL APPENDIX

IMAD AUTUMN REPORT 1998
84 Page
Table 5a : Expenditure on gross domestic product
current prices, SIT million
1992 1993 1994 1995 1996 1997 1998estimate
1999estimate
1 GROSS DOMESTIC PRODUCT (1=4+5+8) 1,017,965 1,435,095 1,852,997 2,221,459 2,552,668 2,906,687 3,267,800 3,620,900
2 EXPORTS OF GOODS AND SERVICES 642,772 843,148 1,111,321 1,225,659 1,419,884 1,660,733 1,802,363 1,924,320
3 IMPORTS OF GOODS AND SERVICES 571,953 827,540 1,070,777 1,262,128 1,445,023 1,694,631 1,844,820 1,985,088
4 EXTERNAL BALANCE OF GOODS AND SERVICES (4 = 2 - 3) 70,819 15,608 40,544 -36,469 -25,139 -33,898 -42,458 -60,768
5 FINAL CONSUMPTION (5 = 6 + 7) 768,124 1,141,855 1,424,453 1,738,562 1,980,982 2,252,739 2,516,563 2,777,862
6 PRIVATE FINAL CONSUMPTION 561,120 839,249 1,050,165 1,290,411 1,463,249 1,660,326 1,846,706 2,046,000
- households 548,668 823,459 1,033,094 1,266,058 1,437,756 1,631,311 1,814,594 2,011,280
- non-profit institutions 12,452 15,790 17,071 24,353 25,493 29,015 32,112 34,720
7 GOVERNMENT CONSUMPTION (individual and collective) 207,004 302,606 374,288 448,151 517,733 592,413 669,857 731,862
8 GROSS CAPITAL FORMATION (8 = 9 + 10) 179,022 277,632 388,000 519,366 596,825 687,846 793,695 903,805
9 GROSS FIXED CAPITAL FORMATION 189,608 270,237 372,663 475,605 573,355 682,672 784,051 890,166
10 CHANGES IN INVENTORIES -10,586 7,395 15,337 43,761 23,470 5,174 9,644 13,640
(cont. on next page)
STATISTICAL APPENDIX
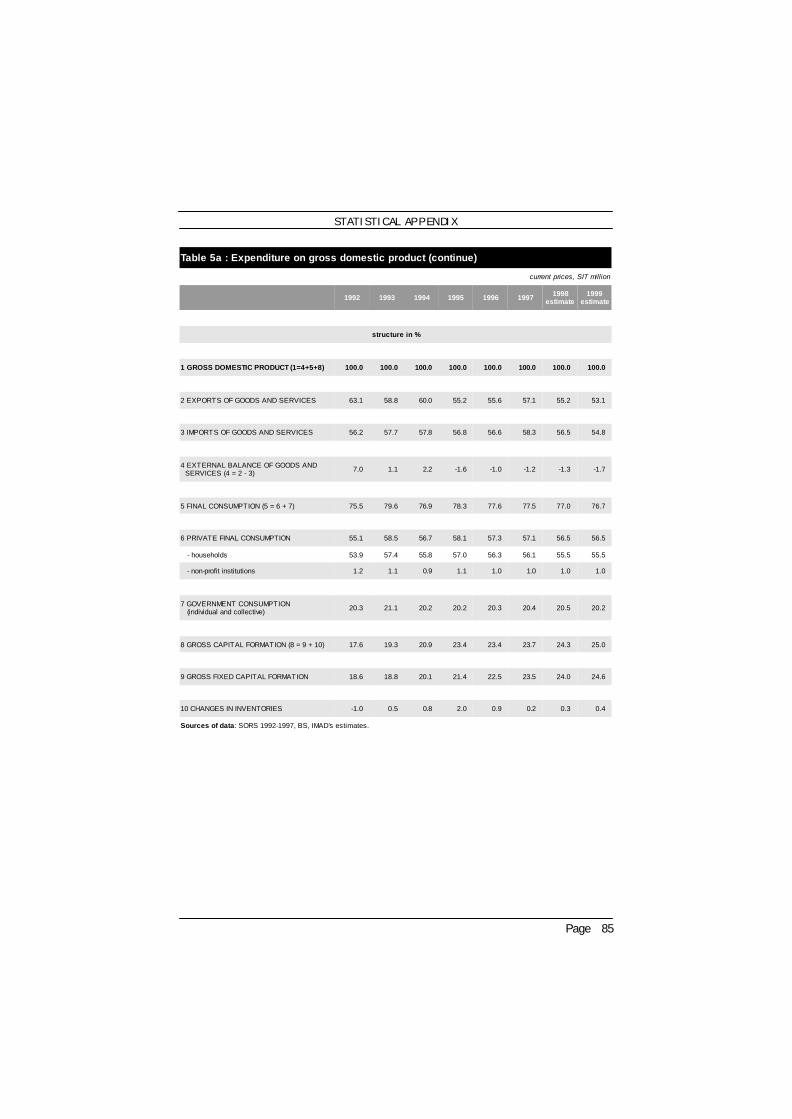
85Page
Table 5a : Expenditure on gross domestic product (continue)
current prices, SIT million
1992 1993 1994 1995 1996 1997 1998estimate
1999estimate
structure in %
1 GROSS DOMESTIC PRODUCT (1=4+5+8) 100.0 100.0 100.0 100.0 100.0 100.0 100.0 100.0
2 EXPORTS OF GOODS AND SERVICES 63.1 58.8 60.0 55.2 55.6 57.1 55.2 53.1
3 IMPORTS OF GOODS AND SERVICES 56.2 57.7 57.8 56.8 56.6 58.3 56.5 54.8
4 EXTERNAL BALANCE OF GOODS AND SERVICES (4 = 2 - 3) 7.0 1.1 2.2 -1.6 -1.0 -1.2 -1.3 -1.7
5 FINAL CONSUMPTION (5 = 6 + 7) 75.5 79.6 76.9 78.3 77.6 77.5 77.0 76.7
6 PRIVATE FINAL CONSUMPTION 55.1 58.5 56.7 58.1 57.3 57.1 56.5 56.5
- households 53.9 57.4 55.8 57.0 56.3 56.1 55.5 55.5
- non-profit institutions 1.2 1.1 0.9 1.1 1.0 1.0 1.0 1.0
7 GOVERNMENT CONSUMPTION (individual and collective) 20.3 21.1 20.2 20.2 20.3 20.4 20.5 20.2
8 GROSS CAPITAL FORMATION (8 = 9 + 10) 17.6 19.3 20.9 23.4 23.4 23.7 24.3 25.0
9 GROSS FIXED CAPITAL FORMATION 18.6 18.8 20.1 21.4 22.5 23.5 24.0 24.6
10 CHANGES IN INVENTORIES -1.0 0.5 0.8 2.0 0.9 0.2 0.3 0.4
Sources of data: SORS 1992-1997, BS, IMAD's estimates.
STATISTICAL APPENDIX
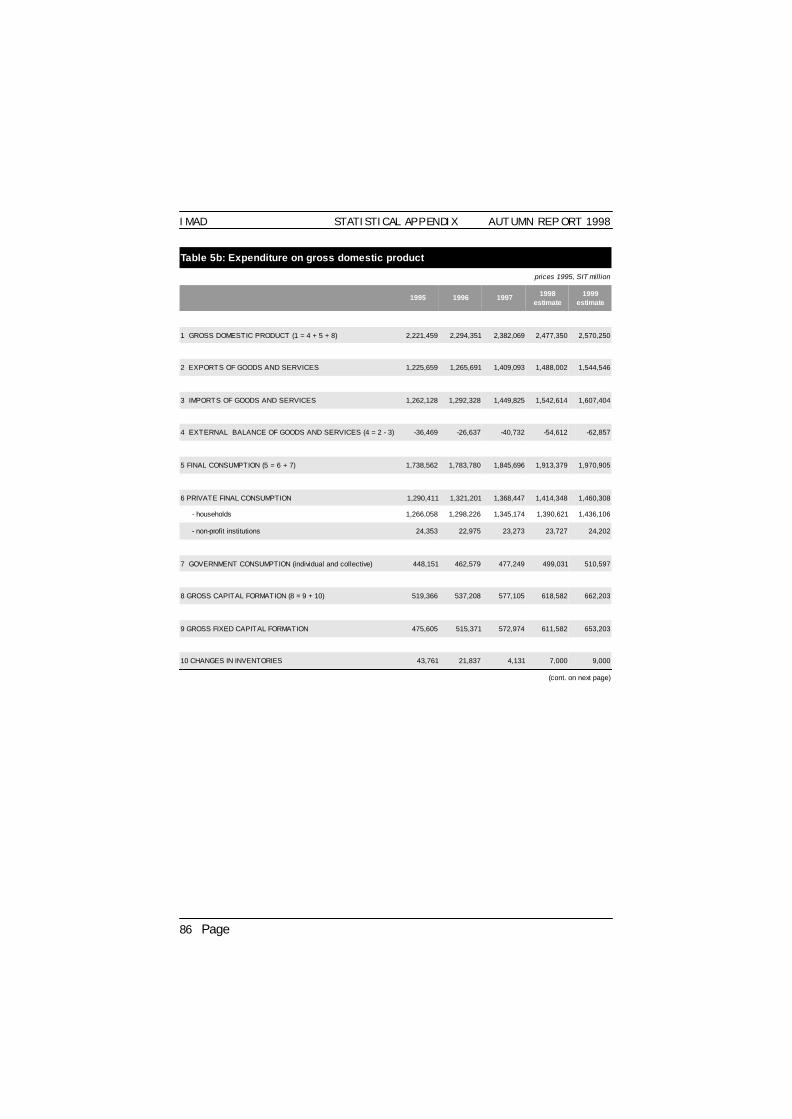
IMAD AUTUMN REPORT 1998
86 Page
Table 5b: Expenditure on gross domestic product
prices 1995, SIT million
1995 1996 1997 1998estimate
1999estimate
1 GROSS DOMESTIC PRODUCT (1 = 4 + 5 + 8) 2,221,459 2,294,351 2,382,069 2,477,350 2,570,250
2 EXPORTS OF GOODS AND SERVICES 1,225,659 1,265,691 1,409,093 1,488,002 1,544,546
3 IMPORTS OF GOODS AND SERVICES 1,262,128 1,292,328 1,449,825 1,542,614 1,607,404
4 EXTERNAL BALANCE OF GOODS AND SERVICES (4 = 2 - 3) -36,469 -26,637 -40,732 -54,612 -62,857
5 FINAL CONSUMPTION (5 = 6 + 7) 1,738,562 1,783,780 1,845,696 1,913,379 1,970,905
6 PRIVATE FINAL CONSUMPTION 1,290,411 1,321,201 1,368,447 1,414,348 1,460,308
- households 1,266,058 1,298,226 1,345,174 1,390,621 1,436,106
- non-profit institutions 24,353 22,975 23,273 23,727 24,202
7 GOVERNMENT CONSUMPTION (individual and collective) 448,151 462,579 477,249 499,031 510,597
8 GROSS CAPITAL FORMATION (8 = 9 + 10) 519,366 537,208 577,105 618,582 662,203
9 GROSS FIXED CAPITAL FORMATION 475,605 515,371 572,974 611,582 653,203
10 CHANGES IN INVENTORIES 43,761 21,837 4,131 7,000 9,000
(cont. on next page)
STATISTICAL APPENDIX
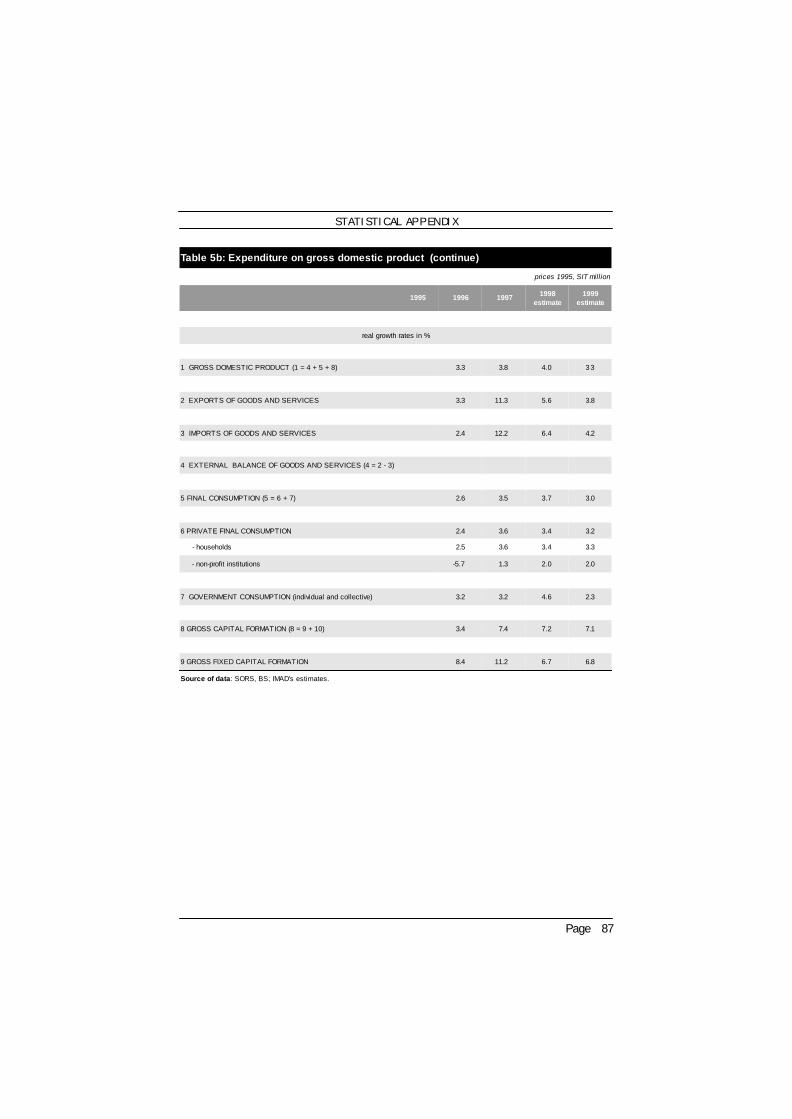
87Page
Table 5b: Expenditure on gross domestic product (continue)
prices 1995, SIT million
1995 1996 1997 1998estimate
1999estimate
real growth rates in %
1 GROSS DOMESTIC PRODUCT (1 = 4 + 5 + 8) 3.3 3.8 4.0 33
2 EXPORTS OF GOODS AND SERVICES 3.3 11.3 5.6 3.8
3 IMPORTS OF GOODS AND SERVICES 2.4 12.2 6.4 4.2
4 EXTERNAL BALANCE OF GOODS AND SERVICES (4 = 2 - 3)
5 FINAL CONSUMPTION (5 = 6 + 7) 2.6 3.5 3.7 3.0
6 PRIVATE FINAL CONSUMPTION 2.4 3.6 3.4 3.2
- households 2.5 3.6 3.4 3.3
- non-profit institutions -5.7 1.3 2.0 2.0
7 GOVERNMENT CONSUMPTION (individual and collective) 3.2 3.2 4.6 2.3
8 GROSS CAPITAL FORMATION (8 = 9 + 10) 3.4 7.4 7.2 7.1
9 GROSS FIXED CAPITAL FORMATION 8.4 11.2 6.7 6.8
Source of data: SORS, BS; IMAD's estimates.
STATISTICAL APPENDIX
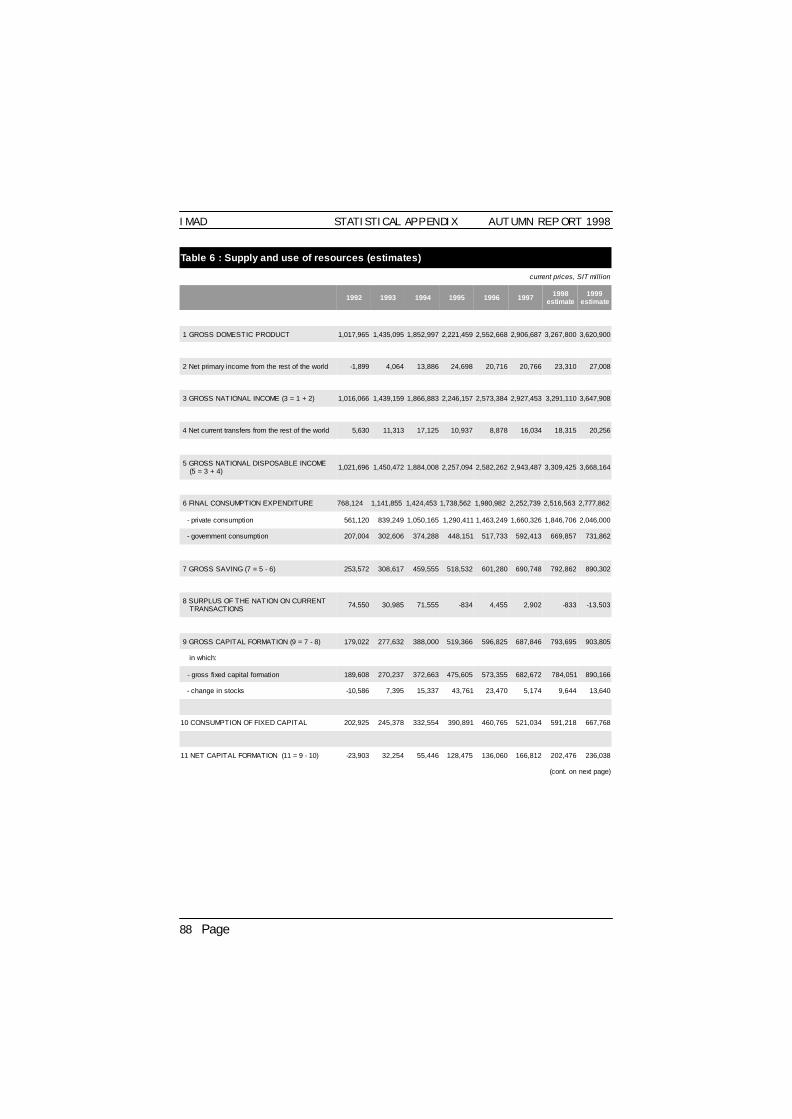
IMAD AUTUMN REPORT 1998
88 Page
Table 6 : Supply and use of resources (estimates)
current prices, SIT million
1992 1993 1994 1995 1996 1997 1998estimate
1999estimate
1 GROSS DOMESTIC PRODUCT 1,017,965 1,435,095 1,852,997 2,221,459 2,552,668 2,906,687 3,267,800 3,620,900
2 Net primary income from the rest of the world -1,899 4,064 13,886 24,698 20,716 20,766 23,310 27,008
3 GROSS NATIONAL INCOME (3 = 1 + 2) 1,016,066 1,439,159 1,866,883 2,246,157 2,573,384 2,927,453 3,291,110 3,647,908
4 Net current transfers from the rest of the world 5,630 11,313 17,125 10,937 8,878 16,034 18,315 20,256
5 GROSS NATIONAL DISPOSABLE INCOME (5 = 3 + 4) 1,021,696 1,450,472 1,884,008 2,257,094 2,582,262 2,943,487 3,309,425 3,668,164
6 FINAL CONSUMPTION EXPENDITURE 768,124 1,141,855 1,424,453 1,738,562 1,980,982 2,252,739 2,516,563 2,777,862
- private consumption 561,120 839,249 1,050,165 1,290,411 1,463,249 1,660,326 1,846,706 2,046,000
- government consumption 207,004 302,606 374,288 448,151 517,733 592,413 669,857 731,862
7 GROSS SAVING (7 = 5 - 6) 253,572 308,617 459,555 518,532 601,280 690,748 792,862 890,302
8 SURPLUS OF THE NATION ON CURRENT TRANSACTIONS 74,550 30,985 71,555 -834 4,455 2,902 -833 -13,503
9 GROSS CAPITAL FORMATION (9 = 7 - 8) 179,022 277,632 388,000 519,366 596,825 687,846 793,695 903,805
in which:
- gross fixed capital formation 189,608 270,237 372,663 475,605 573,355 682,672 784,051 890,166
- change in stocks -10,586 7,395 15,337 43,761 23,470 5,174 9,644 13,640
10 CONSUMPTION OF FIXED CAPITAL 202,925 245,378 332,554 390,891 460,765 521,034 591,218 667,768
11 NET CAPITAL FORMATION (11 = 9 - 10) -23,903 32,254 55,446 128,475 136,060 166,812 202,476 236,038
(cont. on next page)
STATISTICAL APPENDIX
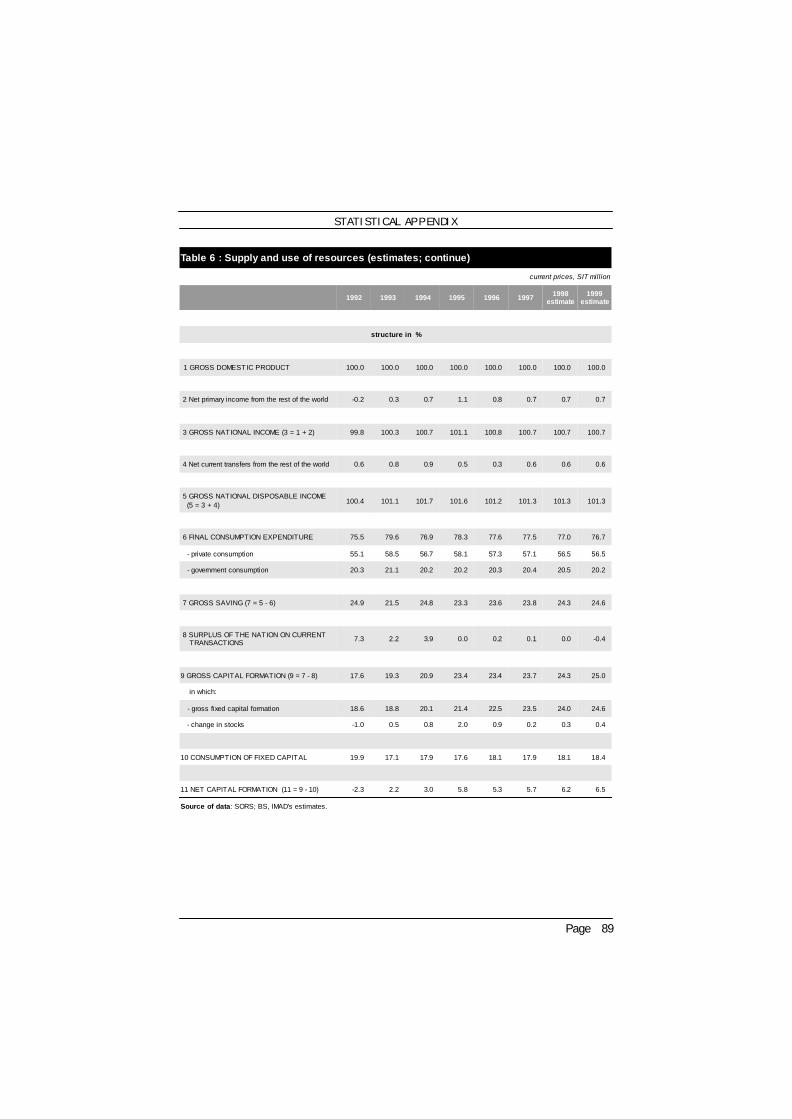
89Page
Table 6 : Supply and use of resources (estimates; continue)
current prices, SIT million
1992 1993 1994 1995 1996 1997 1998estimate
1999estimate
structure in %
1 GROSS DOMESTIC PRODUCT 100.0 100.0 100.0 100.0 100.0 100.0 100.0 100.0
2 Net primary income from the rest of the world -0.2 0.3 0.7 1.1 0.8 0.7 0.7 0.7
3 GROSS NATIONAL INCOME (3 = 1 + 2) 99.8 100.3 100.7 101.1 100.8 100.7 100.7 100.7
4 Net current transfers from the rest of the world 0.6 0.8 0.9 0.5 0.3 0.6 0.6 0.6
5 GROSS NATIONAL DISPOSABLE INCOME (5 = 3 + 4) 100.4 101.1 101.7 101.6 101.2 101.3 101.3 101.3
6 FINAL CONSUMPTION EXPENDITURE 75.5 79.6 76.9 78.3 77.6 77.5 77.0 76.7
- private consumption 55.1 58.5 56.7 58.1 57.3 57.1 56.5 56.5
- government consumption 20.3 21.1 20.2 20.2 20.3 20.4 20.5 20.2
7 GROSS SAVING (7 = 5 - 6) 24.9 21.5 24.8 23.3 23.6 23.8 24.3 24.6
8 SURPLUS OF THE NATION ON CURRENT TRANSACTIONS 7.3 2.2 3.9 0.0 0.2 0.1 0.0 -0.4
9 GROSS CAPITAL FORMATION (9 = 7 - 8) 17.6 19.3 20.9 23.4 23.4 23.7 24.3 25.0
in which:
- gross fixed capital formation 18.6 18.8 20.1 21.4 22.5 23.5 24.0 24.6
- change in stocks -1.0 0.5 0.8 2.0 0.9 0.2 0.3 0.4
10 CONSUMPTION OF FIXED CAPITAL 19.9 17.1 17.9 17.6 18.1 17.9 18.1 18.4
11 NET CAPITAL FORMATION (11 = 9 - 10) -2.3 2.2 3.0 5.8 5.3 5.7 6.2 6.5
Source of data: SORS; BS, IMAD's estimates.
STATISTICAL APPENDIX
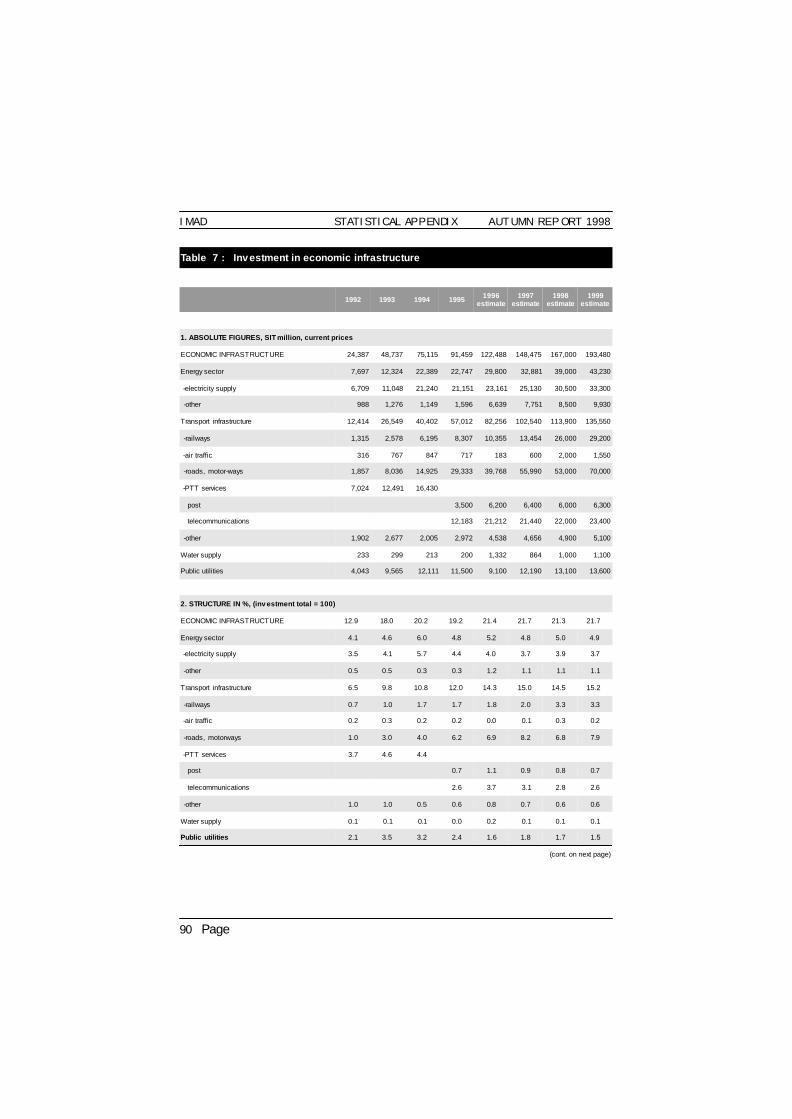
IMAD AUTUMN REPORT 1998
90 Page
Table 7 : Investment in economic infrastructure
1992 1993 1994 1995 1996estimate
1997estimate
1998estimate
1999estimate
1. ABSOLUTE FIGURES, SIT million, current prices
ECONOMIC INFRASTRUCTURE 24,387 48,737 75,115 91,459 122,488 148,475 167,000 193,480
Energy sector 7,697 12,324 22,389 22,747 29,800 32,881 39,000 43,230
-electricity supply 6,709 11,048 21,240 21,151 23,161 25,130 30,500 33,300
-other 988 1,276 1,149 1,596 6,639 7,751 8,500 9,930
Transport infrastructure 12,414 26,549 40,402 57,012 82,256 102,540 113,900 135,550
-railways 1,315 2,578 6,195 8,307 10,355 13,454 26,000 29,200
-air traffic 316 767 847 717 183 600 2,000 1,550
-roads, motor-ways 1,857 8,036 14,925 29,333 39,768 55,990 53,000 70,000
-PTT services 7,024 12,491 16,430
post 3,500 6,200 6,400 6,000 6,300
telecommunications 12,183 21,212 21,440 22,000 23,400
-other 1,902 2,677 2,005 2,972 4,538 4,656 4,900 5,100
Water supply 233 299 213 200 1,332 864 1,000 1,100
Public utilities 4,043 9,565 12,111 11,500 9,100 12,190 13,100 13,600
2. STRUCTURE IN %, (investment total = 100)
ECONOMIC INFRASTRUCTURE 12.9 18.0 20.2 19.2 21.4 21.7 21.3 21.7
Energy sector 4.1 4.6 6.0 4.8 5.2 4.8 5.0 4.9
-electricity supply 3.5 4.1 5.7 4.4 4.0 3.7 3.9 3.7
-other 0.5 0.5 0.3 0.3 1.2 1.1 1.1 1.1
Transport infrastructure 6.5 9.8 10.8 12.0 14.3 15.0 14.5 15.2
-railways 0.7 1.0 1.7 1.7 1.8 2.0 3.3 3.3
-air traffic 0.2 0.3 0.2 0.2 0.0 0.1 0.3 0.2
-roads, motorways 1.0 3.0 4.0 6.2 6.9 8.2 6.8 7.9
-PTT services 3.7 4.6 4.4
post 0.7 1.1 0.9 0.8 0.7
telecommunications 2.6 3.7 3.1 2.8 2.6
-other 1.0 1.0 0.5 0.6 0.8 0.7 0.6 0.6
Water supply 0.1 0.1 0.1 0.0 0.2 0.1 0.1 0.1
Public utilities 2.1 3.5 3.2 2.4 1.6 1.8 1.7 1.5
(cont. on next page)
STATISTICAL APPENDIX
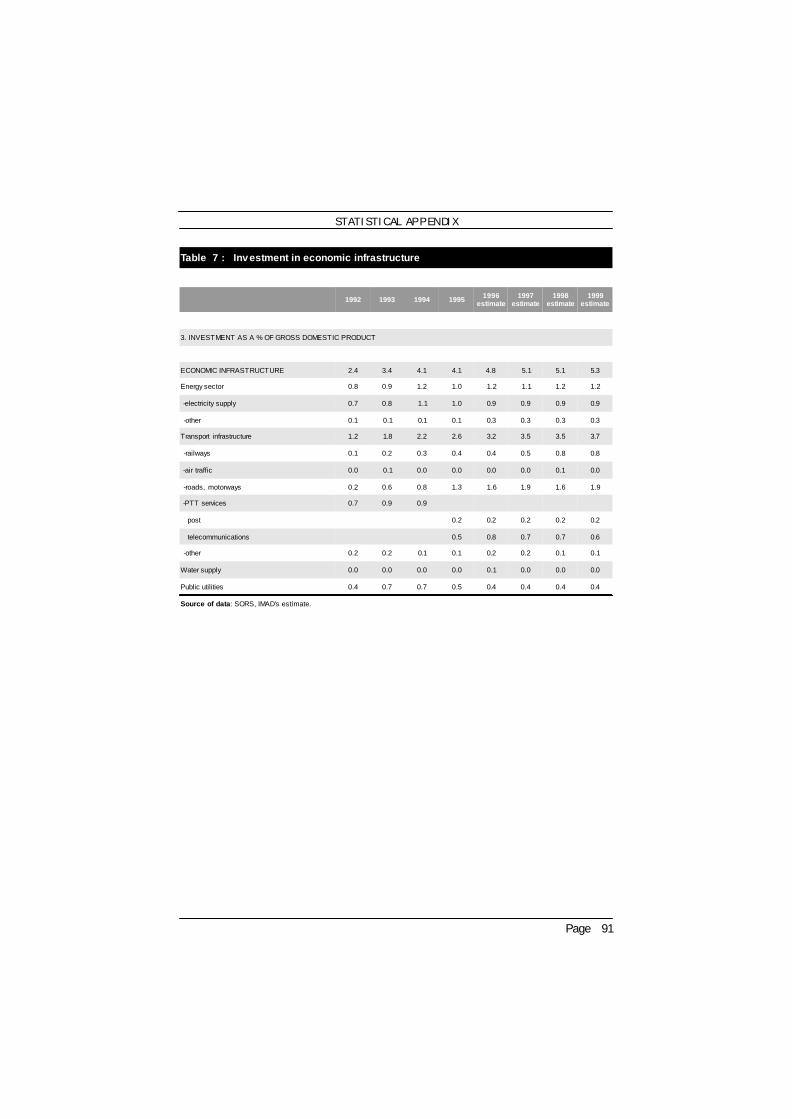
91Page
Table 7 : Investment in economic infrastructure
1992 1993 1994 1995 1996estimate
1997estimate
1998estimate
1999estimate
3. INVESTMENT AS A % OF GROSS DOMESTIC PRODUCT
ECONOMIC INFRASTRUCTURE 2.4 3.4 4.1 4.1 4.8 5.1 5.1 5.3
Energy sector 0.8 0.9 1.2 1.0 1.2 1.1 1.2 1.2
-electricity supply 0.7 0.8 1.1 1.0 0.9 0.9 0.9 0.9
-other 0.1 0.1 0.1 0.1 0.3 0.3 0.3 0.3
Transport infrastructure 1.2 1.8 2.2 2.6 3.2 3.5 3.5 3.7
-railways 0.1 0.2 0.3 0.4 0.4 0.5 0.8 0.8
-air traffic 0.0 0.1 0.0 0.0 0.0 0.0 0.1 0.0
-roads, motorways 0.2 0.6 0.8 1.3 1.6 1.9 1.6 1.9
-PTT services 0.7 0.9 0.9
post 0.2 0.2 0.2 0.2 0.2
telecommunications 0.5 0.8 0.7 0.7 0.6
-other 0.2 0.2 0.1 0.1 0.2 0.2 0.1 0.1
Water supply 0.0 0.0 0.0 0.0 0.1 0.0 0.0 0.0
Public utilities 0.4 0.7 0.7 0.5 0.4 0.4 0.4 0.4
Source of data: SORS, IMAD's estimate.
STATISTICAL APPENDIX
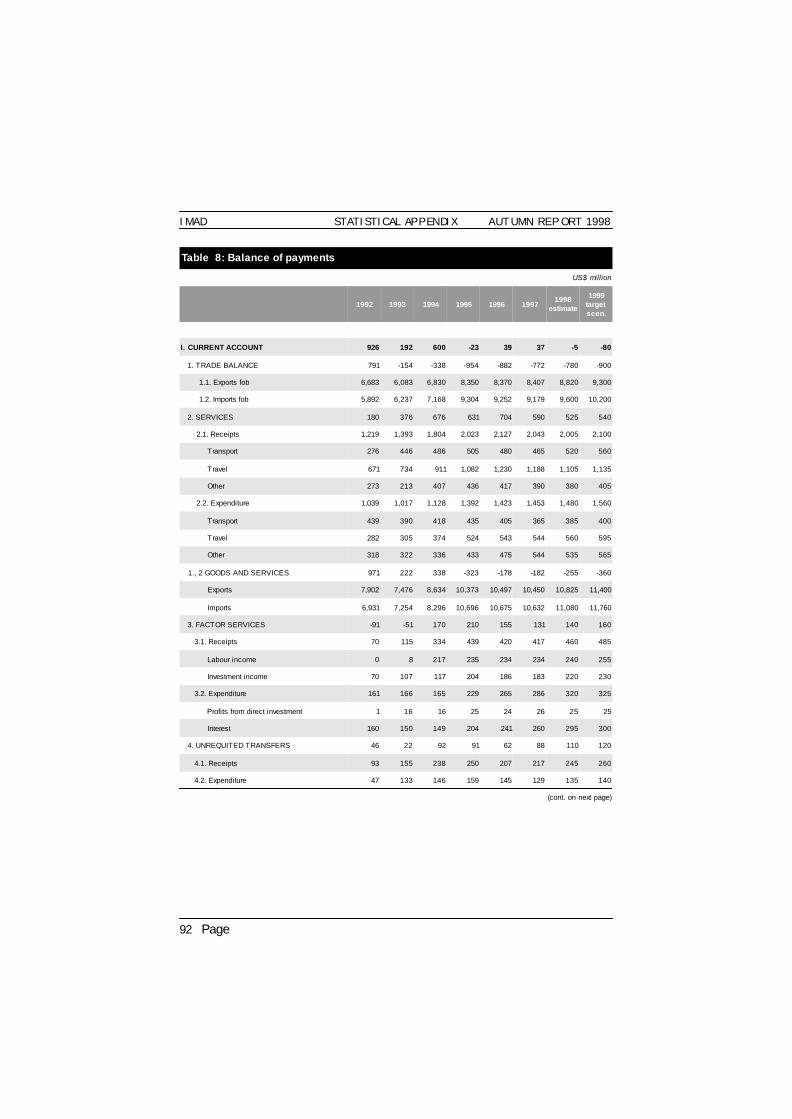
IMAD AUTUMN REPORT 1998
92 Page
Table 8: Balance of payments
US$ million
1992 1993 1994 1995 1996 19971998
estimate
1999targetscen.
I. CURRENT ACCOUNT 926 192 600 -23 39 37 -5 -80
1. TRADE BALANCE 791 -154 -338 -954 -882 -772 -780 -900
1.1. Exports fob 6,683 6,083 6,830 8,350 8,370 8,407 8,820 9,300
1.2. Imports fob 5,892 6,237 7,168 9,304 9,252 9,179 9,600 10,200
2. SERVICES 180 376 676 631 704 590 525 540
2.1. Receipts 1,219 1,393 1,804 2,023 2,127 2,043 2,005 2,100
Transport 276 446 486 505 480 465 520 560
Travel 671 734 911 1,082 1,230 1,188 1,105 1,135
Other 273 213 407 436 417 390 380 405
2.2. Expenditure 1,039 1,017 1,128 1,392 1,423 1,453 1,480 1,560
Transport 439 390 418 435 405 365 385 400
Travel 282 305 374 524 543 544 560 595
Other 318 322 336 433 475 544 535 565
1., 2 GOODS AND SERVICES 971 222 338 -323 -178 -182 -255 -360
Exports 7,902 7,476 8,634 10,373 10,497 10,450 10,825 11,400
Imports 6,931 7,254 8,296 10,696 10,675 10,632 11,080 11,760
3. FACTOR SERVICES -91 -51 170 210 155 131 140 160
3.1. Receipts 70 115 334 439 420 417 460 485
Labour income 0 8 217 235 234 234 240 255
Investment income 70 107 117 204 186 183 220 230
3.2. Expenditure 161 166 165 229 265 286 320 325
Profits from direct investment 1 16 16 25 24 26 25 25
Interest 160 150 149 204 241 260 295 300
4. UNREQUITED TRANSFERS 46 22 92 91 62 88 110 120
4.1. Receipts 93 155 238 250 207 217 245 260
4.2. Expenditure 47 133 146 159 145 129 135 140
(cont. on next page)
STATISTICAL APPENDIX

93Page
Table 8: Balance of payments (continue)
US$ million
1992 1993 1994 1995 1996 1997 1998estimate
1999estimate
II. CAPITAL AND FINANCIAL ACCOUNT -646 -202 -524 168 -47 -103
A CAPITAL ACCOUNT 4 -5 -18 -5 -4
1. Capital transfers 5 -3 -16 -2 -3
2. Non-produced non-financial assets -1 -2 -2 -3 -1
B FINANCIAL ACCOUNT -646 -206 -519 186 -42 -99
1. Direct investment 113 111 131 170 178 295
1.1. Foreign in Slovenia 111 112 128 176 186 321
1.2. Domestic abroad 2 -1 3 -6 -8 -26
2. Portfolio investment -9 3 -33 -13 637 236
3. Other long-term capital -117 -209 27 264 -270 657
3.1. Assets -158 -313 -306 -351 -426 288
3.2. Liabilities 41 104 333 615 156 369
4. International reserves -633 -111 -645 -235 -587 -1,287
III. STATISTICAL ERRORS -280 10 -76 -145 8 66
Source of data: SORS, BS, IMAD's estimates.Note: Exports & imports of goods by f.o.b. parity.
STATISTICAL APPENDIX
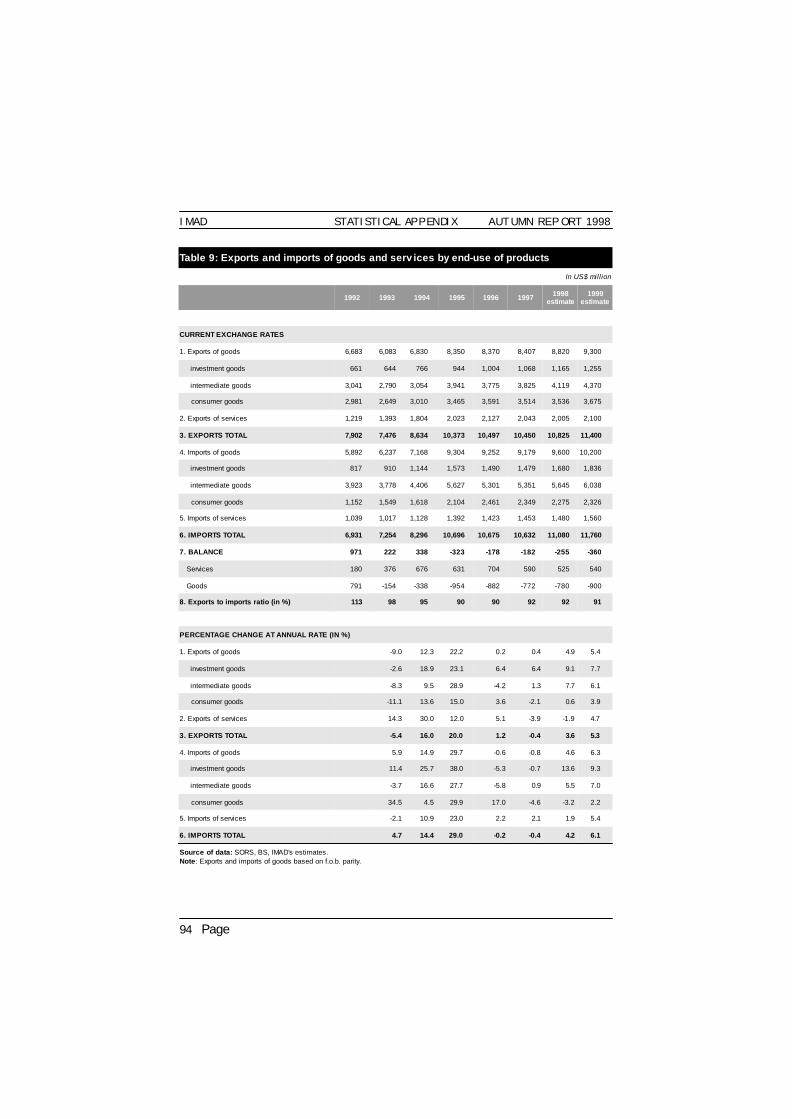
IMAD AUTUMN REPORT 1998
94 Page
Table 9: Exports and imports of goods and services by end-use of products
In US$ million
1992 1993 1994 1995 1996 1997 1998estimate
1999estimate
CURRENT EXCHANGE RATES
1. Exports of goods 6,683 6,083 6,830 8,350 8,370 8,407 8,820 9,300
investment goods 661 644 766 944 1,004 1,068 1,165 1,255
intermediate goods 3,041 2,790 3,054 3,941 3,775 3,825 4,119 4,370
consumer goods 2,981 2,649 3,010 3,465 3,591 3,514 3,536 3,675
2. Exports of services 1,219 1,393 1,804 2,023 2,127 2,043 2,005 2,100
3. EXPORTS TOTAL 7,902 7,476 8,634 10,373 10,497 10,450 10,825 11,400
4. Imports of goods 5,892 6,237 7,168 9,304 9,252 9,179 9,600 10,200
investment goods 817 910 1,144 1,573 1,490 1,479 1,680 1,836
intermediate goods 3,923 3,778 4,406 5,627 5,301 5,351 5,645 6,038
consumer goods 1,152 1,549 1,618 2,104 2,461 2,349 2,275 2,326
5. Imports of services 1,039 1,017 1,128 1,392 1,423 1,453 1,480 1,560
6. IMPORTS TOTAL 6,931 7,254 8,296 10,696 10,675 10,632 11,080 11,760
7. BALANCE 971 222 338 -323 -178 -182 -255 -360
Services 180 376 676 631 704 590 525 540
Goods 791 -154 -338 -954 -882 -772 -780 -900
8. Exports to imports ratio (in %) 113 98 95 90 90 92 92 91
PERCENTAGE CHANGE AT ANNUAL RATE (IN %)
1. Exports of goods -9.0 12.3 22.2 0.2 0.4 4.9 5.4
investment goods -2.6 18.9 23.1 6.4 6.4 9.1 7.7
intermediate goods -8.3 9.5 28.9 -4.2 1.3 7.7 6.1
consumer goods -11.1 13.6 15.0 3.6 -2.1 0.6 3.9
2. Exports of services 14.3 30.0 12.0 5.1 -3.9 -1.9 4.7
3. EXPORTS TOTAL -5.4 16.0 20.0 1.2 -0.4 3.6 5.3
4. Imports of goods 5.9 14.9 29.7 -0.6 -0.8 4.6 6.3
investment goods 11.4 25.7 38.0 -5.3 -0.7 13.6 9.3
intermediate goods -3.7 16.6 27.7 -5.8 0.9 5.5 7.0
consumer goods 34.5 4.5 29.9 17.0 -4.6 -3.2 2.2
5. Imports of services -2.1 10.9 23.0 2.2 2.1 1.9 5.4
6. IMPORTS TOTAL 4.7 14.4 29.0 -0.2 -0.4 4.2 6.1
Source of data: SORS, BS, IMAD's estimates.Note: Exports and imports of goods based on f.o.b. parity.
STATISTICAL APPENDIX
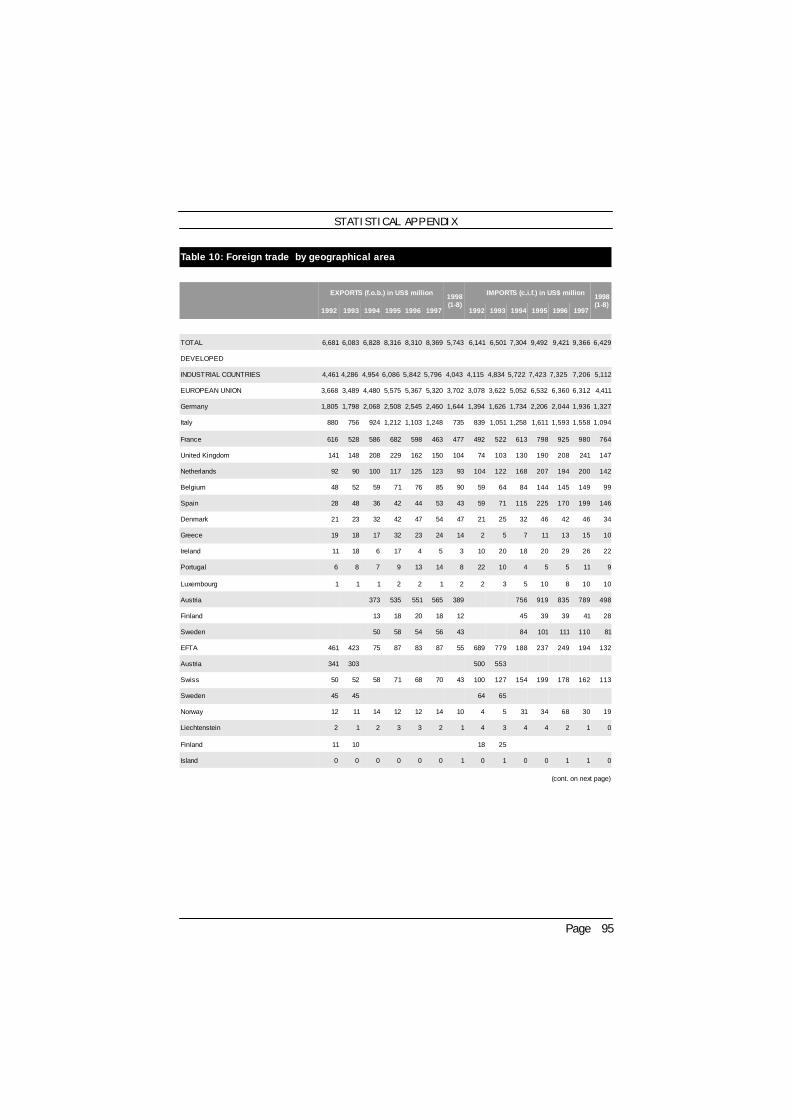
95Page
Table 10: Foreign trade by geographical area
EXPORTS (f.o.b.) in US$ million 1998(1-8)
IMPORTS (c.i.f.) in US$ million 1998(1-8)
1992 1993 1994 1995 1996 1997 1992 1993 1994 1995 1996 1997
TOTAL 6,681 6,083 6,828 8,316 8,310 8,369 5,743 6,141 6,501 7,304 9,492 9,421 9,366 6,429
DEVELOPED
INDUSTRIAL COUNTRIES 4,461 4,286 4,954 6,086 5,842 5,796 4,043 4,115 4,834 5,722 7,423 7,325 7,206 5,112
EUROPEAN UNION 3,668 3,489 4,480 5,575 5,367 5,320 3,702 3,078 3,622 5,052 6,532 6,360 6,312 4,411
Germany 1,805 1,798 2,068 2,508 2,545 2,460 1,644 1,394 1,626 1,734 2,206 2,044 1,936 1,327
Italy 880 756 924 1,212 1,103 1,248 735 839 1,051 1,258 1,611 1,593 1,558 1,094
France 616 528 586 682 598 463 477 492 522 613 798 925 980 764
United Kingdom 141 148 208 229 162 150 104 74 103 130 190 208 241 147
Netherlands 92 90 100 117 125 123 93 104 122 168 207 194 200 142
Belgium 48 52 59 71 76 85 90 59 64 84 144 145 149 99
Spain 28 48 36 42 44 53 43 59 71 115 225 170 199 146
Denmark 21 23 32 42 47 54 47 21 25 32 46 42 46 34
Greece 19 18 17 32 23 24 14 2 5 7 11 13 15 10
Ireland 11 18 6 17 4 5 3 10 20 18 20 29 26 22
Portugal 6 8 7 9 13 14 8 22 10 4 5 5 11 9
Luxembourg 1 1 1 2 2 1 2 2 3 5 10 8 10 10
Austria 373 535 551 565 389 756 919 835 789 498
Finland 13 18 20 18 12 45 39 39 41 28
Sweden 50 58 54 56 43 84 101 111 110 81
EFTA 461 423 75 87 83 87 55 689 779 188 237 249 194 132
Austria 341 303 500 553
Swiss 50 52 58 71 68 70 43 100 127 154 199 178 162 113
Sweden 45 45 64 65
Norway 12 11 14 12 12 14 10 4 5 31 34 68 30 19
Liechtenstein 2 1 2 3 3 2 1 4 3 4 4 2 1 0
Finland 11 10 18 25
Island 0 0 0 0 0 0 1 0 1 0 0 1 1 0
(cont. on next page)
STATISTICAL APPENDIX
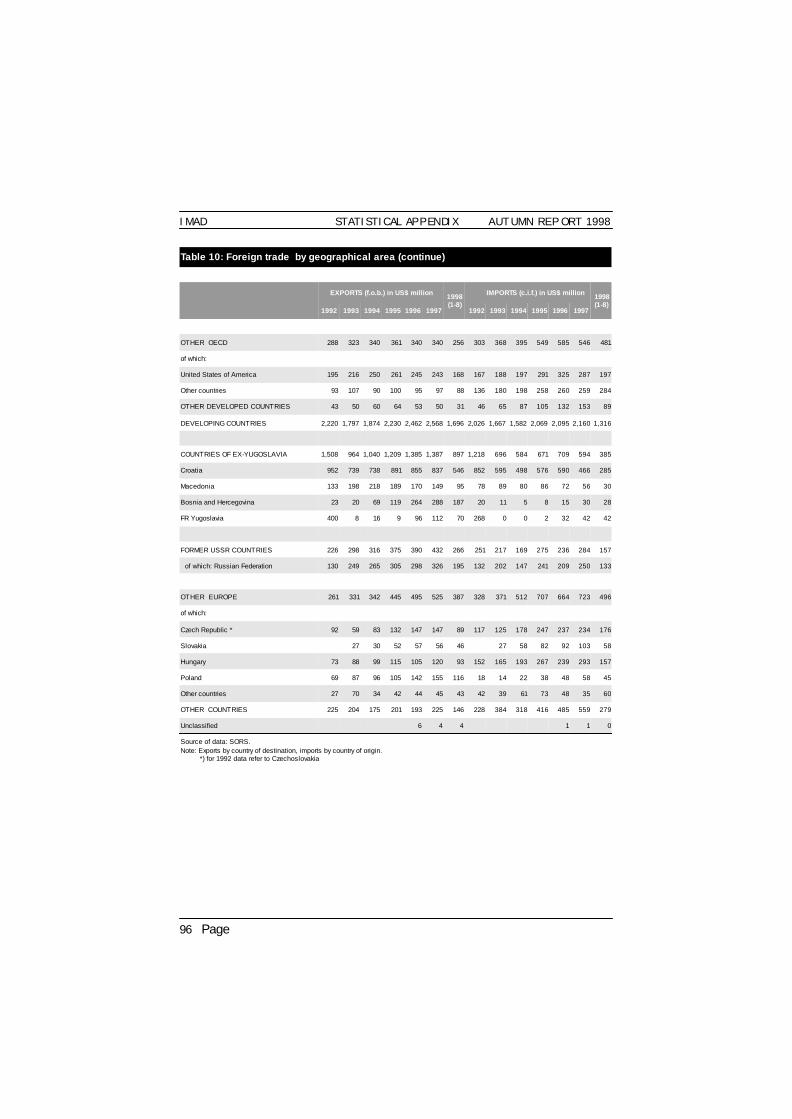
IMAD AUTUMN REPORT 1998
96 Page
Table 10: Foreign trade by geographical area (continue)
EXPORTS (f.o.b.) in US$ million 1998(1-8)
IMPORTS (c.i.f.) in US$ million 1998(1-8)
1992 1993 1994 1995 1996 1997 1992 1993 1994 1995 1996 1997
OTHER OECD 288 323 340 361 340 340 256 303 368 395 549 585 546 481
of which:
United States of America 195 216 250 261 245 243 168 167 188 197 291 325 287 197
Other countries 93 107 90 100 95 97 88 136 180 198 258 260 259 284
OTHER DEVELOPED COUNTRIES 43 50 60 64 53 50 31 46 65 87 105 132 153 89
DEVELOPING COUNTRIES 2,220 1,797 1,874 2,230 2,462 2,568 1,696 2,026 1,667 1,582 2,069 2,095 2,160 1,316
COUNTRIES OF EX-YUGOSLAVIA 1,508 964 1,040 1,209 1,385 1,387 897 1,218 696 584 671 709 594 385
Croatia 952 739 738 891 855 837 546 852 595 498 576 590 466 285
Macedonia 133 198 218 189 170 149 95 78 89 80 86 72 56 30
Bosnia and Hercegovina 23 20 69 119 264 288 187 20 11 5 8 15 30 28
FR Yugoslavia 400 8 16 9 96 112 70 268 0 0 2 32 42 42
FORMER USSR COUNTRIES 226 298 316 375 390 432 266 251 217 169 275 236 284 157
of which: Russian Federation 130 249 265 305 298 326 195 132 202 147 241 209 250 133
OTHER EUROPE 261 331 342 445 495 525 387 328 371 512 707 664 723 496
of which:
Czech Republic * 92 59 83 132 147 147 89 117 125 178 247 237 234 176
Slovakia 27 30 52 57 56 46 27 58 82 92 103 58
Hungary 73 88 99 115 105 120 93 152 165 193 267 239 293 157
Poland 69 87 96 105 142 155 116 18 14 22 38 48 58 45
Other countries 27 70 34 42 44 45 43 42 39 61 73 48 35 60
OTHER COUNTRIES 225 204 175 201 193 225 146 228 384 318 416 485 559 279
Unclassified 6 4 4 1 1 0
Source of data: SORS.Note: Exports by country of destination, imports by country of origin. *) for 1992 data refer to Czechoslovakia
STATISTICAL APPENDIX
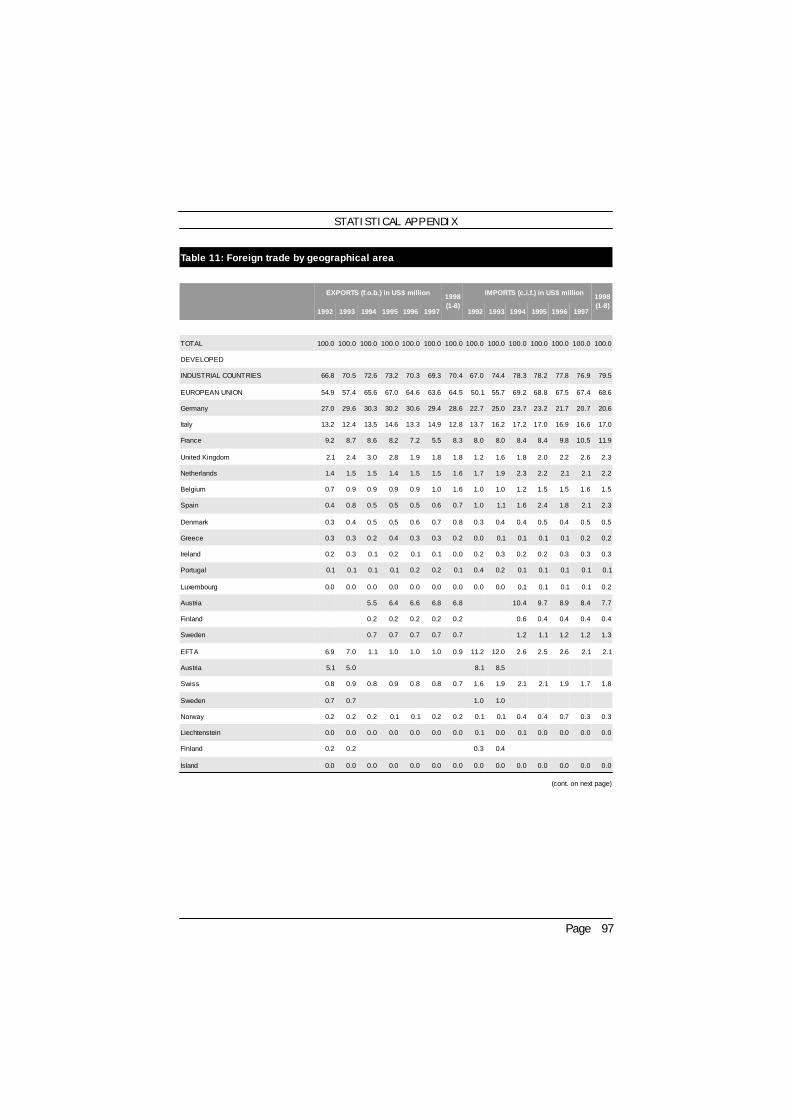
97Page
Table 11: Foreign trade by geographical area
EXPORTS (f.o.b.) in US$ million 1998(1-8)
IMPORTS (c.i.f.) in US$ million 1998(1-8)
1992 1993 1994 1995 1996 1997 1992 1993 1994 1995 1996 1997
TOTAL 100.0 100.0 100.0 100.0 100.0 100.0 100.0 100.0 100.0 100.0 100.0 100.0 100.0 100.0
DEVELOPED
INDUSTRIAL COUNTRIES 66.8 70.5 72.6 73.2 70.3 69.3 70.4 67.0 74.4 78.3 78.2 77.8 76.9 79.5
EUROPEAN UNION 54.9 57.4 65.6 67.0 64.6 63.6 64.5 50.1 55.7 69.2 68.8 67.5 67.4 68.6
Germany 27.0 29.6 30.3 30.2 30.6 29.4 28.6 22.7 25.0 23.7 23.2 21.7 20.7 20.6
Italy 13.2 12.4 13.5 14.6 13.3 14.9 12.8 13.7 16.2 17.2 17.0 16.9 16.6 17.0
France 9.2 8.7 8.6 8.2 7.2 5.5 8.3 8.0 8.0 8.4 8.4 9.8 10.5 11.9
United Kingdom 2.1 2.4 3.0 2.8 1.9 1.8 1.8 1.2 1.6 1.8 2.0 2.2 2.6 2.3
Netherlands 1.4 1.5 1.5 1.4 1.5 1.5 1.6 1.7 1.9 2.3 2.2 2.1 2.1 2.2
Belgium 0.7 0.9 0.9 0.9 0.9 1.0 1.6 1.0 1.0 1.2 1.5 1.5 1.6 1.5
Spain 0.4 0.8 0.5 0.5 0.5 0.6 0.7 1.0 1.1 1.6 2.4 1.8 2.1 2.3
Denmark 0.3 0.4 0.5 0.5 0.6 0.7 0.8 0.3 0.4 0.4 0.5 0.4 0.5 0.5
Greece 0.3 0.3 0.2 0.4 0.3 0.3 0.2 0.0 0.1 0.1 0.1 0.1 0.2 0.2
Ireland 0.2 0.3 0.1 0.2 0.1 0.1 0.0 0.2 0.3 0.2 0.2 0.3 0.3 0.3
Portugal 0.1 0.1 0.1 0.1 0.2 0.2 0.1 0.4 0.2 0.1 0.1 0.1 0.1 0.1
Luxembourg 0.0 0.0 0.0 0.0 0.0 0.0 0.0 0.0 0.0 0.1 0.1 0.1 0.1 0.2
Austria 5.5 6.4 6.6 6.8 6.8 10.4 9.7 8.9 8.4 7.7
Finland 0.2 0.2 0.2 0.2 0.2 0.6 0.4 0.4 0.4 0.4
Sweden 0.7 0.7 0.7 0.7 0.7 1.2 1.1 1.2 1.2 1.3
EFTA 6.9 7.0 1.1 1.0 1.0 1.0 0.9 11.2 12.0 2.6 2.5 2.6 2.1 2.1
Austria 5.1 5.0 8.1 8.5
Swiss 0.8 0.9 0.8 0.9 0.8 0.8 0.7 1.6 1.9 2.1 2.1 1.9 1.7 1.8
Sweden 0.7 0.7 1.0 1.0
Norway 0.2 0.2 0.2 0.1 0.1 0.2 0.2 0.1 0.1 0.4 0.4 0.7 0.3 0.3
Liechtenstein 0.0 0.0 0.0 0.0 0.0 0.0 0.0 0.1 0.0 0.1 0.0 0.0 0.0 0.0
Finland 0.2 0.2 0.3 0.4
Island 0.0 0.0 0.0 0.0 0.0 0.0 0.0 0.0 0.0 0.0 0.0 0.0 0.0 0.0
(cont. on next page)
STATISTICAL APPENDIX
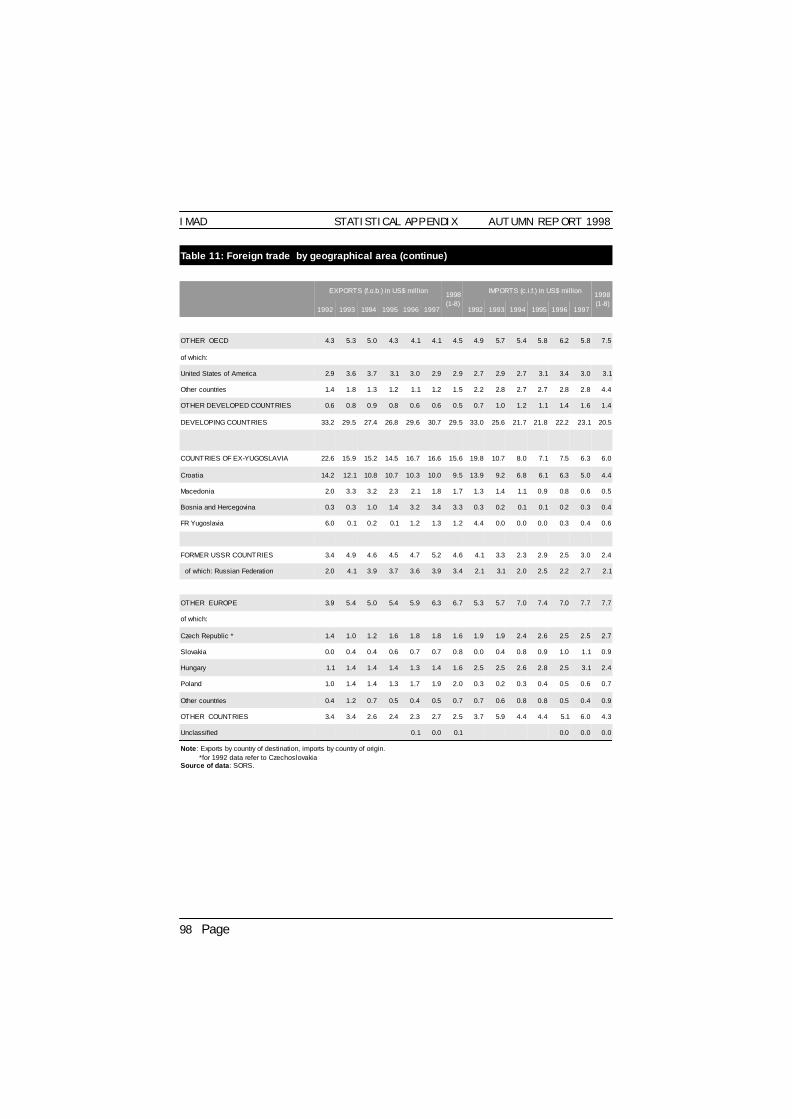
IMAD AUTUMN REPORT 1998
98 Page
Table 11: Foreign trade by geographical area (continue)
EXPORTS (f.o.b.) in US$ million 1998(1-8)
IMPORTS (c.i.f.) in US$ million 1998(1-8)
1992 1993 1994 1995 1996 1997 1992 1993 1994 1995 1996 1997
OTHER OECD 4.3 5.3 5.0 4.3 4.1 4.1 4.5 4.9 5.7 5.4 5.8 6.2 5.8 7.5
of which:
United States of America 2.9 3.6 3.7 3.1 3.0 2.9 2.9 2.7 2.9 2.7 3.1 3.4 3.0 3.1
Other countries 1.4 1.8 1.3 1.2 1.1 1.2 1.5 2.2 2.8 2.7 2.7 2.8 2.8 4.4
OTHER DEVELOPED COUNTRIES 0.6 0.8 0.9 0.8 0.6 0.6 0.5 0.7 1.0 1.2 1.1 1.4 1.6 1.4
DEVELOPING COUNTRIES 33.2 29.5 27.4 26.8 29.6 30.7 29.5 33.0 25.6 21.7 21.8 22.2 23.1 20.5
COUNTRIES OF EX-YUGOSLAVIA 22.6 15.9 15.2 14.5 16.7 16.6 15.6 19.8 10.7 8.0 7.1 7.5 6.3 6.0
Croatia 14.2 12.1 10.8 10.7 10.3 10.0 9.5 13.9 9.2 6.8 6.1 6.3 5.0 4.4
Macedonia 2.0 3.3 3.2 2.3 2.1 1.8 1.7 1.3 1.4 1.1 0.9 0.8 0.6 0.5
Bosnia and Hercegovina 0.3 0.3 1.0 1.4 3.2 3.4 3.3 0.3 0.2 0.1 0.1 0.2 0.3 0.4
FR Yugoslavia 6.0 0.1 0.2 0.1 1.2 1.3 1.2 4.4 0.0 0.0 0.0 0.3 0.4 0.6
FORMER USSR COUNTRIES 3.4 4.9 4.6 4.5 4.7 5.2 4.6 4.1 3.3 2.3 2.9 2.5 3.0 2.4
of which: Russian Federation 2.0 4.1 3.9 3.7 3.6 3.9 3.4 2.1 3.1 2.0 2.5 2.2 2.7 2.1
OTHER EUROPE 3.9 5.4 5.0 5.4 5.9 6.3 6.7 5.3 5.7 7.0 7.4 7.0 7.7 7.7
of which:
Czech Republic * 1.4 1.0 1.2 1.6 1.8 1.8 1.6 1.9 1.9 2.4 2.6 2.5 2.5 2.7
Slovakia 0.0 0.4 0.4 0.6 0.7 0.7 0.8 0.0 0.4 0.8 0.9 1.0 1.1 0.9
Hungary 1.1 1.4 1.4 1.4 1.3 1.4 1.6 2.5 2.5 2.6 2.8 2.5 3.1 2.4
Poland 1.0 1.4 1.4 1.3 1.7 1.9 2.0 0.3 0.2 0.3 0.4 0.5 0.6 0.7
Other countries 0.4 1.2 0.7 0.5 0.4 0.5 0.7 0.7 0.6 0.8 0.8 0.5 0.4 0.9
OTHER COUNTRIES 3.4 3.4 2.6 2.4 2.3 2.7 2.5 3.7 5.9 4.4 4.4 5.1 6.0 4.3
Unclassified 0.1 0.0 0.1 0.0 0.0 0.0
Note: Exports by country of destination, imports by country of origin. *for 1992 data refer to CzechoslovakiaSource of data: SORS.
STATISTICAL APPENDIX
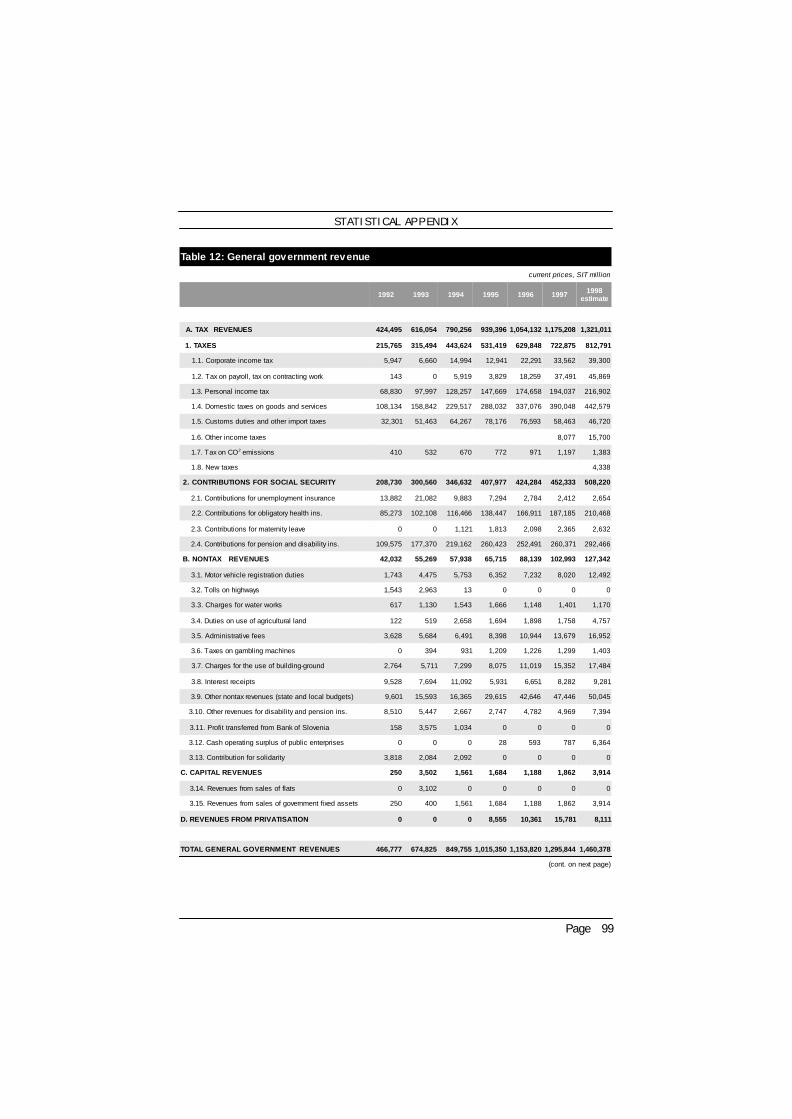
99Page
Table 12: General government revenue
current prices, SIT million
1992 1993 1994 1995 1996 1997 1998estimate
A. TAX REVENUES 424,495 616,054 790,256 939,396 1,054,132 1,175,208 1,321,011
1. TAXES 215,765 315,494 443,624 531,419 629,848 722,875 812,791
1.1. Corporate income tax 5,947 6,660 14,994 12,941 22,291 33,562 39,300
1.2. Tax on payroll, tax on contracting work 143 0 5,919 3,829 18,259 37,491 45,869
1.3. Personal income tax 68,830 97,997 128,257 147,669 174,658 194,037 216,902
1.4. Domestic taxes on goods and services 108,134 158,842 229,517 288,032 337,076 390,048 442,579
1.5. Customs duties and other import taxes 32,301 51,463 64,267 78,176 76,593 58,463 46,720
1.6. Other income taxes 8,077 15,700
1.7. Tax on CO 2 emissions 410 532 670 772 971 1,197 1,383
1.8. New taxes 4,338
2. CONTRIBUTIONS FOR SOCIAL SECURITY 208,730 300,560 346,632 407,977 424,284 452,333 508,220
2.1. Contributions for unemployment insurance 13,882 21,082 9,883 7,294 2,784 2,412 2,654
2.2. Contributions for obligatory health ins. 85,273 102,108 116,466 138,447 166,911 187,185 210,468
2.3. Contributions for maternity leave 0 0 1,121 1,813 2,098 2,365 2,632
2.4. Contributions for pension and disability ins. 109,575 177,370 219,162 260,423 252,491 260,371 292,466
B. NONTAX REVENUES 42,032 55,269 57,938 65,715 88,139 102,993 127,342
3.1. Motor vehicle registration duties 1,743 4,475 5,753 6,352 7,232 8,020 12,492
3.2. Tolls on highways 1,543 2,963 13 0 0 0 0
3.3. Charges for water works 617 1,130 1,543 1,666 1,148 1,401 1,170
3.4. Duties on use of agricultural land 122 519 2,658 1,694 1,898 1,758 4,757
3.5. Administrative fees 3,628 5,684 6,491 8,398 10,944 13,679 16,952
3.6. Taxes on gambling machines 0 394 931 1,209 1,226 1,299 1,403
3.7. Charges for the use of building-ground 2,764 5,711 7,299 8,075 11,019 15,352 17,484
3.8. Interest receipts 9,528 7,694 11,092 5,931 6,651 8,282 9,281
3.9. Other nontax revenues (state and local budgets) 9,601 15,593 16,365 29,615 42,646 47,446 50,045
3.10. Other revenues for disability and pension ins. 8,510 5,447 2,667 2,747 4,782 4,969 7,394
3.11. Profit transferred from Bank of Slovenia 158 3,575 1,034 0 0 0 0
3.12. Cash operating surplus of public enterprises 0 0 0 28 593 787 6,364
3.13. Contribution for solidarity 3,818 2,084 2,092 0 0 0 0
C. CAPITAL REVENUES 250 3,502 1,561 1,684 1,188 1,862 3,914
3.14. Revenues from sales of flats 0 3,102 0 0 0 0 0
3.15. Revenues from sales of government fixed assets 250 400 1,561 1,684 1,188 1,862 3,914
D. REVENUES FROM PRIVATISATION 0 0 0 8,555 10,361 15,781 8,111
TOTAL GENERAL GOVERNMENT REVENUES 466,777 674,825 849,755 1,015,350 1,153,820 1,295,844 1,460,378
(cont. on next page)
STATISTICAL APPENDIX
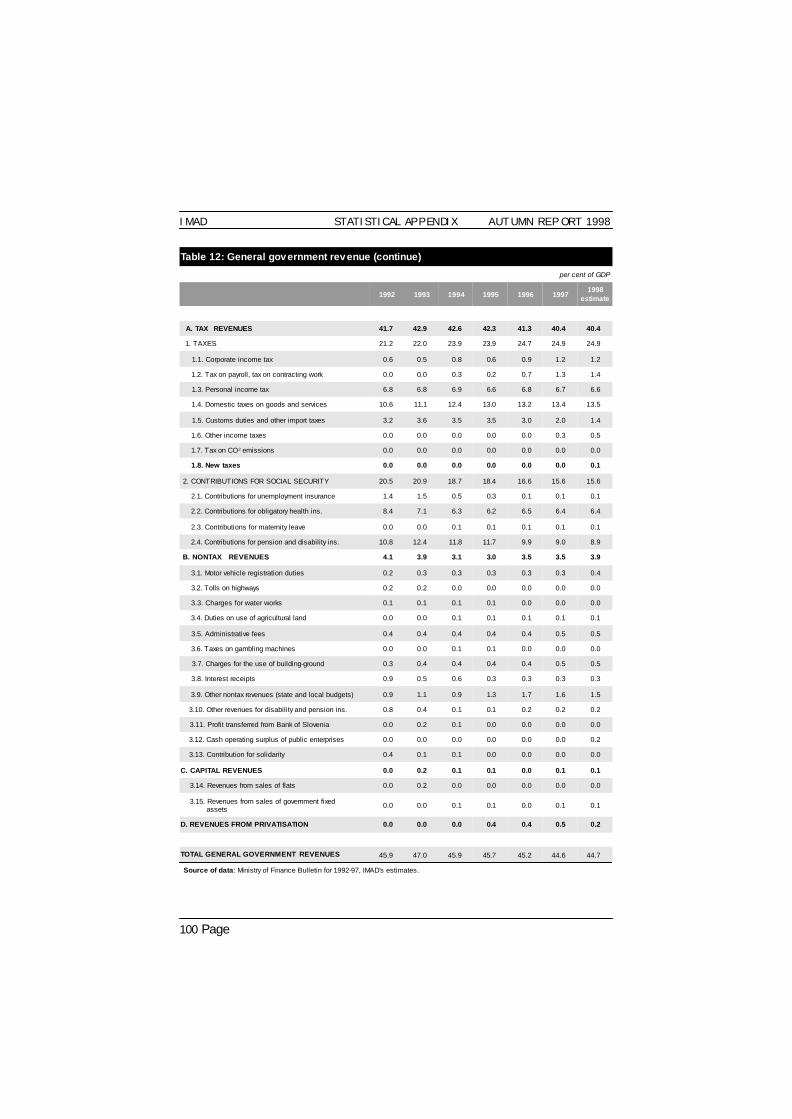
IMAD AUTUMN REPORT 1998
100 Page
Table 12: General government revenue (continue)
per cent of GDP
1992 1993 1994 1995 1996 19971998
estimate
A. TAX REVENUES 41.7 42.9 42.6 42.3 41.3 40.4 40.4
1. TAXES 21.2 22.0 23.9 23.9 24.7 24.9 24.9
1.1. Corporate income tax 0.6 0.5 0.8 0.6 0.9 1.2 1.2
1.2. Tax on payroll, tax on contracting work 0.0 0.0 0.3 0.2 0.7 1.3 1.4
1.3. Personal income tax 6.8 6.8 6.9 6.6 6.8 6.7 6.6
1.4. Domestic taxes on goods and services 10.6 11.1 12.4 13.0 13.2 13.4 13.5
1.5. Customs duties and other import taxes 3.2 3.6 3.5 3.5 3.0 2.0 1.4
1.6. Other income taxes 0.0 0.0 0.0 0.0 0.0 0.3 0.5
1.7. Tax on CO 2 emissions 0.0 0.0 0.0 0.0 0.0 0.0 0.0
1.8. New taxes 0.0 0.0 0.0 0.0 0.0 0.0 0.1
2. CONTRIBUTIONS FOR SOCIAL SECURITY 20.5 20.9 18.7 18.4 16.6 15.6 15.6
2.1. Contributions for unemployment insurance 1.4 1.5 0.5 0.3 0.1 0.1 0.1
2.2. Contributions for obligatory health ins. 8.4 7.1 6.3 6.2 6.5 6.4 6.4
2.3. Contributions for maternity leave 0.0 0.0 0.1 0.1 0.1 0.1 0.1
2.4. Contributions for pension and disability ins. 10.8 12.4 11.8 11.7 9.9 9.0 8.9
B. NONTAX REVENUES 4.1 3.9 3.1 3.0 3.5 3.5 3.9
3.1. Motor vehicle registration duties 0.2 0.3 0.3 0.3 0.3 0.3 0.4
3.2. Tolls on highways 0.2 0.2 0.0 0.0 0.0 0.0 0.0
3.3. Charges for water works 0.1 0.1 0.1 0.1 0.0 0.0 0.0
3.4. Duties on use of agricultural land 0.0 0.0 0.1 0.1 0.1 0.1 0.1
3.5. Administrative fees 0.4 0.4 0.4 0.4 0.4 0.5 0.5
3.6. Taxes on gambling machines 0.0 0.0 0.1 0.1 0.0 0.0 0.0
3.7. Charges for the use of building-ground 0.3 0.4 0.4 0.4 0.4 0.5 0.5
3.8. Interest receipts 0.9 0.5 0.6 0.3 0.3 0.3 0.3
3.9. Other nontax revenues (state and local budgets) 0.9 1.1 0.9 1.3 1.7 1.6 1.5
3.10. Other revenues for disability and pension ins. 0.8 0.4 0.1 0.1 0.2 0.2 0.2
3.11. Profit transferred from Bank of Slovenia 0.0 0.2 0.1 0.0 0.0 0.0 0.0
3.12. Cash operating surplus of public enterprises 0.0 0.0 0.0 0.0 0.0 0.0 0.2
3.13. Contribution for solidarity 0.4 0.1 0.1 0.0 0.0 0.0 0.0
C. CAPITAL REVENUES 0.0 0.2 0.1 0.1 0.0 0.1 0.1
3.14. Revenues from sales of flats 0.0 0.2 0.0 0.0 0.0 0.0 0.0
3.15. Revenues from sales of government fixed assets 0.0 0.0 0.1 0.1 0.0 0.1 0.1
D. REVENUES FROM PRIVATISATION 0.0 0.0 0.0 0.4 0.4 0.5 0.2
TOTAL GENERAL GOVERNMENT REVENUES 45.9 47.0 45.9 45.7 45.2 44.6 44.7
Source of data: Ministry of Finance Bulletin for 1992-97, IMAD's estimates.
STATISTICAL APPENDIX
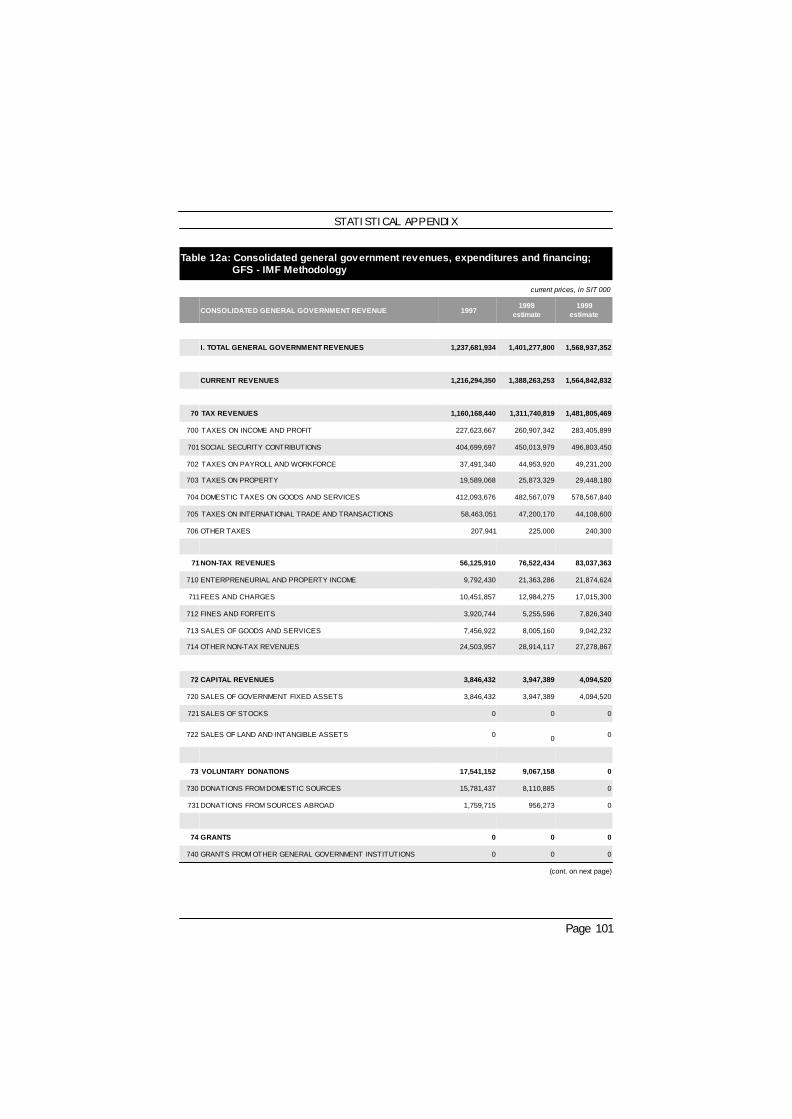
101Page
Table 12a: Consolidated general government revenues, expenditures and financing; GFS - IMF Methodology
current prices, in SIT 000
CONSOLIDATED GENERAL GOVERNMENT REVENUE 19971998
estimate1999
estimate
I. TOTAL GENERAL GOVERNMENT REVENUES 1,237,681,934 1,401,277,800 1,568,937,352
CURRENT REVENUES 1,216,294,350 1,388,263,253 1,564,842,832
70 TAX REVENUES 1,160,168,440 1,311,740,819 1,481,805,469
700 TAXES ON INCOME AND PROFIT 227,623,667 260,907,342 283,405,899
701 SOCIAL SECURITY CONTRIBUTIONS 404,699,697 450,013,979 496,803,450
702 TAXES ON PAYROLL AND WORKFORCE 37,491,340 44,953,920 49,231,200
703 TAXES ON PROPERTY 19,589,068 25,873,329 29,448,180
704 DOMESTIC TAXES ON GOODS AND SERVICES 412,093,676 482,567,079 578,567,840
705 TAXES ON INTERNATIONAL TRADE AND TRANSACTIONS 58,463,051 47,200,170 44,108,600
706 OTHER TAXES 207,941 225,000 240,300
71NON-TAX REVENUES 56,125,910 76,522,434 83,037,363
710 ENTERPRENEURIAL AND PROPERTY INCOME 9,792,430 21,363,286 21,874,624
711FEES AND CHARGES 10,451,857 12,984,275 17,015,300
712 FINES AND FORFEITS 3,920,744 5,255,596 7,826,340
713 SALES OF GOODS AND SERVICES 7,456,922 8,005,160 9,042,232
714 OTHER NON-TAX REVENUES 24,503,957 28,914,117 27,278,867
72 CAPITAL REVENUES 3,846,432 3,947,389 4,094,520
720 SALES OF GOVERNMENT FIXED ASSETS 3,846,432 3,947,389 4,094,520
721 SALES OF STOCKS 0 0 0
722 SALES OF LAND AND INTANGIBLE ASSETS 0 0 0
73 VOLUNTARY DONATIONS 17,541,152 9,067,158 0
730 DONATIONS FROM DOMESTIC SOURCES 15,781,437 8,110,885 0
731 DONATIONS FROM SOURCES ABROAD 1,759,715 956,273 0
74 GRANTS 0 0 0
740 GRANTS FROM OTHER GENERAL GOVERNMENT INSTITUTIONS 0 0 0
(cont. on next page)
STATISTICAL APPENDIX

IMAD AUTUMN REPORT 1998
102 Page
Table 12a: Consolidated general government revenues, expenditures and financing; GFS - IMF Methodology (continue)
per cent of GDP
1997 1998estimate
1999estimate
I. TOTAL GENERAL GOVERNMENT REVENUES 42.6 42.9 43.3
CURRENT REVENUES 41.8 42.5 43.2
70 TAX REVENUES 39.9 40.1 40.9
700 TAXES ON INCOME AND PROFIT 7.8 8.0 7.8
701 SOCIAL SECURITY CONTRIBUTIONS 13.9 13.8 13.7
702 TAXES ON PAYROLL AND WORKFORCE 1.3 1.4 1.4
703 TAXES ON PROPERTY 0.7 0.8 0.8
704 DOMESTIC TAXES ON GOODS AND SERVICES 14.2 14.8 16.0
705 TAXES ON INTERNATIONAL TRADE AND TRANSACTIONS 2.0 1.4 1.2
706 OTHER TAXES 0.0 0.0 0.0
71NON-TAX REVENUES 1.9 2.3 2.3
710 ENTERPRENEURIAL AND PROPERTY INCOME 0.3 0.7 0.6
711FEES AND CHARGES 0.4 0.4 0.5
712 FINES AND FORFEITS 0.1 0.2 0.2
713 SALES OF GOODS AND SERVICES 0.3 0.2 0.2
714 OTHER NON-TAX REVENUES 0.8 0.9 0.8
72 CAPITAL REVENUES 0.1 0.1 0.1
720 SALES OF GOVERNMENT FIXED ASSETS 0.1 0.1 0.1
721 SALES OF STOCKS 0.0 0.0 0.0
722 SALES OF LAND AND INTANGIBLE ASSETS 0.0 0.0 0.0
73 VOLUNTARY DONATIONS 0.6 0.3 0.0
730 DONATIONS FROM DOMESTIC SOURCES 0.5 0.2 0.0
731 DONATIONS FROM SOURCES ABROAD 0.1 0.0 0.0
74 GRANTS 0.0 0.0 0.0
740 GRANTS FROM OTHER GENERAL GOVERNMENT INSTITUTIONS 0.0 0.0 0.0
Source od data: the Ministry of Finance, November 1998, calculations of percentage in GDP by IMAD
STATISTICAL APPENDIX
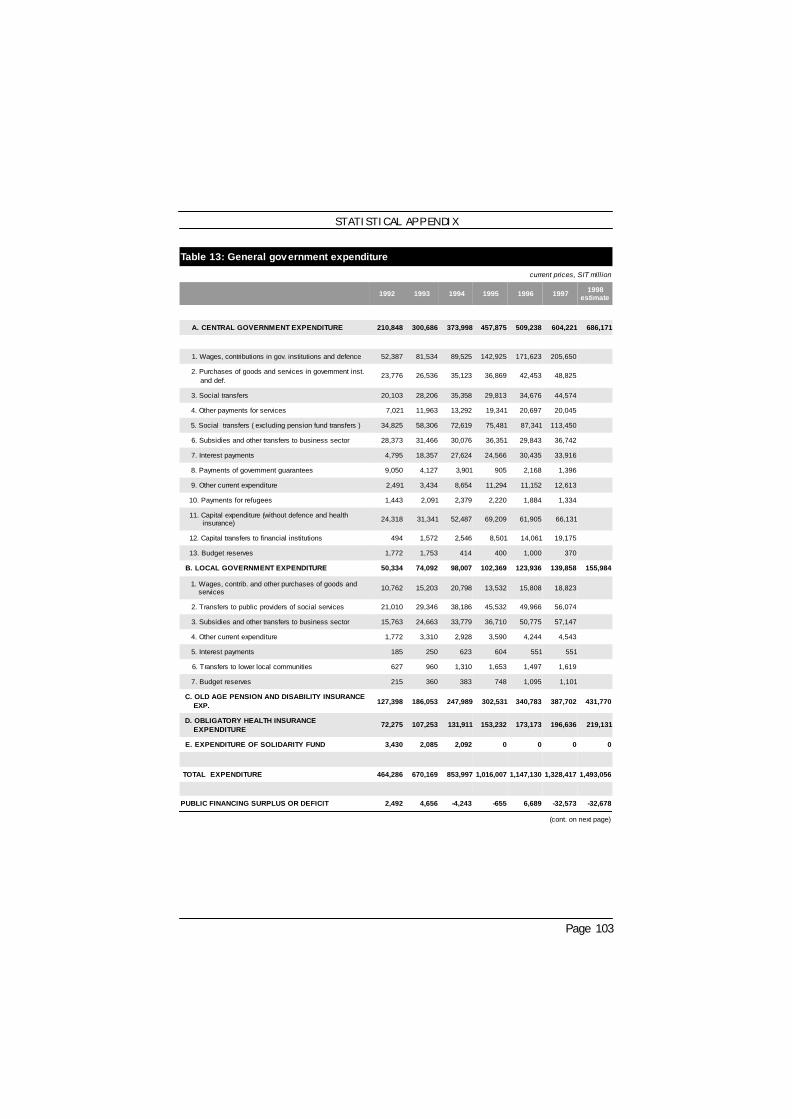
103Page
Table 13: General government expenditure
current prices, SIT million
1992 1993 1994 1995 1996 1997 1998estimate
A. CENTRAL GOVERNMENT EXPENDITURE 210,848 300,686 373,998 457,875 509,238 604,221 686,171
1. Wages, contributions in gov. institutions and defence 52,387 81,534 89,525 142,925 171,623 205,650
2. Purchases of goods and services in government inst. and def.
23,776 26,536 35,123 36,869 42,453 48,825
3. Social transfers 20,103 28,206 35,358 29,813 34,676 44,574
4. Other payments for services 7,021 11,963 13,292 19,341 20,697 20,045
5. Social transfers ( excluding pension fund transfers ) 34,825 58,306 72,619 75,481 87,341 113,450
6. Subsidies and other transfers to business sector 28,373 31,466 30,076 36,351 29,843 36,742
7. Interest payments 4,795 18,357 27,624 24,566 30,435 33,916
8. Payments of government guarantees 9,050 4,127 3,901 905 2,168 1,396
9. Other current expenditure 2,491 3,434 8,654 11,294 11,152 12,613
10. Payments for refugees 1,443 2,091 2,379 2,220 1,884 1,334
11. Capital expenditure (without defence and health insurance) 24,318 31,341 52,487 69,209 61,905 66,131
12. Capital transfers to financial institutions 494 1,572 2,546 8,501 14,061 19,175
13. Budget reserves 1,772 1,753 414 400 1,000 370
B. LOCAL GOVERNMENT EXPENDITURE 50,334 74,092 98,007 102,369 123,936 139,858 155,984
1. Wages, contrib. and other purchases of goods and services 10,762 15,203 20,798 13,532 15,808 18,823
2. Transfers to public providers of social services 21,010 29,346 38,186 45,532 49,966 56,074
3. Subsidies and other transfers to business sector 15,763 24,663 33,779 36,710 50,775 57,147
4. Other current expenditure 1,772 3,310 2,928 3,590 4,244 4,543
5. Interest payments 185 250 623 604 551 551
6. Transfers to lower local communities 627 960 1,310 1,653 1,497 1,619
7. Budget reserves 215 360 383 748 1,095 1,101
C. OLD AGE PENSION AND DISABILITY INSURANCE EXP. 127,398 186,053 247,989 302,531 340,783 387,702 431,770
D. OBLIGATORY HEALTH INSURANCE EXPENDITURE
72,275 107,253 131,911 153,232 173,173 196,636 219,131
E. EXPENDITURE OF SOLIDARITY FUND 3,430 2,085 2,092 0 0 0 0
TOTAL EXPENDITURE 464,286 670,169 853,997 1,016,007 1,147,130 1,328,417 1,493,056
PUBLIC FINANCING SURPLUS OR DEFICIT 2,492 4,656 -4,243 -655 6,689 -32,573 -32,678
(cont. on next page)
STATISTICAL APPENDIX
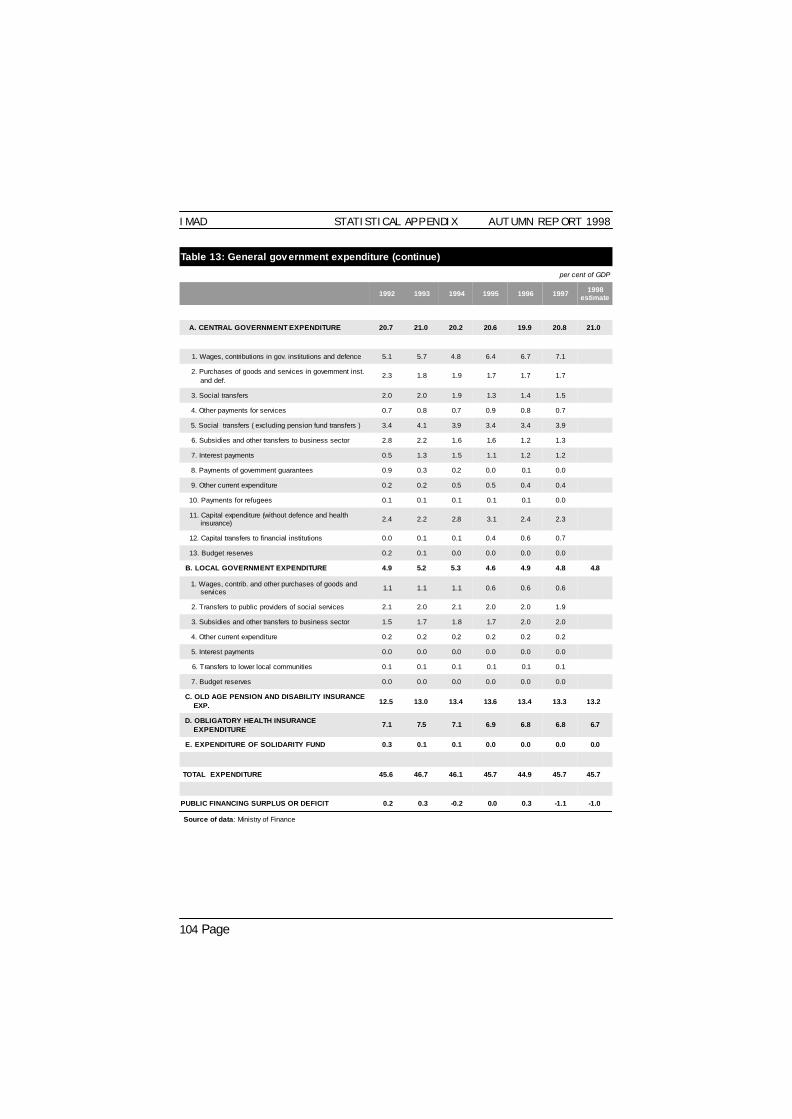
IMAD AUTUMN REPORT 1998
104 Page
Table 13: General government expenditure (continue)
per cent of GDP
1992 1993 1994 1995 1996 1997 1998estimate
A. CENTRAL GOVERNMENT EXPENDITURE 20.7 21.0 20.2 20.6 19.9 20.8 21.0
1. Wages, contributions in gov. institutions and defence 5.1 5.7 4.8 6.4 6.7 7.1
2. Purchases of goods and services in government inst. and def.
2.3 1.8 1.9 1.7 1.7 1.7
3. Social transfers 2.0 2.0 1.9 1.3 1.4 1.5
4. Other payments for services 0.7 0.8 0.7 0.9 0.8 0.7
5. Social transfers ( excluding pension fund transfers ) 3.4 4.1 3.9 3.4 3.4 3.9
6. Subsidies and other transfers to business sector 2.8 2.2 1.6 1.6 1.2 1.3
7. Interest payments 0.5 1.3 1.5 1.1 1.2 1.2
8. Payments of government guarantees 0.9 0.3 0.2 0.0 0.1 0.0
9. Other current expenditure 0.2 0.2 0.5 0.5 0.4 0.4
10. Payments for refugees 0.1 0.1 0.1 0.1 0.1 0.0
11. Capital expenditure (without defence and health insurance) 2.4 2.2 2.8 3.1 2.4 2.3
12. Capital transfers to financial institutions 0.0 0.1 0.1 0.4 0.6 0.7
13. Budget reserves 0.2 0.1 0.0 0.0 0.0 0.0
B. LOCAL GOVERNMENT EXPENDITURE 4.9 5.2 5.3 4.6 4.9 4.8 4.8
1. Wages, contrib. and other purchases of goods and services 1.1 1.1 1.1 0.6 0.6 0.6
2. Transfers to public providers of social services 2.1 2.0 2.1 2.0 2.0 1.9
3. Subsidies and other transfers to business sector 1.5 1.7 1.8 1.7 2.0 2.0
4. Other current expenditure 0.2 0.2 0.2 0.2 0.2 0.2
5. Interest payments 0.0 0.0 0.0 0.0 0.0 0.0
6. Transfers to lower local communities 0.1 0.1 0.1 0.1 0.1 0.1
7. Budget reserves 0.0 0.0 0.0 0.0 0.0 0.0
C. OLD AGE PENSION AND DISABILITY INSURANCE EXP. 12.5 13.0 13.4 13.6 13.4 13.3 13.2
D. OBLIGATORY HEALTH INSURANCE EXPENDITURE
7.1 7.5 7.1 6.9 6.8 6.8 6.7
E. EXPENDITURE OF SOLIDARITY FUND 0.3 0.1 0.1 0.0 0.0 0.0 0.0
TOTAL EXPENDITURE 45.6 46.7 46.1 45.7 44.9 45.7 45.7
PUBLIC FINANCING SURPLUS OR DEFICIT 0.2 0.3 -0.2 0.0 0.3 -1.1 -1.0
Source of data: Ministry of Finance
STATISTICAL APPENDIX
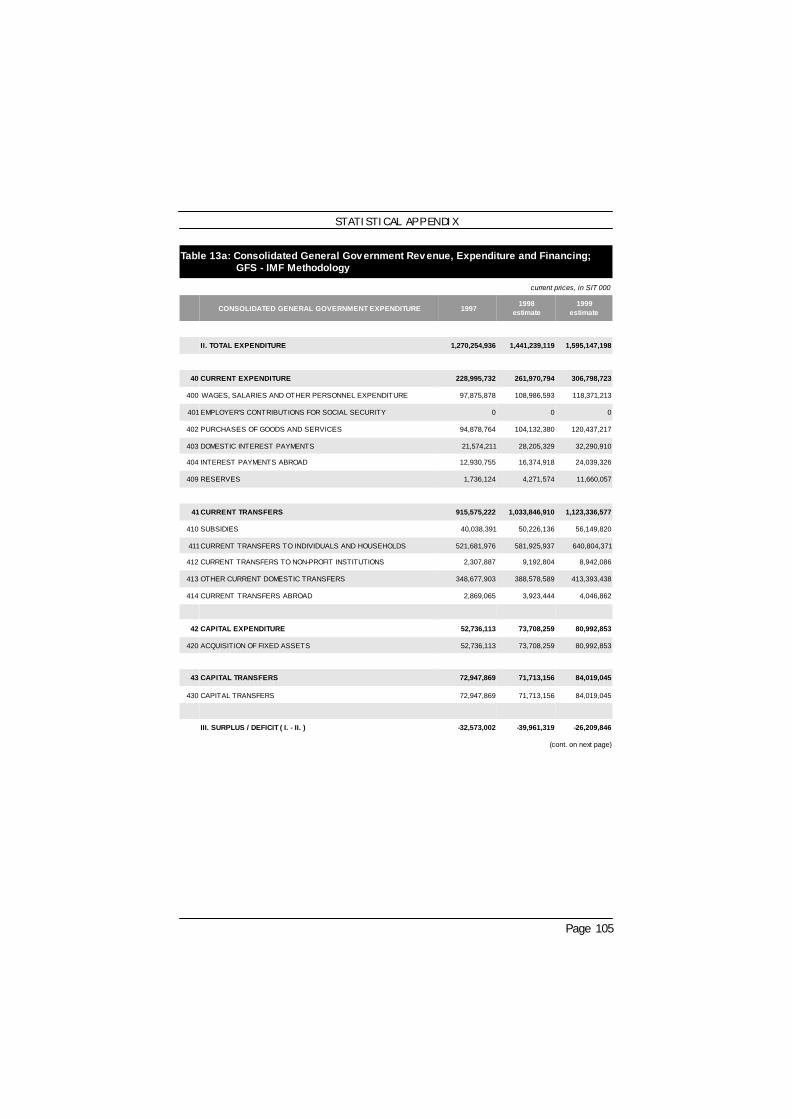
105Page
Table 13a: Consolidated General Government Revenue, Expenditure and Financing; GFS - IMF Methodology
current prices, in SIT 000
CONSOLIDATED GENERAL GOVERNMENT EXPENDITURE 19971998
estimate1999
estimate
II. TOTAL EXPENDITURE 1,270,254,936 1,441,239,119 1,595,147,198
40 CURRENT EXPENDITURE 228,995,732 261,970,794 306,798,723
400 WAGES, SALARIES AND OTHER PERSONNEL EXPENDITURE 97,875,878 108,986,593 118,371,213
401 EMPLOYER'S CONTRIBUTIONS FOR SOCIAL SECURITY 0 0 0
402 PURCHASES OF GOODS AND SERVICES 94,878,764 104,132,380 120,437,217
403 DOMESTIC INTEREST PAYMENTS 21,574,211 28,205,329 32,290,910
404 INTEREST PAYMENTS ABROAD 12,930,755 16,374,918 24,039,326
409 RESERVES 1,736,124 4,271,574 11,660,057
41CURRENT TRANSFERS 915,575,222 1,033,846,910 1,123,336,577
410 SUBSIDIES 40,038,391 50,226,136 56,149,820
411CURRENT TRANSFERS TO INDIVIDUALS AND HOUSEHOLDS 521,681,976 581,925,937 640,804,371
412 CURRENT TRANSFERS TO NON-PROFIT INSTITUTIONS 2,307,887 9,192,804 8,942,086
413 OTHER CURRENT DOMESTIC TRANSFERS 348,677,903 388,578,589 413,393,438
414 CURRENT TRANSFERS ABROAD 2,869,065 3,923,444 4,046,862
42 CAPITAL EXPENDITURE 52,736,113 73,708,259 80,992,853
420 ACQUISITION OF FIXED ASSETS 52,736,113 73,708,259 80,992,853
43 CAPITAL TRANSFERS 72,947,869 71,713,156 84,019,045
430 CAPITAL TRANSFERS 72,947,869 71,713,156 84,019,045
III. SURPLUS / DEFICIT ( I. - II. ) -32,573,002 -39,961,319 -26,209,846
(cont. on next page)
STATISTICAL APPENDIX
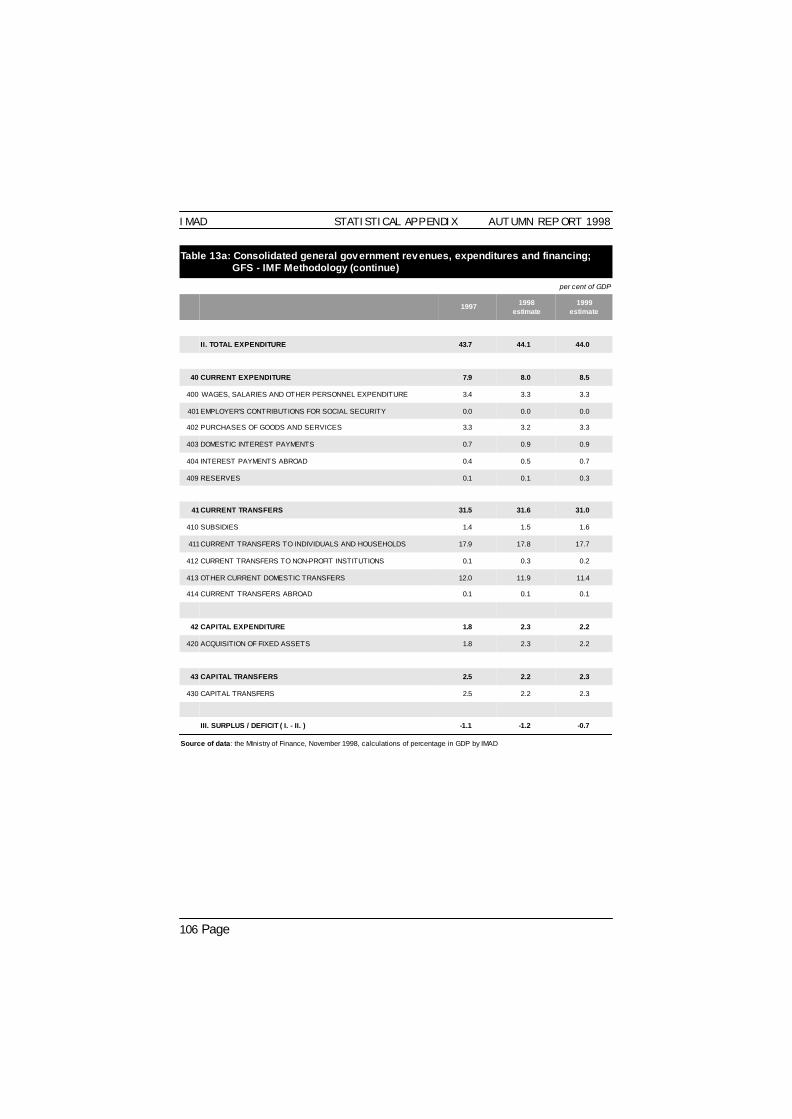
IMAD AUTUMN REPORT 1998
106 Page
Table 13a: Consolidated general government revenues, expenditures and financing; GFS - IMF Methodology (continue)
per cent of GDP
1997 1998estimate
1999estimate
II. TOTAL EXPENDITURE 43.7 44.1 44.0
40 CURRENT EXPENDITURE 7.9 8.0 8.5
400 WAGES, SALARIES AND OTHER PERSONNEL EXPENDITURE 3.4 3.3 3.3
401 EMPLOYER'S CONTRIBUTIONS FOR SOCIAL SECURITY 0.0 0.0 0.0
402 PURCHASES OF GOODS AND SERVICES 3.3 3.2 3.3
403 DOMESTIC INTEREST PAYMENTS 0.7 0.9 0.9
404 INTEREST PAYMENTS ABROAD 0.4 0.5 0.7
409 RESERVES 0.1 0.1 0.3
41CURRENT TRANSFERS 31.5 31.6 31.0
410 SUBSIDIES 1.4 1.5 1.6
411CURRENT TRANSFERS TO INDIVIDUALS AND HOUSEHOLDS 17.9 17.8 17.7
412 CURRENT TRANSFERS TO NON-PROFIT INSTITUTIONS 0.1 0.3 0.2
413 OTHER CURRENT DOMESTIC TRANSFERS 12.0 11.9 11.4
414 CURRENT TRANSFERS ABROAD 0.1 0.1 0.1
42 CAPITAL EXPENDITURE 1.8 2.3 2.2
420 ACQUISITION OF FIXED ASSETS 1.8 2.3 2.2
43 CAPITAL TRANSFERS 2.5 2.2 2.3
430 CAPITAL TRANSFERS 2.5 2.2 2.3
III. SURPLUS / DEFICIT ( I. - II. ) -1.1 -1.2 -0.7
Source of data: the MInistry of Finance, November 1998, calculations of percentage in GDP by IMAD
STATISTICAL APPENDIX
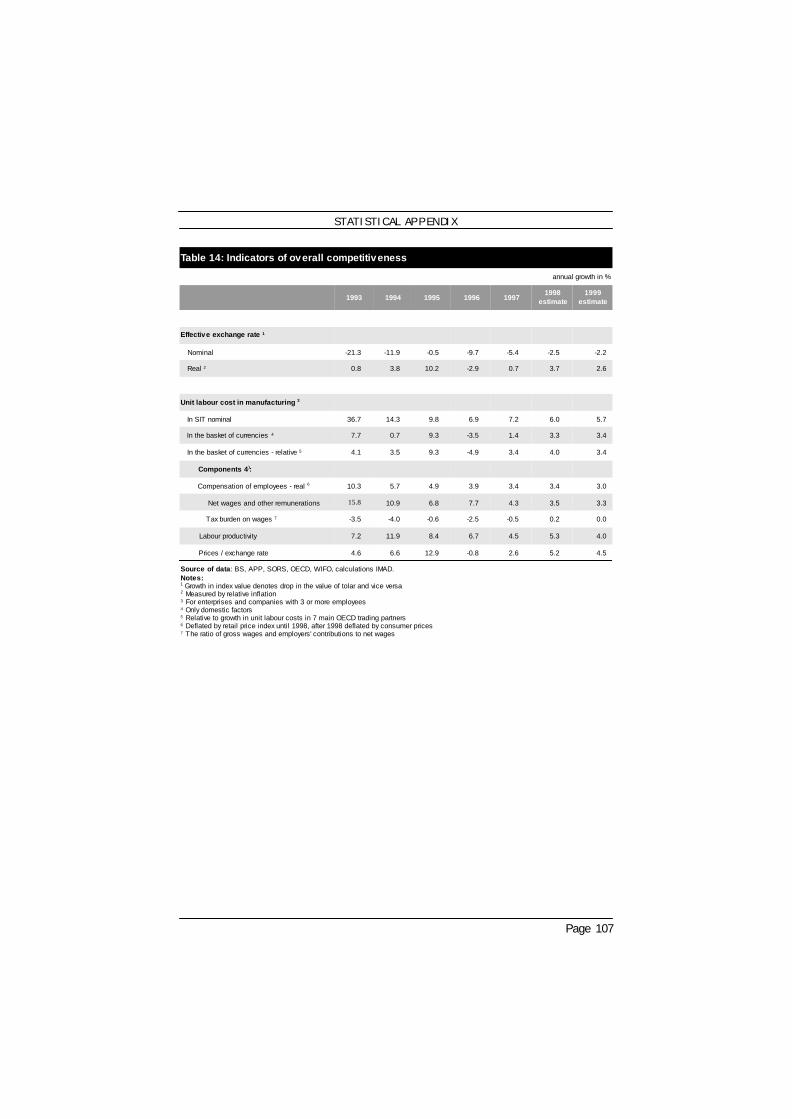
107Page
Table 14: Indicators of overall competitiveness
annual growth in %
1993 1994 1995 1996 19971998
estimate1999
estimate
Effective exchange rate 1
Nominal -21.3 -11.9 -0.5 -9.7 -5.4 -2.5 -2.2
Real 2 0.8 3.8 10.2 -2.9 0.7 3.7 2.6
Unit labour cost in manufacturing 3
In SIT nominal 36.7 14.3 9.8 6.9 7.2 6.0 5.7
In the basket of currencies 4 7.7 0.7 9.3 -3.5 1.4 3.3 3.4
In the basket of currencies - relative 5 4.1 3.5 9.3 -4.9 3.4 4.0 3.4
Components 4):
Compensation of employees - real 6 10.3 5.7 4.9 3.9 3.4 3.4 3.0
Net wages and other remunerations 15.8 10.9 6.8 7.7 4.3 3.5 3.3
Tax burden on wages 7 -3.5 -4.0 -0.6 -2.5 -0.5 0.2 0.0
Labour productivity 7.2 11.9 8.4 6.7 4.5 5.3 4.0
Prices / exchange rate 4.6 6.6 12.9 -0.8 2.6 5.2 4.5
Source of data: BS, APP, SORS, OECD, WIFO, calculations IMAD.Notes:1 Growth in index value denotes drop in the value of tolar and vice versa2 Measured by relative inflation3 For enterprises and companies with 3 or more employees4 Only domestic factors5 Relative to growth in unit labour costs in 7 main OECD trading partners6 Deflated by retail price index until 1998, after 1998 deflated by consumer prices7 The ratio of gross wages and employers' contributions to net wages
STATISTICAL APPENDIX
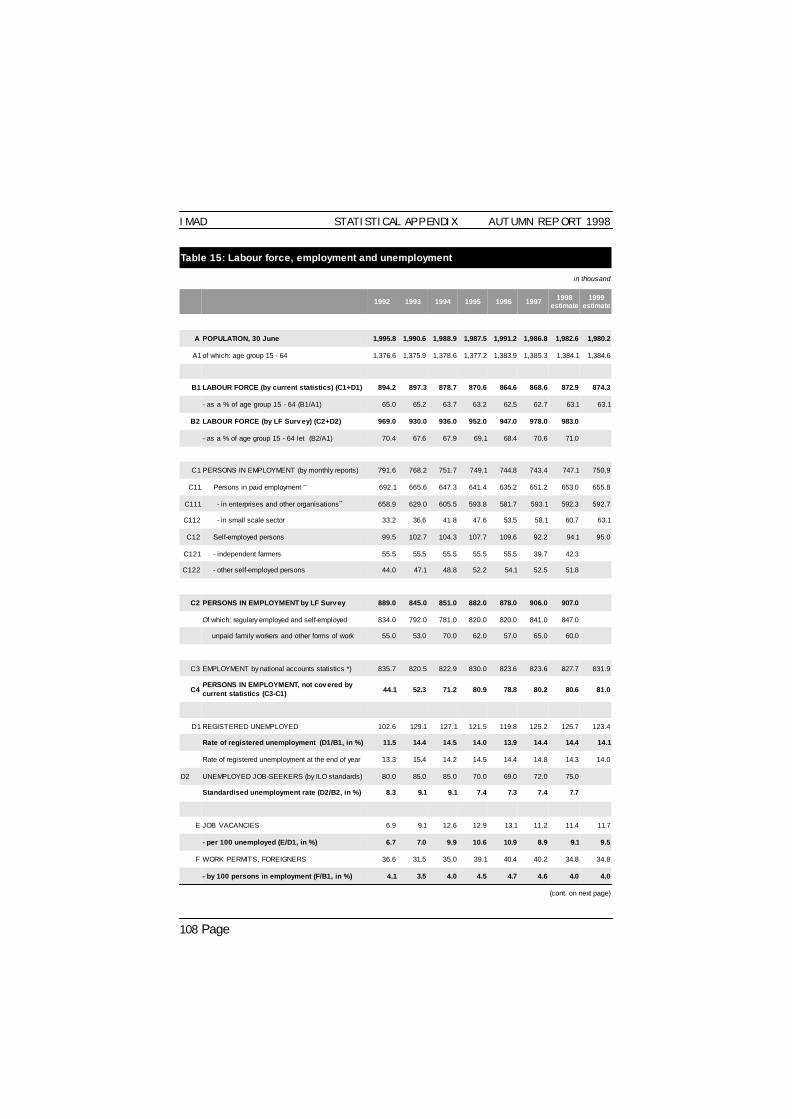
IMAD AUTUMN REPORT 1998
108 Page
Table 15: Labour force, employment and unemployment
in thousand
1992 1993 1994 1995 1996 1997 1998estimate
1999estimate
A POPULATION, 30 June 1,995.8 1,990.6 1,988.9 1,987.5 1,991.2 1,986.8 1,982.6 1,980.2
A1 of which: age group 15 - 64 1,376.6 1,375.9 1,378.6 1,377.2 1,383.9 1,385.3 1,384.1 1,384.6
B1 LABOUR FORCE (by current statistics) (C1+D1) 894.2 897.3 878.7 870.6 864.6 868.6 872.9 874.3
- as a % of age group 15 - 64 (B1/A1) 65.0 65.2 63.7 63.2 62.5 62.7 63.1 63.1
B2 LABOUR FORCE (by LF Survey) (C2+D2) 969.0 930.0 936.0 952.0 947.0 978.0 983.0
- as a % of age group 15 - 64 let (B2/A1) 70.4 67.6 67.9 69.1 68.4 70.6 71.0
C1 PERSONS IN EMPLOYMENT (by monthly reports) 791.6 768.2 751.7 749.1 744.8 743.4 747.1 750.9
C11 Persons in paid employment ** 692.1 665.6 647.3 641.4 635.2 651.2 653.0 655.8
C111 - in enterprises and other organisations** 658.9 629.0 605.5 593.8 581.7 593.1 592.3 592.7
C112 - in small scale sector 33.2 36.6 41.8 47.6 53.5 58.1 60.7 63.1
C12 Self-employed persons 99.5 102.7 104.3 107.7 109.6 92.2 94.1 95.0
C121 - independent farmers 55.5 55.5 55.5 55.5 55.5 39.7 42.3
C122 - other self-employed persons 44.0 47.1 48.8 52.2 54.1 52.5 51.8
C2 PERSONS IN EMPLOYMENT by LF Survey 889.0 845.0 851.0 882.0 878.0 906.0 907.0
Of which: regulary employed and self-employed 834.0 792.0 781.0 820.0 820.0 841.0 847.0
unpaid family workers and other forms of work 55.0 53.0 70.0 62.0 57.0 65.0 60.0
C3 EMPLOYMENT by national accounts statistics *) 835.7 820.5 822.9 830.0 823.6 823.6 827.7 831.9
C4PERSONS IN EMPLOYMENT, not covered bycurrent statistics (C3-C1) 44.1 52.3 71.2 80.9 78.8 80.2 80.6 81.0
D1 REGISTERED UNEMPLOYED 102.6 129.1 127.1 121.5 119.8 125.2 125.7 123.4
Rate of registered unemployment (D1/B1, in %) 11.5 14.4 14.5 14.0 13.9 14.4 14.4 14.1
Rate of registered unemployment at the end of year 13.3 15.4 14.2 14.5 14.4 14.8 14.3 14.0
D2 UNEMPLOYED JOB-SEEKERS (by ILO standards) 80.0 85.0 85.0 70.0 69.0 72.0 75.0
Standardised unemployment rate (D2/B2, in %) 8.3 9.1 9.1 7.4 7.3 7.4 7.7
E JOB VACANCIES 6.9 9.1 12.6 12.9 13.1 11.2 11.4 11.7
- per 100 unemployed (E/D1, in %) 6.7 7.0 9.9 10.6 10.9 8.9 9.1 9.5
F WORK PERMITS, FOREIGNERS 36.6 31.5 35.0 39.1 40.4 40.2 34.8 34.8
- by 100 persons in employment (F/B1, in %) 4.1 3.5 4.0 4.5 4.7 4.6 4.0 4.0
(cont. on next page)
STATISTICAL APPENDIX
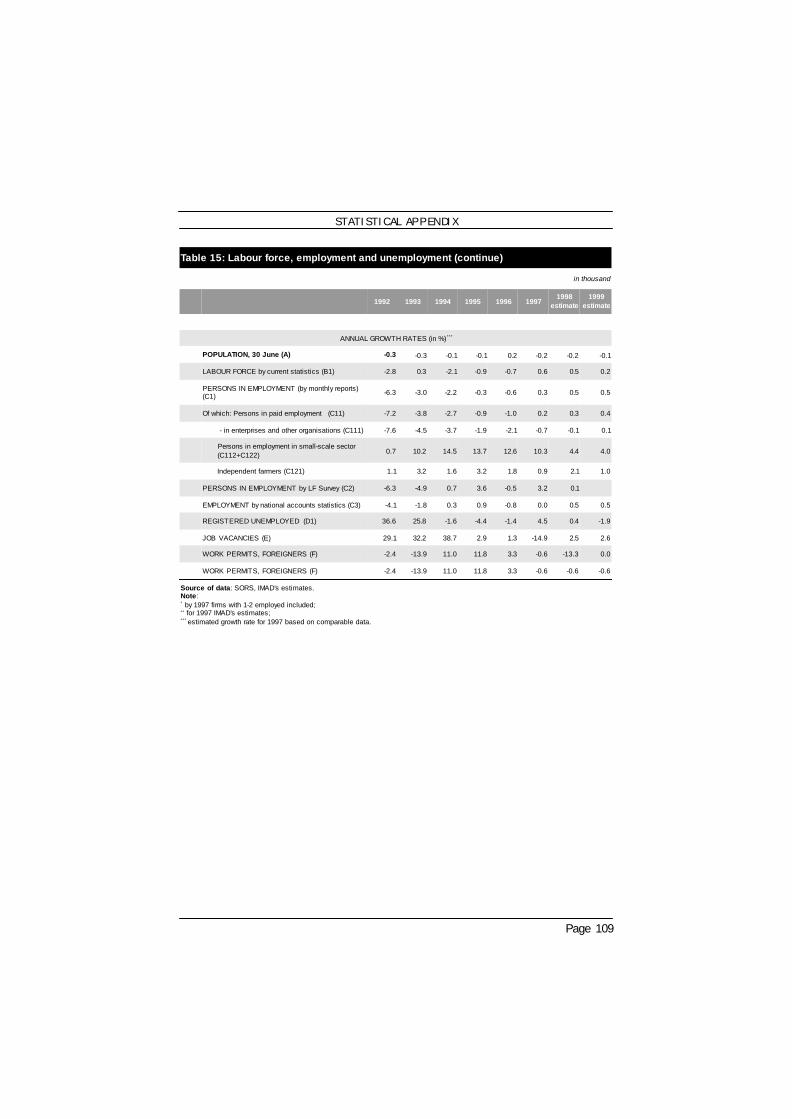
109Page
Table 15: Labour force, employment and unemployment (continue)
in thousand
1992 1993 1994 1995 1996 19971998
estimate1999
estimate
ANNUAL GROWTH RATES (in %) ***
POPULATION, 30 June (A) -0.3 -0.3 -0.1 -0.1 0.2 -0.2 -0.2 -0.1
LABOUR FORCE by current statistics (B1) -2.8 0.3 -2.1 -0.9 -0.7 0.6 0.5 0.2
PERSONS IN EMPLOYMENT (by monthly reports)(C1) -6.3 -3.0 -2.2 -0.3 -0.6 0.3 0.5 0.5
Of which: Persons in paid employment (C11) -7.2 -3.8 -2.7 -0.9 -1.0 0.2 0.3 0.4
- in enterprises and other organisations (C111) -7.6 -4.5 -3.7 -1.9 -2.1 -0.7 -0.1 0.1
Persons in employment in small-scale sector (C112+C122) 0.7 10.2 14.5 13.7 12.6 10.3 4.4 4.0
Independent farmers (C121) 1.1 3.2 1.6 3.2 1.8 0.9 2.1 1.0
PERSONS IN EMPLOYMENT by LF Survey (C2) -6.3 -4.9 0.7 3.6 -0.5 3.2 0.1
EMPLOYMENT by national accounts statistics (C3) -4.1 -1.8 0.3 0.9 -0.8 0.0 0.5 0.5
REGISTERED UNEMPLOYED (D1) 36.6 25.8 -1.6 -4.4 -1.4 4.5 0.4 -1.9
JOB VACANCIES (E) 29.1 32.2 38.7 2.9 1.3 -14.9 2.5 2.6
WORK PERMITS, FOREIGNERS (F) -2.4 -13.9 11.0 11.8 3.3 -0.6 -13.3 0.0
WORK PERMITS, FOREIGNERS (F) -2.4 -13.9 11.0 11.8 3.3 -0.6 -0.6 -0.6
Source of data: SORS, IMAD's estimates.Note:* by 1997 firms with 1-2 employed included;** for 1997 IMAD's estimates;*** estimated growth rate for 1997 based on comparable data.
STATISTICAL APPENDIX
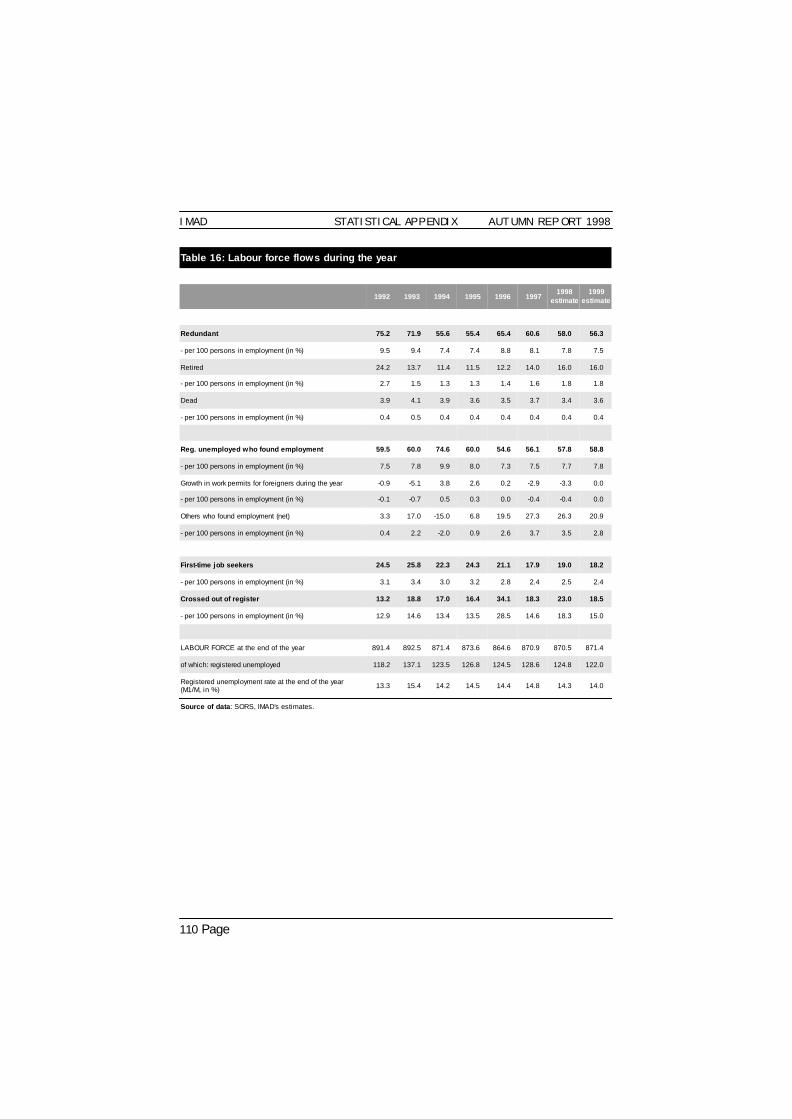
IMAD AUTUMN REPORT 1998
110 Page
Table 16: Labour force flows during the year
1992 1993 1994 1995 1996 19971998
estimate1999
estimate
Redundant 75.2 71.9 55.6 55.4 65.4 60.6 58.0 56.3
- per 100 persons in employment (in %) 9.5 9.4 7.4 7.4 8.8 8.1 7.8 7.5
Retired 24.2 13.7 11.4 11.5 12.2 14.0 16.0 16.0
- per 100 persons in employment (in %) 2.7 1.5 1.3 1.3 1.4 1.6 1.8 1.8
Dead 3.9 4.1 3.9 3.6 3.5 3.7 3.4 3.6
- per 100 persons in employment (in %) 0.4 0.5 0.4 0.4 0.4 0.4 0.4 0.4
Reg. unemployed who found employment 59.5 60.0 74.6 60.0 54.6 56.1 57.8 58.8
- per 100 persons in employment (in %) 7.5 7.8 9.9 8.0 7.3 7.5 7.7 7.8
Growth in work permits for foreigners during the year -0.9 -5.1 3.8 2.6 0.2 -2.9 -3.3 0.0
- per 100 persons in employment (in %) -0.1 -0.7 0.5 0.3 0.0 -0.4 -0.4 0.0
Others who found employment (net) 3.3 17.0 -15.0 6.8 19.5 27.3 26.3 20.9
- per 100 persons in employment (in %) 0.4 2.2 -2.0 0.9 2.6 3.7 3.5 2.8
First-time job seekers 24.5 25.8 22.3 24.3 21.1 17.9 19.0 18.2
- per 100 persons in employment (in %) 3.1 3.4 3.0 3.2 2.8 2.4 2.5 2.4
Crossed out of register 13.2 18.8 17.0 16.4 34.1 18.3 23.0 18.5
- per 100 persons in employment (in %) 12.9 14.6 13.4 13.5 28.5 14.6 18.3 15.0
LABOUR FORCE at the end of the year 891.4 892.5 871.4 873.6 864.6 870.9 870.5 871.4
of which: registered unemployed 118.2 137.1 123.5 126.8 124.5 128.6 124.8 122.0
Registered unemployment rate at the end of the year(M1/M, in %) 13.3 15.4 14.2 14.5 14.4 14.8 14.3 14.0
Source of data: SORS, IMAD's estimates.
STATISTICAL APPENDIX
111Page
BIBLIOGRAPHY
AIECE (1998): Short-term prospects for European Economies. Autumn meet-ing of the Association of European Conjuncture Institutes, Bruselj, 29-30.October.
Barabas, G. in Schaefer-Jaeckel, E. (1998): Country Report: Germany. ProjectLINK Fall Meeting, Rio de Janiero, September.
Commerzbank (1998): Economic Trends. Commerzbank Economic Research,Frankfurt, September.
Dun & Bradstreet Int. (1998): International Risk & Payment Review, Bucks,October.
EBRD (1998): Transition Report Update. European Bank for Reconstructionand Development; April
EC (1998): The Community Economy in 1998-2000 - Autumn 1998 EconomicForecasts.European Economy (European Commission, Directorate General for Eco-nomic and Financial Affairs), No. 10, October
EUROSTAT (1998):Candidate countries real GDP per person is 40% of EUaverage. Eurostat News Release, No. 68/98, 11. September.
Euromoney (1998): Country Risk, September
IFO (1998): IFO Digest: A Quarterly Journal on Economic Trends in theFederal Republic of Germany, Institut fur Wirschaftsforschung, Munich, Vol21, No.3 (September).
IMF (1998a): IMF World Economic Outlook. Washington: International Mon-etary Fund, May
IMF (1998b): IMF World Economic Outlook. Washington: International Mon-etary Fund, October.
Keefer, P.; Shirley M.M. (1998): From the Ivory Tower to the Corridors of
BIBLIOGRAPH Y
IMAD AUTUMN REPORT 1998
112 Page
Power: Making Instituttions Matter for Development Policy. Draft Paper.
LINK (1998): Project LINK World Outlook, Rio de Janiero, September.Meary, R. (1998): Country Report: France. Project LINK Fall Meeting, Rio deJaniero, September.
MF (1998): Konsolidirane bilance javnega financiranja - prikaz po noviekonomski klasifikaciji - konsolidacija po metodologiji GFS/IMF; november
OECD (1998): Economic Outlook. Organisation for Economic Cooperationand Development, Paris, June
Poroeevalec DZ (1998): Prikaz stanja v sektorjih predelovalne dejavnostislovenske industrije s predlogi ukrepov. Poroeevalec Dr?avnega zbora, št.56,56/I, 18.9.1998
Simon (1998): Country Report: Hungary. Project LINK Fall Meeting, Rio deJaniero, September.Simoneti, M.; Rojec, M.; Rems, M. (1998): Enterprise Sector Restructuring andEU Accession of Slovenia. NATO Colloquium: Economic Development andReforms in Cooperation Partner Countries: The Role of the State with Par-ticular Focus on Security and Defence Issues. Ljubljana, June
SKEP-GZS (1998): Konjunkturni trendi - Oktober 1998, Glas gospodarstva,October
Štiblar, F. (1998): Svetovna finanena kriza in ekonomska recesija z vplivomna Slovenijo. strokovna ekspertiza, tipkopis, October
UNCTAD (1998). Foreign Direct Investment on the Rise. UNCTAD Press Re-lease. TAD/INF/2762. 2 September.
Veselinovie, D. (1998): Dogajanja na slovenskih finanenih trgih v letu 1998in mo?nosti nadaljnjega razvoja. tipkopis, October
IMAD (1998): Analysis of economci developments and target developmentscenario by 2002 1998 Spring Report. Institute of Macroeconomic Analysisand Development, Ljubljana, July
Welfe, W. (1998): Country Report: Poland. Project LINK Fall Meeting, Rio deJaniero, September.
113Page
WIFO (1998): Austrian Economic Quarterly. Austrian Institute of EconomicResearch, Dunaj, Vol. 3, No. 3 (september).WIIW (1998a): Research Reports. The Vienna Institute for Comparative Eco-nomic Studies, Dunaj, June
WIIW (1998b): The Vienna Monthly Report. The Vienna Institute for Com-parative Economic Studies, Dunaj, September.
WIIW (1998c): The Vienna Monthly Report. The Vienna Institute for Com-parative Economic Studies, Dunaj, May (št. 5), str. 4.
Wojtulewicz, I. (1998): Vsako uro milijon dolarjev. Rynki zagraniczne No.106,3-4. September
Zagrebaeka Banka (1998): Croatian Economic Forecast, Zagreb, September
BIBLIOGRAPH Y